Embed Size (px)
Citation preview

Cold Regions Science and Technology xxx (2008) xxx–xxx
COLTEC-01343; No of Pages 9
Contents lists available at ScienceDirect
Cold Regions Science and Technology
j ourna l homepage: www.e lsev ie r.com/ locate /co ld reg ions
ARTICLE IN PRESS
Full Length Article
Mapping subsurface conditions within the near-shore zone of an Arctic delta usingground penetrating radar
Christopher W. Stevens a,⁎, Brian J. Moorman b, Steve M. Solomon c, Chris H. Hugenholtz d
a Department of Geoscience, University of Calgary, 2500 University Dr. NW., Calgary, Alberta, Canada T2N 1N4b Department of Geography, University of Calgary, 2500 University Dr. NW., Calgary, Alberta, Canada T2N 1N4c Geological Survey of Canada (Atlantic), Natural Resources Canada, 1 Challenger Drive, P.O. Box 1006, Dartmouth, Nova Scotia, Canada B2Y 4A2d Department of Geography, University of Lethbridge, 4401 University Drive, Lethbridge, Alberta, Canada T1K 3M4
⁎ Corresponding author. Tel.: +1 403 703 9237.E-mail address: [email protected] (C.W. Stevens
0165-232X/$ – see front matter © 2008 Elsevier B.V. Aldoi:10.1016/j.coldregions.2008.09.005
Please cite this article as: Stevens, C.W., etpenetrating radar, Cold Regions Science an
a b s t r a c t
a r t i c l e i n f oArticle history:
This paper demonstrates th Received 30 April 2008Accepted 21 September 2008Available online xxxxKeywords:Arctic deltaGround penetrating radarNear-shore zoneLandfast icePermafrost
e capabilities of ground penetrating radar (GPR) to map and resolve shallowsubsurface features in the near-shore zone: (i) ice conditions (floating or bottom fast); (ii) water bathymetry;(iii) sedimentary structures; and (iv) interfaces between frozen and unfrozen sediment. These features wereresolved in the near-shore zone of the Mackenzie Delta, N.W.T., Canada, using multi-frequency (50, 100 and250 MHz) GPR data collected in winter (2005 and 2006). The capability of GPR to resolve subsurface featuresin the near-shore zone was strongly controlled by bottom-fast and floating ice conditions. The latter werediscriminated using a novel approach involving the energy return from the base of ice and the presence ofice-bottom multiples. Beneath zones of bottom-fast ice, sedimentary structures and interfaces betweenfrozen and unfrozen sediment were discriminated by reflection geometry and amplitude. Beneath floatingice, water depths were measured to depths greater than 5 m using a multi-layer depth calculation. Overall,this research demonstrates that baseline information for geotechnical investigations and climate changeresearch in Arctic coastal zones can be greatly enhanced with GPR data.
© 2008 Elsevier B.V. All rights reserved.
1. Introduction
Near-shore environments of Arctic deltas are dynamic systems,where sea ice, waves and tides interact with terrestrial riverineprocesses. These cold climate coastal regions are distinguished fromsimilar environments in the mid- to low-latitudes by the prolongedduration of ice cover (7–8 months out of the year) and the presence ofpermafrost (Hill et al., 1994; Rachold et al., 2005). The near-shore zoneis commonly characterized by an extensive shallow-water platformthat forms in response to ice-related processes (Dupre and Thompson,1979; Are and Reimnitz, 2000; Hill et al., 2001). Bottom-fast ice alsoplays an important role in regulating ground temperatures (Dyke,1991; Solomon et al., 2008), altering the routing of water andsediment (Dupre and Thompson, 1979), restricting wind–wavegeneration (Harper, 1990) and by modifying the sediment bed(Reimnitz and Barnes, 1974).
With growing development and natural resource exploration inArctic coastal environments, the importance of understanding thedistribution of shallow subsurface conditions and the influence of ice-related processes has increased substantially in recent decades(Ogorodov, 2005; Rachold et al., 2005). Moreover, the determination
).
l rights reserved.
al., Mapping subsurface cond Technology (2008), doi:10.
of climate change impacts in the near-shore zone of Arctic coastal deltasrequires knowledge of subsurface permafrost distribution. Untilrecently, the remote geographic location of Arctic deltas in associationwith extremely coldwinters and short periods of openwaterhas, inpart,limited the acquisition of near-shore subsurface data. The duration of icecover, the timing of freezeup and mechanical breakup pose significantchallenges to the acquisition of subsurface measurements withtraditional methods (Hill et al., 1994). Additional challenges occur inthe open water period whereby extremely shallow near-shore zones(b2 m) are relatively inaccessible to most vessels. As a result, very littlebaseline data has been collected that sheds light on Arctic near-shoreprocesses and morphodynamics. One approach to overcome theselimitations is the use of near-surface geophysics. In this study wedemonstrate howGPR can beused to characterize avariety of significantsubsurface features in the near-shore zone of Arctic deltas (e.g. waterbathymetry, sedimentary stratigraphy, cryostratigraphy).
2. Related GPR investigations in the Arctic
The application of GPR in Arctic environments has primarilyfocused on permafrost-related issues at terrestrial sites. Previousresearch has demonstrated the effectiveness of GPR for monitoringactive layer thickness (Wong et al., 1977; Pilon et al., 1979; Doolittleet al., 1990; Hinkel et al., 2001), delineating massive ground ice bodies(Dallimore and Davis, 1987, 1992; Robinson et al., 1993; Lonne and
ditions within the near-shore zone of an Arctic delta using ground1016/j.coldregions.2008.09.005

Fig.1. Location of the study area. (A) Regional viewof theMackenzie Delta located in thewestern Canadian Arctic. (B) Sitemap showing the orientation of GPR transects surveyed overthe distributary bar at the mouth of Middle Channel. The square box southeast of the channel bar indicates the location of the grid survey presented in Fig. 7. The arrows indicate thelocation and orientation of GPR profiles presented as figures.
2 C.W. Stevens et al. / Cold Regions Science and Technology xxx (2008) xxx–xxx
ARTICLE IN PRESS
Please cite this article as: Stevens, C.W., et al., Mapping subsurface conditions within the near-shore zone of an Arctic delta using groundpenetrating radar, Cold Regions Science and Technology (2008), doi:10.1016/j.coldregions.2008.09.005

Fig. 2. Ground penetrating radar survey setup.
Table 2Drill verification for GPR reflections at the ice–sediment, ice–water, water–sedimentand frozen–unfrozen interfaces
Subsurfacereflector
Measureddepth (m)
Two-way traveltime (ns)
Calculatedvelocity (m/ns)
Calculated radardepth (m)
ice–sediment 0.54 7 0.154 0.56ice–sediment 1.02 13 0.156 1.04ice–sediment 1.00 12 0.166 0.96ice–sediment 1.36 16 0.17 1.28ice–water 1.50 18 0.166 1.44ice–water 1.56 19 0.164 1.52water–sediment
1.49 98 0.030 1.47
water–sediment
0.19 16 0.024 0.24
frozen–unfrozen
1.61 21 0.153 1.57
frozen–unfrozen
1.00 18 0.111 1.35
The calculated velocity and radar depth were determined using the measured drilldepth and two-way travel time of the subsurface reflections. The calculated radarvelocities were then compared with commonly published velocities for ice 0.16 m ns−1,frozen sediment 0.12m ns−1 and water 0.03 m ns −1. The measured depths and two-waytravel times represent the subsurface interval of each material and not the cumulativedepth measured from the ice surface, as the significant changes in wave velocitieswould lead to miscalculations.
3C.W. Stevens et al. / Cold Regions Science and Technology xxx (2008) xxx–xxx
ARTICLE IN PRESS
Lauritsen, 1996; Wolfe et al., 1997) and identifying talik zones (Arconeet al., 1992, 1998; Bradford et al., 2005; Brosten et al., 2006). GPR hasalso been used to resolve ice thickness, bathymetry and thermalinterfaces in Arctic rivers (Arcone and Delaney, 1987; Delaney et al.,1990; Arcone et al., 1998, 2006; Best et al., 2005; Bradford et al., 2005;Brosten et al., 2006).
The effectiveness of GPR in cold climates corresponds to enhancedpropagation of GPR signals within frozen ground (Davis and Annan,1989). As sediment pore water changes phase to ice electricalconduction decreases and radio (radar) wave penetration is improved(Hoekstra and Delaney, 1974; Olhoeft, 1977). For this reason, ice isoften radar translucent and has low attenuation characteristics(0.01 dB m−1) (Davis and Annan, 1989). Similarly, the phase changefrom pore water to interstitial ice in granular material increases thedielectric contrast between frozen and unfrozen sediment, which canbe resolved with GPR (Moorman et al., 2003).
3. Study area
The Mackenzie Delta of northwestern Canada is the largest Arcticdelta in North America (Jenner and Hill, 1998) (Fig. 1A). The moderndelta plain has low relief and is dissected by channels and scatteredwith numerous lakes. Permafrost up to 100 m thick underlies most ofthe subaerial plain (Allen et al., 1988; Taylor et al., 1996). Localizedtaliks occur beneath distributary channels and lakes (Smith,1976). Thenear-shore zone of the delta is characterized by a shallow-waterplatform of fine-grained sediment. In this region, shallow water(b2 m) extends for up to 15 km seaward of the coastline (Solomon,2003). Seawater intrusion into the delta is largely prevented by astrong freshwater outflow from delta channels that persists through-out the year.
GPR surveys were conducted at the mouth of a distributarychannel known as Middle Channel (Fig. 1B). Sediment in this areais mainly composed of fine sand and silt. A compound bar located atthe mouth of this channel is submerged throughout the summer(June–September), with the exception of a central region that isperiodically subaerial. Landfast ice forms a continuous cover forapproximately 7–8 months of the year with onset of ice in October. Icebreakup typically occurs between late May and early June.
Two types of ice conditions commonly occur in the study area:bottom fast and floating. Bottom-fast ice (BFI) occurs in areas whereice freezes to the sediment bed whereas floating ice is separatedfrom the sediment bed by water. The distribution of these iceconditions appears to be controlled by several factors, including icethickness, water depth, snow pack thickness, and sub-ice watercurrents. The rate of ice growth, the entrapment of gases and the
Table 1The frequency dependence of signal penetration and the theoretical vertical resolutionfor frozen sediment
Center frequency Average signal penetration Measured vertical resolution
50 MHz 75 ns 60 cm100 MHz 60 ns 32 cm250 MHz 25 ns 9 cm
Please cite this article as: Stevens, C.W., et al., Mapping subsurface conpenetrating radar, Cold Regions Science and Technology (2008), doi:10.
incorporation of sediment and ions can significantly affect thestratigraphy of the ice column. Sediment incorporated within the icecolumn was observed throughout the study area as a result ofsuspension freezing and periodic liftoff of BFI from the sediment bed.Some of these compositional properties of ice can affect the behaviorof the EM energy (Kovacs and Morey, 1978; Morey et al., 1984) andshould be considered with respect to the performance of GPR in otherArctic coastal environments.
4. Methods
GPR was used to image subsurface conditions over 154 km ofthe near-shore zone at Middle Channel (Fig. 1B). Surveys wereconducted on landfast ice in late winter (March) of 2005 and 2006.From earlier work in the region, survey lines were located in areas withknownsubsurface features: (i) transitions betweenBFI tofloating ice, (ii)shallowchannels, and (iii) channel bars. TwoGPRsystemsmanufacturedby Sensors and Software Inc. were used in this research: a PulseEKKO100with 50MHz and 100MHz antennas and a Noggin Plus systemwith250 MHz shielded antennas. Data were recorded with two separatedigital video loggers to provide continuous, real-time subsurfaceobservations. The GPR systems were simultaneously operated incontinuous reflection mode and towed in tandem behind a vehicle at5 km hr−1 (Fig. 2). During the surveys, a fixed separation of 10 m wasmaintained between antenna frequencies to decrease interference
Fig. 3. The velocity range of major stratigraphic units found within the near-shore zone.The bars represent the typical range in velocity and depth of that particular material.
ditions within the near-shore zone of an Arctic delta using ground1016/j.coldregions.2008.09.005

Fig. 4. Ground penetrating radar signal response of bottom-fast and floating ice using 250MHz antennas. (A) Modeled estimates of reflected and propagated EM energy. Note thatthe large reflection coefficient between ice and water interface (floating ice) results in larger reflection amplitude and the generation of multiple reflections from the base of theice. (B) Graph of amplitude versus travel time.
Fig. 5. 250 MHz GPR profile of (A) bottom-fast ice and (B) floating ice. The difference inamplitude of the reflection from the ice–sediment interface in (A) and the ice–waterinterface in (B) is due to the difference in dielectric contrast. The floating ice alsogenerates multiple reflections (ice-bottommultiples). The GPR profiles were orientatedparallel to the main flow direction of Middle Channel.
4 C.W. Stevens et al. / Cold Regions Science and Technology xxx (2008) xxx–xxx
ARTICLE IN PRESS
between the two systems and from the tow vehicle. No appreciableinterference was observed between the opposing antenna frequencies.Between antennas of the same frequency, a fixed separation of 2m,1m,and 0.26 m was maintained for 50 MHz, 100 MHz and 250 MHzantennas, respectively. Positional data were recorded with a globalpositioning system that acquired real-time differential readings for eachGPR trace. The multi-frequency setup resulted in the acquisition ofseamless datasets, enabling direct comparison of reflections at differentresolutions and depths.
Due to low noise in the GPR data minimal signal processing wasrequired. Automatic gain control was applied to enhance the signalstrength with depth. The GPR reflections were verified where possiblewith shallow auger holes, sediment cores, ice cores and water depthmeasurements. From these data, both the calculated radar depth andthe radar velocity were determined. To convert two-way travel time todepth, we developed a multi-layer model. The latter increases theaccuracy of depth estimations when radar waves travel throughmultiple layers, each with a different velocity. The multi-layer depthcalculation was derived from:
DT ¼ ∑n
i¼1
ti við Þ2
ð1Þ
where DT is the total depth (m), i is the interface number, vi is averagepropagation velocity (m ns−1) from interface (i-1) to interface (i), andti is the two-way travel time (ns) from interface (i-1) to interface (i).The difference in the GPR signal response was determined by thereflection coefficient. Using the dielectric constants, an estimation ofthe reflection coefficient for an interface under vertical incidence canbe determined from:
R ¼ffiffiffiffiffik1
p−
ffiffiffiffiffik2
p
ffiffiffiffiffik1
pþ
ffiffiffiffiffik2
p ð2Þ
where R is the refection coefficient, k1 is the dielectric constant of theoverlying material and k2 is the dielectric constant of the underlying
Please cite this article as: Stevens, C.W., et al., Mapping subsurface conditions within the near-shore zone of an Arctic delta using groundpenetrating radar, Cold Regions Science and Technology (2008), doi:10.1016/j.coldregions.2008.09.005

Fig. 6. Average amplitude values over a time-slice from 60–70 ns (250 MHz GPR data).The sharp decrease in amplitude values corresponds to the transition between bottom-fast and floating ice.
5C.W. Stevens et al. / Cold Regions Science and Technology xxx (2008) xxx–xxx
ARTICLE IN PRESS
material (A-CUBED,1983). The dielectric constants for ice (k=3), water(k=80) and frozen sediment (k=7.5) are calculated using:
k ¼ c=vð Þ2 ð3Þ
where c is the velocity of the EM wave in free space (m ns−1) and v isthe measured wave velocity through the low loss material (m ns−1).The latter (v) was obtained from common mid-point surveys over BFI,floating ice and frozen sediment.
5. Results and discussion
5.1. GPR signal response
The average signal penetration and vertical resolution imaged overBFI conditions are summarized in Table 1. The 250 MHz GPR antennasprovided high vertical resolution compared to the 50 MHz antennas,which achieved the greatest signal penetration. Owing to the shallowposition of subsurface features examined in this research, 250 and100 MHz antennas were found to offer the best combination of signalpenetration and vertical resolution. Four recurring reflections werenoted to represent ice conditions, water bathymetry, sedimentarystructures, and changes in the thermal state of sediments (frozen andunfrozen). Table 2 presents the comparison between drill data andtwo-way travel times of GPR reflections. These calculations indicatethat the GPR-derived depth to each interface corresponds closely tothe drill measurements. It was also determined that radar velocities ofice, sediment and water varied significantly (Fig. 3).
GPR signal penetration and the ability to resolve subsurface featureswithin the near-shore environment are greatly influenced by iceconditions. Beneath floating ice conditions the reflection coefficient atthe ice-water interface is high (67%), which decreases the percentage ofenergy propagating to greater depths (Fig. 4). Beneath BFI conditions thedielectric contrast between the base of ice and the frozen sediment issmaller, resulting in a lower amount of reflected energy (17%) and agreater percentage of energy available to propagate into the subsurface.Thus, greater penetration of radar signals is achieved over BFI. The lowelectrical conductivity of the water column (b0.2 mS m−1) and porewater (b5 mS m−1) and the sediment grain characteristics (mean grainsize of 74 microns) all act as favorable subsurface conditions for thepropagation of electromagnetic (EM) energy at this site.
5.2. Ice conditions
Under floating ice conditions, a large portion of the reflectedenergy is reverberated within the radar translucent ice column, which
Fig. 7. Plan viewmap showing the distribution of bottom-fast and floating ice over a sub-ice cthe grid is shown in Fig. 1B.
Please cite this article as: Stevens, C.W., et al., Mapping subsurface conpenetrating radar, Cold Regions Science and Technology (2008), doi:10.
produces secondary reflections (ice-bottommultiples) that mimic thebase of the ice (Fig. 5). Ice-bottom multiples occur where a largedielectric contrast exists between the overlying ice (k=3) andunderlying water (k=80). This effect does not occur in regions of BFIbecause the smaller dielectric contrast between ice (k=3) and frozensediment (k=7.5) prevents the development of multiples. Signalamplitude also provides an important discriminator between BFI andfloating ice, as shown by a time slice (over 60–70 ns) of averageamplitudes (Fig. 6). At the ice-water interface an average amplitude of8460±391 mV compared to 2206±115 mV for the ice-sedimentinterface occurs. This quantitative approach was used to map anddiscriminate ice conditions near a sub-ice channel (Fig. 7). Theapproach does not work for all frequencies as there appears to besome frequency-dependence. For instance, using low frequencyantennas (100 and 50 MHz) the occurrence of ice-bottom multipleswas decreased, thereby preventing accurate discrimination of BFI andfloating ice with this technique. Therefore, 250 MHz antennas providethe optimum frequency for discriminating BFI and floating ice in thisstudy.
The high vertical resolution of the 250 MHz antennas enabledrelatively accurate determination of ice thickness when compared tothe traditional augering method (Table 2). However, where icethickness was less than 0.75 m, the ability to clearly define the baseof the ice with 250 MHz quickly decreased to the point where onlysub-ice reflections can be resolved. In thin ice conditions, higher-frequency antennas (e.g., 500 MHz) have been used successfully(Nyland, 2004). In general, thicker ice was found to occur beneathzones of floating ice, due to a greater potential for downward freezingthat existed in these areas.
hannel. The map shows a time slice from 60–70 ns (250 MHz GPR data). The location of
ditions within the near-shore zone of an Arctic delta using ground1016/j.coldregions.2008.09.005

Fig. 8. 250 MHz GPR profile showing diffraction patterns within the ice column due to ice fractures.
6 C.W. Stevens et al. / Cold Regions Science and Technology xxx (2008) xxx–xxx
ARTICLE IN PRESS
Reflections from within the ice column were noted at some sitesand are likely attributed to the presence of large air bubbles, sedimentlayers or small ice fractures (Fig. 8). Ice fractures visible at the surfacecoincide with hyperbolic reflections in GPR profiles. Fractures similarin size to the transmitted wavelength act as point-source reflectionswithin the ice column and appear in profile as hyperbolic reflections(Fig. 8). The high occurrence of fractures is common at transitionalboundaries between zones of bottom-fast and floating ice. Suscept-ibility to ice fracturing at this boundary is due to differences in thebuoyancy of the ice that create differential stress and subsequentfailure of the ice column. Vertical ice movement is commonly inresponse to water level fluctuations due to tides and meteorologicalforcing.
5.3. Bathymetry
Surveys over zones of floating ice show a coherent reflectionpattern that is produced by the water–sediment interface (Fig. 9). Thelack of ice-bottom multiples in this profile is a result of the longerwavelengths of 100 MHz. However, some difficulty was encounteredin resolving steep-walled channels, as a majority of the EM energy isreflected away from the receiving antenna. Typically, the reflectionfrom the water–sediment interface is a negatively-phased waveletwhereas the ice-water interface produces a positively-phasedwavelet.Since the average velocity of radar waves through ice (0.16 m ns−1) is 5times greater than water (0.03 m ns−1), bathymetric measurementsrequire application of amulti-layer depth calculation (Eq. (1)), in orderto account for the difference in velocity expressed by each medium.
Fig. 9. 100 MHz GPR profile showing the reflection produced from the water–sediment interthe channel wall, B is characterized by a discontinuous reflection caused by the rough channewhich exceeds the angle at which energy returns can be measured. The lack of ice-bottom
Please cite this article as: Stevens, C.W., et al., Mapping subsurface conpenetrating radar, Cold Regions Science and Technology (2008), doi:10
Due to range-resolution effects, low frequency antennas (100 and50 MHz) are more suitable to deep water (N4.5 m) and high frequencyantennas (250 MHz) are more suitable to shallow water (b2 m).Within shallow-water zones imaged with 250 MHz antennas, thewater–sediment interface can occur at the same travel time as the ice-bottom multiples, causing some interference in the identification ofthe bathymetric reflection. In order to suppress this interference lowgain levels can be used in the signal processing.
5.4. Sedimentary structures and thermal interfaces
Surveys over BFI reveal sub-bottom features interpreted assedimentary structures and thermal interfaces. Thermal interfacesdetected with 250 and 100 MHz antennas correspond to the interfacebetween frozen and unfrozen sediment (Table 2). These interfacescorrelate to the depth of seasonal frost and the permafrost table(Stevens et al., 2008). Fig. 10 shows one example of seaward dippingreflections that correspond to the prograding direction of thedistributary mouth bar. Thus, dipping reflections are interpreted assedimentary structures representing downstream sediment accretion.Thermal interfaces are characterized by high amplitude, laterallycontinuous reflections, which may cross-cut sedimentary structures(Fig. 11).
In some cases, sedimentary bedding is horizontal to sub-horizontaland the distinction between thermal and sedimentary structures byorientation alone is difficult. However, in these situations thereflection amplitude can effectively be used to distinguish the causeof the reflection (Fig. 12). Reflections produced by sedimentological
face. Location A is characterized by a continuous reflection caused by the gentle slope ofl bottom and C is characterized by a lack of reflections caused by the steep channel wallmultiples in this example is due to the longer wavelength of 100 MHz.
ditions within the near-shore zone of an Arctic delta using ground.1016/j.coldregions.2008.09.005

Fig. 10.100 MHz GPR profile showing dipping reflections interpreted as sedimentary structures. (A) Processed GPR profile and (B) interpreted profile of major reflections. Sedimentsare frozen beyond the depth of signal penetration at this location.
7C.W. Stevens et al. / Cold Regions Science and Technology xxx (2008) xxx–xxx
ARTICLE IN PRESS
changes have lower amplitudes than those resulting from thermalinterfaces. Therefore, amplitude analysis provides additional evidencefor discriminating reflection types where borehole verification is notfeasible or available.
6. Conclusions and implications
This study demonstrates the effective use ofmulti-frequency GPR datawithin the coastal zoneof theMackenzieDelta to resolve: (i) ice conditions(floating vs. bottom fast); (ii) water bathymetry; (iii) sedimentarystructures; and (iv) interfaces between frozen and unfrozen sediment.Resolving the spatial patterns of these four characteristics is an importantcomponent of increasing knowledge regarding Arctic coastal processes,the effects of climate change and future development of northernresources. Reliance on traditional methods like drilling can lead tooversimplification of the complex subsurface conditions. The GPR profilespresented in this study document dramatic variations in subsurfaceconditions over relatively short distances (Fig. 7). This confirms the valueof GPR data for continuously documenting spatial changes in subsurfaceconditions. As with most geophysical techniques, the best approach is toacquire borehole data in association with GPR data to ensure accurateinterpretation of GPR reflections.
Objective discrimination of subsurface features with GPR is appliedinfrequently in subsurface investigations. Most GPR interpretationsare still based almost exclusively on visual discrimination of reflectionpatterns. By developing newmethodologies, however, more confident
Please cite this article as: Stevens, C.W., et al., Mapping subsurface conpenetrating radar, Cold Regions Science and Technology (2008), doi:10.
and robust interpretations of subsurface conditions can be achieved.In this regard, three key approaches are presented in this paper. First,discrimination of BFI from floating ice is achieved with reflectionamplitude values. Higher amplitudes occur over zones of floating iceowing to the occurrence of ice-bottom multiples. The outcome of thistechnique, when applied to 3-D GPR surveys, is a plan view map ofbottom-fast and floating ice (Fig. 7). Secondly, a multi-layer velocitymodel improved estimates of depth by accounting for changes inwavepropagation. Such multi-layer velocity model should be used toaccount for velocity pull-ups and push-downs. Thirdly, discriminatingsedimentary structures from thermal interfaces by using amplitudevalues provides means to support visual interpretations at locationswhere drilling is not feasible (Fig. 12).
The extent of BFI in coastal locations is known to be important inregulating ground temperatures (Dyke, 1991; Solomon et al., 2008)and as a component of geotechnical conditions (Kurfurst andDallimore, 1991). However, resolving spatial variations of frozenground associated with permafrost and seasonal frost has, until now,been limited. This study shows that GPR can delineate frozen groundbeneath zones of BFI (Fig. 11). The transition from unfrozen to frozensediment resolved with GPR closely correlates to the permafrost table,as shown in previous studies (Stevens et al., 2008). The capability ofGPR to resolve permafrost-related interfaces and features implies thepotential for monitoring permafrost conditions in the near-shore,shallow water zones. Thus, GPR provides the opportunity to monitorpermafrost aggradation and degradation in freshwater coastal regions.
ditions within the near-shore zone of an Arctic delta using ground1016/j.coldregions.2008.09.005
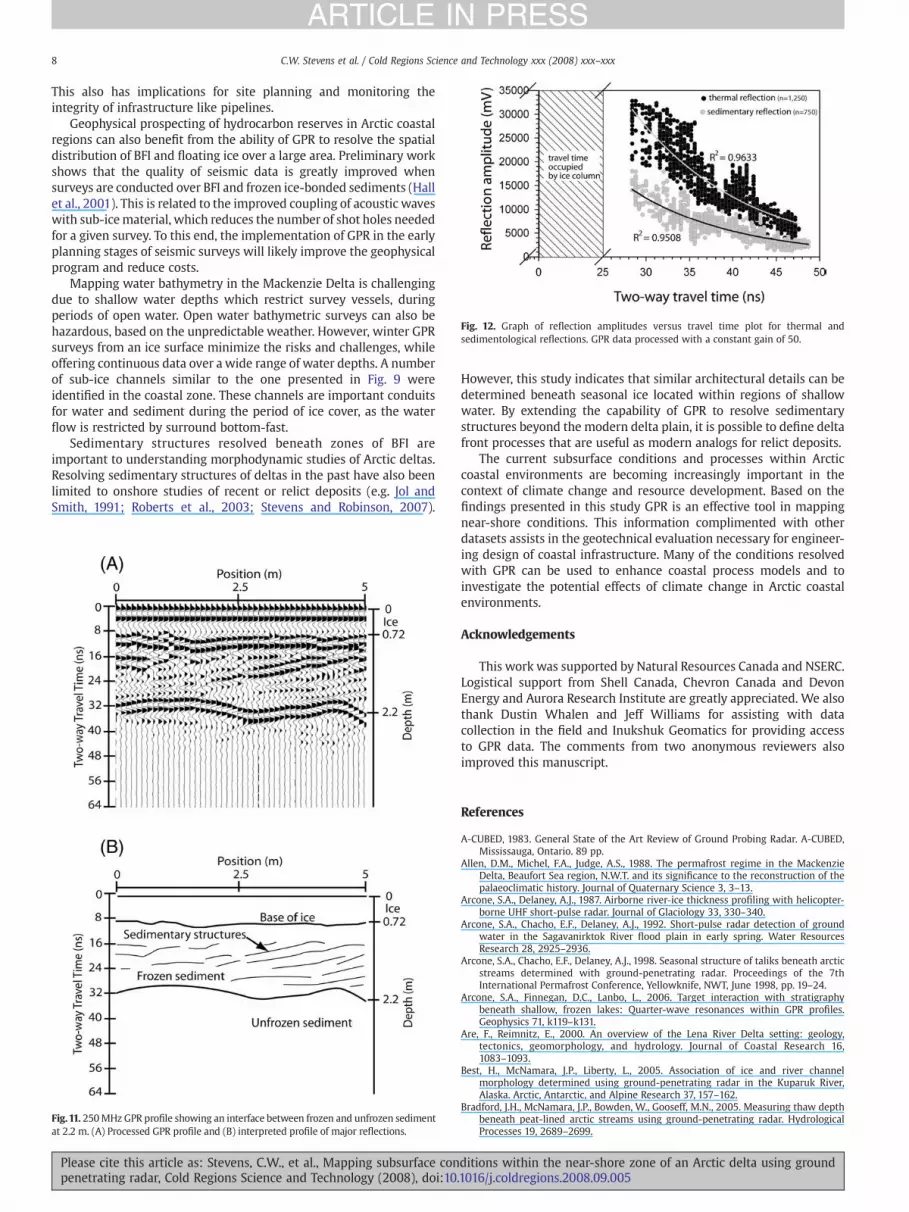
Fig. 12. Graph of reflection amplitudes versus travel time plot for thermal andsedimentological reflections. GPR data processed with a constant gain of 50.
8 C.W. Stevens et al. / Cold Regions Science and Technology xxx (2008) xxx–xxx
ARTICLE IN PRESS
This also has implications for site planning and monitoring theintegrity of infrastructure like pipelines.
Geophysical prospecting of hydrocarbon reserves in Arctic coastalregions can also benefit from the ability of GPR to resolve the spatialdistribution of BFI and floating ice over a large area. Preliminary workshows that the quality of seismic data is greatly improved whensurveys are conducted over BFI and frozen ice-bonded sediments (Hallet al., 2001). This is related to the improved coupling of acoustic waveswith sub-icematerial, which reduces the number of shot holes neededfor a given survey. To this end, the implementation of GPR in the earlyplanning stages of seismic surveys will likely improve the geophysicalprogram and reduce costs.
Mapping water bathymetry in the Mackenzie Delta is challengingdue to shallow water depths which restrict survey vessels, duringperiods of open water. Open water bathymetric surveys can also behazardous, based on the unpredictable weather. However, winter GPRsurveys from an ice surface minimize the risks and challenges, whileoffering continuous data over a wide range of water depths. A numberof sub-ice channels similar to the one presented in Fig. 9 wereidentified in the coastal zone. These channels are important conduitsfor water and sediment during the period of ice cover, as the waterflow is restricted by surround bottom-fast.
Sedimentary structures resolved beneath zones of BFI areimportant to understanding morphodynamic studies of Arctic deltas.Resolving sedimentary structures of deltas in the past have also beenlimited to onshore studies of recent or relict deposits (e.g. Jol andSmith, 1991; Roberts et al., 2003; Stevens and Robinson, 2007).
Fig.11. 250MHz GPR profile showing an interface between frozen and unfrozen sedimentat 2.2 m. (A) Processed GPR profile and (B) interpreted profile of major reflections.
Please cite this article as: Stevens, C.W., et al., Mapping subsurface conpenetrating radar, Cold Regions Science and Technology (2008), doi:10
However, this study indicates that similar architectural details can bedetermined beneath seasonal ice located within regions of shallowwater. By extending the capability of GPR to resolve sedimentarystructures beyond the modern delta plain, it is possible to define deltafront processes that are useful as modern analogs for relict deposits.
The current subsurface conditions and processes within Arcticcoastal environments are becoming increasingly important in thecontext of climate change and resource development. Based on thefindings presented in this study GPR is an effective tool in mappingnear-shore conditions. This information complimented with otherdatasets assists in the geotechnical evaluation necessary for engineer-ing design of coastal infrastructure. Many of the conditions resolvedwith GPR can be used to enhance coastal process models and toinvestigate the potential effects of climate change in Arctic coastalenvironments.
Acknowledgements
This work was supported by Natural Resources Canada and NSERC.Logistical support from Shell Canada, Chevron Canada and DevonEnergy and Aurora Research Institute are greatly appreciated. We alsothank Dustin Whalen and Jeff Williams for assisting with datacollection in the field and Inukshuk Geomatics for providing accessto GPR data. The comments from two anonymous reviewers alsoimproved this manuscript.
References
A-CUBED, 1983. General State of the Art Review of Ground Probing Radar. A-CUBED,Mississauga, Ontario. 89 pp.
Allen, D.M., Michel, F.A., Judge, A.S., 1988. The permafrost regime in the MackenzieDelta, Beaufort Sea region, N.W.T. and its significance to the reconstruction of thepalaeoclimatic history. Journal of Quaternary Science 3, 3–13.
Arcone, S.A., Delaney, A.J., 1987. Airborne river-ice thickness profiling with helicopter-borne UHF short-pulse radar. Journal of Glaciology 33, 330–340.
Arcone, S.A., Chacho, E.F., Delaney, A.J., 1992. Short-pulse radar detection of groundwater in the Sagavanirktok River flood plain in early spring. Water ResourcesResearch 28, 2925–2936.
Arcone, S.A., Chacho, E.F., Delaney, A.J., 1998. Seasonal structure of taliks beneath arcticstreams determined with ground-penetrating radar. Proceedings of the 7thInternational Permafrost Conference, Yellowknife, NWT, June 1998, pp. 19–24.
Arcone, S.A., Finnegan, D.C., Lanbo, L., 2006. Target interaction with stratigraphybeneath shallow, frozen lakes: Quarter-wave resonances within GPR profiles.Geophysics 71, k119–k131.
Are, F., Reimnitz, E., 2000. An overview of the Lena River Delta setting: geology,tectonics, geomorphology, and hydrology. Journal of Coastal Research 16,1083–1093.
Best, H., McNamara, J.P., Liberty, L., 2005. Association of ice and river channelmorphology determined using ground-penetrating radar in the Kuparuk River,Alaska. Arctic, Antarctic, and Alpine Research 37, 157–162.
Bradford, J.H., McNamara, J.P., Bowden, W., Gooseff, M.N., 2005. Measuring thaw depthbeneath peat-lined arctic streams using ground-penetrating radar. HydrologicalProcesses 19, 2689–2699.
ditions within the near-shore zone of an Arctic delta using ground.1016/j.coldregions.2008.09.005

9C.W. Stevens et al. / Cold Regions Science and Technology xxx (2008) xxx–xxx
ARTICLE IN PRESS
Brosten, T.R., Bradford, J.H., McNamara, J.P., Zarnetske, J.P., Gooseff, M.N., Bowden, B.W.,2006. Profiles of temporal thaw depths beneath two Arctic stream types usingground-penetrating radar. Permafrost and Periglacial Processes 17, 341–355.
Dallimore, S.R., Davis, J.L., 1987. Ground-probing radar investigations of massive groundice and near surface geology in continuous permafrost. Current Research, Part A,Geological Survey of Canada Paper 87-1A, pp. 913–918.
Dallimore, S.R., Davis, J.L., 1992. Ground penetrating radar investigations of massiveground ice. In: Pilon, J. (Ed.), Ground Penetrating Radar, Geological Survey of CanadaPaper 90-4, pp. 41–48.
Davis, J.L., Annan, A.P., 1989. Ground-penetrating radar for high resolution mapping ofsoil and rock stratigraphy. Geophysical Prospecting 37, 531–551.
Delaney, A.J., Arcone, S.A., Chacho, E.F., 1990. Winter short-pulse radar studies on theTanana River, Alaska. Arctic 43, 244–250.
Doolittle, J.A., Hardisky, M.A., Gross, M.F., 1990. A ground penetrating radar study ofactive layer thickness in areas of moist sedge and wet sedge tundra near Bethel,Alaska, U.S.A. Arctic and Alpine Research 22, 175–182.
Dupre, W.R., Thompson, R., 1979. The Yukon Delta: a model for deltaic sedimentation inan ice-dominated environment.11th Annual Offshore Technology Conference,1979,proceedings, Houston Texas, pp. 656–664.
Dyke, L.D., 1991. Temperature changes and thaw of permafrost adjacent to RichardsIsland, Mackenzie Delta, N.W.T. Canadian Journal of Earth Sciences 28, 1834–1842.
Hall, K.W., Nieto, C.E., Gallant, E.V., Stewart, R.R., 2001. Multicomponent seismic surveyover ground-fast and floating ice, MacKenzie Delta, N.W.T. CREWES ResearchReport, vol. 13, pp. 29–45.
Harper, J.R., 1990. Morphology of the Canadian Beaufort Sea coast. Marine Geology 91,75–91.
Hill, P.R., Barnes, P.W., Hequette, A., Ruz, R.-H., 1994. Arctic coastal plain shorelines. In:Carter, R.W.G., Woodroffe, C.D. (Eds.), Coastal Evolution Late Quaternary shorelinemorphodynamics, Carter and Woodroffe (eds.), pp. 341–372.
Hill, P.R., Lewis, C.P., Desmarais, S., Kauppaymuthoo, V., Hasna, R., 2001. The MackenzieDelta: sedimentary processes and facies of a high-latitude, fine-grained delta.Sedimentology 48, 1047–1078.
Hinkel, K.M., Doolittle, J.A., Bockheim, J.G., Nelson, F.E., Paetzold, R., Kimble, J.M., Travis, R.,2001. Detection of subsurface permafrost features with ground-penetrating radar,Barrow, Alaska. Permafrost and Periglacial Processes 12, 179–190.
Hoekstra, P., Delaney, A., 1974. Dielectric properties of soils at UHF and microwaveFrequencies. Journal of Geophysical Research 79, 1699–1708.
Jenner, K.A., Hill, P.R., 1998. Recent, arctic deltaic sedimentation: Oliver Islands,Mackenzie Delta, North-west Territories, Canada. Sedimentology 45, 987–1004.
Jol, H.M., Smith, D.G., 1991. Ground penetrating radar of northern lacustrine deltas.Canadian Journal of Earth Sciences 29, 1939–1947.
Kovacs, A., Morey, R.M., 1978. Radar anisotropy of sea ice due to preferred azimuthalorientation of the horizontal c axes of ice crystals. Journal of Geophysical Research83, 6,037–6,046.
Kurfurst, P.J., Dallimore, S.R., 1991. Engineering geology of nearshore areas off RichardsIsland, N.W.T., a comparison of stable and actively eroding coastlines. CanadianGeotechnical Journal 28, 179–188.
Lonne, I., Lauritsen, T., 1996. The architecture of a modern push-moraine at Svalbard asinferred from ground-penetrating radar measurements. Arctic and Alpine Research28, 488–495.
Please cite this article as: Stevens, C.W., et al., Mapping subsurface conpenetrating radar, Cold Regions Science and Technology (2008), doi:10.
Moorman, B.J., Robinson, S.D., Burges, M.M., 2003. Imaging periglacial conditions withground-penetrating radar. Permafrost and Periglacial Processes 14, 319–329.
Morey, R.M., Kovacs, A. and Cox, G.F.N., 1984. Electromagnetic properties of sea ice. U.S.Army Corps. Cold Regions Research and Engineering Laboratory 84-2.
Nyland, D., 2004. Profiles of floating ice in arctic regions using GPR. The Leading Edge23, 665–668.
Ogorodov, S.A., 2005. Human impacts on coastal stability in the Pechora Sea. Geo-Marine Letters 25, 190–195.
Olhoeft, G., 1977. Electrical properties of natural clay permafrost. Canadian Journal ofEarth Sciences 14, 16–24.
Pilon, J.A., Annan, A.P., Davis, J.L., Gray, J.T., 1979. Comparison of thermal and radar activelayer measurements in the Leaf Bay Area, Nouveau-Quebec. Geographie Physique etQuaternaire 23, 317–326.
Rachold, V., Are, F.E., Atkinson, D.E., Cherkashov, G., Solomon, S.M., 2005. Arctic coastaldynamics (ACD): an introduction. Geo-Marine Letters 25, 63–68.
Reimnitz, E., Barnes, P.,1974. Sea ice as a geologic agent on the Beaufort Sea shelf of Alaska.In: Reed, J.C., Sater, J.E. (Eds.), The coast and shelf of the Beaufort Sea, pp. 301–353.
Roberts, M.C., Niller, H.P., Helmstetter, N., 2003. Sedimentary architecture and radarfacies of a fan delta, Cypress Creek, West Vancouver, British Columbia. In: Bristow,C.S., Jol, H.M. (Eds.), Ground Penetrating Radar in Sediments. Geol. Soc. LondonSpec. Publ. 211, pp. 111–126.
Robinson, S.D., Moorman, B.J., Judge, A.S., Dallimore, S.R., 1993. The characterization ofmassive ice at Yaya Lake, Northwest Territories using radar stratigraphy techniques.Current Research, Part B, Geological Survey of Canada Paper 93-1B, pp. 23–32.
Smith, M.W., 1976. Permafrost in the Mackenzie Delta. Geological Survey of Canada,Paper 75-28. 31 pp.
Solomon, S.M., 2003. The mineral potential of the proposed Mackenzie Delta marineprotected areas. Geological Survey of Canada, Open File Report 1820. 50 pp.
Solomon, S.M., Taylor, A.E., Stevens, C.W., 2008. Nearshore ground temperatures,seasonal ice bonding and permafrost formation within the bottomfast ice zone,Mackenzie Delta, NWT. Ninth International Conference on Permafrost, Fairbanks,Alaska, pp. 1675–1680.
Stevens, C.W., Robinson, S.D., 2007. The internal structure of relict lacustrine deltas,northern New York. In: Baker, G.S., Jol, H.M. (Eds.), Stratigraphic Analyses UsingGPR: Geol. Soc. of America Spec. Paper, vol. 432, pp. 93–101.
Stevens, C.W.,Moorman, B.J., Solomon, S.M., 2008.Detectionof frozen andunfrozen interfaceswith ground penetrating radar in the near-shore zone of the Mackenzie Delta, Canada.Ninth International Conference on Permafrost, Fairbanks, Alaska, pp. 1711–1716.
Taylor, A.E., Dallimore, S.R., Judge, A.S., 1996. Late Quaternary history of the Mackenzie-Beaufort region, Arctic Canada, from modelling of permafrost temperatures. 2. TheMackenzie Delta- Tuktoyaktuk coastlands. Canadian Journal of Earth Sciences 33,62–71.
Wolfe, S.A., Burgess, M., Douma, M., Hyde, C., Robinson, S.D., 1997. Geological andgeophysical investigations of ground ice in glaciofluvial deposits, Slave Province,District of Mackenzie, Northwest Territories. Geological Survey of Canada Open File3442, Ottawa.
Wong, J., Rossiter, J.R., Olhoeft, G.R., Strangway, D.W.,1977. Permafrost: Electrical propertiesof the active layer in situ. Canadian Journal of Earth Sciences 14, 582–586.
ditions within the near-shore zone of an Arctic delta using ground1016/j.coldregions.2008.09.005