Embed Size (px)
Citation preview
Amer J of Potato Res (2003) 80:359-369 359
Marker-ass i s ted Genet i c Analys i s o f Non-acc l imated Freez ing Tolerance and Cold Acc l imat ion Capac i ty
in a B a c k c r o s s S o l a n u m P o p u l a t i o n
S a n d r a E. Vega 1, A l fonso H. del Rio 1, G e u n h w a J tmg 2, J o h n B. B a m b e r g 3, a n d J i w a n P. Pa l t a 1.
]Department of Horticulture, University of Wisconsin, 1575 Linden Drive, Madison, WI 53706. 2Department of Plant Pathology, University of Wisconsin, 1630 Linden Drive, Madison, WI 53706.
3USDA/Agricultural Research Service, Inter-Regional Potato Introduction Station, 4312 Hwy 42, Sturgeon Bay, WI 54235. *Corresponding author: Tel: 608-358-5672; FAX: 608-262-4743; E-mail: [email protected]
ABSTRACT
Random amplified polymorphic DNA (RAPD) and
simple sequence r epea t (SSR) markers were used to
cons t ruc t a par t ia l genet ic l inkage map in a po ta to back-
cross populat ion. The popula t ion , derived from two
diploid wild So lanum species ( f ros t to lerant , able to
cold acclimate S. commersonii; frost sensit ive, unab le to
cold acclimate S. cardiophyl lum) , was used to map
quan t i t a t ive t ra i t loci (QTL) of non-accl imated re la t ive
freezing to lerance (NARFT) and cold accl imation capac-
i ty (CAC). Precise assessment of these t ra i t s al lowed
d is t inc t ion of small bu t s ignif icant differences among 35
backcross genotypes. NARFT and CAC were no t corre-
la ted in the segregat ing popula t ion, suggest ing inde-
p e n d e n t gene t ic con t ro l for these two m a j o r
components of freezing tolerance. The l inkage map
spanned 479.4 cM and included 77 RAPD markers and
two SSR markers, with 38 RAPD and 10 SSR unass igned
markers . Two QTLs for NARFT were detec ted in two dif-
f e r en t l inkage groups, account ing for 44.0% of the phe-
notypic var ia t ion for this t ra i t . Two QTLs for CAC were
detected, account ing for 24.9% of the phenotypic varia-
t ion for this t rai t . QTLs for NARFT and CAC were
de tec ted a t separa te genomic regions, in suppor t of the
i ndependen t genet ic cont ro l of these two trai ts . QTLs
for NARFT and CAC were de tec ted in a l inkage group
ident i f ied as par t of chromosome V, suggesting tha t such
Accepted for publication 4 August 2003. ADDITIONAL KEY WORDS: cold hardiness, QTL, RAPD, potato, Solanum commersonii, Solanum cardiophyllum, SSR.
chromosome cons t i tu tes a pr ime candidate for fine-map-
ping. Due to the relat ively small progeny size evaluated
in this study, addi t ional QTLs for NARFT and CAC could
have been involved bu t no t ident i f ied. Therefore, the
conclusions derived from this s tudy should be consid-
ered preliminary.
RESUMEN
Marcadores de DNA pollm6rfico amplificado al azar
(RAPD) y de secuencias simples repe t idas (SSR) fueron
ut i l izadas para cons t ru i r un mapa parcial de l igamiento
gen~tico en u n a poblaci6n de re t ro-cruza de papa. Es ta
pob lac i6n fue der ivada de dos espec ies s i lves t res
diploides, S. commersoni i ( r e s i s t en te a heladas, capaz
de accl imatarse a bajas t empera tu ra s ) y S. cardiophyl-
lum ( sens ib le a heladas, incapaz de acl imatarse a bajas
t empera tu ras ) , y se util iz6 pa ra mapea r loci de car~c-
te res cuant i ta t ivos (QTL) para la to le ranc ia re la t iva a
heladas s in acl imataci6n a bajas t empera tu ras (NARFT)
y la capacidad de acl imatarse a ba jas t empera tu ras
(CAC). La de te rminac i6n precisa de estos dos carac-
te res permi t i6 encon t r a r diferencias pequefias pero sig-
nif icativas en t r e los 35 genot ipos de la retro-cruza. La
correlaci6n en t r e NARFT y CAC no fue significativa en
la poblaci6n segregante, sugier iendo que exis te un con-
t rol gen~tico independ ien te para cada uno de estos dos
ABBREVIATIONS: ACCRF]?, acclimated relative freezing tolerance; BC, backcross; bp, base pair; CAC, cold acclimation capacity; GA, gibberel- lic acid; LG, linkage group; IX)D, logarithm of the odds; NARFr, non- acclimated relative freezing tolerance; PAR, photosynthetically active radiation; r, recombinant fraction; RFT, relative freezing tolerance.
360 AMERICAN JOURNAL OF POTATO RESEARCH Vol. 80
componentes mayores de la tolerancia a heladas . E1
tamafio del mapa fue de 479.4cM e inc luy6 77 mar-
cadores RAPD y dos marcadores SSR; con 38 marcadores
RAPD y 10 marcadores SSR sin asignar. Para NARFT, dos
QTLs fueron detec tados en dos d l ferentes grupos de lig-
a m i e n t o representando 44.0% de la variaci6n fenot ip ica
observada en es te car~cter. Para CAC, dos QTLs fueron
d e t e c t a d o s , los c u a l e s r e p r e s e n t a r o n 24.9% de la
variacidn fenot ip ica observada en es te car~cter. Los
QTLs para NARFT y CAC fueron detec tados en difer-
e n t e s reg iones g e n d m i c a s , c o n f i r m a n d o e l con tro l
gen~t ico independ ien te de es tos dos caracteres . Los
QTLs para NARFT y CAC fueron detec tados en un grupo
de l igamiento ident i f icado como parte del c r o m o s o m a V,
sugir iendo que dicho c r o m o s o m a podria ser un can-
didato principal para mapeo fino. Debido a que el
tamafio de la poblac idn evaluada en este e s tud io fue rel-
a t ivamente pequefio, QTLs adic ionales para NARFT y
CAC podrian existir. En consecuencia , las conc lus iones
derivadas de es te e s tud io deben ser cons ideradas como
prel iminares .
INTRODUCTION
Potatoes are mainly grown in the temperate zones and in
the highlands of the Andean tropics of South America, where
unpredictable frosts often reduce yield and quality. For exam-
ple, it is estimated that in the Andean countries more than
400,000 ha of potato fields are threatened by frost injury every
year (Estrada et al. 1993). One inherent problem is that most
of the potato varieties cultivated worldwide are sensitive to
low temperatures (cultivated species S. tuberosum is killed at
-2 to -3 C; Li and Palta 1978). However, a screening of the
United States potato collection for frost hardiness showed that
many wild Solanum species exhibit frost tolerance far supe-
rior to that of the cultivated species (Vega and Bamberg 1995).
This diversity provides an invaluable resource and an ideal
model system for breeding to improve resistance to low tem-
peratures and to study the mechanisms of freezing tolerance
and cold acclimation.
Two major components of freezing stress resistance are
freezing tolerance in the non-acclimated state (normal grow-
ing condition) and capacity to cold acclimate (increase in
freezing tolerance upon exposure to chilling temperatures
[Palm and Simon 1993]). Solanum species vary greatly in both
(Chen and Li 1980; Vega and Bamberg 1995). Stone et al. (1993)
demonstrated that freezing tolerance and ability to cold accli-
mate are under independent genetic control in potato. This
was later confirmed in other plant species (Arora et al. 1998;
Teutonico et al. 1995). These results have important implica-
tions for the improvement of cold tolerance of cultivated pota-
toes. For the successful improvement of frost hardiness, both
components must be transferred to the cultivated potatoes
(Palta and Simon 1993).
Over the years, limited success has been achieved using
traditional plant-breeding methods to improve freezing stress
resistance in crops (Marshall 1982; Palta and Simon 1993).
Even those that have undergone extensive breeding, such as
winter wheat, have not had significant improvements, and cul-
tivars that were released more than 50 years ago remain
among the most cold hardy today (Limin and Fowler 1991).
Recent progress in plant breeding has focused on the use of
molecular marker techniques to facilitate cloning and efficient
introgression of favorable genes through marker-assisted
selection (Dudley 1993; Lande and Thompson 1990). Genomic
regions with significant effect on freezing tolerance have been
detected in several crops: Citrus (Cai et al. 1994); Brassica
(Kole et al. 2002; Teutonico et al. 1995); Triticum (wheat)
(Sutka 1994); Eucaliptus nitens (Byrne et al. 1997), Lycoper-
sicon (tomato) (Foolad et al. 1998), Vaccinium (blueberry)
(Rowland et al. 1999), and Oryza sativa (rice) (Salto et al.
2001).
The objective of the present study was to provide genetic
insights to potato cold hardiness by analyzing non-acclimated
freezing tolerance (NARVF) and cold acclimation capacity
(CAC) on a segregating population using molecular markers. A
backcross population segregating for both traits was used to
develop a random amplified polymorptfic DNA (RAPD) link-
age map. Two diploid tuber-bearing wild Solanum species that
represent extremes of NARFF and CAC were used as parents,
S. commersonii (frost tolerant and able to cold acclimate) and
S. cardiophyUum (frost sensitive and unable to cold accli-
mate). Simple sequence repeat (SSR) loci of known chromo-
somal location (Milbourne et al. 1998) were included in the
analysis. The resulting map and the phenotypic data of frost
hardiness and cold acclimation capacity of the backcross pop-
ulation were used to identify quantitative trait loci (QTL).
2003 VEGA et al.: FREEZING TOLERANCE AND COLD ACCLIMATION CAPACITY 361
MATERIALS AND METHODS
Plant Material Seeds of S. cardiophylum (cph) PI 184762 and S. com-
mersonii (cram) PI 243503 were obtained from the Inter-
Regional Potato Introduction Station (NRSP-6), Sturgeon Bay,
WI, USA. One single seedling from each species was then
propagated and used as parents; the pollen of S. cardiophy-
lum was pollinated onto stigmas of S. commersonii. To
develop the backcross population we used an F1 individual
(clonal identity: FI-1) in which NARFT and CAC most resem-
bled the sensitive parent cph. The F1 (cmm x cph) and BC1
backcross (FI-1 x cram) populations were obtained using
controlled pollinations as described by Stone et al. (1993).
Nearly 2000 pollinations were performed under controlled
conditions at the University of Wisconsin Biotron facility
(Madison, WI, USA). Backcross to the sensitive parent failed
to produce viable seeds. Therefore, the population evaluated
in this study was derived from the backcross to the freezing
tolerant acclimating parent. Clonal propagation of the back-
cross population was done as described by Vega et al. (2000).
From more than 20 F ls and close to 100 backcross seeds har-
vested, we were able to successfully grow and evaluate 19 F ls
and 35 backcross genotypes. Plantlets of both parents, their
F1 progeny and BC1 backcross population obtained from
stem culture were individually potted in 2.5-L plastic pots con-
taining 1:1 peat:vermiculite (v/v) and grown in a controlled-
environment room at the University of Wisconsin-Madison
Biotron facility.
Growth conditions were 20 + 1/18 _+ 1 C day/night tem-
peratures, with a 14-h photoperiod of 400 pmol.m-2os -1 PAR
from cool-white fluorescent lamps. Relative humidity was 70 +
5%. Plants were irrigated with haft-strength Hoagland solution
delivered automatically twice daily to ensure that plants would
be watered in excess of the container capacity to prevent salt
accumulation. Cold acclimation treatment was initiated 5 wk
after potting. To achieve cold acclimation, the air temperatures
were lowered to 4/2 C day/night with a 14-h photoperiod and
100 vmolom-2os -1 PAR. Plants were kept under these condi-
tions for 12 days. These conditions were previously deter-
mined to be ideal for cold acclimation of potato species
(Steffen et al. 1989).
Determination o f Relative Freezing Tolerance
Freezing tolerance of the plant material was determined
by a modification of the protocol of Steffen et al. (1989). Fully
expanded terminal leaflets were excised at the end of the dark
period before the lights came on and placed in covered glass
culture tubes. Glass tubes containing one leaflet each were
submerged in a glycol-containing controlled temperature cool-
ing bath (Forma Scientific, Model 2323, Marietta, OH, USA)
held at 0 C. After 30 rain the temperature in the cooling bath
was lowered to -0.5 C, held for 30 min, and then lowered to
-1.0 C. After 30 min at -1.0 C, ice nucleation was initiated by
adding a small piece of ice to each tube. Samples were held at
-1.0 C for another 30 min, then the temperature was lowered
to -1.5 C and held for 1 h. Further cooling was at a rate of 0.5
C/30 min down to -10 C and 1.0 C/30 rain below -10 C. Tubes
containing the frozen leaflets were removed at predetermined
temperatures (used to develop an ion leakage curve) and
thawed on ice overnight prior to the evaluation of injury.
Leaflets used as unfrozen controls were kept in an ice-filled
cooler. Three leaflets were evaluated before and after cold
acclimation at each temperature for the parental species, Fls,
and backcross progeny.
Freezing injury was assessed by the measurement of ion
leakage (Flint et al. 1967). The ion leakage was expressed as
the ratio of electrolyte leakage from freeze-injured tissue to
electrolyte leakage from autoclaved tissue. Thawed leaflets
were sliced into strips before the addition of 25 mL of deion-
ized, distilled water at approximately 22 C. Samples were infil-
trated for 5 min at 10 kPa using a vacuum pump and then
shaken for 1 h at 220 rpm on a gyratory shaker at room tem-
perature. Electrical conductivity (R1) was measured with an
YSI model 32 conductance meter (Yellow Springs, OH, USA).
Total conductivity (R~) of each sample was measured follow-
ing a 24 h cooling period after autoclaving at 121C for 15 min.
Percentage mean ion leakage expressed as (R1/R2) x 100 of
triplicates was plotted as a function of freezing temperature.
Relative freezing tolerance (Rl~r) was determined from the
midpoint of the maximum (autoclaved) and minimum (con-
trol) ion leakage values obtained for all the genotypes (average
of the three leaflets) before and after cold acclimation as
described by Stone et al. (1993). The absolute value of this
temperature was defmed as the RVr. CAC was assessed as
acclimated relative freezing tolerance (ACCRFT) minus
362 AMERICAN JOURNAL OF POTATO RESEARCH Vol. 80
NARVF. The distributions of the backcross progenies for the
non-acclimated freezing tolerance and acclimation capacity
were analyzed for deviations from normality using the
Shapiro-Walk Test (Shapiro and Wilk 1965). A correlation
analysis was also performed for both traits.
DNA Isolation DNA was isolated from two tissue-culture-propagated
plantlets according to a procedure previously described by det
Rio et al. (1997) in which potassium ethyl xanthogenate (PEX)
served to liberate DNA. Extracted DNA was dissolved in Ttis
10 mM, EDTA 1 mM (TE) 1X buffer (Promega, Madison, WI,
USA) and stored at -20 C. DNA quantification was performed
by fluorometry using TKO-100 Mini Fluorometer (Hoefer Sci-
entific Supplies, San Francisco, CA).
RAPD/SSR Markers and PCR Amplification The 10 bp ollgonucleotide primers used in the RAPD
assay were randomly selected from Operon Technologies
(Alameda, CA, USA). PCR amplifications were performed in
15-pL reaction volumes containing 50 mM Ttis-HC1 pH 8.0, 100
mM NaC1, 0. i mM DT1 ~, 50% glycerol, 1.0% Triton X-100 as reac-
tion buffer, 25 mM MgC12, 200 pM each of dATP, dCTP, dGTP,
and dTI'P, 1 unit of Taq DNA polymerase (Promega, Madison,
WI, USA), 15 ng genomic DNA template and 0.2 ]~i of a random
primer. PCR amplification was performed in a Perkin Elmer
Applied Biosystems Cetus DNA Thermal Cycler 9600 (Norwalk,
CT, USA) programmed for one cycle of 94 C/4 min; three cycles
of 94 C/15 sec, 35 C/15 sec, 72 C/75 sec; 40 cycles of 94 C/15
sec, 40 C/15 sec; one cycle of 72 C/7 min; and then 4 C soak.
Thirty-two primer pairs flanking SSR regions previously
characterized in potato by Milbourne et al. (1998) were syn-
thesized on a Perkin Elmer Applied Biosystems synthesizer
(model 3948, Norwalk, CT, USA) at the DNA Synthesis and
Sequencing Facility of the University of V~mconsin Biotechnol-
ogy Center (Madison, WI, USA) and used for PCR amplifica-
tion. PCR was performed in 15-p_L reaction volumes containing
the same reagents as specified for RAPD assays, but using 17
ng of genomic DNA and 0.6 pM of each primer of the pair. PCR
was performed in the thermal cycler mentioned above pro-
grammed for one cycle of 94 C/1 min; three cycles of 94 C/15
sec, 45 C/20 sec, 72 C/1:15 min; 43 cycles of 94 C/15 sec, 50 C/15
sec, 72 C/1:15 min; one cycle of 72 C/7 min; and then 4 C soak.
RAPD and SSR products were fractionated by elec-
trophoresis in 1.5% and 1.2% agarose gels, respectively, and
visualized following ethidium bromide staining (gels were
soaked in 0.5 pg EtBr/mL 1X TAE buffer). RAPD and SSR
bands displaying polymorphism were scored as present (1) or
absent (0). The approximate product lengths (within 50 bp)
were estimated by visual comparison with a DNA fragment
size marker (Promega, Madison, WI, USA). Each marker was
then named by the letter (RAPD) and/or number (SSR) identi-
fying the primer and the approximate length of the marker.
This method was considered adequate to unambiguously
name all markers.
Linkage Map Construction Segregating bands were scored as present or absent.
Observed segregation ratios were analyzed for deviation from
the expected 1:1 Mendelian ratio using Chi-square test for
goodness-of-fit (P < 0.01). The segregation analysis of 113
RAPD markers and 12 SSR markers was performed on data
from 35 backcross genotypes. Linkage analysis was conducted
using MAPMAKER Macintosh version 2.0 (Lander et al. 1987),
and the mapping population was treated as an F~ backcross
population. Subsequent map construction followed estab-
lished principles and recommendations (Keats et al. 1991) for
framework mapping. After loading the data, loci were assigned
to linkage groups based on a LOD score (LOD: logarithm of
likelihood odds) >3 and a recombination fraction (r or them)
of 0.3. Map distances were calculated using the Kosambi func-
tion (Kosambi 1944). Thefinal map distances were estimated
using the MAP command with the error detection function
engaged.
Identification of QTLs The data were analyzed based on single-factor analysis of
variance (ANOVA) for each pairwise combination of quantita-
tive traits and marker loci. T-tests (P < 0.05) were used to deter-
mine if significant differences in trait expression were
associated with differences in marker locus-genotypic classes
(Edwards et al. 1987). Significant marker loci in the same link-
age group were considered as one QTL if the distance between
them was <50 cM (Paterson et al. 1991). When significant
marker loci were linked, the marker locus having the greatest
r 2 values was considered to be the most likely position of the
QTL and used in further analysis. The marker loci significantly
associated with trait variation based on the single-factor
ANOVA were then entered into a stepwise multiple regression
analysis in order to select the best set of markers and compute
2003 VEGA et al.: FREEZING TOLERANCE AND COLD ACCLIMATION CAPACITY 363
the total phenotypic variation explained. The method of inter-
val mapping was used for the localization of QTL and the esti-
mation of their genetic effects (Lander and Botstein 1989). For
this purpose, the computer program MAPMAKEPJQTL version
1.9 (Lincoln and Lander 1989) was used with a LOD score for
the QTL threshold set at 1.5. This LOD was chosen to ensure
that any QTL with small, but significant, effects contributing to
these polygenic traits were detected. Stepwise multiple regres-
sion was performed using marker loci associated with individ-
A 10
4 ~
3 ~
O
cram -3.5
F1 parent
cph "2 I
t ~
Nonacclimated Relative Freezing Tolerance (°C)
ual QTL as independent variables to determine the best multi-
locus model and the percentage of the phenotypic variation
explained (Paterson et al. 1991). Marker loci were included in
the fmal model if they were significant at P _< 0.05. The p-value
of 0.05 used for the detection of individual QTLs and for the
stepwise regression analysis was relatively high. This p-value
may increase the experimental Type I error rate; however,
lower stringency of detection has been recommended as a way
to reduce the probability of committing Type II errors
(Edwards et al. 1992). In addition, signifi-
cant molecular marker loci (P_< 0.05) in the
final model by the stepwise multiple regres-
sion analysis were tested for significant
interactions by two-way ANOVA.
B
'l 5
3 ~
m o. m
Cold Acclimation Capacity (°C)
o
R E S U L T S
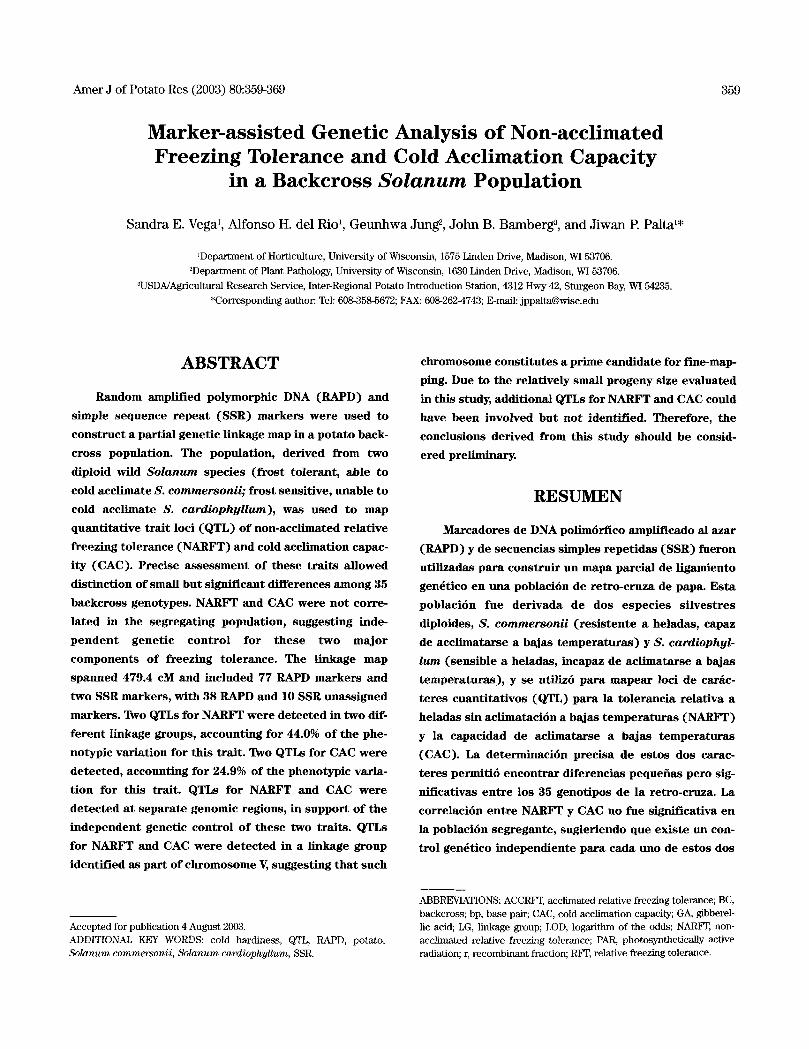
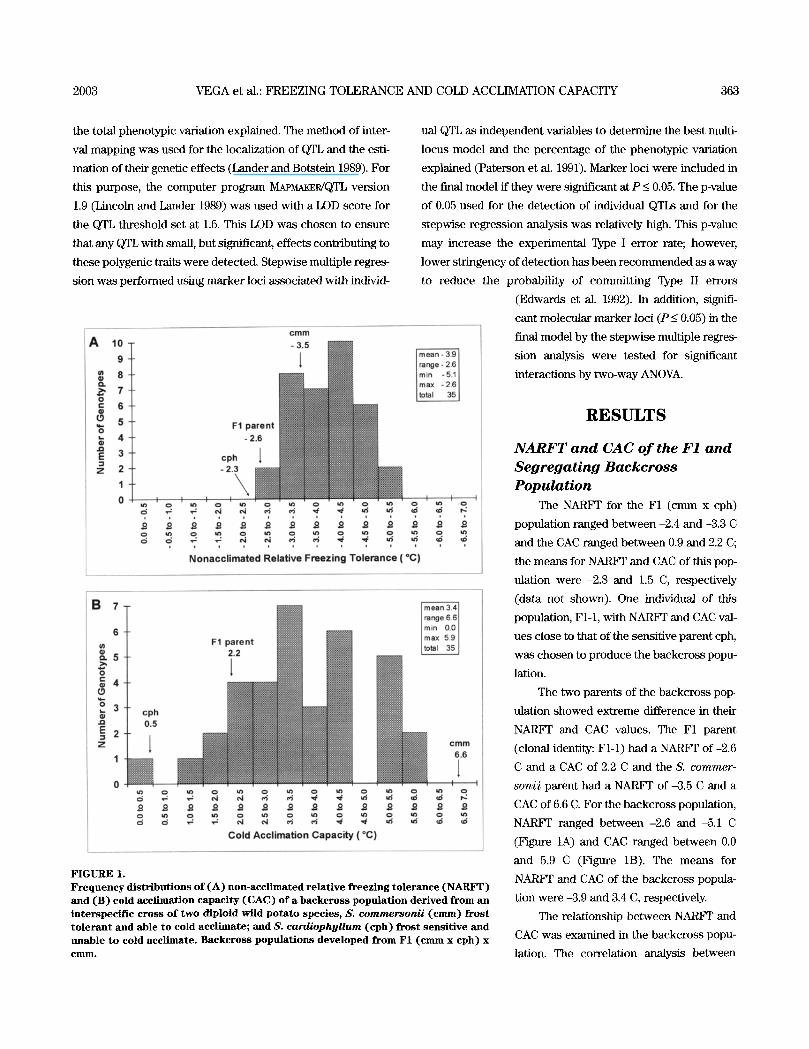
FIGURE 1. Frequency distributions of (A) non-acclimated relative freezing tolerance (NARFT) and (B) cold acclimation capacity (CAC) of a backcross population derived from an interspecif ic cross of two diploid wild potato species , S. commersonii (cram) frost tolerant and able to cold acclimate; and S. cardiophyllum (cph) frost sensit ive and unable to cold acclimate. Backcross populations developed from F1 (cram x cph) x C I I l I I L
N A R F T a n d C A C o f the F1 a n d
S e g r e g a t i n g B a c k c r o s s
P o p u l a t i o n
The NARF]" for the F1 (cram x cph)
population ranged between -2.4 and -3.3 C
and the CAC ranged between 0.9 and 2.2 C;
the means for NARV1 ~ and CAC of this pop-
ulation were -2.8 and 1.5 C, respectively
(data not shown). One individual of this
population, FI-1, with NARFF and CAC val-
ues close to that of the sensitive parent cph,
was chosen to produce the backcross popu-
lation.
The two parents of the backcross pop-
ulation showed extreme difference in their
NARFF and CAC values. The F1 parent
(clonal identity: FI-1) had a NARFF of -2.6
C and a CAC of 2.2 C and the S. commer-
sonii parent had a NARFT of -3.5 C and a
CAC of 6.6 C. For the backcross population,
NARFF ranged between -2.6 and -5.1 C
(Figure 1A) and CAC ranged between 0.0
and 5.9 C (Figure 1B). The means for
NARFF and CAC of the backcross popula-
tion were -3.9 and 3.4 C, respectively.
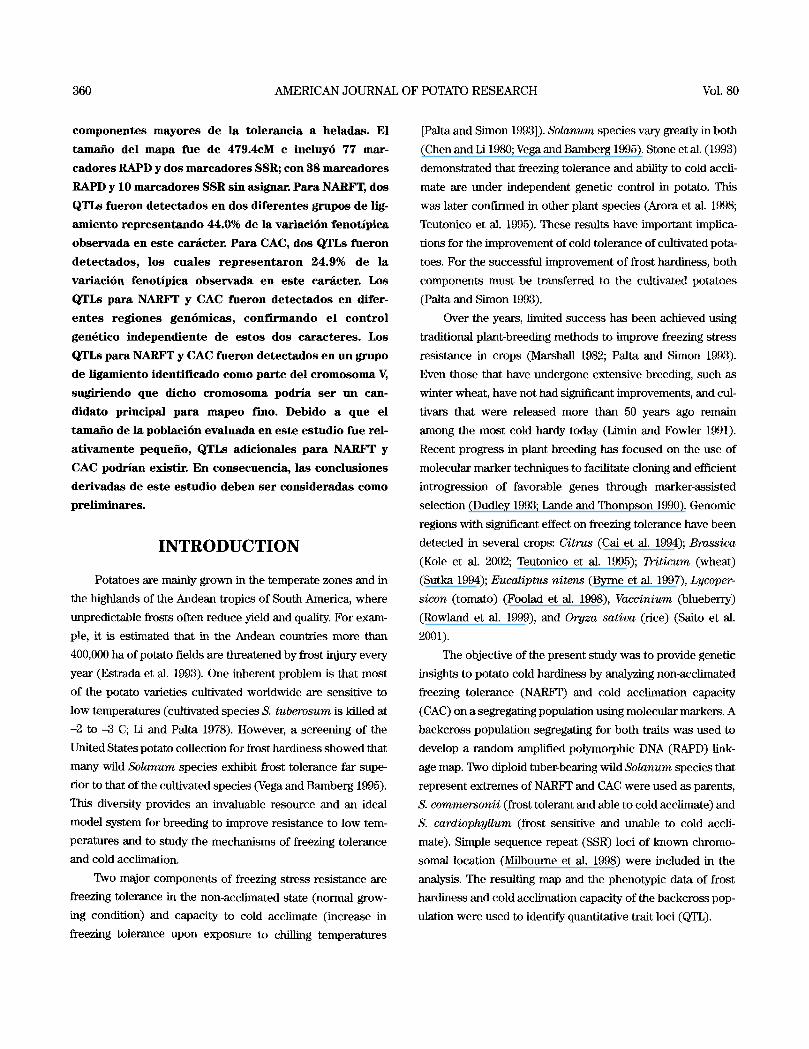
The relationship between NARFF and
CAC was examined in the backcross popu-
lation. The correlation analysis between
364 AMERICAN JOURNAL OF POTATO RESEARCH Vol. 80
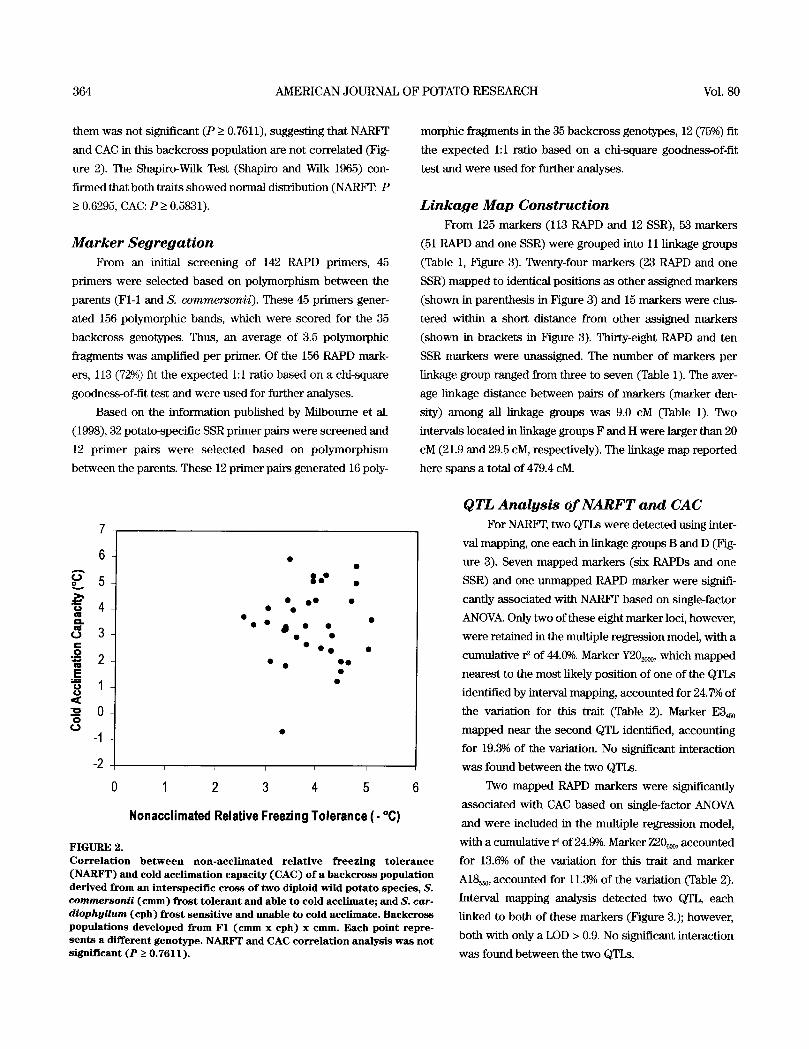
them was not significant (P > 0.7611), suggesting that NARFr
and CAC in this backcross population are not correlated (Fig-
ure 2). The Shapiro-Wilk Test (Shapiro and Wilk 1965) con-
firmed that both traits showed normal distribution (NARF'I~. P
> 0.6295, CAC: P > 0.5831).
M a r k e r S e g r e g a t i o n
From an initial screening of 142 RAPD primers, 45
primers were selected based on polymorphism between the
parents (FI-1 and S. commersonii). These 45 primers gener-
ated 156 polymorphic bands, which were scored for the 35
backcross genotypes. Thus, an average of 3.5 polymorphic
fragments was amplified per primer. Of the 156 RAPD mark-
ers, 113 (72%) fit the expected 1:1 ratio based on a chi-square
goodness-of-fit test and were used for further analyses.
Based on the information published by Milbourne et al.
(1998), 32 potato-specific SSR primer pairs were screened and
12 primer pairs were selected based on polymorphism
between the parents. These 12 primer pairs generated 16 poly-
morphic fragments in the 35 backcross genotypes, 12 (75%) fit
the expected 1:1 ratio based on a chi-square goodness-of-fit
test and were used for further analyses.
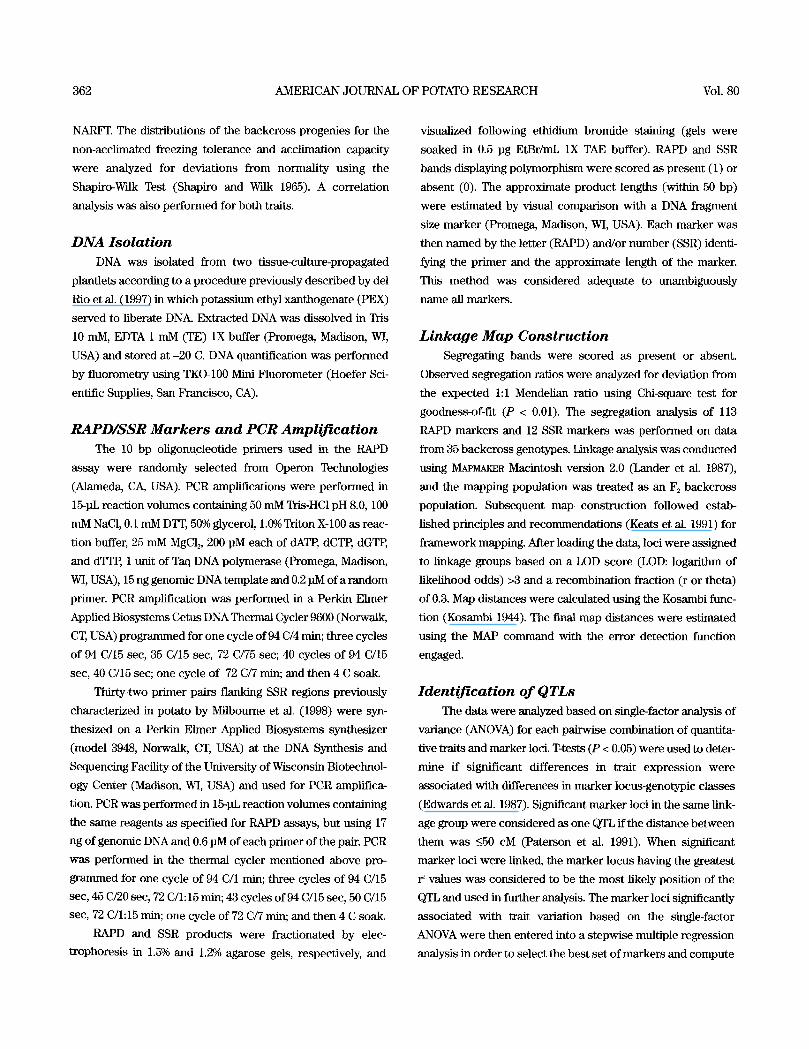
L i n k a g e M a p C o n s t r u c t i o n
From 125 markers (113 RAPD and 12 SSR), 53 markers
(51 RAPD and one SSR) were grouped into 11 linkage groups
(Table 1, Figure 3). Twenty-four markers (23 RAPD and one
SSR) mapped to identical positions as other assigned markers
(shown in parenthesis in Figure 3) and 15 markers were clus-
tered within a short distance from other assigned markers
(shown in brackets in Figure 3). Thirty-eight RAPD and ten
SSR markers were unassigned. The number of markers per
linkage group ranged from three to seven (Table 1). The aver-
age linkage distance between pairs of markers (marker den-
sity) among all linkage groups was 9.0 cM (Table 1). Two
intervals located in linkage groups F and H were larger than 20
cM (21.9 and 29.5 cM, respectively). The linkage map reported
here spans a total of 479.4 cM.
6
? 5
o 4 m ~ L
3 t - O
2 m E 0
0 0
-1
-2
• O 0
• 0 o
• • O 0
i ~ i i i
0 1 2 3 4 5 6
Nonacclimated Relative Freezing Tolerance (- °C)
F I G U R E 2. C o r r e l a t i o n b e t w e e n n o n - a c c l i m a t e d r e l a t i v e f r e e z i n g t o l e r a n c e ( N A R F T ) and cold a c c l i m a t i o n capac i ty ( C A C ) o f a b a c k c r o s s popu la t ion der ived from an in terspec i f i c c r o s s o f t w o diploid wi ld p o t a t o spe c i e s , S. commersonii ( c m m ) fros t t o l e r a n t and able to co ld acc l imate; and S. car- diophyllum (cph) f r o s t s e n s i t i v e and unable t o co ld acc l imate . B a c k c r o s s p o p u l a t i o n s d e v e l o p e d from F1 ( c m m x cph) x cmm. E ac h po int repre- s e n t s a d i f ferent g e n o t y p e . N A R F T and CAC c o r r e l a t i o n ana lys i s w a s no t s ign i f i cant ( P > 0 . 7 6 1 1 ) .
Q T L A n a l y s i s Of N A R F T a n d CAC
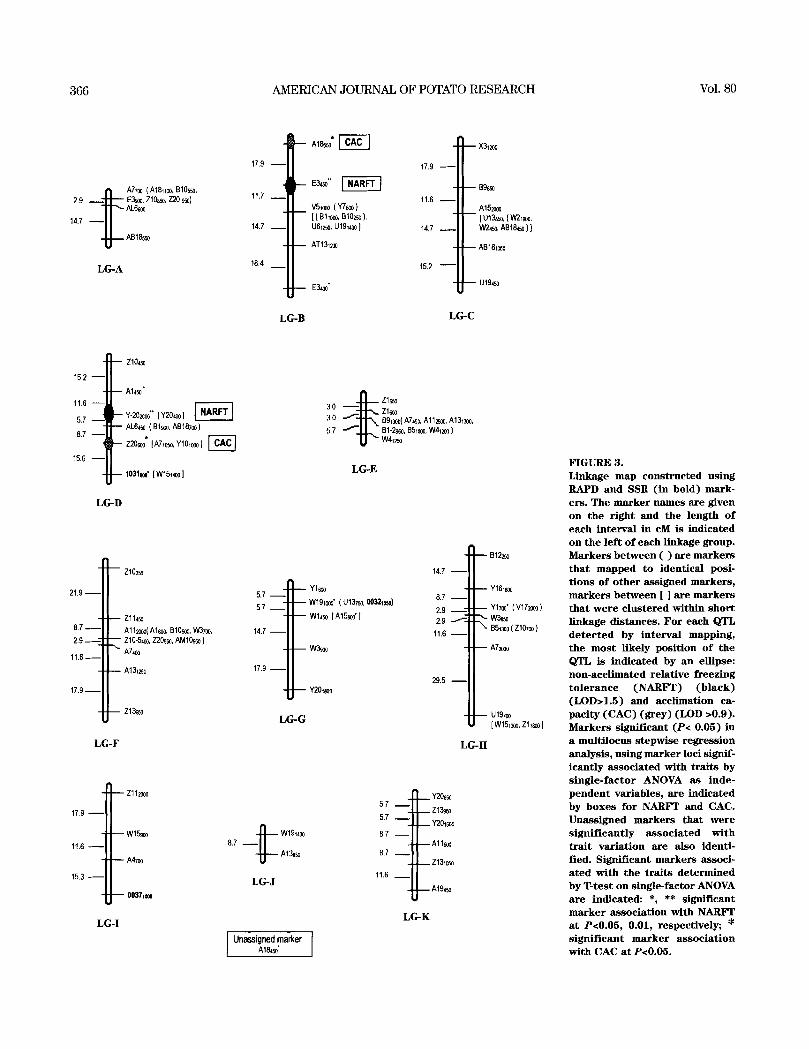
For NARF'r, two QTLs were detected using inter-
val mapping, one each in linkage groups B and D (Fig-
ure 3). Seven mapped markers (six RAPDs and one
SSR) and one unmapped RAPD marker were signifi-
cantly associated with NARFT based on single-factor
ANOVA. Only two of these eight marker loci, however,
were retained in the multiple regression model, with a
cumulative r 2 of 44.0%. Marker Y202000, which mapped
nearest to the most likely position of one of the QTLs
identified by interval mapping, accounted for 24.7% of
the variation for this trait (Table 2). Marker E3~
mapped near the second QTL identified, accounting
for 19.3% of the variation. No significant interaction
was found between the two QTLs.
Two mapped RAPD markers were significantly
associated with CAC based on single-factor ANOVA
and were included in the multiple regression model,
with a cumulative r 2 of 24.9%. Marker Z20~, accounted
for 13.6% of the variation for this trait and marker
A18550, accounted for 11.3% of the variation (Table 2).
Interval mapping analysis detected two QTL, each
linked to both of these markers (Figure 3.); however,
both with only a LOD > 0.9. No significant interaction
was found between the two QTLs.
2 0 0 3 V E G A e t al.: F R E E Z I N G T O L E R A N C E A N D C O L D A C C L I M A T I O N C A P A C I T Y 365
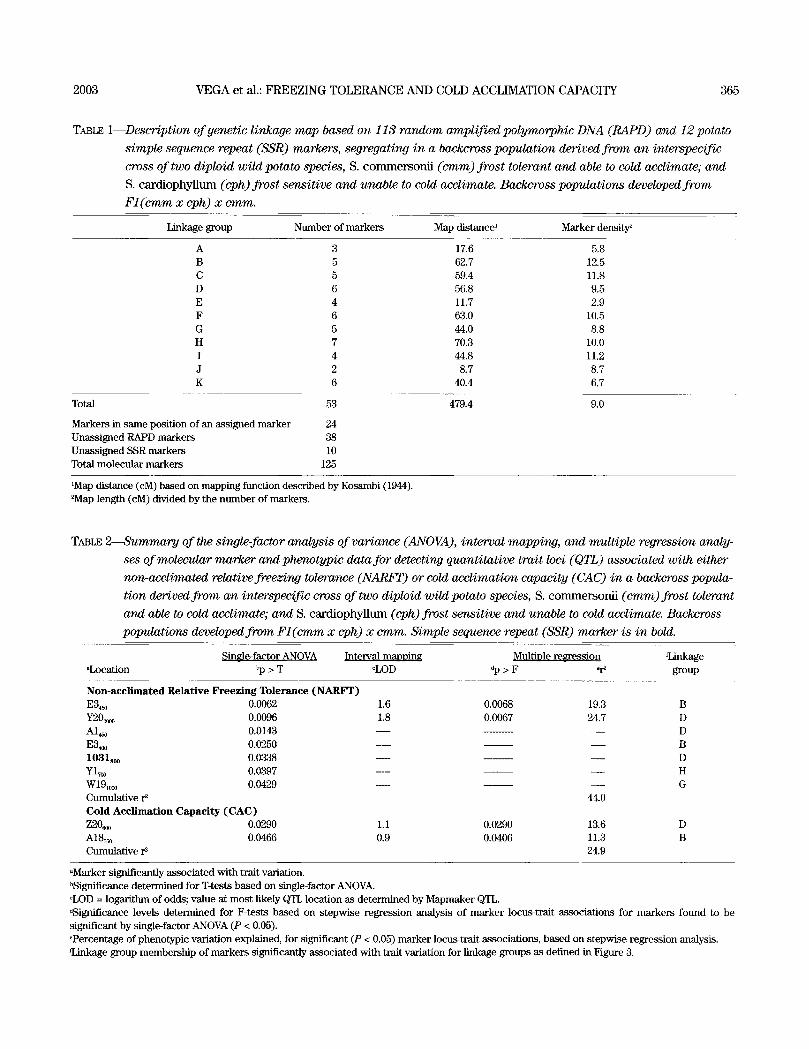
TABLE 1--Description of genetic linkage map based on 113 random amplified polymorphic DNA (RAPD) and 12 potato
simple sequence repeat (SSR) markers, segregating in a backcross population derived from an interspecific
cross of two diploid wild potato species, S. c o m m e r s o n i i (cram) frost tolerant and able to cold acclimate; and
S. c a r d i o p h y l l u m (eph) frost sensitive and unable to cold acclimate. Backcross populations developed from
F l ( c m m x eph) x cram.
Linkage group Number of markers Map distance 1 Marker density 2
A 3 17.6 5.8 B 5 62.7 12.5 C 5 59.4 11.8 D 6 56.8 9.5 E 4 11.7 2.9 F 6 63.0 10.5 G 5 44.0 8.8 H 7 70.3 10.0 I 4 44.8 11.2 J 2 8.7 8.7 K 6 40.4 6.7
Total
Markers in same position of an ass igned marker Unass igned RAPD markers Unass igned SSR markers Total molecular markers
53
24 38 10
125
479.4 9.0
1Map distance (cM) based on mapping function described by Kosambi (1944). 2Map length (cM) divided by the n u m b e r of markers.
TABLE 2---Summary of the single-factor analysis of variance (ANOVA), interval mapping, and multiple regression analy-
ses of molecular marker and phenotypic data for detecting quantitative trait loci (QTL) associated with either
non-acclimated relative freezing tolerance (NARFT) or cold acclimation capacity (CAC) in a backvross popula-
tion derived from an interspecific cross of two diploid wild potato species, S. c o m m e r s o n i i (cram) frost tolerant
and able to cold acclimate; a n d S. c a r d i o p h y l l u m (eph) frost sensitive and unable to cold acclimate. Backcross
populations developed from Fl (cmm x eph) x emm. Simple sequence repeat (SSR) marker is in bold.
SineJe-factor ANOVA Interval manoinz MultiDle re~ression rLinkage aLocation bp > T cLOD Op > F ~ group
Non-acclimated Relative Freezing Tolerance (NARFT) E3~0 0.0062 1.6 0.0068 19.3 B Y20~000 0.0096 1.8 0.0067 24.7 D A I ~ 0.0143 - - - - D E 3 ~ 0.O25O - - - - B 1031soo 0.0338 - - - - D Y17oo 0.0397 - - - - H W1910co 0.0429 - - - - G Cumulative r 2 44.0 Cold Acclimation Capacity (CAC) Z20~ 0.0290 1.1 0.0290 13.6 D A1855o 0.0466 0.9 0.0406 11.3 B Cumulative r ~ 24.9
aMarker significantly associated with trait variation. bSignificance determined for T-tests based on single-factor ANOVA~ cLOD = logarithm of odds; value at mos t likely QTL location as determined by Mapmaker QTL. dSignificance levels determined for F-tests based on s tepwise regression analysis of marker locus-trait associat ions for markers found to be significant by single-factor ANOVA (P < 0.05). °Percentage of phenotypic variation explained, for significant (P < 0.05) marker locus-trait associations, based on stepwise regression analysis. qAnkage group membership of markers significantly associated with trait variation for linkage groups as defined in Figure 3.
366 AMERICAN JOURNAL OF POTATO RESEARCH Vol. 80
N A77oo (A18110o, B1055o, 2.9 ~ E39oo, ZlO~, Z20 95o)
- - ~ AL6~ 14.7 - -
. - .b l~ ABI&~
L G - A
17.9 - -
11.7 __
14.7 _ _
18.4
LG-B
) '~ A1855o*
- - E 3 ~ "
VS,~o ( W~o ) [ (Bl~o, B10z-~o ), U 6 1 ~ , U1914oo ]
AT131~o
E3~o"
X312oo
17.9 - -
89~ 11.6
A15"~o [ U13~o, ( W219oo,
14.7 ~ W2,~, ABI&~ ) }
15.2 ~ AB181~o
1 ~ U1945o
L G - C
15.2 - -
11.6
5 . 7 - -
8.7
15.6 - -
- - Z 1 0 ~
- - A145o"
Y-20*a)" [ Y2Oeo ] - - AL6~ ( BI~, AB187oo)
)~ Z20~o* [A7~o~o, Y101ooo ]
- - 1031~' [W15t4oo]
L C ~ D
3.0 . ~ Zlsso Z l~
3.0 - " - ~ " 891300( A7~o, Al125c0, A1313oo, 5.7 -"-.-.I . .L" B1-29so, B51~o, W412,0o)
U ~ w41~
LC, -E
-• Z10350
21.9 ~ l l
' - 1 "~ Z11450 8.7 ~ 1 | A11~o( A16oo, 9106oo, W37oo, 2.9 - - ~ Z10-5~, Z2055o, AM10s~ )
11.6__1 1 A74oo
1,. -II
LG-F
5.7 - - 5 . 7 m
14.7 - -
17.9 - -
L G - G
14.7 - -
YI~o 8.7 - - W191~oo" ( U1375o, 0 0 3 2 t ~ ) 2 . 9 - -
W14~ [ A15soo" ] 2.9
11.6 - -
W ~
Y20t~o 29.5 - -
L G - H
B12~
Y1618oo
Y17co* (V17'2ooo)
B513oo ( Z107~ )
A7~o
U197oo [W151~, Z1~8oo]
17.9
11.6 - -
15.3 - -
LG-I
Zl12ooo
W159~
A47oo
0 0 3 7 t ~
8.7 ~ L W1914oo
A138so
LG-J
J Unassigned marker A18~.~o* I
Y208~o 5.7 - -
Z l ~ 5.7 - -
Y201~o 8.7 - -
A l1~ 8.7 _ _
Z131~o 11.6 _ _
A1945o
LC~K
FIGURE 3. Linkage map constructed using RAPD and SSR (in bold) mark- ers. The marker names are given on the right and the length of each interval in cM is indicated on the lef t o f each linkage group. Markers be tween ( ) are markers that mapped to identical posi- t ions of o ther assigned markers, markers be tween [ ] are markers that were clustered within shor t linkage distances. For each QTL de tec t ed by interval mapping, the most likely posit ion of the QTL is indicated by an ellipse: non-acclimated relative freezing to l e rance (NARFT) (b lack) (LOD>I.5) and acclimation ca- pacity (CAC) (grey) (LOD >0.9). Markers significant (P< 0.05) in a multilocus stepwise regression analysis, using marker loci signif- icantly associated with trai ts by s ingle- fac tor ANOVA as inde- pendent variables, are indicated by boxes for NARFT and CAC. Unassigned markers that were s ignif icant ly assoc ia ted wi th t ra i t variation are also identi- fied. Significant markers associ- a ted with the t ra i ts determined by T-test on single-factor ANOVA are indicated: *, ** significant marker association with NARFT at P<0.05, 0.01, respectively; * s ignif icant marker associa t ion with CAC at P<0.05.
2003 VEGA et al.: FREEZING TOLERANCE AND COLD ACCLIMATION CAPACITY 367
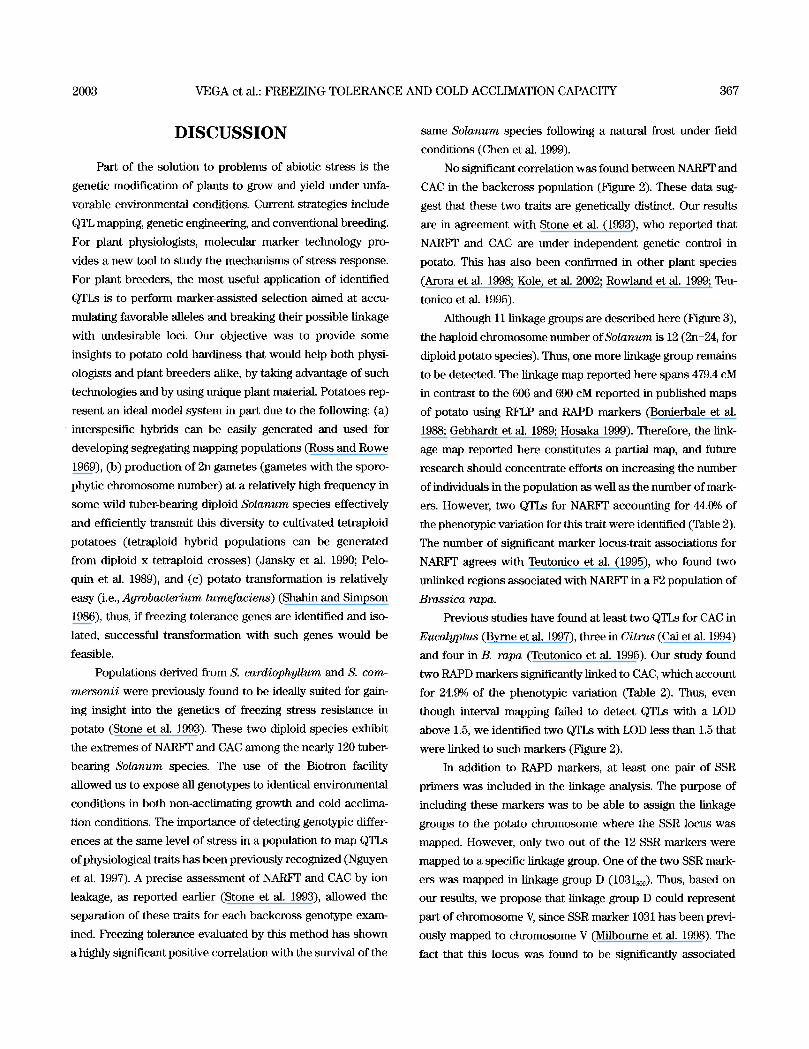
DISCUSSION
Part of the solution to problems of abiotic stress is the
genetic modification of plants to grow and yield under unfa-
vorable environmental conditions. Current strategies include
QTL mapping, genetic engineering, and conventional breeding.
For plant physiologists, molecular marker technology pro-
vides a new tool to study the mechanisms of stress response.
For plant breeders, the most useful application of identified
QTLs is to perform marker-assisted selection aimed at accu-
mulating favorable alleles and breaking their possible linkage
with undesirable loci. Our objective was to provide some
insights to potato cold hardiness that would help both physi-
ologists and plant breeders alike, by taking advantage of such
technologies and by using unique plant material. Potatoes rep-
resent an ideal model system in part due to the following: (a)
interspesific hybrids can be easily generated and used for
developing segregating mapping populations (Ross and Rowe
1969), (b) production of 2n gametes (gametes with the sporo-
phytic chromosome number) at a relatively high frequency in
some wild tuber-bearing diploid Solanum species effectively
and efficiently transmit this diversity to cultivated tetraploid
potatoes (tetraploid hybrid populations can be generated
from diploid x tetraploid crosses) (Jansky et al. 1990; Pelo-
quin et al. 1989), and (c) potato transformation is relatively
easy (i.e., Agrobacterium tumefaciens) (Shahin and Simpson
1986), thus, if freezing tolerance genes are identified and iso-
lated, successful transformation with such genes would be
feasible.
Populations derived from S. cardiophyUum and S. com-
mersonii were previously found to be ideally suited for gain-
ing insight into the genetics of freezing stress resistance in
potato (Stone et al. 1993). These two diploid species exhibit
the extremes of NARFr and CAC among the nearly 120 tuber-
bearing Solarium species. The use of the Biotron facility
allowed us to expose all genotypes to identical environmental
conditions in both non-acclimating growth and cold acclima-
tion conditions. The importance of detecting genotypic differ-
ences at the same level of stress in a population to map QTLs
of physiological traits has been previously recognized (Nguyen
et al. 1997). A precise assessment of NARVI" and CAC by ion
leakage, as reported earlier (Stone et al. 1993), allowed the
separation of these traits for each backcross genotype exam-
ined. Freezing tolerance evaluated by this method has shown
a highly significant positive correlation with the survival of the
same Solanum species following a natural frost under field
conditions (Chen et al. 1999).
No significant correlation was found between NARFY and
CAC in the backcross population (Figure 2). These data sug-
gest that these two traits are genetically distinct. Our results
are in agreement with Stone et al. (1993), who reported that
NARFr and CAC are under independent genetic control in
potato. This has also been confirmed in other plant species
(Arora et al. 1998; Kole, et al. 2002; Rowland et al. 1999; Teu-
tonico et al. 1995).
Although 11 linkage groups are described here (Figure 3),
the haploid chromosome number of Solanum is 12 (2n=24, for
diploid potato species). Thus, one more linkage group remains
to be detected. The linkage map reported here spans 479.4 cM
in contrast to the 606 and 690 cM reported in published maps
of potato using RFLP and RAPD markers (Bonierbale et al.
1988; Gebhardt et al. 1989; Hosaka 1999). Therefore, the link-
age map reported here constitutes a partial map, and future
research should concentrate efforts on increasing the number
of individuals in the population as well as the number of mark-
ers. However, two QTLs for NARFT accounting for 44.0% of
the phenotypic variation for this trait were identified (Table 2).
The number of significant marker locus-trait associations for
NARFr agrees with Teutonico et al. (1995), who found two
unlinked regions associated with NARF]" in a F2 population of
Brassica rapa.
Previous studies have found at least two QTLs for CAC in
Eucalyptus (Byrne et al. 1997), three in Citrus (Cai et al. 1994)
and four in B. rapa (Teutonico et al. 1995). Our study found
two RAPD markers significantly linked to CAC, which account
for 24.9% of the phenotypic variation (Table 2). Thus, even
though interval mapping failed to detect QTLs with a LOD
above 1.5, we identified two QTLs with LOD less than 1.5 that
were linked to such markers (Figure 2).
In addition to RAPD markers, at least one pair of SSR
primers was included in the linkage analysis. The purpose of
including these markers was to be able to assign the linkage
groups to the potato chromosome where the SSR locus was
mapped. However, only two out of the 12 SSR markers were
mapped to a specific linkage group. One of the two SSR mark-
ers was mapped in linkage group D (1031~). Thus, based on
our results, we propose that linkage group D could represent
part of chromosome V, since SSR marker 1031 has been previ-
ously mapped to chromosome V (Milbourne et al. 1998). The
fact that this locus was found to be significantly associated
368 AMERICAN JOURNAL OF POTATO RESEARCH Vol. 80
with NARFY based on single-factor ANOVA and that QTLs for
NARFF and CAC were detected in this particular linkage group
suggest that some of the genes for these two traits could be
located in chromosome V. The second SSR marker was located
in linkage group G (0032-11050), which could indicate that link-
age group G is in ch romosome XII; SSR marker 0032 has been
mapped to that chromosome by Milbourne et al. (1998).
Our results are consistent with previous conclusions that
freezing tolerance is a complex polygenic trait (Chen et al.
1999; Palm et al. 1997; Stushnoff et al. 1984) and that various
components of hardiness (e.g., NARFY and CAC) are not nec-
essarily controlled by the same genes (Palta and Simon 1993;
Stone et al. 1993). The presence of individuals in the backcross
populat ion expressing similar NARFY and CAC as the parental
genotypes suggests that freezing tolerance may be controlled
by relatively few genes, thus, the few QTLs de tec ted in the
population. This is in agreement with previous studies done in
potato (Stone et al. 1993), blueberry (Arora et al. 1998) and
Brassica (Teutonico et al. 1995).
Previous studies done in our laboratory with S. commer-
sonii and S. cardiophyllum and other wild pota to species
indicated that the expression of NARFY and CAC is largely
recessive (Chen et al. 1999; Stone et al. 1993). Hypothetical
recessive cold-hardiness alleles in S. commersonii could only
be detected in a populat ion segregating for homozygous reces-
sive and heterozygous genotypes, which is accompl ished by
backcross to the hardy S. commersonii parent. One drawback
associated to this type of gene action is that a RAPD marker
will be associated with hardiness as a blank (absence of the
band). RAPD bands of equal migration mobility are assumed
to be genetically homologous, but a blank may be anything
that is different. Thus, the usefulness of the QTLs detected
here for marker-ass is ted se lec t ion in o ther popula t ions
depends on the homology of S. commersonii blanks with
blanks from other hardy germplasm. Dominant and codomi-
nant alleles associated to hardiness from S. commersonii
could have been detected from a segregating backcross to S.
cardiophyUum, but a t tempts to make that backcross popula-
tion were unsuccessful.
From close to 2,000 crosses made, we recovered close to
100 backcross seeds. Due to impaired germination or abnor-
mal growth under in vitro and/or greenhouse conditions, how-
ever, only 35 genotypes were successfully included for further
evaluations and analysis. Therefore it is important to note that
sampling size could have been a limiting factor prevent ing the
detect ion of additional QTLs for both NARF'r and CAC. Nev-
ertheless, the QTLs for NARFT and CAC identified in this
study can be used as a starting point for future studies. For a
QTL to be used successfully, fine mapping has to be conducted
in the identified QTL region. From the results of this study we
propose chromosome V in potato as a pr ime candidate for this
purpose.
ACKNOWLEDGMENTS
This research was supported, in part, by a Hatch grant
(142-3717) to J iwan P. Palm from the College of Agricultural
and Life Sciences, University of Wisconsin, Madison.
LITERATURE CITED
Arora R, LI Rowland, G Panta, CC Lira, JS Lehman, and N Vorsa. 1998. Genetic control of hardiness in blueberry. In: PH Li and HH Chen (eds), Plant Cold Hardiness: Molecular Biology, Biochem- istry and Physiology. Plemtm Press, New York. pp 99-106.
Bonierbale MW, RL Plalsted, and SD Tanksley. 1988. RFLP maps based on a common set of clones reveal modes of chromosomal evo- lution in potato and tomato. Genetics 120:1095-1103.
Byrne M, JC Murrel, JV Owen, ER Williams, and GF Moran. 1997. Map- ping of quantitative trait loci influencing frost tolerance in Euca- lyptus nitens. Theor Appl Genet 95:975-979.
Cai Q, CL Guy, and GA Moore. 1994. Extension of linkage map in Citrus using random amplified polymorphic DNA (RAPD) markers and RFLP mapping of cold-acclimation-responsive loci. Theor Appl Genet. 89:606-614.
Chen HH, and PH Li. 1980. Characteristics of cold acclimation and de- acclimation of tuber-bearing Solanum species. Plant Physiol 65:1146-1148.
Chen Y-KH, JB Bamberg, and JP Palta. 1999. Expression of freezing tol- erance in the interspecilic F1 and somatic hybrids of potatoes. Theor Appl Genet 98:995-1004.
del Rio AH, JB Bamberg, and Z Huaman. 1997. Assessing changes in the genetic diversity of potato genebanks. 1. Effects of seed increase. Theor Appl Genet 95:191-198.
Dudley JW. 1993. Molecular markers in plant improvement: manipula- tion of genes affecting quantitaUve traits. Crop Sci 33:660-668.
Edwards MD, CW Stuber, and JF Wendel. 1987. Molecular-marker-facil- itated investigations of quanUtative-trait loci in maize. I. Num- bers, genomic distribution and types of gene action. Genetics 116:113-125.
Edwards MD, T Helentjaris, S Wright, and CW Stuber. 1992. Molecular- marker-facilitated investigations of quantitative-trait loci in maize. Theor Appl Genet 83:765-774.
Estrada RN, W Garcia~ JG Carrasco, and E Carrasco. 1993. Breeding potatoes for tolerance to frost and resistance to late blight. Am Potato J 70:809-810.
Flint HL, BR Boyse, and DJ Beattie. 1967. Index of injury - a useful expression of freezing injury to plant tissues as determined by the electrolytic method. Can J Plant Sci 47:229-230.
2003 VEGA et al.: FREEZING TOLERANCE AND COLD ACCLIMATION CAPACITY 369
Foolad MR, FQ Chen, and GY Lin. 1998. RFLP mapping of QTLs con ferring cold tolerance during seed germination in an interspe~ cific cross of tomato. Mol Breed 4:519-529.
Gebhardt C, E Ritter, T Debener, U Schachtschabel, B Walkemeier, H Uhrig, and F Salantini. 1989. RFLP analysis and linkage mapping in Solanum tuberosum. Theor Appl Genet 78:65-75.
Hosaka K. 1999. A genetic map of Solanum phureja Clone 1.22 con- structed using RFLP and RAPD markers. Am J Potato Res 75:97- 102.
Jansky SH, GL Yerk, and SJ Peloquin. 1990. The use of potato haploids to put 2x wild species germplasm into usable form. Plant Breed 104:290-294.
Keats BIB, SL Sherman, NE Morton, EB Robson, KH Beutow, HM Carm, PE Cartwright, A Chakravarti, U Francke, PP Green, and J Ott. 1991. Guidelines for human linkage maps: An international sys- tem for human linkage maps (ISLM 1990). Genomics 9:557-560.
Kole C, CE Thorman, BH Karlsson, JP Palta, P Gaffney, B Yandell, and TC Osborn. 2002. Comparative mapping of loci controlling win- ter survival and related traits in oilseed Brassica rapa and Bras- sica napus. Mol Breed 9:201-210.
Kosambi DD. 1944. The estimation of map distances from recombina- tion values. Ann Eugen 12:172-175.
Lande R, and R Thompson. 1990. Efficiency of marker-assisted selec- tion in the improvement of quantitative traits. Genetics 124:743- 756.
Lander ES, and D Botstein. 1989. Mapping Mendelian factors underly- ing quantitative traits using RFLP linkage maps. Genetics 121:185-199.
Lander ES, P Green, J Abrahamson, A Barlow, MJ Daly, SE Lincoln, and L Newburg. 1987. Mapmaker: An interactive computer package for constructing primary genetic linkage maps of experimental and natural populations. Genomics 1:174-181.
Li PH, and JP Palta. 1978. Frost hardening and freezing stress in tuber bearing Solanum species. In: PH Li and A Sakai (eds), Recent Advances in Plant Cold Hardiness and Freezing Stress: Mecha- nism and Crop Implications. Academic Press, New York. pp 49- 71.
Limln AE, and DB Fowler. 1991. Breeding for cold hardiness in winter wheat: problems, progress and alien gene expression. Field Crops Res 27:201-218.
Lincoln SE, and E Lander. 1989. Mapping genes controlling quantitative traits with MAPMAKER/QTL. Whitehead Institute for Biomed- ical Research Technical Report, Cambridge.
Marshall HG. 1982. Breeding for tolerance to heat and cold. In: MN Christiansen and CJ Lewis (eds), Breeding Plants for Less Favorable Environments. J Wiley and Sons, New York. pp 47-49.
Milbourne D, RC Meyer, AJ Collins, LD Ramsay, C Gebhardt, and R Waugh. 1998. Isolation, characterization and mapping of simple sequence repeat loci in potato. Mol Gen Genet 259:233-245.
Nguyen HT, RC Babu, and A Blum. 1997. Breeding for drought resist- ance in rice; physiology and molecular genetics considerations. Crop Sci 37:1426-1434.
Palta JP, and G Simon. 1993. Breeding potential for improvement of freezing stress resistance: genetic separation of freezing toler- ance, freezing avoidance, and capacity to cold acclimate. In: PH Li and L Christersson (eds), Advances in Plant Cold Hardiness. CRC Press, Boca Raton. pp 299-310.
Palta JP, JB Bamberg, Y-K Chen, SE Vega, LS Weiss, and BH Karlsson. 1997. Understanding the genetic control of freezing stress resist- ance using potato species as a model system. In: PH Li and THH Chen (eds), Plant Cold Hardiness. Molecular Biology, Biochem- istry and Physiology. Plenum Press, New York. pp 67-75.
Paterson AH, S Damon, JD Hewitt, D Zamir,, HD Rabinowitch, SE Lin- coln, ES Lander, and SD Tanksley. 1991. Mendelian factors underlying quantitative traits in tomato: Comparison across species, generations, and en~ronments. Genetics 127:181-197.
Peloquin S J, GL Yerk, JE Werner, and E Darmo. 1989. Potato breeding with haploids and 2n gametes. Genome 31:1000-1004.
Ross RW, and PR Rowe. 1969. Utilizing the frost resistance of diploid Solanum species. Am Potato J 46:5-14.
Rowland LI, EL Ogden, R Arora, C-C Lim, JS Lehman, A Levi, and GR Panta. 1999. Use of blueberry to study genetic control of chilling requirement and cold hardiness in woody perennials. HortScience 34: 1185-1191.
Salto K, K Miura, K Nagano, Y Hayano-Salto, H Arald, and A Kato. 2001. Identification of two closely linked quantitative trait loci for cold tolerance on chromosome 4 of rice and their association with anther length. Theor Appl Genet 103:862-868.
Shahin E, and R Simpson. 1986. Gene transfer system for potato. HortScience 21:1199-1201.
Shapiro SS, and MB Wflk. 1965. An analysis of variance for normality (complete samples). Biometrika 52:591-611.
Steffen KL, R Arora, and J. Palm. 1989. Relative sensitivity of photo- synthesis and respiration to a freeze-thaw stress: role of realis- tic freeze-thaw protocol. Plant Physio189:1372-1379.
Stone JM, JP Palta, JB Bamberg, LS Weiss, and JF Harbage. 1993. Inher- itance of freezing resistance in tuber-bearing Solanum species: Evidence for independent genetic control of non-acclimated freezing tolerance and cold acclimation capacity. Proc Natl Acad Sci 90:7869-7873.
Stushnoff C, DB Fowler, and A Brule-Babel. 1984. Breeding and selec- tion for resistance to low temperature. In: PB Vose and SG Blixt (eds), Crop Breeding: A Contemporary Basis. Pergamon Press, New York. pp 115-136.
Sutka J. 1994. Genetic control of frost tolerance in wheat. Euphytica 77:277-282.
Teutonico RA, B Yandell, JM Satagopan, ME FeiTeira, JP Palta, and TC Osborn. 1995. Genetic analysis and mapping of genes control- ling freezing tolerance in oilseed Brassica. Mol Breed 1:329-339.
Vega SE, and JB Bamberg. 1995. Screening the US potato collection for frost hardiness. Am Potato J 72:13-21.
Vega SE, JP Palta, and JB Bamberg. 2000. Variability in the rate of cold acclimation and deacclimation among tuber-bearing Solanum (potato) species. J Am Soc Hort Sci 125:205-211.


