Embed Size (px)
Citation preview

1
MASS APPRAISAL REPORT
FOR
2021 APPRAISAL YEAR
WISE COUNTY APPRAISAL DISTRICT
Michael L. (Mickey) Hand, R.P.A., R.T.A. Chief Appraiser
2
Table of Contents
Introduction 3
Summary of Properties Appraised 4
General Assumptions and Limiting Conditions 6
Market Value 7
Area Analysis 8
Overview of Types of Properties Appraised 8
Highest and Best Use Analysis 11
Market Analysis 12
Data Collection and Validation 13
Valuation Analysis 14
Cost Approach to Value 15
Residential Schedules 16
Commercial / Business Personal Schedules 17
Income Approach to Value 18
Sales Comparison (Market) Approach to Value 19
Statistical Analysis 20
Ratio Study Standards 22
Individual Value Review Procedures 23
Performance Tests 24
Certification 27

3
INTRODUCTION
The purpose of this mass appraisal report is to aid property owners, taxing entities, and
the public we serve to better understand the methods and techniques utilized by the Wise County
Appraisal District (WCAD) in the valuation and revaluation of property within Wise County. This
report is written in compliance with Standard 6 of the Uniform Standards of Professional Appraisal
Practice and the Texas Property Tax Code.
Taxing jurisdictions that participate in the district must use the appraisals as the basis for
imposition of property taxes. The State of Texas allocates state funds to school districts based upon
the district’s appraisals, as tested and modified by the Property Tax Assistance Division, State
Comptroller of Public Accounts.
The 2019 mass appraisal results is an estimate of the market value of all property within the
district’s boundaries. Where required by law to appraise property at a value other than market
value, the district also estimates value on said requirement. These situations are described where
applicable later in this report.
The Chief Appraiser is the chief administrative and executive officer of the appraisal
district. The Chief Appraiser employs and directs the district’s staff, oversees all aspects
of the appraisal districts operations and performs either directly or through the district
staff a variety of operations.
The Chief Appraiser’s responsibilities are as follows:
1. Discover, list and appraise property
2. Determine exemption and special use valuation requests
3. Organize periodic reappraisals
4. Notify taxpayers, taxing units and the public about matters that affect property
values
The WCAD staff is budgeted for 19 positions and currently consists of the Chief Appraiser, Deputy
Chief Appraiser, Collections Supervisor, Mapping / Deeds Supervisor, five Staff Appraisers, and
five support positions. All property in the district is appraised by the WCAD staff with the
exception of minerals and pipelines, which are appraised by Capital Appraisal Group Inc.
Significant mass appraisal assistance was provided by Capital Appraisal Group Inc. as well as
Deidra Deaton, Deputy Chief Appraiser, Greg Reasoner, Commercial Appraiser, Greg Reasoner,
Business Commercial / Industrial Appraiser, and LaReesea North, Patia Moncrief, Josh Campbell
& Teresa Reed, Troy Gregg, Katie Drevecky Residential Appraisers.
It is the goal of WCAD staff to provide the best possible service to the tax paying public and the
taxing entities. The WCAD staff promotes and adheres to the professional standards and ethics as
set forth by the Texas Department of Licensing and Regulation
and the Texas Association of Appraisal Districts.

4
SUMMARY OF PROPERTIES APPRAISED
WCAD is an Appraisal District formed by the Texas Legislature in 1979 and is charged
with the appraisal of all taxable property within the 41 taxing entities within the district’s
boundaries. Currently these taxing entities are as follows:
Alvord ISD City of Alvord
Boyd ISD City of Boyd
Bridgeport ISD City of Bridgeport
Chico ISD City of Chico
Decatur ISD City of Decatur
Paradise ISD City of Paradise
Slidell ISD City of Aurora
Wise County City of Newark
Wise FM / LTR City of Rhome
Wise Water Control District #1 Jacksboro ISD
Wise Water Supply Krum ISD
Emergency Services District #1 Northwest ISD
Poolville ISD Springtown ISD
City of Fort Worth Clear Creek Water
Cooke CAD - overlap (Slidell ISD)
Denton CAD – overlap (Slidell ISD & Northwest ISD)
Jack CAD - overlap (Jacksboro ISD)
Parker CTA - overlap (Poolville ISD & Springtown ISD)
Montague CAD - overlap (Alvord ISD & Slidell ISD)
Tarrant CAD - overlap (Azle ISD)
5
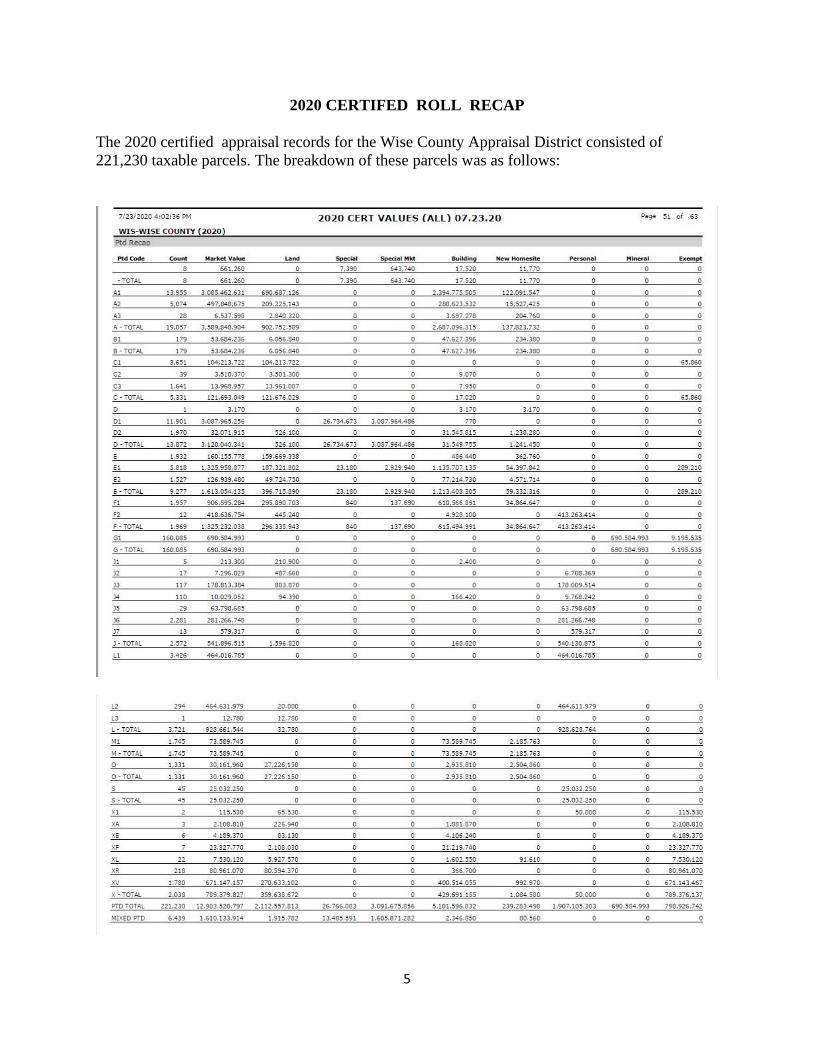
2020 CERTIFED ROLL RECAP
The 2020 certified appraisal records for the Wise County Appraisal District consisted of
221,230 taxable parcels. The breakdown of these parcels was as follows:

6
The property rights appraised were fee simple interests, with the exception of leasehold
interests in property exempt to the holder of the property’s title. The latter are appraised
under a statutory formula described in Sec. 25.07, Texas Property Tax Code. The description and
identification of each property appraised is included in the appraisal records submitted to the Wise
County Appraisal Review Board each year.
Supporting information relied on for this report, such as individual property records, sales ratio
reports, market studies, modeling documentation, appraisal manuals and procedures, regulations
and statutes is voluminous and is generally kept in an electronic format and is available to the
general public at the appraisal district or its website, except where protected by statute by
confidentiality regulations.
GENERAL ASSUMPTIONS AND LIMITING CONDITIONS
The appraised value estimates provided by the district are subject to the following
conditions:
The appraisals were prepared exclusively for ad valorem tax purposes. The property characteristic
data upon which the appraisals are based is assumed to be correct. Physical inspections and/or
inspections via imagery of the property appraised were performed as staff resources and time
allowed.
Validation of sales transactions occurred through questionnaires to buyer and seller, telephone
survey and field review. In the absence of such confirmation, residential sales
data obtained from vendors was considered reliable.
No responsibility is assumed for the legal description or for matters including
legal or title considerations. Title to any property is assumed to be good and
marketable, unless otherwise stated.
All property is appraised as if free and clear of any or all liens or
encumbrances, unless otherwise stated. All taxes are assumed to be current.
All property is appraised as though under responsible, adequately
capitalized ownership and competent property management.
All engineering is assumed to be correct. Any plot plans and/or illustrative
material contained with the appraisal records are included only to assist in
visualizing the property.
It is assumed that there is full compliance with all applicable federal, state
and local environmental regulations and laws unless noncompliance is
stated, defined and considered in this mass appraisal report.
It is assumed that all applicable zoning and use regulations and restrictions
have been complied with unless a nonconformity has been stated, defined
and considered in this mass appraisal report.
It is assumed that all required licenses, certificates of occupancy, consents or
other legislative or administrative authority from any local, state or national
government or private entity or organization have been or can be obtained or

7
renewed for any use on which the value estimate contained in this report is
based.
It is assumed that the utilization of the land and improvements of the
properties described are within the boundaries or property lines, and that
there are no encroachments or trespasses unless noted on the appraisal
record.
Unless otherwise stated in this report or noted on the appraisal record, the appraiser is not aware
of the existence of hazardous substances or other environmental conditions. The value estimates
are predicated on the assumption that there is no such condition on or in the property or in such
proximity thereto that it would cause a loss in value. No
responsibility is assumed for any such conditions, or for any expertise or engineering
knowledge required to discover them.
Texas is a non-disclosure state in which buyers and sellers are not required to report sales
transactions to the ad valorem property appraiser. WCAD uses great diligence in
attempting to acquire sales data, but is limited in its ability to gather sales data by the
current legislative scheme.
EFFECTIVE DATE OF APPRAISAL AND DATE OF THE REPORT
With the exception of certain inventories for which the property owner has elected a
valuation date of September 1, 2020, all appraisals are as of January 1, 2021. To receive the
September 1 appraisal date, the property owner must have filed an application by July 31, 2020.
The date of this report is April 30, 2021.
DEFINITION OF MARKET VALUE
Except as otherwise provided by the Texas Property Tax Code (hereafter “Tax Code”),
all taxable property is appraised at its “market value” as of January 1. Under the tax
code, “market value” means the price at which a property would transfer for cash or its
equivalent under prevailing market conditions if:
exposed for sale in the open market with a reasonable time for the seller to find a
purchaser;
both the seller and the buyer know of all the uses and purposes to which the property
is adapted and for which it is capable of being used and of the enforceable restrictions
on its use, and;
both the seller and buyer seek to maximize their gains and neither is in a position to
take advantage of the exigencies of the other.
The Tax Code defines special appraisal provisions for the valuation of several different
categories of property. Specially appraised property is taxed on a basis other than market value as
defined above. These categories include residential homes WCAD property (Sec. 23.23, Tax

8
Code), agricultural and timber property (Chapter 23, Subchapters C and D, Tax Code), real and
personal property inventory (Sec. 23.12, Tax Code), certain types of dealer inventory (Sec. 23.121,
23.124, 23.1241 and 23.127), and nominal (Sec. 23.18) or restricted use properties (Sec. 23.83).
The WCAD Appraisal Manual contains detailed information on the appraisal of specially
appraised property and is incorporated herein by reference.
AREA ANALYSIS
WCAD appraises all properties within the physical boundaries of Wise County. Wise County is
located in North Central Texas and is bordered to the north by Montague and Cooke Counties, to
the east by Denton County, to the south by Tarrant and Parker Counties, to the west by Jack
County. Wise County is in transition from a rural county with an agricultural based economy to a
county with a growing population and a balanced agribusiness and commercial / industrial tax
base. Wise County is currently one of the fastest growing counties in the state.
Decatur, the largest town and county seat, is on Highway 287 twenty-eight miles north of Fort
Worth. Bridgeport is the second largest city in Wise County and is located on Highway 380 about
35 miles north of Fort Worth and 12 miles west of Decatur. Wise County has five limestone
crushing plants, two natural gas processing plants, one combined cycle electricity generation plant
and one graphite processing plant. City of Decatur is host to nine hotels, three auto dealerships,
and Wise Regional Hospital. City of Bridgeport also has four hotels and Devon Energy North
Texas Operations Headquarters. Both Decatur and Bridgeport have airports. The proximity to Fort
Worth - Dallas Metro Area has a large impact on the values of properties within the county.
OVERVIEW OF TYPES OF PROPERTIES APPRAISED
There are four major categories of property appraised by WCAD. These categories are:
➢ Real Property: Residential, Multi-family, Commercial, Vacant residential lots,
Vacant commercial lots, Vacant rural land and improvements on rural land.
➢ Personal Property: Business personal property and Industrial personal properties.
➢ Utilities: Telephone companies, Power companies, Gas companies and Cable
companies.
➢ Minerals: Oil and Gas
The Property Tax Assistance Division of the State Comptroller’s office requires properties to be
identified by using a standard identification code. The codes currently
used by WCAD are as follows:
9
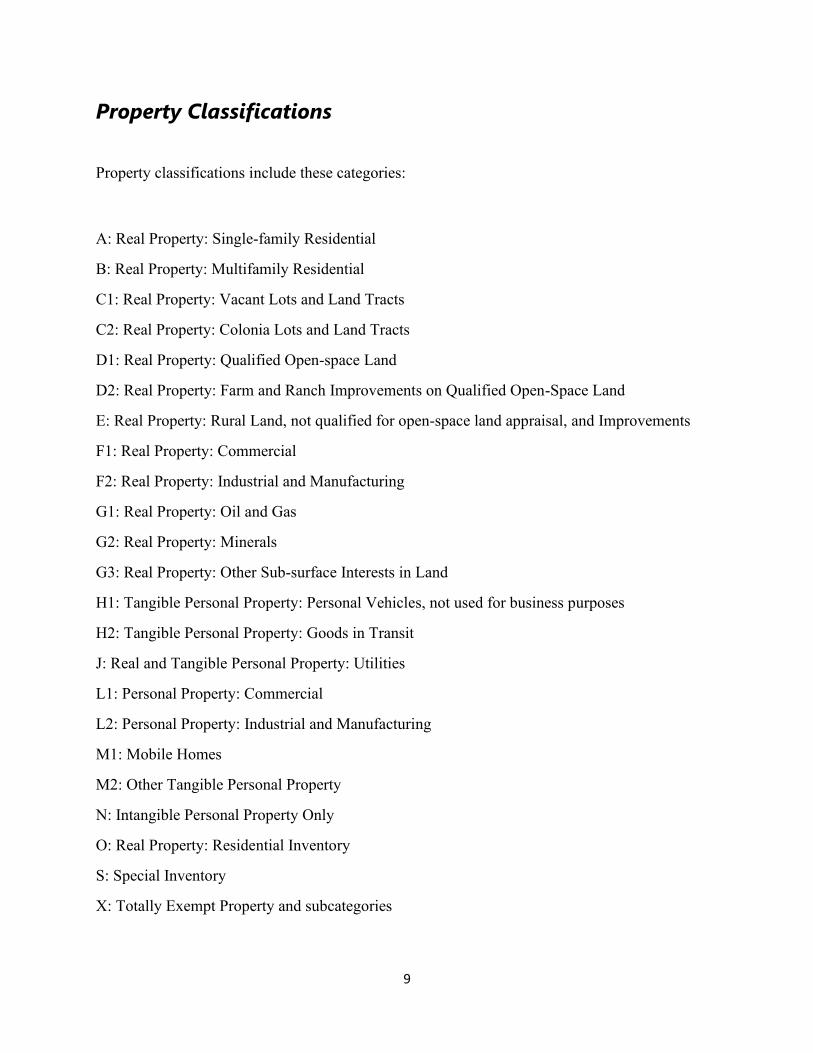
Property Classifications
Property classifications include these categories:
A: Real Property: Single-family Residential
B: Real Property: Multifamily Residential
C1: Real Property: Vacant Lots and Land Tracts
C2: Real Property: Colonia Lots and Land Tracts
D1: Real Property: Qualified Open-space Land
D2: Real Property: Farm and Ranch Improvements on Qualified Open-Space Land
E: Real Property: Rural Land, not qualified for open-space land appraisal, and Improvements
F1: Real Property: Commercial
F2: Real Property: Industrial and Manufacturing
G1: Real Property: Oil and Gas
G2: Real Property: Minerals
G3: Real Property: Other Sub-surface Interests in Land
H1: Tangible Personal Property: Personal Vehicles, not used for business purposes
H2: Tangible Personal Property: Goods in Transit
J: Real and Tangible Personal Property: Utilities
L1: Personal Property: Commercial
L2: Personal Property: Industrial and Manufacturing
M1: Mobile Homes
M2: Other Tangible Personal Property
N: Intangible Personal Property Only
O: Real Property: Residential Inventory
S: Special Inventory
X: Totally Exempt Property and subcategories
10
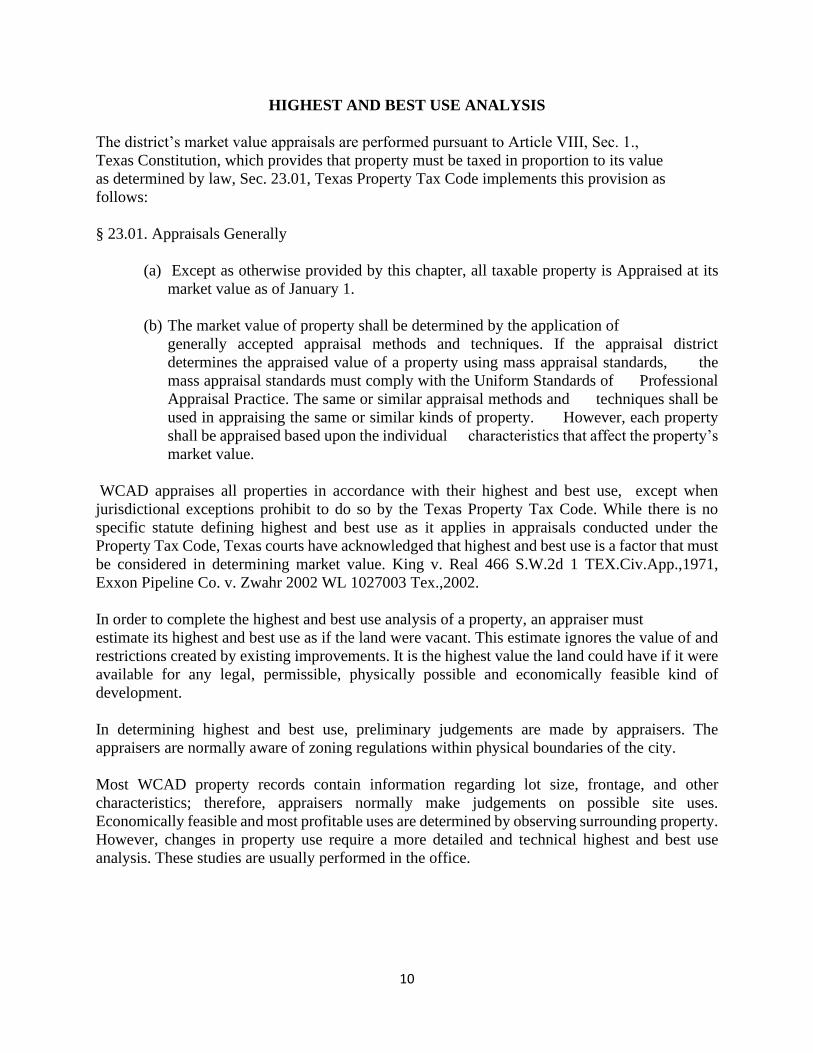
HIGHEST AND BEST USE ANALYSIS
The district’s market value appraisals are performed pursuant to Article VIII, Sec. 1.,
Texas Constitution, which provides that property must be taxed in proportion to its value
as determined by law, Sec. 23.01, Texas Property Tax Code implements this provision as
follows:
§ 23.01. Appraisals Generally
(a) Except as otherwise provided by this chapter, all taxable property is Appraised at its
market value as of January 1.
(b) The market value of property shall be determined by the application of
generally accepted appraisal methods and techniques. If the appraisal district
determines the appraised value of a property using mass appraisal standards, the
mass appraisal standards must comply with the Uniform Standards of Professional
Appraisal Practice. The same or similar appraisal methods and techniques shall be
used in appraising the same or similar kinds of property. However, each property
shall be appraised based upon the individual characteristics that affect the property’s
market value.
WCAD appraises all properties in accordance with their highest and best use, except when
jurisdictional exceptions prohibit to do so by the Texas Property Tax Code. While there is no
specific statute defining highest and best use as it applies in appraisals conducted under the
Property Tax Code, Texas courts have acknowledged that highest and best use is a factor that must
be considered in determining market value. King v. Real 466 S.W.2d 1 TEX.Civ.App.,1971,
Exxon Pipeline Co. v. Zwahr 2002 WL 1027003 Tex.,2002.
In order to complete the highest and best use analysis of a property, an appraiser must
estimate its highest and best use as if the land were vacant. This estimate ignores the value of and
restrictions created by existing improvements. It is the highest value the land could have if it were
available for any legal, permissible, physically possible and economically feasible kind of
development.
In determining highest and best use, preliminary judgements are made by appraisers. The
appraisers are normally aware of zoning regulations within physical boundaries of the city.
Most WCAD property records contain information regarding lot size, frontage, and other
characteristics; therefore, appraisers normally make judgements on possible site uses.
Economically feasible and most profitable uses are determined by observing surrounding property.
However, changes in property use require a more detailed and technical highest and best use
analysis. These studies are usually performed in the office.

11
MARKET ANALYSIS
Economic trends, national, regional and local trends affect the universe of property
appraised in Wise County. An awareness of social, economic, governmental and
environmental conditions is essential in understanding, analyzing and identifying local
trends that affect the real estate market.
Market analysis is performed throughout the year. Both general and specific data is
collected and analyzed.
Examples of sources of general data include “Tierra Grande” issued by The Real Estate
Center at Texas A&M University, “The Appraiser” published by The Texas Association of
Appraisal Districts and “Texas Assessor’s News” published by the Texas Association of
Assessing Officers. When possible, local sources such as lending institutions and the
Chamber of Commerce are used to obtain financing information and demographics and
labor statistics.
Sales information is received from various sources. Asking prices are gathered from the
local paper and realtor listings. Information is also gathered from conversations with local real
estate appraisers, agents and brokers.
WCAD employees go to the Wise County Courthouse bi-weekly basis to obtain all deed
transactions. Once ownership is identified, an informational letter and questionnaire are mailed to
the buyer to obtain information on the sale. This information is not mandatory
in the State of Texas and only a small percentage of letters are returned with useful information.
This presents a problem in that there is sometimes inadequate sales data to perform as thorough an
analysis of sales data as USPAP would require. However, every effort is made to use what data is
available. The Property Tax Assistance Division also sends out sales letters and that data is made
available to WCAD at least once per year. WCAD also subscribes to the MLS and LoopNet and
conducts property owner interviews to obtain sales information.
WCAD currently conducts revaluation on a two-year rotation in accordance with the Reappraisal
Plan. One-half of the district is reappraised every year. The revaluation includes the inspection of
properties and the updating of all information on the properties. Sales and market analysis are
performed each year on all properties, as information is available. Each year new properties are
inspected, measured and added to the roll. In addition, building permits are obtained from the
county and cities and changes to accounts are made as indicated. Individual properties are also
reappraised when changes to the condition as the property warrants; for example: fire, remodeling
or an addition or demolition of a portion of the improvement. Appraisers will perform detailed
exterior field inspections of properties if requested by the owner.
Appraisers performing revaluation in the field have property records that contain specific
information regarding the property being appraised. These records contain brief legal descriptions,
ownership interest, property use codes, property addresses, land size and
characteristics, sketches of improvements as well as any available detailed information of the
improvements.

12
Field inspections require the appraisers to check all information on the property and to update as
necessary. The appraiser takes a digital photo of each property inspected. The appraiser notes their
opinion of classification, condition and characteristics of the property. If changes in the size of any
structures are observed, the appraiser measures
and lists those dimensions.
DATA COLLECTION/VALIDATION
The WCAD replacement cost and value schedules include land and residential improvements.
Commercial and residential schedules are based on Marshall and Swift
Valuation Service and personal property schedules are based on the Property Tax Assistance
Division appraisal manual or Marshall and Swift. Personal property renditions provided by
property owners are also used in the valuation of business personal property. Marshall and Swift
Valuation Service is a nationally based cost manual and is recognized throughout the nation by the
real estate industry. The cost manual is based on cost per square foot and also the unit in place
method. The unit in place method involves the estimated cost by using actual building components.
This nationally based cost information service provides the base price of buildings as per
classification with modifications for characteristics that either enhance or detract from value. The
schedule is then modified for time and location.
Renditions are confidential sources and cannot be used for specific information. However, data
from renditions may be compared with data from cost manuals and used
to test their accuracy.
WCAD schedules are then developed from a combination of each of these sources. Schedules may
also be modified by use of local market data (sales information) to further ensure the accuracy of
the cost and value schedules.
Data on individual properties is also collected from the inspection, compiled and analyzed.
Buildings and other improvements are inspected in the field, measured and classified. The
appraiser estimates the age of improvements and determines the condition of the improvements.
This data is used to compile depreciation (loss of value) tables and any notes pertaining to the
improvements are made at this time. Residential dwellings are classified for quality and type of
construction, whether frame or brick veneer. The classifications are from Class 4 to Class 16. Class
4 are a basic structure using the poorest quality materials and lowest workmanship while Class 16
structure is of the highest possible quality using only the best of materials and the highest and best
quality workmanship available.
The age of an improvement is used to estimate depreciation and is based on the effective age of
improvements. Effective age is the age the property appears to be due to maintenance and upkeep.
Effective age for a house that is properly maintained may be its actual or chronological age.
However, if a structure suffers from deferred maintenance due to neglect, its effective age may be
older than the actual age. In contrast, if a house is an older structure and has been remodeled or
updated, its effective age may be less than its actual age.

13
Physical depreciation is estimated by condition of the improvements. Condition ranges
from poor to excellent. Appraisers in the field usually inspect structures from exterior perspectives.
The interior condition is assumed to be similar to the exterior. WCAD appraisers will not enter an
occupied home, but will consider any evidence regarding the interior condition provided by the
property owner, such as photos, estimates, etc.
Foundation failure may occur in varying degrees and may also result in loss of value.
WCAD makes allowances for foundation problems on a case by case basis.
Additional depreciation may by estimated for a variety of reasons including functional
obsolescence resulting from bad floor plans or out of date construction methods.
Economic obsolescence results from a loss of value to a property due to adverse influences from
outside the physical boundaries of the property. Examples of economic
obsolescence may be proximity to a landfill, residences located in an airport flight path,
etc.
VALUATION ANALYSIS
WCAD valuation schedules are divided into four main classifications, residential, commercial,
land, and business personal property. These schedules are based on the most appropriate data
available. Depreciation tables and schedules (loss of value schedules) are also included within
these schedules. These tables are calibrated from cost as well as sales data and updated as needed.
Miscellaneous special categories such as residential inventory, dealer’s inventory, and
agricultural productivity valuation are appraised using different techniques. Detailed information
on the appraisal methods for the miscellaneous categories is contained in the WCAD Appraisal
Manual.
THREE APPROACHES TO VALUE
Texas law requires all three approaches to value be considered – cost, sales comparison (market),
and income. Using multiple approaches whenever possible also provides a check versus the values
obtained from other approaches. If a value can be determined using multiple approaches, then the
value arrived at via the various approaches must be reconciled. The appraiser must then choose
the approach to value that best estimates market value.
COST APPROACH
The cost approach is best used for properties where sales and income data are scarce.
These tend to be unique properties. This method works best for newer properties, because accrued
depreciation must be estimated.
WCAD cost schedules are based on Marshall and Swift Valuation Service and personal property
schedules are based on the Property Tax Assistance Division appraisal manual and Marshall and

14
Swift. Marshall and Swift Valuation Service is a national based cost manual and is recognized
throughout the nation by the real estate industry. The cost manual is based on cost per square foot
and also the unit in place method. The unit in place method involves the estimated cost by using
actual building components. This nationally based cost information service provides the base price
of buildings as per classification with modifications for characteristics that either enhance or
detract from value. The schedule is then modified for time and location to make it current and
specific to Wise County.
Field appraisers measure and class properties in accordance with the commercial, residential, or
personal property classification guidelines. The appraiser also estimates
the condition and effective age of the improvements. Additional depreciation may by estimated
for a variety of reasons including functional obsolescence resulting from bad
floor plans, out of date construction methods, or super-adequacies. Economic obsolescence results
from a loss of value to a property due to adverse influences from
outside the physical boundaries of the property. Examples of economic obsolescence
may be proximity to a landfill, residences located in an airport flight path, etc. Economic and
functional depreciation are estimated based on the estimated impact to market value due to
economic or functional obsolescence. All field work is reviewed by a zone appraiser.
The basic formula for the cost approach to value is as follows:
Market Value = RNCLD + Land Value
(RCNLD = Replacement Cost New Less Depreciation)
Land value must be derived from either the market or income approach. WCAD appraisers
generally use the market approach due to the lack of reliable income data for
valuing land.
The cost approach is best used for newer properties, where sales and income data are
scarce. These tend to be unique properties. Because accrued depreciation must be estimated, this
method works best for newer properties where accrued depreciation is generally less and therefore
less subjective. Examples of properties that WCAD typically values via the cost approach are
industrial buildings and large, unique houses, and business personal property.
RESIDENTIAL SCHEDULES
Residential valuation schedules are cost based tables taken from Marshall and Swift
Valuation Service adjusted to the local market. That is, the cost reflects actual replacement cost
new of the subject property. Market research indicates that the common unit of comparison for
new residential construction as well as sales of existing
housing is the price paid per square foot. The value of extra items is based on their contributory
value to the property. This value may be estimated by the price per square
foot or a value of the item as a whole. This data is extracted from the market by paired
sales analysis and conversations with local appraisers and brokers.

15
The residential schedule is based on the size, age and condition of structure, quality of
construction, contributory value of extra items and land value. Each of these variables
has a direct impact on the cost as well as the property. The following is an example of
each of the variables and how they may affect market value.
Quality of construction- Residential construction may vary greatly in quality of construction. The
type of construction affects the quality and cost of material used the quality of the workmanship
as well as the attention paid to detail. The cost and value of
residential property will vary greatly depending on the quality of the construction. As stated above,
WCAD residential schedules currently class residential structures based on quality of construction
from Class 4 to Class 16. This classification schedule is based
on the Marshall and Swift definitions of residential classes of dwellings with modifications for
local market.
Size of Structure- The size of a structure also has a direct impact on its cost as well as
value. The larger the structure, the less the cost per square foot. WCAD schedules are
graduated in size increments from 100 to 200 square feet, depending on market conditions. The
Property Tax Assistance Division and Marshall and Swift also support
this economy of scale.
Condition of Improvements- WCAD rates conditions from poor to excellent. Properties that in the
opinion of the appraiser are unlivable may be given no value or salvage value.
Age of Structure- WCAD residential depreciation schedule is based on Marshall and Swift and as
stated above effective age and chronological age may be the same or different depending on the
condition of the structure.
Extra Items- As stated above, extra items or amenities are valued according to their contributory
value to the whole. Examples of extra items include fireplaces, swimming pools and tennis courts.
Land Value- WCAD values land based on market transactions whenever possible. Specific land
influences are used to adjust values for such factors as view, shape, size and topography. We use
abstraction and allocation methods to ensure that the land values created best reflect the
contributory market value of the land to the overall property value. As there are not always market
transactions available, other methods of land valuation may be used. The two most common
methods are the land residual method and the land ratio method. Land schedules are available at
the appraisal district office.

16
COMMERCIAL SCHEDULES
Commercial properties valued via the cost approach are valued using Marshall and Swift Valuation
schedules for commercial property. Replacement cost new is determined and then adjusted for
location. Depreciation is then applied using physical observation of the property. The depreciated
value of the improvements is then added to the land value to arrive at the total value of the property.
PERSONAL PROPERTY SCHEDULES
The Personal Property Schedules value business furniture, fixtures and equipment as well as
inventory that is taxable by law. Business vehicles located within the appraisal district boundaries
are also valued.
Business personal property values are derived from several sources. Business owners are required
by Texas Law to render their business personal property each year. It is the experience of the
district that about 70% of businesses render each year. Rendered values are used on business
personal property if the rendered value is reasonable for the type of business and within acceptable
ranges when compared to the Property Tax Assistance Division or Marshall and Swift personal
property schedules for the type of business rendered. Should the rendered values not be acceptable,
Property Tax Assistance Division or Marshall and Swift schedules are used to estimate a value.
Values on business personal property accounts not rendered are established using personal
property schedules based on the Standard Industry Code (SIC), Property Tax
Assistance Division, and Marshall and Swift schedules for the type of business being
valued. For inventory valuation, this ensures the proper level of trade is considered. Physical
depreciation is determined by the age of the property and its expected life. Economic and
functional depreciation are estimated on a case by case basis. Schedules are available in the
appraisal district office.
Business vehicles are valued based on N.A.D.A. Used Car Guide wholesale value for the particular
make, model and age of the vehicle. The appraisal district used a report obtained from Texas
Vehicle Information and Computer Services, which list vehicles registered in Wise County County
on January 1 of each year. This report uses the vehicle identification number to determine make,
model and vehicle characteristics to determine N.A.D.A. value. This report along with renditions,
physical observations and city reports are used to discover and list vehicles that are taxable within
the county. When adverse factors such as high mileage are known then the appropriate adjustments
are made to value.
INCOME APPROACH TO VALUE
Many properties, especially commercial properties, are best valued via the income approach. Many
properties sell for their income producing capacity. Examples of such properties are duplexes,
shopping centers, apartments, and office buildings. When the
income approach is the most appropriate approach for the valuation of a subject property, the
appraiser chooses the income approach to override the value arrived at via the cost approach.

17
Income producing properties are placed on income schedules that are derived from data collected
from landlords, tenants, and market surveys. Schedules are built based on type of property, class
within each type, and economic area. Similar properties are placed on like schedules to ensure
equity. WCAD income schedules are modeled on the concept of market rent, vacancy and
collection loss, expenses, and cap rate for the respective type of income producing property and
economic area.
The use of the income approach to value is particularly useful for properties in which sales data is
scarce and the market indicates the property is likely to sell for its income producing capacity.
The first step in the income approach pertains to the estimation of market rent. This is
derived primarily from actual rent data furnished by property owners and lessees and
from regional information obtained from various sources.
A vacancy and collection loss allowance is the next item to consider in the income approach. The
projected vacancy and collection loss allowance is established from actual data furnished by
property owners and local market survey trends. This allowance accounts for periodic fluctuations
in occupancy, both above and below an estimated stabilized level. This feature may also provide
for a reasonable lease-up period for multitenant properties, where applicable. The market derived
stabilized vacancy and collection loss allowance is subtracted from the potential gross rent estimate
to yield an indication of estimated annual effective gross rent to the property.
Next, a secondary income or service income is considered and, if applicable, calculated
as a percentage of stabilized effective gross rent. Secondary income represents parking
income, escalations, reimbursements, and other miscellaneous income generated by the operations
of real property. The secondary income estimate is derived from actual data collected and available
market information. The secondary income estimate is then
added to effective gross rent to arrive at an effective gross income, when applicable. Allowable
expenses and expense ratio estimates are based on a study of the local market, with the assumption
of prudent management. Relevant expense ratios are developed for different types of commercial
property based on use and market experience.
Another form of allowable expense is the replacement of short-lived items (such as roof,
floor coverings, air conditioning units, or appliances) requiring expenditures of lump sum
costs. These expenses when annualized are known as replacement reserves.
Subtracting the allowable expenses (inclusive of non-recoverable expenses and replacement
reserves when applicable) from the annual effective gross income yields an estimate of annual net
operating income to the property.
Return rates and income multipliers are used to convert operating income expectations
into an estimate of market value for the property under the income approach. These include income
multipliers and overall capitalization rates. Each of these multipliers or
capitalization rates are considered and used in specific applications. Rates and multipliers may
vary between property types, as well as by location, quality, condition, design, age, and other
factors. Therefore, application of the various rates and multipliers

18
must be based on a thorough analysis of the market for individual income property types and uses.
These procedures are supported and documented based on analysis of market sales for these
property types.
Capitalization analysis is used in the income approach models to form an indication of
value. This methodology involves the direct capitalization of net operating income as an
indication of market value for a specific property. Capitalization rates applicable for direct
capitalization method and yield rates for estimating terminal cap rates for discounted cash flow
analysis are derived from the market. Sales of improved properties from which actual income and
expense data are obtained provide a very good indication of property return expectations a specific
market participant is requiring from an investment at a specific point in time. In addition, overall
capitalization rates can be derived and estimated from the built-up method (band-of-investment).
This method relates to satisfying estimated market return requirements of both the debt and equity
positions in a real estate investment. This information is obtained from available sales of
property, local lending sources, and from real estate and financial publications.
Rent loss concessions are estimated for specific properties with vacancy problems. A rent loss
concession accounts for the impact of lost rental income while the building is moving toward
stabilized occupancy. The rent loss is calculated by multiplying the rental
rate by the percent difference of the property’s stabilized occupancy and its actual occupancy.
Build out allowances (for first generation space or retrofit/second generation
space as appropriate) and leasing expenses are added to the rent loss estimate. The total adjusted
loss from these real property operations is discounted using an acceptable risk rate. The discounted
value (inclusive of rent loss due to extraordinary vacancy, build out allowances and leasing
commissions) becomes the rent loss concession and is deducted from the value indication of the
property at stabilized occupancy. A variation of this technique allows a rent loss deduction to be
estimated for every year that the property’s actual occupancy is less than stabilized occupancy.
Economic areas are defined whenever the district has sufficient income information to
group similar types and classes of income producing properties. Income schedules are
developed for these economic areas and all properties within the grouping are valued via the
appropriate income schedule to ensure equitable treatment of similar properties.
SALES COMPARISON (MARKET) APPROACH
Whenever possible, the sales comparison approach is used to appraise properties. This
method is preferred because data is taken directly from the market. However, this method can only
be used for properties in which there is sufficient sales information.
Sales information is received from various sources. Listing prices are gathered from newspaper
and realtor listings, entered into the CAMA system, and reviewed monthly for outliers and expired
listings.
Sales letters are mailed to the buyer to obtain information on the sale. WCAD also subscribes to
MLS and conducts property owner interviews to obtain sales information. Whenever talking with
a property owner and an account reflects a recent transaction, WCAD staff ask the property owner

19
if they would be willing to share the sales information in order to increase the accuracy of WCAD
data.
The appraisal district’s CAMA system is based on a cost approach to value. All improvements are
measured and classed. When the sales comparison method is used for improved properties, a
modifier is applied to the improvements (on a neighborhood basis) to bring cost in line with
market. This approach is also known as a modified cost
approach.
Although WCAD currently does revaluation on a three-year rotation, with one-third of the district
is re-inspected every year, all properties must be valued at market value each year. Sales ratio
studies and profiling are done for all classes of property in all school districts and market areas at
least annually. Appraisers are responsible for running all sales ratio studies and profiles within
their assignment area. Residential appraisers are responsible for all properties in their zone and all
land under 10 acres, except for commercial properties. The land/ag appraiser is responsible for all
properties exceeding 10 acres, except commercial land. The commercial appraiser is responsible
for all commercial real and business personal property.
STATISTICAL ANALYSIS
Properties are defined by market area or “neighborhood”. Neighborhoods consist of properties that
share common characteristics and should be valued similarly in the marketplace. Neighborhoods
are grouped by like land size, neighborhood demographic,
class range, size, and age. A homogeneous neighborhood is a neighborhood where all of the
properties are similar in age, class, and size. This is often the case for many subdivisions. All
properties in a homogeneous neighborhood should sell in a fairly tight
price range, differing only for size and amenities.
WCAD categorizes every residential property into a neighborhood based on the factors
listed above in order to compare all like properties, sold and unsold, and ensure that all
are valued at market value and treated equitably. When sales or income data demonstrate that
current valuations need to be adjusted to achieve market value, all properties in the same
neighborhood grouping are adjusted with the same adjustment factor.
The district’s primary approach to the valuation of residential properties uses a hybrid cost-sales
comparison approach. This type of approach accounts for neighborhood market influences that
cannot be captured in a purely cost model.
The following equation denotes the hybrid model used:
MV = LV + (RCNLD*MA)
The estimated market value (MV) of the property equals the land value (LV) plus the replacement
cost new of property improvements less accrued depreciation (RCNLD) multiplied by a market
adjustment (MA) derived from sales analysis. As the cost approach separately estimates both land
and building contributory values and uses depreciated replacement costs, which reflect only the

20
supply side of the market, it is expected that adjustments to the cost values may be needed to bring
the level of appraisal to an acceptable standard as indicated by market sales.
Neighborhoods are reviewed at least annually to verify all properties within a neighborhood should
remain in that neighborhood. Since neighborhoods are often combinations of subdivisions and
other properties considered to be like properties, the market may demonstrate that those
assumptions no longer reflect reality. Similarly, two or more neighborhoods that have similar
characteristics, may be able to be merged if market conditions indicate they are selling the same.
This can be determined by comparing the market adjustments applied to each neighborhood. If
two or more neighborhoods that have similar characteristics also have a similar or equal market
adjustment, they should be merged. This process ensures there are sufficient comparable sales for
analysis and streamline the valuation process. However, properties are to be removed from a
neighborhood only by groups, such as a subdivision, or class of like properties. Individual
properties are not removed from a neighborhood merely because of sales ratio.
Sales Ratio Reports and Profiling in WCAD’s CAMA system provide a great deal of appraisal
information. The overall level of appraisal, coefficient of dispersion (COD), price related
differential (PRD), class breakdown, difference between sold and unsold
properties.
WCAD performs statistical analysis at least annually to confirm that values are equitable
and consistent with the market. Ratio studies are conducted on all property in the district
to judge the two primary aspects of mass appraisal accuracy, level and uniformity of value.
Appraisal statistics of central tendency and dispersion generated from sales ratios are available for
property within an ISD. These statistics include, but are not limited to, the weighted mean, standard
deviation and coefficient of dispersion and provide the analysts an analytical tool by which to
determine both the level and uniformity of appraised value in the district.
The analyst, based on the sales ratio statistics and designated parameters for valuation
update, makes a preliminary decision as to whether the value level needs to be updated in an
upcoming reappraisal, or whether the level of market value is at an acceptable level.
Ratio studies are usually done on a countywide base of all sales in the county and then by
residential classification and market area. The median ratio within each classification is then
compared to the desired ratio to determine if adjustments should be made. The coefficient of
dispersion is also studied to indicate how tight the ratios are in relation to measures of central
tendency. The median and coefficient of dispersion are good indicators that identify statistically
the results of the valuation process. All statistical measure are reviewed again after any adjustments
are made to confirm the adjustment
produced the desired results.
RATIO STUDY STANDARDS
WCAD adheres to the following standards recommended by the IAAO Standard on Ratio
Studies.
A. Appraisal Level – The overall level of appraisal for the jurisdiction and each major stratum of
properties should by within 5 percent of the legal standard – 100 percent of market value.

21
B. Appraisal Uniformity
1. Uniformity Amount Strata. The level of appraisal for each stratum should be
within 5 percent of the overall level of appraisal for the jurisdiction.
2. Single Family Residential Strata. CODs generally should be 15.0 or less and
for areas of newer and fairly similar residences, 10.0 or less.
3. Strata Composed of Income Producing Properties. CODs should by 15.0 or
less for larger, urban jurisdiction and 20.0 or less in small rural jurisdictions.
4. Vacant Land. CODs should be 20.0 or less.
5. Other Strata. Target CODs should reflect the nature of the properties involved
and the availability of reliable market indicators.
6. Vertical Equity. PRDs (Price related differential) should generally lie between
0.98 and 1.03. An appropriate statistical test should be conducted when bias is
indicated.
ADJUSTING SALES FOR TIME
WCAD monitors changes in price levels and, if necessary, adjusts sales prices for time.
Sales are adjusted to the appraisal date of January 1. The adjustment factors are developed for each
school district in the county. Adjustment factors are developed by comparing per unit value
changes over time. Sales prices are divided by appropriate units of comparison and plotted against
time.
Comparisons are made plotting sale/appraisal ratios against the date of sale. An upward trend in
the ratios tends to indicate inflation and a downward trend indicates deflation in the market.
Once a reliable time adjustment factor has been developed for a stratum it is used to adjust sales
to the appraisal date. This factor is used when analyzing sales data for potential market adjustments
that occur annually.
Data sources for time adjustments include the S&P/Case-Schiller Index, the Texas A&M
Real Estate Center, the North Texas Realtors Association, and from actual sales in Wise County.
INDIVIDUAL VALUE REVIEW PROCEDURES
In order for comparable sales data to be considered reliable it must contain a sales date, sales price,
financing information, tract size and details of the improvements. Sales data is gathered by sending
sales letters to the buyer properties that the district knows changed ownership. WCAD also
subscribes to the Multiple Listing Service. Commercial sales are confirmed from the direct parties

22
involved whenever possible. Confirmation of sales from local real estate appraisers is also
considered a reliable source.
Sales data is compiled and the improved properties are physically inspected and photographed. All
data listed on the property record card is verified and updated as needed including building
classification, building size, additions or added out buildings,
condition of structures and any type change in data or characteristics that would affect the value
of the property. Individual sales are analyzed to meet the test of market value as defined by Section
1.04(7) of the Texas Property Tax Code. Examples of reasons why sales may be deleted or not
considered are:
1. Property acquired through foreclosures or auction.
2. Property sold between relatives.
3. The buyer or seller is under duress and may be compelled to sell or
purchase.
4. Financing may be non-typical or below or above prevailing market rates.
5. Considerable improvements or remodeling have been done since the date
of the sale and the appraiser is unable to make judgments on the
property’s condition at the time of the transaction.
6. Sales may be unusually high or low when compared with typical sales
located in the market area. Some sales may be due to relocation or
through divorce proceedings.
7. The property is purchased through an estate sale.
8. The sale involves intangibles, such as goodwill, that are to value.
9. There are value-related problems associated with the sale, i.e. incorrect
land size or square footage of living area.
10. Property use changes occurring after the sale.
APPRAISAL PERFORMANCE AND TESTING
In accordance with Section 5.102 of the Texas Property Tax Code and Section 403.302 of the
Texas Government Code, the Texas Comptroller of Public Accounts conducts a bi-annual property
value study to determine the degree of uniformity of and the median level of appraisals by the
appraisal district within each major category of property, as required by Section 5.10, Property

23
Tax Code. The final findings, based on the district’s 2019 appraisal roll, were calculated by the
district on March 2019. The overall median appraisal ratio for Wise County CAD was reported at
1.00
The Comptroller of Public Accounts certifies a school district’s local tax roll value to the
Commissioner of Education if it is within the calculated statistical error margin. A margin of error
of 5% is used for each school district. The complete report for Wise County and all school districts
can be found at
http://www.window.state.tx.us/taxinfo/proptax/pvs19f
Beginning in 2010, in addition to the property value study, the Texas Comptroller of Public
Accounts will conduct a biannual review of the governance of each appraisal district, taxpayer
assistance provided, and the operating and appraisal standards, procedures, and methodology
used by the district. The last such review was conducted by the Property Tax Assistance Division
in 2020. The results of the review, reported to the chief appraiser on January 23, 2021 reported
that the district’s methods, standards, and procedures exceeded requirements in all categories
texted. The complete Methods and Assistance Program Report can be found at :
http://www.window.state.tx.us/taxinfo/proptax/map/2020/wise-MAP.pdf.

24
CERTIFICATION
I certify that, to the best of my knowledge and belief:
➢ the statements of fact contained in this report are true and correct;
➢ the reported analyses, opinions and conclusions are limited only by the
➢ reported assumptions and limiting conditions, and are my personal, impartial,
and unbiased professional analyses, opinions and conclusions.
➢ I have no present or prospective interest in the properties that are the subject
of this report and I have no personal interest or bias with respect to the parties
involved.
➢ I have no bias with respect to any property that is the subject of this report or
to the parties involved with this assignment.
➢ My engagement in this assignment was not contingent upon developing or
reporting predetermined results.
➢ My compensation is not contingent upon the reporting of a predetermined
value or direction in value that favors the cause of the taxing jurisdiction, the
amount of the value estimate, the attainment of a stipulated result, or the
occurrence of a subsequent event.
➢ My analyses, opinions and conclusions were developed, and this report has
been prepared, in conformity with the Uniform Standards of Profession
Appraisal Practice, the International Association of Assessing Officers, and
the Texas Department of Licensing and Regulation;
➢ I have not made a personal inspection of the properties that are the subject of
this report.
➢ This report was prepared with the assistance of the WCAD appraisal staff listed
on the following page.
Michael L. (Mickey) Hand
Michael L. (Mickey) Hand, R.P.A., R.T.C.
Chief Appraiser
Wise County Appraisal District

25
STAFF THAT PROVIDED SIGMIFICANT APPRAISAL ASSISTANCE
NAME TITLE TDLR# ASSISTANCE
Deidra Deaton, RPA Assistant Chief 68273 Appraisal Operations
Greg Reasoner , RPA Personal Property / Commercial 73583 Update Property Data
Lareesea North, RPA Appraiser 67922 Update Property Data
Patia Moncrief, RPA Real Estate 71851 Update Property Data
Josh Campbell Real Estate 74520 Update Property Data
Teresa Reed ,RPA Real Estate 73392 Update Property Data
Troy Gregg Real Estate 75732 Update Property Data
Katie Drevecky Real Estate 75915 Update Property Data
Greg Davis Capital Appraisal Group Inc.. 71552 Utility Evaluation
Kenneth Hitt Capital Appraisal Group Inc. 71452 Mineral Evaluation
Noel Wilcoxen Capital Appraisal Group Inc.. 71581 Industrial Evaluation


