Embed Size (px)
Citation preview
MEASUREMENT OF SURFACE TENSIONS OF BLOOD CELLS AND PROTEINS
A. W. Neumann,a,b,C D. R. Absolom,a,btd,h D. W. Francis,*rb S. N. Omenyi,e J. K. S elt,a Z. Policova,a,b C. Thomson,"rb
w. Zingg,tc,f and c. J. van 0ssd.g
Department o f Mechanical Engineering Institute of Biomedical Engineering
f Institute of Medical Sciences University of Toronto
Toronto, Canada, M5S IA4 lJ Research Institute
Hospital for Sick Children Toronto, Canada, M5G 1x8 Department o f Microbiology
Department of Chemical Engineering State University of New York at Buffalo
Buffalo, New York 14214 Separation Processes Branch
NASAIGeorge C. Marshall Space Flight Center Huntsville, Alabama 35812
INTRODUCTION
The role of surface properties in various biological processes is now well established. In particular, interfacial tensions have been shown to play an impor- tant, if not crucial role, in phenomena as diverse as the critical closing and open- ing of vessels in the microcirculation,' cell protein adsor~t ion , ' ,~ antigen-antibody interactions,',' and phagocytos i~ .~ , '~ In view of the importance of interfacial energetics in these systems we have investigated the development of techniques, compatible with various biological constraints, for determining the surface tension of the interacting species. The purpose of this paper is to describe the novel techniques that have evolved and to provide the comparative results obtained for various cell types and serum proteins.
Before discussing the various strategies that have evolved some fundamentals are considered. In analogy to bulk phases, various thermod namic properties can be defined for a surface. For example the surface energy U h ! of a flat surface can be defined as:",'*
U(A! = UiA1 (S(A! , A, N,iA!. . .) (11
where SiAl is the surface entropy, A is the surface area, NJAl is the number of moles of component i for the surface.
The surface tension y is defined as
Address correspondence to D. R. Absolom.
276 0077-8923/83/0416-0276 $01.7510 0 1983. NYAS

Neumann et al. : Blood Cell and Protein Surface Tensions 277
The surface tension can be defined instead in terms of derivatives of Legendre transforms of the surface energy.I3 The surface need not consist of one compo- nent, but can consist of several components. If these components are uniformly distributed, the surface can be considered homogeneous, with a surface tension as defined above. However, complications can arise when the surface of a multi- component system consists of patches of different composition. Nevertheless, if these patches are below a critical size, probably of the order of 0.1 c(m,14 the sur- face can be considered homogeneous in certain respects, such as in contact angle and wetting phenomena. If the patches are above this critical size, the surface is heterogeneous, with different surface tensions as defined above for each patch. As the domains of different components on the membrane of a cell are typically of macromolecular size (i.e. < O.lc(m), the concepts of surface thermodynamics are applicable to cells.
The concept of surface tension as introduced above assumes that the phase under consideration is bounded by a vacuum. In cases where the phase under consideration borders on a second phase, the surface tension for that interface, called the interfacial tension, is determined by the nature of these phases. For example for a solid-liquid interface the value of the interfacial tension, y s ~ will de- pend on which solid and liquid are present. Since the value of the interfacial ten- sion of, for example, solids, depends on the phase with which the solid is in con- tact, some reference state must be chosen to be able to compare the surface properties of these solids.
That reference state is chosen as the solid in contact with its own vapor. Thus, the surface tension of a solid, ys, is defined as the surface tension for the interface between the solid and its vapor. This surface tension cannot be mea- sured directly; it can however be related to the interfacial tension ysv, between the solid and the vapor of some other material, such as a liquid. When the solid surface is brought into contact with such a vapor, some of the vapor may be ad- sorbed on the solid surface, lowering the apparent surface tension of that solid. The difference between ys and ysv is called the equilibrium spreading pressure. Very often, particularly for "low energy" surfaces, the adsorption of the vapor is negligible and the spreading pressure is small. The surface tension for the inter- face between the solid and the vapor, ysv, is then essentially the same as the solid surface tension, ys. Therefore, the value of the solid surface tension is usually taken to be the value of ysv.
For cells and proteins the situation is somewhat different, as they are usually in an aqueous medium, and bringing them to the reference state may cause changes in the structure and the properties of the membrane or the conformation of the protein molecules. Therefore it may not always be possible to bring a cell or a protein physically into its reference state without changing or even destroy- ing it. The surface tension of a cell should be looked upon as the surface tension that would exist in the reference state provided the surface structure, composi- tion, etc., has not changed from its usual state. The purpose of this definition of the surface tension of a cell is to allow the comparison between the surface prop- erties of different or transformed cells or proteins. Thus the surface tension of a cell or protein is a reference surface tension, which reflects the surface properties of that cell or protein in its usual state.
When considering the experimental determination of the surface tension of a given material, the first question to be asked is whether the material is liquid or solid. While more or less trivial in the case of nonbiological systems, the question is important when considering biological materials such as cells and proteins. The question is crucial because there are usually several direct techniques for the

278 Annals New York Academy of Sciences
determination of the surface tension of a liquid, but no direct techniques for measuring the surface tension of a solid. What matters with respect to the distinc- tion between solids and liquids is whether the surface assumes a shape that is governed by surface tension alone and, of course, whether external fields such as gravity influence that shape. Such shapes are given by the Laplace equation of capillarity and are generally called Laplacean curves.1s While cells often are in- deed deformable, their shapes clearly are not solely determined by surface ten- sions. This is obvious, for example, in the case of an activated platelet where the development of pseudopodia is due to nonsurface tension stimuli. In addition, many cells are known to possess an internal cytoskeleton, which makes them un- like liquids. We therefore conclude that the only way of determining the surface tension of biological cells is by treating them as solids.
The determination of surface tensions of solids is possible only by indirect means and hence is inherently complex. Until a few years ago the only general approach to determine surface tensions of solids utikized contact angle measure- ments. To that end, we developed an equation of state approach for determining interfacial tension^.'^,'^ In essence, this approach uses the fact that if a liquid is in contact with a solid, the interfacial tension ysr. between liquid and solid is given byl8
YSL = flYSV YLVI (31
where y ~ v and ~ L V are the solid and the liquid surface tensions, respectively. Equation 3 can be used in conjunction with Young's equation
YSv - YsL = YLvcose (4)
where 0 is the contact angle between solid and liquid, to determine ysv and ~ S L from y ~ v and 0, the latter two quantities being readily amenable to direct experi- mental determination.
Equation 3 was formulated explicitly; computer program^'^^'^ as well as tables" that allow one to determine ysv and YSL for a range of y ~ v and 0 values are available.
DETERMINATION OF SURFACE TENSIONS OF CELLS AND PROTEINS FROM CONTACT ANGLES
Two major problems are encountered when attempting to obtain solid sur- face tensions from contact angles: (1) There is always the question of the magni- tude of the equilibrium spreading pressure, and (2) the thermodynamic status of contact angles is a difficult pr0b1em.l~ This problem is highlighted by the phenomenon of contact angle hysteresis, which cannot be reconciled with Young's e q ~ a t i o n . ' ~ Without elaborating on this point, we simply wish to state that contact angles, measured in situations where contact angle hysteresis is due to surface heterogeneity, may be used in conjunction with Young's equation. Contact angles measured on rough surfaces may not be used in conjunction with Young's equation. The arguments supporting these contentions have been given in considerable detail e1se~here. l~ Since there were no independent means of checking either one of these concerns, the only possible approach available was to go ahead with suitable experiments and to assess subsequently the merit of the results by comparing them with other observations.
There is one further complication peculiar to biological systems, i.e., the question of the appropriate type of liquid to be used for the contact angle

Neumann et al. : Blood Cell and Protein Surface Tensions 279
35r
3o
"7 I
25- 0
z y 20- 0 z Q I- 15- U 6 b-
measurements. Thermodynamic considerations demand that for the approxima- tion ys N ysv to hold, that is, for the equilibrium spreading pressure to be negli- gible, the liquid surface tension has to be larger than the surface tension of the material on which the contact angle is measured. As it is anticipated that the sur- face tensions of cells are fairly large, water or buffer solutions seems to be the only safe choice. Physiological considerations lead of course to the same choice for the measuring liquid and we feel that contact angle measurements with any other liquids are probably useless due to various complications arising both from thermodynamic and physiological considerations as outlined above.
Contact angle measurements on layers of cells were first reported over ten years ago.21.2z The details of the experimentakprocedures have been reported sev- eral times or proteinsz6 are prepared by deposition from suspension or by ultrafiltration on anisotropic cellulose acetate membranes. Drops of saline or buffer of known surface tension y ~ v are deposited on the initially very wet layer and the contact angle is measured by means of a telescope that is equipped with a goniometer eyepiece. Initially the contact angle is close to zero, as expected. However, as water evaporates and fresh drops of saline are deposited on sites that had not been used for contact angle measure- ments previously, gradually increasing contact angles are observed. After approx- imately 30 minutes to 1 hour, depending on circumstances such as the relative humidity, the observed contact angles reach a plateau value, which persists for approximately another 30 minutes. Then the contact angles sometimes rapidly decrease or increase and in other cases simply become erratic.
Examples of such curves are given in FIGURE 1 for bacteria and platelets and in FIGURE 2 for proteins. Our interpretation of these curves is as follows: Initially, the biological material, cells or proteins, are completely covered by water and the contact angle is equal to zero. As time passes and water evaporates, the water
In essence, layers of
1 monocytogenes
A S epidermidis S oureus
v E coli * Platelet
e
TIME (minuter)
FIGURE 1. Contact angles of saline on nonopsonized bacteria and platelets as a func- tion of water evaporation from the wet biological substrate, measured in terms of time. Each symbol is the average of ten individual contact angle readings on each of four dif- ferent drops, at approximately the same time, on one and the same biological substrate.

280 Annals New York Academy of Sciences
T 24- L 0)
-g 20- - w 5 16- 6 I- 12- V
8- 2 s
0 lgG
--- A
0 0
0
4 1 L
I I I I
15 30 45 60 75 90 TIME (min)
FIGURE 2. Contact angles of four serum proteins deposited by ultrafiltration on aniso- tropic cellulose acetate membranes. Error limits [90% confidence limits] are shown for a single protein only for graphical reasons. Errors are similar in all cases. m, IgG; M, IgM; M, human serum albumin; M, 0,-macroglobulin.
drops start reacting to the presence of the biological material. Finally, when the plateau is reached we contend that the observed advancing contact angle is a Young contact ang1eI4 and thus is determined exclusively by the properties of the layer of biological material. The final points beyond the plateau are attributed to conformational changes and denaturation of the specimen. This interpretation is corroborated by the fact that changes in experimental conditions such as relative humidity, change all features of the curves of FIGURES 1 and 2, such as the initial slopes, or the length of the plateau, with the exception of the height of the plateau, which in our interpretation reflects solely the properties of the intact bio- logical material.
The experiments of FIGURES 1 and 2 were all performed at room temperature (22°C). The surface tension of saline (0.15 M NaCI) at that temperature is 72.6 ergskm’. From the contact angles (plateau values) of FIGURES 1 and 2 and the sur- face tension of saline y ~ v , the surface tensions of the biological materials were cal- culated from the equation of state approach. The results are listed in the first col- umn of TABLE 1. Contact angle measurements were similarly performed on layers of granulocyte^,^' lymphocytesz3 and several serum proteins.26 These results are also given in TABLE 1.
DETERMINATION OF SURFACE TENSIONS OF CELLS AND PROTEINS FROM ADHESION EXPERIMENTS
Thermodynamically, cell adhesion to a solid substrate is favored when the change in free energy for the process of cell attachment is negative. For a system in which the effect of electrical charges can be neglected, this change is, per unit surface area

TA
BL
E 1
(IN
ER
GS
~M
’, T
= 2
2°C
)
Engu
lfm
ent
SURF
ACE
TEN
SIO
NS OF
B
IOLO
GIC
AL EN
TITI
ES
Con
tact
Ang
le
z (D
e,
5
5
via
Phag
ocyt
ic I
nges
tion
Equa
tion
of St
ate
Adv
anci
ng
Susp
ensi
on
App
roac
h So
lidifi
catio
n G
ranu
locy
tes
Plat
elet
s A
dhes
ion
Det
achm
ent
Stab
ility
Sy
stem
Gra
nulo
cyte
s (H
uman
) Ly
mph
ocyt
es
(Hum
an)
Eryt
hroc
ytes
H
uman
H
orse
C
hick
en
Tur
key
Can
ine
Plat
elet
s (P
orci
ne)
Bac
teria
E.
Col
i
m, %
E! a
..
0
0
69.1
68
.3
69.0
69
.0
70.1
70
.6
64.3
65
.4
65.2
65
.7
64.4
64.9
65
.1
64.8
65
.1
63.9
67.2
67
.9
69.7
-
-
-
69.6
69
.3
69.6
cn c 0
(D
- -
S. au
reus
69
.1
-
68.7
68
.8
69.3
S.
epi
derm
idis
67
.1
- 66
.9
67.3
66
.0
L. m
onoc
ytog
enes
66
.3
-
66.1
-
65.6
B. S
erum
Alb
umin
70
.2
- H
. Ser
um A
lbum
in
70.3
-
-
-
70.2
H
. Im
mun
oglo
bulin
G
67.3
H
. Im
mun
oglo
bulin
M
69.4
-
-
- 71
.0
H. a
, M
acro
glob
ulin
71
.0
-
- -
71.0
H
. Tra
nsfe
rrin
66
.8
-
-
-
-
-
Prot
eins
0 -
-
-
-
- -
- 67
.7
- -
-
- -
B-b
ovin
e; H
-hum
an
c3
5
5
(D g. m
Po
03 c

282 Annals New York Academy of Sciences
"1 YLV ' YPV
FIGURE 3. The free energy of adhesion ( A P d h ) of a single bacterial species as a function of substrate surface tension. The bacteria con- sidered are E. coli 2627 with a surface tension, ypv = 69.7 ergs/cm*. A. yLv > y p v ; yLv = 72.8 ergs/cm2 B. yLv < ypv; yLv = 64.9 ergs/cm*.
u
-0
a 0
- 1 I I I
10 30 50 70
Y s v Cergs /cm 3 2
A P d h = YPS - YPL - YSL ( 5 )
where yps is the particle (cel1)isolid interfacial tension, YPL the particle/liquid interfacial tension and YSL the substratelliquid interfacial tension.
Cell adhesion or protein adsorption onto several polymer substrates (covering a range of surface tensions) varies as a function of ysv, and the suspending liquid surface tension, YLV. It is our primary aim here to assess to what extent the num- ber of cells adhering to various substrates corresponds to the free energy of adhe- sion. To this end, we need to know the interfacial tensions yps, y p ~ and YSL. Con- sidering Equation 3 as a generic equation that allows us to calculate the interfacial tensions between two phases from the respective surface tensions of these phases, the three quantities can be calculated from ysv, the surface tension of the substrate, y ~ v , the surface tension of the suspending liquid and ypv, the surface tension of the particle (cell).
We are therefore in the position to calculate the free energy of adhesion and to predict the pattern of adhesive behavior of cells to various polymer surfaces. For a given cellular species of a given surface tension ypv there are two functional parameters, namely, the surface tension of the substrate ysv and the surface ten- sion of the suspending liquid y ~ v . In our experiments we varied both, the sub- strate surface tension by changing the substrate and the surface tension of the suspending aqueous medium through the admixture of suitable low molecular weight additives such as dimethylsulfoxide (DMSOJ.
Typical calculations of Wdh for Escherichia coli with ypv = 67.8 ergs/cm2 are given in FIGURE 3. It becomes apparent that we have to distinguish between two cases. For
YLV > YPV (6) A P d h increases with increasing ysv predicting decreasing cell adhesion with in- creasing surface tension ysv of the substrate over a wide range of YSV values. On the other hand, when
YLV < riw (71
the opposite behavior is predicted. For the case of the equality

Neumann et a2. : Blood Cell and Protein Surface Tensions 283
0 3%DMSO rLv = 70.8 ergl/cm2
A 5% DMSO = 6 9 . 8 "
A 7.5%DMSO = 69.0 "
2M) c 0 7.5% DMSO + 2 % EDTA =69.0 "
0 8% DMSO =68.5 'I
0 IO%DMSO = 67.0 "
15% DMSO = 63.2
€ 150 - N
W
\
A - 8
? 0) fm
- 2 (T
- 0
u
... n
z' 50 .
r z 1 - - J , 20 30 40 50 60 70
2 y s v iergdcm I
FIGURE 4. Granulocyte adhesion to several polymers for various liquid surface ten- sions; error limits are 95% confidence. For graphical reasons, error limits are given only for some cases; the errors are similar in all cases.
YLV = YPV (8)
Pdh becomes equal to zero independently of the value of ysv. It is this latter fact which offers the possibility of an alternative method of determining the surface tension of cells: by determining the liquid surface tension y ~ v at which the level of cell adhesion becomes independent of the substrate surface tension, ysv.
As an example, we wish to report here on adhesion studies with human gran- ulocytes. The substrates used, their preparation, contact angles with water and surface tension are all available in reference 20. Adhesion experiments were per- formed with suspensions of granulocytes in Hanks Balanced Salt Solution (HBSS) to which varying amounts of DMSO were admixed, in order to change the sur- face tension of the suspending liquid. Each individual test was performed with 1 ml of granulocyte suspension containing 1 x lo6 cells, which was placed on the surfaces and was retained in wells formed from 2% (w/v) agarose. The cells were then incubated at room temperature for 30 minutes. Thereafter the surfaces were carefully rinsed in a standardized procedure with HBSS to remove nonadhering cells. Next, the cells adhering to the surfaces were air dried and subsequently stained using Wrights stain. The cells adhering per unit surface area were then determined by counting under the microscope. Complete experimental details have been given elsewhere." The results of these adhesion experiments are sum- marized in FIGURE 4. The theoretical predictions are borne out by the experimen- tal results. At the low DMSO concentrations, that is, at high surface tensions YLV of the suspending medium, granulocyte adhesion decreased with increasing ysv of the substrate, whereas at low values of the surface tension y ~ v the number of

Annals New York Academy of Sciences
FIGURE 5. Slopes of the straight lines of FIGURE 4 versus yLv Slope is zero for yLv = ypv = 69.0 ergs/cm2. The points are computer curve fitted to a second order polynomial and the intercept is taken from that curve fit.
adhering granulocytes increases with increasing ysv. At some intermediate value of y ~ v , adhesion does indeed become independent of substrate surface properties. As this is the case to which Equation 8 refers, we have here a novel possibility of determining the surface tension ypv of cells. To this end, the slopes of the straight lines in FIGURE 4 are evaluated by means of a computer least squares fit and plotted versus y ~ v in FIGURE 5. It is inferred that the slope becomes equal to zero at y ~ v = 69.0 ergs/cm2 implying in view of Equation 8 that the surface tension of the granulocytes is also equal to 69.0 ergs/cm2. This is in excellent agreement with the value of 69.1 ergs/cm2 obtained from the contact angle measurements.
Similar adhesion experiments were performed with glutaraldehyde-fixed human erythrocytes.28 The number of fixed erythrocytes adhering per unit sur- face area are plotted as a function of the substrate surface tension ysv for several values of y ~ v in FIGURE 6. We note that the overall appearance of these straight lines is quite similar to those of FIGURE 4. Again, the surface tension ypv of these cells was determined by plotting the slopes of the straight lines of FIGURE 6 versus y ~ v in FIGURE 7. The ypv value, obtained as the intercept with the y ~ v axis (i.e., for the slope equal to zero) is reported in TABLE 1.
It is interesting to note that so far we have only succeeded in measuring con- tact angles on layers of erythrocytes with considerable difficulty so that the adhe- sion technique, although somewhat cumbersome, has considerable attraction. In addition this technique has the advantage that it does not require, as does the contact angle method, the exposure o f the biological material to the air interface.
Similar adhesion experiments were performed with several species of bac- teria.z9 The surface tensions of these bacteria obtained in this way are also sum- marized in TABLE 1. In all these systems the agreement with the results from the contact angle measurements is striking.
Protein adsorption studies were conducted with four plasma proteins follow- ing a protocol very similar to the one used for cell adhesion.” Experimentally, the

Neumann et al. : Blood Cell and Protein Surface Tensions 285
2000-
mE 1600- E \ VI a, 1 c
g 1200- 5 2 W
0
0 z
c
800-
400-
I I 1 I I I I 10 2 0 30 40 50 60 70
Ys,( ergs/cmz)
FIGURE 6 . Erythrocyte adhesion to several polymers for various liquid surface ten- sions; error limits are 95% confidence. For graphical reasons error limits are given only for some cases; the errors are similar in all cases.
FIGURE 7. Slopes of straight lines of FIGURE 6 versus yLv Slope is zero for yLv = ypv = 64.6 ergdcm’. The points are computer curve fitted to a second order polynomial and the intercepts taken from that curve fit.
286
3.0
z- 2 0 6 \ 0 a z - 0 L
Annals New York Academy of Sciences
5 LV(ergs/cm’)
729 A 700 0 698 0 691 v 672 0 63 2
I 1 I I I 1 I 10 20 30 40 50 60 70
V S v (ergs,/cm’)
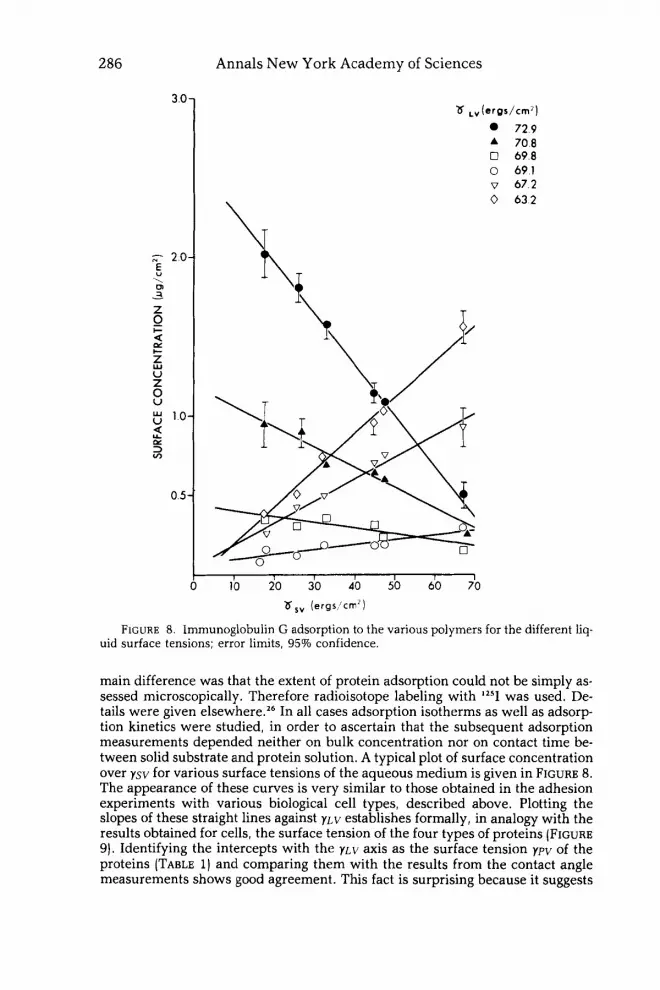
FIGURE 8. Immunoglobulin G adsorption to the various polymers for the different Iiq- uid surface tensions; error limits, 95% confidence.
main difference was that the extent of protein adsorption could not be simply as- sessed microscopically. Therefore radioisotope labeling with lz5I was used. De- tails were given elsewhere.26 In all cases adsorption isotherms as well as adsorp- tion kinetics were studied, in order to ascertain that the subsequent adsorption measurements depended neither on bulk concentration nor on contact time be- tween solid substrate and protein solution. A typical plot of surface concentration over ysv for various surface tensions of the aqueous medium is given in FIGURE 8. The appearance of these curves is very similar to those obtained in the adhesion experiments with various biological cell types, described above. Plotting the slopes of these straight lines against y ~ v establishes formally, in analogy with the results obtained for cells, the surface tension of the four types of proteins (FIGURE 9). Identifying the intercepts with the y ~ v axis as the surface tension ypv of the proteins (TABLE 1) and comparing them with the results from the contact angle measurements shows good agreement. This fact is surprising because it suggests

Neumann et a2. : Blood Cell and Protein Surface Tensions 287
0 1 r/)
+ 0.751
0 1gG a IgM
0.50 4 0 HSA
0,501
-I 63 65 67 69 71 73
'6, (eres/cm2)
FIGURE 9. Slopes of the straight lines of FIGURE 8 versus yLv The slope is zero for yLv = 67.7 ergs/cm2. The points are computer curve fitted to a second order polynomial and the intercepts are taken from that curve fit.
that the model implicit in Equation 5 is applicable not only to cell adhesion but to protein adsorption as well, and this in turn implies that we could refer to the sur- face tension of individual protein molecules, in spite of the notion that surface tension is a macroscopic concept which one does not necessarily expect to hold in macromolecular dimensions. The answer to this problem may be connected with the interrelation of interfacial tensions and van der Waals forces. We have shown recently3' that the free energy of adhesion as given by Equation 5 may be under- stood as an expression of the van der Waals interactions, and these interactions are of course operative in macromolecular dimensions, even though interfacial tensions may not be defined on such a small scale. In any event, we find it conve- nient to refer to the surface tension of proteins, with the understanding that we are primarily interested in the fact that these surface tensions reflect the van der Waals interactions.
ELUTION OF CELLS FROM SUBSTRATES
In terms of the model underlying Equation 5 it is clear that for negative values of Pdk we expect cell attachment to a substrate. As the free energy of de- tachment, hFdef is given by
,@et = - p d k (9) it is clear that detachment of cells from substrates to which they are attached is not easily possible under the same conditions. However, it is possible to change the sign of Pdh subsequent to cell adhesion and to make this @' negative, SO
that the process of cell detachment will be favored. This is equivalent to making

288 Annals New York Academy of Sciences
70 -
50 -
30-1
0 dimethylrulfoxide 0 dimethyl acetamide
4 T
i I I
I
!O
I I I I I 1
7 Lv ( e r g s / c m z )
62 64 66 68 70 72
FIGURE 10. Granulocyte elution yield from nylon fibers as a function of the surface tension of the eluting buffer.
the van der Waals interactions repulsive. Expressed in terms of surface tensions, there will be repulsion
YSV< Y L V < YPV (104
YPV < YLV < YSV (lob) On this basis we have reported recently3' a novel method for the isolation of gran- ulocytes from nylon fibers. In that study the percentage yield of granulocytes was determined as a function of the surface tension of the elution liquid. The low molecular weight surface tension lowering additives used were dimethylsulfox- ide (DMSO) and dimethlylacetamide JDMAC). The results are given in FIGURE 10. We note that the points derived from the two additives fall on the same curve, re- inforcing the fact that it is the surface tensions which matter. The main feature of this plot is the dramatic rise in cell yield near a liquid surface tension of 69 ergs/cm2 as the surface tension of the buffer is decreased by adding increasing amounts of DMSO and DMAC. As we infer from the inequalities, (lo), we expect the van der Waals interaction to become repulsive as we decrease the liquid sur- face tension YLV from an initially high value to one just below ypv. Thus the re- sults of FIGURE 10 suggest that the surface tension of granulocytes is approximate- ly equal to 69 ergs/cm*. While cell elution as a means of determining the surface tension of cells may not have the same potential for accuracy as contact angles and adhesion strategies, it is certainly a very direct manifestation of interfacial tensions, essentially free from the thermodynamic complexities which are inher- ent in the contact angle technique.
It is interesting to compare the mechanisms of cell adhesion and cell elution. In cell adhesion, we observe generally an increase of cell adhesion with decreas- ing free energy of adhesion, and in elution an on-off mode of adhesion as we cross the borderline between attraction and repulsion. The reason for this difference is unclear at this time.
or

Neumann et al. : Blood Cell and Protein Surface Tensions 289
Finally, elution experiment^^^,^^ with proteins [hydrophobic chromatog- raphy) were also performed and analyzed from the same thermodynamic aspect, as well as the dissociation of antigen-antibody [ AG-AB) c ~ m p l e x e s . ~ ~ - ~ ~ While a reduction in surface tension often facilitates elution or dissociation, the surface tensions at which these processes occur are normally somewhat lower than those anticipated on the basis of measured surface tensions of the individual proteins. This pattern of behavior may be due to conformational changes taking place after the initial interaction, for example, adsorption. In the case of AG-AB complexes this may also be due to the extrusion of water from the system.
SURFACE TENSION MEASUREMENTS OF CELLS WITH THE FREEZINGFRONT TECHNIQUE
Very recently the freezing-front technique was used to explore its potential for the determination of the surface tension of biological cells.37 This method is relatively new, but it has already been used to determine the surface tension of polymer particles3s and of coal particle^.^^ In the freezing-front technique the cells are placed in the liquid phase of some matrix material, which is then frozen in a carefully regulated manner.37-40 The interactions between the advancing solidification front and the cells are then observed through a microscope with the aim of determining the critical velocity of engulfment. This is the velocity of the advancing front at which cells are no longer pushed by the solidmelt interface, but are engulfed. A simple model of this phenomenon involves a balance be- tween the viscous drag force acting on the cell and the repulsive force between the cell and the advancing freezing front arising from a positive free energy of a d h e ~ i o n . ~ ~ . ~ ' At the critical velocity these forces are equal and engulfment is pro- duced by any small disturbance. The critical velocity, which can be determined experimentally, has been linked to the free energy of adhesion through a scheme of dimensional analy~is .~ '
Knowing the surface tension of the matrix material in the liquid as well as in the solid state, the surface tension of the cells can then be obtained from the free energy of adhesion. To date, the surface tensions of fixed erythrocytes of several species and of fresh human lymphocytes and granulocytes have been determined with the freezing-front t e c h n i q ~ e . ~ ~ Water was used as the matrix material in all cases. A photomicrograph of fixed human erythrocytes being swept along by the advancing icelwater interface is shown in FIGURE 11. The surface tensions ob- tained with the freezing-front technique are those at the melting point of the matrix materials. The values listed in TABLE 1 have been referred to room temper- ature by assuming dypvldl' = -0.1 ergs/(cm2 "Cj. The agreement of the results for granulocytes and lymphocytes with those obtained from contact angles (and in the case of granulocytes also from the adhesion protocol) is good.
The critical velocities of engulfment on which the above results are based are 13.5 p d s e c for the fresh human lymphocytes and 31.0 pmlsec for fresh human granulocytes. The average diameter of granulocytes and lymphocytes is 13.0 pm and 11.0 pm, respectively. As the freezing-front technique is not sensitive to such small differences in size, the considerable difference in critical velocity must be attributed essentially to the relatively small difference in surface tension between granulocytes and lymphocytes. This implies that the sensitivity of the technique to small differences or changes in surface properties is quite high.
The technique obviously cannot be used to study proteins in solution, partly because protein molecules cannot be readily made visible and partly because

290 Annals New York Academy of Sciences
c E e 'i
w
c a M E 'g e 4
c e 3 3

Neumann et al. : Blood Cell and Protein Surface Tensions 29 1
FIGURE 12. Schematic Of the sequence of events in ag- glomeration of fixed red cells. (a] Initial state; (b) Beginning agglomeration; [c) Fully devel- oped agglomeration, manifested by sedimentation of agglomer- ation droplets into the lower phase (heavy water).
Brownian motion and convection currents would make measurements of the critical velocity impossible. However, it is possible to study protein-coated par- ticles with this technique. One point of interest in this connection is that due to adsorption the conformation and hence the surface tension of the adsorbed pro- tein may change. The freezing-front technique might therefore provide a means of studying such changes.
SURFACE TENSION MEASUREMENTS OF CELLS FROM STABILITY OF SUSPENSIONS
While the van der Waals interactions between unlike phases embedded in a liquid can be attractive as well as repulsive, the interaction between identical par- ticles in a liquid can only be attractive or zero. This implies that the van der Waals forces between cells of one type in suspension can only be attractive or
FIGURE 13. Suspension stability measured by the "critical particle concentration" as a function of dimethylsulfoxide concentration. Maximum stability occurs where yLv = ypv. A = Turkey; 0 = Chicken; 0 = Horse; V = Canine; 0 = Human.

292 Annals New York Academy of Sciences
zero in the limiting case. As attraction between the cells enhances agglomeration and aggregation, maximum suspension stability is expected when the van der Waals attraction becomes zero. This occurs when the surface tension of the cells ypv is equal to the surface tension YLV of the suspending medium.
We recently reported sedimentation experiments with fixed e r y t h r ~ c y t e s ~ ~ . ~ ~ from the same species as we investigated with the freezing front technique. The experimental design followed the above reasoning. In essence, the aqueous sus- pension of fixed erythrocytes was layered on a cushion of heavy water as indi- cated schematically in FIGURE 12. As aggregates of erythrocytes form in the sus- pension, they start to sink into the D20 cushion. Various protocols are possible, such as measuring the time elapsed until the first aggregates form as a function of the surface tension of the suspending medium at constant particle concentration. In FIGURE 13 we report results of a somewhat different protocol, where the maxi- mum concentration was determined that did not give rise to aggregation for a pre- selected length of time. The maxima in these curves correspond to the surface tension of the fixed erythrocytes and occurs when y ~ v = ypv. The results are sum- marized in TABLE 1. We note that the agreement with the results obtained from the freezing front and in the case of human erythrocytes with the adhesion tech- nique is very good.
SURFACE TENSION MEASUREMENTS OF CELLS AND BACTERIA FROM PHAGOCYTIC INGESTION
Thermodynamically, the process of ingestion of a particle such as a bacteri- um B by a phagocytic cell P generates a cell-bacterium interface PB and annihi- lates a bacterium-liquid interface BL. Therefore the free energy of engulfing is
mn8 = YPR - YBL (11)
FIGURE 14. Free energy of engulfment ( A F " R ) as a function of the surface ten- sion of the suspending aque- ous media for the four species of non-opsonized bacteria.

Neumann et al. : Blood Cell and Protein Surface Tensions 293
where ~ P B is the phagocyte-bacterium interfacial tension and ysr. the bacterium- liquid interfacial tension.
Since both ypv and ~ B V are fixed in an experiment with a certain bacterial species and a given type of phagocyte, the only means of influencing the outcome of the experiment by thermodynamic means is to vary the surface tension y ~ v of the liquid medium. Our first step then is to consider the thermodynamic predic- tion for the free energy of engulfing W n g as a function of the liquid surface ten- sion y ~ v . In FIGURE 14, hFe"8 is given for the ingestion of four bacterial species by platelets.44 The input information used are the values of the surface tensions of the bacteria and of platelets as determined from contact angles. The main feature of each individual curve is a minimum that occurs at 7r.v = ~ B V . Thus, if the ex- perimental results follow this pattern, we have yet another strategy for determin- ing the surface tension of the bacteria, which consists simply in establishing the surface tension of the suspending liquid at which phagocytic ingestion is mini- mized. The curves for the ingestion of the various bacteria have a common inter- section. This intersection occurs when y ~ v = ypv , that is, when the surface ten- sion of the suspending liquid is equal to the surface tension of the phagocytic cells. Thus phagocytic ingestion can be used in principle to determine both the surface tension of the ingested particles as well as the surface tension of the phagocytic cells.
Phagocytosis experiments were performed from this point of view with vari- ous bacteria and with both porcine platelets and human granulocytes as the phagocytic cells. The experimental procedures as well as the results were de- scribed in detail e l ~ e w h e r e . ~ ~ , ~ ~ We reproduce FIGURE 15 results of phagocytosis of nonopsonized bacteria by platelets. Comparison with FIGURE 14 shows that there is a very close correspondence between the thermodynamic predictions and the experimental observations. The minima were identified as the surface tension of the bacteria and entered in TABLE 1, together with the common inter- section, which represents the surface tension of the platelets. The agreement
a 0 L. monocytogenes b S. epiderrnidis "F C. S. aureus
FIGURE 15. The experimentally determined extent of the same bacteria ingested by pig platelets in the same aqueous media. Errors are 95% confidence limits.

294
7
6 2
E E 5
$ 4
z 5 3
i
w e n Y
Y a
c= Y c U
Y 0 E LI1
= 1 3 z 0
Annals New York Academy of Sciences
- T
T- - 4- - - - - - - - 0.0 E. coli A,A 5. epidermidis A.0 Opsonized n.0 Non-opsonized
I I I I I I I I 60 62 64 66 68 70 7 2 74
ZLv (ergs/cmz)
FIGURE 16. Extent of bacterial ingestion by human granulocytes as a function of the surface tension of the suspending aqueous medium. The minima in the curves correspond to the ysv values of the strains used. The principal deviation from the theoretical curves shown in FIGURE 14 is the plateau each experimental curve shows at high yLv values, and the lack of a common intersection of the experimental curves.
with the results obtained from contact angle measurements, and in the case of the bacteria also with the results from the adhesion experiments, is good. These experiments were also performed with opsonized Contact angle mea- surements showed that the more hydrophobic bacteria remained virtually un- changed, whereas the surface tension of the more hydrophilic bacteria was slight- ly reduced by opsonization. The experimental curves corresponding to the theoretical curves in FIGURE 14 showed only minor differences, reflecting noth- ing more than the slightly lower surface tensions of the opsonized bacteria. This implies that Fc receptors do not play a role in the phagocytosis of bacteria by platelets.
Typical curves for the number of bacteria engulfed per granulocyte as a function of the surface tension of the suspending liquid are given in FIGURE 15. Theoretically, that is, from the point of view of the thermodynamic model, curves like those in FIGURE 14 are expected. But the experimental curves for the ingestion even of the nonopsonized bacteria have a somewhat different appearance, the reasons for which are not completely understood at the present time. However, one feature of the theoretical curves is preserved, that is, the minimum at y ~ v = y ~ v so that phagocytosis by granulocytes can indeed by used for determinations of the sur- face tension of ingested particles other than opsonized bacteria. Results obtained in this way are summarized in TABLE 1.
In the case of opsonized bacteria we infer from FIGURE 16 that there is no de- pendence at all of the extent of phagocytic ingestion on the surface tension of the
Phagocytosis of bacteria by granulocytes is a very different

Neumann et al. : Blood Cell and Protein Surface Tensions 295
suspending liquid. This indicates clearly that in this case ingestion does not fol- low the thermodynamic model. This finding is in agreement with the well known fact that phagocytic ingestion of opsonized bacteria by granulocytes is Fc receptor mediated and hence specific and not nonspecific, as assumed in the thermo- dynamic m0de1.’~ By implication it is clear that the thermodynamic model also is an excellent tool to help distinguish between specific and nonspecific interactions.
SUMMARY OF CONCLUSIONS
1. Surface tensions of cells and proteins can be measured by a variety of tech- niques.
2. The results obtained from the different techniques and summarized in TABLE 1 are in good agreement.
3. Surface tensions of cells and proteins are relatively high; that is, these mater- ials tend to be hydrophilic in their natural state.
4. The interpretation of the experiments discussed here aimed at the determina- tion of surface tensions of cells and proteins. These arguments can be in- verted; we may conclude that surface tensions govern cell adhesion, protein adsorption, stability of suspensions, and phagocytosis.
REFERENCES
1. SHERMAN, I. A,, J. GRAYSON & W. ZINGG. 1980. The critical closing phenomenon in the hind limb of the dog. Proc. 11th Europ. Conference Microcirculation. In Bibliotheca Anatomica, No. 20. P. Gaehtgens, Ed. S. Karger. Basel.
2. NEUMANN, A. W., D. R. ABSOLOM, W. ZINGG & C. J. VAN Oss. 1979. Surface thermo- dynamics of leukocyte and platelet adhesion to polymer surfaces. Cell Biophys. 1 (1):
3. ABSOLOM, D. R., C. J. VAN Oss, R. J. GENCO & A. W. NEUMANN. 1980. Surface thermo- dynamics of normal and pathological human granulocytes. Cell Biophys. 2: 113- 126.
4. NEUMANN, A. W., 0. S. HUM, D. W. FRANCIS, W. ZINGG & C. J. VAN OsS. 1980. Kinetic and thermodynamic aspects of platelet adhesion from suspension to various sub- strates. J. Biomed. Mat. Res. 14: 499-509.
5. VAN DER SCHEER, A,, & C. A. SMOLDERS. 1978. Dynamic aspects of contact angle mea- surements on adsorbed protein layers. J. Colloid Interface Sci. 63: 7-15.
6. GENDREAU, R. M. & R. J. JAKOBSEN. Blood-surface interactions. J. Biomed. Mater. Res.
7. VAN Oss, C. J., D. BECKERS, C. P. ENGELFRIET, D. R. ABSOLOM & A. W. NEUMANN. 1981. Elution of blood group antibodies. I. Red cell antibodies. Vox Sang. 40: 367-371.
8. DE GROOT, E. R., M. C. LAMERS, L. A. AARDEN, R. J . T. SMEENK & C. J. VAN 0%. 1980. Dissociation of DNNanti-DNA complexes at high pH. Immunol. Comm. 9:
9. VAN Oss, C. J. 1978. Phagocytosis as a surface phenomenon. Ann. Rev. Microbiol. 32:
10. CAPO, C., P. BONGRAND, A. M. BENOLIEL & R. DEPIEDS. 1979. Non-specific recognition in phagocytosis: Ingestion of aldehyde-treated erythrocytes by rat pertoneal macro- phages. Immunology 36: 501-508.
79-92.
13: 893-906.
515-518.
19-39.
11. GIBBS, J. W. 1961. The Scientific Papers. Dover. New York. Volume 1: 55-371. 12. BORUVKA, L. &A. W. NEUMANN. 1977. Generalization of the classical theory of capillar-
13. CALLEN, H. B. 1960. Thermodynamics. Wiley. New York. 14. NEUMANN, A. W. 1974. Contact angles and their temperature dependence: Thermo-
ity. J. Chem. Phys. 66: 5464-5476.

296 Annals New York Academy of Sciences
dynamic status, measurement, interpretation and application. Adv. Colloid Interface Sci. 4: 105-191.
15. ROTENBERG, Y., L. BORUVKA &A. W. NEUMANN. 1983. Determination of surface tension and contact angle from the shapes of axisymmetric fluid interfaces. J. Colloid Inter- face Sci. 93: 169-183.
16. DRIEDGER, O., A. W. NEUMANN i?~ P. J. SELL. 1965. An equation of state approach for surface free energies. Kolloid -Z.u.Z. Polymere 201: 52-59.
17. NEUMANN, A. W., R. J. GOOD, C. J. HOPE & M. SEJPAL. 1974. An equation of state ap- proach to determine surface tensions of low energy solids from contact angles. J. Col- loid Interface Sci. 49: 291-304.
18. WARD, C. A. & A. W. NEUMANN. 1974. On the surface thermodynamics of a two- component liquid-vapour-ideal solid system. J. Colloid Interface Sci. 49: 286-290.
19. NEUMANN, A. W., 0. S. HUM, D. W. FRANCIS, W. ZINGC & C. J. VAN Oss. 1980. Kinetic and thermodynamic aspects of platelet adhesion from suspension to various sub- strates. J. Biomed. Mater. Res. 14: 499-509.
20. NEUMANN, A. W., D. R. ABSOLOM, D. W. FRANCIS & C. J . VAN oss. 1980. Conversion tables of contact angles to surface tensions. Separ. Purif. Method 9: 69-163.
21. V A N Oss, C. J. & C. F. GILLMAN. 1972. Phagocytosis as a surface phenomenon. I. Con- tact angles and phagocytosis of non-opsonized bacteria. J. Reticuloendothel. SOC.
22. VAN Oss, C. J., & C. F. GILLMAN. 1972. Phagocytosis as a surface phenomenon 11. Con- tact angles and phagocytosis of encapsulated bacteria before and after opsonization by specific antiserum and complement. J. Reticuloendothel. SOC. 12: 497-504.
23. V A N Oss, C. J . , C. F. GILLMAN & A. W. NEUMANN. 1975. In Phagocytic engulfment and cell adhesiveness as surface phenomena. Marcel Dekker. New York.
24. ABSOLOM, D. R., C. J . VAN Oss, W. ZINGG & A. W. NEUMANN. 1982. Phagocytosis as a surface phenomenon VI. Opsonization by aspecific adsorption of IgG as a function of bacterial hydrophobicity. J. Reticuloendothel. SOC. 31: 59-70.
25. ABSOLOM, D. R., D. W. FRANCIS, W. ZINGG, C. J. VAN OSS & A. W. NEUMANN. 1982. Phagocytosis of bacteria by platelets: Surface thermodynamics. J. Colloid Interface Sci. 85: 168-177.
26. V A N Oss, C. J., D. R. ABSOLOM, A. W. NEUMANN & W. ZINGG. 1981. Determination of the surface tension of proteins. I. Surface tension of native serum proteins in aqueous media. Biochim. Biophys. Acta 670: 76-78.
27. ABSOLOM, D. R. , A. W. NEUMANN, W. ZINGG & C. J . V A N Oss. 1979. Thermodynamics of cell adhesion. Trans. Am. SOC. Artif. Intern. Organs. 15: 152-158.
28. ABSOLOM, D. R., C. T. THOMSON, W. ZINGG, C. J. VAN OSS & A. W. NEUMANN. 1982. Erythrocyte adhesion to polymer surfaces: Influence of electrical charges. 183rd Am. Chem. SOC. Mtg., Div. Colloid and Surface Chemistry, Las Vegas, Nevada, April.
29. ABSOLOM, D. R., F. V. LAMBERTI, 2. POLICOVA, W. ZINGG, C. J. VAN Oss & A. W. NEUMANN. 1983. Surface thermodynamics of bacterial adhesion. J. Appl. Environ. Microbiol.
30. NEUMANK, A. W., S. N. OMENYI & C. J. VAN 0%. 1982. Attraction and repulsion of solid articles by solidification fronts. 3. van der Waals Interactions. J. Phys. Chem. 86:
31. ABSOLOM, D. R., C. J. V A N Oss & A . W. NEUMANN. 1982. Elution of human granulocytes from nylon fibres by means of repulsive van der Wads forces. Transfusion 21:
32. VAN Oss. C. 1.. D. R. ABSOLOM & A . W. NEUMANN. 1979. Reoulsive van der Waals forces.
12: 283-287.
46: 90-97.
1267-1270.
663-676. , ,
11. The mechanism of hydrophobic chromatograph;. Separ. Sci. Technol. 14: 305-317.
33. VAN Oss, C. J., D. R. ABSOLOM & A. W. NEUMANN. 1982. Role of attractive and repulsive van der Waals forces in affinity and hydrophobic chromatography. In Affinity Chromatography and Related Methods. T. B. Gribnau, J . Visser & R. J. Nirvard, Eds. Elsevier. Amsterdam: 29-37.
34. VAN Oss, C. J., D. R. ABSOLOM, A. L. GROSSBERG & A. W. NEUMANN. 1979. Repulsive van der Waals forces. I. Complete dissociation of antigen-antibody complexes by means of negative van der Waals forces. Immunol. Commun. 8: 11-29.

Neumann et al. : Blood Cell and Protein Surface Tensions 297
35.
36. 37.
38.
39.
40.
41.
42.
43.
44.
HOVANEC, D. L., D. R. ABSOLOM, C. J. VAN OSS & E. A. GORZYNSKI. 1980. The relation- ship to coagglutination of immunoglobulin class dissociated from E. coli-antibody complexes. J. Clin. Microbiol. 12: 608-610.
ABSOLOM, D. R. 1981. Affinity chromatography. Separ. Purif. Methods 10: 239-286. SPELT, J. K., D. R. ABSOLOM, W. ZINGG, C. J. VAN OSS &A. W. NEUMANN. 1982. Surface
tension determination of biological cells by means of the freezing front technique. Cell Biophys. 4: 113-137.
OMENYI, S. N., R. P. SMITH &A. W. NEUMANN. 1980. Determination of solidmelt inter- facial tensions and of contact angles of small particles from the critical velocity of en- gulfing. J. Colloid Interface Sci. 75: 117-125.
VARGHA-BUTLER, E. I., M. R. SOULARD, A. W. NEUMANN & H. HAMZA. 1981. Contact angle measurements on coal particles from solidification-front experiments. Can. Mining Metal. Bull. 12: 1-5.
OMENYI, S. N., A. W. NEUMANN & C. J. VAN OSS. 1982. Attraction and repulsion of solid particles by solidification fronts. I. Thermodynamic effects. J. Appl. Phys. 52:
OMENYI, S. N., A. W. NEUMANN, W. W. MARTIN, G. M. LESPINARD & R. P. SMITH. 1981. Attraction and repulsion of solid particles by solidification fronts. 11. Dimensional analysis. J . Appl. Phys. 52: 796-802.
OMENYI, S. N., R. S. SNYDER, C. J. VAN Oss, D. R. ABSOLOM & A. W. NEUMANN. 1981. Effects of zero van der Waals and zero electrostatic forces on droplet sedimentation. J. Colloid Interface Sci. 81: 402-409.
OMENYI, S. N., R. S. SNYDER, D. R. ABSOLOM, C. J. VAN Oss & A. W. NEUMANN. 1982. Enhanced erythrocyte suspension layer stability achieved by surface tension lower- ing additive. J. Dispersion Sci. 3: 303-310.
NEUMANN, A. W., D. R. ABSOLOM, W. ZINGG, D. W. FRANCIS & C. J. VAN Oss. 1983. Thermodynamic aspects of granulocyte phagocytosis. Cell Biophys. 4: 285-293.
789-795.
DISCUSSION OF THE PAPER
H. L. GOLDSMITH (McGill University, Montreal, Canada): Might I begin by commenting on something that puzzles me a great deal? One of the most extra- ordinary phenomena about all your results is the fact that your total spread in interfacial tension is only from 63 to 70 dynes cm-'. There seems to be very little difference between the types of cells and bacteria that you looked at. Do you have an explanation for this? Because I think this is quite extraordinary.
A. W. NEUMANN: If you had very much larger differences you would have very large interfacial tensions. We are aware of bacteria which are much more hydrophobic but that is a different matter. Inside the blood we think there is nothing that is very hydrophobic. The only item we have found to be truly hydro- phobic in the higher organism is cartilage. Cartilage is very hydrophobic. Other- wise everything else tends to be hydrophilic.
E. A. EVANS (University of British Columbia, Vancouver): I am a bit puzzled, too, but from the opposite viewpoint. Basically, when we study the aggregation of a single cell organism, it takes an incredibly low energy difference-we are talk- ing about lllOOth of the variation of interfacial energies that you are looking at.
NEUMANN: Is the suspension well defined? EVANS: I understand what you mean, but it is not the surface tension of the
NEUMANN: What I mean is surface tension in the Gibbsonian sense. EVANS: Right, it is the interfacial free energy measured relative to some other
cell.
phase.
298 Annals New York Academy of Sciences
NEUMANN: No, it is the surface tension in the Gibbsonian sense. EVANS: The point is that I would be surprised if everything did not stick to
everything, with these kinds of large variations in interfacial tensions that you report here, meaning factors of a hundred over the kinds of aggregation energies that we look at.
NEUMANN: You must be aware of the fact that what I have listed here are ref- erence surface tensions. If you plug these numbers in with your liquid surface tension in the equation of state, you get values ranging from zero to 1.0 in some extreme cases. The typical interfacial tensions with these reference values are of the order of 0.1 dynes cm-’.
EVANS: The other point that concerns me a bit is in the measurement of sur- face tension. We know from physical chemistry that these membrane surfaces like to remain hydrated and the state of hydration is a very strong function of vapor pressure and the vapor pressure also strongly correlates with the surface density, because of the hydration, so we remove density and the surface con- denses. We certainly expect to have a major change in the surface free energy, and yet as far as I can tell, you make no effort to maintain the state of hydration in the system.
NEUMANN: All what you say refers only to a direct contact angle measure- ment. I have talked about six different techniques. The next point is that, yes, one could be concerned. The fact however is that these techniques yield the same answer. What we say is, we continuously dehydrate the system. Initially we evaporate unbound water, which simply happens to be there from the prepara- tion. Eventually the water of hydration also evaporates. We are implying that the plateau value that we measure indeed reflects the surface properties of the hy- drated film.
EVANS: I am very impressed that the numbers do come out the same, mainly because I question some of the physical principles behind a couple of things.
NEUMANN: Like the second law of thermodynamics? EVANS: Well, not normally, But the thing that does concern me in the
freezing-front measurement is your claim that basically you have a negative van der Waals interaction between cells that produces rejection from the interface, which I find quite astounding.
NEUMANN: They are primarily repelled in our model because of positive free energies of adhesion and they follow that model very precisely.
A. SILBERBERG (Weizrnann Institute of Science, Rehovot, Israel): I wanted to ask a question very similar to the one Dr. Evans asked. It concerns the state of the surface of the cells that you are measuring. We have these proteins that are organized in some special way in the living system. Now, if you dehydrate, you are going to alter the surface gel. You no longer have the same physical state on the surface. Now, if that is the surface which you are testing you may not actually be testing what is happening in the system in an aqueous environment. So, am I right in saying that this is the state that you are measuring? Or are you trying to measure the gel state?
NEUMANN: This whole comment again refers to the direct contact angle meas- urement. Let me be pragmatic here. The fact is that I agree that one can have those concerns. However, it turns out that in all the other measurements, where the cells never are exposed to an air interface, the results are identical. This rein- forces our contention that indeed on that plateau you have gotten rid of enough water to see the cell but not that much water yet that your cells are dehydrated. Once you have six techniques all yielding the same results, five of which do not ever have the interface with air, I think one can be reasonably confident about the experiments.


