Embed Size (px)
Citation preview
310Journal of Marketing ResearchVol. XL (August 2003), 310–320
*Kevin E. Voss is Assistant Professor of Marketing, Department of Mar-keting, Oklahoma State University (e-mail: [email protected]). Eric R.Spangenberg is Associate Professor of Marketing, Department of Market-ing, Washington State University (e-mail: [email protected]). BiancaGrohmann is Assistant Professor of Marketing, John Molson School ofBusiness, Concordia University (e-mail: [email protected]).The authors express their gratitude to Chris Janiszewski, John Mowen,David Sprott, Josh Wiener, Russ Winer, and three anonymous JMR review-ers for their helpful comments on previous versions of this article. Theauthors also recognize Ayn Crowley for ideas that led to the developmentof this research stream.
KEVIN E. VOSS, ERIC R. SPANGENBERG, and BIANCA GROHMANN*
This article reports the development and validation of a parsimonious,generalizable scale that measures the hedonic and utilitarian dimensionsof consumer attitudes toward product categories and different brandswithin categories. The hedonic/utilitarian (HED/UT) scale includes tensemantic differential response items, five of which refer to the hedonicdimension and five of which refer to the utilitarian dimension of consumerattitudes. The authors conducted six studies to establish the unidimen-sionality, reliability, and validity of the two HED/UT subscales. In reachingthe final scale, the authors also develop and implement a unique processof paring down a psychometrically sound but otherwise too large set ofitems. Nomological validity is established by replacing a typical, one-dimensional attitude toward the brand measure with the hedonic and util-itarian dimensions in a central route processing model. Results suggestthat the hedonic and utilitarian constructs are two distinct dimensions ofbrand attitude and are reliably and validly measured by the HED/UT scale.
Measuring the Hedonic and UtilitarianDimensions of Consumer Attitude
Researchers continually seek a richer understanding ofconsumer attitudes. Investigation of the hedonic and utilitar-ian components of attitude has been suggested in suchdiverse disciplines as sociology, psychology, and econom-ics. This multidisciplinary recognition of the hedonic andutilitarian elements of consumption mirrors parallel theoret-ical development in marketing, mainly from a series of arti-cles by Hirschman and Holbrook (1982; Holbrook andHirschman 1982). Although product/brand attitude has his-torically been treated one-dimensionally (e.g., Osgood,Suci, and Tannenbaum 1957), the view that attitudes arecomplex and multidimensional (e.g., Bagozzi and Burnkrant1979; Eagly and Chaiken 1993) has directed marketingresearchers toward integrating an experiential view of con-sumption with more-traditional functional approaches (e.g.,Mano and Oliver 1993; Park, Jaworski, and MacInnis 1986).In an early attempt to measure multiple dimensions of prod-uct/brand attitudes, Batra and Ahtola (1990, p. 159, empha-
sis added) state, “consumers purchase goods and servicesand perform consumption behaviors for two basic reasons:(1) consummatory affective (hedonic) gratification (fromsensory attributes), and (2) instrumental, utilitarian reasons.”We adopt this two-dimensional conceptualization of con-sumer attitudes: The first dimension is a hedonic dimensionresulting from sensations derived from the experience ofusing products, and the second is a utilitarian dimensionderived from functions performed by products.
Measurement of these attitudinal dimensions can provideresearchers and managers with fresh approaches to model-ing marketing problems. Measures of attitudinal dimensionsprovide building blocks for researchers attempting todevelop models that explain a greater proportion of the vari-ance in consumer behavior (Bagozzi and Burnkrant 1979;Olney, Holbrook, and Batra 1991). Measures of the hedonicand utilitarian dimensions of attitude enable marketers totest the effectiveness of advertising campaigns that stressexperiential or functional positioning strategies (Park,Jaworski, and MacInnis 1986). Then, too, these measurescan reveal brand differences/positions that may not beapparent when a single dimension attitude measure is used(Dillon et al. 2001; Machleit, Allen, and Madden 1993).Previous research has suggested that products/brands thatare highly valued on the hedonic dimension rather than theutilitarian dimension are better able to charge a price pre-mium (Dhar and Wertenbroch 2000) or engage in sales pro-motions (Chandon, Wansink, and Laurent 2000). Thus,measures of these two dimensions may serve as input intopricing and sales promotion decisions. Relatedly, because
JMR3E.qxdII 7/3/03 9:51 AM Page 310

Hedonic and Utilitarian Dimensions of Attitude 311
1Several definitions exist for discriminant validity. Some researchersdefine the term as demonstrating that a measure does not correlate with the-oretically unrelated constructs (e.g., Tull and Hawkins 1993). Others definethe term as too-high correlations with other tests from which they wereintended to differ (e.g., Bagozzi, Phillips, and Yi 1991; Nunnally and Bern-stein 1994). The second definition is the one we adopt in this study.
2Unidimensionality necessitates that all items in a scale are generatedfrom the same conceptual domain (Gerbing and Anderson 1988). However,it is possible for items appearing methodologically united on a singledimension to derive from theoretically different but correlated domains,that is, concept-X scale interaction. A concept-X scale interaction occurswhen measure items are affected by a construct other than the hypothesizedconstruct.
owners of hedonic items keep them for longer periods (Dharand Wertenbroch 2000) and because ownership is a recom-mended segmentation criterion (Kirmani, Sood, and Bridges1999), measuring attitude dimensions is a basis for seg-menting markets.
A major impediment to such research is the difficulty ofcapturing both dimensions with a reliable and valid meas-urement instrument. The most commonly used scale, whichBatra and Ahtola (1990) developed, has proved problematicin nearly all published reports of its use (e.g., Chaudhuri andHolbrook 2001; Crowley, Spangenberg, and Hughes 1992).This performance can be explained both theoretically andmethodologically. A prominent criticism of the scale is itsinability to account for relevant theoretical concepts withina nomological framework. For example, the instrument doesnot accommodate involvement, as Hirschman and Holbrook(1982) propose. Predictably, Batra and Ahtola’s items cross-load with items from Zaichkowsky’s (1985) measure ofproduct category involvement, suggesting inadequate dis-criminant validity (Mano and Oliver 1993).1 This result inpart can be accounted for by an apparent concept-X scaleinteraction suggested by the inconsistent factor loadings ofscale items reported by the original authors. A careful read-ing suggests that Batra and Ahtola blur the theoretical dis-tinction between unidimensionality (Gerbing and Anderson1988) and single-dimension scales.2 In developing multipleitem measures, theory suggests that researchers should sam-ple from the (hypothetical) set of all items representing theconstruct of interest (Churchill 1979). However, Batra andAhtola conduct two independent development efforts withdifferent sets of initial items that ostensibly represent thesame construct(s) and subsequently combine items from thetwo efforts to arrive at a final scale. Because slight differ-ences in initial construct definition or domain sampling cangenerate items from different domains, this method canintroduce concept-X scale interaction, which could easilyexplain the item cross-loading problem Mano and Oliver(1993) identify. Batra and Ahtola do not report a test of uni-dimensionality for their measure; thus, the possibility existsthat the items actually represent different but correlateddomains.
The measure has also disappointed with regard to predic-tive validity and generalizability across product categories(Crowley, Spangenberg, and Hughes 1992). Although Batraand Ahtola (1990) report initial, successful applications oftheir scale in terms of evaluation of specific branded prod-ucts, Crowley, Spangenberg, and Hughes (1992) are unableto replicate the original findings or demonstrate generaliz-ability of the scale to product categories. Product categoriesin the Crowley study scored high on both dimensions of
Batra and Ahtola’s scale, inappropriately appearing in thesame quadrant when represented in a two-dimensionalspace. The study’s results arguably are related to the meth-ods used in the original validation studies. Batra andAhtola’s tests of validity compare their apparent hedonicand utilitarian dimensions of consumer attitudes with eachother or with consumer evaluations of product attribute lev-els. Although it is not methodologically flawed, such a pro-cedure is theoretically inadequate for establishing the valid-ity of a scale purporting to measure separate dimensions ofconsumer attitudes toward product categories and/or brandsin a given category. A scale must be tested within a nomo-logical network that shows its relationship or lack of rela-tionship to other constructs. As a disquieting example, inone series of factor analyses, Batra and Ahtola find that their“hedonic subdimension” loads on the same factor as itemspurporting to measure overall brand attitude, which indictsthe discriminant validity between these two measures. Fur-thermore, Batra and Ahtola do not present evidence linkingtheir scales to a higher-order attitude construct. Although weembrace the two-dimensional view of consumer attitudes,Batra and Ahtola’s results—together with the findings ofCrowley, Spangenberg, and Hughes; Mano and Oliver(1993); and others—call into question their instrument’sreliability and validity.
Our research contributes to the integration of the experi-ential view of consumption in marketing research by devel-oping a rigorously tested, reliable, valid, and generalizablescale to measure the hedonic and utilitarian dimensions ofconsumer attitudes. Following accepted scale developmentprocedures (e.g., Churchill 1979; Gerbing and Anderson1988), we began with a pool of items that represented thedomains of interest and winnowed this pool down to tenitems that displayed sound psychometric properties. In aseries of studies, we demonstrate the scale’s appropriatenessin tests of unidimensionality and reliability as well as dis-criminant, predictive, and nomological validity. We demon-strate predictive validity by plotting scale scores for bothproduct categories and brands in a two-dimensional space;for some brands/products the hedonic dimension may bemore important, for others the utilitarian dimension mayprevail, and for still others both dimensions may be impor-tant (Batra and Ahtola 1990; Kempf 1999). Finally, weplaced our scale within a nomological network by proposingand testing a central route processing model that comparesthe hedonic and utilitarian dimensions to brand attitude.Notably, we present an empirical method we developed forreducing a qualified but lengthy scale to a parsimonious setof items. We describe our scale development process indetail in the following section.
SCALE DEVELOPMENT
Study 1: Initial Item Generation and Selection
We derived an initial pool of adjective pairs from pub-lished research and a pretest of students and professionals.We gave participants definitions (Hirschman and Holbrook1982) of both hedonic and utilitarian (HED/UT) scaledimensions (but not dimension labels) and asked them to listadjectives that would capture these definitions and to pro-vide the polar opposite adjective. We eliminated duplicatesor items found psychometrically inadequate in published lit-erature. We asked half of 608 student subjects from a large
JMR3E.qxdII 7/3/03 9:51 AM Page 311

312 JOURNAL OF MARKETING RESEARCH, AUGUST 2003
Table 1HED/UT ITEMS: INITIAL AND FINAL SCALE STATISTICS
Study 1b
Brand Names Product Categories Study 2c
Item-Total Item-Total Product Itemsa Factor 1 Factor 2 Correlation Factor 1 Factor 2 Correlation Categories
UtilitarianEffective/ineffective .68 .58 .84 .60 .62 .86 .87/.84Helpful/unhelpful .66 .59 .80 .58 .61 .84 .89/.86Functional/not functional .57 .64 .77 .63 .54 .82 .91/.87Necessary/unnecessary .69 .43 .73 .49 .65 .75 .89/.86Practical/impractical .58 .54 .75 .51 .63 .75 .89/.86Beneficial/harmful .69 .46 .75 .47 .68 .76Useful/useless .74 .34 .73 .46 .66 .73Sensible/not sensible .66 .50 .74 .52 .61 .78Efficient/inefficient .69 .47 .74 .49 .63 .78Unproductice/productive .56 .46 .75 .53 .55 .70Handy/not handy .53 .46 .59 .47 .43 .66Problem solving/not problem solving .44 .56 .57 .61 .56 .66
HedonicNot fun/fun –.62 .56 .82 .72 –.48 .84 .98/.85Dull/exciting –.70 .46 .72 .61 –.57 .80 .85/.80Not delightful/delightful –.61 .56 .79 .69 –.46 .81 .86/.81Not thrilling/thrilling –.67 .56 .84 .66 –.51 .80 .82/.77Enjoyable/unenjoyable –.62 .45 .71 .63 –.44 .72 .79/.74Not happy/happy –.57 .66 .83 .73 –.42 .80Unpleasant/pleasant –.66 .45 .74 .61 –.51 .76Not playful/playful –.58 .64 .82 .62 –.52 .76Cheerful/not cheerful –.60 .51 .75 .69 –.43 .76Amusing/not amusing –.57 .40 .64 .61 –.46 .71Not sensuous/sensuous –.47 .57 .68 .60 –.44 .70Not funny/funny –.39 .52 .60 .63 –.32 .65
Explained Varianceb 33% 60% 32% 63% 80%
AVEd
Hedonic 50% 47% 71%Utilitarian 49% 49% 79%
Reliabilityd
Hedonic .92 .91 .95Utilitarian .92 .92 .93
Coefficient AlphaHedonic .95 .95 .95Utilitarian .95 .95 .92
aItems in bold compose the final HED/UT scale.bFrom principal components factor analysis (unrotated solution).cFrom CFA (factor loadings/item-total correlations).dCalculations described by Fornell and Larcker (1981).
North American university to rate one of the followingbrands on the resultant 27, seven-point semantic differentialitems: IBM personal computers, Lay’s potato chips, Hiltonvacation resorts, Wesson cooking oil, Dawn dish detergent,and Nike athletic shoes. We asked the other subjects to rateone product category associated with each brand, with nomention of the brand. We selected categories and brandnames from a pretest of 70 students who were asked to (1)“List products or services purchased predominantly forpleasure/utility,” and (2) “Within that category [referring to(1)], what brand first comes to mind?”
Psychometric analysis. We conducted principal compo-nents exploratory factor analysis (EFA) separately for bothbrands and product categories, and we assessed internal con-sistency and item-to-total correlations separately (Churchill
1979). All items loaded as predicted, save for three itemsdropped because of low item-to-total correlations and factorloadings; deleted pairs were “hedonic/not hedonic,” “utili-tarian/not utilitarian,” and “convenient/not convenient.”Thus, EFA and internal consistency estimates suggested atwo-dimensional scale (HED/UT) with 12 adjective pairsrepresenting each of the hedonic and utilitarian dimensionsof product attitude. Table 1 contains items, factor loadings,item-to-total correlations, reliability, and average varianceextracted (AVE) estimates (Fornell and Larcker 1981).
We assessed unidimensionality using confirmatory factoranalysis (CFA) in LISREL 8 (Jöreskog and Sörbom 1996).The CFA indicated that for both brand names and productcategories, the items loaded as predicted and with minimalcross-loading, providing evidence of unidimensionality
JMR3E.qxdII 7/3/03 9:51 AM Page 312

Hedonic and Utilitarian Dimensions of Attitude 313
3As Bollen (1989) details, the χ2 test for CFAs has many weaknesses.Although throughout the article we present the χ2 test, we rely primarily onGFIs in assessing model adequacy.
4As a reviewer noted, this design does introduce some dependency. How-ever, we chose to maximize generality by having a large number of stimulirated rather than maximize model fit by focusing on one or a few stimuli.
(Gerbing and Anderson 1988). For the two-factor brandname model, χ2 = 901.77 (degrees of freedom [d.f.] = 251,p < .001); goodness-of-fit index (GFI) = .80; normed fitindex (NFI) = .86; nonnormed fit index (NNFI) = .88; andcomparative fit index (CFI) = .90.3 For the two-factor prod-uct category model, χ2 = 1062.16 (d.f. = 251, p < .001);GFI = .77; NFI = .84; NNFI = .87; and CFI = .88. Model fitrepresented a significant improvement over the null modelfor both brands (χ2 = 6110.2 [d.f. = 276]) and product cate-gories (χ2 = 5777.0 [d.f. = 276]).
Study 2A: Scale Reduction
Although the previous development procedure followedpublished recommendations, CFA fit statistics suggestedthat further improvement in the scale was possible. Highinteritem correlations for the two subscales suggested thatitems could be dropped while maintaining reliability. More-over, this scale was too long to be pragmatic for inclusion inmost research. Thus, we reexamined the scale with a newgroup of 400 students at the same university. Subjects ratedtwo randomly assigned product categories (selected fromthe studies of Batra and Ahtola [1990]; Crowley, Spangen-berg, and Hughes [1992]; and Spangenberg, Voss, andCrowley [1997]) on the 24 HED/UT items.4 After elimina-tion of nonrespondents, 706 completed product categoryevaluations were available for analysis.
In Study 1, scale development depended on the evaluationof item-to-total correlations, internal consistency (reliabil-ity), AVE, and unidimensionality. Although the literaturetypically advocates scale purification through elimination ofitems with regard to these characteristics (see DeVellis1991; Spector 1992), no criteria are published regarding par-ing down a psychometrically acceptable but otherwise toolarge set of items. Thus, to reduce scale length, we created aprocedure that uses CFA fit indexes and χ2 difference test-ing. Conducting separate analyses for each subscale, weselected and eliminated the scale item with the lowest item-to-total correlation. We then conducted a χ2 difference testbetween the original CFA model and a CFA model of thereduced scale. In addition to difference testing, we alsonoted GFIs and AGFIs at each step. The GFI will increaseas items are removed; however, AGFI could decrease. If thedifference test provided a significant result and AGFIincreased, we accepted the reduced scale as the better of thetwo. We iterated the process by recomputing item-to-totalcorrelations, deleting the lowest item, fitting a CFA model,and conducting the χ2 difference test. We halted item-removal iterations when one or both of two possible resultsoccurred: (1) the χ2 difference tests showed no differenceand/or (2) the AGFI did not increase. For the hedonic dimen-sion, AGFI hit a plateau at five items (AGFI = .88); thus, weselected this five-item version of the hedonic scale (Table 1).For the utilitarian subscale, the χ2 difference test anddecreased AGFI also suggested a five-item scale (Table 1).
Psychometrically, this ten-item (5 + 5) HED/UT scale per-forms better than the original version (χ2 = 175.06 [d.f. = 34,p < .0001]; GFI = .95; NFI, NNFI, and CFI = .97). Coeffi-cient alpha, composite reliability, and AVE (Fornell and Lar-cker 1981) exceed recommended standards (Table 1).
Second-order relationship. Thus far, we have analyzedthe HED/UT scales separately; here, we test whether the twodimensions link to a higher-order construct (Bollen 1989)by fitting a second-order factor analysis model (Jöreskogand Sörbom 1996). The second-order factor analysis modelsupports our contention that hedonic and utilitarian productattitudes link to a common higher-order construct (χ2 =175.99 [d.f. = 35, p < .0001]; GFI = .95; NFI, NNFI, andCFI = .97). Standardized parameter estimates linking thehigher-order construct to the utilitarian and hedonic con-structs are identical (γ = .24) and significant (p = .032).Because the constructs were correlated (standardized φ =.37), we examined the discriminant validity between ourHED/UT subscales. First, we fit an alternative model withall ten items loading on a single factor. If the two-factormodel is superior, there should be a large difference in theχ2 statistics associated with the two alternative models. Inthis case, the χ2
∆ of 2802.88 (d.f. = 1) was significant withp < .0001. Second, Fornell and Larcker (1981) indicate thatdiscriminant validity is achieved when AVE is greater thanthe squared correlation between the constructs. In this case,AVE estimates were greater than .70, and the squared corre-lation was .14. Finally, Anderson and Gerbing (1988) andBagozzi, Yi, and Phillips (1991) recommend testing whetherthe correlation is less than one. We fit a two-factor modelwith the correlation set equal to one; a χ2 difference test(χ2
∆ = 4.81 [d.f. = 1, p = .0823]) suggests that the correlationbetween constructs is less than unity. Thus, the hedonic andutilitarian measures are distinct (i.e., they capture differentinformation), but they are correlated through a relationshipto a common higher-order construct.
Study 2B: Discriminant Validity
The literature lacks clarity regarding the relationshipbetween involvement and the hedonic and utilitarian dimen-sions of attitude. For example, Mano and Oliver (1993)merge Batra and Ahtola’s (1990) scale with Zaichowsky’s(1985) 20-item involvement scale to model what they termutilitarian and affective dimensions. Kapferer and Laurent(1993) introduce a five-dimension conceptualization ofinvolvement in which one dimension is labeled hedonic. Wecontend that the involvement construct is distinct from thehedonic and utilitarian dimensions of attitude. However, theresearch cited previously questions the discriminant validitybetween hedonic and utilitarian scales and measures ofinvolvement. Thus, we tested discriminant validity usingthree published scales purporting to measure involvement.Scales collected in conjunction with Study 2A were the cog-nitive (PIICOG) and affective (PIIAFF) dimensions ofZaichkowsky’s (1990) personal involvement inventory (PII),Traylor and Joseph’s (1984) measure of involvement, andKapferer and Laurent’s (1993) five-dimension consumerinvolvement profile.
To determine the extent to which the HED/UT subscalescaptured information different from these three measures ofinvolvement, we fit a series of single-factor and two-factor
JMR3E.qxdII 7/3/03 9:51 AM Page 313

314 JOURNAL OF MARKETING RESEARCH, AUGUST 2003
Table 2DISCRIMINANT VALIDITY BETWEEN HED/UT AND MEASURES
OF INVOLVEMENT
Hedonic UtilitarianDimension Dimension
r χ2∆
ar χ2
∆a
PIICognitive .48 1884.25 .78 1102.37Affective .82 289.68 .58 2956.52
CIPb
Importance .39 276.90 .38 278.85Mispurchase .16 493.05 .03 4349.85Symbolism .32 841.54 .12 928.51Hedonic .67 833.70 .27 1331.36Interest .57 320.95 .42 390.13
TJIc .47 1987.47 .22 2460.93
aAll χ2 differences have 1 d.f. with p < .0001.bConsumer involvement profile (Kapferer and Laurent 1993).cConsumer involvement in products (Traylor and Joseph 1984).
Table 3TWO-FACTOR HEDONIC AND UTILITARIAN CFAs USING PRODUCT CATEGORIES
n χ2 d.f. p-Value GFI NFI NNFI CFI αhedonic αutilitarian
Pet rocks 379 230.82 34 .0000 .88 .93 .92 .94 .93 .94Tobacco 341 96.02 34 .0000 .95 .96 .96 .97 .93 .85Shoelaces 379 171.51 34 .0000 .92 .94 .93 .95 .85 .95Blue jeans 377 176.37 34 .0000 .91 .90 .89 .92 .83 .89Athletic shoes 380 259.76 34 .0000 .88 .89 .87 .90 .86 .90Glass figurines 376 201.52 34 .0000 .90 .93 .92 .94 .93 .90Video games 376 160.70 34 .0000 .92 .94 .94 .95 .94 .87Alkaline batteries 377 166.09 34 .0000 .91 .93 .92 .94 .82 .90Paper clips 233 75.01 34 .0001 .94 .94 .96 .97 .83 .85Automobiles 238 81.09 34 .0000 .94 .92 .94 .95 .85 .82Fake mustaches 226 99.23 34 .0000 .92 .93 .94 .95 .89 .88Television sets 199 104.53 34 .0000 .90 .90 .90 .93 .91 .78Plastic fruit 173 65.41 34 .0010 .93 .93 .95 .96 .88 .84Beer/alcoholic beverages 144 100.52 34 .0000 .87 .89 .90 .93 .92 .85Disposable baby diapers 181 58.42 34 .0057 .94 .94 .96 .97 .88 .84Vacation resorts 179 58.84 34 .0052 .94 .93 .96 .97 .89 .82
Average .92 .93 .93 .95 .88 .87
CFA models in LISREL. For example, we fit a single-factormodel with our hedonic items loading on the same factor asthe five items from PIIAFF and compared the fit of thatmodel with a similar CFA with our hedonic subscale load-ing on a different factor than did PIIAFF. If the two-factormodel is superior, there should be a reduction in the χ2 sta-tistic relative to the single-factor model. In every case, thetwo-factor model provided a vastly superior fit (Table 2).Because HED-PIIAFF and UT-PIICOG were correlated(Table 2), we took the additional step of testing whether theconstruct correlations were less than unity (Anderson andGerbing 1988; Bagozzi, Yi, and Phillips 1991). We fit a two-factor CFA model with the correlation between the con-structs fixed at unity (Jöreskog and Sörbom 1996) and foundthat the construct correlation was less than one in both cases(HED: χ2
∆ = 354.13 [d.f. = 1, p < .0001]; UT: χ2∆ = 341.15
[d.f. = 1, p < .0001]). Finally, we compared the AVE with thesquared correlation between the constructs, and in bothcases (HED: .71 > .67; UT: .79 > .61) AVE exceeded thesquared correlation (Fornell and Larcker 1981). Takentogether, this evidence suggests that when used to measure
attitudes of product categories, HED/UT captures informa-tion different from the affective and cognitive dimensions ofproduct category involvement.
Studies 3, 4, and 5: Criterion (Predictive) Validity
Study 3. Study 3 tests whether HED/UT discriminatesamong product categories expected a priori to differ alongthe hedonic and utilitarian dimensions. In selecting cate-gories for the study, we used a three-step process. First, weidentified products that had been used in prior literature (i.e.,Batra and Ahtola 1990; Crowley, Spangenberg, and Hughes1992). The product categories we identified were blue jeans,athletic shoes, automobiles, and vacation resorts; empiricalevidence has shown that these product categories are high inboth utilitarian and hedonic ratings. Second, because priorresearch has failed to identify adequately products thatwould be low in either the hedonic or the utilitarian ratings,we asked 129 students (who were given definitions of thehedonic and utilitarian dimensions) at two North Americanuniversities to identify one product category that would fallinto each of three classifications: (1) high utilitarian/lowhedonic value, (2) low utilitarian/high hedonic value, or (3)low utilitarian/low hedonic value. We then asked students toname five brands in each product category. We selected forfurther study the four categories in each of two hypothesizedquadrants that received the most mentions: low hedonic/high utilitarian (disposable diapers, shoelaces, alkaline bat-teries, and paper clips) and high hedonic/low utilitarian(tobacco, beer, video games, and television sets). This elici-tation produced no usable responses for the low hedonic/lowutilitarian quadrant. Thus, as a third step, we relied on brain-storming to derive categories for this low/low quadrant,which includes plastic fruit, pet rocks, fake mustaches, andglass figurines. We collected evaluations of these 16 productcategories from 567 students in four lab sessions at a largeNorth American university. We randomly assigned subjectsto rate 8 of the 16 product categories using HED/UT andBatra and Ahtola’s (1990) scale. We fit a CFA in LISREL foreach product category to check the performance of HED/UT. These results, which further substantiate the perform-ance of the HED/UT scale, appear in Table 3 along withassociated coefficient alphas.
JMR3E.qxdII 7/3/03 9:51 AM Page 314

Hedonic and Utilitarian Dimensions of Attitude 315
Figure 1CLASSIFICATION OF PRODUCT CATEGORIES ON HEDONIC
AND UTILITARIAN DIMENSIONS
(COMPARISON OF HED/UT AND BATRA AND AHTOLA [1990])
Product Categories Classified Using HED/UT
Product Categories Classified Using Batra and Ahtola (1990)
1
2
3
4
5
6
7
1 2 3 4 5 6 7Hedonic
Quadrant 4
Quadrant 1 Quadrant 2
Quadrant 3
Pet rocks
Fake mustaches
Tobacco
Glass figurines
Plastic fruit
Video gamesBeer
Alkaline batteries
Shoelaces Paper clips
Disposable baby diapers
Television sets
Blue jeans
Athletic shoes
Automobiles
Vacation resorts
Util
itari
an
1
2
3
4
5
6
7
1 2 3 4 5 6 7
Quadrant 1 Quadrant 2
Pet rocks
Fake mustaches
Tobacco
Glass figurines
Plastic fruit
Video gamesBeer
Alkaline batteries
Shoelaces Paper clips
Disposable baby diapers
Vacation resorts
Television sets
Blue jeans
Athletic shoes
Automobiles
Quadrant 4 Quadrant 3
Util
itari
an
Hedonic
To assess predictive validity, we created an x–y plot, fol-lowing Crowley, Spangenberg, and Hughes (1992), andidentified quadrants by scale midpoints. In Figure 1, 14 ofthe 16 product categories plotted as hypothesized. The twomisclassified items had been hypothesized to fall in Quad-rant 4; tobacco actually plotted in the low utilitarian/lowhedonic quadrant, and television sets received high ratingson the utilitarian dimension and the hypothesized hedonicdimension. Analysis of variance indicated that smokers andformer smokers rated tobacco as significantly more hedonic(F = 129.33, p < .001) and utilitarian (F = 53.43, p < .001)than did nonsmokers; mean ratings for smokers thereforeplace tobacco squarely in the high hedonic/low utilitarian
quadrant, as our elicitation suggests. Television sets’ appear-ing in Quadrant 2, though contrary to the elicitation, is con-sistent with research that finds stereo systems high in bothhedonic and utilitarian ratings (Crowley, Spangenberg, andHughes 1992).
After reverse scoring, ratings of the 16 categories usingBatra and Ahtola’s (1990) scale (Figure 1) enabled compar-ison with our HED/UT. Of the 16 product categories, 8 aremisclassified using the Batra and Ahtola scale, including 3of the 4 low hedonic/high utilitarian categories falling in thehigh hedonic/high utilitarian quadrant. Psychometrically,Batra and Ahtola’s scale was inferior to HED/UT; across allproduct categories, coefficient alpha averaged .80 and .77for Batra and Ahtola’s scales, respectively, compared withalpha of .88 and .87 for our HED/UT. The EFA of Batra andAhtola’s scale shows single-factor solutions for 5 of the cat-egories. This psychometric evidence, the superior predictiveability of HED/UT, and critical evaluations by others (Crow-ley, Spangenberg, and Hughes 1992; Mano and Oliver 1993)further support our belief that HED/UT is superior to Batraand Ahtola’s scale.
Study 4. In extending the predictive validity of HED/UTto brand names, we selected one product category from eachquadrant in Figure 1: batteries, athletic shoes, beer, andtobacco. For each category, we compiled the four brandsthat received the most mentions in the Study 3 elicitation.We then asked 142 student subjects from a (different) NorthAmerican university to each rate a set of four randomlyassigned brand name products, one from each category.After eliminating nonrespondents, 500 observations wereavailable for analysis. A multiple-groups CFA again con-firmed the unidimensionality and reliability of HED/UT(χ2 = 324.67 [d.f. = 136, p < .001]; GFI = .90; NFI = .90;NNFI = .91; CFI = .93; and α = .93 [hedonic] and .92[utilitarian]).
Prediction of brand placement on the quadrant map is notstraightforward because of the relationship between a prod-uct category and its associated brands. A person’s evaluationof a product category is a summary construct of the brandsin a category (e.g., Chaudhuri and Holbrook 2001) and mayoperate in several ways. For example, the product categoryevaluation may derive from an evaluation of the prototypicalbrand within the category, or the category evaluation may bean average evaluation of the brands within the category.Regardless of the underlying process, we expect variabilityin subjects’ ratings of brands within a product category. Forexample, if a brand adopts an experiential positioning strat-egy (Park, Jaworski, and MacInnis 1986), it may be posi-tioned higher than competing brands on the hedonic dimen-sion. Thus, it is possible that brands in a single productcategory may fall in different quadrants. Figure 2 shows spe-cific brand locations relative to respective product categorypositions.
In confirmation of our expectation, two product cate-gories had brands that appeared in two quadrants. For bat-teries, Kodak and Duracell are located close together withnearly the same utilitarian rating estimate for the overall cat-egory; relative to the reference, however, Energizer is givennearly equivalent utilitarian ratings but higher hedonic rat-ings, and Radio Shack is given nearly equivalent hedonicratings but lower utilitarian ratings. Across these four prod-uct categories, brand attitudes appear to be associated with
JMR3E.qxdII 7/3/03 9:51 AM Page 315

316 JOURNAL OF MARKETING RESEARCH, AUGUST 2003
Figure 2CLASSIFICATION OF BRAND NAME PRODUCTS ON HEDONIC
AND UTILITARIAN DIMENSIONS USING HED/UT
1
2
3
4
5
6
7
1 2 3 4 5 6 7
Alkaline batteries
Tobacco
Beer
Athletic shoes
Corona
Pabst
BudMiller
MarlboroWinston
Camel
Salem
NikeAdidas
Keds
Reebok
Kodak
Energizer
Radio Shack
Duracell
Hedonic
Util
itari
an
Notes: Triangles indicate average product category ratings (from Figure 1).
the attitude toward the product category, but the number ofbrands included is insufficient to make strong generaliza-tions in this regard. A notable, if unanticipated, finding is thetendency of the brands to vary on the hedonic dimensionmore so than on the utilitarian dimension. This is apparentin the beer and athletic shoe categories and in the batterycategory, with the exception of Radio Shack (utilitarian atti-tudes could result from Radio Shack’s status as the onlystore brand in the study). Tobacco brands vary on the utili-tarian dimension, but as in Study 2B, smokers drive thisdifference.
Study 5. Although Studies 3 and 4 demonstrate predictivevalidity, perhaps a more stringent criterion test of a measureis its usefulness in marketing research. Thus, we measuredsubjects’ hedonic and utilitarian attitudes toward a fictionalbrand of soap (Cue, chosen by pretest [n = 67] as relevant tostudents) after we manipulated brand positioning. We cre-ated a product concept description and two alternativeadvertising concepts with either functional or experientialpositioning. Functional positioning statements stress abrand’s ability to solve consumption-related problems,whereas experiential positioning statements stress a brand’seffects on sensory satisfaction (Park, Jaworski, and MacIn-nis 1986). We exposed pretest subjects to five statements forfunctional positioning and five for experiential positioning.For bath soap, subjects perceived “strong” and “exotic” asfunctional and experiential attributes, respectively, and thuswe chose these words for the positioning statement manipu-lations. Comparative advertising research indicates thatdirect comparative claims are superior for positioning andare most effective when the referent brand is a market leader(Dröge and Darmon 1987). Thus, we used a leading nationalbrand of soap (Ivory) as the referent in direct comparativeadvertisements. In the functional positioning condition, the
advertising concept contained a picture of a cheetah and amock label with the brand’s name and product claims suchas “antibacterial” and “retains skin moisture.” The word“strong” appeared under the picture, and the phrase “AsStrong as Ivory” appeared under the mock label. The stim-uli for the experiential positioning condition were identical,except that a picture of a waterfall replaced the picture of thecheetah and “strong” was replaced with “exotic” wherever itappeared. The HED/UT should measure respective differ-ences ensuing from the experiential and functional position-ing statements. The elaboration likelihood model (ELM)suggests that product category involvement moderates brandratings (Petty, Caccioppo, and Schumann 1983). Thus, wemeasured involvement with the PII; a median split delin-eated high and low involvement groups. Consequently, weemployed a 2 (involvement: high or low) × 2 (positioningstatement: functional or experiential) design.
We randomly assigned students at a large North Americanuniversity (n = 164) who had not participated in our previ-ous studies to lab sessions in which they were exposed toone of the two manipulated conditions. Using Hotelling’s T,a multivariate analysis of variance showed significant resultsfor positioning statement (F = 8.26 [d.f. = 2158, p = .0003])and product category involvement (F = 5.36 [d.f. = 2158, p =.0056]). In support of Dröge’s (1989) finding, interactioneffects were not significant (F = 1.08 [d.f. = 2158, p =.3438]). Investigation of the between-subjects effects indi-cated that the model was significant for the hedonic dimen-sion (F = 8.60 [d.f. = 3159, p < .0001]) but not the utilitar-ian dimension (F = .92 [d.f. = 3159, p < .4322]). In thehedonic model, the main effect for positioning was signifi-cant (F = 15.80 [d.f. = 1159, p < .0001]), as was the maineffect for involvement (F = 10.77 [d.f. = 1159, p = .0013]).As predicted, the mean hedonic attitude was higher in theexperiential positioning condition for both involvementgroups (low F(1, 75) = 5.49 [p = .0219]; high F(1, 75) =10.98 [p = .0009]). Failure to observe differences on the util-itarian dimension suggests that subject responses to brandpositioning advertisements are perhaps more complex thanthe literature has shown. Our Study 4 data suggest thatbrands do not vary much on the utilitarian dimension. Onesuggestion is that functional positioning statements may notbe effective for brand differentiation within homogeneousproduct categories. Study 5 shows that at least on the hedo-nic dimension, the HED/UT scale is capable of capturingdifferences in subjects’ brand attitudes in response to adver-tising positioning statements.
Study 6: Nomological Validity
Attitude toward the brand is a focal construct in attitude-change research (e.g., Brown and Stayman 1992; Homer1990; MacKenzie, Lutz, and Belch 1986; Mittal 1990).Attitude-change thinking is firmly rooted in the ELM (Petty,Caccioppo, and Schumann 1983). The ELM proposes thatattitude change can occur in two ways. The central routedescribes the process of attitude change when message-relevant thinking (i.e., elaboration) is high, and the periph-eral route describes attitude change when message-relevantthinking is low (Petty, Caccioppo, and Schumann 1983). Forexample, when the product is personally relevant, the con-sumer likely spends more time elaborating the message(Petty, Caccioppo, and Schumann 1983). In this stream ofresearch, the central route to persuasion is modeled as the
JMR3E.qxdII 7/3/03 9:51 AM Page 316

Hedonic and Utilitarian Dimensions of Attitude 317
Figure 3CENTRAL ROUTE PROCESSING MODEL FOR NOMOLOGICAL
VALIDITY COMPARISON
Model 1
Central Route Processing Model with One-Dimensional Measure ofAttitude Toward the Brand
γ22
γ11
β31Attitude
toward brand
Affective involvement
Cognitive involvement
Purchase intention
γ22
γ11
β31
Hedonic
β32Utilitarian
Affective involvement
Cognitive involvement
Purchase intention
Hedonic
Model 2
Central Route Processing Model with Hedonic and UtilitarianDimensions of Attitude
chain of effects from advertising exposure to purchase inten-tion (MacKenzie, Lutz, and Belch 1986), and cognitive elab-oration directly antecedes the mediating attitude toward thebrand (e.g., Brown and Stayman 1992; Goldsmith, Lafferty,and Newell 2000) in predicting purchase intent (e.g.,Miniard, Bhatla, and Rose 1990).
The extent to which a measure defines a constructdepends on how well the measure fits into a network ofexpected relationships called a “nomological network”(Nunnally and Bernstein 1994). The central route is such anetwork. Inferences about nomological validity will followif our HED/UT scales have significant relationships withpurchase intent and mediate the relationship between cogni-tive elaboration and purchase intent (Churchill 1995). IfHED/UT is an equal or superior substitute for the Ab meas-ure in the central route processing model, we have evidenceof nomological validity because HED/UT would replace itshigher-order relative in a well-established nomological net-work. Thus, our nomological validity test compares a centralroute processing model using the hedonic and utilitarianconstructs, as measured by our HED/UT scales, with oneincluding Ab (Nunnally and Bernstein 1994; Olney, Hol-brook, and Batra 1991).
We used the central route processing models shown inFigure 3, which are limited versions of the dominant con-ceptualization in brand attitude research in that they focussolely on the central route to persuasion. In Model 1, we
view Ab as directly antecedent to purchase intentions. It iswell established, both theoretically and empirically, that theamount of elaboration is positively associated with involve-ment (Brown and Stayman 1992; Homer 1990; Lord, Lee,and Sauer 1995; Miniard, Bhatla, and Rose 1990; Mittal1990; Petty, Caccioppo, and Schumann 1983). Thus, withcentral route persuasion, involvement can be a proxy forcognitive elaboration (Petty, Caccioppo, and Schumann1983). As MacKenzie and Lutz (1989) note, measures ofcognitions may be weak as a result of low reliability; thus,we measure product category involvement as a proxy forcognitive elaboration and propose in Model 1 that attitudetoward the brand (Ab) depends on product category involve-ment. We used the two-dimensional view of involvement(Zaichkowsky 1990) in which affective involvement is asso-ciated with the personal relevance of the product as a resultof emotional attachment, and cognitive involvement ariseswhen personal relevance is based in logic.
Consistent with prior research regarding the experientialview of consumption (Hirschman and Holbrook 1982) andour arguments and empirical evidence, we conceptualize thehedonic and utilitarian constructs as dimensions of brandattitude. Thus, we propose Model 2, in which we substitutethe hedonic and utilitarian constructs for attitude toward thebrand in the central route processing model. In this compet-ing model, consistent with Study 2B, affective involvementpredicts the hedonic dimension, and cognitive involvementpredicts the utilitarian dimension.5
Method. To compare the proposed central route process-ing models in Figure 3, we selected four brand name prod-ucts that represented each of the four quadrants in Figure 1:Duracell batteries, RCA compact disc (CD) players, Her-shey’s chocolate, and Winston cigarettes (chosen either fromthe elicitation procedure described in Study 3 or from thepretest).6 In controlled lab sessions, student subjects at alarge North American university (n = 264) first completedPII measures (Zaichkowsky 1990) for all four stimuli. Afterparticipating in a 20-minute distraction task, we exposedsubjects to advertisements extracted from published shop-ping circulars. The advertisements had a picture of the brandand its price without any peripheral execution cues about thebrands or references to the offering merchants.7 Because apicture of the product and price are rational message argu-ments (Goldsmith, Lafferty, and Newell 2000), these adver-tisements should be persuasive for those who are highlyinvolved but less so for those who are uninvolved. Thus, per-suasion in this study should occur only along the centralroute. Subsequently, subjects completed a booklet for a sin-gle product with instructions on the outside cover followedby HED/UT, a measure of Ab (MacKenzie, Lutz, and Belch
5We are indebted to the reviewers for suggesting this approach.6Because chocolate candy (high hedonic/low utilitarian) and CD players
(high hedonic/high utilitarian) had not yet been measured with our ten-itemHED/UT, we conducted a pretest with new subjects to confirm that theywould fall in the hypothesized quadrants. Student subjects rated chocolatecandy (n = 64) and CD players (n = 45); results confirmed that these prod-ucts fall cleanly into the expected quadrants.
7As a reviewer noted, involvement is typically viewed as a moderator inthe ELM. As befits a nomological validation study, however, we do not seekto make strong inferences about the attitude formation process. Thus, we donot manipulate advertising stimuli or use image advertisements. It bearsemphasis that more complete models of attitude change recognize theperipheral route to persuasion.
JMR3E.qxdII 7/3/03 9:51 AM Page 317
318 JOURNAL OF MARKETING RESEARCH, AUGUST 2003
Table 4NOMOLOGICAL VALIDITY MODEL PARAMETER ESTIMATES AND MODEL FIT COMPARISON
Standardized Parameter Estimates
Model 1a Model 2b
Duracell RCA Hershey’s Winston Duracell RCA Hershey’s WinstonBatteries CD Player Chocolate Cigarettes Batteries CD Player Chocolate Cigarettes
γ11 .10* .14 .48* .18 .49* .26* .88* .52*γ22 –.14 .17* .44* .52* –.09 .19* .89* .78*β31 .60* .88* .75* .46* .09 .55* .78* .70*β32 — — — — .74* .36* .26* .31*R2 .35 .50 .62 .44 .15 .53 .71 .66
Model Fit Comparison
IndependenceModel
χ2 d.f. p χ2 d.f. GFI NFI NNFI CFI
Model 1a 32.49 8 .0001 580.95 24 .90 .94 .85 .95Model 2b 17.81 16 .3200 858.01 40 .97 .98 .99 .99
BCVL Posterior Probabilities
P(Model 1)c .50 .90 .95
Model 1a .01 .11 .20Model 2b .99 .89 .80
*Parameter estimates significant at α = .01.aCorresponds to Model 1 in Figure 3.bCorresponds to Model 2 in Figure 3.cThe prior probability that Model 1 is the correct model.
8An appendix containing factor loadings, AVE, and reliability estimates(Fornell and Larcker 1981) for all measures used in Study 6 is available onrequest from the first author.
1986; Miniard, Bhatla, and Rose 1990), and a measure ofpurchase intentions (Dodds, Monroe, and Grewal 1991;Netemeyer and Bearden 1992).
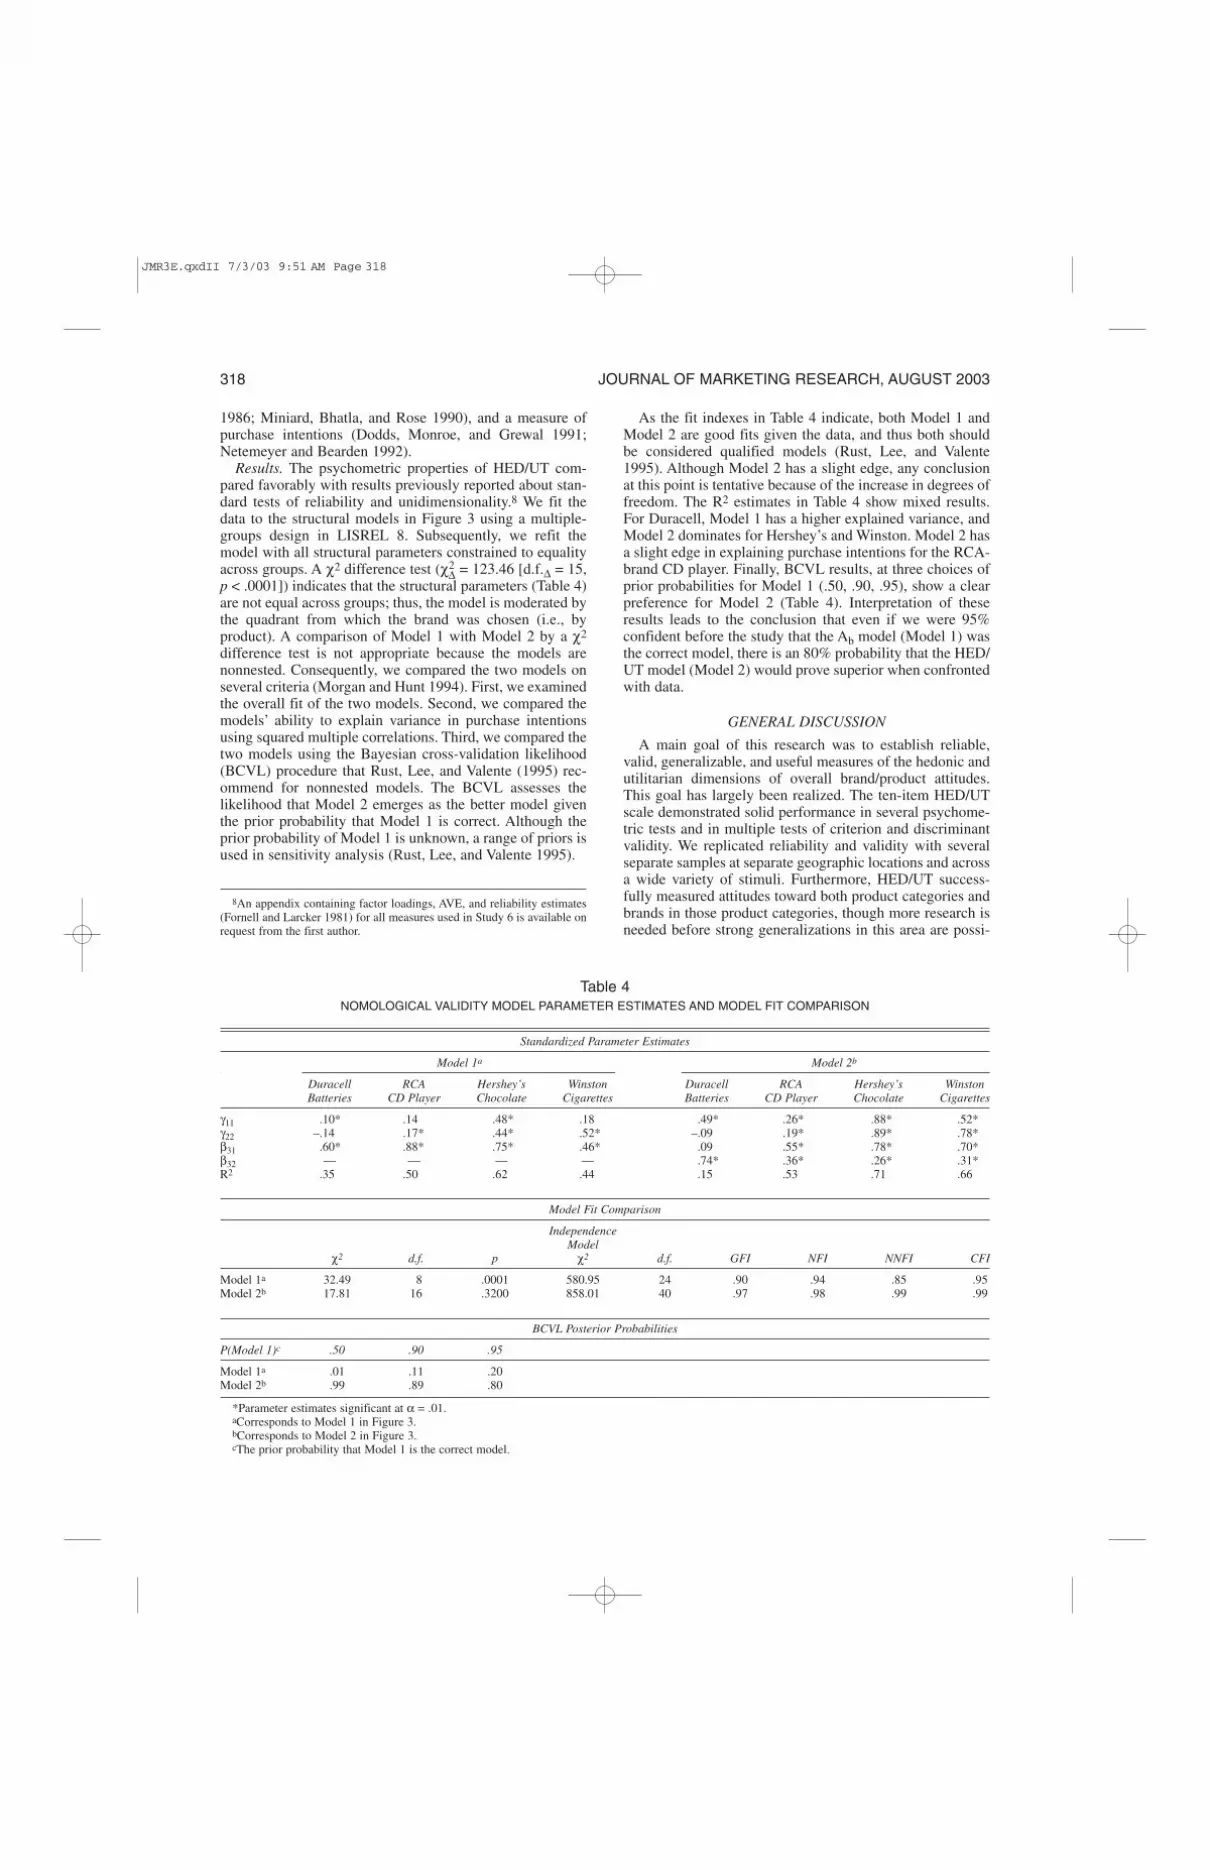
Results. The psychometric properties of HED/UT com-pared favorably with results previously reported about stan-dard tests of reliability and unidimensionality.8 We fit thedata to the structural models in Figure 3 using a multiple-groups design in LISREL 8. Subsequently, we refit themodel with all structural parameters constrained to equalityacross groups. A χ2 difference test (χ2
∆ = 123.46 [d.f.∆ = 15,p < .0001]) indicates that the structural parameters (Table 4)are not equal across groups; thus, the model is moderated bythe quadrant from which the brand was chosen (i.e., byproduct). A comparison of Model 1 with Model 2 by a χ2
difference test is not appropriate because the models arenonnested. Consequently, we compared the two models onseveral criteria (Morgan and Hunt 1994). First, we examinedthe overall fit of the two models. Second, we compared themodels’ ability to explain variance in purchase intentionsusing squared multiple correlations. Third, we compared thetwo models using the Bayesian cross-validation likelihood(BCVL) procedure that Rust, Lee, and Valente (1995) rec-ommend for nonnested models. The BCVL assesses thelikelihood that Model 2 emerges as the better model giventhe prior probability that Model 1 is correct. Although theprior probability of Model 1 is unknown, a range of priors isused in sensitivity analysis (Rust, Lee, and Valente 1995).
As the fit indexes in Table 4 indicate, both Model 1 andModel 2 are good fits given the data, and thus both shouldbe considered qualified models (Rust, Lee, and Valente1995). Although Model 2 has a slight edge, any conclusionat this point is tentative because of the increase in degrees offreedom. The R2 estimates in Table 4 show mixed results.For Duracell, Model 1 has a higher explained variance, andModel 2 dominates for Hershey’s and Winston. Model 2 hasa slight edge in explaining purchase intentions for the RCA-brand CD player. Finally, BCVL results, at three choices ofprior probabilities for Model 1 (.50, .90, .95), show a clearpreference for Model 2 (Table 4). Interpretation of theseresults leads to the conclusion that even if we were 95%confident before the study that the Ab model (Model 1) wasthe correct model, there is an 80% probability that the HED/UT model (Model 2) would prove superior when confrontedwith data.
GENERAL DISCUSSION
A main goal of this research was to establish reliable,valid, generalizable, and useful measures of the hedonic andutilitarian dimensions of overall brand/product attitudes.This goal has largely been realized. The ten-item HED/UTscale demonstrated solid performance in several psychome-tric tests and in multiple tests of criterion and discriminantvalidity. We replicated reliability and validity with severalseparate samples at separate geographic locations and acrossa wide variety of stimuli. Furthermore, HED/UT success-fully measured attitudes toward both product categories andbrands in those product categories, though more research isneeded before strong generalizations in this area are possi-
JMR3E.qxdII 7/3/03 9:51 AM Page 318

Hedonic and Utilitarian Dimensions of Attitude 319
ble. Notably, an additional benefit of our research emerged.In reducing the psychometrically sound but otherwise toolong scale resulting from our initial development efforts, wedeveloped a process for paring down a set of items to arriveat a more parsimonious, manageable scale. This item-reduction process should be of value to future measurementdevelopment efforts.
We demonstrated the value to marketing researchers ofadopting a two-dimensional (hedonic and utilitarian) viewof product attitude by consumers in several ways and acrossmultiple studies. First, we demonstrated discriminant valid-ity between hedonic and utilitarian attitudes and product cat-egory involvement. Second, we showed hedonic and utili-tarian benefits to be important dimensions of overall attitudetoward the brand. Second-order factor analysis indicatedthat the dimensions of HED/UT are related to a higher-orderconstruct, and the nomological validity test supported ourcontention that this construct was brand attitude. Third, pre-dictive validity studies demonstrated that HED/UT could beuseful for assessing brand differences and advertising effec-tiveness. Finally, echoing findings of previous research, welinked the hedonic and utilitarian dimensions of attitude,such as attitude toward the brand, with purchase intentions.In this vein, our nomological validity study demonstratedthat using separate hedonic and utilitarian attitudinal dimen-sions produces a stronger model than using a one-dimensional measure of brand attitude. Thus, our HED/UTscale provides marketing researchers with more worthwhileand complete measures of a complex phenomenon that hastraditionally been measured with a single dimension: Ab.
CONCLUSION
The studies reported herein support the contention thatcomplex processes are at work in the formation of con-sumers’ attitudes toward brands/products and their develop-ment of purchase intentions. Specifically, it appears that thehedonic and utilitarian constructs are separate and importantdimensions of attitude toward products and brands. Limitingthe scope of our nomological model to central route pro-cessing provided evidence of validity while somewhat con-straining the generalizations that can be made. We inten-tionally restricted our development of the model in Study 6;it was designed to test our HED/UT dimensions versus Ab ina small nomological network. Further research shouldexamine incorporating the hedonic and utilitarian dimen-sions of attitude in more complex models with constructssuch as attitude toward the ad (McKenzie, Lutz, and Belch1986) and ad skepticism (Obermiller and Spangenberg1998).
Another concern is the failure of the functional position-ing statement to generate significant differences on the util-itarian dimension in Study 5. It is possible that the compar-ative nature of the positioning statement erased anyperception of utilitarian differences, but we believe this isunlikely. The experiential positioning statement alsoincluded a comparative claim, but significant differencesresulted on the hedonic scale. If the comparative claimerased differences on the utilitarian scale, it should erase dif-ferences on the hedonic scale as well. Regarding the inter-action between positioning statement and involvement, thenonsignificant results are in concert with previous findingsin comparative advertising research (Dröge 1989). Non-
significant effects for level of involvement on the utilitarianscale can be interpreted to mean that customers understandthe utilitarian properties of bar soap, regardless of their levelof involvement. Thus, when products are highly functional,involvement may play less of a role in consumers’ evalua-tions of brands. Accordingly, the product used could be (andis, in our view) responsible for the nonsignificant findings.Additional research dedicated to sorting out the roles ofcomparative statements, involvement, and product/brandchoice would be valued.
The development and introduction of HED/UT—a reli-able, valid, parsimonious, and generalizable scale for meas-uring two important underlying dimensions of consumerattitude—should encourage and facilitate further testing ofpostulations in this stream of research. The measure shouldbe of value to researchers, because greater variance isaccounted for by HED/UT than by traditional one-dimensional brand attitude measures. By conceptualizingconsumer attitudes as comprising two dimensions and byusing HED/UT to capture these dimensions, marketingresearchers can develop a richer understanding of criticalmarketing outcomes.
REFERENCES
Anderson, James C. and David W. Gerbing (1988), “StructuralEquation Modeling in Practice: A Review and RecommendedTwo-Step Approach,” Psychological Bulletin, 103 (3), 411–23.
Bagozzi, Richard P. and Robert E. Burnkrant (1979), “AttitudeOrganization and the Attitude-Behavior Relationship,” Journalof Personality and Social Psychology, 37 (6), 913–29.
———, Youjae Yi, and Lynn W. Phillips (1991), “Assessing Con-struct Validity in Organizational Research,” Administrative Sci-ence Quarterly, 36 (September), 421–58.
Batra, Rajeev and Olli T. Ahtola (1990), “Measuring the Hedonicand Utilitarian Sources of Consumer Attitudes,” Marketing Let-ters, 2 (2), 159–70.
Bollen, Kenneth A. (1989), Structural Equations with Latent Vari-ables. New York: John Wiley & Sons.
Brown Steven P. and Douglas M. Stayman (1992), “Antecedentsand Consequents of Attitude Toward the Ad: A Meta-Analysis,”Journal of Consumer Research, 19 (June), 34–51.
Chandon, Pierre, Brian Wansink, and Gilles Laurent (2000), “ABenefit Congruency Framework of Sales Promotion Effective-ness,” Journal of Marketing, 64 (October), 65–81.
Chaudhuri, Arjun and Morris B. Holbrook (2001), “The Chain ofEffects from Brand Trust and Brand Affect to Brand Perfor-mance: The Role of Brand Loyalty,” Journal of Marketing, 65(April), 81–93.
Churchill, Gilbert A. (1979), “A Paradigm for Developing BetterMeasures of Marketing Constructs,” Journal of MarketingResearch, 26 (February), 64–73.
——— (1995), Marketing Research: Methodological Foundations,6th ed. Fort Worth, TX: Dryden Press.
Crowley, Ayn E., Eric R. Spangenberg, and Kevin R. Hughes(1992), “Measuring the Hedonic and Utilitarian Dimensions ofAttitudes Toward Product Categories,” Marketing Letters, 3 (3),239–49.
DeVellis, Robert F. (1991), Scale Development: Theory and Appli-cations. Newbury Park, CA: Sage Publications.
Dhar, Ravi and Klaus Wertenbroch (2000), “Consumer ChoiceBetween Hedonic and Utilitarian Goods,” Journal of MarketingResearch, 37 (February), 60–71.
Dillon, William R., Thomas J. Madden, Amna Kirmani, andSoumen Mukherjee (2001), “Understanding What’s in a BrandRating: A Model for Assessing Brand and Attribute Effects and
JMR3E.qxdII 7/3/03 9:51 AM Page 319

320 JOURNAL OF MARKETING RESEARCH, AUGUST 2003
Their Relationship to Brand Equity,” Journal of MarketingResearch, 38 (November), 415–19.
Dodds, William B., Kent B. Monroe, and Dhruv Grewal (1991),“The Effects of Price, Brand, and Store Information on Buyer’sProduct Evaluations,” Journal of Marketing Research, 28(August), 307–319.
Dröge, Cornelia (1989), “Shaping the Route to Attitude Change:Central Versus Peripheral Processing Through Comparative Ver-sus Noncomparative Advertising,” Journal of MarketingResearch, 26 (May), 193–204.
——— and Rene Y. Darmon (1987), “Associative PositioningStrategies Through Comparative Advertising: Attribute VersusOverall Similarity Approaches,” Journal of Marketing Research,24 (November), 377–78.
Eagly, Alice H. and Shelly Chaiken (1993), The Psychology of Atti-tudes. Orlando: Harcourt Brace.
Fornell, Claes and David F. Larcker (1981), “Evaluating StructuralEquation Models with Unobservable Variables and Measure-ment Error,” Journal of Marketing Research, 28 (February),39–50.
Gerbing, David W. and James C. Anderson (1988), “An UpdatedParadigm for Scale Development Incorporating Unidimension-ality and Its Assessment,” Journal of Marketing Research, 25(May), 186–92.
Goldsmith, Ronald E., Barbara A. Lafferty, and Stephen J. Newell(2000), “The Impact of Corporate Credibility and CelebrityCredibility on Consumer Reaction to Advertisements andBrands,” Journal of Advertising, 29 (Fall), 43–54.
Hirschman, Elizabeth C. and Morris B. Holbrook (1982), “Hedo-nic Consumption: Emerging Concepts, Methods, and Proposi-tions,” Journal of Marketing, 46 (Summer), 92–101.
Holbrook, Morris B. and Elizabeth C. Hirschman (1982), “TheExperiential Aspects of Consumption: Consumer Fantasies,Feelings, and Fun,” Journal of Consumer Research, 9 (Septem-ber), 132–40.
Homer, Pamela (1990), “The Mediating Role of Attitude Towardthe Ad: Some Additional Evidence,” Journal of MarketingResearch, 27 (February), 78–86.
Jöreskog, Karl and Dag Sörbom (1996), LISREL 8: User’s Refer-ence Guide. Chicago: Scientific Software International.
Kapferer, Jean-Noël and Gilles Laurent (1993), “Further Evidenceon the Consumer Involvement Profile: Five Antecedents ofInvolvement,” Psychology & Marketing, 10 (4), 347–56.
Kempf, DeAnna S. (1999), “Attitude Formation from ProductTrial: Distinct Roles of Cognition and Affect for Hedonic andFunctional Products,” Psychology & Marketing, 16 (1), 35–50.
Kirmani, Amna, Sanjay Sood, and Sheri Bridges (1999), “TheOwnership Effect in Consumer Responses to Brand LineStretches,” Journal of Marketing, 63 (January), 88–101.
Lord, Kenneth R., Myung-Soo Lee, and Paul L. Sauer (1995), “TheCombined Influence Hypothesis: Central and PeripheralAntecedents of Attitude Toward the Ad,” Journal of Advertising,24 (Spring), 73–85.
Machleit, Karen A., Chris T. Allen, and Thomas J. Madden (1993),“The Mature Brand and Brand Interest: An Alternative Conse-quence of Ad-Evoked Affect,” Journal of Marketing, 57 (Octo-ber), 72–82.
MacKenzie, Scott B. and Richard J. Lutz (1989), “An EmpiricalExamination of the Structural Antecedents of Attitude Towardthe Ad in an Advertising Pretesting Context,” Journal of Mar-keting, 53 (April), 48–65.
———, ———, and George E. Belch (1986), “The Role of Atti-tude Toward the Ad as a Mediator of Advertising Effectiveness:
A Test of Competing Explanations,” Journal of MarketingResearch, 23 (May), 130–43.
Mano, Haim and Richard L. Oliver (1993), “Assessing the Dimen-sionality and Structure of the Consumption Experience: Evalua-tion, Feeling, and Satisfaction,” Journal of Consumer Research,20 (December), 451–66.
Miniard, Paul W., Sunil Bhatla, and Randall L. Rose (1990), “Onthe Formation and Relationship of Ad and Brand Attitudes: AnExperimental and Causal Analysis,” Journal of MarketingResearch, 27 (August), 290–303.
Mittal, Banwari (1990), “The Relative Roles of Brand Beliefs andAttitude Toward the Ad as Mediators of Brand Attitude: A Sec-ond Look,” Journal of Marketing Research, 27 (May), 209–219.
Morgan, Robert M. and Shelby D. Hunt (1994), “TheCommitment–Trust Theory of Relationship Marketing,” Journalof Marketing, 58 (July), 20–38.
Netemeyer, Richard G. and William O. Bearden (1992), “A Com-parative Analysis of Two Models of Behavioral Intention,” Jour-nal of the Academy of Marketing Science, 20 (Winter), 49–59.
Nunnally, Jum C. and Ira H. Bernstein (1994), Psychometric The-ory. Hillsdale, NJ: McGraw-Hill.
Obermiller, Carl and Eric R. Spangenberg (1998), “Developmentof a Scale to Measure Skepticism Toward Advertising,” Journalof Consumer Psychology, 7 (2), 159–86.
Olney, Thomas J., Morris B. Holbrook, and Rajeev Batra (1991),“Consumer Responses to Advertising: The Effects of Ad Con-tent, Emotions, and Attitude Toward the Ad on Viewing Time,”Journal of Consumer Research, 17 (March), 440–53.
Osgood, Charles E., George J. Suci, and Percy H. Tannenbaum(1957), The Measurement of Meaning. Urbana: University ofIllinois Press.
Park, C. Whan, Bernard J. Jaworski, and Deborah J. MacInnis(1986), “Strategic Brand Concept–Image Management,” Journalof Marketing, 50 (October), 135–45.
Petty, Richard E., John T. Caccioppo, and David W. Schumann(1983), “Central and Peripheral Routes to Advertising Effective-ness: The Moderating Role of Involvement,” Journal of Con-sumer Research, 10 (September), 135–46.
Rust, Roland T., Chol Lee, and Ernest Valente Jr. (1995), “Com-paring Covariance Structure Models: A General Methodology,”International Journal of Research in Marketing, 12 (November),279–91.
Spangenberg, Eric R., Kevin E. Voss, and Ayn E. Crowley (1997),“Measuring the Hedonic and Utilitarian Dimensions of Attitude:A Generally Applicable Scale,” in Advances in ConsumerResearch, Vol. 24, Merrie Brucks and Deborah J. MacInnis, eds.Provo, UT: Association for Consumer Research, 235–341.
Spector, Paul (1992), Summated Rating Scale Construction: AnIntroduction. Newbury Park, CA: Sage Publications.
Traylor, Mark B. and W. Beanie Joseph (1984), “Measuring Con-sumer Involvement in Products: Developing a General Scale,”Psychology and Marketing, 1 (Summer), 65–77.
Tull, Donald S. and Del I. Hawkins (1993), Marketing Research:Measurement and Method, 6th ed. New York: Macmillan.
Zaichkowsky, Judith Lynne (1985), “Measuring the InvolvementConstruct,” Journal of Consumer Research, 12 (December),341–52.
——— (1990), “The Personal Involvement Inventory: Reduction,Revision, and Application to Advertising,” Journal of Advertis-ing, 23 (December), 59–70.
JMR3E.qxdII 7/3/03 9:51 AM Page 320


