Embed Size (px)
Citation preview
ilable at ScienceDirect
Polymer Testing 34 (2014) 103–112
Contents lists ava
Polymer Testing
journal homepage: www.elsevier .com/locate/polytest
Material properties
Mechanical characterisation of Duraform� Flex for FEAhyperelastic material modelling
Shwe P. Soe a,*, Nick Martindale b, Chris Constantinou b, Michael Robinson a
aCardiff School of Engineering, Queens Buildings, The Parade, Cardiff CF24 3AA, UKbBAE Systems, Advanced Technology Centre, Filton, Bristol BS34 7QW, UK
a r t i c l e i n f o
Article history:Received 1 December 2013Accepted 9 January 2014
Keywords:Additive manufacturingLaser sinteringDuraform� FlexHyperelasticFinite element analysis
* Corresponding author. Tel.: þ44 2920 874173.E-mail address: [email protected] (S.P. Soe).
0142-9418/$ – see front matter � 2014 Elsevier Ltdhttp://dx.doi.org/10.1016/j.polymertesting.2014.01.0
a b s t r a c t
Laser Sintering (LS) is widely accepted as a leading additive manufacturing process with aproven capability for manufacturing complex lattice structures using a group of speciallydeveloped powder based materials. However, to date, very little research has been directedtowards achieving greater knowledge of the properties of the elastomeric materials thatcan be used to produce energy absorbent items such as personalised sports helmets andrunning shoes via the LS technique. This paper will contribute to addressing this knowl-edge gap by examining the material properties and characteristics of Duraform� Flex, acommercially available elastomeric material used for such LS applications.A 3D Systems HiQ machine fitted with a closed loop thermal control systemwas employed,together with a number of the advanced processing options available in the operatingsoftware. In order to measure the mechanical properties of this material, sets of ISOstandard tensile test specimens were fabricated, employing a range of differentmanufacturing processing parameters. The result shows that varying key LS processingparameters such as powder bed temperature, laser power and the number of scanningexposures has a significant impact on the mechanical properties of the resulting part,including its ultimate strength and elongation at break. As LS is a layer manufacturingprocess, part properties are found to vary considerably between the horizontal (X-Y) andvertical (Z) build orientations.The paper demonstrates how the measured tensile stress-strain curve can be transformedinto appropriate hyperelastic material models employing the data curve fitting process inPTC Creo 2.0 Simulate software, and how these material models can be used practically tomatch user requirements for the laser sintered parts, leading to design optimisation forboth bulky solid and lightweight lattice components. The paper concludes with a dis-cussion examining the potential future direction of the research.
� 2014 Elsevier Ltd. All rights reserved.
1. Introduction
Over recent years, innovative examples have beendocumented in the literature about the translation of orig-inal design ideas, developed fromeither artistic imaginationor functional expression, into physical parts via the LS pro-cess [1–5]. However, to date, the design and production of
. All rights reserved.04
such parts has been primarily based on the use of nylon-12powders, as a result of which a significant body of researchfocusing on developing an improved understanding of itsmaterial properties is available to support the design pro-cess [6–12]. Despite the ever increasing usage of the LSprocess, the range of materials available for this process isstill very limited, especiallywhen considering the vast arrayof materials available for injection moulding.
The most commonly used LS material is nylon-12,commercially offered by 3D Systems under the trade

S.P. Soe et al. / Polymer Testing 34 (2014) 103–112104
name of Duraform� PA [13], although similar nylon-12based materials are also provided by other suppliersunder different trade names, including: EOS (PA2200), ALM(PA650) and EXCELTEC (Innov’PA 1550) [14–16]. Furthervariants, again based on nylon-12, utilise the addition ofdifferent types of fillers such as glass beads, or carbon-fibreto achieve stronger and stiffer materials [17–19].
In contrast, only three elastomeric materials arecommercially available: Duraform� Flex from 3D Systems[20], TPE 210-S from Advanced Laser Materials (ALM) [21]and DESMOSINT� X92A-1 from Lehman & Voss & Co[22]. Duraform� Flex is themain focus of this study andwillbe denoted simply as “Flex” hereafter. The material prop-erties as listed on the respective material suppliers’ data-sheets are presented in Table 1.
According to the datasheets, Flex and TPE 210-S mate-rials were released in 2005 whereas DESMOSINT� X92A-1was only recently introduced in 2012, all the materialsaiming to meet a requirement for producing parts withrubber-like flexibility and durability. Typical applications ofsuch parts include (1) prototyping and low volumemanufacturing of athletic footwear, gaskets, hoses andseals, and (2) simulating thermoplastic elastomers, casturethane, silicone and rubber parts and soft-touch over-moulded grips.
Additional information available on the datasheets ofFlex and TPE 210-S suggests that a wide range of Shore Ahardness can be achieved before and after infiltration butno details have been provided for corresponding LS pro-cessing parameters, nor for properties of infiltration ma-terials and techniques employed. The datasheets of Flexand TPE 210-S do not specify in which orientation thespecimens were fabricated but it is understood that thedata reflects test pieces built along the primary scanningdirection (X-axis) only.
The number of established thermoplastic elastomer(TPE) materials available for additive manufacturing (AM)by LS falls short of the six different ranges of thermoplasticelastomers developed for injection moulding [23]. Fig. 1identifies these injection mouldable materials and dem-onstrates the range of hardness that can be accommodatedby selection of the appropriate material. It is anticipated
Table 1Material properties of LS elastomers.
Duraform� Flex TPE 210-S DESMOSINT� X92A-1
Part orientation Notspecified
Notspecified
X – axis Z – axis
Tensilestrength (MPa)
1.8 Notspecified
27 22
Tensilemodulus (MPa)
7.4 8 9 10
Elongationat break (%)
110 110 400 370
Shore Ahardness
45–75 40 92
Initial tearstrength (N/m)
15,100 6000 Not specified
Base material Polyester Nylon PolyurethaneYear of
materialreleased
2005 2005 2012
that development of further AM TPEs in the short to me-dium term will provide access to elastomeric materialswith an increasingly wide range of properties.
Selecting a material based on hardness data alone is,however, insufficient in practical terms for ensuring opti-mum design as hardness is generally only used forcomparative study and quality control purposes. In mostcases, additional rigorous testing needs to be conductedprior to subjecting the materials to the real life environ-ment. To aid material selection, virtual prototyping is a stepthat can be taken to save time and cost before a commit-ment is made to full physical prototyping. Here, virtualprototyping implies the prediction of structural responsethrough employing an appropriate finite element (FE)analysis tool.
This paper presents the range of stress and strain dataachievable by employing different processing parameters,followed by the demonstration of a novel data curve fittingprocedure used to derive material coefficients for hypere-lastic material modelling using PTC Creo 2.0 Simulate FEsoftware.
2. Overview of LS machine and process capability forelastomeric powders
2.1. Equipment
The HiQ LS machine employed in the study is fitted witha 40 W CO2 laser and has an X – Y build chamber size of330 mm � 280 mm, and a maximum build height of420 mm. When the machine was procured, the tempera-ture control was configured as an open loop system. Thissystemmade it difficult to achieve a consistent powder bedtemperature from build to build or along the Z heightwithin a build. Such temperature variation was found toaffect part quality producing either a soft part at oneextreme, or a caked build (part cannot be cleaned due tovery hard surrounding powder) at the other extreme. Themachine was subsequently upgraded to enable closedlooped temperature control, integrated with a black bodyinfrared calibrator. Manufacturing runs have been suc-cessfully completed for both Flex and TPE210-S powderswith this revised, closed loop machine configuration.
2.2. Temperature calibration techniques
Since different LS machines possess different thermalcharacteristics, it is common practice to calibrate thepowder bed temperature for a specific machine. Experiencesuggests that a temperature variation of 4–5 �C can existfrom one system to another for the same powder. Thepowder bed temperature can be calibrated in two ways.The technique offered by 3D Systems is to raise the tem-perature by 1–2 �C (starting from the recommended tem-perature) in every 3–4 layers until glazing of the powderbed is observed. A temperature 12–15 �C lower than theglazing temperature is then selected. Alternatively, thetechnique offered by an alternative machine manufacturer,EOS, involves placing an array of (50 mm � 50 mm) crossshaped parts across the powder bed and starting the build2–3 �C lower than the recommended temperature. After a

Fig. 1. Shore hardness of individual TPE group [23].
Table 2LS process parameters – Duraform� Flex.
Parameters Defaultvalue
Experimentalvalue used
Laser power (W) 9 12–18Scanning speed (mm/s) 5080 5080Scan spacing (mm) 0.15 0.15Number of scan exposures 1 1–4Layer thickness (mm) 0.1 0.1Powder bed temperature (�C) 153 151–156Powder feed temperature
(�C)90 90
Roller speed (mm/s) 305 177–305Hatch style X and Y X and Y
Fig. 3. Build layout of tensile specimens (X-axis and Z-axis).
S.P. Soe et al. / Polymer Testing 34 (2014) 103–112 105
few layers of build, the crosses are found to curl up, espe-cially at the corners. The temperature is then raised byanother 2–3 �C depending on the severity of the curling andanother layer of crosses built. The build temperature isselected 1–2 �C above the point where no signs of curlingare observed.
The method offered by EOS is preferred and applied inthis research because, firstly, it is easier to observe the partcurling than to spot glazing on the power bed and, sec-ondly, the crosses can be placed at any height and any-where in the build (even when the machine is running),allowing the machine operative to monitor the tempera-ture stability. Thirdly, this method is suitable for any newpowder under research, even when there is a lack of priorknowledge regarding a suitable temperature range. Fromexperience, all LS powders are temperature sensitive and1–2 �C can have a significant impact on overall part quality.From a research point of view, full confidence can only beachieved when test data is obtained from a machine withfull thermal stability.
2.3. Operating parameters
The operating parameters for each material offered by3D Systems are readily available in the machine operating
Fig. 2. Detailed dimensions of the tensile specimen in mm (thickness,2 mm).
software (version 3.45). The process parameters providedfor Duraform� Flex are used as a starting point, shown asthe default values in Table 2, along with the experimentalparameters employed in this research. Here it should benoted that the machine used for this work had an advancedfeature vital to carrying out this research, namely theability to allow multiple scanning exposures (up to 10).Another important feature is the ability to scan the part inboth the X and Y directions in alternate layers, thusequalising part properties in each of these directions andensuring similar shrinkage in both.
3. Experimental procedure
3.1. Build preparation
Unlike other LS materials such as Duraform� PA orCastform� PS powders [13], new supplies of Flex powderare observed to be lumpy and slightly sticky. Continuedobservation suggests that both new and recycled powdersneed fresh sieving before use, as the powder becomeslumpy again during storage. It is also notable that themaximum recommended roller speed was nearly twicethat for the Duraform� PA material. Due to the effect ofstatic charge a trail of soft powder lumps was created on
Fig. 4. A fabricated tensile specimen.

Table 3Process parameters and properties of parts produced in X-axis and Z-axis.
Laser power (W) No of scanning exposures Part orientation Tensile strength at break (MPa) Maximum elongation at break (%)
12 1 X 3.1 21012 4 X 8.9 78012 4 Z 5.7 200
15 1 X 4.2 27015 2 X 7.8 66015 4 X 12.5 78015 1 Z 0.6 3015 2 Z 4.1 100
18 1 X 5.5 380
S.P. Soe et al. / Polymer Testing 34 (2014) 103–112106
the powder bed immediately after the roller passed, how-ever this did not seem to have a negative effect on thesintering process, indeed, trials using a lower roller speedwere observed to create more lumpy powder. Therefore,the maximum roller speed was maintained for all testbuilds.
3.2. Test specimen details
Detailed information regarding dimensions and testingspecifications for the tensile testing of rubber and TPEmaterials can be found in BS ISO 37:2011 [24]. The di-mensions of the specimens used in these trials are shownin Fig. 2 which corresponds to BS ISO 37:2011 Type 1.
3.3. Specimen fabrication
One of the objectives of this work is to evaluate themechanical properties of parts using different build orien-tations. In this respect, the specimens are oriented in eitherthe X-axis (horizontal) or Z-axis (vertical) of the buildchamber, as shown in Fig. 3. Since an X and Y hatch scan-ning strategy has been applied, the part orientation alongthe Y-axis is equivalent to that of the X-axis, and is thusomitted in this study. To provide the data to support thisproject, more than 15 builds were carried out under a va-riety of conditions. As a starting point, the trial builds werebased on the default processing parameters shown in Table2. In later builds, several key parameters such as powder
Fig. 5. Tensile stress-strain graph of two specimens showing repeated straincycles and single pull to failure (LP – 12 W, NSE – 4, X – axis).
bed temperature, laser power and the number of scan ex-posures were varied depending on the test results observedfrom the prior builds. The laser power and number ofscanning exposures are henceforth referred to as “LP” andNSE” respectively. It was observed after each build that theremaining powder was slightly sticky, similar to the feel ofa soft rubber part, and it was found to be easier to clean theparts as soon as the build was completed and remained hot,rather than allowed to cool to room temperature. Anexample of the fabricated tensile test specimens is shownin Fig. 4.
3.4. Testing
Using a Shimadzu (AG-50kNG) mechanical testing ma-chine, the fabricated tensile specimens (three for eachprocess condition) were subjected to a quasi-static loadingrate of 500 mm/min in accordance with the BS ISO 37:2011recommendation [24]. Repeated loading cycles were alsoconducted so that the hysteresis effect and stress-softeningbehaviour for each cycle could be observed. During tensiletesting, accurate strain data was recorded using digitalimage correlation.
4. Experimental results
Table 3 contains the process parameters and propertiesof tensile parts produced along the X and Z axes. Figs. 5–9
Fig. 6. Tensile stress-strain graph of two specimens showing repeated straincycles and single pull to failure (LP – 12 W, NSE – 4, Z – axis).

Fig. 7. Tensile stress-strain graph of two specimens showing repeated straincycles and single pull to failure (LP – 15 W, NSE – 2, X – axis).
S.P. Soe et al. / Polymer Testing 34 (2014) 103–112 107
show the individual stress – strain graphs for samplesprocessed under varying conditions, including differentlaser powers (i.e. 12W,15W), the correspondingmaximumnumber of scanning exposures (NSE – 2 and NSE – 4) andthe orientation in which the parts were laid during thebuild (X and Z – axes). A range of repeated strain cyclesfrom 10% to 600% are also shown, together with the resultsof a second, equivalent sample subjected to a single pull tofailure.
5. Analysis of results
5.1. Effect of temperature
All the data shown in Table 3 and Figs. 5–9 were takenfrom test builds run with a fixed powder bed temperatureof 155 �C. This temperature was chosen because earliertrials at lower temperatures, such as 153 �C, resulted inparts that were found to be very weak, especially in the Z-axis. In contrast, for higher temperature builds at 156 �C,difficulty was found in separating the parts from the hardsurrounding powder. Since the aim of the study was to findthe optimum processing parameters for building latticestructure parts, a powder bed temperature of 155 �C wasmaintained as one of the optimum parameters andemployed in all further experimental builds.
5.2. Effect of laser power and scanning exposure
Test parts were built to assess the effect of variation inthe laser power and NSE. For all parts the powder bedtemperature used was 155 �C. Three different laser powers;12 W, 15 W and 18 W, were considered together with NSEup to 4.
In Table 3, selected experimental results are shown inorder to highlight the similarities and differences of the endproperties achievable by varying the laser power and NSE.The values of tensile strength at break (TSb) and elongationat break (Eb) with single exposures (NSE-1) shows that theparts produced at a laser power of 15 W have a higher TSband Eb than for 12 W. Similarly, those parts produced at a
laser power of 18 W have higher TSb and Eb than 15 W.However, under close inspection, the specimens fabricatedwith 18 W laser power were found to suffer from uneventhickness. In the case of the tensile bar specimens, thewider ends had an increased thickness compared to thenarrower (middle) section. However, even the thicknessincrease in the middle section (compared to nominal2 mm) was greater than the Z-offset compensation limit(0.25 mm) of the machine. On the basis of these observa-tions, no further manufacture at 18 W was undertaken andevaluation of the effect of NSE, was based on 12Wand 15Wlaser powers.
Study of the effect of the number of scanning exposureswas limited to NSE – 4. Although the machine softwareallows the use of an NSE up to 10, it was considered that:
� NSE up to 4 would be sufficient to show any trends� Wewould intuitively expect any effect of increasing NSE
to taper off at higher levels of NSE� NSE has a direct impact on manufacturing time so there
is a strong motivation to keep it as low as practicable.
It can be seen in Table 3 that the TSb and Eb increasedramatically as the NSE increases for all selected laserpowers. Specifically at 12 W, both TSb and Eb increasedabout 3 times when using an NSE of 4 compared to a singleexposure (NSE – 1). A similar trend can be seen for 15 Wlaser power, where the TSb and Eb increase successivelyfrom a NSE of 1 to 2 and then to 4, although not in a linearfashion (the increases in structural properties diminishingwith increasing NSE). It also shows that the use of increasedNSE has a major impact on the properties of parts built inthe Z-axis. Comparison of test results for parts manufac-turedwith NSEs of 1 and 2 at a laser power of 15W in the Z-axis, show the TSb has increased seven times, where Eb hasincreased three times. The results indicate that there is aclear opportunity to customise the properties of the sin-tered material to meet specific requirements, based oncareful selection of laser power and number of scanexposures.
The results suggest that the NSE value has a significantimpact on the tensile strength and elongation at break,however there are also significant practical implicationswhen considering the use of multiple scanning exposures.The first implication is that the time for sintering increaseslinearly with NSE, and this may limit the size and density ofcomponents that can be manufactured within realisticturnaround times. The second factor is that multiplescanning exposures can lead to part inaccuracy. This phe-nomenon can be related to the visual observation madeduring the sintering stage where, after the first laserexposure, the fluffy powder was seen to become level anddense. After the second exposure, the sintered area be-comes darker and a shallow cavity is formed and found toget progressively deeper after each successive exposure,but at a reducing rate. The depth of cavity is also found tovary depending on the process parameters (NSE and LP)and the cross sectional area. As the powder is fluffy, thenewly laid powder is unable to completely cover the deeper

Fig. 8. Tensile stress-strain graph of two specimens (LP – 12 W, NSE – 4, X –
axis and Z – axis).
S.P. Soe et al. / Polymer Testing 34 (2014) 103–112108
cavities and, as a result, the previously sintered layer is stilltransparent in some areas. In an attempt to remedy theproblem, the powder feeding dosage and the roller speedwere adjusted but no improvement was evident. As aresult, the bottom of the part gets progressively thicker asNSE increases, which is a typical observation of thoseworking with LS, who term this phenomenon “bonus-Z”,the severity of which is found to depend on the geometry ofthe part. Observation of fabricated parts suggests that apart with a large flat area can be covered with sticky cakedpowder at the bottom, whereas the round geometries (i.e.3 mm diameter) which are built along the X-axis, can beseen to exhibit oval shapes. Although the Z-axis compen-sation limit of the machine may accommodate thicknesschanges of up to 0.25 mm, higher laser powers such as15W, in combinationwith the use of multiple scanning canincrease such thickness variations up to 0.5 mm.
5.3. Effect of build orientation
Fig. 3 depicts the orientation of parts manufactured inthe X and Z-axis. The differences in the stress-strain char-acteristic between the two axes is significant, as shown inFig. 8, and this remains true for all combinations of pro-cessing parameters considered. This anisotropic charac-teristic should be taken into account in the design process.
Fig. 9. Tensile stress-strain graph of three specimens showing the level ofrepeatability along Z – axis (LP – 15 W, NSE – 2, Z – axis).
In addition, the use of increased NSE is a necessity toimprove the overall performance of a part, particularlywhen the part is oriented along the Z-axis.
5.4. Build repeatability
Fig. 9 shows the corresponding stress and straincurves of three parts, from the same build (LP – 15 W,NSE – 2), aligned with the Z-axis. The curves demonstratethe variability of both TSb and Eb between nominallyidentical parts, and highlight the level of repeatability inthe part properties likely to be achieved. This variabilityis an inherent feature of the additive manufacturingprocess.
6. Relevance to design practice
6.1. LS design opportunities
Additive Manufacturing (AM) processes allow designersto express their design intent freely, not bounded by con-ventional manufacturing rules. The process has been sup-ported by the development of specialist CAD software forbuilding cellular lattice structures. These techniques enablethe creation of biomedical scaffolds, surgical implants andstrong, lightweight structures for applications in aerospaceand motor racing [25–28].
The application of numerical optimisation techniquesprovides a means of developing efficient lattice designs.This process generally utilises FEA as a platform for theoptimisation process and relies on the availability of accu-rate material data input. If the application involves the useof a hyperelastic material where large scale structuraldeformation is expected, then the decision as to whichmaterial model to use needs careful consideration. Thefollowing section explains how material test data is trans-lated into a suitable hyperelastic material dataset usingCreo Simulate software.
6.2. Hyperelastic material and FEA modelling
Hyperelastic material models are typically charac-terised by different forms of strain energy (density)functions [29]. These functions are expressed mathemati-cally in terms of three stretched invariants or principlestretched ratios, derived from testing the material underdifferent types of loading. In the Creo Simulate softwaresix hyperelastic material models are supported whichallow test data input of four different types of loading(uniaxial tension, equibiaxial tension, planar tension andvolumetric compression, (i.e. hydrostatic pressure)) [30].After entering the engineering stress and strain values, thesoftware uses a Least Square Fitting Algorithm to calculatethe material coefficients and provides an option to auto-matically choose the material model with the best fitbased on the RMS error. If more than one test is entered,then the data from all of the tests are considered equallywhen determining the material coefficients. On comple-tion of the analysis, the software reports true stress andtrue strain data [31].
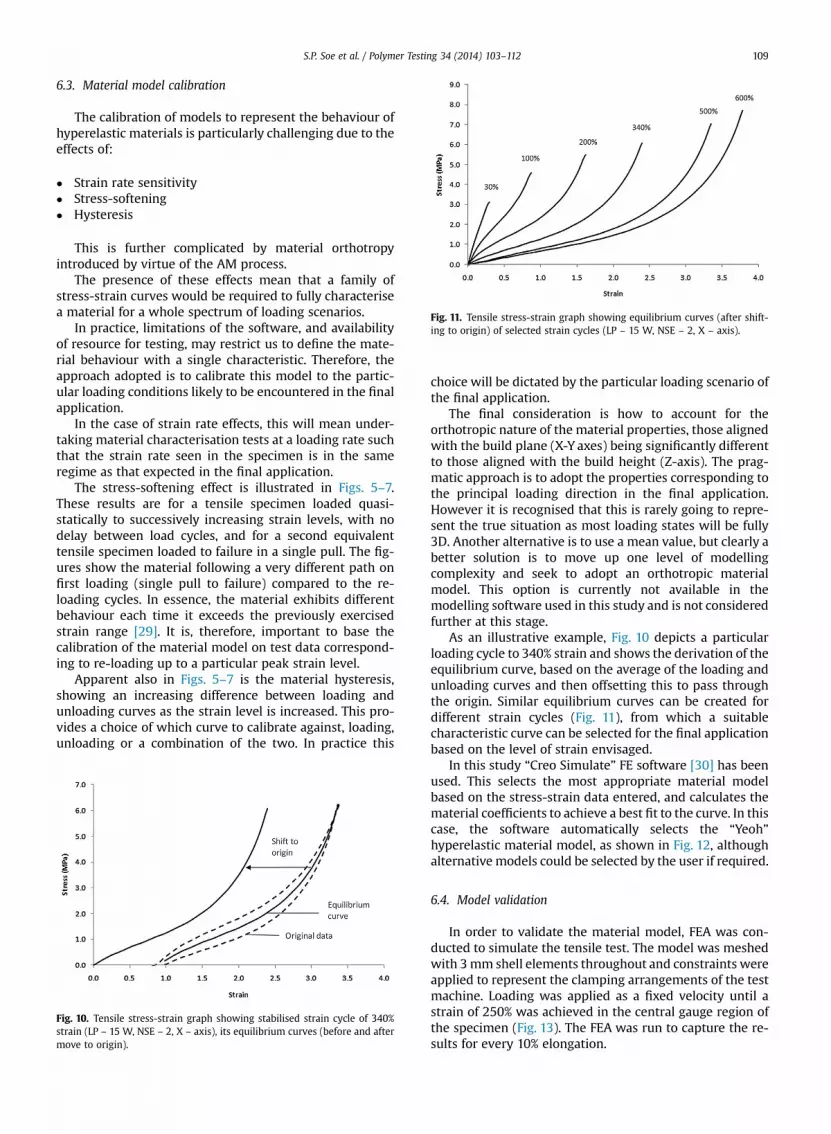
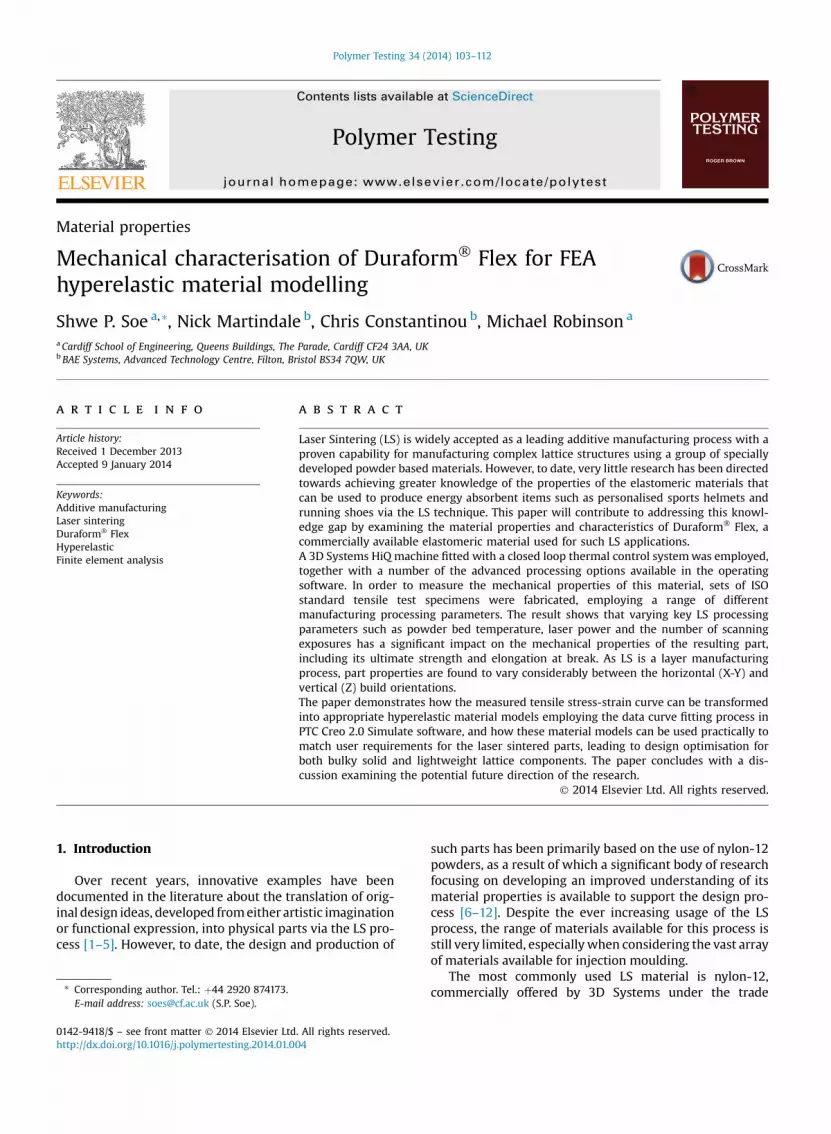
Fig. 11. Tensile stress-strain graph showing equilibrium curves (after shift-ing to origin) of selected strain cycles (LP – 15 W, NSE – 2, X – axis).
S.P. Soe et al. / Polymer Testing 34 (2014) 103–112 109
6.3. Material model calibration
The calibration of models to represent the behaviour ofhyperelastic materials is particularly challenging due to theeffects of:
� Strain rate sensitivity� Stress-softening� Hysteresis
This is further complicated by material orthotropyintroduced by virtue of the AM process.
The presence of these effects mean that a family ofstress-strain curves would be required to fully characterisea material for a whole spectrum of loading scenarios.
In practice, limitations of the software, and availabilityof resource for testing, may restrict us to define the mate-rial behaviour with a single characteristic. Therefore, theapproach adopted is to calibrate this model to the partic-ular loading conditions likely to be encountered in the finalapplication.
In the case of strain rate effects, this will mean under-taking material characterisation tests at a loading rate suchthat the strain rate seen in the specimen is in the sameregime as that expected in the final application.
The stress-softening effect is illustrated in Figs. 5–7.These results are for a tensile specimen loaded quasi-statically to successively increasing strain levels, with nodelay between load cycles, and for a second equivalenttensile specimen loaded to failure in a single pull. The fig-ures show the material following a very different path onfirst loading (single pull to failure) compared to the re-loading cycles. In essence, the material exhibits differentbehaviour each time it exceeds the previously exercisedstrain range [29]. It is, therefore, important to base thecalibration of the material model on test data correspond-ing to re-loading up to a particular peak strain level.
Apparent also in Figs. 5–7 is the material hysteresis,showing an increasing difference between loading andunloading curves as the strain level is increased. This pro-vides a choice of which curve to calibrate against, loading,unloading or a combination of the two. In practice this
Fig. 10. Tensile stress-strain graph showing stabilised strain cycle of 340%strain (LP – 15 W, NSE – 2, X – axis), its equilibrium curves (before and aftermove to origin).
choice will be dictated by the particular loading scenario ofthe final application.
The final consideration is how to account for theorthotropic nature of the material properties, those alignedwith the build plane (X-Y axes) being significantly differentto those aligned with the build height (Z-axis). The prag-matic approach is to adopt the properties corresponding tothe principal loading direction in the final application.However it is recognised that this is rarely going to repre-sent the true situation as most loading states will be fully3D. Another alternative is to use a mean value, but clearly abetter solution is to move up one level of modellingcomplexity and seek to adopt an orthotropic materialmodel. This option is currently not available in themodelling software used in this study and is not consideredfurther at this stage.
As an illustrative example, Fig. 10 depicts a particularloading cycle to 340% strain and shows the derivation of theequilibrium curve, based on the average of the loading andunloading curves and then offsetting this to pass throughthe origin. Similar equilibrium curves can be created fordifferent strain cycles (Fig. 11), from which a suitablecharacteristic curve can be selected for the final applicationbased on the level of strain envisaged.
In this study “Creo Simulate” FE software [30] has beenused. This selects the most appropriate material modelbased on the stress-strain data entered, and calculates thematerial coefficients to achieve a best fit to the curve. In thiscase, the software automatically selects the “Yeoh”hyperelastic material model, as shown in Fig. 12, althoughalternative models could be selected by the user if required.
6.4. Model validation
In order to validate the material model, FEA was con-ducted to simulate the tensile test. The model was meshedwith 3mm shell elements throughout and constraints wereapplied to represent the clamping arrangements of the testmachine. Loading was applied as a fixed velocity until astrain of 250% was achieved in the central gauge region ofthe specimen (Fig. 13). The FEA was run to capture the re-sults for every 10% elongation.

Fig. 12. Creo Simulate Hyperelastic Material curve fitting process window showing uniaxial stress and strain input (left), the fitted curve (middle), best fitmaterial model and coefficients (right).
S.P. Soe et al. / Polymer Testing 34 (2014) 103–112110
Fig. 14 shows a comparison of the (engineering) stress-strain curve (converted from true stress-strain data)generated from FEA with the stress-strain curve from theexperimental (engineering) stress-strain data. It shows thata high level of agreement has been achieved.
Fig. 13. (A) Model showing fixed end and pull end sections, (B) Fully meshed mod
7. Discussion and future research
In the previous section, it was shown that a materialmodel can be derived which closely follows the experi-mental data, lending confidence that these material
el (C) Deformed model showing VonMises (True) stress at 100% elongation.

Fig. 14. A comparison of stress-strain (Experimental) curve vs. the FEA (Yeohmodel) stress-strain curve.
S.P. Soe et al. / Polymer Testing 34 (2014) 103–112 111
coefficients can be applied for the analysis of real designs toprovide a means of assessing performance. Similarly, ten-sile curves for different load scenarios, materials ormanufacturing conditions can be processed to providecorresponding material models and coefficients.
However, it is recognised that the current software limitsapplicability to loading scenarios that are predominantlyuni-directional due to the assumption of isotropic proper-ties, i.e. it will not account for the large difference betweenproperties in the build plane direction compared to thosealong the build height. This large difference between the“in-plane” and “through-thickness” properties, combinedwith the modification to properties that can be achieved byalteration to the manufacturing process parameters pro-vides huge scope for tailoring properties to meet specificstiffness and strength requirements. In addition, LS is arelatively flexible process since variable process parameterscan be assigned on a part by part basis within a build,segment bysegment basiswithin a part or on a layer by layerbasis along the Z-height. This flexibility facilitates designoptimisation in both solid and lattice components. Solidcomponents can be divided into different volumes anddifferent LS process parameters applied to each so as toachieve soft regions and hard regionswherever needed. Thesame approachmaybe applied to lattice components but, inaddition, the element shapes, sizes, and densities of latticestructures can be altered to provide further opportunities tooptimise structures.
In this study, the investigation of material properties hasbeen limited to tensile data from both single pull andassociated strain cycling tests. In future research, the au-thors intend to extend the range of tests to consider othertypes of loading such as biaxial, compression and planar.
A specific focus of future research will also be to extendthese initial studies in order to develop an improved un-derstanding on the life of the powder in relation to buildtime and build congestion, with the aim of better control-ling part quality and maintaining build consistency.
8. Conclusions
The research identified that, while a range of TPE ma-terials are available for use in the injection moulding
process, the availability of TPE materials for LS remainscomparatively limited. As a result, it is anticipated that asthe range of TPE materials for LS increases in the short tomedium term, so the range of available material propertieswill expand allowing a broader range of applications to beconsidered. In addition, the information available from thesuppliers’ datasheets for the current materials was found tobe insufficient for design purposes. This research was car-ried out to fill this knowledge gap by identifying andquantifying appropriate processing parameters followingISO standard procedures for rubber and TPE materials.
The HiQ machine integrated with a closed loop thermalmanagement system was found to provide accurate tem-perature control. Using this system, a powder bed tem-perature of 155 �C was adopted as an optimum value. Atthis fixed temperature, the strength and elongation tobreak of the Flexmaterial could be altered bymodifying thenumber of scanning exposures and the laser power, eitherin combination or independently. However, it was foundthat there was an upper limit to the processing parametersabove which part quality was sacrificed, typically a laserpower >15 W combined with scanning exposures >2.
The Flex parts for all build orientations behave as typicalelastomeric components in exhibiting stress-softening andhysteresis effects under repeated strain cycles. It has beendemonstrated that, for a selected strain cycle, an equilib-rium curve can be generated and FEA software used toobtain a suitable hyperelastic material model via the curvefitting procedure within the Creo Simulate software. Averification analysis showed that the FEA material modelcan closely replicate the experimental data.
This article aims to offer an interesting practical insightto both material suppliers and LS users into how a powdersystem with relatively unknown parameters can be sys-tematically fine tuned to optimise its properties and pa-rameters for processing, testing and verification. Likewise,it demonstrates novel ways for design engineers and FEAspecialists to work collaboratively with material suppliersand LS practitioners in order to achieve improved outcomesfrom personalised manufacturing and high level rapidprototyping processes.
Acknowledgement
We would like to thank BAE Systems, Advanced Tech-nology Centre for part funding the project upon which thisarticle is based, for sharing their knowledge and in kindlygiving us permission to present our experimental findings.
References
[1] I. Gibson, D.W. Rosen, B. Stucker, Additive ManufacturingTechnologies: Rapid Prototyping to Direct Digital Manufacturing,Springer, 2010.
[2] C.K. Chua, G.K. Leong, C.S. Lim, Rapid Prototyping: Principles andApplications, World Scientific Publishing, 2010.
[3] Materialise. MGX catalogue Available at: http://www.mgxbymaterialise.com (accessed 01.12.13).
[4] 3D Systems. Freedom of Creation Products Available at: http://www.freedomofcreation.com (accessed 01.12.13).
[5] J.J. Crookston, A.C. Long, G.A. Bingham, R.J.M. Hague, Finite-elementmodelling of mechanical behaviour of rapid manufactured textiles,Proceedings of the Institution of Mechanical Engineers, Part L:Journal of Materials Design and Applications 222 (1) (2008) 29.

S.P. Soe et al. / Polymer Testing 34 (2014) 103–112112
[6] G.V. Salmoria, P. Klauss, R.A. Paggi, L.A. Kanis, A. Lago, Structure andmechanical properties of cellulose based scaffolds fabricated byselective laser sintering, Polymer Testing 28 (6) (2009) 648.
[7] M. Vesenjak, L. Krstulovi�c-Opara, Z. Ren, �Z. Domazet, Cell shapeeffect evaluation of polyamide cellular structures, Polymer Testing29 (8) (2010) 991.
[8] H. Zarringhalam, N. Hopkinson, N.F. Kamperman, J.J.D. Vlieger, Ef-fects of processing on microstructure and properties of SLS Nylon12, Material Science and Engineering: A 435 (2006) 172.
[9] B.V. Hooreweder, F.D. Coninck, D. Moens, R. Boonen, P. Sas, Micro-structural characterization of SLS-PA12 specimens under dynamictension/compression excitation, Polymer Testing 29 (3) (2010) 319.
[10] B.V. Hooreweder, D. Moens, R. Boonen, J.P. Kruth, P. Sas, On thedifference in material structure and fatigue properties of nylonspecimens produced by injection molding and selective laser sin-tering, Polymer Testing 32 (5) (2013) 972.
[11] S. Dupin, O. Lame, C. Barrès, J.Y. Charmeau, Microstructural origin ofphysical and mechanical properties of polyamide 12 processed bylaser sintering, European Polymer Journal 48 (9) (2012) 1611.
[12] R.D. Goodridge, R.J.M. Hague, C.J. Tuck, Effect of long-term ageing onthe tensile properties of a polyamide 12 laser sintering material,Polymer Testing 29 (4) (2010) 483.
[13] 3D Systems. Duraform� PA material datasheet. Available at: http://www.3dsystems.com (accessed 01.12.13).
[14] EOS Gmbh. PA2200 material datasheet. Available at: http://www.eos.info (accessed 01.12.13).
[15] Advanced Laser Materials (ALM). PA650 material datasheet. Avail-able at: http://alm-llc.com/index.shtml (accessed 01.12.13).
[16] Exceltec. Innov’PA 1550 material datasheet. Available at: http://www.exceltec.eu/product.html (accessed 01.12.13).
[17] R. Seltzer, F.M.D.I. Escalera, J. Segurado, Effect of water conditioningon the fracture behaviour of PA12 composites processed by selec-tive laser sintering, Materials Science and Engineering: A 528 (22)(2011) 6927.
[18] S. Kumar, J.P. Kruth, Composites by rapid prototyping technology,Materials & Design 31 (2) (2010) 850.
[19] R.D. Goodridge, M.L. Shofner, R.J.M. Hague, M. McClelland,M.R. Schlea, R.B. Johnson, C.J. Tuck, Processing of a Polyamide-12/carbon nanofibre composite by laser sintering, Polymer Testing 30(1) (2011) 94.
[20] 3D Systems. Duraform� Flex material datasheet. Available at: http://production3dprinters.com/materials/duraform-flex-plastic(accessed 01.12.13).
[21] Advanced Laser Materials (ALM). TPE_210_S material datasheet.Available at: http://alm-llc.com/Tech_Data_Sheets/TPE_210_S.pdf(accessed 01.12.13).
[22] Lehmann & Voss & Co. DESMOSINT� X92A-1 material datasheet.Available at: http://www.lehvoss.de/eng/1446.htm (accessed 01.12.13).
[23] Ticona. http://tools.ticona.com/tools/documents/literature/2KENGLrev-101.pdf (accessed 14.09.12).
[24] BS ISO 37, Rubber, Vulcanized or Thermoplastic d Determination ofTensile Stress-Strain Properties, 2011.
[25] J.Y. Tan, C.K. Chua, K.F. Leong, Fabrication of channelled scaffoldswith ordered array of micro-pores through microsphere leachingand indirect Rapid Prototyping technique, Biomedical Microdevices15 (1) (2013) 83.
[26] Y. Jun, K. Choi, Design of patient-specific hip implants based on the3D geometry of the human femur, Advances in Engineering Soft-ware 41 (4) (2010) 537.
[27] Materialise. Magics 18 Software Available at: http://software.materialise.com/magics-structures-module (accessed 01.12.13).
[28] Simpleware. þCAD Module Software Available at: http://www.simpleware.com/software/cad-module.html (accessed 01.12.13).
[29] J.T. Bauman, Fatigue, Stress, and Strain of Rubber Components: AGuide for Design Engineers, Hanser Publishers, 2008.
[30] PTC. PTC Creo Simulate 2.0 Software available at: http://www.ptc.com/product/creo/simulate (accessed 01.12.13).
[31] R. Jakel, Analysis of Hyperelastic Materials with MECHANICA –
Theory and Application Examples, PTC presentation for the 2ndSAXSIM at Technische Universität Chemnitz, 2010.


