Embed Size (px)
Citation preview

Medicine & Science in Sports & ExerciseMedicine & Science in Sports & ExerciseMortality effects of hypothetical interventions on physical activity and TVMortality effects of hypothetical interventions on physical activity and TV
viewingviewing--Manuscript Draft--
Manuscript Number:Manuscript Number:
Full Title:Full Title: Mortality effects of hypothetical interventions on physical activity and TV viewing
Short Title:Short Title: physical activity, TV viewing, and mortality
Article Type:Article Type: Original Investigation
Keywords:Keywords: time-varying confounding; hypothetical interventions; g-formula; cohort study
Corresponding Author:Corresponding Author: Yi YangCancer Council VictoriaMelbourne, Victoria AUSTRALIA
Corresponding Author SecondaryCorresponding Author SecondaryInformation:Information:
Corresponding Author 's Institution:Corresponding Author 's Institution: Cancer Council Victoria
Corresponding Author 's SecondaryCorresponding Author 's SecondaryInstitution:Institution:
First Author:First Author: Yi Yang
First Author Secondary Information:First Author Secondary Information:
Order of Authors:Order of Authors: Yi Yang
Allison Hodge
Pierre-Antoine Dugué
Elizabeth Williamson
Paul Gardiner
Elizabeth Barr
Neville Owen
David Dunstan
Brigid Lynch
Dallas English
Order of Authors SecondaryOrder of Authors SecondaryInformation:Information:
Powered by Editorial Manager® and ProduXion Manager® from Aries Systems Corporation

Abstract:Abstract: Introduction
Long-term effects of physical activity and TV viewing on mortality have been inferred fromobservational studies. The associations observed do not allow inferences about theeffects of population interventions and could be subject to bias due to time-varyingconfounding.
Methods
Using data from the Australian Diabetes, Obesity and Lifestyle Study, collected at threetime points, we applied the parametric g-formula to estimate cumulative risks of deathunder hypothetical interventions on physical activity and/or TV viewing, while adjusting fortime-varying confounding.
Results
In the 6,377 participants followed for 13 years from 2004-05 to death or censoring in2017, 781 participants died. The observed cumulative risk of death was 12.2%. The mosteffective hypothetical intervention was to increase weekly physical activity to >300minutes (RR=0.66, 0.46 to 0.86 compared with a ‘worst-case’ scenario; and RR=0.83,0.73 to 0.94 compared with no intervention). Reducing daily TV viewing to <2 hours inaddition to physical activity interventions did not show added survival benefits. ReducingTV viewing alone was least effective in reducing mortality (RR=0.85, 0.60 to 1.10compared with the worst-case scenario; and RR=1.06, 0.93 to 1.20 compared with nointervention).
Conclusion
Our findings suggested that sustained interventions to increase physical activity couldlower all-cause mortality over a 13-year period and there might be limited gain fromintervening to reduce TV viewing time in a relatively healthy population.
Powered by Editorial Manager® and ProduXion Manager® from Aries Systems Corporation

Funding Information:Funding Information: Melbourne Research, University ofMelbourne(Melbourne Research Scholarship)
Ms Yi Yang
Victorian Cancer Agency(MCRF-18005)
Brigid Lynch
National Health and Medical ResearchCouncil(233200)
Not applicable
Department of Health, AustralianGovernment
Not applicable
Abbott Australasia Not applicableAlphapharm Not applicableAstraZeneca Not applicableAventis Pharma Not applicableBio-Rad Laboratories Not applicableBristol-Myers Squibb Not applicableCity Health Centre Diabetes ServiceCanberra
Not applicable
Department of Health and CommunityServices Northern Territory
Not applicable
Department of Health and Human ServicesTasmania
Not applicable
Department of Health New South Wales Not applicableDepartment of Health Western Australia Not applicableDepartment of Human Services SouthAustralia
Not applicable
Department of Health and Human Services,State Government of Victoria
Not applicable
Diabetes Australia Not applicableDiabetes Australia Northern Territory Not applicableEli Lilly Australia Not applicableEstate of the Late Edward Wilson Not applicableGlaxoSmithKline Not applicableHighpoint Shopping Centre (AU) Not applicableJack Brockhoff Foundation Not applicableJanssen-Cilag Not applicableKidney Health Australia Not applicableMarian & EH Flack Trust Not applicableMenzies Research Institute Tasmania Not applicableMerck Sharp & Dohme Not applicableMultiplex Not applicableNovartis Pharmaceuticals Not applicableNovo Nordisk Pharmaceuticals Not applicablePfizer Pty Ltd Not applicablePratt Foundation Not applicableDepartment of Health, Queensland Not applicableRoche Diagnostics Australia Not applicableRoyal Prince Alfred Hospital Sydney Not applicableSanofi-Synthelabo Not applicable
Powered by Editorial Manager® and ProduXion Manager® from Aries Systems Corporation

Submission Form/Page Charge Agreement
Click here to access/downloadSubmission Form/Page Charge Agreement
submissionform.docx

Page 1 of 20
Mortality effects of hypothetical interventions on physical activity and TV viewing 1
2
Yi Yang, MPH 1,2 Allison M. Hodge, PhD 1,2 Pierre-Antoine Dugué, PhD 1,2,3 Elizabeth J. 3
Williamson, PhD 4,5 Paul A. Gardiner, PhD 6,7 Elizabeth L.M. Barr, PhD 8,9 Neville Owen, PhD 4
10 David W. Dunstan, PhD 11,12 Brigid M Lynch, PhD* 1,2,11 Dallas R English, PhD * 1,2 5
* Brigid M Lynch, PhD and Dallas R English, PhD contributed equally to this work. 6
1 Cancer Epidemiology Division, Cancer Council Victoria, Melbourne, VIC, Australia. 2 Centre 7
for Epidemiology and Biostatistics, Melbourne School of Population and Global Health, The 8
University of Melbourne, VIC, Australia. 3 Precision Medicine, School of Clinical Sciences at 9
Monash Health, Monash University, Clayton, VIC, Australia. 4 Department of Medical Statistics, 10
London School of Hygiene and Tropical Medicine, London, United Kingdom. 5 Farr Institute of 11
Health Informatics Research, London, United Kingdom. 6 Centre for Health Services Research, 12
The University of Queensland, Brisbane, QLD, Australia. 7 Mater Research Institute-UQ, 13
Brisbane, QLD Australia. 8 Menzies School of Health Research, Darwin, NT, Australia. 9 Baker 14
Heart and Diabetes Institute, Melbourne, VIC, Australia. 10 Behavioural Epidemiology, Baker 15
Heart and Diabetes Institute, Melbourne, VIC, Australia. 11 Physical Activity Laboratory, Baker 16
Heart and Diabetes Institute, Melbourne, VIC, Australia. 12 Mary MacKillop Institute for Health 17
Research, Australian Catholic University, Melbourne, VIC, Australia. 18
19
Corresponding author Yi Yang, [email protected], +61 3 9514 6268 20
615 St Kilda Rd, Melbourne, VIC 3004, Australia 21
Manuscript (include title page, abstract, text, references)

Page 2 of 20
ABSTRACT 22
Introduction Long-term effects of physical activity and TV viewing on mortality have been 23
inferred from observational studies. The associations observed do not allow inferences about the 24
effects of population interventions and could be subject to bias due to time-varying 25
confounding. 26
Methods Using data from the Australian Diabetes, Obesity and Lifestyle Study, collected at 27
three time points, we applied the parametric g-formula to estimate cumulative risks of death 28
under hypothetical interventions on physical activity and/or TV viewing, while adjusting for 29
time-varying confounding. 30
Results In the 6,377 participants followed for 13 years from 2004-05 to death or censoring in 31
2017, 781 participants died. The observed cumulative risk of death was 12.2%. The most 32
effective hypothetical intervention was to increase weekly physical activity to >300 minutes 33
(RR=0.66, 0.46 to 0.86 compared with a ‘worst-case’ scenario; and RR=0.83, 0.73 to 0.94 34
compared with no intervention). Reducing daily TV viewing to <2 hours in addition to physical 35
activity interventions did not show added survival benefits. Reducing TV viewing alone was 36
least effective in reducing mortality (RR=0.85, 0.60 to 1.10 compared with the worst-case 37
scenario; and RR=1.06, 0.93 to 1.20 compared with no intervention). 38
Conclusion Our findings suggested that sustained interventions to increase physical activity 39
could lower all-cause mortality over a 13-year period and there might be limited gain from 40
intervening to reduce TV viewing time in a relatively healthy population. 41
42
Keywords: time-varying confounding, hypothetical interventions, g-formula, cohort study 43

Page 3 of 20
Introduction 44
Both insufficient physical activity (i.e., not meeting physical activity recommendations) and 45
sedentary behaviour (time spent sitting, as distinct from lack of physical activity) contribute to 46
risk of chronic disease and mortality. In the absence of evidence from randomized trials to 47
quantify the long-term effects of changes in physical activity and sedentary behaviour, 48
understanding how they are jointly related to mortality could be enhanced by better exploiting 49
data from observational studies (1). 50
Insufficient physical activity and time spent in sedentary behaviours, particularly television (TV) 51
viewing, have been associated with higher all-cause mortality in observational studies (2-4). 52
These studies have typically measured exposures and confounders at a single time point, so did 53
not assess the possible impact of exposure changes over follow-up. We have previously 54
highlighted (5) that in studies that used data from multiple time points, conventional regression 55
analyses can be problematic in the presence of time-varying confounding when the values of 56
confounding variables are influenced by past exposures (e.g. sedentary behaviour affects obesity 57
status, which in turn affects physical activity at the next time point) (6, 7). When there is time-58
varying confounding, conditioning on confounders (e.g. obesity status) that also lie in a causal 59
pathway in standard regression models can produce biased estimates (see Web Figure 1, which 60
illustrates an example of time-varying confounding affected by prior exposure) (8). Alternative 61
methods such as inverse probability weighting of marginal structural models have been used to 62
estimate causal effects of physical activity while adjusting for such time-varying confounding (9-63
13). No published studies on sedentary behaviour with multiple observation points have 64
accounted for time-varying confounding. 65

Page 4 of 20
Insufficient physical activity and sedentary behaviour can be viewed as separate risk factors with 66
distinct sociodemographic and behavioural contexts and correlates (14). Our aim was to estimate 67
the effects of single or joint hypothetical interventions for insufficient physical activity and a 68
common leisure-time sedentary behaviour, TV viewing, on all-cause mortality over an 69
approximate 13-year period, while accounting for time-varying confounding, using the 70
parametric g-formula. We used the parametric g-formula because it allows estimation of the 71
causal effects of complex population interventions, which could inform policy more directly 72
compared with a typical exposure effect (15). 73
74
Methods 75
Study population 76
The Australian Diabetes, Obesity and Lifestyle Study (AusDiab) is a population-based cohort 77
study conducted in the six states and the Northern Territory of Australia. Details about the cohort 78
have been described (16). Briefly, participants aged at least 25 years were recruited in 1999-2000 79
(T0), then followed up in 2004-05 (T1), and 2011-12 (T2). Each data collection involved an 80
initial household interview, followed by a biomedical examination and the administration of 81
questionnaires. In the present study, we used T1 (2004-05) as baseline in order to have 82
information on pre-baseline exposure and confounder history. Participants who attended T1 data 83
collection (n=6,400) were included in this analysis. Participants who were pregnant (n=23) at 84
data collections were excluded, which left 6,377 participants eligible for the analysis. The study 85
was approved by the Ethics Committee of the International Diabetes Institute. 86
87

Page 5 of 20
Covariate measurements 88
Self-reported frequency and duration of leisure-time physical activity during the previous week 89
was measured using the Active Australia Survey (17). The questions have been shown to have 90
good reliability and validity (17). Physical activity consisted of walking for recreation or 91
transport, moderate-intensity and vigorous-intensity physical activity at leisure-time. Weekly 92
physical activity time was calculated as the total time spent walking continuously for ≥ 10 93
minutes or performing moderate physical activity, plus double the time spent in vigorous 94
physical activity. 95
The total time spent watching TV or videos in the past 7 days was self-reported, excluding time 96
when TV viewing and other activities (such as preparing a meal or doing other household 97
chores) were being undertaken at the same time. This method has been shown to provide reliable 98
and valid estimates of TV viewing time among adults (18). Average daily TV viewing hours was 99
calculated. 100
Information on demographic attributes, history of health conditions, and self-reported general 101
health was obtained by an interviewer-administered questionnaire (16). Alcohol and dietary 102
intake were assessed using a self-administered, validated food frequency questionnaire (19). 103
Mediterranean diet score was computed and used as a measure of overall diet quality (20). Waist 104
circumference was measured by trained staff (16). 105
Death ascertainment 106
Vital status and date of death were determined by linkage to the Australian National Death 107
Index. Participants were followed until the date of death or administrative end of follow-up on 17 108
April 2017. 109

Page 6 of 20
Hypothetical interventions 110
We considered the following hypothetical interventions at T1 and T2, based on guidelines for 111
physical activity (21) and the associations between TV viewing time and metabolic biomarkers 112
(22-24) (No.2 to No.6 in Table 2): increasing weekly physical activity to sufficient (i.e. 150 to 113
300 minutes) if insufficiently active (i.e. <150 minute); increasing weekly physical activity to 114
optimal (i.e. >300 minutes) for all participants; reducing daily TV viewing to <2 hours for all 115
participants; increasing weekly physical activity to sufficient if insufficiently active and reducing 116
daily TV viewing to <2 hours; and, increasing weekly physical activity to >300 minutes and 117
reducing daily TV viewing to <2 hours for all participants. 118
In addition, for comparison, we considered a no-intervention scenario in which physical activity 119
level and TV viewing time were allowed to evolve naturally (typically referred to as the ‘natural 120
course’, No.0 in Table 2), and a scenario where weekly physical activity decreased to less than 121
30 minutes and daily TV viewing increased to 4 hours or more for all participants (i.e. worst-case 122
scenario, No. 1 in Table 2). 123
Statistical analysis 124
We used the parametric g-formula to estimate the 13-year cumulative risk of death under various 125
hypothetical interventions on physical activity and/or TV viewing. The parametric g-formula is a 126
generalization of standardization for time-varying exposures and confounders and can be used to 127
estimate the standardized risk of death for hypothetical interventions under the assumptions of no 128
unmeasured confounding, no measurement error and no model misspecification (7). The 129
standardized risk is estimated by a weighted average of the risks of death conditional on the 130
given intervention and the observed confounder history. The weights are probability distribution 131
functions of the time-varying confounders estimated using parametric regression models. The 132

Page 7 of 20
weighted average is approximated through Monte Carlo simulation (25-27). We implemented the 133
parametric g-formula in two steps. First, parametric models were fitted to model conditional 134
probabilities of physical activity, TV viewing, and each of the following time-varying 135
confounders in the order listed: history of high cholesterol, high blood pressure, heart disease, 136
and diabetes, self-reported general health status, waist circumference, Mediterranean diet score, 137
smoking status, and alcohol intake. The models also included the following time-fixed 138
confounders: sex, baseline age, quintiles of an area-based index of relative socio-economic 139
advantage and disadvantage, country of birth, and level of education (see Web Table 1 for details 140
of models). These models were then used to simulate risk of death while setting physical activity 141
and TV viewing to a specified intervention level in a Monte Carlo sample of the same size: 1) T0 142
and T1 confounder values were retained for all participants; T1 physical activity and TV viewing 143
values were set to a specific level if part of an intervention; 2) risk of death before T2 was 144
simulated; 3) for participants simulated to remain alive at T2: physical activity and TV viewing 145
were set to a specific level if part of an intervention, T2 values of confounders were simulated by 146
comparing the predicted probability of the confounder value to a value randomly drawn from a 147
standard uniform distribution, and risk of death from T2 to the end of follow-up was simulated; 148
4) cumulative risk of death (i.e. 13-year risk) was calculated as: 149
P13-year = Pdeath before T2 + (1- Pdeath before T2 ) Pdeath after T2. 150
For each hypothetical intervention, we compared the estimated 13-year risk of death with the risk 151
under the natural course (i.e. no-intervention scenario) and the risk under the worst-case scenario 152
by calculating the risk ratios (RR) and risk differences (RD). We conducted the analyses 153
separately in female and male participants to examine the possibility of effect heterogeneity by 154
Page 8 of 20
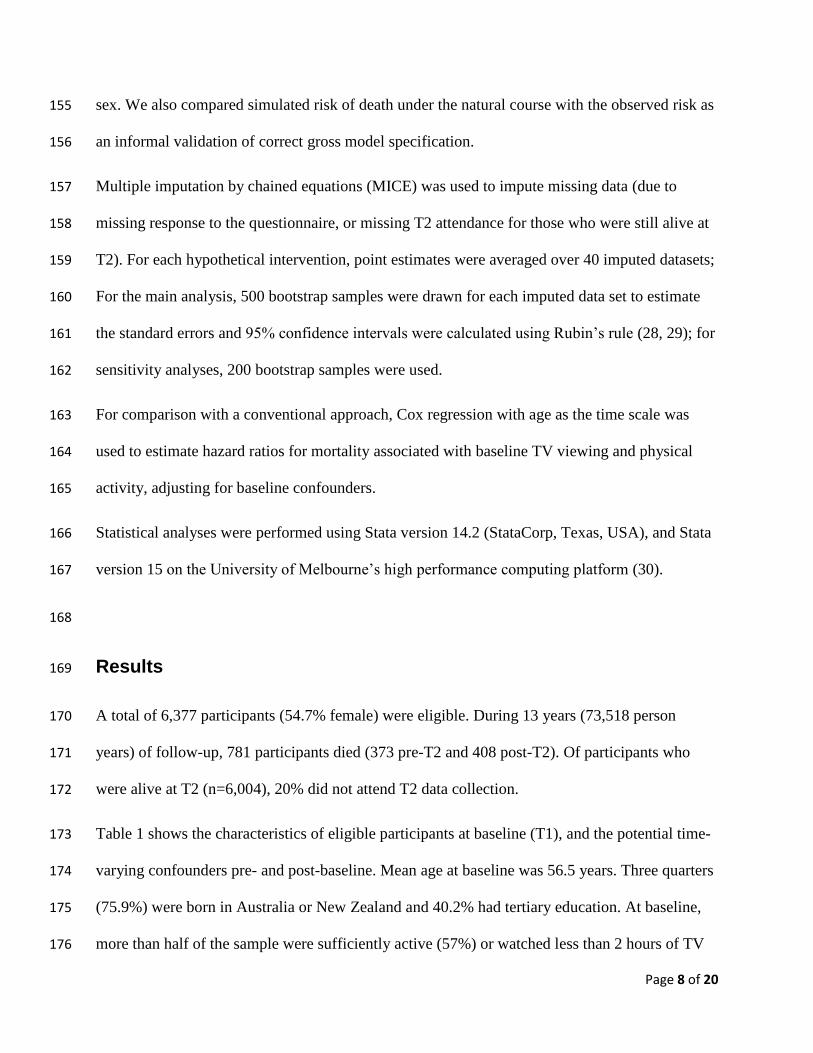
sex. We also compared simulated risk of death under the natural course with the observed risk as 155
an informal validation of correct gross model specification. 156
Multiple imputation by chained equations (MICE) was used to impute missing data (due to 157
missing response to the questionnaire, or missing T2 attendance for those who were still alive at 158
T2). For each hypothetical intervention, point estimates were averaged over 40 imputed datasets; 159
For the main analysis, 500 bootstrap samples were drawn for each imputed data set to estimate 160
the standard errors and 95% confidence intervals were calculated using Rubin’s rule (28, 29); for 161
sensitivity analyses, 200 bootstrap samples were used. 162
For comparison with a conventional approach, Cox regression with age as the time scale was 163
used to estimate hazard ratios for mortality associated with baseline TV viewing and physical 164
activity, adjusting for baseline confounders. 165
Statistical analyses were performed using Stata version 14.2 (StataCorp, Texas, USA), and Stata 166
version 15 on the University of Melbourne’s high performance computing platform (30). 167
168
Results 169
A total of 6,377 participants (54.7% female) were eligible. During 13 years (73,518 person 170
years) of follow-up, 781 participants died (373 pre-T2 and 408 post-T2). Of participants who 171
were alive at T2 (n=6,004), 20% did not attend T2 data collection. 172
Table 1 shows the characteristics of eligible participants at baseline (T1), and the potential time-173
varying confounders pre- and post-baseline. Mean age at baseline was 56.5 years. Three quarters 174
(75.9%) were born in Australia or New Zealand and 40.2% had tertiary education. At baseline, 175
more than half of the sample were sufficiently active (57%) or watched less than 2 hours of TV 176

Page 9 of 20
(54%) (Table 1). Active participants tended to spend less time watching TV daily, although the 177
differences were not large (Figure 1). 178
Table 2 shows the 13-year risks of death under various hypothetical interventions. The simulated 179
13-year risk of death under no intervention (12.1%) was very similar to the observed risk 180
(12.2%), indicating that the models were correctly specified overall. The hypothetical 181
intervention that reduced 13-year risk of death the most was to improve physical activity to >300 182
mins/week (RR=0.83, 0.73 to 0.94 compared with the natural course; and RR=0.66, 0.46 to 0.86 183
compared with the worst-case scenario), followed by improving physical activity to 150-300 184
mins/week for insufficiently active participants (RR=0.92, 0.82 to 1.01 compared with the 185
natural course; and RR=0.73, 0.52 to 0.94 compared with the worst-case scenario). The average 186
percentages of participants who needed to improve their physical activity were 65.2% and 187
42.1%, respectively for the two interventions. The intensive physical activity intervention would 188
have prevented 20 deaths (CI: 7 to 33 deaths) per 1000 people in a 13-year period compared with 189
not intervening. Reducing daily TV viewing to < 2 hours alone was the least effective 190
intervention for lowering mortality (RR=1.06, 0.93 to 1.20 compared with the natural course; 191
and RR=0.85, 0.60 to 1.10 compared with the worst-case scenario). Reducing daily TV hours 192
jointly with any of the physical activity interventions required more people changing their 193
behaviours (average of 80.7% and 68.2%, respectively), while not lowering the risk further. 194
Table 3 shows the 13-year risk of death in male and female participants under the natural course, 195
the worst-case scenario, and the joint intensive intervention. The effect of hypothetical 196
interventions on mortality (i.e. risk ratios) appeared to be similar for male and female 197
participants. However, population risk difference was larger in males than in females because of 198
higher absolute risks under the natural course. 199
Page 10 of 20
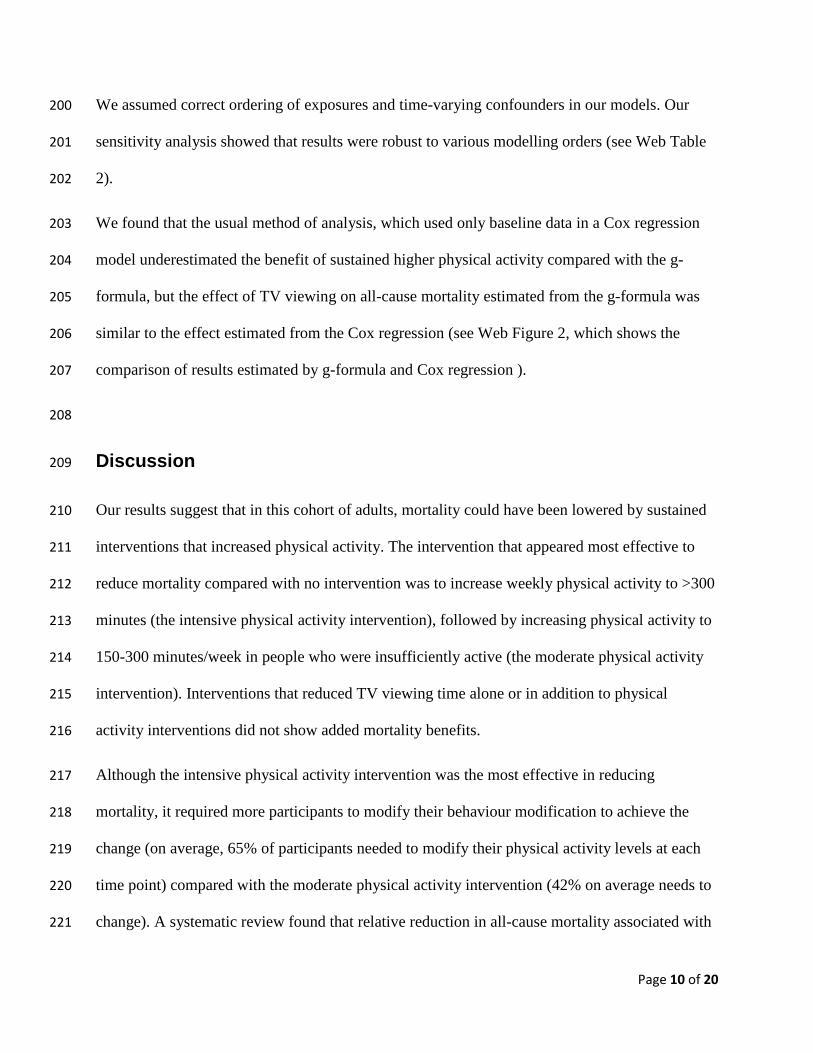
We assumed correct ordering of exposures and time-varying confounders in our models. Our 200
sensitivity analysis showed that results were robust to various modelling orders (see Web Table 201
2). 202
We found that the usual method of analysis, which used only baseline data in a Cox regression 203
model underestimated the benefit of sustained higher physical activity compared with the g-204
formula, but the effect of TV viewing on all-cause mortality estimated from the g-formula was 205
similar to the effect estimated from the Cox regression (see Web Figure 2, which shows the 206
comparison of results estimated by g-formula and Cox regression ). 207
208
Discussion 209
Our results suggest that in this cohort of adults, mortality could have been lowered by sustained 210
interventions that increased physical activity. The intervention that appeared most effective to 211
reduce mortality compared with no intervention was to increase weekly physical activity to >300 212
minutes (the intensive physical activity intervention), followed by increasing physical activity to 213
150-300 minutes/week in people who were insufficiently active (the moderate physical activity 214
intervention). Interventions that reduced TV viewing time alone or in addition to physical 215
activity interventions did not show added mortality benefits. 216
Although the intensive physical activity intervention was the most effective in reducing 217
mortality, it required more participants to modify their behaviour modification to achieve the 218
change (on average, 65% of participants needed to modify their physical activity levels at each 219
time point) compared with the moderate physical activity intervention (42% on average needs to 220
change). A systematic review found that relative reduction in all-cause mortality associated with 221

Page 11 of 20
higher physical activity was greater for females than for males (31), the effects of the 222
hypothetical interventions on relative reduction in mortality were similar for females and males 223
in our study. 224
Like other analyses of observational data, these estimates are based on the assumptions of no 225
unmeasured confounding, no measurement error, and no model misspecification. We cannot 226
exclude the possibility of unmeasured confounding despite adjusting for several important 227
confounders. Self-reported time spent in physical activity and TV viewing are subject to 228
measurement error. However, the questionnaires used in our study were previously shown to 229
have good reliability and acceptable validity for estimates of the true exposure level (17, 18). We 230
were able to closely reproduce the observed risk of death under the natural course, which is a 231
necessary condition for no overall model misspecification under no intervention. The parametric 232
g-formula requires fitting multiple models, therefore it may be more sensitive to violations of the 233
above assumptions as violation in one model may accumulate through the others (25). Finally, 234
the parametric g-formula is subject to the ‘g-null paradox’, i.e. the null hypothesis, (in our case, 235
this is that interventions on physical activity and TV viewing have no effect on all-cause 236
mortality), even if true, will be rejected in a large enough sample because the estimated value of 237
the g-formula for the outcome generally depends on the exposure history (32). However, in 238
practice, the g-null paradox is of less concern compared with typical random variability (33). 239
Current public health guidelines recommend minimizing sedentary behaviour and doing at least 240
150 mins/week of moderate-to-vigorous-intensity physical activity, or 300 mins/week for 241
additional health benefit (34-36). These recommendations are mainly based on studies of 242
associations between exposures at a single time point and risk of health outcomes such as 243
cardiovascular health and cancer (35). Our study, on the other hand, estimated the potential 244
Page 12 of 20
impact on mortality had these two risk factors been altered by sustained population interventions. 245
This is the key strength of our study, because it is rarely feasible to estimate such causal effects 246
for a generally healthy population through randomized controlled trials (1). Our finding 247
demonstrated that using a single measurement of physical activity is likely to underestimate the 248
protective effects of physical activity. This may stimulate additional public health expenditure 249
into physical activity promotion. Health promotion programmes frequently incorporate physical 250
activity promotion into programmes address obesity prevention or reduction. Our research 251
(which accounts for obesity-related time-varying confounding) highlights that physical activity 252
itself is important for longevity. 253
Previous findings from the AusDiab study reported that watching ≥ 4 hours of TV daily was 254
associated with higher all-cause mortality (37). Our Cox model showed a weaker association in 255
the same direction between TV viewing time at T1 and all-cause mortality (See Web Figure 2). 256
This could be partly because the previous study used T0 as baseline, whereas we used T1 as 257
baseline. Our sample was smaller due to loss to follow-up between T0 and T1, and healthier. In 258
our sample where daily TV viewing hours were already below two hours for more than half of 259
the participants, we estimated no further survival benefit by intervening on this exposure. Over 260
the 12 years between T0 (1999/2000) and T2 (2011/2012), there was an expansion of television 261
viewing options, and other domestic entertainment and screen-based technologies, which may 262
have reduced the relevance of our exposure variable. Although our estimates are not directly 263
comparable to results from studies using conventional regression approaches, our findings and 264
those of studies using regression approaches suggest protective effects of physical activity on 265
mortality (31). Furthermore, we found that using only baseline data could underestimate the 266
potential benefit of long-term physical activity. 267

Page 13 of 20
Although we used repeatedly measured exposure data, the analyses would have benefited from 268
more time points at regular intervals, which are more representative of sustained interventions 269
over time. We coarsened the time spent in physical activity and TV viewing into categories 270
relevant to current public health guidelines. This may affect the interpretation of our findings 271
because of multiple versions of treatment (38). For example, our hypothetical intervention. 272
“increasing physical activity to > 300 mins/week” can be achieved by increasing physical 273
activity to 301 minutes or to 400 minutes through increasing activity duration or intensity over a 274
week. Our estimates can be interpreted as a weighted average of the effects of the different 275
versions, weighted by the probability of each version naturally arising within the population (38, 276
39). It should be noted that our estimates may not be generalizable to populations with different 277
distributions of physical activity and TV viewing level. Results from the Australian National 278
Health Surveys showed that the percentage of Australian adults with sufficient physical activity 279
(i.e. ≥ 150 mins/week ) remained low from 1989 to 2011 (39% in 1989 to 41% in 2011) (40). 280
The hypothetical interventions we considered may have a greater benefit on lowering mortality 281
in the general population than in our sample where close to 60% can be classified as ‘sufficiently 282
active’. 283
In conclusion, our findings suggest that sustained interventions on physical activity could lower 284
all-cause mortality over a 13-year period, and that there might be limited gain from intervening 285
on TV viewing time in a relatively healthy population. 286
287
Page 14 of 20
Acknowledgements 288
The authors thank the participants and staff of The Australian Diabetes, Obesity and Lifestyle 289
(AusDiab) study for their valuable contributions. YY is supported by a Melbourne Research 290
Scholarship from the University of Melbourne. BML is supported by a fellowship from the 291
Victorian Cancer Agency (MCRF-18005). AusDiab study is supported by a National Health and 292
Medical Research Council (NHMRC) project grant (233200), Australian Government 293
Department of Health and Ageing. In addition, the study has received financial support from the 294
Abbott Australasia, Alphapharm, AstraZeneca, Aventis Pharma, Bio-Rad Laboratories, Bristol-295
Myers Squibb, City Health Centre Diabetes Service Canberra, Department of Health and 296
Community Services Northern Territory, Department of Health and Human Services Tasmania, 297
Department of Health New South Wales, Department of Health Western Australia, Department 298
of Human Services South Australia, Department of Human Services Victoria, Diabetes Australia, 299
Diabetes Australia Northern Territory, Eli Lilly Australia, Estate of the Late Edward Wilson, 300
GlaxoSmithKline, Highpoint Shopping Centre, Jack Brockhoff Foundation, Janssen-Cilag, 301
Kidney Health Australia, Marian & EH Flack Trust, Menzies Research Institute, Merck Sharp & 302
Dohme, Multiplex, Novartis Pharmaceuticals, Novo Nordisk Pharmaceuticals, Pfizer Pty Ltd, 303
Pratt Foundation, Queensland Health, Roche Diagnostics Australia, Royal Prince Alfred Hospital 304
Sydney, and Sanofi-Synthelabo. 305
YY, AMH, PAD, BML, and DRE designed the study. YY performed the statistical analysis with 306
support from EJW. YY, AMH, PAD, BML, and DRE drafted the manuscript. PAG, ELMB, NO, 307
and DWD contributed to the data interpretation and provided critical feedback for each draft. All 308
authors read and approved the final manuscript. 309
310

Page 15 of 20
Conflict of interest 311
The authors declare that they have no relationship with companies or manufacturers who will 312
benefit from the results of the present study. The results of the present study do not constitute 313
endorsement by ACSM. The results of the study are presented clearly, honestly, and without 314
fabrication, falsification, or inappropriate data manipulation. 315
316
References 317
1. Lynch BM, Leitzmann MF. An Evaluation of the Evidence Relating to Physical 318
Inactivity, Sedentary Behavior, and Cancer Incidence and Mortality. Current 319
Epidemiology Reports. 2017;4(3):221-31. 320
2. Grøntved A, Hu FB. Television viewing and risk of type 2 diabetes, cardiovascular 321
disease, and all-cause mortality: A meta-analysis. JAMA. 2011;305(23):2448-55. 322
3. Biswas A, Oh PI, Faulkner GE et al. Sedentary time and its association with risk for 323
disease incidence, mortality, and hospitalization in adults: a systematic review and meta-324
analysis. Annals of Internal Medicine. 2015;(2):123. 325
4. Thorp AA, Owen N, Neuhaus M, Dunstan DW. Sedentary Behaviors and Subsequent 326
Health Outcomes in Adults: A Systematic Review of Longitudinal Studies, 1996–2011. 327
American Journal of Preventive Medicine. 2011;41(2):207-15. 328
5. Yang Y, Lynch BM, van Roekel EH. Letter by Yang et al Regarding Article, 329
"Accelerometer-Measured Physical Activity and Sedentary Behavior in Relation to All-330
Cause Mortality: The Women's Health Study". Circulation. 2018;138(1):114-5. 331

Page 16 of 20
6. Pedisic Z, Grunseit A, Ding D et al. High sitting time or obesity: Which came first? 332
Bidirectional association in a longitudinal study of 31,787 Australian adults. Obesity. 333
2014;22(10):2126-30. 334
7. Robins J. A new approach to causal inference in mortality studies with a sustained 335
exposure period—application to control of the healthy worker survivor effect. 336
Mathematical Modelling. 1986;7:1393-512. 337
8. Daniel R, Cousens S, De Stavola B, Kenward M, Sterne J. Methods for dealing with 338
time-dependent confounding. Statistics in Medicine. 2013;32(9):1584-618. 339
9. Tager IB, Haight T, Sternfeld B, Yu Z, van Der Laan M. Effects of physical activity and 340
body composition on functional limitation in the elderly: application of the marginal 341
structural model. Epidemiology. 2004;15(4):479-93. 342
10. Bembom O, van der Laan M, Haight T, Tager I. Leisure-time physical activity and all-343
cause mortality in an elderly cohort. Epidemiology. 2009;20(3):424-30. 344
11. Haight T, Tager I, Sternfeld B, Satariano W, van der Laan M. Effects of Body 345
Composition and Leisure-time Physical Activity on Transitions in Physical Functioning 346
in the Elderly. American Journal of Epidemiology. 2005;162(7):607-17. 347
12. Garcia-Aymerich J, Lange P, Serra I, Schnohr P, Anto JM. Time-dependent confounding 348
in the study of the effects of regular physical activity in chronic obstructive pulmonary 349
disease: an application of the marginal structural model. Annals of Epidemiology. 350
2008;18(10):775-83. 351
13. Shortreed SM, Peeters A, Forbes AB. Estimating the effect of long-term physical activity 352
on cardiovascular disease and mortality: evidence from the Framingham Heart Study. 353
Heart. 2013;99(9):649-54. 354

Page 17 of 20
14. Friedenreich CM, Neilson HK, Lynch BM. State of the epidemiological evidence on 355
physical activity and cancer prevention. European Journal of Cancer. 2010;46(14):2593-356
604. 357
15. Westreich D. From Exposures to Population Interventions: Pregnancy and Response to 358
HIV Therapy. American Journal of Epidemiology. 2014;179(7):797-806. 359
16. Dunstan DW, Zimmet PZ, Welborn TA et al. The Australian diabetes, obesity and 360
lifestyle study (AusDiab)—methods and response rates. Diabetes research and clinical 361
practice. 2002;57(2):119-29. 362
17. The Active Australia Survey: a guide and manual for implementation, analysis and 363
reporting. In: AIoHa Welfare editor. Canberra, Australia: Australian Institute of Health 364
and Welfare; 2003. 365
18. Salmon J, Owen N, Crawford D, Bauman A, Sallis JF. Physical activity and sedentary 366
behavior: A population-based study of barriers, enjoyment, and preference. Health 367
Psychology. 2003;22(2):178-88. 368
19. Ireland P, Jolley D, Giles G et al. Development of the Melbourne FFQ: a food frequency 369
questionnaire for use in an Australian prospective study involving an ethnically diverse 370
cohort. Asia Pacific Journal of Clinical Nutrition. 1994;3(1):19-31. 371
20. Hodge A, English D, Itsiopoulos C, O’Dea K, Giles G. Does a Mediterranean diet reduce 372
the mortality risk associated with diabetes: evidence from the Melbourne Collaborative 373
Cohort Study. Nutrition, Metabolism and Cardiovascular Diseases. 2011;21(9):733-9. 374
21. Brown WJ, Bauman AE, Bull FC, Burton NW. Development of evidence-based physical 375
activity recommendations for adults (18-64 years): report prepared for the Australian 376
Government Department of Health, August 2012. 2013. 377

Page 18 of 20
22. Dunstan DW, Salmon J, Owen N et al. Physical Activity and Television Viewing in 378
Relation to Risk of Undiagnosed Abnormal Glucose Metabolism in Adults. Diabetes 379
Care. 2004;27(11):2603-9. 380
23. Wijndaele K, Healy GN, Dunstan DW et al. Increased cardiometabolic risk is associated 381
with increased TV viewing time. Medicine and science in sports and exercise. 382
2010;42(8):1511-8. 383
24. Shibata AI, Oka K, Sugiyama T, Salmon JO, Dunstan DW, Owen N. Physical Activity, 384
Television Viewing Time, and 12-Year Changes in Waist Circumference. Medicine and 385
science in sports and exercise. 2016;48(4):633-40. 386
25. Taubman SL, Robins JM, Mittleman MA, Hernan MA. Intervening on risk factors for 387
coronary heart disease: an application of the parametric g-formula. International journal 388
of epidemiology. 2009;38(6):1599-611. 389
26. Danaei G, Pan A, Hu FB, Hernán MA. Hypothetical mid-life interventions in women and 390
risk of type 2 diabetes. Epidemiology. 2013;24(1):122. 391
27. Lajous M, Willett WC, Robins J et al. Changes in fish consumption in midlife and the 392
risk of coronary heart disease in men and women. American Journal of Epidemiology. 393
2013;178(3):382-91. 394
28. Rubin DB. Multiple imputation for nonresponse in surveys. New York ; Wiley, c1987.; 395
1987. 396
29. Schomaker M, Heumann C. Bootstrap inference when using multiple imputation. 397
Statistics in Medicine. 2018;37(14):2252-66. 398
30. Lev Lafayette GS, Linh Vu, Bernard Meade. Spartan Performance and Flexibility: An 399
HPC-Cloud Chimera. In: Proceedings of the OpenStack Summit. 2016: Barcelona. 400

Page 19 of 20
31. Samitz G, Egger M, Zwahlen M. Domains of physical activity and all-cause mortality: 401
systematic review and dose-response meta-analysis of cohort studies. International 402
journal of epidemiology. 2011;40(5):1382-400. 403
32. Robins JM, Wasserman LA. Estimation of effects of sequential treatments by 404
reparameterizing directed acyclic graphs. In: Proceedings of the Proceedings of 405
Thirteenth Conference on Uncertainty in Artificial Intelligence (UAI1997). 1997. 406
33. Hernán M, Robins J. Causal Inference. Boca Raton: Chapman & Hall/CRC, forthcoming; 407
2019. 408
34. Research. WCRFAIfC. Recommendations and public health and policy implications. 409
2018. 410
35. Global recommendations on physical activity for health. In: World Health Organization; 411
2010. 412
36. Australia's physical activity and sedentary behaviour guidelines. In: Australian 413
Government Department of Health; 2014. 414
37. Dunstan DW, Barr EL, Healy GN et al. Television viewing time and mortality: the 415
Australian Diabetes, Obesity and Lifestyle Study (AusDiab). Circulation. 416
2010;121(3):384-91. 417
38. VanderWeele TJ, Hernan MA. Causal Inference Under Multiple Versions of Treatment. 418
Journal of causal inference. 2013;1(1):1-20. 419
39. VanderWeele TJ. On Well-defined Hypothetical Interventions in the Potential Outcomes 420
Framework. Epidemiology. 2018;29(4):e24-e5. 421
Page 20 of 20
40. Chau J, Chey T, Burks-Young S, Engelen L, Bauman A. Trends in prevalence of leisure 422
time physical activity and inactivity: results from Australian National Health Surveys 423
1989 to 2011. Australian and New Zealand journal of public health. 2017;41(6):617-24. 424
425

Mortality effects of hypothetical interventions on physical activity and TV viewing
Tables and Figures
Page 1 of 5
Table 1. Characteristics of participants included in the analysis, Australia
1999-2000 (T0)
N=6377
2004-05 (T1)
N=6377
2011-12 (T2)
N=4785a
Time-fixed covariates
Baseline age (years), mean(SD) 56.5 (12.8)
Sex, N(%)
Male 2891 (45.3)
Female 3486 (54.7)
Born in Australia/New Zealand, N(%) 4839 (75.9)
The Index of Relative Socio-economic
Advantage and Disadvantage (IRSAD), N(%)
1 (greatest disadvantage) 1084 (17.3)
2 1296 (20.7)
3 1291 (20.6)
4 1204 (19.2)
5 (greatest advantage) 1395 (22.2)
Level of education, N(%)
University or technical institution 2561 (40.2)
Completed high school 1460 (22.9)
Some high school 1966 (30.8)
Primary or never attended school 390 (6.1)
Baseline height(cm), mean(SD)
167.6 (9.6)
Time-varying covariates
Weekly Physical activity, N(%)
< 30 minutes 1257 (19.9) 1099 (17.4) 729 (15.8)
30 to 149 minutes 1686 (26.7) 1626 (25.7) 1127 (24.4)
150 to 300 minutes 1368 (21.6) 1480 (23.4) 1074 (23.3)
> 300 minutes 2015 (31.9) 2118 (33.5) 1680 (36.4)
Daily TV viewing time, N(%)
< 2 hours 3655 (57.7) 3385 (53.6) 2030 (52.7)
2 to 4 hours 2225 (35.1) 2340 (37.0) 1478 (38.3)
≥ 4 hours 459 (7.2) 595 (9.4) 347 (9.0)
Mediterranean Diet Score, N(%)
0-3 1870 (29.3) 1922 (30.7) 1067 (29.7)
4-6 3766 (59.1) 3695 (59.0) 2127 (59.3)
7-9 741 (11.6) 651 (10.4) 394 (11.0)
Waist circumferenceb, N(%)
Normal 2500 (39.6) 2120 (33.3) 1057 (26.8)
Increased risk 1641 (26.0) 1654 (26.0) 1007 (25.5)
Greatly increased risk 2173 (34.4) 2584 (40.6) 1879 (47.7)
Tables and Figure for initial submission

Mortality effects of hypothetical interventions on physical activity and TV viewing
Tables and Figures
Page 2 of 5
Table 1. Characteristics of participants included in the analysis, Australia (continued)
Smoking status, N(%)
Never smoker 3686 (58.8) 3527 (58.0) 2657 (59.9)
Former smoker 1858 (29.6) 1982 (32.6) 1517 (34.2)
Current smoker 723 (11.5) 568 (9.3) 260 (5.9)
Alcohol intake (g/day), N(%)
0 g/day (Male & Female) 940 (14.7) 836 (13.3) 481 (13.4)
1-39(Male)/1-19(Female) 4571 (71.7) 4470 (71.3) 2537 (70.7)
40-59(Male)/20-39(Female) 627 (9.8) 683 (10.9) 411 (11.5)
60+(Male)/40+(Female) 239 (3.7) 279 (4.5) 159 (4.4)
Self-reported general health, N(%)
Excellent 603 (9.5) 689 (10.9) 426 (10.7)
Very Good 2346 (37.0) 2335 (36.9) 1522 (38.3)
Good 2633 (41.5) 2460 (38.8) 1552 (39.1)
Fair 693 (10.9) 755 (11.9) 422 (10.6)
Poor 74 (1.2) 95 (1.5) 51 (1.3)
History of health conditions, N(%)
High cholesterol 1714 (27.0) 2654 (41.8) 3044 (58.1)
High blood pressure 1690 (26.6) 2399 (37.7) 2666 (51.5)
Diabetes 276 (4.3) 512 (8.0) 629 (12.9)
Heart conditions 443 (7.0) 559 (8.8) 218 (4.6)
Numbers across categories for some variables did not add up because of missing values.
a Number of participants attended T2, before multiple imputation was applied to impute missing data due to missing
T2 attendance for those who were still alive at T2. b Normal: <94cm (male) or <80cm (female); increased risk: 94cm
to <102cm (male) or 80cm to <88 cm (female); greatly increased risk: ≥102cm (male) or ≥88 (women).

Mortality effects of hypothetical interventions on physical activity and TV viewing
Tables and Figures
Page 3 of 5
Table 2. Risks of death under hypothetical interventions using the parametric g-formula
No. Interventions
13-year risk of
death (%),
95% CI
Population risk
difference (%),
95% CI
Population
risk ratio,
95% CI
Risk difference
(%), 95% CI
Risk ratio,
95% CI
Average %
needed
interventiona
0 Natural course No intervention 12.1 (10.9 to 13.2) Reference Reference
0
1 Worst-case
scenario
Reducing physical
activity to <30
mins/week, and
increasing TV
viewing to ≥4 hrs/day
for all
15.2 (11.6 to 18.9) 3.2 (-0.4 to 6.8) 1.26 (0.96 to 1.57) Reference Reference 97.6
2 Physical activity
only, moderate
Increasing physical
activity to 150-300
mins/week if <150
mins/week
11.1 (9.7 to 12.4) -1.0 (-2.2 to 0.2) 0.92 (0.82 to 1.01) -4.2 (-8.2 to -0.2) 0.73 (0.52 to 0.94) 42.1
3 Physical activity
only, intensive
Increasing physical
activity to >300
mins/week for all
10.0 (8.6 to 11.5) -2.0 (-3.3 to -0.7) 0.83 (0.73 to 0.94) -5.2 (-9.3 to -1.1) 0.66 (0.46 to 0.86) 65.2
4 TV viewing only Reducing TV
viewing to <2 hrs/day
if ≥2 hrs/day
12.8 (11.1 to 14.6) 0.8 (-0.9 to 2.4) 1.06 (0.93 to 1.20) -2.4 (-6.6 to 1.8) 0.85 (0.60 to 1.10) 48.4
5 Joint, moderate Intervention No. 2
and No.4
11.6 (9.8 to 13.3) -0.5 (-2.1 to 1.1) 0.96 (0.83 to 1.09) -3.7 (-8.0 to 0.7) 0.76 (0.52 to 1.01) 68.2
6 Joint, intensive Intervention No. 3
and No.4 10.5 (8.7 to 12.4) -1.5 (-3.3 to 0.2) 0.87 (0.73 to 1.02) -4.7 (-9.2 to -0.2) 0.70 (0.46 to 0.93) 80.7
The observed 13-year risk of death was 12.2%; 500 bootstrap samples were drawn for each of the 40 imputed datasets to estimate the standard errors and 95%
CIs. a Average percentage of participants who need to be intervened on at T1 and T2.

Mortality effects of hypothetical interventions on physical activity and TV viewing
Tables and Figures
Page 4 of 5
Table 3. Risk of death under hypothetical interventions in women and men
Interventions 13-year risk of death
(%), 95% CI
Population risk ratio,
95% CI
Population risk
difference (%), 95% CI
Risk ratio,
95% CI
Risk difference
(%), 95% CI
Women
Natural course 9.9 (8.4 to 11.3) Reference Reference
Worst-case scenario 12.5 (8.0 to 16.9) 1.27 (0.83 to 1.70) 2.6 (-1.6 to 6.8) Reference Reference
Joint, intensive 8.7 (6.1 to 11.3) 0.88 (0.61 to 1.15) -1.2 (-3.8 to 1.4) 0.70 (0.31 to 1.09) -3.8 (-9.6 to 2.0)
Men
Natural course 14.7 (13.1 to 16.4) Reference Reference
Worst-case scenario 19.1 (12.9 to 25.2) 1.30 (0.88 to 1.71) 4.3 (-1.8 to 10.5) Reference Reference
Joint, intensive 12.7 (9.7 to 15.7) 0.86 (0.68 to 1.04) -2.0 (-4.7 to 0.7) 0.67 (0.36 to 0.98) -6.4 (-14.0 to 1.3)
The observed 13-year risk of death was 9.8% for women, and 15.2% for men; 200 bootstrap samples were drawn for each of the 40 imputed datasets to estimate
the standard errors and 95% CIs.

Mortality effects of hypothetical interventions on physical activity and TV viewing
Tables and Figures
Page 5 of 5
Figure 1. Plot of daily TV viewing and weekly physical activity at baseline (T1)

Supplemental Data File (.doc, .tif, pdf, etc.)
Click here to access/downloadSupplemental Data File (.doc, .tif, pdf, etc.)
Supplementary Documents.docx


