Embed Size (px)
Citation preview
Environment Inhmuational, Vol. 17. pp. 7-21,199l Printed in the U.S.A. All rights reserved.
0160-4120/91$3.00 t.00 Copyright (81991 Pergamon Press plc
MELANOMA MORTALITY AND EXPOSURE TO ULTRAVIOLET RADIATION: AN EMPIRICAL RELATIONSHIP
Hugh M. Pitcher Science, Economics and Statistics Division, Office of Policy Planning and Evaluation, U.S. Environmental Protection Agency, Washington, D.C. 20460, USA
Janice D. Longstreth Clement InternaGonal Corporation, Fairfax, VA 22031, USA
EI 8910-270M (Received 22 October 1989; accepted 14 ]une 2990)
Results are presented from a study of the relationship of melanoma deaths to ambient ultraviolet radiation levels for the United States. A National Air and Space Administration (NASA) satellite-based model is used to estimate ambient levels of ultraviolet radiation and an EPA/NC1 data base provides melanoma death rates for a thirty-year period used as a response measure. Estimates of effective dose were derived by applying different weighting functions to the ambient UV energy levels predicted by the NASA model for 215 Standard Metropolitan Areas (SMA), thereby developing estimates of active UV energy which would penetrate the epidermis of individuals at various locations. Biological weighting functions included ones based on the action spectra for erythema and DNA-damage; in the latter instance, dose estimates were modified by factors for transmission through lightly pigmented (skin type I untanned; “White”) skin. For purposes of comparison, a weighting function based on the response of a Robertson-Berger (R-B) meter is also included. A highly statistically significant association between all measures of dose and death rates is found, with dose estimates based on application of a weighting function derived from the action spectrum for DNA-damage (DNA-weighted dose) providing (very marginally) the strongest relationship. Controls for ethnicity, income, education, and occupation reduce the size of the effect, but the effect remains significant. The death rates in males show a greater response than those in females to changes in estimated dose. Variations in the duration of the exposure measure (e.g., peak or cumulative dose) have a large impact on the estimates of the effects that ozone depletion will have on cutaneous malignant melanoma (CMM) mortality. For a dose estimate based on the amount of DNA-weighted UV energy received on a clear day in June (“peak dose”). results imply a 1% reduction in ozone will result in a 1.6% increase in male death rates and a 1.1% increase in female death rates. A dose estimate based on an annual amount of DNA-weighted UV energy (“annual dose”) implies mortality changes of 0.82% for men and 0.57% for women for a 1% change in ozone.
INTRODUCTION
The U.S. Environmental Protection Agency (USEPA) is currently in the process of evaluating the health and environmental effects that would accompany a
decrease in stratospheric ozone. The results of this evaluation will contribute to a benefits analysis in support of an assessment of the need for regulatory strategies to minimize ozone depletion. As a part of
8 H.M. Pitcher and I.D. Longstreth
this evaluation, the Agency has recently completed a comprehensive review of the literature relevant to assessing the role of ultraviolet B radiation (UV-B) in the induction of cutaneous malignant melanoma (CMM) (USEPA 1987). While no single piece of evidence overwhelmingly implicates UV-B radiation in the induction of melanoma, the weight of evidence clearly indicates a role for solar radiation, and sug- gests as well that UV-B is the most effective waveband. This report starts from the conclusions developed in that review and seeks to determine and evaluate the empirical relationships between CMM mortality in the U.S. from 1950 to 1979 and estimates of exposure to ultraviolet radiation (UVR) derived from global scale ozone measurements made by the Nimbus 7 satellite. Several of these empirical relationships (based on differing estimates of effective dose) are then used to estimate the impacts on CMM mortality of the increased UV-B levels that are likely to result from stratospheric ozone depletion.
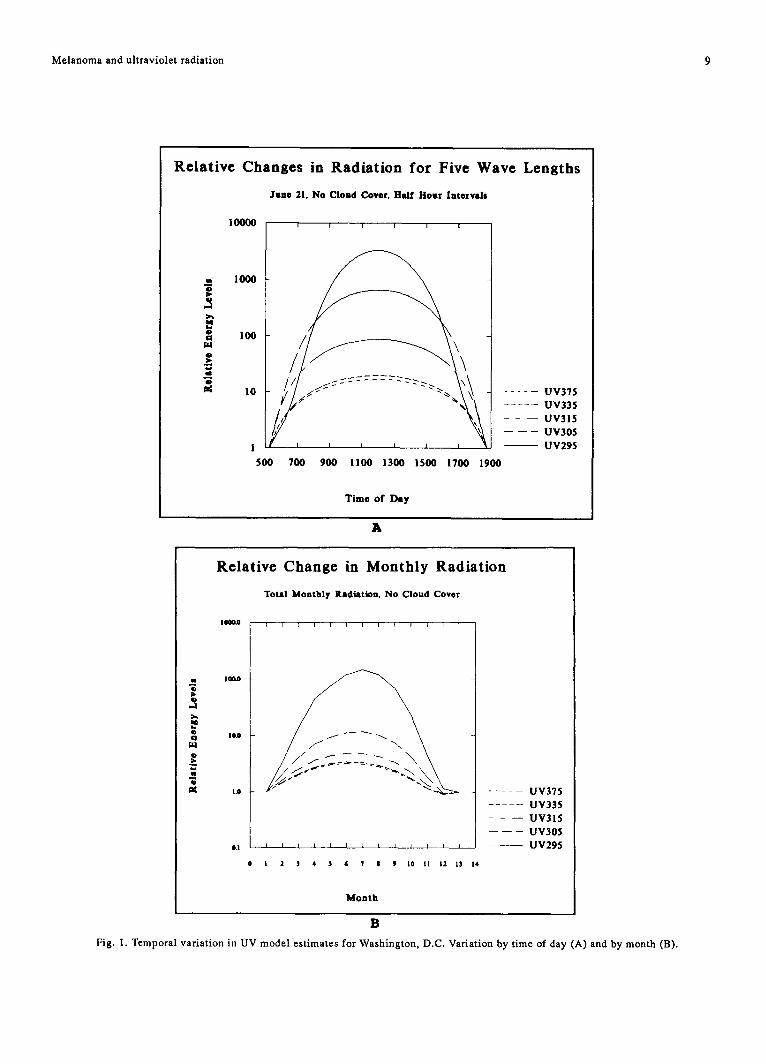
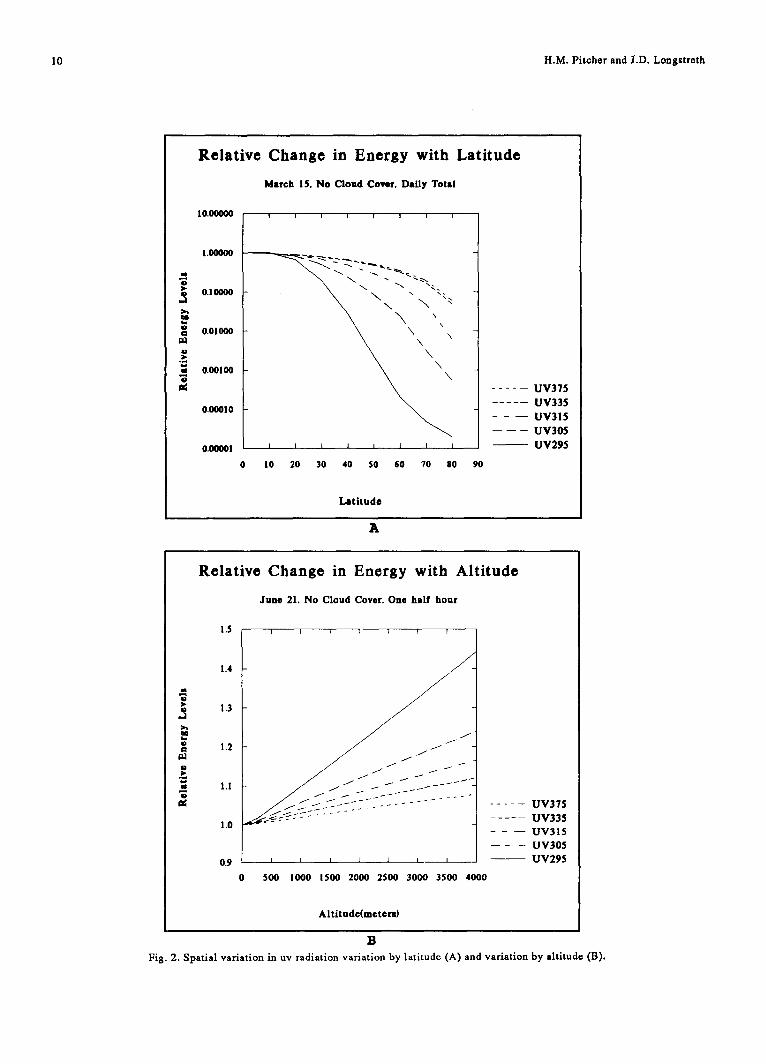
The implicit model of CMM induction used in this paper assumes that CMM stems from ultraviolet ra- diation-induced damage to the melanocyte. The role that solar radiation, and UV-B in particular, plays in the development of CMM requires an understanding of the natural variation of solar radiation, especially in the ultraviolet part of the spectrum, so a brief synopsis of the variability follows. The solar radia- tion reaching the earth spans the ultraviolet (200 to 400 nm), visible (400 to 900 nm), and infrared (about 900 to 4000 nm) wavebands. The ultraviolet region is generally additionally divided into the UV-C (200 to 280 nm), UV-B (280 to 320 nm) and UV-A (320 to 400 nm) regions. Ozone (O3), a highly energetic form of oxygen, occurs naturally in the stratosphere and is highly absorbent of shorter wavelength UV radiation (absorbing all UV-C and substantial portions of UV- B but virtually none of the UV-A). One effect of the ozone layer and the earth's rotation and revolution is the modification of the quality and quantity of solar energy (principally UV-B) delivered from place to place over time. The energy levels of wavelengths within the UV part of the spectrum show significant temporal and spatial variation; Fig. 1 shows the vari- ation in Washington, D.C. with time of day (1A), and by month (1B). Fig. 2 shows the variation by latitude (2A) and altitude (2B). Other factors that can affect the amount of UVR received at any location include cloud cover, reflectiveness of surfaces (albedo), and atmospheric aerosols.
In addition to the factors that modify the ambient levels of UVR in the environment, there are a number of factors that can influence the amount of energy
incident on an individual, and the amount of energy which penetrates through the upper layers of the skin to the melanocyte. The amount of energy actually received by the melanocyte will depend on behav- ioral characteristics such as when, where, and for how long an individual is outside, his/her clothing habits, and genetic characteristics such as the degree of skin pigmentation and thickening. Lacking infor- mation on exposure-related behavior, we use as esti- mates of exposure (i.e., estimated doses of UV) various weighted sums of energy delivered to a given loca- tion; for an individual remaining at this location this would be an upper bound on exposure rather than that which is actually received. Travel to locations with higher incident radiation could result in higher expo- sures. To control for genetic characteristics that might modify the dose received by melanocytes, we use 1980 census data on ethnic origin.
The action spectrum or weighting functions used to develop estimated doses reflect the relative ef- fectiveness of different wavelengths in causing the biological effect of interest. The appropriate action spectrum for CMM development is unknown. How- ever, a case can be made for either of two action spectra already determined: those for DNA damage and those for erythema. The choice between them is difficult, yet estimation of potentially effective doses will differ depending on which is chosen. If, for instance, damage to DNA is the underlying event linking solar radiation to CMM, the dose estimate should include energy only in the 290 to 320 nm waveband. In comparison, if the action spectrum for erythema is the more appropriate one, then energy from wavelengths above 320 nm will make a contri- bution to the dose estimate. For these weighted dose estimates, deriving the effective dose received by an individual is further complicated by the fact that the amount of potentially effective energy incident on the skin must be corrected for the filtering character- istics of the epidermis in order to determine how much energy reaches the melanocyte. Two features of the skin--melanin content and thickness--can con- tribute to significant reductions in the amount of energy which reaches the melanocytes. These fea- tures are highly variable among individuals and, in addition, will vary temporally since prior sun expo- sure both increases melanin levels and thickens the skin.
This report differs from previous efforts to esti- mate coefficients of the association between CMM mortality and exposure to ultraviolet radiation (Scott and Straf 1977; NRC 1982) by the larger size and longer time period of the sample from which it
M e l a n o m a a n d u l t r a v i o l e t r a d i a t i o n 9
Relative Changes in Radiation for Five Wave Lengths
J u n e 21. lqo C l o u d Cover . H a l f H o u r I n t e r v a l s
1 0 0 0 0 , , ,
m
g ~
O
l i t
1000
10O
10
\ I/I
1 t t t I t t
5 0 0 7 0 0 9 0 0 ! ! 0 0 1300 1500 1700 1900
. . . . . U V 3 7 5
. . . . . U V 3 3 5
- - - - U V 3 1 $
- - - - U V 3 0 5
- - U V 2 9 5
T i m e o f D a y
Relative Change in Monthly Radiation
Tota l M o n t h l y Rad ia t ion . No C l o u d Cover
| ~ J ~ [ 1 [ [ l I I I I J J I ]
m Q
m
q Q
1 0 0 . 0
l e e
1 . 0
O. I I l I I I I I t I I I l I
0 1 2 3 4 S | 7 I ! 1 0 11 I ! 13 1 4
. . . . . U V 3 7 5
. . . . . U V 3 3 5
- - - - U V 3 1 5
- - - - U V 3 0 5
- - U V 2 9 5
M o n t h
B
Fig . I . T e m p o r a l v a r i a t i o n in U V m o d e l e s t i m a t e s f o r W a s h i n g t o n , D . C . V a r i a t i o n b y t i m e of d a y (A) a n d b y m o n t h (B) .
10 H . M . P i t c h e r and I . D . L o n g s t r e t h
Relative
I0.00000
Change in Energy with Latitude
M a rc h 15. N o Cloud Cover . Daffy Tota l
us
g u.I
L I
_u , 0
!.00000
0.1004}0
0.01000
0.00100
0.00010
0.00001
\ \
I l i l I i l l
I0 20 30 40 50 60 70 80
. . . . . U V 3 7 5
. . . . . U V 3 3 5
- - - - U V 3 1 5
- - - - U V 3 0 5
- - U V 2 9 5
90
Latitude
sa
o
o
o
g
o
Relative Change in Energy with Altitude
J u n e 21. No Cloud Cover. One h a l f h o u r
l.S , , , ~ ~ I l
1 . 4
1.3
1.2
1.1
1.0
0.9
J
i i I i L I I
0 500 I000 1500 2000 2$00 3000 3500 4000
. . . . . U V 3 7 5
. . . . . U V 3 3 5
- - - U V 3 1 $
- - - - U V 3 0 5
- - U V 2 9 5
A l t i t u d e ( m e t e r s )
B Fig. 2. S pa t i a l v a r i a t i o n in uv r a d i a t i o n v a r i a t i o n b y l a t i t u d e (A) an d v a r i a t i o n by a l t i t ude (B).
M e l a n o m a and u l t ravio le t radia t ion 11
derives its response measures and by its use of satel- lite measurements of column ozone to estimate am- bient levels of UV radiation fluxes, thus overcoming the extremely limited availability of actual data on UV radiation. Because of this enhanced data set, it has also been possible to control not only for con- founding variables such as ethnicity and income but also for the strong birth cohort effect which has been seen in many studies of melanoma incidence (Magnus 1982; Osterlind and Jensen 1986) and mortality (Roush et al. 1985).
The study had two major aims. The first was to evaluate the various empirical relationships between UV and melanoma mortality, and to determine if any specific estimate of dose showed a stronger associa- tion with mortality than any other. The second aim was to use one or more of these empirical relation- ships to develop population-based estimates of CMM mortality risk that would be associated with a poten- tial decrease in stratospheric ozone levels.
MATERIALS AND METHODS
Exposure models
Given below is a brief description of the exposure model used to estimate UV exposures. A detailed description of the exposure model is presented in Serafino and Frederick (1986), and a brief discussion of its validation with ground-based measurements of UV by Robertson-Berger (R-B) meters is also pres- ent.
The exposure estimates in this analysis are based on estimated ultraviolet fluxes as a function of wavelength produced by a computer model (here- after referred to as UVM) developed by Serafino and Frederick (1987). The UVM uses global scale ozone measurements obtained by the solar backscattered ultraviolet (SBUV) spectral radiometer carried on the Nimbus 7 satellite.
The UVM estimates UV fluxes based on one of two states; clear or cloudy skies. In the clear sky case, the lower boundary of the model (the ground) is considered to be a surface of specified albedo and the algorithm produces estimates of UV at the ground as a function of wavelength, solar zenith angle (local time), and ozone amount. In the case of cloudy skies, the clear sky case is merged with a cloudy sky model which divides the atmosphere into layers of known reflectivity and transmission. Clouds occupy the up- permost layers, while the bottom layer is the ground with a transmission of zero.
The data used as the basis for the UV estimates are total column ozone and vertical ozone profiles de-
rived from the SBUV measurements averaged over one-month time intervals and over all longitudes in 10-degree wide latitude bands. These month by 10-degree means are associated with the middle of each month and latitude "bin". Interpolation in lat- itude and time then provides the ozone amount for a specific location and time of year. Information on the extraterrestrial solar irradiance, ozone absorp- tion cross sections, and Rayleigh scattering cross section (WHO/NASA 1986) are then input into the algorithm with the ozone amount for the specific location and time and day of year, and the output in ground-level instantaneous flux by waveband is then generated. The output may also be generated as mean fluxes over the daylight portion of a 24-h period or as cumulative fluxes over specified time periods such as an hour, a month or a year.
The model as described by Serafino and Frederick (1986) has default fractional cloud cover as a func- tion of latitude and month from Hughes (1984). In this report, those defaults were replaced with weather data acquired from a weather station in each Standard Metropolitan Area (SMA). Details on how these data were gathered and used are given below in the section on data base development.
Three estimates of UV exposure were initially eval- uated in this analysis; "peak day dose," "June dose," and "annual dose". The "peak day dose" is the amount of UV radiation delivered to the identified location (i.e., SMA), on a clear day in mid-June, the "June dose" is the total amount delivered during the month of June, and the "annual dose" is the total amount delivered over a year. The latter two doses are mod- ified to reflect, respectively, the monthly or yearly average degree of cloud cover.
Note that the doses estimated using these proce- dures are potential doses for average individuals liv- ing in the SMA represented by a particular weather station. The doses estimated would be the total po- tential dose (as opposed to the actual dose received) and do not take into account differences in behavior which might systematically modify the relationship between actual and potential dose. In this regard, this methodology could suffer from the ecological fal- lacy, for it assumes that the behavior of individuals is not remarkably different from location to location and, thus, that the doses estimated, while not esti- mates of dose actually received, are representative of such doses and not location-based.
An extensive effort to validate the NASA UV model using ground-based measurements of UVR by Robertson-Berger (R-B) meters is in progress with the participation of Pitcher. Preliminary evaluation
12 H.M. Pitcher and I.D. Longstreth
of the efforts indicates that the model overpredicts incident energy as the sun approaches the hori- z o n - p o s s i b l y because it fails to account for aerosols (Green et al. 1974). Since energy levels are low for large zenith angles, especially in the part of the spec- trum strongly affected by changes in ozone, the error introduced into the exposure variables by this prob- lem is small. For El Paso, the relative error for the cumulative annual R-B measure is 0.4%, for San Francisco, it is 8.4%, and for Minneapolis it is 16%.
Data base development
Four separate sources of data have been developed for this study. They consist of 1) death rates by five year age groups by SMA, 2) weather data (primarily cloud cover) for each SMA, 3) a set of model-esti- mated, weighted doses for each SMA (e.g., including doses estimated under three exposure scenarios and two or three weighting functions), and 4) a set of
control variables (ethnicity, income, education, and occupation) for each SMA. Each of these data base development efforts is described below.
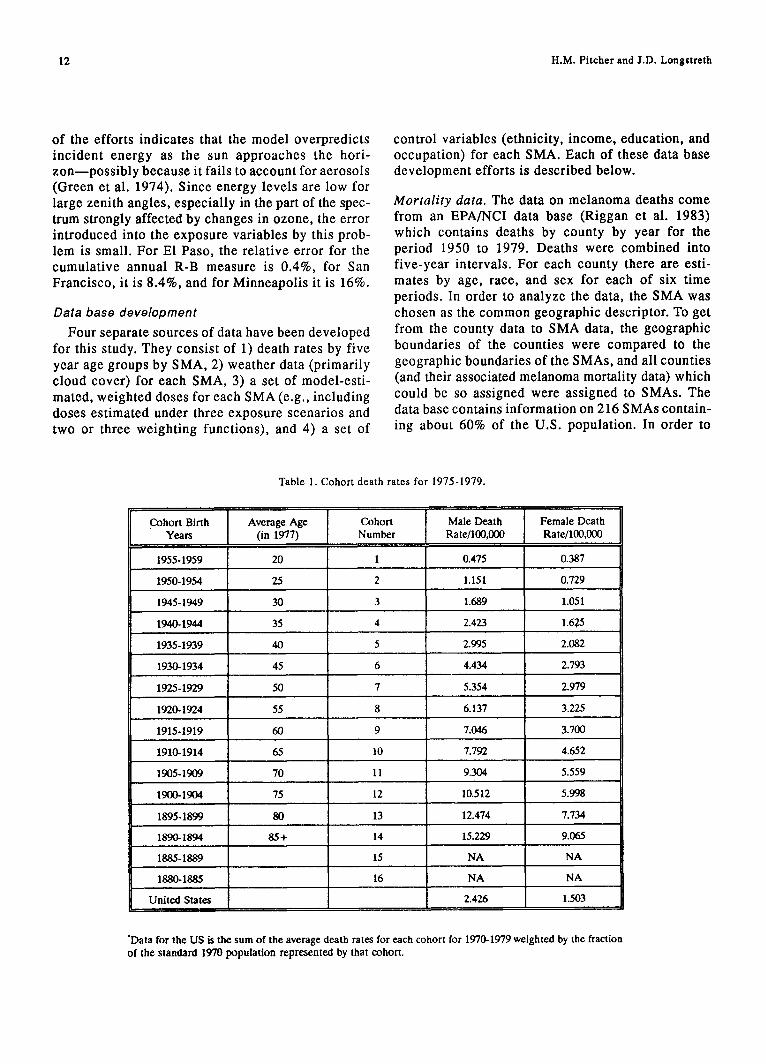
Mortality data. The data on melanoma deaths come from an EPA/NCI data base (Riggan et al. 1983) which contains deaths by county by year for the period 1950 to 1979. Deaths were combined into five-year intervals. For each county there are esti- mates by age, race, and sex for each of six time periods. In order to analyze the data, the SMA was chosen as the common geographic descriptor. To get from the county data to SMA data, the geographic boundaries of the counties were compared to the geographic boundaries of the SMAs, and all counties (and their associated melanoma mortality data) which could be so assigned were assigned to SMAs. The data base contains information on 216 SMAs contain- ing about 60% of the U.S. population. In order to
Table 1. Cohort death rates for 1975-1979.
Cohort Birth Average Age Cohort Male Death Female Death Years (in 1977) Number Rate/100,000 Rate/100,000
1955-1959 20 1 0.475 0.387
1950-1954 25 2 1.151 0.729
1945-1949 30 3 1.689 1.051
1940-1944 35 4 2.423 1.67.5
1935-1939 40 5 2.995 2.082
1930-1934 45 6 4.434 2.793
1925-1929 50 7 5.354 2.979
1920-1924 55 8 6.137 3.225
1915-1919 60 9 7.046 3.700
1910-1914 65 10 7.792 4.652
1905-1909 70 11 9.304 5.559
1900-1904 75 12 10.512 5.998
1895-1899 80 13 12.474 7.734
1890-1894 85+ 14 15.229 9.065
1885-1889 15 NA NA
1880-1885 16 NA NA
2.426 1.503 UmtedSmtes
"Data for the US is the sum of the average death rates for each cohort for 1970-1979 weighted by the fraction of the standard 1970 population represented by that cohort.
Melanoma and ultraviolet radiation 13
Table 2. Characteristics of three weighting functions as applied to peak (June 15) UVR annual doses.
Mean
June 15
Maximum
R-B Meter
June 15 Annual
746 110,282
51.1 22,539
589 46,128
885 165,083
3.27
DNA
Annual
437
St. Dev. 0.492 131
Minimum 1.75 118
4.23 816
Erythema
June 15 ] Annual
312 42,800
40.0 11,7o3
187 13,224
393 74,857
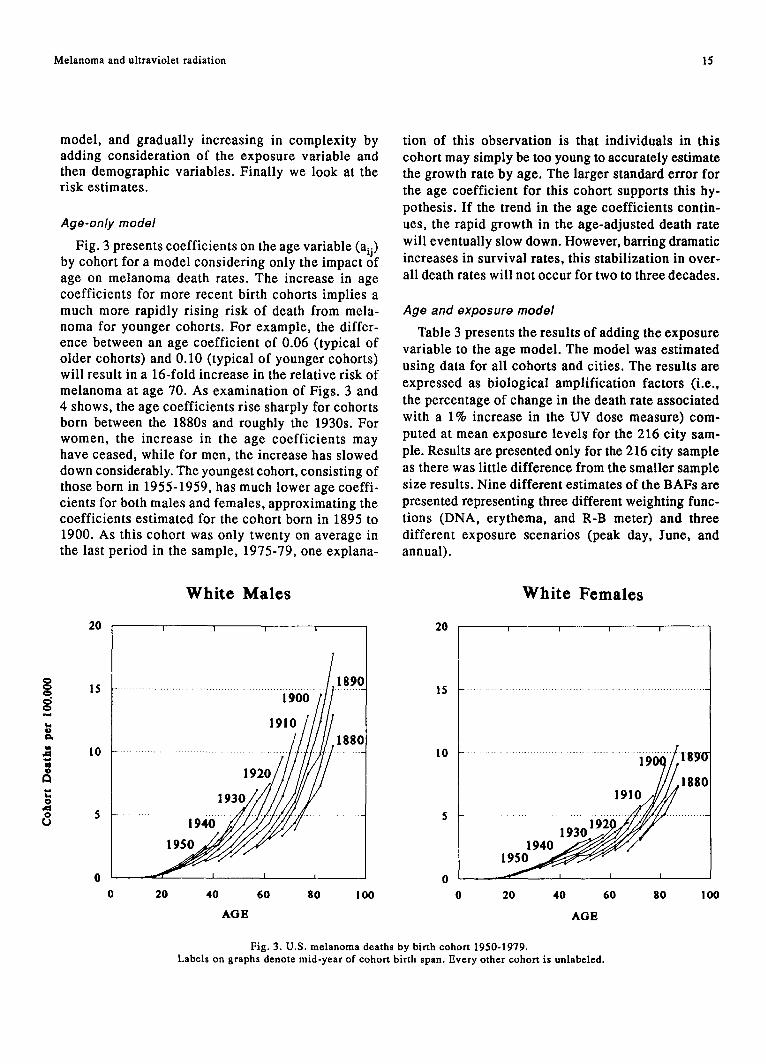
further refine the analysis, SMAs were also divided into one of three groups on the basis of size. The analysis was then sometimes limited to the 31 SMAs with white female populations of 500 000 or greater, or the 70 SMAs with white female populations of 250 000 or greater. Death rates were estimated by taking total deaths for the period (e.g., 1950-1954) and dividing by five times the population in the middle year (e.g., 1952). Rates were expressed on a per 100 000 basis. Melanoma death rates were used instead of absolute numbers in order to treat the cities/SMAs as comparable units. These rates consti- tute the dependent variables used in the study. Table 1 presents cohort death rates for 16 male and female cohorts who died in the 1975-79 period, as well as overall death rates for the same period for the United States. Fig. 2 presents the male and female cohort death rates for the period 1950-1979. Examination of Fig. 2 reveals that younger cohorts reach the same death rate at a much earlier age than the older co- horts, and that rates are higher for men than women.
Model estimated, weighted doses. The second data set contains model estimates of ultraviolet radiation doses. These estimates were based on outputs of the UVM in terms of UV flux by location and time of day and year, modified by the application of different weighting functions derived from various biological action spectra or the response function for the R-B meter. The UVM uses inputs of latitude, longitude, altitude, surface albedo, total column ozone, and cloud cover.
The model provides energy estimates in millijoules per nanometer every five nanometers. These data are input into an interpolation routine which develops estimates for every nanometer from 290 to 399 nm. These interpolated data are then either summed by five nanometer bandwidths or input into weighting functions derived from various action spectra and output as energy equivalent values in five nanometer
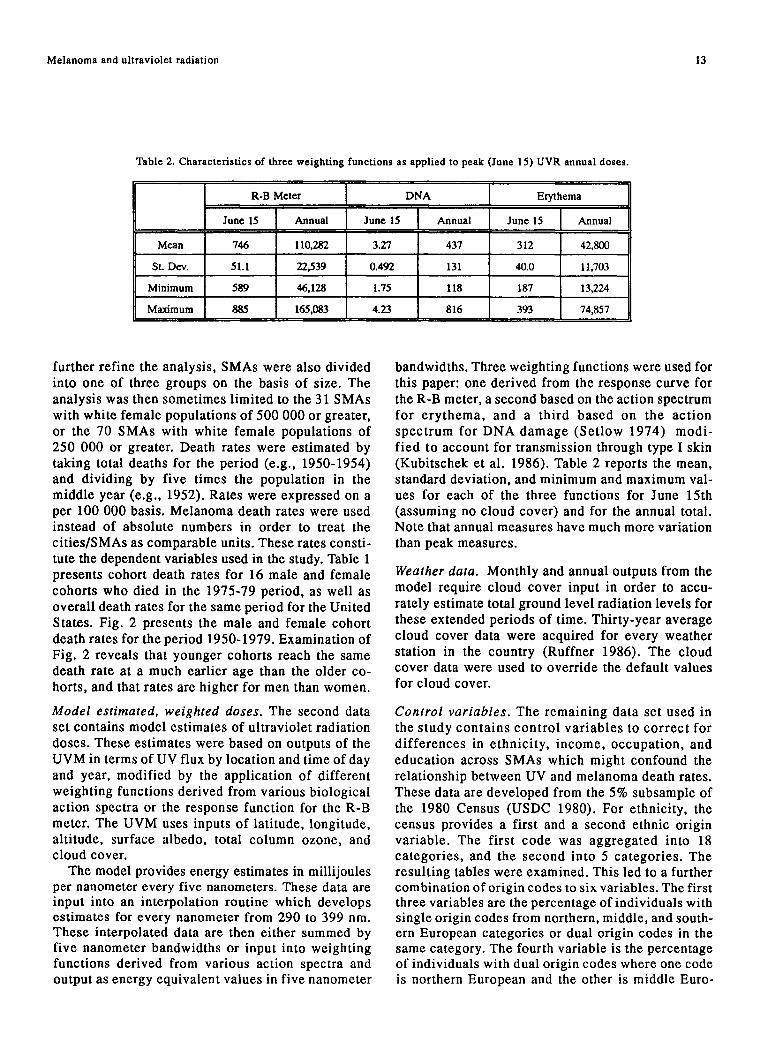
bandwidths. Three weighting functions were used for this paper: one derived from the response curve for the R-B meter, a second based on the action spectrum for e ry thema, and a third based on the action spectrum for DNA damage (Setlow 1974) modi- f ied to account for transmission through type I skin (Kubitschek et al. 1986). Table 2 reports the mean, standard deviation, and minimum and maximum val- ues for each of the three functions for June 15th (assuming no cloud cover) and for the annual total. Note that annual measures have much more variation than peak measures.
Weather data. Monthly and annual outputs from the model require cloud cover input in order to accu- rately estimate total ground level radiation levels for these extended periods of time. Thirty-year average cloud cover data were acquired for every weather station in the country (Ruffner 1986). The cloud cover data were used to override the default values for cloud cover.
Control variables. The remaining data set used in the study contains cont ro l var iables to cor rec t for di f ferences in ethnicity, income, occupation, and education across SMAs which might confound the relationship between UV and melanoma death rates. These data are developed from the 5% subsample of the 1980 Census (USDC 1980). For ethnicity, the census provides a first and a second ethnic origin variable. The first code was aggregated into 18 categories, and the second into 5 categories. The resulting tables were examined. This led to a further combination of origin codes to six variables. The first three variables are the percentage of individuals with single origin codes from northern, middle, and south- ern European categories or dual origin codes in the same category. The fourth variable is the percentage of individuals with dual origin codes where one code is northern European and the other is middle Euro-
14 H.M. Pitcher and I.D. Longstreth
pean. The fifth variable is the percentage of individ- uals with any other European origin codes, and the sixth is those listing U.S., American, or North Amer- ican as their origin. The income variable is the aver- age household income associated with the individual. This was felt to be most relevant since it probably best reflected access to vacations and medical care. The occupation variable is the percent of those at work with outdoor occupations. The education vari- able is the mean year of education completed for those over 14. Because of the need to create control variables from the 5% subsample of the 1980 Census, it was necessary to create a matching file so that geographically coterminous data sets could be devel- oped from the counties in the EPA/NCI data base and geographic identifiers on the census file. This match- ing file was used to combine counties to define the data set for each SMA. These usually coincide with the census definition of the SMA, but in some cases include one or more counties outside the census def- inition of the SMA.
It is important to note that the information on control variables and exposure is constant for each city. It would have been desirable to create control variables for each cohort, but for small SMAs the 5% census sample from which the control variables were created is too small to estimate the variables for the number of birth cohorts in use.
Dose-response models. The two dose-response mod- els used in this report are taken from earlier studies by Fears et al. (1977) and Fears and Scotto (1983). The first model assumes an exponential relationship between UV dose and melanoma incidence or death rates (the exponential model), whereas the second model assumes a proportionality between the loga- rithms of UV doses and melanoma death rates (the power model). The latter transformation is suggested by Fears and Scotto (1983) to be supported by the work of Armitage and Doll (1954) and Nordling ( 1953) which indicated that the logarithm of incidence should be proportional to the logarithm of the dose rate of a carcinogen. Using these models and incorporating the effects of age on cohort death rates require addi- tive rather than multiplicative error terms. The addi- tive errors require the use of the non-linear regression techniques. Since, as Fig. 2 shows, the death rates for males and females are clearly different, all regres- sions were run separately for males and females.
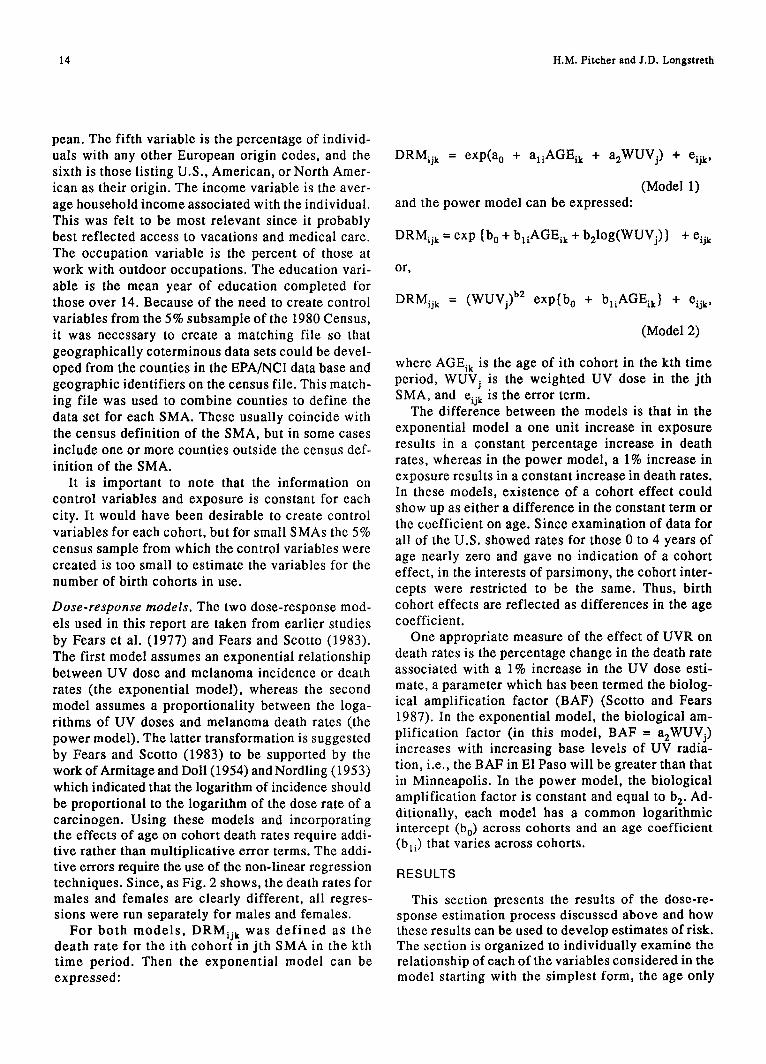
For both models , D R M i j k w a s def ined as the death rate for the ith cohort in jth SMA in the kth time period. Then the exponential model can be expressed:
DRMij k = exp(a 0 + al iAGEik + a2WUV j) + eij k,
(Model 1) and the power model can be expressed:
DRMij k = exp {b 0 + bliAGEik + b21og(WUVj)} + eij k
or,
DRMij k = (WUVj) b2 exp{b 0 + bliAGEik} + eij k,
(Model 2)
where AGEik is the age of ith cohort in the kth time period, WUVj is the weighted UV dose in the jth SMA, and eij k is the error term.
The difference between the models is that in the exponential model a one unit increase in exposure results in a constant percentage increase in death rates, whereas in the power model, a 1% increase in exposure results in a constant increase in death rates. In these models, existence of a cohort effect could show up as either a difference in the constant term or the coefficient on age. Since examination of data for all of the U.S. showed rates for those 0 to 4 years of age nearly zero and gave no indication of a cohort effect, in the interests of parsimony, the cohort inter- cepts were restricted to be the same. Thus, birth cohort effects are reflected as differences in the age coefficient.
One appropriate measure of the effect of UVR on death rates is the percentage change in the death rate associated with a 1% increase in the UV dose esti- mate, a parameter which has been termed the biolog- ical amplification factor (BAF) (Scotto and Fears 1987). In the exponential model, the biological am- plification factor (in this model, BAF -- a2WUVj) increases with increasing base levels of UV radia- tion, i.e., the BAF in E1 Paso will be greater than that in Minneapolis. In the power model, the biological amplification factor is constant and equal to b 2. Ad- ditionally, each model has a common logarithmic intercept (bo) across cohorts and an age coefficient (bli) that varies across cohorts.
RESULTS
This section presents the results of the dose-re- sponse estimation process discussed above and how these results can be used to develop estimates of risk. The section is organized to individually examine the relationship of each of the variables considered in the model starting with the simplest form, the age only
Melanoma and ultraviolet radiation 15
model, and gradually increasing in complexity by adding consideration of the exposure variable and then demographic variables. Finally we look at the risk estimates.
Age-only model
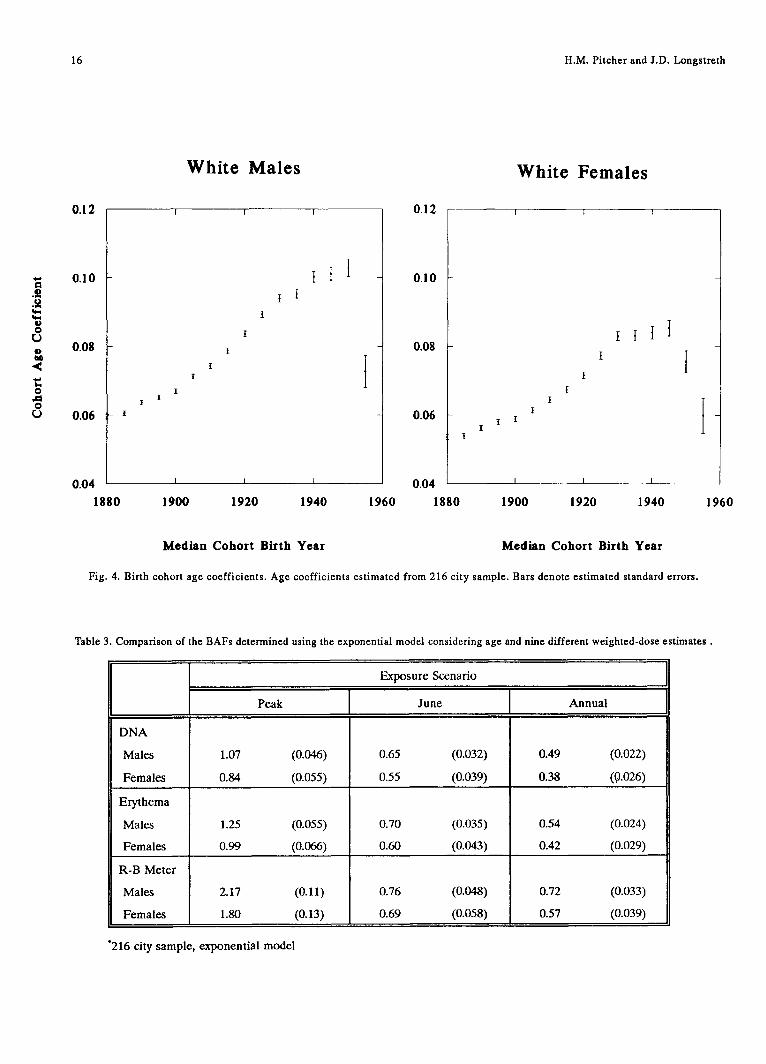
Fig. 3 presents coefficients on the age variable (aij) by cohort for a model considering only the impact of age on melanoma death rates. The increase in age coefficients for more recent birth cohorts implies a much more rapidly rising risk of death from mela- noma for younger cohorts. For example, the differ- ence between an age coefficient of 0.06 (typical of older cohorts) and 0.10 (typical of younger cohorts) will result in a 16-fold increase in the relative risk of melanoma at age 70. As examination of Figs. 3 and 4 shows, the age coefficients rise sharply for cohorts born between the 1880s and roughly the 1930s. For women, the increase in the age coefficients may have ceased, while for men, the increase has slowed down considerably. The youngest cohort, consisting of those born in 1955-1959, has much lower age coeffi- cients for both males and females, approximating the coefficients estimated for the cohort born in 1895 to 1900. As this cohort was only twenty on average in the last period in the sample, 1975-79, one explana-
tion of this observation is that individuals in this cohort may simply be too young to accurately estimate the growth rate by age. The larger standard error for the age coefficient for this cohort supports this hy- pothesis. If the trend in the age coefficients contin- ues, the rapid growth in the age-adjusted death rate will eventually slow down. However, barring dramatic increases in survival rates, this stabilization in over- all death rates will not occur for two to three decades.
Age and exposure model
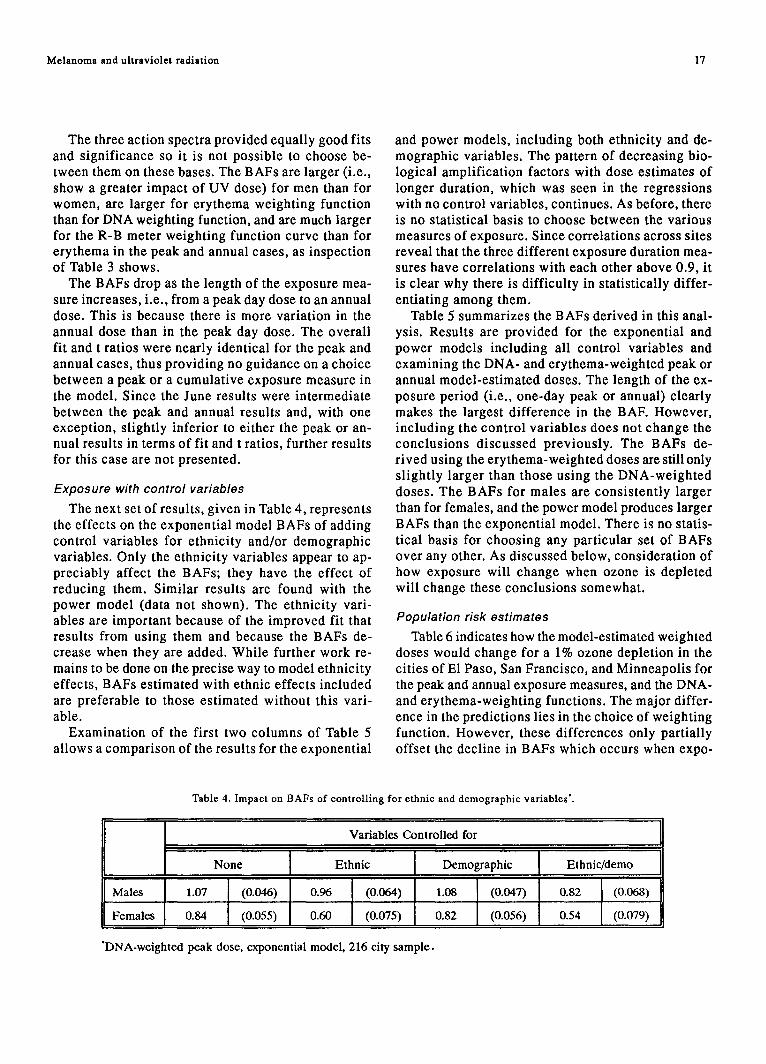
Table 3 presents the results of adding the exposure variable to the age model. The model was estimated using data for all cohorts and cities. The results are expressed as biological amplification factors (i.e., the percentage of change in the death rate associated with a 1% increase in the UV dose measure) com- puted at mean exposure levels for the 216 city sam- ple. Results are presented only for the 216 city sample as there was little difference from the smaller sample size results. Nine different estimates of the BAFs are presented representing three different weighting func- tions (DNA, erythema, and R-B meter) and three different exposure scenarios (peak day, June, and annual).
O
O O i,,,*
U e x
qD
0
0
White Males White Females
20 I I I I 20
1890 15 . . . . . . . . . . . . . . . . . . . . . . . . . . . . . . . . . . . . . . . . . . . . . . . . . . . . . i900 ...............
191~i//~1880
1920 1930
5 .................... i940 . . . . . . . . . . . . . . . . . . . .
0 t J i
0 20 40 60 80 I00
15
tO
1910"7//1880
~ 1 9 3 0 1 9 2
0 ....
0 20 40 60 80 1 O0
AGE AGE
Fig. 3. U.S. melanoma deaths by birth cohort 1950-1979. Labels on graphs denote mid-year of cohort birth span. Every other cohort is unlabeled.
16 H.M. Pitcher and J.D. Longstreth
White Males White Females
0.12 0.12 I I I I I I
U 0
r~ qk~
0 , e l 0
0.10
0.08
0.06 I
I
I I
t I
t t
t t t
I I t
0.10
0.08
0.06 I
I
I I I
I I
0.04 I I J 0.04 I I I
1880 1900 1920 1940 1960 1880 1900 1920 1940 1960
Median Cohort Birth Year Median Cohort Birth Year
Fig. 4. Birth cohort age coefficients. Age coefficients estimated from 216 city sample. Bars denote estimated standard errors.
Table 3. Comparison of the BAFs determined using the exponential model considering age and nine different weighted-dose estimates.
DNA
Males
Females
Erythema
Males
Females
R-B Meter
Males
Females
Exposure Scenario
Peak
1.07 (0.046)
0.84 (0.055)
1.25 (0.055)
0.99 (0.066)
2.17 (0.11)
1.80 (0.13)
June
0.65 (0.032)
0.55 (0.039)
0.70 (0.035)
0.60 (0.043)
0.76 (0.048)
0.69 (0.058)
Annual
0.49 (0.022)
0.38 (0.026)
0.54 (0.024)
0.42 (0.029)
0.72 (0.033)
0.57 (0.039)
"216 city sample, exponential model
Melanoma and ultraviolet radiation 17
The three action spectra provided equally good fits and significance so it is not possible to choose be- tween them on these bases. The BAFs are larger (i.e., show a greater impact of UV dose) for men than for women, are larger for erythema weighting function than for DNA weighting function, and are much larger for the R-B meter weighting function curve than for erythema in the peak and annual cases, as inspection of Table 3 shows.
The BAFs drop as the length of the exposure mea- sure increases, i.e., from a peak day dose to an annual dose. This is because there is more variation in the annual dose than in the peak day dose. The overall fit and t ratios were nearly identical for the peak and annual cases, thus providing no guidance on a choice between a peak or a cumulative exposure measure in the model. Since the June results were intermediate between the peak and annual results and, with one exception, slightly inferior to either the peak or an- nual results in terms of fit and t ratios, further results for this case are not presented.
Exposure with control variables
The next set of results, given in Table 4, represents the effects on the exponential model BAFs of adding control variables for ethnicity and/or demographic variables. Only the ethnicity variables appear to ap- preciably affect the BAFs; they have the effect of reducing them. Similar results are found with the power model (data not shown). The ethnicity vari- ables are important because of the improved fit that results from using them and because the BAFs de- crease when they are added. While further work re- mains to be done on the precise way to model ethnicity effects, BAFs estimated with ethnic effects included are preferable to those estimated without this vari- able.
Examination of the first two columns of Table 5 allows a comparison of the results for the exponential
and power models, including both ethnicity and de- mographic variables. The pattern of decreasing bio- logical amplification factors with dose estimates of longer duration, which was seen in the regressions with no control variables, continues. As before, there is no statistical basis to choose between the various measures of exposure. Since correlations across sites reveal that the three different exposure duration mea- sures have correlations with each other above 0.9, it is clear why there is difficulty in statistically differ- entiating among them.
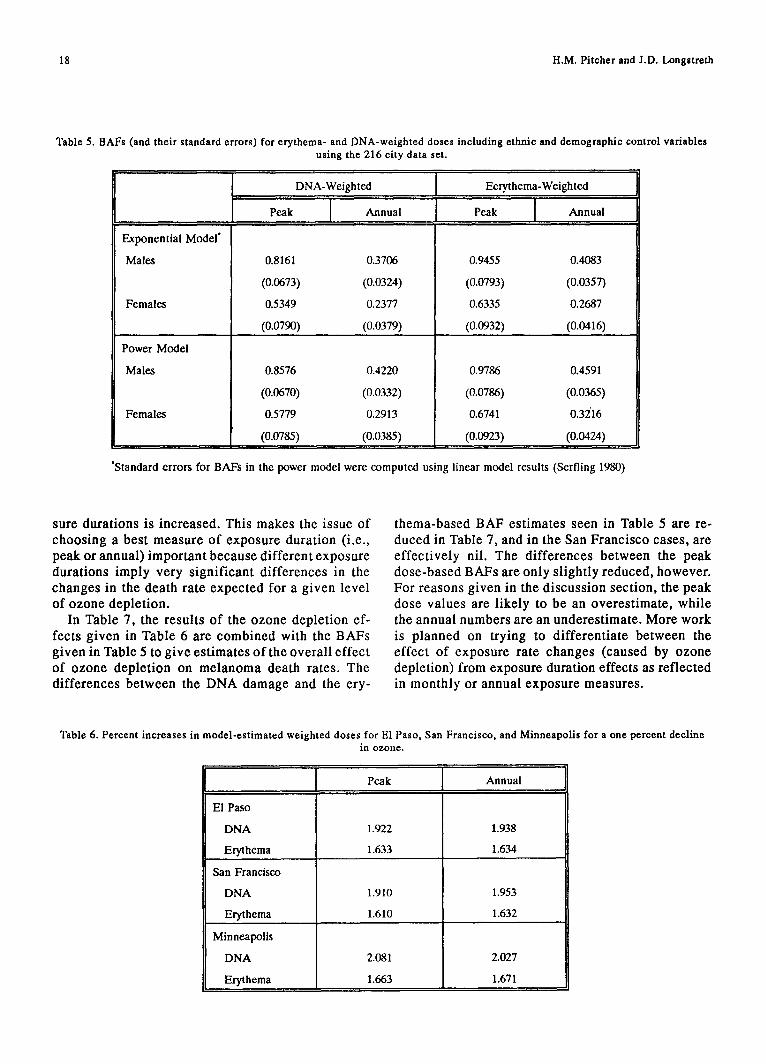
Table 5 summarizes the BAFs derived in this anal- ysis. Results are provided for the exponential and power models including all control variables and examining the DNA- and erythema-weighted peak or annual model-estimated doses. The length of the ex- posure period (i.e., one-day peak or annual) clearly makes the largest difference in the BAF. However, including the control variables does not change the conclusions discussed previously. The BAFs de- rived using the erythema-weighted doses are still only slightly larger than those using the DNA-weighted doses. The BAFs for males are consistently larger than for females, and the power model produces larger BAFs than the exponential model. There is no statis- tical basis for choosing any particular set of BAFs over any other. As discussed below, consideration of how exposure will change when ozone is depleted will change these conclusions somewhat.
Population risk estimates
Table 6 indicates how the model-estimated weighted doses would change for a 1% ozone depletion in the cities of E1 Paso, San Francisco, and Minneapolis for the peak and annual exposure measures, and the DNA- and erythema-weighting functions. The major differ- ence in the predictions lies in the choice of weighting function. However, these differences only partially offset the decline in BAFs which occurs when expo-
Table 4. Impact on BAFs of controlling for ethnic and demographic variables'.
Variables Controlled for I I I
None Ethnic Demographic Ethnic/demo
Males 1.07 (0.046) 0 .96 (0.064) 1.08 (0.047) 0 .82 (0.068)
Females 0.84 (0.055) 0 .60 (0.075) 0.82 (0.056) 0 .54 (0.079)
"DNA-weighted peak dose, exponential model, 216 city sample.
18 H.M. Pitcher and J.D. Longstreth
Table 5. BAFs (and their standard errors) for erythema- and DNA-weighted doses including ethnic and demographic control variables using the 216 city data set.
Exponential Model"
Males
Females
Power Model
Males
Females
DNA-Weighted Eerythema-Weighted
Peak Annual
0.8161 0.3706
(0.0673) (0.0324)
0.5349 0.2377
(0.0790) (0.0379)
0.8576 0.4220
(0.0670) (0.0332)
0.5779 0.2913
(0.0785) (0.0385)
Peak Annual
0.9455 0.4083
(0.0793) (0.0357)
0.6335 0.2687
(0.0932) (0.0416)
0.9786 0.4591
(0.0786) (0.0365)
0.6741 0.32'16
(0.0923) (0.0424)
"Standard errors for BAFs in the power model were computed using linear model results (Serfling 1980)
sure durat ions is increased. This makes the issue of choos ing a best measure of exposure durat ion (i.e., peak or annual) impor tan t because di f ferent exposure durat ions imply very s ignif icant d i f ferences in the changes in the death rate expec ted for a g iven level of ozone deplet ion.
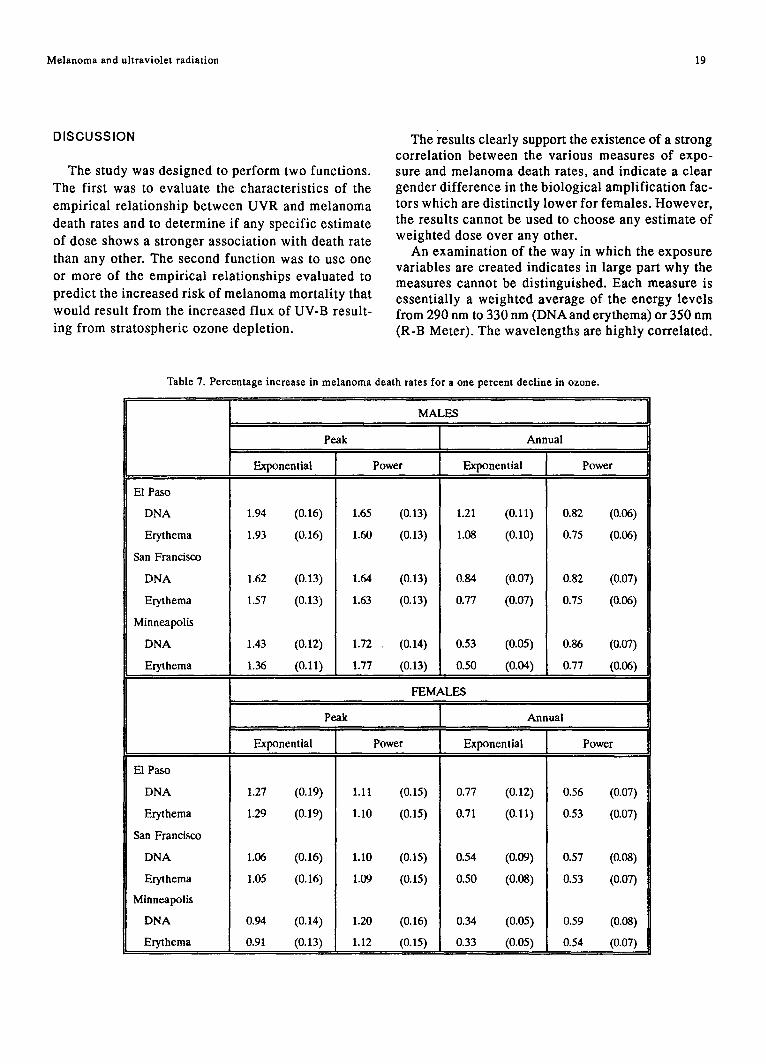
In Table 7, the resul ts o f the ozone deplet ion ef- fects g iven in Table 6 are combined with the BAFs g iven in Table 5 to g ive es t imates o f the overal l e f fec t of ozone deple t ion on m e l anom a death rates. The d i f fe rences be tween the DNA damage and the ery-
thema-based BAF es t imates seen in Table 5 are re- duced in Table 7, and in the San Franc isco cases, are e f fec t ive ly nil. The d i f fe rences be tween the peak dose -based BAFs are only s l ight ly reduced, however . For reasons given in the discuss ion sect ion, the peak dose values are l ikely to be an overes t imate , while the annual numbers are an underes t imate . More work is p lanned on trying to d i f ferent ia te be tween the ef fec t of exposure rate changes (caused by ozone depletion) from exposure duration effects as ref lec ted in month ly or annual exposure measures .
Table 6. Percent increases in model-estimated weighted doses for E1 Paso, San Francisco. and Minneapolis for a one percent decline
El Paso
DNA
Erythema
San Francisco
DNA
Erythema
Minneapolis
DNA
Erythema
in ozone.
Peak
1.922
1.633
1.910
1.610
2.081
1.663
Annual
1.938
1.634
1.953
1.632
2.027
1.671
Melanoma and ultraviolet radiation 19
DISCUSSION
The study was des igned to pe r fo rm two funct ions.
The first was to evalua te the charac ter i s t ics of the
empir ica l re la t ionship be tween UVR and m e l a n o m a
death rates and to de te rmine if any specif ic es t imate
of dose shows a s t ronger assoc ia t ion with death rate
than any other. The second funct ion was to use one or more of the empir ica l re la t ionships eva lua ted to
predic t the increased r isk of m e l anom a mor ta l i ty that would resul t f rom the increased flux of UV-B result-
ing f rom s t ra tospher ic ozone deplet ion.
The results clearly support the existence of a strong corre la t ion be tween the var ious measures of expo- sure and me lanoma death rates, and indicate a c lear gender d i f ference in the b io logica l ampl i f ica t ion fac- tors which are dis t inct ly lower for females . However , the resul ts cannot be used to choose any es t imate of weighted dose over any other.
An examina t ion of the way in which the exposure var iables are created indicates in large par t why the measures cannot be dis t inguished. Each measure is essent ia l ly a weighted average of the energy levels from 290 nm to 330 nm (DNA and erythema) or 350 nm (R-B Meter) . The wave leng ths are highly correlated.
Table 7. Percentage increase in melanoma death rates for a one percent decline in ozone.
El Paso
DNA
Erythema
San Francisco
DNA
Erythema
Minneapolis
DNA
Erythema
MALES
Peak Annual
Exponential Power Exponential Power
1.94 (0.16)
1.93 (0.16)
1.62 (o.13)
1.57 (o.13)
1.43 (0.12)
1.36 (o.11)
1.65 (0.13)
1.60 (0.13)
1.64 (0.13)
1.63 (0.13)
1.72 ~ (0.14)
1.77 (0.13)
1.21 (0.11)
1.08 (0.10)
0.84 (0.07)
0.77 (0.07)
0.53 (0.05)
0.50 (0.04)
0.82 (0.06)
0.75 (0.06)
0.82 (0.07)
0.75 (0.06)
0.86 (o.o7)
0.77 (0.06)
El Paso
DNA
Erythema
San Francisco
DNA
Erythema
Minneapolis
DNA
Erythema
FEMALES
Peak Annual
Exponential Power Exponential Power
1.27 (0.19)
1.29 (0.19)
1.06 (0.16)
1.05 (0.16)
0.94 (0.14)
0.91 (0.13)
1.11 (0.15)
1.10 (0.15)
1.10 (0.15)
1.09 (0.15)
1.20 (0.16)
1.12 (0.15)
0.77 (0.12)
0.71 (0.11)
0.54 (0.09)
0.50 (0.08)
0.34 (0.05)
0.33 (0.05)
0.56
0.53
0.57
0.53
0.59
0.54
(o.o7)
(o.o7)
(o.08)
(0.07)
(0.08)
(0.07)
20 H.M. Pitcher and J.D. Longstreth
Thus, for example, the correlation of 310-314 nm with 315-319 nm is 0.960 for the peak measure. Since information based on one wavelength provides a great deal of information about other wavelengths, it is difficult to distinguish between them. This corre- lation also makes it impossible to estimate the effect of variation in a single waveband.
From the point of view of computing effects, it is not very important to choose between the erythema and DNA action-weighted doses. As the data in Table 6 indicate, the increase in estimated dose for a given level of ozone depletion does not change much for these two measures. Neither is there much difference in 216-city BAFs for the two measures in Table 5. Therefore, we have used the DNA coefficients for our computations since there is a clearer potential link for this exposure measure to a biological mechanism.
As mentioned in the results section, it is crucial to choose a length of exposure period. The annual mea- sure of exposure has a BAF of about 50% (Table 5) of that found for the peak measure. This difference is clearly significant in both a practical and statisti- cal sense. As discussed in the EPA's Ultraviolet Ra- diation and Melanoma (USEPA 1987), one of the most likely hypotheses to explain all of the available data about melanoma would support a peak (as in sunburn) exposure measure. The issue is then to un- derstand why it is inappropriate to simply adapt the peak results as being best since they are apparently consistent with the biology. The answer is that the potential number of days on which one can get a peak exposure varies significantly from south to north. E1 Paso has about double the number of clear days found in Minneapolis, with exposure levels equal to or greater than those found in Minneapolis in the summertime. Since ozone depletion alone will not appreciably change total incoming radiation, and hence temperature, we need to have a measure which re- flects only the dose rate and not the differences in the chance of getting a dose. More work is planned on this issue.
Differences between the power model and the ex- ponential model are large enough that more work needs to be done to see if a sharper distinction can be made between the two models. Especially at ozone depletion levels above 10%, the models imply a sharp north/south difference in the predicted effects of such a depletion, although ov~erall effects should be about the same. Finally, the potential impacts on mortality caused by decreases in ozone in the 10-20% range are quite large if no other changes occur. In contrast to many other risk assessments, the change in radiation levels associated with 10-20% depletions is well within
the range of exposure for our data set. Barring other changes, a depletion of 10% would increase the death rate by 16% (power model--Table 7) for males and 11% for females.
However, other changes are bound to occur. Sim- ple preventative measures, like wearing a sunscreen can sharply reduce exposure, especially the peak exposures which the weight of the current evidence suggests provide the best explanation of the role of UV in affecting melanoma death rates. The large difference in age coefficients across cohorts is sug- gestive of how large the impact of such efforts might be. Recent progress in treating melanoma suggests that five-year survival rates should continue to rise in the future. Thus, the extrapolation of current rates and relationships into the future is subject to numer- ous caveats. And while much work remains to be done to sort out the precise relationship between UVR and melanoma death rates, this analysis does provide strong empirical support for the existence of such a relationship.
A c k n o w l e d g m e n t - - We are indebted to Joe Scotto who sug- gested the basic data set, and to Ed Fu, Mona Ostrowski. and John Sablehaus for solving problems of creating a large data base, and to John Hoffman for creating the opportunity to do the work.
REFERENCES
Armitage, P.; Doll, R. The age distribution of cancer and a multi- stage theory of carcinogenesis. Br. J. Cancer 7:1-12; 1954.
Berger) D.; Robertson, D.F.; Davies, R.E,; Urbach, F. (1975) Field measurements of biologically effective radiation. In: Impacts of Climatic Change on the Biosphere. CIAP Monograph 5, Part 1 Ultraviolet Radiation Effects. US Department of Transporta- tion; 1975:p.2-234 to 2-264,
USDC (U.S. Department of the Census), Bureau of the Census. Census of Population and Housing. Technical documentation, Public-use mierodata samples; 1980.
Fears, T.R.; Scotto, J.; Schneiderman, M.A. Skin cancer, melanoma, and sunlight. Amer. J. Public Health 66:461-464; 1976.
Fears) T.R.; Scotto, J., Estimating increases in skin cancer mor- bidity due to increases in ultraviolet radiation exposure. Cancer Invest. 1: 119-126; 1983.
Green, A.E.S.; Miller) J.H. Measures of biologically effective radiation in the 280-340 region. In: Impacts of Climatic Change on the Biosphere, CIAP Monograph 5, Part 1 Ultraviolet Radi- ation Effects. US Department of Transportation; 1975:pp.2-60 to 2-70.
Green, A.E.S.; Sawada, T.; Shettle) E.P. The middle ultraviolet reaching the ground. Photochem. Photobiol. 19:251-259;1974.
Hughes, N.A. Global cloud cover elimatologies: a historical re -
v i e w . J. Climate Appl. Meteor. 23:724-751; 1984. Kubitschek, H.E.; Baker) K.S.; Peak, M.J. Enhancement of mu-
tagenesis and human skin cancer rates resulting from in- creased fluences of solar ul traviolet radiation. Photochem. Photobiol . 43:443-447; 1986.
Melanoma and ultraviolet radiation 21
Magnus, K. Incidence trends in thc nordic countries: effects of sun exposure. In: Magnus, K., ed. Trends in cancer incidence, causes and practical implications. New York: Hemisphere Publication Corporation; 1982: 387-392.
NRC (National Research Council) Direct Human Health Hazards. In: Causes and effects of stratospheric ozone reduction: an update. Washington, D.C.: National Academy Press; 1982: 75-143.
Nordling, C.O. A new theory on the cancer-inducing mechanism. Br. L Cancer 7:68-72; 1953.
Osterlind, A.; Jensen, O.M. Trends in incidence of malignant melanoma of the skin in Denmark 1943-1982. Recent Results in Cancer Research I02:8-17; 1986.
Riggan, W.B.; Briggan, LB.; Acquavclla0 LF.; Beaubier, J.; Mason, T.J.U.S. cancer mortality rates and trends, 1950- 1979. Washington, D.C.: U.S. Environmental Protection Agency; 1983.
Roush, G.C.; Schymura, M.J.; Holford, T.R.; White, C.; Flannery, J.T. Time period compared to birth cohort in Connecticut: incidence rates for twenty-five malignant neoplasms. J. Nat. Cancer Inst. 74:779-788; 1985.
Ruffner, J.A., ed. Climates of the states. Detroit, MI: Gale Re- search Co.; 1986.
Scott, E.L.; Straf, M.L. Ultraviolet radiation as a cause of can- cer. In: Hiatt, H.H.; Watson, J.D.; Winsten, J.A., eds. Origins
of Human Cancer, Book A, Incidence of Cancer in Humans. Vol. 4. The Cold Spring Harbor conferences on cell prolifer- ation. New York, NY: The Cold Spring Harbor Laboratory; 1977; 529-546.
Scotto, J.; Fears, T.R. The association of solar ultraviolet radia- tion and skin melanoma among caucasians in the United States. Cancer Investi. 5:275-283 ;1986.
Serafino, G.; Frederick, J. Global modeling of the ultraviolet solar flux incident on the biosphere. In: Assessing the risks of trace gases that can modify the stratosphere. Vol. VII. Washington, D.C.: U,S. Environmental Protection Agency; 1987.
Serfling, R.L Approximation theorems in mathematical statistics. New York: Wiley; 1980.
Setlow, R.B. The wavelengths in sunlight effective in producing skin cancer: a theoretical analysis. Prec. Nat. Acad. Sci. USA 69: 3363-3366; 1974.
USEPA (U.S. Environmental Protection Agency). Ultraviolet Ra- diation and Melanoma with a Special Focus on Assessing the Risks of Ozone Depletion. Longstreth, LD., ed. GPO EPA 400/I-87/001D; 1987.
WMO/NASA 1986: Atmospheric ozone. Geneva: World Meteoro- logical Organization, Global Ozone Research and Monitoring Project Report Number 16; 1986.


