Embed Size (px)
Citation preview
Page 1
MEMORANDUM To: Mayor and City Council From: Ronnie Campbell, Finance Director Prepared By: Joni Vierra, Payroll/Financial Analyst Date: February 13, 2021 Agenda: Financial Report for FY2021 Year to Date through January 31, 2021
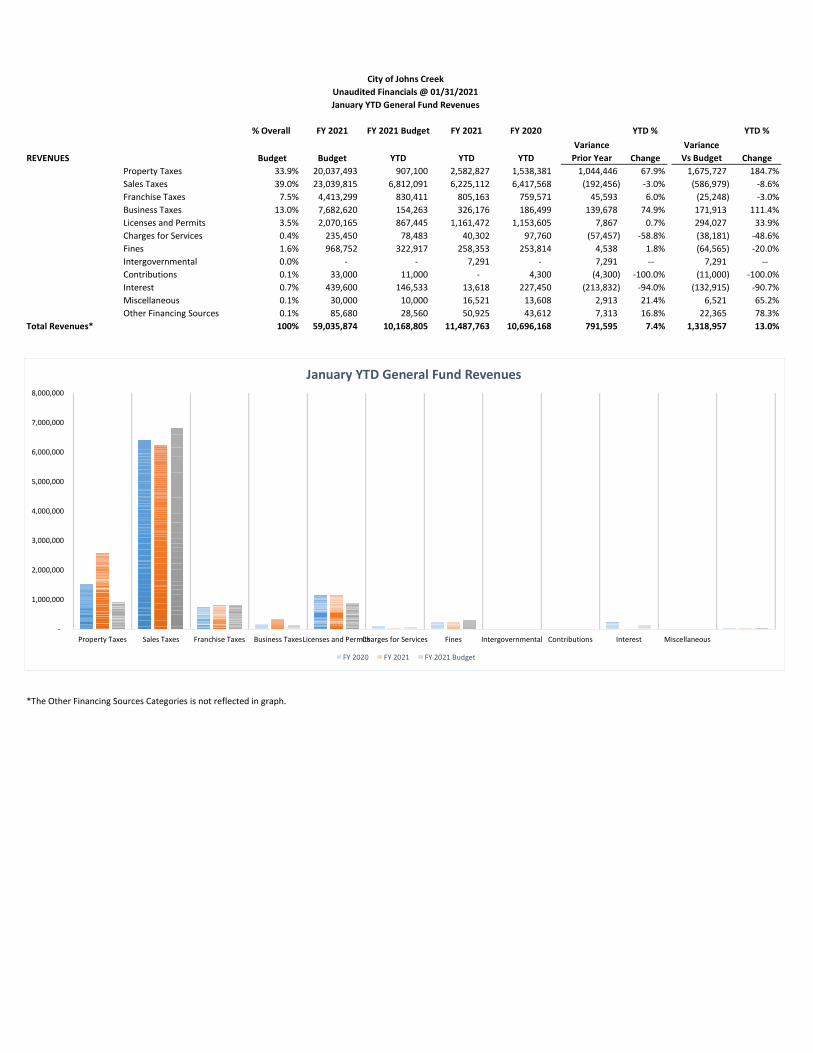
At the end of January for Fiscal Year 2021, revenues total $11.5M which is $1.3M or 13% over budget. With this report, we will focus our discussion of Budget versus Actual variance on any Revenue Groups that exceeds 5% or $500K of our Forecasted Monthly Revenue. Following are the revenue groups that meet this threshold:
The Property Tax revenue group is $1.6M over budget. Reflected within this group is Property Tax Current Year, Property Tax Prior Year, Motor Vehicle Tax, Motor Vehicle TAVT, Recording Intangible Tax and Real Estate Transfer Tax. During the month of January $.05M in revenues was received in Property Tax Prior Year, Motor Vehicle TAVT, and Recording Intangible Tax. Overall, higher than budgeted revenues in Property Tax Prior Year $1.2M and Recording Intangible Tax $0.4M account for the revenue variance in this category.
The Sales Tax revenue group is $0.6M under budget which reflects the continued fiscal impacts of COVID-19 on our Local Option Sales Tax (LOST). Year to Date Local Option Sales Tax revenue averages $.02M per month under anticipated revenue.
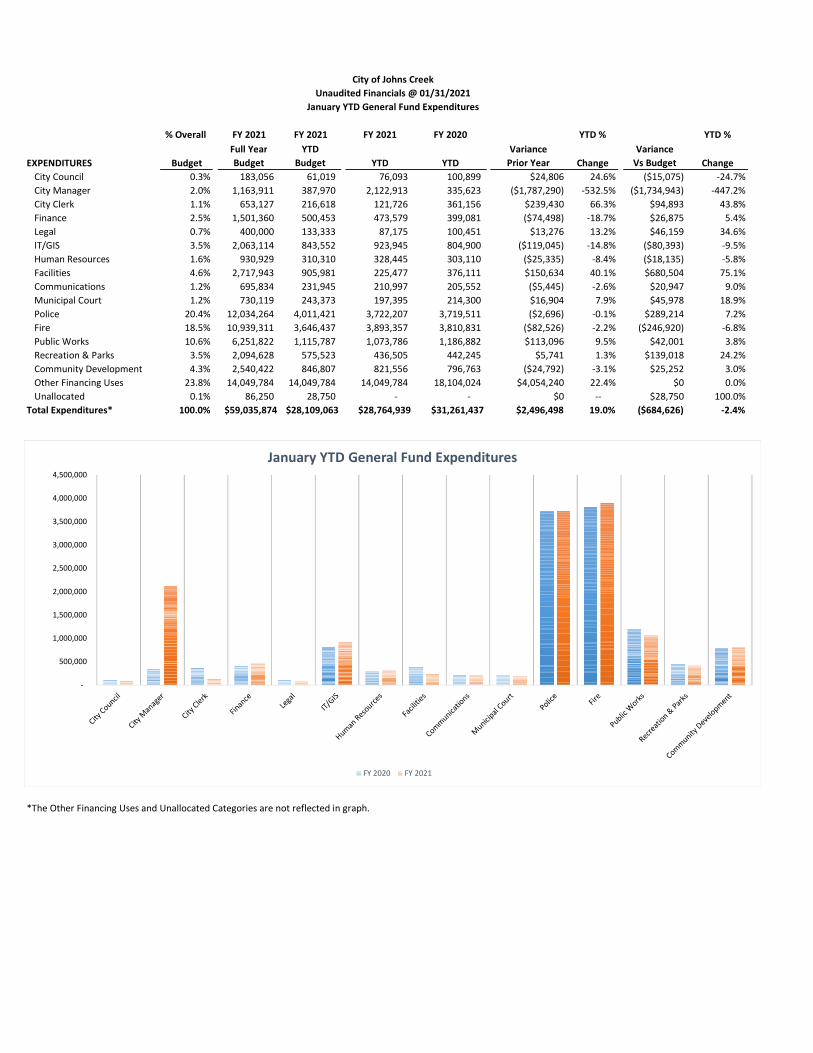
The expenditures totaling $28.8M which is $0.7M or 2.4% above annualized spending levels. Consistent with our revenue variance analysis, we will focus our discussion of Budget versus Actual variance on any Departments that exceed 5% or $1.4M of our Forecasted Monthly Expenditures. For the month of January the City Council, City Manager, IT/GIS, Human Resources and Fire Departments are all trending above the annualized budget.
City Council and IT/GIS reflect operating expenditures are being made earlier in the fiscal year than forecasted during budget adoption. When operating expenditures are annualized over the remaining months of the fiscal year these Departments should all be within the FY2021 Adopted Budget.
City Manager continues to reflect expenditures for The Johns Creek CARES Business Grant Program Awards totaling $2.1M that will be properly accounted for in the Monthly Financial Report for February after having concluded discussions with our external auditors on how to properly account for this Grant subsequent to their
2
review of the signed Intergovernmental Agreement (IGA) between the City and Fulton County. When the YTD Expenditures for the Johns Creek CARES Business Grant Program is removed from the City Manager January YTD Expenditure, the remaining spending level is below the annualized variance threshold.
Human Resources and Fire reflect personnel expenditures in Salaries, Health, and Insurance are exceeding annualized spending levels. The budget to actual variance is due to the three pay cycles paid in December reflecting an increase in the YTD Actual amounts. When these operating expenditures are annualized over the remaining months of the fiscal year these Departments should also be within the FY2021 Adopted Budget.
As of January 31, 2021 there were 8 vacant positions within the City Manager, City Clerk, and Police Departments.
The financial packet also includes the capital projects listing. This listing details capital projects funded by the General Fund as well as those funded by Parks Bonds and TSPLOST. The Parks Bond and TSPLOST projects are listed below the department projects.
% Overall FY 2021 FY 2021 Budget FY 2021 FY 2020 YTD % YTD %
REVENUES Budget Budget YTD YTD YTDVariance
Prior Year ChangeVariance
Vs Budget ChangeProperty Taxes 33.9% 20,037,493 907,100 2,582,827 1,538,381 1,044,446 67.9% 1,675,727 184.7%Sales Taxes 39.0% 23,039,815 6,812,091 6,225,112 6,417,568 (192,456) -3.0% (586,979) -8.6%Franchise Taxes 7.5% 4,413,299 830,411 805,163 759,571 45,593 6.0% (25,248) -3.0%Business Taxes 13.0% 7,682,620 154,263 326,176 186,499 139,678 74.9% 171,913 111.4%Licenses and Permits 3.5% 2,070,165 867,445 1,161,472 1,153,605 7,867 0.7% 294,027 33.9%Charges for Services 0.4% 235,450 78,483 40,302 97,760 (57,457) -58.8% (38,181) -48.6%Fines 1.6% 968,752 322,917 258,353 253,814 4,538 1.8% (64,565) -20.0%Intergovernmental 0.0% - - 7,291 - 7,291 -- 7,291 -- Contributions 0.1% 33,000 11,000 - 4,300 (4,300) -100.0% (11,000) -100.0%Interest 0.7% 439,600 146,533 13,618 227,450 (213,832) -94.0% (132,915) -90.7%Miscellaneous 0.1% 30,000 10,000 16,521 13,608 2,913 21.4% 6,521 65.2%Other Financing Sources 0.1% 85,680 28,560 50,925 43,612 7,313 16.8% 22,365 78.3%
Total Revenues* 100% 59,035,874 10,168,805 11,487,763 10,696,168 791,595 7.4% 1,318,957 13.0%
*The Other Financing Sources Categories is not reflected in graph.
City of Johns CreekUnaudited Financials @ 01/31/2021January YTD General Fund Revenues
-
1,000,000
2,000,000
3,000,000
4,000,000
5,000,000
6,000,000
7,000,000
8,000,000
Property Taxes Sales Taxes Franchise Taxes Business TaxesLicenses and PermitsCharges for Services Fines Intergovernmental Contributions Interest Miscellaneous
January YTD General Fund Revenues
FY 2020 FY 2021 FY 2021 Budget
% Overall FY 2021 FY 2021 FY 2021 FY 2020 YTD % YTD %
EXPENDITURES BudgetFull YearBudget
YTDBudget YTD YTD
Variance Prior Year Change
Variance Vs Budget Change
City Council 0.3% 183,056 61,019 76,093 100,899 $24,806 24.6% ($15,075) -24.7%City Manager 2.0% 1,163,911 387,970 2,122,913 335,623 ($1,787,290) -532.5% ($1,734,943) -447.2%City Clerk 1.1% 653,127 216,618 121,726 361,156 $239,430 66.3% $94,893 43.8%Finance 2.5% 1,501,360 500,453 473,579 399,081 ($74,498) -18.7% $26,875 5.4%Legal 0.7% 400,000 133,333 87,175 100,451 $13,276 13.2% $46,159 34.6%IT/GIS 3.5% 2,063,114 843,552 923,945 804,900 ($119,045) -14.8% ($80,393) -9.5%Human Resources 1.6% 930,929 310,310 328,445 303,110 ($25,335) -8.4% ($18,135) -5.8%Facilities 4.6% 2,717,943 905,981 225,477 376,111 $150,634 40.1% $680,504 75.1%Communications 1.2% 695,834 231,945 210,997 205,552 ($5,445) -2.6% $20,947 9.0%Municipal Court 1.2% 730,119 243,373 197,395 214,300 $16,904 7.9% $45,978 18.9%Police 20.4% 12,034,264 4,011,421 3,722,207 3,719,511 ($2,696) -0.1% $289,214 7.2%Fire 18.5% 10,939,311 3,646,437 3,893,357 3,810,831 ($82,526) -2.2% ($246,920) -6.8%Public Works 10.6% 6,251,822 1,115,787 1,073,786 1,186,882 $113,096 9.5% $42,001 3.8%Recreation & Parks 3.5% 2,094,628 575,523 436,505 442,245 $5,741 1.3% $139,018 24.2%Community Development 4.3% 2,540,422 846,807 821,556 796,763 ($24,792) -3.1% $25,252 3.0%Other Financing Uses 23.8% 14,049,784 14,049,784 14,049,784 18,104,024 $4,054,240 22.4% $0 0.0%Unallocated 0.1% 86,250 28,750 - - $0 -- $28,750 100.0%
Total Expenditures* 100.0% $59,035,874 $28,109,063 $28,764,939 $31,261,437 $2,496,498 19.0% ($684,626) -2.4%
*The Other Financing Uses and Unallocated Categories are not reflected in graph. for the variance in timing for transfers.
City of Johns Creek
January YTD General Fund ExpendituresUnaudited Financials @ 01/31/2021
-
500,000
1,000,000
1,500,000
2,000,000
2,500,000
3,000,000
3,500,000
4,000,000
4,500,000
January YTD General Fund Expenditures
FY 2020 FY 2021
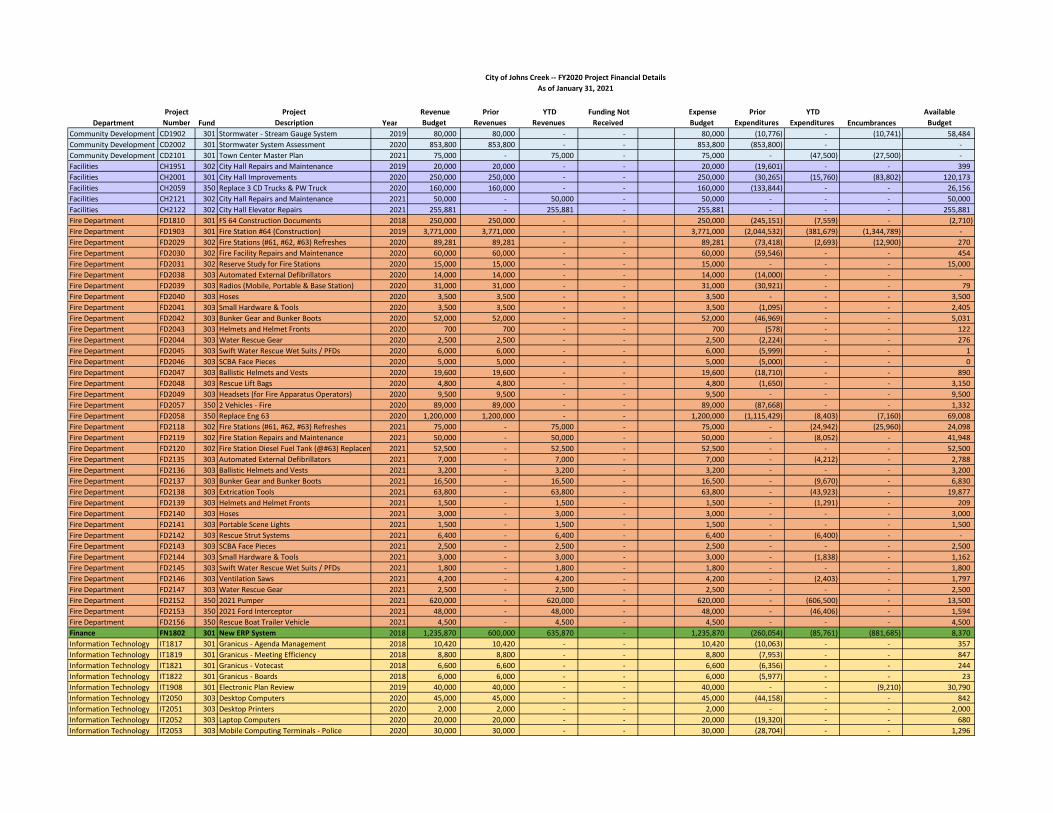
DepartmentProject
Number FundProject
Description Year Revenue Budget
PriorRevenues
YTDRevenues
Funding Not Received
Expense Budget
PriorExpenditures
YTDExpenditures Encumbrances
Available Budget
Community Development CD1902 301 Stormwater - Stream Gauge System 2019 80,000 80,000 - - 80,000 (10,776) - (10,741) 58,484 Community Development CD2002 301 Stormwater System Assessment 2020 853,800 853,800 - - 853,800 (853,800) - - Community Development CD2101 301 Town Center Master Plan 2021 75,000 - 75,000 - 75,000 - (47,500) (27,500) - Facilities CH1951 302 City Hall Repairs and Maintenance 2019 20,000 20,000 - - 20,000 (19,601) - - 399 Facilities CH2001 301 City Hall Improvements 2020 250,000 250,000 - - 250,000 (30,265) (15,760) (83,802) 120,173 Facilities CH2059 350 Replace 3 CD Trucks & PW Truck 2020 160,000 160,000 - - 160,000 (133,844) - - 26,156 Facilities CH2121 302 City Hall Repairs and Maintenance 2021 50,000 - 50,000 - 50,000 - - - 50,000 Facilities CH2122 302 City Hall Elevator Repairs 2021 255,881 - 255,881 - 255,881 - - - 255,881 Fire Department FD1810 301 FS 64 Construction Documents 2018 250,000 250,000 - - 250,000 (245,151) (7,559) - (2,710) Fire Department FD1903 301 Fire Station #64 (Construction) 2019 3,771,000 3,771,000 - - 3,771,000 (2,044,532) (381,679) (1,344,789) - Fire Department FD2029 302 Fire Stations (#61, #62, #63) Refreshes 2020 89,281 89,281 - - 89,281 (73,418) (2,693) (12,900) 270 Fire Department FD2030 302 Fire Facility Repairs and Maintenance 2020 60,000 60,000 - - 60,000 (59,546) - - 454 Fire Department FD2031 302 Reserve Study for Fire Stations 2020 15,000 15,000 - - 15,000 - - - 15,000 Fire Department FD2038 303 Automated External Defibrillators 2020 14,000 14,000 - - 14,000 (14,000) - - - Fire Department FD2039 303 Radios (Mobile, Portable & Base Station) 2020 31,000 31,000 - - 31,000 (30,921) - - 79 Fire Department FD2040 303 Hoses 2020 3,500 3,500 - - 3,500 - - - 3,500 Fire Department FD2041 303 Small Hardware & Tools 2020 3,500 3,500 - - 3,500 (1,095) - - 2,405 Fire Department FD2042 303 Bunker Gear and Bunker Boots 2020 52,000 52,000 - - 52,000 (46,969) - - 5,031 Fire Department FD2043 303 Helmets and Helmet Fronts 2020 700 700 - - 700 (578) - - 122 Fire Department FD2044 303 Water Rescue Gear 2020 2,500 2,500 - - 2,500 (2,224) - - 276 Fire Department FD2045 303 Swift Water Rescue Wet Suits / PFDs 2020 6,000 6,000 - - 6,000 (5,999) - - 1 Fire Department FD2046 303 SCBA Face Pieces 2020 5,000 5,000 - - 5,000 (5,000) - - 0 Fire Department FD2047 303 Ballistic Helmets and Vests 2020 19,600 19,600 - - 19,600 (18,710) - - 890 Fire Department FD2048 303 Rescue Lift Bags 2020 4,800 4,800 - - 4,800 (1,650) - - 3,150 Fire Department FD2049 303 Headsets (for Fire Apparatus Operators) 2020 9,500 9,500 - - 9,500 - - - 9,500 Fire Department FD2057 350 2 Vehicles - Fire 2020 89,000 89,000 - - 89,000 (87,668) - - 1,332 Fire Department FD2058 350 Replace Eng 63 2020 1,200,000 1,200,000 - - 1,200,000 (1,115,429) (8,403) (7,160) 69,008 Fire Department FD2118 302 Fire Stations (#61, #62, #63) Refreshes 2021 75,000 - 75,000 - 75,000 - (24,942) (25,960) 24,098 Fire Department FD2119 302 Fire Station Repairs and Maintenance 2021 50,000 - 50,000 - 50,000 - (8,052) - 41,948 Fire Department FD2120 302 Fire Station Diesel Fuel Tank (@#63) Replacement 2021 52,500 - 52,500 - 52,500 - - - 52,500 Fire Department FD2135 303 Automated External Defibrillators 2021 7,000 - 7,000 - 7,000 - (4,212) - 2,788 Fire Department FD2136 303 Ballistic Helmets and Vests 2021 3,200 - 3,200 - 3,200 - - - 3,200 Fire Department FD2137 303 Bunker Gear and Bunker Boots 2021 16,500 - 16,500 - 16,500 - (9,670) - 6,830 Fire Department FD2138 303 Extrication Tools 2021 63,800 - 63,800 - 63,800 - (43,923) - 19,877 Fire Department FD2139 303 Helmets and Helmet Fronts 2021 1,500 - 1,500 - 1,500 - (1,291) - 209 Fire Department FD2140 303 Hoses 2021 3,000 - 3,000 - 3,000 - - - 3,000 Fire Department FD2141 303 Portable Scene Lights 2021 1,500 - 1,500 - 1,500 - - - 1,500 Fire Department FD2142 303 Rescue Strut Systems 2021 6,400 - 6,400 - 6,400 - (6,400) - - Fire Department FD2143 303 SCBA Face Pieces 2021 2,500 - 2,500 - 2,500 - - - 2,500 Fire Department FD2144 303 Small Hardware & Tools 2021 3,000 - 3,000 - 3,000 - (1,838) - 1,162 Fire Department FD2145 303 Swift Water Rescue Wet Suits / PFDs 2021 1,800 - 1,800 - 1,800 - - - 1,800 Fire Department FD2146 303 Ventilation Saws 2021 4,200 - 4,200 - 4,200 - (2,403) - 1,797 Fire Department FD2147 303 Water Rescue Gear 2021 2,500 - 2,500 - 2,500 - - - 2,500 Fire Department FD2152 350 2021 Pumper 2021 620,000 - 620,000 - 620,000 - (606,500) - 13,500 Fire Department FD2153 350 2021 Ford Interceptor 2021 48,000 - 48,000 - 48,000 - (46,406) - 1,594 Fire Department FD2156 350 Rescue Boat Trailer Vehicle 2021 4,500 - 4,500 - 4,500 - - - 4,500 Finance FN1802 301 New ERP System 2018 1,235,870 600,000 635,870 - 1,235,870 (260,054) (85,761) (881,685) 8,370 Information Technology IT1817 301 Granicus - Agenda Management 2018 10,420 10,420 - - 10,420 (10,063) - - 357 Information Technology IT1819 301 Granicus - Meeting Efficiency 2018 8,800 8,800 - - 8,800 (7,953) - - 847 Information Technology IT1821 301 Granicus - Votecast 2018 6,600 6,600 - - 6,600 (6,356) - - 244 Information Technology IT1822 301 Granicus - Boards 2018 6,000 6,000 - - 6,000 (5,977) - - 23 Information Technology IT1908 301 Electronic Plan Review 2019 40,000 40,000 - - 40,000 - - (9,210) 30,790 Information Technology IT2050 303 Desktop Computers 2020 45,000 45,000 - - 45,000 (44,158) - - 842 Information Technology IT2051 303 Desktop Printers 2020 2,000 2,000 - - 2,000 - - - 2,000 Information Technology IT2052 303 Laptop Computers 2020 20,000 20,000 - - 20,000 (19,320) - - 680 Information Technology IT2053 303 Mobile Computing Terminals - Police 2020 30,000 30,000 - - 30,000 (28,704) - - 1,296
City of Johns Creek -- FY2020 Project Financial DetailsAs of January 31, 2021
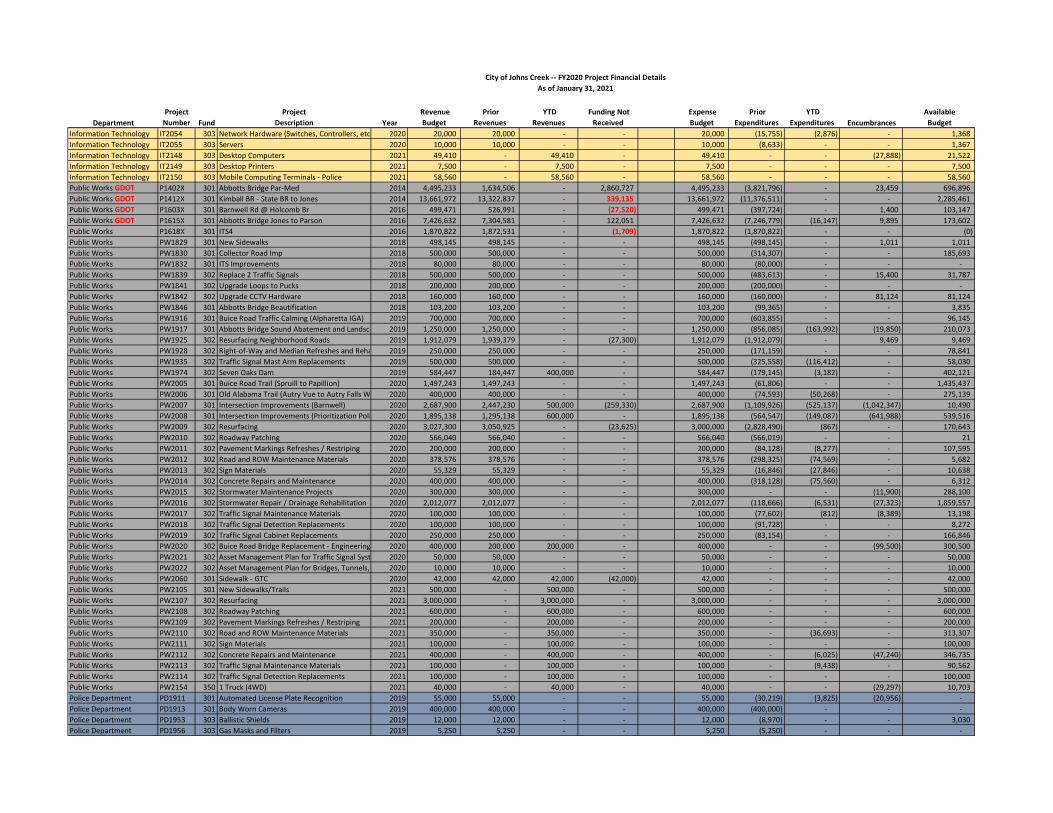
DepartmentProject
Number FundProject
Description Year Revenue Budget
PriorRevenues
YTDRevenues
Funding Not Received
Expense Budget
PriorExpenditures
YTDExpenditures Encumbrances
Available Budget
City of Johns Creek -- FY2020 Project Financial DetailsAs of January 31, 2021
Information Technology IT2054 303 Network Hardware (Switches, Controllers, etc.) 2020 20,000 20,000 - - 20,000 (15,755) (2,876) - 1,368 Information Technology IT2055 303 Servers 2020 10,000 10,000 - - 10,000 (8,633) - - 1,367 Information Technology IT2148 303 Desktop Computers 2021 49,410 - 49,410 - 49,410 - - (27,888) 21,522 Information Technology IT2149 303 Desktop Printers 2021 7,500 - 7,500 - 7,500 - - - 7,500 Information Technology IT2150 303 Mobile Computing Terminals - Police 2021 58,560 - 58,560 - 58,560 - - - 58,560 Public Works GDOT P1402X 301 Abbotts Bridge Par-Med 2014 4,495,233 1,634,506 - 2,860,727 4,495,233 (3,821,796) - 23,459 696,896 Public Works GDOT P1412X 301 Kimball BR - State BR to Jones 2014 13,661,972 13,322,837 - 339,135 13,661,972 (11,376,511) - - 2,285,461 Public Works GDOT P1603X 301 Barnwell Rd @ Holcomb Br 2016 499,471 526,991 - (27,520) 499,471 (397,724) - 1,400 103,147 Public Works GDOT P1615X 301 Abbotts Bridge Jones to Parson 2016 7,426,632 7,304,581 - 122,051 7,426,632 (7,246,779) (16,147) 9,895 173,602 Public Works P1618X 301 ITS4 2016 1,870,822 1,872,531 - (1,709) 1,870,822 (1,870,822) - - (0) Public Works PW1829 301 New Sidewalks 2018 498,145 498,145 - - 498,145 (498,145) - 1,011 1,011 Public Works PW1830 301 Collector Road Imp 2018 500,000 500,000 - - 500,000 (314,307) - - 185,693 Public Works PW1832 301 ITS Improvements 2018 80,000 80,000 - - 80,000 (80,000) - - - Public Works PW1839 302 Replace 2 Traffic Signals 2018 500,000 500,000 - - 500,000 (483,613) - 15,400 31,787 Public Works PW1841 302 Upgrade Loops to Pucks 2018 200,000 200,000 - - 200,000 (200,000) - - - Public Works PW1842 302 Upgrade CCTV Hardware 2018 160,000 160,000 - - 160,000 (160,000) - 81,124 81,124 Public Works PW1846 301 Abbotts Bridge Beautification 2018 103,200 103,200 - - 103,200 (99,365) - - 3,835 Public Works PW1916 301 Buice Road Traffic Calming (Alpharetta IGA) 2019 700,000 700,000 - - 700,000 (603,855) - - 96,145 Public Works PW1917 301 Abbotts Bridge Sound Abatement and Landscaping 2019 1,250,000 1,250,000 - - 1,250,000 (856,085) (163,992) (19,850) 210,073 Public Works PW1925 302 Resurfacing Neighborhood Roads 2019 1,912,079 1,939,379 - (27,300) 1,912,079 (1,912,079) - 9,469 9,469 Public Works PW1928 302 Right-of-Way and Median Refreshes and Rehabilitations2019 250,000 250,000 - - 250,000 (171,159) - - 78,841 Public Works PW1935 302 Traffic Signal Mast Arm Replacements 2019 500,000 500,000 - - 500,000 (325,558) (116,412) - 58,030 Public Works PW1974 302 Seven Oaks Dam 2019 584,447 184,447 400,000 - 584,447 (179,145) (3,182) - 402,121 Public Works PW2005 301 Buice Road Trail (Spruill to Papillion) 2020 1,497,243 1,497,243 - - 1,497,243 (61,806) - - 1,435,437 Public Works PW2006 301 Old Alabama Trail (Autry Vue to Autry Falls Way) 2020 400,000 400,000 - - 400,000 (74,593) (50,268) - 275,139 Public Works PW2007 301 Intersection Improvements (Barnwell) 2020 2,687,900 2,447,230 500,000 (259,330) 2,687,900 (1,109,926) (525,137) (1,042,347) 10,490 Public Works PW2008 301 Intersection Improvements (Prioritization Policy) 2020 1,895,138 1,295,138 600,000 - 1,895,138 (564,547) (149,087) (641,988) 539,516 Public Works PW2009 302 Resurfacing 2020 3,027,300 3,050,925 - (23,625) 3,000,000 (2,828,490) (867) - 170,643 Public Works PW2010 302 Roadway Patching 2020 566,040 566,040 - - 566,040 (566,019) - - 21 Public Works PW2011 302 Pavement Markings Refreshes / Restriping 2020 200,000 200,000 - - 200,000 (84,128) (8,277) - 107,595 Public Works PW2012 302 Road and ROW Maintenance Materials 2020 378,576 378,576 - - 378,576 (298,325) (74,569) - 5,682 Public Works PW2013 302 Sign Materials 2020 55,329 55,329 - - 55,329 (16,846) (27,846) - 10,638 Public Works PW2014 302 Concrete Repairs and Maintenance 2020 400,000 400,000 - - 400,000 (318,128) (75,560) - 6,312 Public Works PW2015 302 Stormwater Maintenance Projects 2020 300,000 300,000 - - 300,000 - - (11,900) 288,100 Public Works PW2016 302 Stormwater Repair / Drainage Rehabilitation 2020 2,012,077 2,012,077 - - 2,012,077 (118,666) (6,531) (27,323) 1,859,557 Public Works PW2017 302 Traffic Signal Maintenance Materials 2020 100,000 100,000 - - 100,000 (77,602) (812) (8,389) 13,198 Public Works PW2018 302 Traffic Signal Detection Replacements 2020 100,000 100,000 - - 100,000 (91,728) - - 8,272 Public Works PW2019 302 Traffic Signal Cabinet Replacements 2020 250,000 250,000 - - 250,000 (83,154) - - 166,846 Public Works PW2020 302 Buice Road Bridge Replacement - Engineering 2020 400,000 200,000 200,000 - 400,000 - - (99,500) 300,500 Public Works PW2021 302 Asset Management Plan for Traffic Signal System 2020 50,000 50,000 - - 50,000 - - - 50,000 Public Works PW2022 302 Asset Management Plan for Bridges, Tunnels, and Dams2020 10,000 10,000 - - 10,000 - - - 10,000 Public Works PW2060 301 Sidewalk - GTC 2020 42,000 42,000 42,000 (42,000) 42,000 - - - 42,000 Public Works PW2105 301 New Sidewalks/Trails 2021 500,000 - 500,000 - 500,000 - - - 500,000 Public Works PW2107 302 Resurfacing 2021 3,000,000 - 3,000,000 - 3,000,000 - - - 3,000,000 Public Works PW2108 302 Roadway Patching 2021 600,000 - 600,000 - 600,000 - - - 600,000 Public Works PW2109 302 Pavement Markings Refreshes / Restriping 2021 200,000 - 200,000 - 200,000 - - - 200,000 Public Works PW2110 302 Road and ROW Maintenance Materials 2021 350,000 - 350,000 - 350,000 - (36,693) - 313,307 Public Works PW2111 302 Sign Materials 2021 100,000 - 100,000 - 100,000 - - - 100,000 Public Works PW2112 302 Concrete Repairs and Maintenance 2021 400,000 - 400,000 - 400,000 - (6,025) (47,240) 346,735 Public Works PW2113 302 Traffic Signal Maintenance Materials 2021 100,000 - 100,000 - 100,000 - (9,438) - 90,562 Public Works PW2114 302 Traffic Signal Detection Replacements 2021 100,000 - 100,000 - 100,000 - - - 100,000 Public Works PW2154 350 1 Truck (4WD) 2021 40,000 - 40,000 - 40,000 - - (29,297) 10,703 Police Department PD1911 301 Automated License Plate Recognition 2019 55,000 55,000 - - 55,000 (30,219) (3,825) (20,956) - Police Department PD1913 301 Body Worn Cameras 2019 400,000 400,000 - - 400,000 (400,000) - - - Police Department PD1953 303 Ballistic Shields 2019 12,000 12,000 - - 12,000 (8,970) - - 3,030 Police Department PD1956 303 Gas Masks and Filters 2019 5,250 5,250 - - 5,250 (5,250) - - -
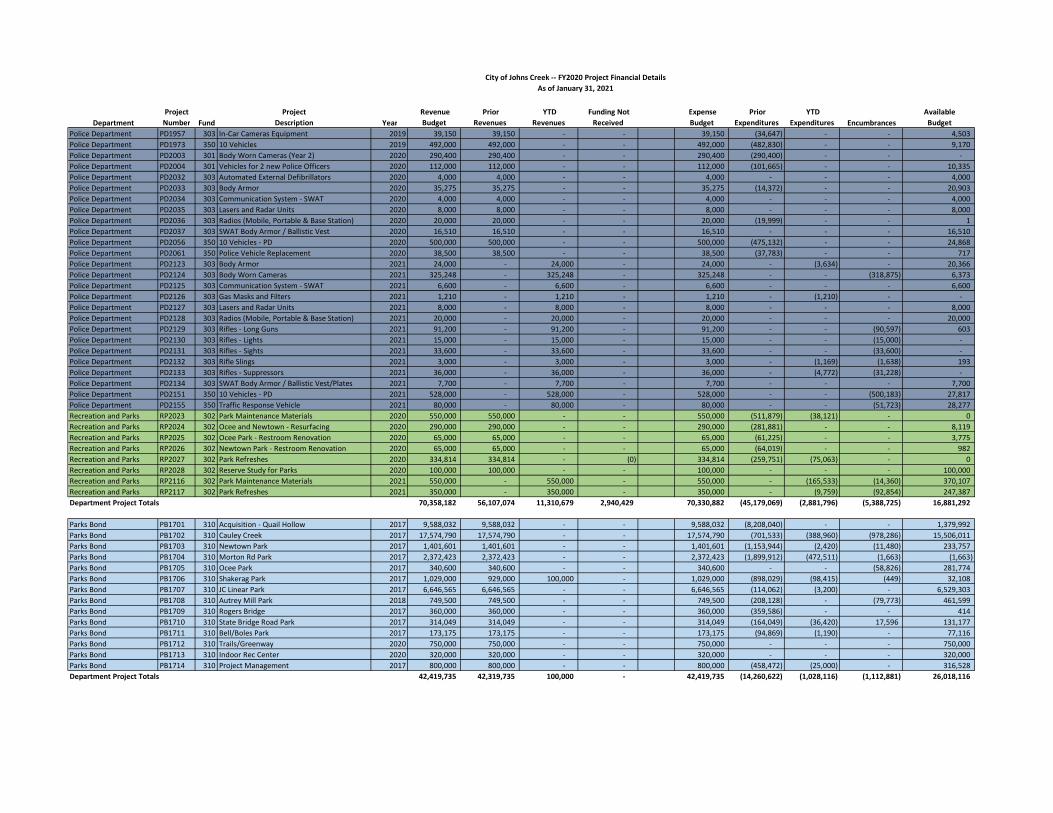
DepartmentProject
Number FundProject
Description Year Revenue Budget
PriorRevenues
YTDRevenues
Funding Not Received
Expense Budget
PriorExpenditures
YTDExpenditures Encumbrances
Available Budget
City of Johns Creek -- FY2020 Project Financial DetailsAs of January 31, 2021
Police Department PD1957 303 In-Car Cameras Equipment 2019 39,150 39,150 - - 39,150 (34,647) - - 4,503 Police Department PD1973 350 10 Vehicles 2019 492,000 492,000 - - 492,000 (482,830) - - 9,170 Police Department PD2003 301 Body Worn Cameras (Year 2) 2020 290,400 290,400 - - 290,400 (290,400) - - - Police Department PD2004 301 Vehicles for 2 new Police Officers 2020 112,000 112,000 - - 112,000 (101,665) - - 10,335 Police Department PD2032 303 Automated External Defibrillators 2020 4,000 4,000 - - 4,000 - - - 4,000 Police Department PD2033 303 Body Armor 2020 35,275 35,275 - - 35,275 (14,372) - - 20,903 Police Department PD2034 303 Communication System - SWAT 2020 4,000 4,000 - - 4,000 - - - 4,000 Police Department PD2035 303 Lasers and Radar Units 2020 8,000 8,000 - - 8,000 - - - 8,000 Police Department PD2036 303 Radios (Mobile, Portable & Base Station) 2020 20,000 20,000 - - 20,000 (19,999) - - 1 Police Department PD2037 303 SWAT Body Armor / Ballistic Vest 2020 16,510 16,510 - - 16,510 - - - 16,510 Police Department PD2056 350 10 Vehicles - PD 2020 500,000 500,000 - - 500,000 (475,132) - - 24,868 Police Department PD2061 350 Police Vehicle Replacement 2020 38,500 38,500 - - 38,500 (37,783) - - 717 Police Department PD2123 303 Body Armor 2021 24,000 - 24,000 - 24,000 - (3,634) - 20,366 Police Department PD2124 303 Body Worn Cameras 2021 325,248 - 325,248 - 325,248 - - (318,875) 6,373 Police Department PD2125 303 Communication System - SWAT 2021 6,600 - 6,600 - 6,600 - - - 6,600 Police Department PD2126 303 Gas Masks and Filters 2021 1,210 - 1,210 - 1,210 - (1,210) - - Police Department PD2127 303 Lasers and Radar Units 2021 8,000 - 8,000 - 8,000 - - - 8,000 Police Department PD2128 303 Radios (Mobile, Portable & Base Station) 2021 20,000 - 20,000 - 20,000 - - - 20,000 Police Department PD2129 303 Rifles - Long Guns 2021 91,200 - 91,200 - 91,200 - - (90,597) 603 Police Department PD2130 303 Rifles - Lights 2021 15,000 - 15,000 - 15,000 - - (15,000) - Police Department PD2131 303 Rifles - Sights 2021 33,600 - 33,600 - 33,600 - - (33,600) - Police Department PD2132 303 Rifle Slings 2021 3,000 - 3,000 - 3,000 - (1,169) (1,638) 193 Police Department PD2133 303 Rifles - Suppressors 2021 36,000 - 36,000 - 36,000 - (4,772) (31,228) - Police Department PD2134 303 SWAT Body Armor / Ballistic Vest/Plates 2021 7,700 - 7,700 - 7,700 - - - 7,700 Police Department PD2151 350 10 Vehicles - PD 2021 528,000 - 528,000 - 528,000 - - (500,183) 27,817 Police Department PD2155 350 Traffic Response Vehicle 2021 80,000 - 80,000 - 80,000 - - (51,723) 28,277 Recreation and Parks RP2023 302 Park Maintenance Materials 2020 550,000 550,000 - - 550,000 (511,879) (38,121) - 0 Recreation and Parks RP2024 302 Ocee and Newtown - Resurfacing 2020 290,000 290,000 - - 290,000 (281,881) - - 8,119 Recreation and Parks RP2025 302 Ocee Park - Restroom Renovation 2020 65,000 65,000 - - 65,000 (61,225) - - 3,775 Recreation and Parks RP2026 302 Newtown Park - Restroom Renovation 2020 65,000 65,000 - - 65,000 (64,019) - - 982 Recreation and Parks RP2027 302 Park Refreshes 2020 334,814 334,814 - (0) 334,814 (259,751) (75,063) - 0 Recreation and Parks RP2028 302 Reserve Study for Parks 2020 100,000 100,000 - - 100,000 - - - 100,000 Recreation and Parks RP2116 302 Park Maintenance Materials 2021 550,000 - 550,000 - 550,000 - (165,533) (14,360) 370,107 Recreation and Parks RP2117 302 Park Refreshes 2021 350,000 - 350,000 - 350,000 - (9,759) (92,854) 247,387 Department Project Totals 70,358,182 56,107,074 11,310,679 2,940,429 70,330,882 (45,179,069) (2,881,796) (5,388,725) 16,881,292
Parks Bond PB1701 310 Acquisition - Quail Hollow 2017 9,588,032 9,588,032 - - 9,588,032 (8,208,040) - - 1,379,992 Parks Bond PB1702 310 Cauley Creek 2017 17,574,790 17,574,790 - - 17,574,790 (701,533) (388,960) (978,286) 15,506,011 Parks Bond PB1703 310 Newtown Park 2017 1,401,601 1,401,601 - - 1,401,601 (1,153,944) (2,420) (11,480) 233,757 Parks Bond PB1704 310 Morton Rd Park 2017 2,372,423 2,372,423 - - 2,372,423 (1,899,912) (472,511) (1,663) (1,663) Parks Bond PB1705 310 Ocee Park 2017 340,600 340,600 - - 340,600 - - (58,826) 281,774 Parks Bond PB1706 310 Shakerag Park 2017 1,029,000 929,000 100,000 - 1,029,000 (898,029) (98,415) (449) 32,108 Parks Bond PB1707 310 JC Linear Park 2017 6,646,565 6,646,565 - - 6,646,565 (114,062) (3,200) - 6,529,303 Parks Bond PB1708 310 Autrey Mill Park 2018 749,500 749,500 - - 749,500 (208,128) - (79,773) 461,599 Parks Bond PB1709 310 Rogers Bridge 2017 360,000 360,000 - - 360,000 (359,586) - - 414 Parks Bond PB1710 310 State Bridge Road Park 2017 314,049 314,049 - - 314,049 (164,049) (36,420) 17,596 131,177 Parks Bond PB1711 310 Bell/Boles Park 2017 173,175 173,175 - - 173,175 (94,869) (1,190) - 77,116 Parks Bond PB1712 310 Trails/Greenway 2020 750,000 750,000 - - 750,000 - - - 750,000 Parks Bond PB1713 310 Indoor Rec Center 2020 320,000 320,000 - - 320,000 - - - 320,000 Parks Bond PB1714 310 Project Management 2017 800,000 800,000 - - 800,000 (458,472) (25,000) - 316,528 Department Project Totals 42,419,735 42,319,735 100,000 - 42,419,735 (14,260,622) (1,028,116) (1,112,881) 26,018,116
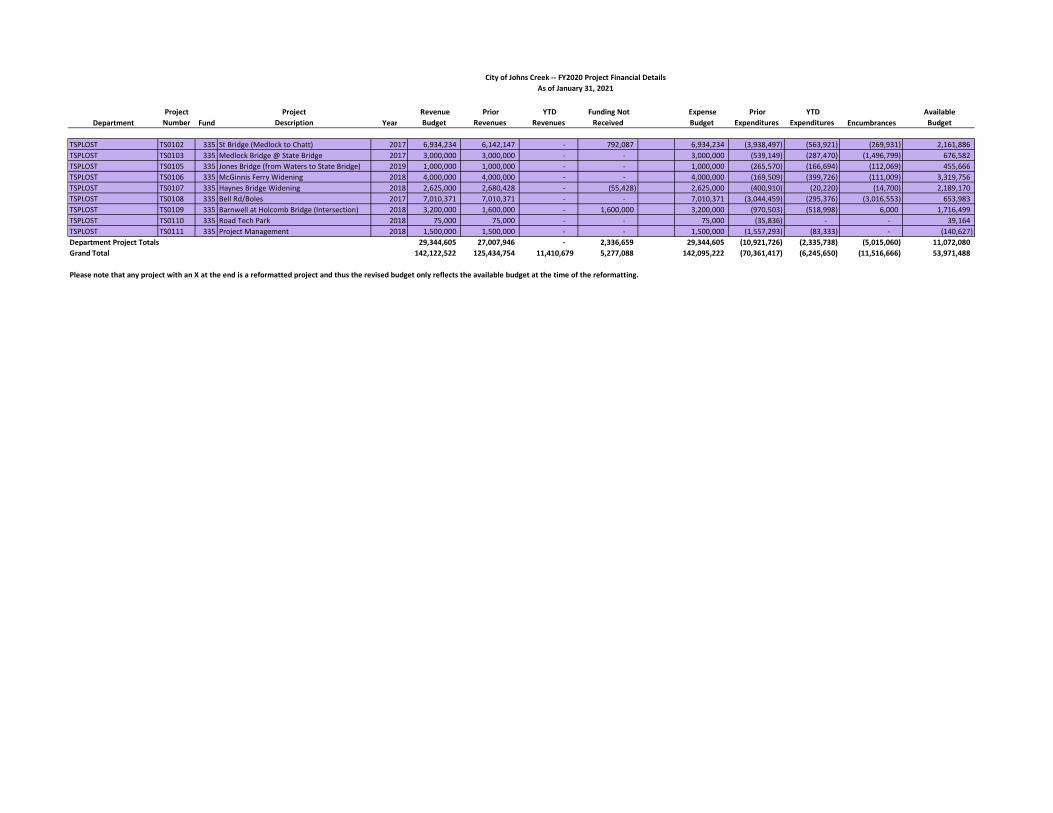
DepartmentProject
Number FundProject
Description Year Revenue Budget
PriorRevenues
YTDRevenues
Funding Not Received
Expense Budget
PriorExpenditures
YTDExpenditures Encumbrances
Available Budget
City of Johns Creek -- FY2020 Project Financial DetailsAs of January 31, 2021
TSPLOST TS0102 335 St Bridge (Medlock to Chatt) 2017 6,934,234 6,142,147 - 792,087 6,934,234 (3,938,497) (563,921) (269,931) 2,161,886 TSPLOST TS0103 335 Medlock Bridge @ State Bridge 2017 3,000,000 3,000,000 - - 3,000,000 (539,149) (287,470) (1,496,799) 676,582 TSPLOST TS0105 335 Jones Bridge (from Waters to State Bridge) 2019 1,000,000 1,000,000 - - 1,000,000 (265,570) (166,694) (112,069) 455,666 TSPLOST TS0106 335 McGinnis Ferry Widening 2018 4,000,000 4,000,000 - - 4,000,000 (169,509) (399,726) (111,009) 3,319,756 TSPLOST TS0107 335 Haynes Bridge Widening 2018 2,625,000 2,680,428 - (55,428) 2,625,000 (400,910) (20,220) (14,700) 2,189,170 TSPLOST TS0108 335 Bell Rd/Boles 2017 7,010,371 7,010,371 - - 7,010,371 (3,044,459) (295,376) (3,016,553) 653,983 TSPLOST TS0109 335 Barnwell at Holcomb Bridge (Intersection) 2018 3,200,000 1,600,000 - 1,600,000 3,200,000 (970,503) (518,998) 6,000 1,716,499 TSPLOST TS0110 335 Road Tech Park 2018 75,000 75,000 - - 75,000 (35,836) - - 39,164 TSPLOST TS0111 335 Project Management 2018 1,500,000 1,500,000 - - 1,500,000 (1,557,293) (83,333) - (140,627) Department Project Totals 29,344,605 27,007,946 - 2,336,659 29,344,605 (10,921,726) (2,335,738) (5,015,060) 11,072,080 Grand Total 142,122,522 125,434,754 11,410,679 5,277,088 142,095,222 (70,361,417) (6,245,650) (11,516,666) 53,971,488
Please note that any project with an X at the end is a reformatted project and thus the revised budget only reflects the available budget at the time of the reformatting.


