Embed Size (px)
Citation preview

MEMORY

2018 XIV International Engineering Congress (CONIIN)Universidad Autónoma de Querétaro, Santiago de Querétaro, México
From 2018-05-14 to 2018-05-19

ORGANIZING COMMITTEE2018 XIV International Engineering Congress (CONIIN)
2018 XIV International Engineering Congress (CONIIN)Facultad de Ingeniería, Universidad Autónoma de Querétaro, Santiago de Querétaro, México
From 2018-05-14 to 2018-05-19
General Chair:Gonzalo Macías Bobadilla
Program Chair
Technical Program Chair:
Saúl Tovar Arriaga
Juvenal Rodríguez ResendízCarlos Villareal Sosa
Information ChairCarlos Torres Hernández
Margarita Teresa de Jesús García GascaAurelio Domínguez González
Manuel Toledano Ayala
Advisory Committee:

Rojas Molina Adrian Jose Manuel Alvarez AlvaradoFeregrino Perez Ana AngelicaMendez Lopez ArturoAlejandro Clemente ChavezVargas Vazquez DamiánTalavera Velázquez DimasElizalde Peña EduardoGorrostieta Urtado EfrénRico García EnriqueOrtíz Arredondo FelipeAngel Figueroa SotoAvatar Flores GutiérrezRomán García RamosSoto Zarazua GenaroHernández Padron GenovevaJose Marcelino Gutierrez VillalobosArroyo Chávez HiramRodríguez Reséndiz HugoRodríguez Morales Jose AlbertoRíos Moreno José GabrielHernádez Zaragoza Juan BoscoGarcía Trejo Juan FernandoEsquivel Escalante KarenVerónica Leyva Picazo
Aceves Fernández Marco AntonioContreras Padilla MargaritaPerez Rea María de La LuzCuan Hernandez Maria de Los AngelesGarduño Aparicio MarianoTrejo Perea MarioMartínez Prado Miguel ÁngelMartÍnez HernÁndez Moises AgustinGeorgina Mota ValtierraJuan Carlos Moya MoralesChavez Alegría OmarJesus Carlos Pedraza OrtegaMiguel Perez LaraGerardo Israel Perez SotoJuan Manuel Ramos ArreguínHector ReaJose Luis ReyesEdgar Rivas AraizaErik Rivas AraizaCarrillo Serrano Roberto ValentínLópez Lara TeresaSuresh ThenozhiDiana Carolina Toledo Pérez
REVIEWER COMMITTEE

POSTER PRESENTATIONS MEMORY

Table of Contents2018 XIV International Engineering Congress (CONIIN)
Fiber Optic Sensors as an Alternative to Structural Health Monitoring in Concrete Structural Beams.
Non-invasive System for the Identification and Classification of Melanomas.
Polymer concrete for paving using polyethylene terephthalate resins.
Email classification using lemmatization and noun pattern recognition.
Comparison of urban expansion models.
From process to user-centered desing.
Image processing algorithm for detection of aquatic macroinvertebrates.
Modeling of humidity in clothes drying machines by means of a pattern detection algorithm.
Synthesis of Micro and Nano-Sized Hydroxyapatite Fibers Through the Microwave Assisted Hydrothermal Method.
Elicitation with Nanomaterials in the Early Stages of Plants.
Hydrophobic concrete resistant to sulfates as a protection mechanism against the presence of seawater.
Estimation of origin-destination matrices in a urban road network through RFID technology.
Modeling greenhouses microclimates by system dynamics.
Arsenic adsorption using iron oxide nanoparticles supported on a mesoporous SBA-15 matrix.
Ground rubber in asphalt mixes.
Current trends in alternative feed sources for fish culture.
Use of Polyethylene Terephthalate (PET) as aggregate.in concrete mixes.
Poster Presentation

Poster Presentation
Study of the profitability of a polyculture in a greenhouse ventilated naturally with CO2 injection.
DFT Calculations of AlAs and GaAs.
Nanoencapsulation of Lauric Acid with Chitosan for Bacterial control.
Modified asphalt mixtures with recycled materials to be used as a wearing course in long-lasting pavements.
Comparison between PET based prefabricated sidewalks and simple concrete sidewalks.
Digital sensor of magnetoresistive properties of semiconductor materials.
Improvement of the mechanical properties of rigid pavements through polymeric additives.
The damage factor of pavement on the roads of mexico is included in the toll rate?.
Portable optical device for the non-destructive and in situ measurement of lycopene and degree of maturity in ball tomato.
Impact of a photo-transistior’s, collector current, equivalent resistance and process temperature on ouput voltaje.
Asphalts Mixtures.
Evaluation of the properties of concrete with the addition of rubber particles for structural elements.
Quantum mechanics: simulation and calculations CdSe and PbSe.
An study of classification movements of the lower limb based on up to 4-EMG channels.
Applications of recycled polyethylene terephthalate (PET) and its use in construction.
Undestructive Methods: An Alternative to Determine Capsaicin.
Use of Unmanned Aircraf Vehicle (UAVs-drone) as main tool of work in engineering. A review.

Poster Presentation
Biogenic volatile organic compounds a tool to defend the crops.
Conceptual Design of Transtibial Prosthesis*
Implementation of different position controllers for servo motors in a serial robot R||R.
Evaluation of technological interactions of public space by the urban design sector in the state of Queretaro.
Retrieval of materials in civil construction for its reuse in creating new constructionmaterials.
Parameters of crispness in a breakfast cereal enriched with nopal powdered.
Fiber Optic Sensors as an Alternative to Structural Health Monitoring in Concrete Structural Beams Explanation and Development of a System Capable to Monitor in Real Live – Time
Displacements, Temperature, and Strains in Structural Beams
García Benítez Rodrigo 1*
1 Facultad de Ingeniería, Licenciatura en Ingeniería Civil, Universidad Autónoma de Querétaro Querétaro, México
Edgar Alejandro Rivas Araiza2
2 Facultad de Ingeniería, Coordinación de Maestría en Instrumentación y Control Automático, Universidad Autónoma de Querétaro, México
Seismic activity causes catastrophic effects all over the world. This is due to the bad standardization in the present normative in the construction of hospitals in order to prevent a disaster. The bad quality in construction, the low-cost materials and the poor manufacturing in the process affects, in an earthquake, way more than a bad design in the structure itself. This investigation reaches and creates a system capable of measuring in real live – time the variations of displacements, temperature, and strains created before, during, and after the catastrophe. Hospitals are very important to the people; we cannot ignore the fact that if such building collapses during an earthquake, many people lives will perish, and way more will be in danger if fallen debris harmed them in any matter. Fiber Bragg Grating optic sensors are capable to measure these variations. They deflect light that passes through them and rebounds some of it, causing an effect that can be related to changes in its initial position.
Keywords—Wavelength, Strain, Deformation, Fiber Optic Sensors, Strains, Embedded Optic Sensors
I. INTRODUCTION Continuous monitoring is very important in order to
prevent structural damages. Using fiber optic sensors we are able to measure the magnitude of the phenomenon that can affect buildings, such as hospitals. A high resistance mesh and fiber optic sensors becomes necessary along the entire internal body of the structural beams. [10] Providing a continuous and real-time diagnosis of the internal forces that were modified due to the seismic activity is the main purpose of this research.
Important and significant buildings, such as hospitals, libraries, airports and colleges should meet with a strict security system against contingencies, this because in an emergency they should work as shelter or safe house in order to protect citizens [8]
The techniques and methods to find a real result are very centralized. Since obsolete technologies are used to only distinguish the effects of the forces in a single point of the structural element. The optical fiber, when transmitted by light becomes faster, granting in real-time what it is in effect happening throughout the element. Becoming an efficient technology in the study of structural health monitoring. [3]
Our approach goes directly to the study of longitudinal structural elements, such as beams, and columns. The proposed mesh consists of high strength wiring with fiber optic sensors and a rigid transverse body that holds the mesh in place, thus providing sufficient stability so that it does not move once placed inside the structure. Once the fiber optic system has been built along all the main structural elements, they are connected to a single central console. [4] Programmed only to be able to register these changes continuously, to alert in time some variation or sudden re-arrangement in the elements analyzed, as well as make a file of these studies for a later analysis if it is required.
The analyzed elements will be selected in order to be able to generalize the behavior of this structure. Since, if the system were place in each of the elements, the system would be loaded with information and lose the ability to store information quickly. As well as hindering the study considerably. [12]
External forces are the most related factors to deformation, although they are the most significant, they are not the only causes to create them all the way across the sections in the entire structure. The proper weight of the elements affect the behavior of the building, also the shrinkage of concrete elements due to the loss of water, as well as the creep, were dead loads deform the sections were they are grounded through

time. This consideration can be analyze in the early behavior of the construction itself, in the case of shrinkage of concrete elements. [3]
II. THEORETIC CONSIDERATIONS
A. Fiber Bragg Grating Sensor Considerations
In 1978 Ken Hill, demonstrated that through the interference pattern of ultraviolet laser light and the Fresnel reflection, light did not reach entirely the final point of an optic interface [7]. This because part of the light that went through reflected and some other refracted [2]. He demonstrated and related this behavior to the Bragg wavelength:
λB = 2ne⋀ (1)
Were ne is the effective refractive index of the fiber core and ⋀ stands for the grating period.
Fig 1 Main function of a Fiber Bragg grating core, reflected and refracted light
– systemic strain measure [2]
A property of the Fiber Bragg gratings is that they perform as wavelength filters, this due to the reflection of light all over the incident broadband. [1] Transmitting only in his first wavelength range, producing the same spectrum as when it was initially induced, with the only difference of a clear depression in its spectrum, in which can be inferred the refracted light.
Other factors affect Fiber Bragg gratings, such as temperature. Strain (Δε) and temperature (ΔT) variations might change lectures in the core if not read properly [5]. The shift in Bragg wavelength is given by:
Δ𝜆𝐵 = (1 − 𝑃𝑒)𝜆𝐵Δ ∈ +(𝛼 + 𝜉)𝜆𝐵Δ𝑇 (2)
Where 𝑃𝑒 represents the effective photo-elastic coefficient, approximately, rounded to 0.22, expressed in the next equation: 𝑃𝑒 = 𝑛2
2[𝑃12 − 𝑣(𝑃12 + 𝑃11)] (3)
Where 𝑃𝑖𝑗 is the known Pockels coefficient of the
strain-optic sensor and 𝑣 is the Poisson ratio. [6] When a strain is affecting a Fiber Bragg grating
sensor, the elasto-optic effect vary the lectures in the effective refractive index, ne , using equation (3) and assuming that the grating period ⋀ in equation (1), we can join (1), (2) and (3) in the following expression:
𝜇𝜀 = Δ𝜆𝐵
𝜆𝐵= {1 − 𝑛𝑒
2[𝑃12−𝑣(𝑃11+𝑃12]2
} 𝜀 (4)
This relation expresses the Bragg wavelength relative changes due to the effects of any strain focused in the optic sensor applied.
If pressure from the environment is another factor to consider. Considering the atmospheric pressure or other features involving pressure, the Bragg wavelength changes can be expressed by: [9]
Δ𝜆𝐵
𝜆𝐵= 1−2𝜈
𝐸[𝑛2
2(2𝑃12 + 𝑃11) − 1] Δ𝑃 (5)
B. Concrete Structures Considerations Concrete is known to be an alkaline substance; this factor
obligates the optic sensor to be capable to handle well with corrosion. In addition, civil engineering requires maintaining quality in its structure, regardless of which structure is being built, its durability as well as its reliability is the key factor to creating and developing a sensor capable of reaching and surpassing these standards.
An athermal packaged FBG can be useful to measure sensible changes in temperature. The working temperature frame for this type of sensor varies across the 0°C to 75°C.
Fig 2 T&S model Athermal type FBG Sensor – Grupo COFITEL
An integrated deformation Fiber Bragg Grating (IDFBG)
[11] sensor is the most common sensor for embedded structures. With a central wavelength of 1500 nm, the IDFBG is capable of measuring strains with a typical sensitivity of 1.5 𝑝𝑚/𝜇𝜀. Reinforced with a high-resistance steel capable of resisting the contraction of concrete in its first 24 hours after being emptied. [10]
The IDFBG sensors uses the high sensibility from other sensors to measure deformations, displacements or vibrations in a real-time analysis. Its typical deformation range goes to 5000 𝜇𝜀 with a precision of 10 𝜇𝜀.
The effect of the temperature on the sensor and on the base material is represented by the next equation: [13]
𝜎 = 𝑥𝑆 − 7.32Δ𝑇 − 𝑐𝑡𝑒𝑠𝑡𝑟𝑢𝑐𝑡𝑢𝑟𝑒Δ𝑇 (7)
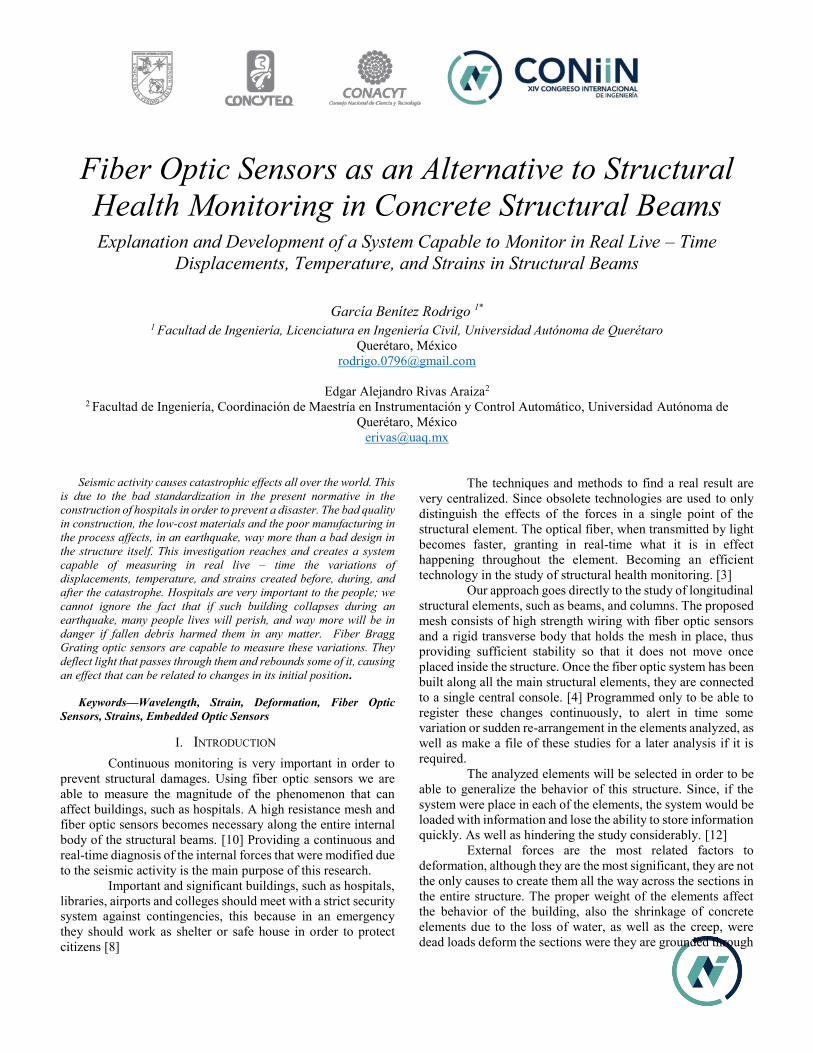
Fig 3 Concrete cylinder, f’c = 250 kg/cm2, and a FBG sensor attached to
the body of the cylinder for its further analysis.
III. METHODOLOGY a) Designing the Concrete Cylinders:
The cylinders were designed to reach an f’c = 250 kg/cm^2 to its full resistance in 28 days. Giving us the next design:
Element Concrete Design
Amount Needed for One Cylinder Quantity Unit
Water Water needed 0.30074 lts
Cement Cement needed 0.57752 Kg
Gravel Gravel needed 1.42099 Kg
Sand Sand needed 1.34790 Kg Fig 4 Concrete design for an f’c = 250 kg/cm^2 used to build the concrete
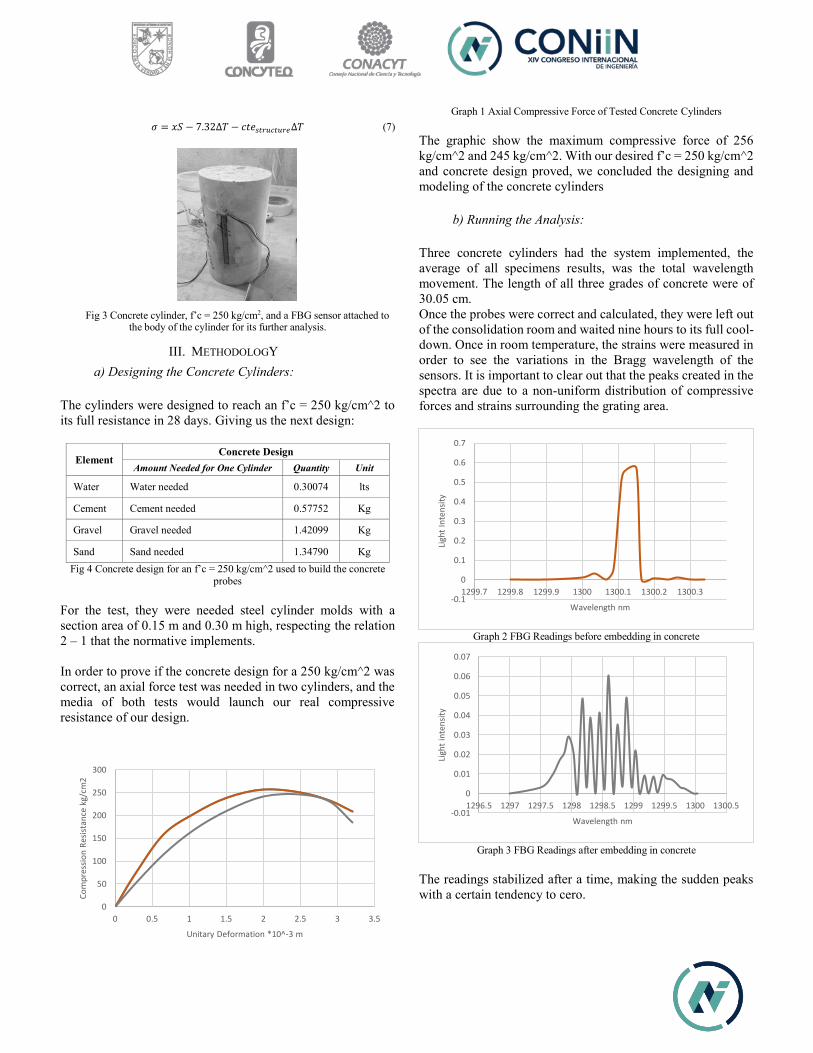
probes For the test, they were needed steel cylinder molds with a section area of 0.15 m and 0.30 m high, respecting the relation 2 – 1 that the normative implements. In order to prove if the concrete design for a 250 kg/cm^2 was correct, an axial force test was needed in two cylinders, and the media of both tests would launch our real compressive resistance of our design.
Graph 1 Axial Compressive Force of Tested Concrete Cylinders The graphic show the maximum compressive force of 256 kg/cm^2 and 245 kg/cm^2. With our desired f’c = 250 kg/cm^2 and concrete design proved, we concluded the designing and modeling of the concrete cylinders
b) Running the Analysis: Three concrete cylinders had the system implemented, the average of all specimens results, was the total wavelength movement. The length of all three grades of concrete were of 30.05 cm. Once the probes were correct and calculated, they were left out of the consolidation room and waited nine hours to its full cool-down. Once in room temperature, the strains were measured in order to see the variations in the Bragg wavelength of the sensors. It is important to clear out that the peaks created in the spectra are due to a non-uniform distribution of compressive forces and strains surrounding the grating area.
Graph 2 FBG Readings before embedding in concrete
Graph 3 FBG Readings after embedding in concrete
The readings stabilized after a time, making the sudden peaks with a certain tendency to cero. 0
50
100
150
200
250
300
0 0.5 1 1.5 2 2.5 3 3.5
Com
pres
sion
Res
ista
nce
kg/c
m2
Unitary Deformation *10^-3 m
-0.1
0
0.1
0.2
0.3
0.4
0.5
0.6
0.7
1299.7 1299.8 1299.9 1300 1300.1 1300.2 1300.3
Ligh
t In
tens
ity
Wavelength nm
-0.01
0
0.01
0.02
0.03
0.04
0.05
0.06
0.07
1296.5 1297 1297.5 1298 1298.5 1299 1299.5 1300 1300.5
Ligh
t in
tens
ity
Wavelength nm
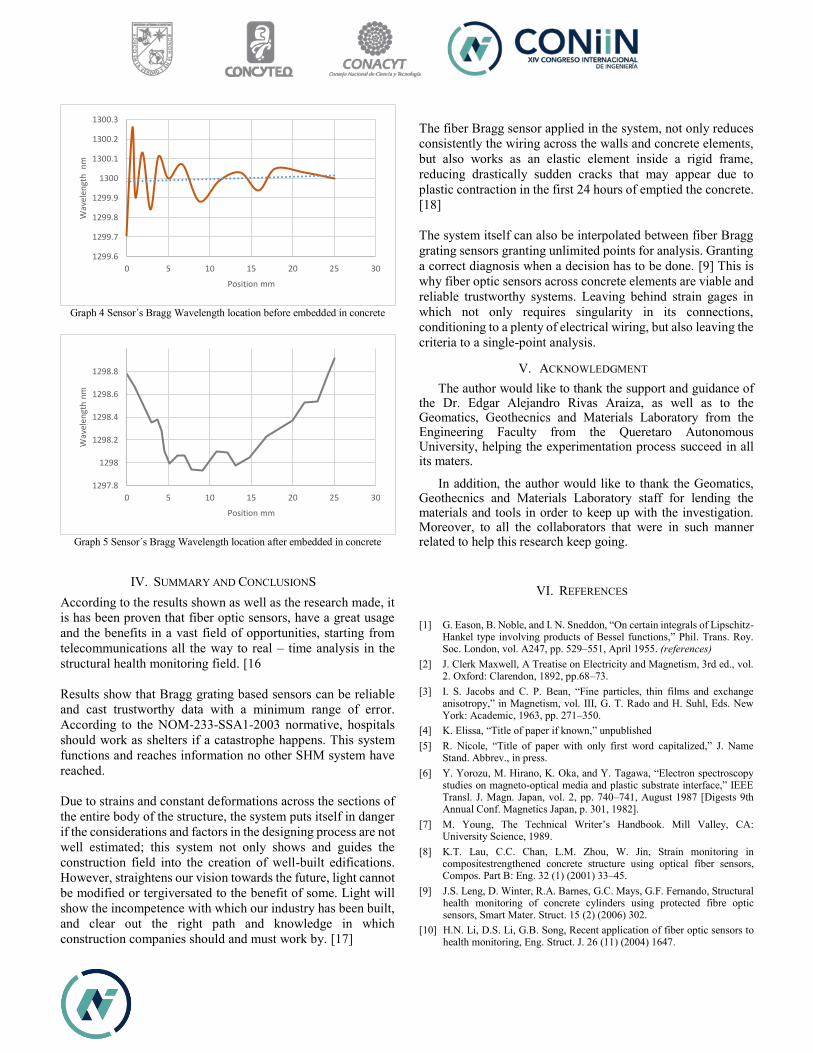
Graph 4 Sensor´s Bragg Wavelength location before embedded in concrete
Graph 5 Sensor´s Bragg Wavelength location after embedded in concrete
IV. SUMMARY AND CONCLUSIONS According to the results shown as well as the research made, it is has been proven that fiber optic sensors, have a great usage and the benefits in a vast field of opportunities, starting from telecommunications all the way to real – time analysis in the structural health monitoring field. [16 Results show that Bragg grating based sensors can be reliable and cast trustworthy data with a minimum range of error. According to the NOM-233-SSA1-2003 normative, hospitals should work as shelters if a catastrophe happens. This system functions and reaches information no other SHM system have reached. Due to strains and constant deformations across the sections of the entire body of the structure, the system puts itself in danger if the considerations and factors in the designing process are not well estimated; this system not only shows and guides the construction field into the creation of well-built edifications. However, straightens our vision towards the future, light cannot be modified or tergiversated to the benefit of some. Light will show the incompetence with which our industry has been built, and clear out the right path and knowledge in which construction companies should and must work by. [17]
The fiber Bragg sensor applied in the system, not only reduces consistently the wiring across the walls and concrete elements, but also works as an elastic element inside a rigid frame, reducing drastically sudden cracks that may appear due to plastic contraction in the first 24 hours of emptied the concrete. [18] The system itself can also be interpolated between fiber Bragg grating sensors granting unlimited points for analysis. Granting a correct diagnosis when a decision has to be done. [9] This is why fiber optic sensors across concrete elements are viable and reliable trustworthy systems. Leaving behind strain gages in which not only requires singularity in its connections, conditioning to a plenty of electrical wiring, but also leaving the criteria to a single-point analysis.
V. ACKNOWLEDGMENT The author would like to thank the support and guidance of
the Dr. Edgar Alejandro Rivas Araiza, as well as to the Geomatics, Geothecnics and Materials Laboratory from the Engineering Faculty from the Queretaro Autonomous University, helping the experimentation process succeed in all its maters.
In addition, the author would like to thank the Geomatics, Geothecnics and Materials Laboratory staff for lending the materials and tools in order to keep up with the investigation. Moreover, to all the collaborators that were in such manner related to help this research keep going.
VI. REFERENCES
[1] G. Eason, B. Noble, and I. N. Sneddon, “On certain integrals of Lipschitz-Hankel type involving products of Bessel functions,” Phil. Trans. Roy. Soc. London, vol. A247, pp. 529–551, April 1955. (references)
[2] J. Clerk Maxwell, A Treatise on Electricity and Magnetism, 3rd ed., vol. 2. Oxford: Clarendon, 1892, pp.68–73.
[3] I. S. Jacobs and C. P. Bean, “Fine particles, thin films and exchange anisotropy,” in Magnetism, vol. III, G. T. Rado and H. Suhl, Eds. New York: Academic, 1963, pp. 271–350.
[4] K. Elissa, “Title of paper if known,” unpublished [5] R. Nicole, “Title of paper with only first word capitalized,” J. Name
Stand. Abbrev., in press. [6] Y. Yorozu, M. Hirano, K. Oka, and Y. Tagawa, “Electron spectroscopy
studies on magneto-optical media and plastic substrate interface,” IEEE Transl. J. Magn. Japan, vol. 2, pp. 740–741, August 1987 [Digests 9th Annual Conf. Magnetics Japan, p. 301, 1982].
[7] M. Young, The Technical Writer’s Handbook. Mill Valley, CA: University Science, 1989.
[8] K.T. Lau, C.C. Chan, L.M. Zhou, W. Jin, Strain monitoring in compositestrengthened concrete structure using optical fiber sensors, Compos. Part B: Eng. 32 (1) (2001) 33–45.
[9] J.S. Leng, D. Winter, R.A. Barnes, G.C. Mays, G.F. Fernando, Structural health monitoring of concrete cylinders using protected fibre optic sensors, Smart Mater. Struct. 15 (2) (2006) 302.
[10] H.N. Li, D.S. Li, G.B. Song, Recent application of fiber optic sensors to health monitoring, Eng. Struct. J. 26 (11) (2004) 1647.
1299.6
1299.7
1299.8
1299.9
1300
1300.1
1300.2
1300.3
0 5 10 15 20 25 30
Wav
elen
gth
nm
Position mm
1297.8
1298
1298.2
1298.4
1298.6
1298.8
0 5 10 15 20 25 30
Wav
elen
gth
nm
Position mm

[11] H. Marzouk, Creep of high-strength concrete and normal-strength concrete, Mag. Concr. Res. 43 (155) (1991) 121–126. H.C. Mertol, W. Choi, S. Rizkalla, P. Zia, Shrinkage
[12] Humbert, L, Botsis, J, Bosia, F. Modeling of the residual stresses acting on a low-birefringence fiber Bragg grating sensor embedded in an epoxy matrix. SPIE 10th Annual International Symposium on Smart Structures and Materials, San Diego, CA, 2003.
[13] Colpo F, Giaccari P, Humbert L, Botsis J. Residual stresses characterization in an epoxy block by embedded FBG sensor and the OLCR technique. Euromech 453 Internal Stresses in Polymer Composite Processing and Service Life, Saint-Etienne, France 2003.
[14] Mikata Y, Taya M. Stress field in a coated continuous fiber composite subjected to thermomechanical loading. Journal of Composite Materials 1985;19:554–79.
[15] Hasan R. Xu L. Grierson D.E. Push-over analysis for performance-based seismic design. J. PERGAMON 2002; 80: 2483-2493.
[16] Federal Emergency Management Agency.NEHRP guidelines for the seismic rehabilitation of buildings, Rep. FEMA273 (Guidelines) and 274 (Commentary), Washinton, DC, 1997.
[17] Zabihollah A, Sedagahti A. Ganesan R. Active vibration suppression of smart laminated beams using layerwise theory and an optimal control strategy. J.Smart Mater. Struct 2007; 16: 2190–2201.
[18] Farahmand Azar B. Ghaffarzadeh H. Talebian N. Seismic Performance of Composite RCS Special Moment Frames. J.KSCE 2012; 219:450-457.

Non-invasive System for the Identification and Classification of Melanomas
Luz María Sánchez Reyes
División de Posgrado, Facultad de Ingeniería Universidad Autónoma de Querétaro
Querétaro, México [email protected]
Damián Vargas Vázquez División de Posgrado, Facultad de Ingeniería
Universidad Autónoma de Querétaro Querétaro, México [email protected]
Abstract— This paper presents research performed at the Universidad Autónoma de Querétaro, Facultad de Ingeniería. Melanoma is the most severe type of skin cancer. Also, according to the World Health Organization (OMS) it is the leading cause of skin cancer death at the world. The first sign of a melanoma is a change in size, shape, color or texture of a mole. The objective of the project was to implement a portable, non-invasive system for the classification of benign and malignant melanomas, using image processing. The system was implemented on a Raspberry-pi3 card using Python programming as the main programming language. The system is trained to evaluate the four main characteristics of melanomas, which are: size, shade dispersion, symmetry, and shape relation. Once the device was available, a database was taken to evaluate its functions; it was tested with each of the pictures and the results obtained were verified, compared and analyzed. The main features of the device are the following: it is portable, non-invasive, low energy consumption, flexible and has a friendly interface with the user.
Keywords— Malignant and benign melanoma; Raspberry-pi3; Python; image processing.
I. INTRODUCTION The digital processing of images has been significant
progress for the technology since this set of techniques is applied to digital images with the aim of improving the quality of the image and facilitating the search for information.
The objective of this work was to improve the quality of the images received for their study and, in turn, through various techniques and programming algorithms, to obtain sufficient information to distinguish between malignant tumors and benign tumors of melanomas. This work will be part of a first stage for the prevention, detection, and treatment of one of the most severe skin diseases, since according to the World Health Organization (OMS) it is the leading cause of skin cancer death at the world [3], [6-8].
The International Labor Organization (OIT) reports that 56 percent of the world's rural population does not have health coverage, compared to 22 percent who live in urban areas. Also, it establishes that there are inequalities in health coverage in most countries, whether rich or poor, although the highest rural/urban gap is found in developing countries. The device
designed during this research is oriented to rural areas because, being an easy-to-use device, accessible transportation and use, and not an invasive treatment, it can be used in rural areas of difficult access where they do not have this type of studies and that there are no specialists in dermatology.
The Raspberry-pi3 is an embedded system used with high frequency for the processing of images due to its technical characteristics such as speed and processing power, memory capacity and its possibility of wireless connection using Bluetooth or a Wi-Fi network. On the other hand, Python is a platform-independent and object-oriented scripting language. Some of the main features of Python are the following: Free software, general-purpose language, multiplatform, object-oriented, among others. The combination of these two elements allows us to develop high-performance applications in a short time and even low cost [1], [2], [5].
II. MATERIALS AND METHODS The research was done in the facilities of the Universidad
Autónoma de Querétaro at the Facultad de Ingeniería, since last year. The primary elements were the following: A Raspberry-pi3, a minor sd class 10 of 32GB, an HP computer (Intel Celeron N3050 processor, 4GB memory, and 8GB hard drive), and a camera for Rasberry-pi3.
The methodology was divided into three parts; the first part was the bibliographic search that allowed us to know the state of the art of the systems applied to the detection of melanomas. The second stage was the implementation of programming algorithms for the conditioning of images and obtaining characteristics, which allowed us to measure and evaluate the parameters that characterize malignant and benign melanomas. The third stage consisted in the evaluation of the device for which a database was taken in which cases of both types of melanomas were contained, and the results of each image were verified.
As mentioned above, four characteristics were evaluated for the identification of melanomas, and for each of them the device was trained, and an algorithm was designed to identify and assess the parameter.
Verification of the image
size
Skin removal: identification of skin and possible
candidates
Noise removal using Gaussian
filters and morphological
filters
Conversion of color space,
RGB to GRAY
Calculation of HueDispersi-
on
Calculation of UnevenShap-
eRatio
Calculation of ASymmetric-
Ratio
Calculation of InjuryThreshold
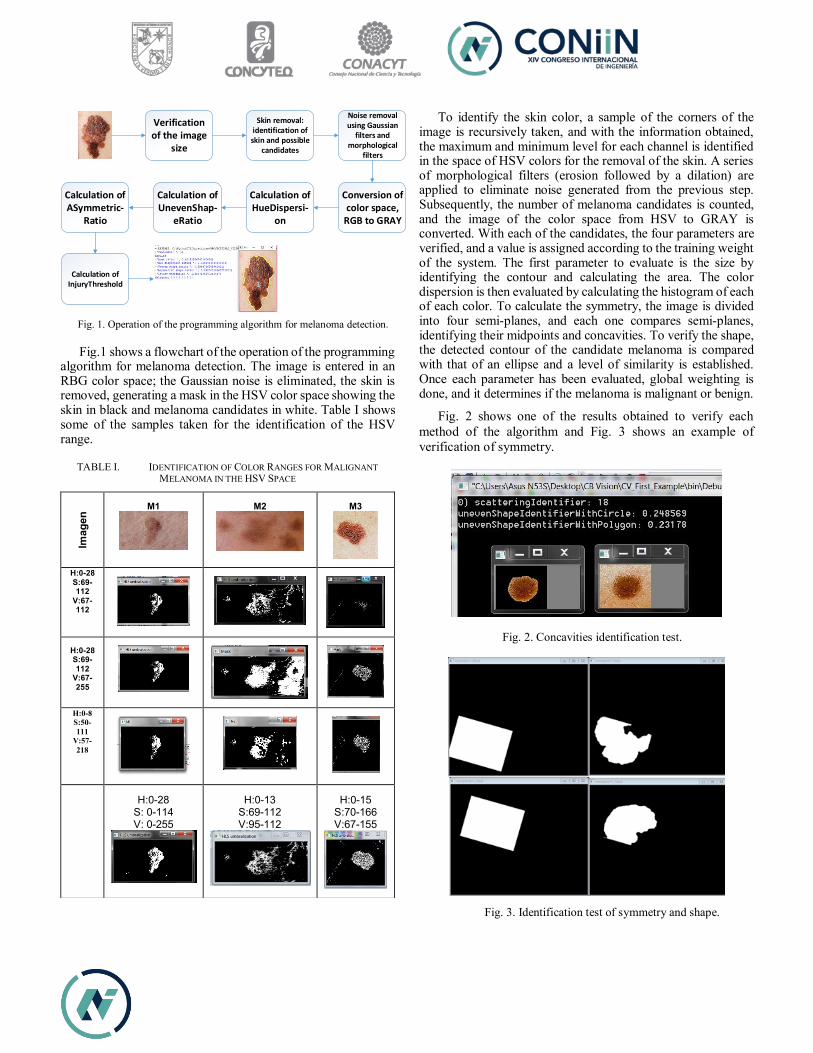
Fig.1 shows a flowchart of the operation of the programming algorithm for melanoma detection. The image is entered in an RBG color space; the Gaussian noise is eliminated, the skin is removed, generating a mask in the HSV color space showing the skin in black and melanoma candidates in white. Table I shows some of the samples taken for the identification of the HSV range.
TABLE I. IDENTIFICATION OF COLOR RANGES FOR MALIGNANT MELANOMA IN THE HSV SPACE
To identify the skin color, a sample of the corners of the image is recursively taken, and with the information obtained, the maximum and minimum level for each channel is identified in the space of HSV colors for the removal of the skin. A series of morphological filters (erosion followed by a dilation) are applied to eliminate noise generated from the previous step. Subsequently, the number of melanoma candidates is counted, and the image of the color space from HSV to GRAY is converted. With each of the candidates, the four parameters are verified, and a value is assigned according to the training weight of the system. The first parameter to evaluate is the size by identifying the contour and calculating the area. The color dispersion is then evaluated by calculating the histogram of each of each color. To calculate the symmetry, the image is divided into four semi-planes, and each one compares semi-planes, identifying their midpoints and concavities. To verify the shape, the detected contour of the candidate melanoma is compared with that of an ellipse and a level of similarity is established. Once each parameter has been evaluated, global weighting is done, and it determines if the melanoma is malignant or benign.
Fig. 2 shows one of the results obtained to verify each method of the algorithm and Fig. 3 shows an example of verification of symmetry.
Imag
en M1
M2
M3
H:0-28 S:69-112
V:67-112
H:0-28 S:69-112
V:67-255
H:0-8 S:50-111
V:57-218
H:0-28
S: 0-114 V: 0-255
H:0-13 S:69-112 V:95-112
H:0-15 S:70-166 V:67-155
Fig. 1. Operation of the programming algorithm for melanoma detection.
Fig. 2. Concavities identification test.
Fig. 3. Identification test of symmetry and shape.
To weight each parameter, we had the previous training of the system that consisted in the identification of the range of values according to a database taken from medical results in which cases of positive melanoma and negative cases were presented. That is, there were two databases in total, one to train the system and another to verify the operation.
III. RESULTS AND DISCUSSION The primary purpose of this research was to achieve a non-
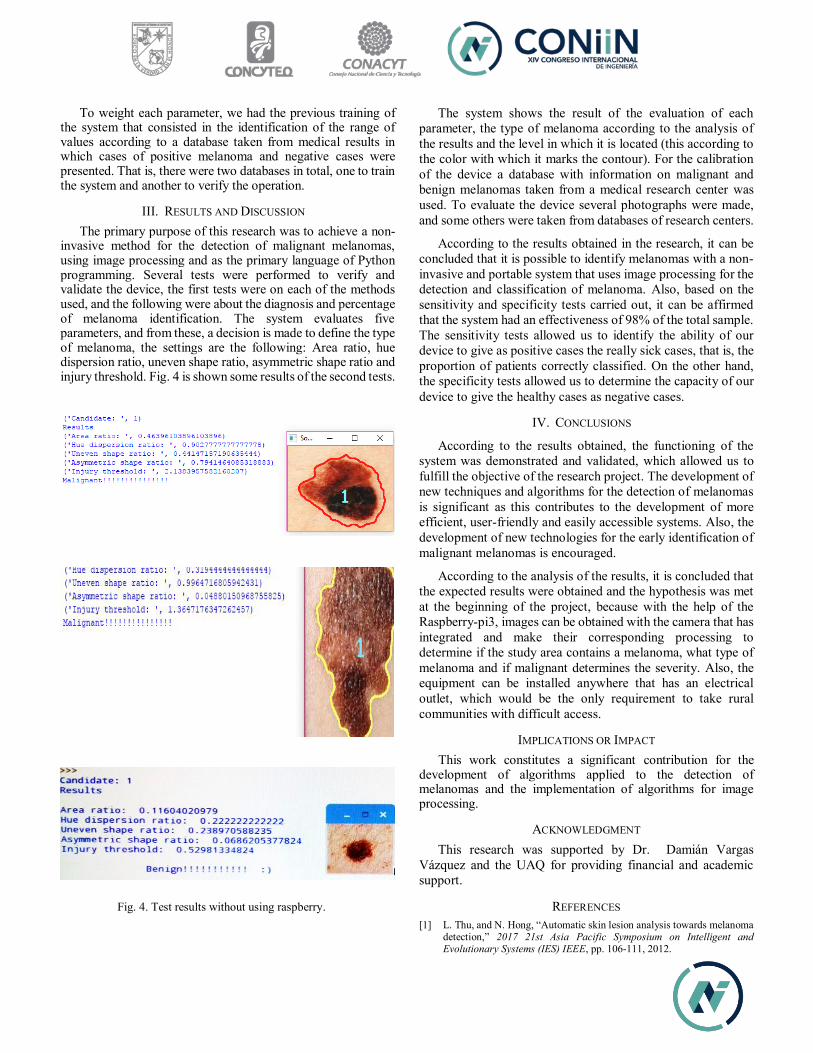
invasive method for the detection of malignant melanomas, using image processing and as the primary language of Python programming. Several tests were performed to verify and validate the device, the first tests were on each of the methods used, and the following were about the diagnosis and percentage of melanoma identification. The system evaluates five parameters, and from these, a decision is made to define the type of melanoma, the settings are the following: Area ratio, hue dispersion ratio, uneven shape ratio, asymmetric shape ratio and injury threshold. Fig. 4 is shown some results of the second tests.
The system shows the result of the evaluation of each parameter, the type of melanoma according to the analysis of the results and the level in which it is located (this according to the color with which it marks the contour). For the calibration of the device a database with information on malignant and benign melanomas taken from a medical research center was used. To evaluate the device several photographs were made, and some others were taken from databases of research centers.
According to the results obtained in the research, it can be concluded that it is possible to identify melanomas with a non-invasive and portable system that uses image processing for the detection and classification of melanoma. Also, based on the sensitivity and specificity tests carried out, it can be affirmed that the system had an effectiveness of 98% of the total sample. The sensitivity tests allowed us to identify the ability of our device to give as positive cases the really sick cases, that is, the proportion of patients correctly classified. On the other hand, the specificity tests allowed us to determine the capacity of our device to give the healthy cases as negative cases.
IV. CONCLUSIONS
According to the results obtained, the functioning of the system was demonstrated and validated, which allowed us to fulfill the objective of the research project. The development of new techniques and algorithms for the detection of melanomas is significant as this contributes to the development of more efficient, user-friendly and easily accessible systems. Also, the development of new technologies for the early identification of malignant melanomas is encouraged.
According to the analysis of the results, it is concluded that the expected results were obtained and the hypothesis was met at the beginning of the project, because with the help of the Raspberry-pi3, images can be obtained with the camera that has integrated and make their corresponding processing to determine if the study area contains a melanoma, what type of melanoma and if malignant determines the severity. Also, the equipment can be installed anywhere that has an electrical outlet, which would be the only requirement to take rural communities with difficult access.
IMPLICATIONS OR IMPACT This work constitutes a significant contribution for the
development of algorithms applied to the detection of melanomas and the implementation of algorithms for image processing.
ACKNOWLEDGMENT This research was supported by Dr. Damián Vargas
Vázquez and the UAQ for providing financial and academic support.
REFERENCES [1] L. Thu, and N. Hong, “Automatic skin lesion analysis towards melanoma
detection,” 2017 21st Asia Pacific Symposium on Intelligent and Evolutionary Systems (IES) IEEE, pp. 106-111, 2012.
Fig. 4. Test results without using raspberry.

[2] H. Robby, E. Martiana, and F. Fahrul, “Detection Melanoma Cancer using ABCD rule based on Mobile Device,” 2017 International Electronics Symposium on Knowledge Creation and Intelligent Computing (IES-KCIC), IEEE, pp. 127-131, 2017.
[3] B. Zhang, D. Kuang, X. Tang, Y. Mi, Q. Lou, and S. Guanbin, “Effect of Low-field High-frequency nsPEFs on the Biological Behaviors of Humans A375 Melanoma Cells,” IEEE Transactions on Biomedical Engineering, pp. 1-8, 2017. doi: 10.1109/TBME.2017.2784546
[4] A. Rajesh, “Classification of malignant melanoma and Benign Skin Lesion by Using Back Propagation Neural Network and ABCD Rule,” 2017 International Conference on Electrical, Instrumentation, and Communication Engineering (ICEICE2017), 2017.
[5] S. Mustafa, A. Baba, and D. Mohammed, “Image Processing and SVM Classification for Melanoma Detection,” 2017 IEEE, 2017.
[6] A. Munya, M. El-Sayed and M. AbdelBadeeh, “Computational Intelligence Approaches for Malignant Melanoma Detection and Diagnosis,” IEEE, 2017 8th International Conference on Information Technology (ICIT), pp. 55-61, 2017.
[7] X. Hongming, H. Wang, B. Richard, J. Naresh, and M. Mrinal, “Computerized Measurement of Melanoma Depth of Invasion in Skin Biopsy Images,” 2017 IEEE, pp. 17-20, 2017.
[8] G. Zacharakis, S. George, F. Rosy, K. Athanasios, L. Konstantinos and T. Androniki, “Characterization of biopsy samples with Optical Computed Tomography,” 2011 IEEE, 2011.
[9] P. Ashwin, “Raspberry Pi Computer Vision Programming,” PacktPub, 2015.
[10] R. Zegarra, “Situación del Melanoma Maligno Cutáneo en el Hospital Militar Central Lima 1985-2007,” Desmatología Peruana 2008, vol. 18, pp. 267-283, 2007.
[11] B. Pedro and L. Andrea, “Non-melanoma skincancer,” Revista Médica Clínica las Condes, ELSEVIER, vol. 22, pp. 737-748, 2011. doi: 10.1016/S0716-8640(11)70486-2
[12] G. Francisco, “Melanoma: Fundamentos del diagnóstico y la terapéutica.” Available: http://www.medigraphic.com/pdfs/actmed/am-2012/am124h. pdf, 2012.
Polymer concrete for paving using polyethylene terephthalate resins
José David López Muro Faculty of Engineering
Autonomous University of Queretaro Querétaro, México
Teresa López Lara Faculty of Engineering
Autonomous University of Queretaro Querétaro, México
J. Horta Rangel
Faculty of Engineering Autonomous University of Queretaro
Querétaro, México
Juan Bosco Hernández Zaragoza Faculty of Engineering
Autonomous University of Queretaro Querétaro, México
In the following document, the feasibility of developing a hydraulic concrete modified with polymers is analyzed so that it is implemented as a rigid pavement. The alternatives are reviewed when there is a need to use a material so that it works as pavement on high specification roads and a comparison is made with the polymeric concrete to see the attributes that it could provide.
keywords—polymer, pavement, hydraulic concrete, flexural strength, mechanical properties, durability.
I. INTRODUCTION Hydraulic concrete is the most used construction material in
the world. Its low cost, its workability and the resistance to simple compression it provides are the main qualities for it to be widely accepted [1]. Despite all this, it has important disadvantages, such as low resistance to bending and tension, high porosity and susceptibility to acid environments [2].
A point that requires special care when considering the construction of a rigid pavement is that the resistance to bending is the main parameter to perform the design [3], a deficiency that hydraulic concrete presents [2]. There are several investigations in which it was sought to improve the resistance to flexion obtaining favorable results.
By adding recycled PET fibers in 4 different proportions to 4 hydraulic concrete mixtures with the same dosage, it was possible to verify that the PET fibers increased the flexural strength of concrete by 19.2% in the optimum proportion. It was concluded that the resistance to bending increases proportionally to the increase of the fibers in the mixture. [4]
In a similar investigation, by means of the addition of urban solid waste (PET) fibers to hydraulic concrete in 66 specimens, which were differentiated by the length and quantity of fibers that each specimen contained, it was possible to conclude that there is an increase in tensile strength by 22% with the addition of fibers at 0.06% and with lengths greater than 24 mm [5].
On the other hand, it has been sought to develop a polymer concrete for a repair use in high specification pavements by adding liquid type silicone rubber or residual dust from tire to concrete. This investigation allows us to suppose that the highest amounts of tire dust induce to obtain higher deflections, having a higher area in the tension-deformation curve [6].
In a similar way, an experimental investigation was developed on a stretch of the "Quadrilatero-Marche Umbria" road in Italy, in which a concrete with polypropylene fibers was applied in a monitored test section and imposed on real traffic loads for 6 months. Very low deformation levels were obtained, located practically in the initial pre-service condition. A beneficial effect of tension relaxation dominated the recorded readings [7].With this, it can be said that it is no coincidence that hydraulic concrete with polymers of various types acquires superior mechanical properties, which can be used in the field of highway engineering, for the implementation of a material for paving that can be competitive with the materials currently used.
In general, based on various investigations, it is concluded that polymer concrete has greater durability and resistance than a common hydraulic concrete [8]. The improvement of the addition of the polymer is obtained by the interaction of the particles of this and the hydrates of the cement involved in the
formation of a film, positively affecting the microstructure of the material and with it the performance and durability [9].
Nowadays, the existing paving materials are flexible pavement, made of asphalt concrete or a rigid pavement, made of hydraulic concrete. The development of both materials has negative impacts on the environment. The cement industry was responsible for 38.5% of Co2 emissions in Europe, in 2009 [10]. Likewise, working with asphalt in high temperatures produces considerable amounts of greenhouse gases, as well as other chemical pollutants that affect air quality [11]. In this sense, it is inferred that for both materials modifications in its composition can be made, with the aim of reducing the polluting agents that arise from its production.
In general, the use of hydraulic concrete as pavement has been growing in recent decades as these provide greater durability and longer structural life than a flexible pavement [12]. This material is superior in terms of performance and durability, but it has the disadvantage of having a higher cost in terms of development and construction. However, through various methodologies, such as the addition of polymers, it is possible to make their production more economical using recycled materials [13]. With this it is inferred that a polymeric concrete has the capacity to be a competitive material both in the functional sense as in the economic one in the field of pavements.
II. METHODOLOGY
Initially it will be necessary to carry out the characterization of the aggregates. The coarse aggregates correspond between 40 - 50% of the total volume of the mixture [14], so special care must be taken in their selection to produce a hydraulic concrete of good quality. To develop a material that is useful to function as a rigid pavement it will be necessary to use the guide for the design and proportion of concrete mixtures for pavements of the ACI [15], of which the granulometries to be used are specified, as well as the parameters of quality of concrete aggregates.
The evaluation of the quality of the hydraulic concrete is done through various tests. In this case, it will be appropriate to evaluate the resistance to bending, since it is the parameter that needs to be improved. This will be obtained by means of the rupture module which is governed by the conditions of ASTM C 78 [16]. The modulus of elasticity is linked to the modulus of rupture, which will be obtained by means of the expression:
Ec = 26454Mr0.77 (1)
Where Ec is the modulus of elasticity and Mr is the modulus of rupture obtained from the previously performed assays. After this, a revision of the compressive strength must be made, which, although it is high in a conventional hydraulic concrete, it is necessary to make sure that the addition of the polymer did not have negative effects on said mechanical property. Therefore, what is described in the ASTM C39 standard [17] should be followed. Considering that it is necessary to obtain a material so that it works as a pavement, then it is essential that it has a workability according to the task it will perform. To measure this property, slump is used, which measures the fluidity that concrete gives in its fresh state. The regulations governing the review of this procedure is ASTM C 143 [18]. Having defined the mechanical properties to be improved, we will proceed to design the hydraulic concrete base mix, with a flexural strength of 682.7 psi, a value recommended by the AASHTO for high specification highways [19]. This mixture will be taken as the main indicator to make the comparison with the concrete modified with polymers. The polymer will be obtained from the condensation polymerization [20] applied to the polyethylene terephthalate, product of the waste of plastic bottles. This will make an addition in proportions of 6%, 8%, 10% and 12% of the total volume of the specimens to be tested. Through a set of 5 tests of each test by percentage of volume, a comparison of the results will be made by means of an analysis of variance, which will determine what percentage of polymers is the optimum of the 4 mixtures made with the different proportions described.
III. EXPECTED RESULTS AND CONCLUSIONS According to what has been described in the investigations,
it is expected that the polymer will benefit the microstructure of the mixture and thereby obtain a greater flexural strength than the obtained in the common hydraulic concrete. If such resistance is obtained it may be possible to carry out additional experimentation in which the quantities of cement or coarse and fine aggregates are reduced from the base design mixture of the polymeric concrete, to such an extent that it is possible to obtain the minimum resistance required for the concrete works as a high specification pavement (682.7 psi), bringing positive impacts on the environment by reducing the amount of cement in the material, without sacrificing its performance as pavement.
IV. REFERENCES [1] Muthukumar, M.; Mohan, D. (2004). Studies on polymer concretes based on optimized aggregate mix proportion. European Polymer Journal, 40, 2167–2177. Doi: 10.1016/j.eurpolymj.2004.05.004. [2] S. Popovics, Concrete Making Materials, Hemisphere Publishing Corporation, McGraw-Hill Book Co., Washington, 1979. [3] Ziari, H., Hayati, P.; Sobhani, J. (2016) Air-Entrained Air Field Self-Consolidating Concrete Pavements: Strength and Durability, International journal of civil engineering, 15, 21-33. [4] Pelisser, F., Klegues, O., Gleize, P.; Ramos, H. (2012) Mechanical Properties of Recycled PET Fibers in Concrete. Materials Research, 15, 679-686. [5] Pereira, E. L., Oliveira, A. L.; Fineza, A.G. (2017) Optimization of mechanical properties in concrete reinforced with fibers from solid urban wastes (PET bottles) for the production of ecological concrete. Construction and building materials, 149, 837-848. [6] Roh, I., Jung, K.C., Chang, S.; Cho, Y. (2015) Characterization of compliant polymer concretes for rapid repair of runways. Construction and building materials, 78, 77-84. [7] Nobili, A., Lanzoni, L.; Tarantino, A.M. (2013) Experimental investigation and monitoring of a polypropylene-based mfiber reinforced concrete road pavement. Construction and building materials, 47, 888-895. [8] Jo, B. W., Park, S. K.; Park, J. C. (2008) Mechanical properties of polymer concrete made with recycled PET and recycled concrete aggregates. Construction and building Materials, 22, 2281-2291. [9] Giustozzi, F. (2016). Polymer-modified pervious concrete for durable and sustainable transportation infrastructures. Construction And Building Materials, 111, 502-512. doi: 10.1016/j.conbuildmat.2016.02.136 [10] Vatopoulos, K.; Tzimas, E. (2012). Assessment of CO2 capture technologies in cement manufacturing process. Journal Of Cleaner Production, 32, 251-261. doi:10.1016/j.jclepro.2012.03.013
[11] Rubio, M., Moreno, F., Martínez-Echevarría, M., Martínez, G.,; Vázquez, J. (2013). Comparative analysis of emissions from the manufacture and use of hot and half-warm mix asphalt. Journal Of Cleaner Production, 41, 1-6. doi:10.1016/j.jclepro.2012.09.036
[12] Yang, J., Shin, H., & Yoo, D. (2017). Benefits of using amorphous metallic fibers in concrete pavement for long-term performance. Archives Of Civil And Mechanical Engineering, 17(4), 750-760. doi:10.1016/j.acme.2017.02.010
[13] Krishnamoorthy, R., David, T., Mastor, N., y Nadarasa, K. (2016). Repair of Deteriorating Pavement Using Recycle Concrete Materials. Procedia Engineering, 142, 371-382. doi:10.1016/j.proeng.2016.02.064 [14] McGinnis, M., Davis, M., De la Rosa, A., Weldon, B. y Kurama, Y. (2017) Quantified sustainability of recycled concrete aggregates. Magazine of concrete research. Doi: https://doi.org/10.1680/jmacr.16.00338. [15] American Concrete Institute, ACI Committee 325, Guide for Design and Proportioning of Concrete Mixtures for Pavements, (2017). Report 325.14R-17. [16] ASTM C78 / C78M-16, Standard Test Method for Flexural Strength of Concrete (Using Simple Beam with Third-Point Loading), ASTM International, West Conshohocken, PA, (2016). [17] ASTM C39 / C39M-17b, Standard Test Method for Compressive Strength of Cylindrical Concrete Specimens, ASTM International, West Conshohocken, PA, (2017). [18] ASTM C39 / C39M-17b, Standard Test Method for Compressive Strength of Cylindrical Concrete Specimens, ASTM International, West Conshohocken, PA, (2017). [19] American Association of State Highway and Transportation Officials (1993). AASHTO Guide for Design of Pavement Structures. Washington D.C.
[20] Jin, F., Li, X., y Park, S. (2015). Synthesis and application of epoxy resins: A review. Journal Of Industrial And Engineering Chemistry, 29, 1-11. doi:10.1016/j.jiec.2015.03.026
Email classification using lemmatization and noun pattern recognition.
Claudia Rosas Raya Universidad Autonoma de Queretaro
(UAQ) Facultad de Informatica
Juriquilla, Querétaro Mexico
Hugo Jimenez Hernandez
Universidad Autonoma de Queretaro (UAQ)
Facultad de Informatica Juriquilla, Querétaro
Mexico
Ana Marcela Herrera Navarro
Universidad Autonoma de Queretaro (UAQ)
Facultad de Informatica Juriquilla, Querétaro
Mexico
Abstract— The enormous amount of information sent via email is becoming almost unmanageable. Currently, thousands of emails are sent and received everyday by millions of users. Every email has by itself structure and meaning. However, all emails represent unstructured data. Perhaps, the ability to separate useful information from the rest has become a hard task. Nevertheless, processing text is an arduous task, it may result in a long-time activity. Hence, the importance of using a technique that involves the minimum quantity of variables to analyze but at the same time they must be significant. In this work lemmatization is used to determinate the lemma of a word based on its intentional meaning. Thus, using the lemma of a word in text classification may help the performance in the search by allowing to use only that part of the word instead of the entire term.
Keywords— lemmatization, e-mail classification, NLTK, pattern recognition, data mining.
I. INTRODUCTION Data on the internet is growing in a way that it’s becoming almost uncontrollable and unstructured, due to millions of users around the world with several devices. And a part of this data comes in form of an email. More challenges are created for dealing with the amount of information on the web, while it continues growing quickly, and so do the inexperienced users. [6] Email has become a crucial tool in many schools or companies and one of the most economical and quickest forms of communication. People are drowning in information contained in emails. They have to dedicate a significant part of their time to read all that it’s received. Moreover, they have to separate it in categories like spam (a representation of misuse of this tool) and what it’s significant. Subsequently, inside the category of significant, they must create subcategories to assign criteria of what it’s more urgent to get reviewed or what represents important information to store. This is time consuming and human dependent. It tends to be “completely manual and somewhat haphazard” [4], this is hard to maintain and subjective.
Another common problem is phishing [2]. A variation on the word fishing, as bait is thrown out with the intention that a user “bites” it; phishing is unsolicited, fraudulent and potentially harmful email, especially threatening for ecommerce. [2] Text meaningful classification represents a big challenge, due to the fact that it exists a large amount of data and several number of features embedded, and it gets difficult whether to read an e-mail. “Key phrases have shown to improve system efficiency and accuracy”. [12]
In this specific case, in an email only a low percentage of all features may be useful for classifying text. Furthermore, using all the features maybe counterproductive since it can affect the performance.
In this paper, we discuss which feature selection process will be formulated for identifying the most relevant words influencing the content of the information in the text of an email. Only text will be analyzed, leaving features like tables or images out of the scope of this paper.
II. RELATED WORK
Different approaches have already classified information. In [1] four classifiers are compared: Neural Network, SVM, Naïve Bayesian and J48, they were tested to filter spam from a dataset of emails, where results concluded that Neural Network and SVM didn’t show good results compared with J48 or Naïve Bayesian classifier, because these algorithms were not appropriate to make binary decision. And J48, a simple C4.5 decision tree for classification, gives a binary decision tree, providing a better result for classification or spam filtering.
After in [2], shows Latent semantic analysis (LSA), which is a text classification technique that examines the association between a term and concepts in an unstructured collection of text. It is commonly used for page retrieval methods. This is a corpus-built technique to obtain and represent contextual implication of a word by analyzing the natural language corpus [10]. There are also hybrid methods, where corpus-based and knowledge-base techniques are involved. The Feature Extraction approach uses the original feature and the converts it to a more compact new one. Hence, all the original features are converted and reduced, containing meaningful information. [2] In [3] a domain knowledge is used to extract keywords. The results showed that domain knowledge utilization improves the performance and accuracy of keywords. [3] It uses TextRank, inspired by PageRank launched by Google, it’s an unsupervised ranking algorithm and graph-based. It makes a network of words from a text, and every edge linking two elements references a relationship between those words. The rank of a word is determined by the importance of its neighbors.
Thus, improving the performance of keyword extraction takes advantage of the domain knowledge, since every word is semantically related with each other. Meaning that if a candidate word never appears in the domain, it will be discarded. Their results showed that domain knowledge improves the keyword extraction, but it is not perfect, especially in areas such as petroleum and mathematics. In their opinion, the advantage of domain knowledge relies on coverage and quality of known keywords.
Maybe one of the most important projects is found in [6], the founders of Google created PageRank. It is based in the measure of its citation, as they said that it corresponds with the subjective people’s idea of importance. Another subjective consideration was that a page’s PageRank could be even higher if many pages considered important were pointing at it.
When PageRank was launched (1998), a total of 26 million web pages could be computed in a few hours in a medium size computer. Today, it is considerably faster.
In [7] experimented with speech recognition and used the term frequency, inverse document frequency (TFIDF) algorithm to analyze the information and it also made an insertion of POS (part of speech) material to improve the exactitude of their results.
They concluded that a simple unsupervised TFIDF executes reasonably well, and that adding information from POS helped to extract more precise keywords. One observation they had about the things that may influence the precision of the analysis was the difference between the consideration of the
actual speech and the human transcriptions.
People were included as part of giving they own classification. Users rejected a between 2% and 5% more the computer-made categories. But even so, the acceptance in general was good. [7]
In [8] they found out that startup companies needed to manage a large number of daily emails, as it was the principal via of communication of their employees and customers.
Sometimes employees wanted to consult specific data and the number of emails increased with time. The owners needed applications to manage this situation, and software for such task was available but the cost was high and not affordable for a startup company.
So, in [7] employees were asked to define the main classifications for them, such as: Sales, agent, Shipping, Customs, Billing, Packing and Moving and Insurance. After this step, 12,465 were selected randomly and 1260 used as training data. Separating the words and eliminating those with no meaningful impact, like ‘not’, ‘thanks’ or ‘regards’.
According to [7], its approach had a good level of accuracy, showing some problems to consider like: some emails could not be categorized because of the acceptable criteria and some words may represent more than one category. Next, in [11] worked on a binary text classification project, they tried to categorize spam and ham or phishing and spam. In other words, malicious emails from others.
The basic objective of [11] was to reduce the dimensions of the original space so it’d be easier to examine but also conserve the most significant part of the data. In this work, the authors compared several feature selection methods with content-based statistical feature extraction for e-mail classification. Techniques such as PCA (Principal Component Analysis), BDA (biased discriminant analysis) and ANMM (Average Neighborhood Margin Maximization). They were proven useful to classify e-mail. The results showed good binary classification, and above all BDA, which showed better results, under the ROC (Receiving Operating Characteristic) area.
Finally in [12] presented a procedure for extracting keyphrases automatically from documents named B&C. This system scores the keyphrases according to their frequency and length to determine their importance in the text.
The rest of this paper is organized as follows: In section 3, the algorithm is presented and described, while section 4 contains the results and finally section 5 the conclusions.
Identify applicable sponsor/s here. If no sponsors, delete this text box (sponsors).

III. THE ALGORITHM
III. 1 ALGORITHM DESCRIPTION Keywords, consisting of one single word or several words, may encapsulate topics and ideas of an e-mail. Furthermore, keywords help us find information from a massif amount of data.
TFIDF weighting is used to obtain the keywords. Finding the words that appear more repeatedly in an e-mail, but not necessarily in all the inbox files. Effectiveness of TFIDF is been proven before [7].
Regardless of the enormous growth of the web, its content has become commercial. Hence, its value is considered extraordinary and the separation of wanted and unwanted information becomes harder and harder.
Usually, an e-mail has two main sections: the header and the body. The header covers general information about the subject of the message in the body, data about the sender and receiver. And the body gets the message.
The original words are transformed into new reduced but meaningful ones and becoming a smaller representative term. Like this, the input data is converted into a reduced representation of the word.
The data set is obtained from a Gmail account with approximately 30 emails with text on them. Then the e-mails are categorized with the words from the feature selection. Using only the top 5 found categories, since the users “are still only willing to look at the first few tens of results.” [6]. So, more accurate tools are needed to retrieve the most relevant information in the top results of a search.
Table 1 shows the analysis of each email individually:
word Notification Account Operation Credit Card
Repetition number 4 2 2 2 2
Table 1 Analysis of individual email
The type of e-mails considered for this paper, the body contains plain text. In this work a separation between header and body is not pondered. All the information is taken as a whole.
The extracted words are obtained by using lemmatization and parsing. The parsing process is in charge of getting the features from the e-mail and the lemmatization. This stage reduces inflected (or derived) words. The words with no meaningful importance are removed, in fact, only nouns are
considered for the classifier. Selecting from keyword candidates is contemplated as a ranking problem.
The goal of this classifier, as an alternative, is to have data in a shorter and more representative way. Reducing the complexity of handling many variables in the classification process originating in an increase of the process speed.
The hypothesis of this paper is that nouns are more likely to be meaningful. So, the search of words and their frequency is limited to nouns and their lemmas. Considering that the lemmas represent words that are similar in terms of semantic value. For example, taking the words Notification and notification, when lemmatizing stage is over, only the word Notification is chosen to represent both words, so no time and effort is expend in both when it can be appreciated that the email intention is to notify something.
When a text is short, the term frequency may not be as highly reliable. However, the unsupervised approach is much simpler than other methods and does not require any sophisticated modeling to get significant results.
In this project, the Natural Language Toolkit (NLTK) was used. It is a Python tool with a GPL open source license. Recently, it has become a popular instrument in research. [5]
The University of Pennsylvania developed NLTK in 2001, with three purposes in mind: demonstrations, assignments and projects. [5]
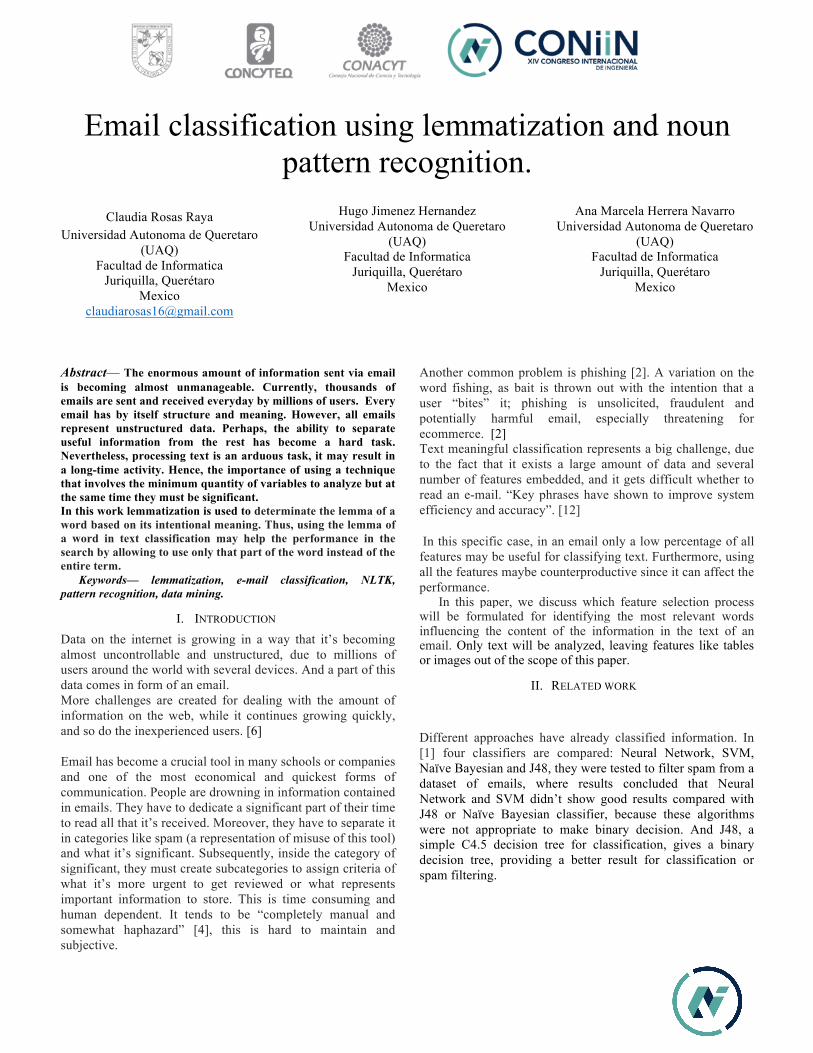
The flow of the algorithm is explained in the figure 1.
Figure 1: Flow chart of the proposed algorithm
III.2 Algorithm implementation
Python was chosen because of its syntax and its good string-handling functionality.
A. These are the steps followed by the classifier algorithm. • Tokenization: Used to label words according to their
lexical function such as: Nouns or verbs. Using NLTK library. For a multi-word search, the situation is more complicated and the inaccuracies are more visible. The main module used to achieve this task was nltk. tokenizer to split the text into its fundamental parts.
• The words with no meaningful impact to the classifier are removed. In this case, only nouns are considered.
• Lemmatization is implemented to remove flexional endings from the nouns selected in the previous step.
• Finally, a matrix is created where a row is an e-mail and each column represents a term in the document, and each cell represents the number of appearances in all the top 5 categories of all the collection of documents.
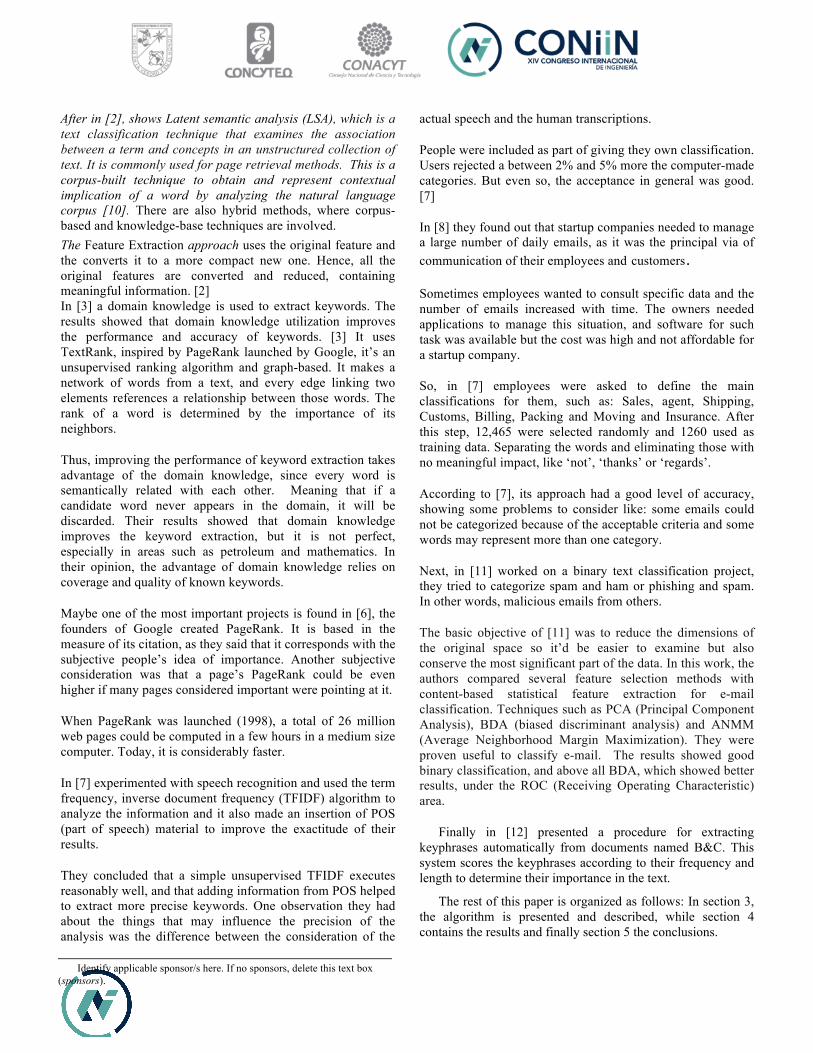
IV. RESULTS The results of the final analysis are shown in table 2:
Table 2 Final results
word http Notification Account Help email
Repetition number 106 65 61 53 46
After analyzing all the emails, these were the top 5 categories selected by the classifier. Considering only the top 5 words selected by each email. Each email contributed with its 5 most-repeated lemmas, and then the the sum of them all. When a new email is received, it goes through the same process of lemmatizing and counting, but to tag it into the correct category, the software goes throughout the categories found in the training stage to find a match between its categories and the general categories. The process is shown in figure 2:
Figure 2: Process to classify
While working in the project, many points to consider were found.
First, not necessarily the most relevant, in the step of tokenization, several inaccuracies were found. Some belong to the linguistic complexity of the natural language, in this
Training set is defined with the
information in table 2.
A new email is received
The software takes the top 5 lemmas in the
new email
A comparisson between the categories found in the training and the new email lemmas is
made. If a match is found, then a category is
assigned to the new email, if no match is found then the email gets uncategorized according to
the already existing data.

particular case: English. Phenomena such as verbs becoming noun or adjectives provoked mistakes, for example:
Helping others is great.
She is helping others.
In the example, the word helping is working as a noun while in the latter it’s a verb conjugated in present continuous tense.
Another observation worth making is the composed nouns like Credit Card. Shown in table 1, the words credit and card were evaluated as separated entities while they belong to just one. That is a problem due to all the complex words found in the English language and the inaccuracy that this may cause.
Interpreting the final results, the word http is the most repeated one in the whole examination. It seems odd, but manually reading some of the emails to find a possible answer: chain messages were found, where a URL started with http was in it several times and also it appeared in the signature of some enterprises.
Particularly, this represents an issue because the word http does not give the clarity of what the emails are about, and the purpose of the classification gets lost, since the category doesn’t really represent something clear to the user.
Another thing to consider is that the process is completely attached to the completeness of the NLTK, meaning that it depends on its content and how it is structured. While the algorithm should work universally, another set of tools or corpora may perform better or worse results.
Nonetheless, the project was developed simple but expressive, trying to innovate the linguistic elements considered to verify that it can improve classification methods in the field of Natural Language Processing (NLP).
V. CONCLUSIONS
When evaluating the results, it is observed that this technique gives a good label for each classification using the minimum of information. While others may give more accurate and detailed results but they also need more features to evaluate. It denotes an advantage because analyzing a big data set may
take a lot of time if more features are considered.
The method doesn’t have the sophistication of others, it’s rather simple. Nevertheless, it proposes the use of lemmatization which is a feature not used before in these classification techniques and it may offer a new option to consider when selecting the features to analyze.
REFERENCES
[1] Youn, S., & McLeod, D. (2007). A comparative study for email classification. In Advances and innovations in systems, computing sciences and software engineering (pp. 387-391). Springer, Dordrecht.
[2] Zareapoor, M., & Seeja, K. R. (2015). Feature extraction or feature selection for text classification: A case study on phishing email detection. International Journal of Information Engineering and Electronic Business, 7(2), 60.
[3] Li, G., & Wang, H. (2014). Improved automatic keyword extraction based on TextRank using domain knowledge. In Natural Language Processing and Chinese Computing (pp. 403-413). Springer, Berlin, Heidelberg.
[4] Cohen, W. W. (1996, March). Learning rules that classify e-mail. In AAAI spring symposium on machine learning in information access (Vol. 18, p. 25).
[5] Bird, S., & Loper, E. (2004, July). NLTK: the natural language toolkit. In Proceedings of the ACL 2004 on Interactive poster and demonstration sessions (p. 31). Association for Computational Linguistics.
[6] Brin, S., & Page, L. (1998). The anatomy of a large-scale hypertextual web search engine. Computer networks and ISDN systems, 30(1-7), 107-117.
[7] Liu, F., Pennell, D., Liu, F., & Liu, Y. (2009, May). Unsupervised approaches for automatic keyword extraction using meeting transcripts. In Proceedings of human language technologies: The 2009 annual conference of the North American chapter of the association for computational linguistics (pp. 620-628). Association for Computational Linguistics.
[8] Chaipornkaew, P., Prexawanprasut, T., Chang, C. L., & McAleer, M. (2017). A Generalized Email Classification System for Workflow Analysis (No. 17-066/III). Tinbergen Institute.
[9] Kim, S. N., Medelyan, O., Kan, M. Y., & Baldwin, T. (2013). Automatic keyphrase extraction from scientific articles. Language resources and evaluation, 47(3), 723-742.
[10] Sowmya, V., Vardhan, B. V., & Raju, M. S. B. (2017). Improving Semantic Textual Similarity with Phrase Entity Alignment. International Journal of Intelligent Engineering and Systems, 10(4).
[11] Gomez, J. C., Boiy, E., & Moens, M. F. (2012). Highly discriminative statistical features for email classification. Knowledge and information systems, 31(1), 23-53.
[12] Barker, K., & Cornacchia, N. (2000, May). Using noun phrase heads to extract document keyphrases. In Conference of the Canadian Society for Computational Studies of Intelligence (pp. 40-52). Springer, Berlin, Heidelberg.

Comparison of urban expansion models An analysis of the methodologies created to predict the expansion of a city
Manuel Fernando Chavira Quiñonez Faculty of Engineering
Autonomous University of Querétaro Querétaro, México
Saúl Antonio Obregón Biosca
Faculty of Engineering Autonomous University of Querétaro
Querétaro, México [email protected]
Gerardo Rios Quesada Faculty of Engineering
Autonomous University of Querétaro Querétaro, México
Abstract— This research compares the different methodologies that have been developed to model the expansion of a city, evaluating first the variables that sustain the models. Other factors to take into account are the combination of different models and theories to form a final model, the modeling software and the results obtained by each methodology. A comparative table of the different methodologies was carried out and a more complete methodology was proposed in the form of a conclusion that contemplates variables that are intimately linked to the phenomenon of urban growth, specifically those related to a city of medium size and rapid growth in Mexico.
Keywords—urban expansion; GIS; urbanization; cellular automata; land usage; dynamic simulation analysis; models
I. INTRODUCTION The world population increasingly lives in urban areas; in
Mexico it is not the exception, where the migration from the countryside to the city or from small cities to larger cities has caused the growth of large cities, reaching some, enormous proportions that exceed the limits of municipal and state political division [8].
The uncontrolled growth that almost always occurs, involves challenges in terms of provision of services such as public transport, housing, employment and care for the environment. This has led to the study of urban growth in the discipline of modeling. Most methodologies simulate land use change and urban expansion over time, to predict a pattern of change and be part of basic urban development planning systems for the future [7][11][18].
The majority of models aim to understand the continuity of the historical development of an urban agglomeration, predict its future evolution, simulate its condition of expansion and find its advantages and disadvantages. However, there are differences among them, mainly in the variables that interact directly as factors of urban growth, in addition, in most of the
methodologies, explanatory variables are not taken into account that by their use could be estimated more realistic results.
The results obtained by some researchers regarding urban growth models are shown below, which compares the different methodologies created to predict urban expansion, as well as other studies that have been conducted to model the expansion of urban development. Subsequently, a comparative conclusion is created to evaluate the similarities and differences between the methodologies and indicate which would be the best to use in a specific case in Mexico; also, suggest explanatory variables that help improve the selected methodology.
II. STATE OF THE ART According to the reference [3], the study of urban growth
finds new challenges every day due to the environmental, social, economic and cultural impacts that the urbanization processes comprise. The simulation of future urban spatial patterns can provide knowledge of how our cities develop under multiple social, economic and environmental conditions [4]. Different models have been used to simulate different types of urban and development forms, as well as to investigate the evolution of the urban spatial structure over time.
From the table I, it is possible to indicate that the models made to simulate the growth of a city involve precision techniques and use geographic information systems (GIS) to work the models and show the results. Regarding the methods used, the main ones are the Cellular Automata and Dynamic Simulation, each author makes use of them in a unitary way or mixes them with some other tools or methods. Regarding the variables, which are commonly used is land use and historical data on urban growth, depending on the study approach, other variables are used. The results always show a tendency to the growth of the urban sprawl and predict the potential for growth.

TABLE I. RECENT STUDIES ON URBAN EXPANSION MODELING
Reference Description of the study
[1] They developed a model based on a binomial logistic framework to predict urban growth in terms of land use change.
[13]
They investigated the application of urban growth models based on cellular automata in urban areas of developing countries. They used Clarke UGM software and its variables were historical growth, transportation, digital elevation model and protection areas.
[12]
He developed the weighted scenario method using the analytical hierarchical process method to simulate urban expansion using distributed cellular automata models, which generated maps of urbanization potential.
[16] They used global and local logistic regressions to model urban expansion with variables of land use and historical growth.
[20]
Using a cellular automata approach, they created a model of urban development, based on the theory of urban growth and integrates logistic regression and MoonLoop to obtain quantities. They used local sensitivity analysis to evaluate the performance of the model.
[2]
In their study they mixed cellular automaton with geographic information systems to generate simulations and realistic predictions of informal settlements in the context of unplanned areas.
[15]
They proposed a model of urban expansion called simulation model of urban growth patterns. They used the cellular automaton model and the discrete selection model, in addition to the Monte Carlo method.
[21]
It proposes the dynamic analysis of simulation based on the theories and methods relevant to the spatial analysis of urban agglomerations. It used geographic information systems to dynamically simulate urban expansion.
[9]
They created a model to predict the future expansion of an urban area for target years through a simulation using geographic information systems, automaton cell and Markov chain. Its main variable was the change in land use.
[19]
They proposed a model of urban expansion to capture the relation of the evolutionary process between the propagation of the population and the development of roads. They used the cellular automaton model with the road network variables and the random exploration factor.
[5]
They implemented a spatial distribution model based on the cellular automaton, focusing on the relationship between the economic performance of commercial corridors and the expected urban growth.
[6]
Using an integrated modeling approach based on the Markov chain, logistic regression and cellular automata, they studied the dynamic changes in land use. Its variables were the use of land and the demand for public transport.
[10]
They created an urban growth model with the help of SLEUTH software and using the cellular automaton model. Their data were satellite images covering 21 years of information and the results were compared with other methods using the type of land use.
[14] They used the model of cellular automaton with the help of heuristic rules and data by pixel to model the urban expansion, its main variable was the density of urbanization.
[17]
They linked a model of a cellular automaton with a flood modeling tool called openLISEM to generate scenarios of changes in land cover and generate ordering policies. Its response variable was the percentage of urbanized area.
The models commonly used to model urban growth are Cellular Automata and Dynamic Simulation. The first one is essentially a rule of temporal evolution on a discrete set, where given a point of this set, a rule that associates another point of the set is presented. The second is a process in which we work with the dynamics, agents and central processes of the system necessary for the construction of the model, which is fed with data and factors, making each parameter clearly sustainable, which allows us to make a qualified and concrete weighting of the variables and factors.
The use of Cellular Automata coupled with a geographic information system creates great adaptability to various situations of urban growth. In particular, it is possible to realistically represent the spatial complexity and dynamics of urban growth change by adapting the configurations of the basic elements of the models.
The dynamic simulation analysis aims to understand the continuity of the historical development of an urban agglomeration, predict its future evolution, simulate its condition of expansion and find its advantages and disadvantages. This method can include current and historical development situations, as well as anticipate future development trends and simulate degrees of expansion in various directions of the urban agglomeration.
The most widely used variables are the use of land, density of urbanization, influence of roads and historical growth data.
III. CONCLUSIONS About models, the one that could best explain the urban
growth of a city in Mexico is Dynamic Simulation, because its main function is to model in time and in the directions that are requested, in addition to admitting a greater number of variables and does not need auxiliary methods. Moreover, it is easier to model with the help of a Geographic Information System (GIS).
Cellular automaton is a more austere and conservative method, in addition to its complexity to handle it. It also makes necessary the use of other theories and models to reinforce it.
The variables that should be included in a model that explains urban growth in Mexico should be those that directly interact in the phenomenon and that studies already conducted in other parts of the world have not been taken into account. Some of the ideal variables to use together are the use of land, modes of transport, distance to work centers, transport modes, topography, population, roads, and other factors.
The dynamic simulation model can be used as a tool in spatial plans and development strategies, as well as in policies

for the reform of urban agglomerations in developing countries, especially in Mexico, where most of its cities show disorderly growth. On the other hand, the dynamic simulation analysis can provide methodological support for the study of the metropolitan area. The model, data and methods described can be useful references for the investigation of urban agglomerations in Mexico and Latin America.
ACKNOWLEDGMENT I thank Saúl Obregón and Gerardo Rios for discussions and
revisions at various stages of this work, and the CONACYT for offering the economic support during the realization of this work.
REFERENCES
[1] Allen J. and Lu K., “Modeling and Prediction of Future Urban Growth in the Charleston Region of South Carolina: a GIS-based Integrated Approach”, conservation ecology, 2nd ed., vol. 8, Clemson:Academic, 2003, pp.16-35.
[2] Badwi I., El-Barmelgy M. and El-Din A., “Modeling and Simulation of Greater Cairo Region Urban Dynamics Using SLEUTH”, Journal of urban planning and development, 4th ed., vol. 141, San Diego:Academic, 2015, pp.1-19.
[3] Cifuentes P. A., “Modelización de los factores de crecimiento urbano como aporte a la sostenibilidad. Estudio de caso: Manizales – Colombia”, Revista Internacional Sostenibilidad, Tecnología y Humanismo, vol. 4, 2009, pp.81-96.
[4] Clarke K. C., Hoppen S. and Gaydos L., “A self-modifying cellular automaton model of historical urbanization in the San Francisco Bay area”, Environment and Planning B: Planning and Design, 2nd ed., vol. 24, 1997, pp.247-261.
[5] Guan Ch. and Rowe P., “In pursuit of a well-balanced network of cities and towns: A case study of the Changjiang Delta Region in China”, Urban analytics and city science. “In press”, Cambridge: Academics, 2017, pp.1-19.
[6] Han Y. and Jia H., “Simulating the spatial dynamics of urban growth with an integrated modeling approach: A case study of Foshan, China”, Ecological modelling, vol. 353, 2017, pp.107-116.
[7] Himiyama Y. “Land use/cover change in north-east China”, Land use for global environmental conservation. 1999, pp.92–98.
[8] Instituto Nacional de Estadística y Geografía, Consejo Nacional de Población y Secretaría de Desarrollo Agrario, Territorial y Urbano, “Delimitación de las zonas metropolitanas de México”, Ciudad de México City, 2015, pp.1-284.
[9] Jafari M., Majedi H., Monavari S., Alesheikh A. and Zarkesh M., “Dynamic simulation of urban expansion through a CA-Markov model case study: Hyrcanian region, Gilan, Iran”, European Journal of Remote Sensing. 1st ed., vol. 49, 2016, pp.513-529.
[10] Jat M. K., Choudhary M. and Saxena A., “Application of geo-spatial techniques and cellular automata for modelling urban growth of a heterogeneous urban fringe”, The Egyptian Journal of Remote Sensing and Space Sciences, vol. 20, Jaipur:Academics, 2017, pp.223-241.
[11] Kim D. S., “Location modeling of population and land-use change in rural area by new expressway”, Journal of Urban Planning Development, 3rd ed., vol. 133, 2007, pp.201–210.
[12] Kim D., “Development of an optimization technique for a potential surface of spatial urban growth using deterministic modeling methodology”, Journal of Urban Planning and Development. 2nd ed., vol. 135, Ulster:Academics, 2009, pp.74-85.
[13] Leao S., Bishop I. and Evans D., “Simulating urban growth in a developing nation’s region using a Cellular Automata-based model”, Journal of Urban Planning and Development, 3rd ed., vol. 130, 2004, pp.145-158.
[14] Li X., Gong P., Yu L. and Hu T., “A segment derived patch-based logistic cellular automata for urban growth modeling with heuristic rules”, Computers, Environment and Urban Systems, vol. 65, 2017, pp.140-149.
[15] Liu Y., He Q., Tan R., Liu Ya. and Yin Ch., “Modeling different urban growth patterns based on the evolution of urban form: A case study from Huangpi, Central China”, Applied geography, vol. 66, 2015, pp.109-118.
[16] Luo J. and Wei Y. “Modeling spatial variations of urban growth patterns in Chinese cities: The case of Nanjing”, Landscape and urban Planning, vol. 91, 2009, pp.51-64.
[17] Pérez-Molina E., Sliuzas R., Flacke J. and Jerren V., “Developing a cellular automata model of urban growth to inform spatial policy for flood mitigation: A case study in Kampala, Uganda”, Computers, Environment and Urban Systems, vol. 65, 2017, pp.53-65.
[18] Wang F. and Zhou Y., “Modeling urban population densities in Beijing 1982–1990: Suburbanization and its causes”, Urban Studies, 2nd ed., vol. 36, 1999, pp.271–287.
[19] Wu J., Li R., Ding R., Li T. and Sun H., “City expansion model based on population diffusion and road growth”, Applied mathematical modelling, 1st ed., vol. 43, 2016, pp.1-14.
[20] Ying L., Qizhi M. and Anrong D., “Beijing Urban Development Model: Urban Growth Analysis and Simulation”, Tsinghua Science & Technology, 6th ed., vol. 14, 2009, pp.782-794.
[21] Zheng Z., “Spatial structure of the Changsha–Zhuzhou–Xiangtan urban agglomeration based on dynamic simulation analysis”, Journal of urban planning and development, 4th ed., vol. 141, 2014, pp.41-52.
From process to user-centered desing A development perspective.
Mónica Dessireé Martínez Lara Universidad Autónoma de Querétaro
UAQ Querétaro, México
Juana Guadalupe Herrera Pérez Universidad Autónoma de Querétaro
UAQ Querétaro, México
Anelisse Yerett Oliveri Rivera Universidad Autónoma de Querétaro
UAQ Querétaro, México
Juvenal Rodríguez Reséndiz Universidad Autónoma de Querétaro
UAQ Querétaro, México
Abstract. - Often the product developers experience difficulties to identify and understand the sensitive factors; Therefore, this paper exposes the relationship between the design process and the user experience which has its origin in the execution of the design tools, starting from the analysis that shows the behavior of the developer immersed in the process, based on in-depth interviews with professionals in design and innovation. Also arguing the need for the creation of tools that serve as support in the development of projects which have as a starting point qualitative variables of an emotional nature.
Key Words: user, experience, process, developer, design.
I. INTRODUCTION The traditional methods lead the designer to obtain a list of requirements (non-formal linguistic), but do not provide a clear path to formal synthesis. [1]. The lack of tools to analyze the emotional factors of the experience on the interaction between user and product, give subjective validations and little support. These factors influence the perception of the user on the added value of the product, service or process; causing that the products derived from the design processes do not completely match the aspirations and expectations of the user, leading to the development of experience without emotional sense, which has an impact on the user.
As the degree of human collaboration required in the development of a project increases, also increase the need to formulate working methods that will facilitate such collaboration as much as possible and help to interpret into a single language the data and proposals that come from the different areas of design [2].
For being a synthesis of multiple factors, this process must be flexible and holistic, [3] referring to the latter as a design vision focused not only on the consideration of human aspects and their needs but also on the environmental and technological aspects that surround the user [4], derived from this is "User-centered design". The general term used to describe the design in which the user influences the final result, being at the same time, a philosophy and a process; This philosophy, has a strategic orientation, which places the person at the centre with the intention of developing a product adapted to their needs and requirements.
II. LITERATURE REVIEW
The importance of the method consists in the fact that it is endowed with cognitive properties that allow for an orderly approach to a part of reality and that it depends on the cognitive subject how useful it can be in achieving what, through research work, it is possible to clarify what was previously unknown. The application of the method does not depend on itself, but on the subject, who, in his or her opinion, chooses the object of study, selects the system of concepts to be worked on and structures the way in which the research is to be carried out. [5].
A key element in the user experience is to consider the affective and emotional aspects, i.e. taking into account the emotions that users experience when using a system, and getting systems to recognize, understand and express opinions. [6]. User experience can take advantage of emotions to improve design [7].
The theory of Emotional Design proposed by Donald Norman [7], is where emotions support a user's decision making
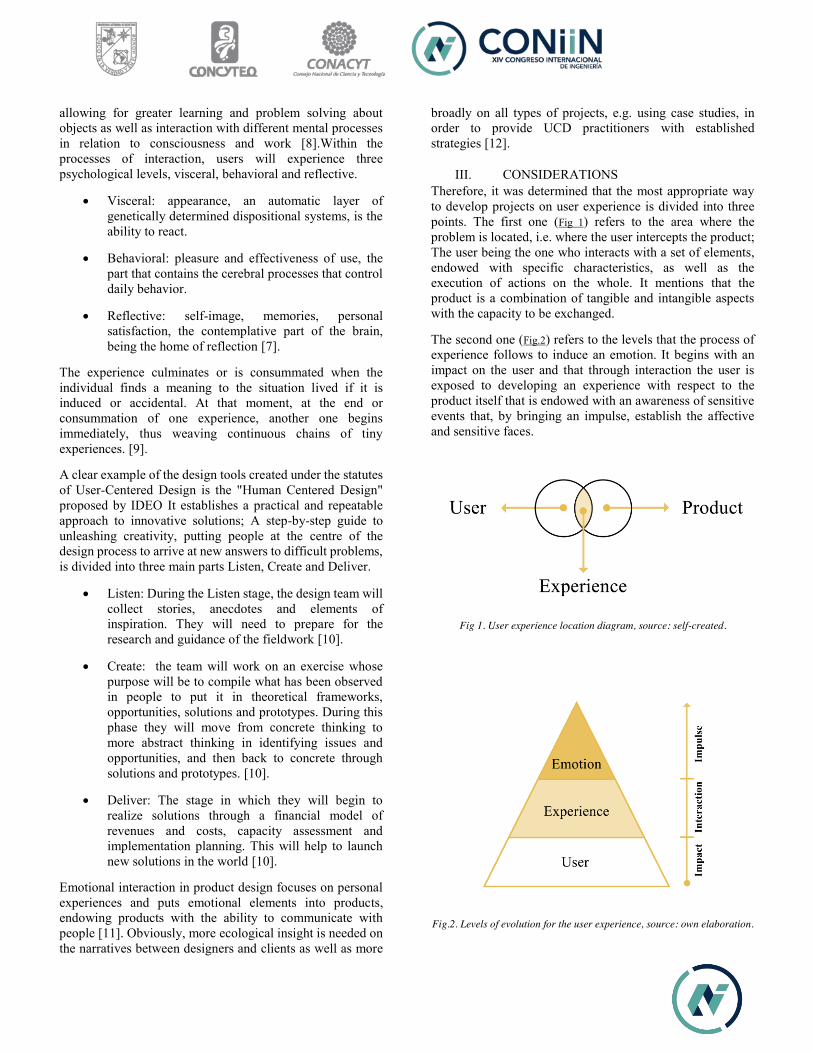
allowing for greater learning and problem solving about objects as well as interaction with different mental processes in relation to consciousness and work [8].Within the processes of interaction, users will experience three psychological levels, visceral, behavioral and reflective.
• Visceral: appearance, an automatic layer of genetically determined dispositional systems, is the ability to react.
• Behavioral: pleasure and effectiveness of use, the part that contains the cerebral processes that control daily behavior.
• Reflective: self-image, memories, personal satisfaction, the contemplative part of the brain, being the home of reflection [7].
The experience culminates or is consummated when the individual finds a meaning to the situation lived if it is induced or accidental. At that moment, at the end or consummation of one experience, another one begins immediately, thus weaving continuous chains of tiny experiences. [9].
A clear example of the design tools created under the statutes of User-Centered Design is the "Human Centered Design" proposed by IDEO It establishes a practical and repeatable approach to innovative solutions; A step-by-step guide to unleashing creativity, putting people at the centre of the design process to arrive at new answers to difficult problems, is divided into three main parts Listen, Create and Deliver.
• Listen: During the Listen stage, the design team will collect stories, anecdotes and elements of inspiration. They will need to prepare for the research and guidance of the fieldwork [10].
• Create: the team will work on an exercise whose purpose will be to compile what has been observed in people to put it in theoretical frameworks, opportunities, solutions and prototypes. During this phase they will move from concrete thinking to more abstract thinking in identifying issues and opportunities, and then back to concrete through solutions and prototypes. [10].
• Deliver: The stage in which they will begin to realize solutions through a financial model of revenues and costs, capacity assessment and implementation planning. This will help to launch new solutions in the world [10].
Emotional interaction in product design focuses on personal experiences and puts emotional elements into products, endowing products with the ability to communicate with people [11]. Obviously, more ecological insight is needed on the narratives between designers and clients as well as more
broadly on all types of projects, e.g. using case studies, in order to provide UCD practitioners with established strategies [12].
III. CONSIDERATIONS Therefore, it was determined that the most appropriate way to develop projects on user experience is divided into three points. The first one (Fig 1) refers to the area where the problem is located, i.e. where the user intercepts the product; The user being the one who interacts with a set of elements, endowed with specific characteristics, as well as the execution of actions on the whole. It mentions that the product is a combination of tangible and intangible aspects with the capacity to be exchanged.
The second one (Fig.2) refers to the levels that the process of experience follows to induce an emotion. It begins with an impact on the user and that through interaction the user is exposed to developing an experience with respect to the product itself that is endowed with an awareness of sensitive events that, by bringing an impulse, establish the affective and sensitive faces.
Fig 1. User experience location diagram, source: self-created.
Fig.2. Levels of evolution for the user experience, source: own elaboration.
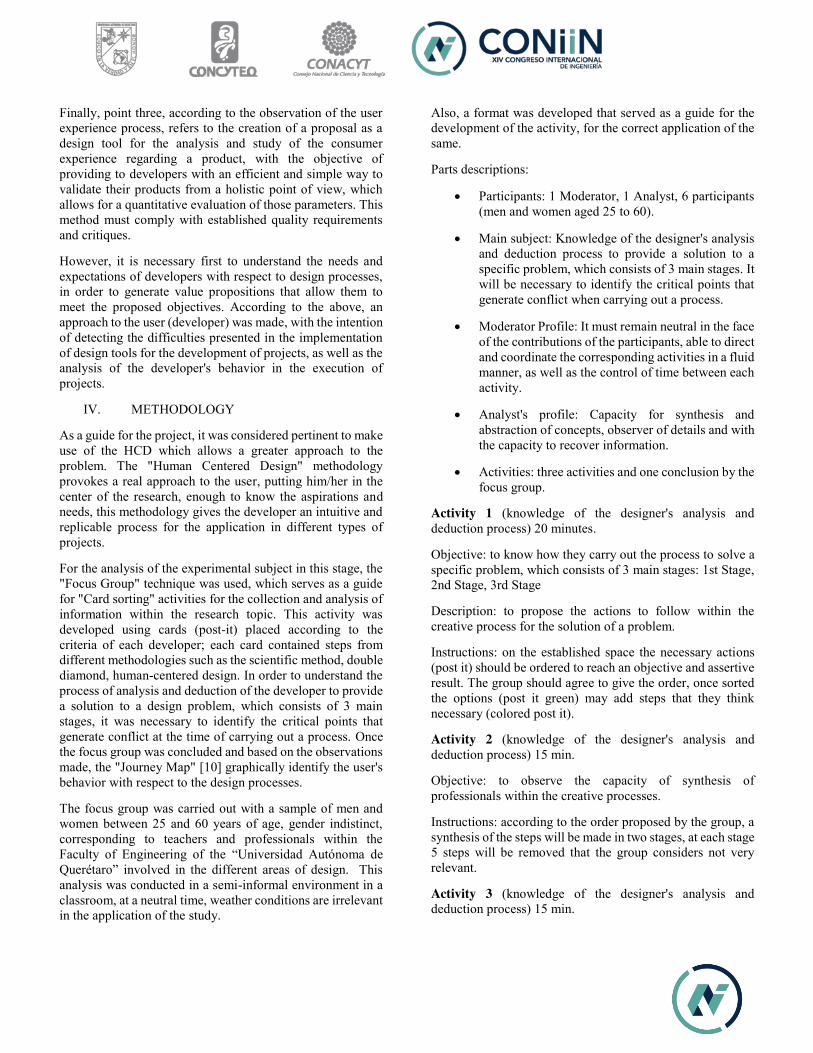
Finally, point three, according to the observation of the user experience process, refers to the creation of a proposal as a design tool for the analysis and study of the consumer experience regarding a product, with the objective of providing to developers with an efficient and simple way to validate their products from a holistic point of view, which allows for a quantitative evaluation of those parameters. This method must comply with established quality requirements and critiques.
However, it is necessary first to understand the needs and expectations of developers with respect to design processes, in order to generate value propositions that allow them to meet the proposed objectives. According to the above, an approach to the user (developer) was made, with the intention of detecting the difficulties presented in the implementation of design tools for the development of projects, as well as the analysis of the developer's behavior in the execution of projects.
IV. METHODOLOGY
As a guide for the project, it was considered pertinent to make use of the HCD which allows a greater approach to the problem. The "Human Centered Design" methodology provokes a real approach to the user, putting him/her in the center of the research, enough to know the aspirations and needs, this methodology gives the developer an intuitive and replicable process for the application in different types of projects.
For the analysis of the experimental subject in this stage, the "Focus Group" technique was used, which serves as a guide for "Card sorting" activities for the collection and analysis of information within the research topic. This activity was developed using cards (post-it) placed according to the criteria of each developer; each card contained steps from different methodologies such as the scientific method, double diamond, human-centered design. In order to understand the process of analysis and deduction of the developer to provide a solution to a design problem, which consists of 3 main stages, it was necessary to identify the critical points that generate conflict at the time of carrying out a process. Once the focus group was concluded and based on the observations made, the "Journey Map" [10] graphically identify the user's behavior with respect to the design processes.
The focus group was carried out with a sample of men and women between 25 and 60 years of age, gender indistinct, corresponding to teachers and professionals within the Faculty of Engineering of the “Universidad Autónoma de Querétaro” involved in the different areas of design. This analysis was conducted in a semi-informal environment in a classroom, at a neutral time, weather conditions are irrelevant in the application of the study.
Also, a format was developed that served as a guide for the development of the activity, for the correct application of the same.
Parts descriptions:
• Participants: 1 Moderator, 1 Analyst, 6 participants (men and women aged 25 to 60).
• Main subject: Knowledge of the designer's analysis and deduction process to provide a solution to a specific problem, which consists of 3 main stages. It will be necessary to identify the critical points that generate conflict when carrying out a process.
• Moderator Profile: It must remain neutral in the face of the contributions of the participants, able to direct and coordinate the corresponding activities in a fluid manner, as well as the control of time between each activity.
• Analyst's profile: Capacity for synthesis and abstraction of concepts, observer of details and with the capacity to recover information.
• Activities: three activities and one conclusion by the focus group.
Activity 1 (knowledge of the designer's analysis and deduction process) 20 minutes.
Objective: to know how they carry out the process to solve a specific problem, which consists of 3 main stages: 1st Stage, 2nd Stage, 3rd Stage
Description: to propose the actions to follow within the creative process for the solution of a problem.
Instructions: on the established space the necessary actions (post it) should be ordered to reach an objective and assertive result. The group should agree to give the order, once sorted the options (post it green) may add steps that they think necessary (colored post it).
Activity 2 (knowledge of the designer's analysis and deduction process) 15 min.
Objective: to observe the capacity of synthesis of professionals within the creative processes.
Instructions: according to the order proposed by the group, a synthesis of the steps will be made in two stages, at each stage 5 steps will be removed that the group considers not very relevant.
Activity 3 (knowledge of the designer's analysis and deduction process) 15 min.

Objective: is to identify the critical or conflicting points when carrying out a problem-solving process.
Instructions: write down (colored post it) those critical points or difficulties you experience when carrying out a design process.
V. RESULTS
It was necessary to know first-hand the implementation of design processes by the developers, as well as their behavior, which are described below in three main activities:
Activity 1
Objective: to know how they carry out the process to solve a specific problem, which consists of 3 main stages: 1st Stage, 2nd Stage, 3rd Stage
Activity 2
Objective: to observe the capacity of synthesis of professionals within the creative processes.
Activity 3
Objective: is to identify the critical or conflicting points when carrying out a problem-solving process.
Knowledge of the
analysis and
deduction process
Stages of the Process
Stage 1 Stage 2 Link Stage 3
Order of elements in
a design process.
Problem Define problem Research Collection of data Define user Emotions
Data Analysis Measure Research Methods Understand Synthesis Hypothesis Ideas Emotions
Materials Technology Experiment Prototypes Define
Interaction Doing Emotions Implementation Validate Delivery Accept Improvement
Table 1. The proposal made by participants of focus group, source: own
realization.
Knowledge of the analysis
and deduction process
Stages of the Process (First simplification process)
Stage 1 Stage 2 Link Stage 3
Order of elements
in a design
process.
Problem Research Collection of data Define User emotion
Data analysis Research Methods Synthesis Hypothesis Ideas
Materials Technology Experiment Prototypes Define
Interaction Implementation Validate Delivery Accept Improvement
Table 2. The outcome of the group for the first simplification process
Knowledge of the
analysis and
deduction process
Stages of the Process (First simplification process)
Stage 1 Stage 2 Link Stage 3
Order of elements in
a design process.
Problem Collection of data User Name
Data analysis Research Methods Ideas
Experiment Prototyping
Implementation Delivery
Table 3. Group result for the second simplification process.
Difficulties during the
process
Stages of the Process
Stage 1 Stage 2 Link Stage 3 Elements of the stages of the creative process.
Define problem Define the scope Coordinate
Coordinate Time Resources Method selection
Empathy Emotion
Metrics and instruments
Table 4. Difficulties in the analysis of the processes detected by the focus group.
Journey Map
The present tool used a Likert slave from 1 to 5 being 1 as bad and 5 as excellent. It can be observed that the behavior of the screwdriver starts with a "good" behavior at the beginning of the project development, (ZMOT). However it decreases in the first moment of truth (FMOT) at the moment of arriving at the prototyping stage where its behavior becomes "regular" due to the complexity that represents the stage, the behaviour continues to decrease in the second moment of truth (SMOT) when the validation process is reached with a "bad" scale due to the problems of carrying out a qualitative or quantative validation that allows us to determine the reliability or success of the design to be implemented. (Fig 3).
Fig. 3. Journey User Map, source: self-created.

VI. DISCUSSION Within the insights, the group experiences problems in the selection of methods according to the information. While two common characteristics were detected, the first one refers to the difficulties in the application of measurement instruments concerning qualitative variables, the second characteristic defines that an efficient process is divided into three main stages of development with links between each part.
VII. CONCLUSION
The results obtained promotes that the efficiency of a process includes concrete tools with a reduced number of steps; It incorporates them into their creative processes according to the needs of the project; This allows the knowledge of the process of analysis and deduction of the designer to give solution to a specific problem, emphasizing that the developer has also become the user, a user of the processes; This will have an impact on the generation of proposals that match the needs and aspirations of the final user, which in turn may be able to generate a satisfactory user experience. So it is imperative to consider the development of new tools that have as their main objective not only the solution of problems but also to have the main characteristic of being an effective support for their implementation.
Acknowledgements The present work was carried out within the research and postgraduate division of the engineering faculty at the Universidad Autónoma de Querétaro. We also wish to greatly thank the practitioners who participated in this study and willingly shared their experiences.
References
[1] C. Alexander, Ensayo Sobre La Síntesis de La Forma, Ediciones Infinito, 1966.
[2] O. Olea and C. González Lobo, Análisis y diseño lógico, México: Trillas, 1978.
[3] L. Rodríguez Morales , Diseño, estrategia y táctica, México: Siglo Veintiuno, 2004.
[4] D. Dantas, Diseño centrado en el sujeto: una visión holística del diseño rumbo a la responsabilidad social, Argentina: Cuadernos del Centro de Estudios en Diseño y Comunicación, 2018.
[5] R. M. Aguilera Hintelholher, Identidad y diferenciación entre Método y Metodología, México: Estudio Políticos- UNAM, 2011.
[6] R. Picard, Affective computing, Cambridge: MIT Press, 1997.
[7] D. Norman, Emotional Dsign: why we love (or hate) everyday things, New York: Basic Books, 2004.
[8] P. W. Sun, The research on Emotional Design, China: IEEE, 2008.
[9] . C. M. Montenegro Ortiz, Arte y experiencia estética: john dewey, 2014, pp. 95-105.
[10] IDEO, Human Centered Design - Kit de Herramientas, IDEO, 2015.
[11] C. X. Yang, Emotional Interation in Product Design, China: IEEE, 2008.
[12] E. Eshet and H. Bouwman, Context of use: The final frontier in the practice of user-centered design?, Oxford: IEEE, 2016.
[13] D. A. Norman, User Centered System Design; New Perspectives on Human-Computer Interaction, USA: Lawrence Erlbaum Associates,, 1986.
[14] E. Mor Pera, Diseño Centrado en el Usuario, Cataluña: Universidad de Cataluña, 2017.
Image processing algorithm for detection of aquatic macroinvertebrates
Rafael García Arredondo Department of Electrical and Electronic Engineering
Tecnológico Nacional de México en Celaya Celaya, Guanajuato, México [email protected]
José Alfredo Padilla Medina
Department of Electrical and Electronic Engineering Tecnológico Nacional de México en Celaya
Celaya, Guanajuato, México [email protected]
Luis Miguel Contreras Medina C.A. Ingeniería en Biosistemas
Universidad Autónoma de Querétaro Amazcala, Querétaro, México
Alejandro Espinosa Calderón
Department of Development and Design of Equipment Centro Regional de Optimización y Desarrollo de Equipo
de Celaya – Tecnológico Nacional de México Guanajuato, México
Ricardo Miguel Pérez Munguía School of Biology
Universidad Michoacana de San Nicolás de Hidalgo Morelia, Michoacán, México
Mario Calderón Ramírez Department of Development and Design of Equipment
Centro Regional de Optimización y Desarrollo de Equipo de Celaya – Tecnológico Nacional de México
Celaya, Guanajuato, México [email protected]
Abstract— Pollution in aquatic ecosystems has significant impact on the ecology and on the health of people living in the surrounding areas. Detection of aquatic macroinvertebrates is useful to determine the water quality, depending on the species found in the study area. This article presents a methodology for the detection of aquatic macroinvertebrates using an image processing algorithm. The algorithm was programmed in Matlab software, no toolboxes where used. The results show a percentage of success of 97.8% when detecting an insect sample. The images were taken with a Dino-Lite camera and the samples were taken from lakes and rivers from the province of Michoacán.
Keywords—Insect; Recognition; Identification; Moments of Hu; Images; Euclidean distance; Processing.
I. INTRODUCTION Rivers represent an essential component of our
natural and cultural heritage. But, they have suffered an important ecological deterioration since the middle of the last century, mainly due to the regulation of the flows, the channeling of rivers, the occupation of the riverbanks, agriculture, industry and urbanization. As a result of this deterioration, 80% of the world population is currently affected by the degradation of rivers [1].
Polluting waste alters the ecological status of rivers, lakes, aquifers and seas. The contamination of drinking water sources and aquatic ecosystems is a problem that today greatly harms all ecosystems. These contaminants can be physical,
chemical or biological. Alterations in ecosystems are reflected in damage to the condition and functioning of their biotic communities (a set of species of plants, animals and other organisms that occupy a certain area) [2]. For this reason, this problem has been studied since the twentieth century, reaching the conclusion that aquatic biota changes their functioning by modifying the environmental conditions of their natural habitats.
So, it is possible to use some characteristics or structural and functional properties of the different levels of biological organization to evaluate in a comparative way the state of the aquatic biota, whose condition is a reflection of the ecological state of the water body. These evaluation characteristics are known by the generic name of bioindicators [3].
Bioindicators are a good method to assess the quality of the environment of these systems and to determine other types of impacts. These indicators use family or gender as an identification level, so they are low cost, efficient and easy to use. Aquatic macroinvertebrates are those aquatic invertebrates with a size greater than 500μm. Aquatic macroinvertebrates are ideal for use as a bioindicator due to the following characteristics [4]:
• They are abundant, widely distributed and easy to collect.
• Relatively easy to identify visually. • Chemicals are not required to be detected. • They are sedentary mostly and reflect local
conditions. • They have long life cycles. • They can be grown in laboratories. • They respond quickly to environmental tensors.
Knowing this information about the bioindicators and the aquatic macroinvertebrates, it is planned to use the digital image processing for the detection of these insects, since their wide utility in the detection and classification of objects has been demonstrated. This detection is possible because certain characteristics of insects can be known, such as their shape and size. By detecting and classifying the insects, this information can be used for a method of quantifying biotic integrity and with which the conditions of the ecological state of the water in which the samples are found can be determined.
The identification of these macroinvertebrates will be done using the image processing, because this method speeds up the identification and classification times, in addition to allowing the processing of large amounts of images in minutes. This is done because there are several programs and tools for the processing of digital images and it is a widely used programming language.
The purpose of the system that is created is to identify and classify macroinvertebrate species that can be used as bioindicators and thus use this information for its use in the biotic integrity index.
II. MATERIALS AND METHODS
2.1 MATERIALS
2.1.1 Experimental insects.
The insects used for these experiments were provided from the School of Biology of the Universidad Michoacana de San Nicolás de Hidalgo. These insects are native to the river and lake areas of Michoacán.
We used 3 different species of insects, which are: Dixella,
Gyrinus and Rhagovelia.
Fig. 1. Gyrinus.
Fig. 2. Rhagovelia.
Fig. 3. Dixella.
2.1.2 Image acquisition equipment.
For the capture of images, a Digital Microscope Dino-Lite litter was used, it has a 10x-200x cabling, 8 LED lighting, 640x480 JPEG / BMP image captures and it is
compatible with Windows systems and iOS systems [5].
Fig. 4. Camera Dino-Lite AM-311ST.
2.1.3 Digitals Images. An image can be defined as a function, f (x, y), where x and y are spatial coordinates (plane), and the amplitude of any coordinate pair (x, y) is called the intensity or gray level of the image at that point. When x, y and the amplitude values of f are all finite, discrete quantities, the image is called as a digital image. A digital image is composed of a finite number of elements, each of which has a particular location and value. These elements are referred to as pixels and image elements [6].
2.2 METHODS
2.2.1 Image Processing.
The image processing aims to improve the appearance of the images and make more evident in them certain details that you want to be noticed. For this, there are several tools or techniques that allow to obtain certain information of the pixels that the image contains.
Fig. 5. Image with different types of noise.
As shown in Fig. 5, you can have different types of noise that prevents you from having detailed information about the image, because if the image is not better, the information obtained would be incorrect.
2.2.2 Image Filtering.
Filtering is a technique to improve an image, this filter can highlight or attenuate certain characteristics [7]. Because noise is an undesired characteristic, and since this is a variation on the levels of the image, it corresponds to high frequencies. Since noise is a signal that is added to the original signal (image), the gray level of a pixel can be defined as the sum of the ideal gray level (f1) and noise (r):
𝑓(𝑥, 𝑦) = 𝑓1(𝑥, 𝑦) + 𝑟(𝑥, 𝑦) (1)
2.2.3 Image binarization. The binarization of an image consists of comparing the gray levels present in the image with a predetermined value (threshold). If the level of gray in the image is smaller than the value of the predetermined threshold, the value of 0 (black) is assigned to the pixel of the binarized image; and if it is greater it is assigned the value of 1 (white).In this way a black and white image is obtained, which in general, most image recognition techniques are worked with binarized images.
Fig. 6. Binarized image.
2.2.4 Object recognitions. This step is fundamental for the processing of images,
mainly because this is the strongest part of the programming and which will help us obtaining information useful to recognize and classify objects.
For this the characteristics of an object (circular, spherical, square) can be quantified by moments, which
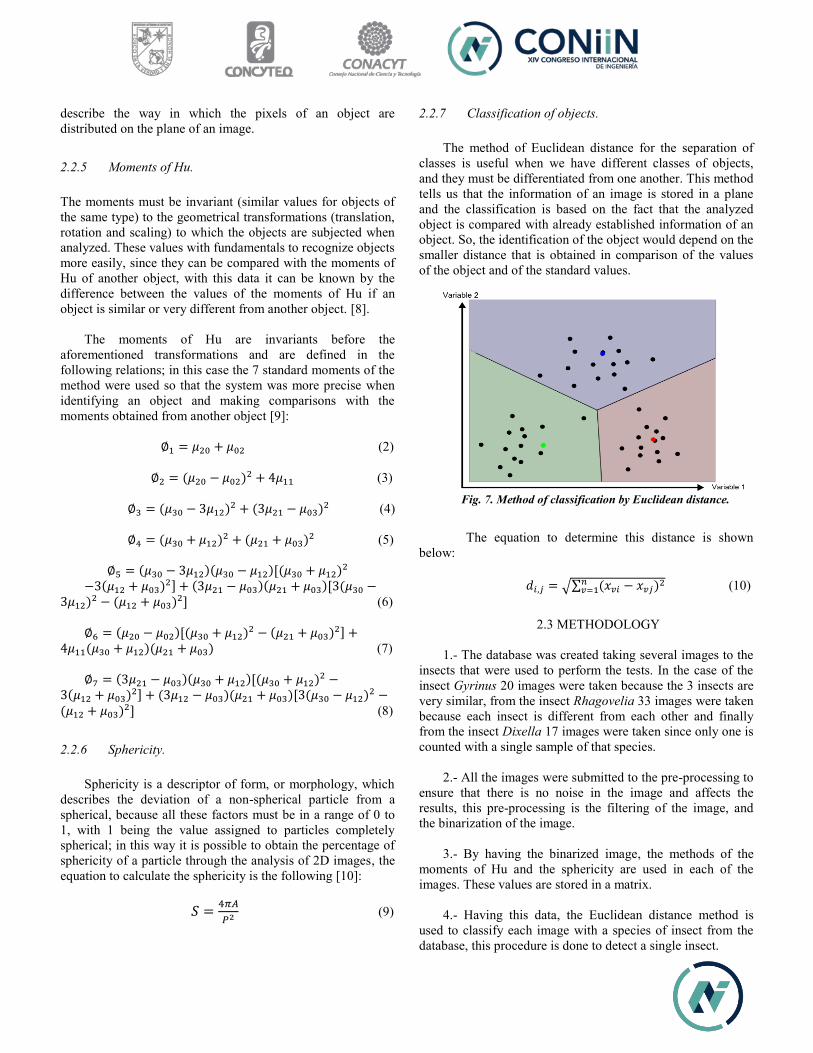
describe the way in which the pixels of an object are distributed on the plane of an image.
2.2.5 Moments of Hu. The moments must be invariant (similar values for objects of the same type) to the geometrical transformations (translation, rotation and scaling) to which the objects are subjected when analyzed. These values with fundamentals to recognize objects more easily, since they can be compared with the moments of Hu of another object, with this data it can be known by the difference between the values of the moments of Hu if an object is similar or very different from another object. [8].
The moments of Hu are invariants before the aforementioned transformations and are defined in the following relations; in this case the 7 standard moments of the method were used so that the system was more precise when identifying an object and making comparisons with the moments obtained from another object [9]:
∅1 = 𝜇20 + 𝜇02 (2) ∅2 = (𝜇20 − 𝜇02)2 + 4𝜇11 (3) ∅3 = (𝜇30 − 3𝜇12)2 + (3𝜇21 − 𝜇03)2 (4) ∅4 = (𝜇30 + 𝜇12)2 + (𝜇21 + 𝜇03)2 (5)
∅5 = (𝜇30 − 3𝜇12)(𝜇30 − 𝜇12)[(𝜇30 + 𝜇12)2 −3(𝜇12 + 𝜇03)2] + (3𝜇21 − 𝜇03)(𝜇21 + 𝜇03)[3(𝜇30 −
3𝜇12)2 − (𝜇12 + 𝜇03)2] (6) ∅6 = (𝜇20 − 𝜇02)[(𝜇30 + 𝜇12)2 − (𝜇21 + 𝜇03)2] +
4𝜇11(𝜇30 + 𝜇12)(𝜇21 + 𝜇03) (7) ∅7 = (3𝜇21 − 𝜇03)(𝜇30 + 𝜇12)[(𝜇30 + 𝜇12)2 −
3(𝜇12 + 𝜇03)2] + (3𝜇12 − 𝜇03)(𝜇21 + 𝜇03)[3(𝜇30 − 𝜇12)2 −(𝜇12 + 𝜇03)2] (8)
2.2.6 Sphericity.
Sphericity is a descriptor of form, or morphology, which describes the deviation of a non-spherical particle from a spherical, because all these factors must be in a range of 0 to 1, with 1 being the value assigned to particles completely spherical; in this way it is possible to obtain the percentage of sphericity of a particle through the analysis of 2D images, the equation to calculate the sphericity is the following [10]:
𝑆 = 4𝜋𝐴
𝑃2 (9)
2.2.7 Classification of objects.
The method of Euclidean distance for the separation of classes is useful when we have different classes of objects, and they must be differentiated from one another. This method tells us that the information of an image is stored in a plane and the classification is based on the fact that the analyzed object is compared with already established information of an object. So, the identification of the object would depend on the smaller distance that is obtained in comparison of the values of the object and of the standard values.
Fig. 7. Method of classification by Euclidean distance.
The equation to determine this distance is shown
below: 𝑑𝑖,𝑗 = √∑ (𝑥𝑣𝑖 − 𝑥𝑣𝑗)2𝑛
𝑣=1 (10)
2.3 METHODOLOGY 1.- The database was created taking several images to the
insects that were used to perform the tests. In the case of the insect Gyrinus 20 images were taken because the 3 insects are very similar, from the insect Rhagovelia 33 images were taken because each insect is different from each other and finally from the insect Dixella 17 images were taken since only one is counted with a single sample of that species.
2.- All the images were submitted to the pre-processing to
ensure that there is no noise in the image and affects the results, this pre-processing is the filtering of the image, and the binarization of the image.
3.- By having the binarized image, the methods of the
moments of Hu and the sphericity are used in each of the images. These values are stored in a matrix.
4.- Having this data, the Euclidean distance method is used to classify each image with a species of insect from the database, this procedure is done to detect a single insect.
5.- The previous steps are repeated but now with images
where they contain more than one insect sample of the same species to train the system in the recognition and classification of an insect species.
6.- Finally the steps are repeated but now with the three
samples of insects in a single image.
III. RESULTS
The aim of this article is to be able to identify the 3 species of insects using a programming algorithm in Matlab software. In these tests the first step is to have the database of different photographs of each of the species. Being a total of 70 images for training the system in which each species of insect was identified separately.
Then 10 images were taken with 3 insects of the species
Gyrinus and another 10 images with 3 insects of the species Rhagovelia to make tests in the recognition of a single species of insect. Finally, another 10 images were taken with the 7 insects of the 3 different species for the final tests.
3.1 Pre-processing of images.
Once that we have the database of all the images, we start with the image pre-processing. It consists in applying a filter to the image to eliminate noise that affects the image and then binarize it and continue with the recognition of objects. This pre-processing must be done in each image that is in the database to ensure that they have noise when binarizing the image.
Fig. 8. Binarized Gyrinus image.
Fig. 9. Binarized Rhagovelia image.
Fig. 10. Binarized Dixella image.
When we have all the binarized images, we are ready to use the moments of Hu and sphericity to get the average values of all the values. In Table 1 all the average values of the moments of Hu and sphericity of the images of each species are shown. These values are used to identify each of the species, as shown in Fig. 11 and Fig. 12. The samples are classified with the method of the Euclidean distance with the name of the insect species to which it belongs.
Insect Table 1. Moments of Hu
∑ Hu1 ∑ Hu2 ∑ Hu3 ∑ Hu4 ∑ Hu5 ∑ Hu6 ∑ Hu7 ∑ Sphericity
Gyrinus 0.1939 0.0112 5.653 e-5 5.5174e-6 1.7318e-10 5.7106e-6 7.3311e-6 0.4358
Rhagovelia 0.3247 0.0118 0.0017 2.418e-4 1.1164e-7 1.7327e-5 3.0271e-4 0.0456
Dixella 1.2798 1.4388 0.3244 0.0453 -0.0038 -0.0376 0.0379 0.1782
Fig. 11. Identification of Rhagovelia.
Fig. 12. Identification of objects of the same species.
Fig. 13. Identification of species.
When verifying that the system works by identifying 2 species, detection and classification tests were carried out with all the samples of the 3 species (7 insects) with which the tests were carried out. As shown in Fig. 14 with green color, the species Gyrinus is identified and labeled, in the same way with the red color the species Rhagovelia is identified and with blue color the species Dixella.
Fig. 14. Identification of the 3 species.
After having trained the system to recognize each of the species, we tried to identify in a single image each of the insects that are in the image. As shown in Fig. 13 with the moments of Hu and the Euclidean distance classification, it was possible to identify and classify 2 species in one image.
The tests to identify the species Gyrinus was 20 tests, 17 tests for Dixella and 33 tests for Rhagovelia, these tests were made by the number of images that were taken of each species of insect. The percentages of hits by species individually are shown in Fig. 15.
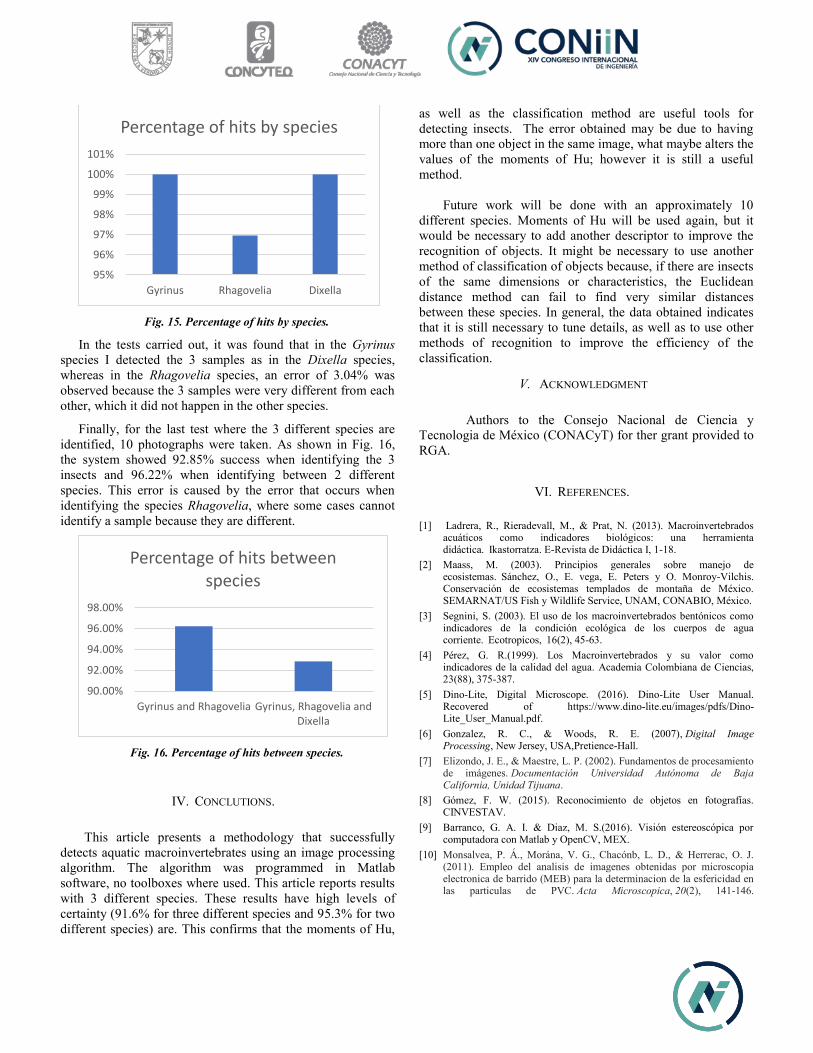
Fig. 15. Percentage of hits by species.
In the tests carried out, it was found that in the Gyrinus species I detected the 3 samples as in the Dixella species, whereas in the Rhagovelia species, an error of 3.04% was observed because the 3 samples were very different from each other, which it did not happen in the other species.
Finally, for the last test where the 3 different species are identified, 10 photographs were taken. As shown in Fig. 16, the system showed 92.85% success when identifying the 3 insects and 96.22% when identifying between 2 different species. This error is caused by the error that occurs when identifying the species Rhagovelia, where some cases cannot identify a sample because they are different.
Fig. 16. Percentage of hits between species.
IV. CONCLUTIONS.
This article presents a methodology that successfully detects aquatic macroinvertebrates using an image processing algorithm. The algorithm was programmed in Matlab software, no toolboxes where used. This article reports results with 3 different species. These results have high levels of certainty (91.6% for three different species and 95.3% for two different species) are. This confirms that the moments of Hu,
as well as the classification method are useful tools for detecting insects. The error obtained may be due to having more than one object in the same image, what maybe alters the values of the moments of Hu; however it is still a useful method.
Future work will be done with an approximately 10
different species. Moments of Hu will be used again, but it would be necessary to add another descriptor to improve the recognition of objects. It might be necessary to use another method of classification of objects because, if there are insects of the same dimensions or characteristics, the Euclidean distance method can fail to find very similar distances between these species. In general, the data obtained indicates that it is still necessary to tune details, as well as to use other methods of recognition to improve the efficiency of the classification.
V. ACKNOWLEDGMENT
Authors to the Consejo Nacional de Ciencia y Tecnologia de México (CONACyT) for ther grant provided to RGA.
VI. REFERENCES. [1] Ladrera, R., Rieradevall, M., & Prat, N. (2013). Macroinvertebrados
acuáticos como indicadores biológicos: una herramienta didáctica. Ikastorratza. E-Revista de Didáctica I, 1-18.
[2] Maass, M. (2003). Principios generales sobre manejo de ecosistemas. Sánchez, O., E. vega, E. Peters y O. Monroy-Vilchis. Conservación de ecosistemas templados de montaña de México. SEMARNAT/US Fish y Wildlife Service, UNAM, CONABIO, México.
[3] Segnini, S. (2003). El uso de los macroinvertebrados bentónicos como indicadores de la condición ecológica de los cuerpos de agua corriente. Ecotropicos, 16(2), 45-63.
[4] Pérez, G. R.(1999). Los Macroinvertebrados y su valor como indicadores de la calidad del agua. Academia Colombiana de Ciencias, 23(88), 375-387.
[5] Dino-Lite, Digital Microscope. (2016). Dino-Lite User Manual. Recovered of https://www.dino-lite.eu/images/pdfs/Dino-Lite_User_Manual.pdf.
[6] Gonzalez, R. C., & Woods, R. E. (2007), Digital Image Processing, New Jersey, USA,Pretience-Hall.
[7] Elizondo, J. E., & Maestre, L. P. (2002). Fundamentos de procesamiento de imágenes. Documentación Universidad Autónoma de Baja California, Unidad Tijuana.
[8] Gómez, F. W. (2015). Reconocimiento de objetos en fotografías. CINVESTAV.
[9] Barranco, G. A. I. & Diaz, M. S.(2016). Visión estereoscópica por computadora con Matlab y OpenCV, MEX.
[10] Monsalvea, P. Á., Morána, V. G., Chacónb, L. D., & Herrerac, O. J. (2011). Empleo del analisis de imagenes obtenidas por microscopia electronica de barrido (MEB) para la determinacion de la esfericidad en las particulas de PVC. Acta Microscopica, 20(2), 141-146.
95%
96%
97%
98%
99%
100%
101%
Gyrinus Rhagovelia Dixella
Percentage of hits by species
90.00%
92.00%
94.00%
96.00%
98.00%
Gyrinus and Rhagovelia Gyrinus, Rhagovelia andDixella
Percentage of hits between species

Modeling of humidity in clothes drying machines by means of a pattern detection algorithm.
Ricardo Miranda Cervantes Dpto. de Ing. Eléctrica y Electrónica.
Tecnológica Nacional de México en Celaya. Celaya, Guanajuato, México. [email protected]
Julio Alberto Anaya López Dpto. de Cuidado de Ropa.
Mabe TyP. Querétaro, Querétaro, México.
Rosario Guzmán Cruz C.A. de Ingeniería en Biosistemas.
Universidad Autónoma de Querétaro. Querétaro, Querétaro México.
Alejandro Espinosa Calderon Dpto. de Diseño y Desarrollo de Equipo.
Tecnológico Nacional de México Centro Regional de Optimización y Desarrollo de Equipo
de Celaya. Celaya, Guanajuato, México.
Juan Prado Olivares Dpto. de Ing. Eléctrica y Electrónica.
Tecnológico Nacional de México en Celaya. Celaya, Guanajuato, México. [email protected]
Jaime Navarrete Damián
Dpto. de diseño y Desarrollo de Equipo. Tecnológico Nacional de México.
Centro Regional de Optimización y Desarrollo de Equipo de Celaya.
Celaya, Guanajuato, México. [email protected]
Abstract— This article presents a novel methodology to
describe relative humidity in clothes drying machines (CDM). This methodology is carried out by implementing a pattern detection algorithm, with this it is possible to predict humidity levels in ranges where a conventional sensor is not able to give a reliable measurement. By obtaining reliable humidity levels, it is possible to reduce the drying cycles and thus obtain an energy saving as well as making a more efficient drying, avoiding damaging the clothes by over drying them, or leaving them still wet. It is necessary to obtain a relation between the relative humidity (which is the one found in the environment) as well as the humidity that is found in the tissue of the clothes (that is, the amount of water impregnated clothes have) to obtain more favorable results in drying. This relationship is important since the variable that really matters is monitoring the humidity that is in the clothes and not in the environment. This last one is the one usually measured by the sensors. Finally, materials, tools and platforms used for the development of the algorithm are presented, as well as simulated tests where the efficiency of the algorithm for the prediction of humidity in the dryers is demonstrated.
Keywords— Clothes care, Energy saving, Mathematical models, Relative Humidity, Relative Humidity in Clothes.
I. INTRODUCTION The increase in the use of clothes dryer’s machines (CDM) in homes has increased in recent years, resulting also in an
increasing of the development of new methods and technologies to make CDM more efficient. Generally, an RH sensor is not able to measure or interpret humidity correctly in low ranges, this is where mathematical tools help to correct these problems. The implementation of complex mathematical models (based on thermodynamics) or models that require different types of variables to make the description and modeling of humidity. These models depending on the application or the implementation that is required can be moderately viable [1]. You can also implement simpler models that are easier to implement and require less computer work, especially when you plan to implement these models in microcontrollers.
This article focuses on describing and modeling the behavior and tendency of moisture in CDM. To achieve this, it is necessary to understand what humidity is and that there are diverse types of humidity based on where you want to measure it. Humidity can be defined, according to the Royal Spanish Academy (RAE) [2], as: “The amount of water, water vapor or any other liquid that is present on the surface, or inside a body, or in the air”. Starting from the previous definition different terms are derived, for example: absolute humidity or relative humidity, to say some. The relative humidity (RH) on which this article focuses, is defined according to the RAE [2] as: “A percentage expression on the amount of water vapor present in

the air with respect to the maximum possible of the amount of water vapor present in the air with respect to the maximum possible for given conditions of pressure and temperature”. However, RH is not the objective humidity to be controlled. There is another type of relative humidity called relative humidity in clothes or RMC (it is called RMC by its abbreviations in English Relative Moisture Clothes). The RMC humidity represents the amount of water that really wants to be controlled, as this is the amount of moisture that the clothes contain within their tissues. However, the conventional, or more typically used sensors, do not measure RMC but rather the RH. Therefore, from here the importance of obtaining a relationship, based on the measurements of RH, that allows forecasting at what time RMC has reached suitable levels for a good drying of clothes [3].
In the CDM, generally, two types of humidity are measured, RMC and RH. The mathematical equations to determine the amount of moisture RMC and RH are (1)[3] and (2)[4].
𝑅𝑀𝐶 = ( ) ( )
− 1 ∗ 100 (1)
𝑅𝐻 =
∗ 100 (2)
Although these equations are easy to calculate, the tools that are needed for measure the input variables are not viable to be applied in domestic CDM, at least not in a practical way. It is not feasible to implement or equip a CDM with a weighing system that will present calibration problems over time, or damage the weight measuring cells due to the vibrations generated by the CDM.
A. Patterm Detection Method
The recognition of patterns is the science that deals with the processes on engineering, computing and mathematics related to physical or abstract objects, with the purpose of extracting information that allows establishing properties between sets of said objects. Pattern recognition consists of identification of signals. The patterns are obtained from the processes of segmentation; extraction of characteristics; and description, where each object is represented by a collection of descriptors. The recognition system must assign to each object its category or class (set of entities that share some characteristics that differentiates them from the rest). To recognize the patterns, the following processes are followed:
x Data acquisition.
x Feature extraction
x Decision making.
The essential point of pattern recognition is classification: you want to classify a signal depending on its characteristics. The
signs, characteristics and classes can be represented in diverse ways [5].
B. Patterns Clasification.
There are two general classification techniques, supervised and unsupervised. A supervised classification is presented when the user defines the decision rules for each class directly or provide a data training (prototype classes) for each class with the aim of guiding the classification process. An unsupervised classification process is presented if no prior training is required and if the user needs to specify the number of classes [3].
C. General Procedure in the Classification of Patterns.
x Establish a classification scheme. Determine the classes in which the pattern will be labeled. The characteristics must be appropriate according to the type of objects to be classified and include background classes that can be confused with the target classes.
x Select the characteristics that will be used in the classification. Redundant or ineffective data is eliminated.
x Determine the parameters required for the classifier. Use the training data to estimate the parameters required by the classification algorithm.
x Execute the classification. Evaluate the discriminant functions and label the patterns according to the decision rules, to subsequently make the necessary adjustment determined by the training algorithm of the classifier. Evaluate the results. Use test data to evaluate the accuracy of the classification [6].
II. MATERIALS AND METHODS
This section presents all the methodology to be followed as well as the materials used during the development of the algorithm, all based on the pattern recognition methodology that was previously explained. In order to generate the algorithm, it was necessary to make a relation, or some indicative, that would allow relating the values of the RH with respect to the RMC. To achieve this, the RMC trend information was obtained and adjusted versus the RH trend (all this information was obtained based on data previously obtained from CDM). Finally, the reported relationship was achieved through mathematical equations as characteristic polynomials generated with their trend lines.
A. Materials.
The materials used for the development of this methodology in terms of hardware were:
x An Arduino Due Card.

x A computer.
The Arduino Due card, it has a microcontroller with a 32 bits architecture that is the same architecture that the CMD normally contain. for the development of this work did not need the use of a sensor since the data that was analyzed and with which it worked had already been previously obtained. This article does not focus on the characterization or control of the sensor used because it is not listed in the materials used or sensor characteristics are mentioned. Regarding the obtaining of humidity RMC was obtained by means of the use of a scale, but it is necessary to clarify that these data of the humidity RMC already had been previously obtained along with the RH for that reason in this article it does not deepen in this area. The used software was:
x Microsoft Office Excel.
x MATLAB.
x Arduino IDE.
The data, as well as the graphs, were analyzed and observed in Excel, while the mathematical polynomials and some digital filtering were carried out in MATLAB. Finally, the algorithm that was tested was implements by using the Arduino IDE.
B. Methodology. The steps that were followed during the development of
the project are:.
1) According to the data that had been previously acquired from the CMD, the most relevant data were taken for their study and exported to Microsoft Excel for analysis. These data are: Time, RH and RMC.
2) Once the RH data of the 2, 7 and 12 lbs. Loads of clothes were exported to Microsoft Excel, they were plotted, as well as their respective RMC, in order to analyze if there was a relationship between the RH and the RMC.
3) With the information obtained when processing all the information and analyzing the graphs of the behavior of the RH and RMC in Microsoft Excel, the relevant information of the RH and RMC was extracted and exported to MATLAB.
4) In MATLAB the information was processed to generate the mathematical models, this stage was one of the most important because here the adjustment was made so that the crossing point between the RH generated by the mathematical model and the CMR obtained from the CMD coincided in the range between 3.7% to 3.3% of both humidities. That is, when the RMC is between 3.7% to 3.3% the RH described by the model is between 3.7% to 3.3% and to the contrary. This point is explained in more detail in the results section.
5) With the models obtained from MATLAB they were transferred to Microsoft Excel where they were re-plotted and it was compared that the points of intersection between the modeled RH and the CMR of the CMD were the same within the range of 3.7% to 3.3%.
6) Once verified that the models were correct in the Arduino IDE, these models were programmed based on the pattern detection methodology.
7) The pattern detection algorithm was programmed based on the literature discussed in the introduction section, based on a supervised pattern classification.
8) Finally, the code was tested by performing two types of simulations.
9) The first simulations were done manually, that means that the data that had been acquired from the sensor were entered randomly along with the manual sampling time.
10) Subsequently, a simulation was carried out. This is closer to the real application. A real time base was programmed, and the sensor data was randomly entered. The procedure that was established to carry out the simulations were as follows: take 50 samples of the sensor during the first 5 minutes after these samplings, the system will determinate the load of clothes and determine now the required humidity levels have been reached 3.7% to 3.3% on average. The last is determined by the models obtained from the general equation (3). These models help to determine the RH in acceptable ranges in terms of the RMC.
III. RESULTS
The tests carried out were for diverse types of clothing loads of 2, 7 and 12 pounds with 9 repetitions each, analyzing a total of 27 loads. The data describing the behavior of the RH were previously acquired by a RH sensor. These data were isolated and plotted to observe the behavior of RH. Fig. 1 shows the RH average behavior obtained and the RMC average by the sensor and bascule in drying cycles for loads of 2 pounds clothes.
Fig. 1. Trend of RH average and RMC average during drying cycles for loads
of 2 lb.
Looking at Fig. 1, we can see that the humidity measurement tends to stabilize at around 30% RH, even though the drying cycle has ended. This tendency cannot be taken as valid because at the end of the cycle the RMC is in acceptable ranges where it can be considered the clothes are dry (between 3.7% to 3.4%), and not in 30% as the RH sensor indicated.
Fig. 2. Trend of Humidity RH Average and RMC average during a drying
cycle for a load of 7 lb.
The humidity RH behavior in Fig. 2 again shows tendencies to be stable in the end and fluctuates very little during de drying cycle. We can observe how it remains in a range between 50% to 80% of RH. Is not throws us relevant information to be able to determine at what moment the clothes are in RMC levels, where the clothes can be considered as dry (ranges between 3.7% to 3.4%). In Fig. 3 we can notice that even though the moisture decreases, at the end of the cycle the humidity is still very high compared to the humidity RMC.
Fig. 3. Trend of Humidity RH average and RMC average during a drying
cycle for a load of 12 lb.
Table 1. presents concentrated information of the most relevant data such as the average RH and RMC, and the average drying times for each type of load when the cycle was end.
Table. 1. Humidity percentages RH and RMC as well as the time of the drying cycle for the different loads of clothes.
Load clothes RH average RMC average Time average
2 pounds 30% 3.1% 28 min.
7 pounds 50% 2.9% 33 min.
12 pounds 35% 2.3% 83 min.
From table 1. We summarize that more clothes to dry imply longer drying times. The RMC is always very similar and low, so it can be said that the clothes are dry in those levels. However, the RH does not present a tendency or characteristic for each type o load, and besides, it always present high values that do not seem to be related with RMC.
With the information obtained, based on the analysis of the graphical data and the information in table 1, it is found that an adjustment must be made in the RH so that it decreases and adjusts to the actual drying cycles times and to the RMC tendency. In order to obtain this adjustment, equations of the type shown in equation (3), generated in MATLAB, were drawn from the real trend of the RH obtained from the sensor. The polynomial form of equation (3) [7] is shown in a very general way, but this type of model allows using the information. But first, the trend of the information must be adjusted with MATLAB.
𝑃(𝑥) = 𝑎 𝑥 + 𝑎 𝑥 +. . . +𝑎 𝑥 + 𝑎 𝑥 (3)
In order to be able to make the adjustments of the humidity tendency by means of the model, it was necessary to truncate
the sensor data to be able to make the adjustment and generate the models.
In Fig. 4 we can see the result of the RH trend obtained by means of the model. We can see that the RH humidity level is 0% at 25 minutes. At this time, you have RMC of 3.7% average. At this percentage we can consider that the clothes are dry. By comparing the drying time of 25 minutes versus the 28 minutes for the 2 pounds loads, there is a difference of 3 minutes. With this it can be concluded that a reduction of the drying cycle of 3 minutes would be obtained.
Next, the graphs in Fig. 4, Fig. 5 and Fig. 6 show the trend of modeled RH humidity. Recall that in the methodology section in point 4 spoke of adjusting the humidity RH with respect to moisture RMC. It is in this section that the adjustment of the modeled RH and the RMC can be seen with greater clarity so that both humidities coincide in a range between 3.7% and 3.4% humidity.
Fig. 4. Relationship between modeled RH and RMC 2 lb. loads.
Fig. 5. Relationship between modeled RH and RMC 7 lb. loads.
Fig. 6. Relationship between modeled RH and RMC 12 lb. loads.
Fig. 5 and Fig. 6 show the moderated RH trends for the 7 and 12 pounds load, respectively. When the RH ranges reach percentages of 3.5% the drying cycle times are 27 and 76 minutes respectively. Having again reference to table 1 for these loads, there were 33 and 83 minutes times where the RMC was 2.9% and 2,3%. Whit this information we can say that there are reductions in the drying cycles of between 5 minutes for the 7 pounds load, and 7 minutes for the 12 pounds load. The way in which it can be verified that the humidity of 3.5% RH is equal and very similar to the RMC was by graphing both humidities and verifying the point where both humidities crossed. Such crossing point occurs in an average range of 3.7 to 3.3% RMC.
Once we had everything to begin the implementation of the algorithm, the models that were generated could be defined as the process of extraction of characteristics which will serve as reference to be able to recognize and classify the signal from the sensor.
With the above information and the models generated, the algorithm was programmed in the Arduino IDE based on the methodology of pattern detection with a supervised data classification. The results are shown below in the following images. As mentioned, two different simulation tests were done, the manual simulations section is shown below.
Fig. 7. Results of the first manual simulations for the 2 lb. load.
In Fig. 7 can see the results of the first simulations which have the detection of dynamic ranges. In Fig. 7 the interface of the serial monitor that integrates the IDE of Arduino is presented. Fig. 7 shows which load of clothes is detected. It was established a total of 50 samples for the recognition

process. Fig shows the result of the descriptors, and it can be appreciated that several descriptors obtained coincidences, however, the algorithm managed to correctly identify the load of clothes.
Another corroboration is shown in Fig. 8. Here data was entered from a different repetition of the same type of 2 pounds load. it is expected to determine the same load since the model is based on the average of all the repetitions that belong to the load of 2 pounds We can see that the proper load of clothing was re-sighted. Looking at the descriptors we can see that there are two that showed 10 matches and one of 12 matches. Despite of the near possible error, the system detected the load of clothes.
In Fig. 9 and Fig. 10, the results of the test made with data from two different drying cycles of the same 7 pounds laundry loads are shown. The results that were obtained were the expected algorithm achievement to properly interpret the data and correctly determine the loads of clothing. Regarding the descriptors, they were very varied because for a test there were 39 matches (Fig. 9) while de second test only 17 (Fig.10) matches were obtained. Likewise, not only was there this difference in the second test (Fig. 10) but also that, apart from the fact that the coincidences were less, other descriptors also showed similarities being close to each other.
Fig. 8. Results entering data from a different repetition for a load of 2 lb.
laundry.
Fig. 9. Simulation results for a 7 lb. load of laundry.
Fig. 10. Simulated results from a different repetition for the same 7 lb. laundry
load.
Fig 11 and Fig. 12 show the results of the simulation of two different drying cycles of the same laundry load of 12 pounds. The descriptors in this case are strong, that is, no other descriptor showed any coincidence in; however, if we compare, Fig. 11 shows 21 matches while Fig. 12 shows 17 matches. This difference is due to the fact that they are different repetitions and the sensor data is logical that they are not the same and vary and this is where this difference in the descriptors is reflected, even if it is the same load of clothes because it is a different repetition. Moisture behavior is not exactly the same and is reflected in the descriptor. This difference is considered to be within expected by the fluctuations of the sensor when measuring.
Fig. 11. Results for the simulation for a 12 lb. load of clothing.
Fig. 12. Results for the simulation of a different repetition for a 12 lb. load of
clothes.
Finally, the results of the second type of simulation are shown, where the database was integrated into the program and more closely linked to reality. Fig. 13 represents the results of the simulation; observe that the interface is subtly different from the rest of the other simulations. A counter was added indicating how much time elapsed in the cycle. You can see that in minute 5 it detects the load. In this case the simulated data corresponded to a load of clothes of 12 pounds. From minute 5 the model starts to represent the humidity tendency when the system detects the humidity levels RH of the model marks the end of the cycle shows the percentage of
3.5% and finally tells us in what time the drying cycle would end in this case it was 76 minutes remembering Fig. 6, The RH model predicted that humidity within the range of 3.7% to 3.4% on average would be reached in 76 minutes, this was an estimate. With the simulation we can see that actually the cycle was completed in 76 minutes with this making comparisons of drying cycles duration in table 1, 5 minutes are saved in the cycle so it can be said that by reducing the cycle 5 minutes by inherencies one obtains an energy saving and when stopping the cycle within the suitable rank it is avoided to dry of plus the clothes and with this to damage it therefore it is also obtained a care of the clothes.
So, the results obtained demonstrate that the pattern
detection method works properly to detect the loads of clothes that are drying. To determine how long the load cycle will take, it can be predicted from the model that describes the clothing.
IV. CONCLUSIONS This article presents a novel methodology to describe
relative humidity in clothes drying machines (CDM). This methodology is carried out by implementing a pattern detection algorithm; with this it is possible to predict humidity levels in ranges where a conventional sensor is not able to give a reliable measurement. Based on the results we can conclude that the applied methodology works properly during the total tests made (29 simulations in total). The system presented an average error of 9% at the time of detecting the laundry load. The error that the algorithm showed is not significant enough to conclude that the method is not viable. It was demonstrated, in the simulations, that the system can detect de clothes load in a lapse of 5 minutes on average. This time can be thought to be too long, but it is relatively low in comparison of the average time that the drying cycles last, more than 15 minutes. On the other hand, other advantages of using this methodology were, as we saw in Fig. 1. Fig. 2 and Fig. 3, that the behavior of RH does not offer us significant information to be able to determinate at what moment the laundry is considered dry.
With this algorithm we can determined at what time the laundry is in percentages that are dry, this is thanks to the implemented models that describe a moisture tendency based on the RMC. Finally, we can say, based on the results obtained, that the drying cycles are reduced on average 5 minutes. This time may seem small, but if we approach it from a broader long-term point of view, these 5 minutes become a considerable time. For example, if a household uses CDM 3 times a week doing 4 cycles for each time it uses CDM; it gives us a total of 12 cycles per week. If you save 5 minutes per week in each cycle you will save 60 minutes. a year, 624 cycles would be carried out on average, multiplying the 12 weekly cycles for the 52 weeks of the year. This year reflects a saving in time of 3120 minutes per year taking into account only one home. If we multiply it by hundreds of homes, the reflected energy savings take on significance. Therefore we can say that with this methodology we can save energy.
A. Future work
The results shown so far have been simulated; short-term future work includes taking these tests to a next step and making them experimental. That implies performing the drying cycles directly in a CDM and obtaining experimental results. Another work that remains to be done is the improvement of detection ranges and gives a deeper learning to the algorithm in order to make it more robust. It is expected to obtain an average error lower than 9%.
V. ACKNOWLEDGMENTS
The authors thank the Consejo Nacional de Ciencia y Tecnología of Mexico (CONACyT) for the grant provided to RMC for the realization of this project. Likewise, the authors thank the company Mabe Tecnología y Proyectos (TyP) in Queretaro, Queretaro, México, for the facilities granted for the experiments of this project.
REFERENCES [1] Miranda C. R., Padilla M. J. A., Prado O. J., Cerritos J. R. and Espinosa
C. A., 2017, Análisis de modelos matemáticos para detectar humedad relativa en secadoras de ropa: ¿Usar ecuaciones favorece a una buena detección del secado de ropa? Pistas Educativas No. 126, Vol. 39, pp. 215 - 235.
[2] RAE, Real Academia Española, http://dle.rae.es/?id=KoBWiNL visited on March 26, 2018.
[3] AMTEX (Industria química). 2005, Método para determinar la humedad. FFJ / PVR, Técnicos analistas, LAC, Responsable de desarrollo, JGF, Responsable de aseguramiento de calidad. Documento CK-G04.
[4] Salazar, D.P. E. 1996. Calculo de la Humedad Relativa en el Ambiente. Quimica Braniwein, Manual de Ciencias de la UNESCO. P. 38.
[5] Duda, R. O., Hart, P. E., & Stork, D. G. 2000. Pattern Classification (2a ed.). San Jose, California: Wiley.
[6] Philpot, W. 2012. Pattern Recognition and Classification. Cornell University, CEE 6150: Digital Image Processing, Ithaca, NY.
[7] Aponte G., Pagán E. and Pons F. 1998. Fundamentos de matemáticas básicas (1st ed.). Addison Wesley Longman de México.
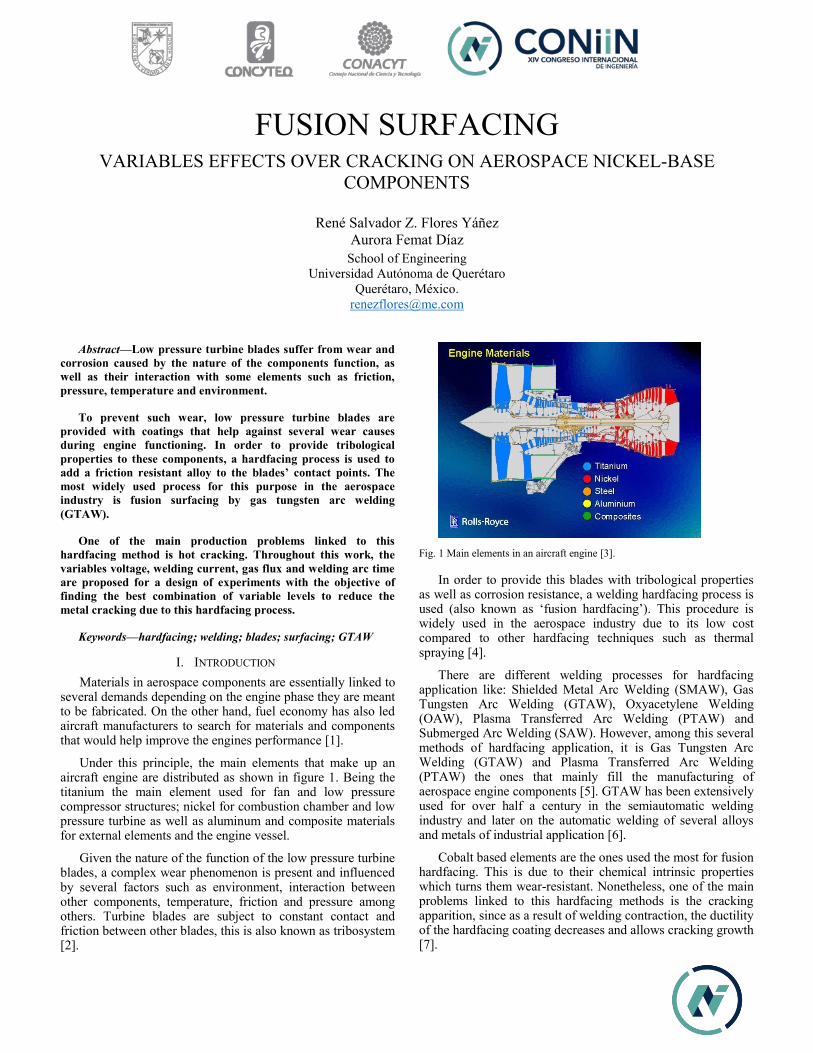
FUSION SURFACING VARIABLES EFFECTS OVER CRACKING ON AEROSPACE NICKEL-BASE
COMPONENTS
René Salvador Z. Flores Yáñez Aurora Femat Díaz
School of Engineering Universidad Autónoma de Querétaro
Querétaro, México. [email protected]
Abstract—Low pressure turbine blades suffer from wear and corrosion caused by the nature of the components function, as well as their interaction with some elements such as friction, pressure, temperature and environment.
To prevent such wear, low pressure turbine blades are provided with coatings that help against several wear causes during engine functioning. In order to provide tribological properties to these components, a hardfacing process is used to add a friction resistant alloy to the blades’ contact points. The most widely used process for this purpose in the aerospace industry is fusion surfacing by gas tungsten arc welding (GTAW).
One of the main production problems linked to this hardfacing method is hot cracking. Throughout this work, the variables voltage, welding current, gas flux and welding arc time are proposed for a design of experiments with the objective of finding the best combination of variable levels to reduce the metal cracking due to this hardfacing process.
Keywords—hardfacing; welding; blades; surfacing; GTAW
I. INTRODUCTION Materials in aerospace components are essentially linked to
several demands depending on the engine phase they are meant to be fabricated. On the other hand, fuel economy has also led aircraft manufacturers to search for materials and components that would help improve the engines performance [1].
Under this principle, the main elements that make up an aircraft engine are distributed as shown in figure 1. Being the titanium the main element used for fan and low pressure compressor structures; nickel for combustion chamber and low pressure turbine as well as aluminum and composite materials for external elements and the engine vessel.
Given the nature of the function of the low pressure turbine blades, a complex wear phenomenon is present and influenced by several factors such as environment, interaction between other components, temperature, friction and pressure among others. Turbine blades are subject to constant contact and friction between other blades, this is also known as tribosystem [2].
Fig. 1 Main elements in an aircraft engine [3].
In order to provide this blades with tribological properties as well as corrosion resistance, a welding hardfacing process is used (also known as ‘fusion hardfacing’). This procedure is widely used in the aerospace industry due to its low cost compared to other hardfacing techniques such as thermal spraying [4].
There are different welding processes for hardfacing application like: Shielded Metal Arc Welding (SMAW), Gas Tungsten Arc Welding (GTAW), Oxyacetylene Welding (OAW), Plasma Transferred Arc Welding (PTAW) and Submerged Arc Welding (SAW). However, among this several methods of hardfacing application, it is Gas Tungsten Arc Welding (GTAW) and Plasma Transferred Arc Welding (PTAW) the ones that mainly fill the manufacturing of aerospace engine components [5]. GTAW has been extensively used for over half a century in the semiautomatic welding industry and later on the automatic welding of several alloys and metals of industrial application [6].
Cobalt based elements are the ones used the most for fusion hardfacing. This is due to their chemical intrinsic properties which turns them wear-resistant. Nonetheless, one of the main problems linked to this hardfacing methods is the cracking apparition, since as a result of welding contraction, the ductility of the hardfacing coating decreases and allows cracking growth [7].

The present paper is based on the determination of the variables that influence the most over the welding process as well as the levels that help the reduction of crack apparition on low pressure turbine blades.
II. PROJECT PLAN Design of experiments is a statistical tool to help model a
plan of trials based on the variables and value levels determined significant for the process under scope. Then, valid statistical analysis are carried out to resolve the variables and levels that best fit the hypothesis presented at the beginning of the experiment.
The present paper proposes an experimental design based on the literature of research within the field hereby developed, as well as the expected results. In order to perform the series of experiments, the next steps will be followed and later on be developed and explained:
A. Determine the process variables and levels to be considered for the experiments.
B. Define the materials and equipment to be used during the experimentation.
C. Define the research hypothesis.
D. Development of a design matrix.
A. Determine the process variables and levels GTAW process has several factors that can be identified in
most of the aerospace industry applications. Table 1 lists the main ones and shows their characteristics:
TABLE 1 GTAW MOST COMMON PARAMETERS.
Parameters Comments Electrode diameter From 1.6mm to 3.2mma Protection gas Inert gas (Argon and Helium most frequently used) Welding current Continuous variable, unit: Amperes Electrode sharpening Discrete variable, from 30° to 90° at 10° intervals Pulsation frequency Continuous variable, unit: Hertz Welding velocity Continuous variable, unit: mm/sec. Protection gas flow Continuous variable, unit: l/sec. a Depending on the pistol specifications.
Previous to this experiment proposition, in 2014, Tsai et al. [7] used the GTAW technique to perform an experiment in order to demonstrate that a hammer peening process over the welding bead should help mitigate cracking propagation due to the welding procedure. For this experiment, they settled the process at a current of 140A and an advancement speed of 10 cm/min.
Later, in 2017, Saha and Mondal [8] stablished the parameters and levels shown in Table 2 for a Manual Metal Arc Welding (MMAW) procedure looking forward to optimize the technique by measuring the critical-to-quality factors: Bead width, weld reinforcement and bead hardness.
The next year, Venkatesh et al. [4] in the research of an improvement on the properties of cobalt-based hardfacing coatings against solid particles erosion, decided to perform an
experiment evaluating the influence of the GTAW process conditions by fixing as variables: Voltage, welding current, welding speed and protection gas flow as well as their respective value levels shown in Table 3.
TABLE 2 WELDING FACTORS AND LEVELS USED FOR MMAW CHARACTERISTICS OPTIMIZATION.
Factor Low level High level Welding currant (A) 140 160 Arc voltage (V) 17 25 Welding speed (mm/min.) 20 60
TABLE 3 PARAMETERS AND EXPERIMENTAL LEVELS FOR PROPERTIES IMPROVEMENT AGAINST SOLID PARTICLES EROSION.
Factor Values Welding current (A) 70, 80 & 90 Arc voltage (V) 440 Welding speed (mm/sec.) 2.25, 2.75 & 3.00 Protecting gas (Argon) pressure (Kg/cm2) 10
Using the previous experiments, it can be inferred that given the contribution of this experiences, the most important factors to take into account for this paper’s work are: Welding current, arc voltage, welding speed and protection gas flow. Also, we have decided to add the factor “electrode sharpening angle” as it may have an important influence during the first fusion arc. The factors’ levels were stablished based on the experience from an existing aerospace field industry. The factors and levels are shown in Table 4.
TABLE 4 EXPERIMENTAL FACTORS AND LEVELS.
Parameters Level 1 Level 2 Welding current 20A 30A Pulse frequency 100Hz 300Hz Electrode sharpening angle 20° 60° Protection gas flow 8 l/m 12 l/m
Time (sec.) Low (<10sec)
High (>20sec)
B. Define the materials and equipment The equipment and materials to be used for this
experimentation process are defined as follows:
1) Gas Tungsten Arc Welding process: TransTIG 2200 Job by Fronius International.
a) Protection gas: 99.9% purity Argon.
b) Electrode material: Tungsten 2% Cerium.
2) Fluorescent Penetrant Inspection line: PROCECO 504.
a) Penetrant liquid: RC65 Sensibility 3, Sherwin Williams.
b) Hydrophilic emulsifier: ER83A, Sherwin Williams.
c) Revealing powder: Dry powder D-90G, Sherwin Williams.

3) Degreasing line: ELMA.
a) Degreaser: ARDROX 6333A.
b) Rising liquid: Deionized water.
C. Research hypothesis Nowadays, aerospace engine components manufacturers
deal with high costs linked to process flaws that unfortunately cannot, in most cases, be detected before tests are performed. This is the case of turbine blades cracking due to fusion hardfacing processes. Turbine blades have to be weld, machined and passed through a thermal treatment before they can be inspected under UV light at the FPI control area to look for surface discontinuities and cracks. This path adds considerable value to the parts and when cracks are detected, in most cases, the part is rejected, causing a high cost loss in manufacturing facilities.
Given this facts, the project hypothesis can be developed as follows:
“By reducing and adjusting the variables welding current, pulse frequency, electrode sharpening angle and welding speed, the rejection rate due to welding cracking can be reduced to up to a 50% on low pressure turbine blades
manufacturing”.
D. Design of experiments matrix A full factorial design was chosen to develop the
experimental trials matrix so it includes all the variables and levels considered for this papers’ work. Therefore, the experimental matrix is developed as shown in Table 5.
TABLE 5 FULL FACTORIAL EXPERIMENT DESIGN MATRIX
Trial Current Frequency Angle Flow Time 1 20 100 20 8 Low 2 30 100 20 8 Low 3 20 300 20 8 Low 4 30 300 20 8 Low 5 20 100 60 8 Low 6 30 100 60 8 Low 7 20 300 60 8 Low 8 30 300 60 8 Low 9 20 100 20 12 Low
10 30 100 20 12 Low 11 20 300 20 12 Low 12 30 300 20 12 Low 13 20 100 60 12 Low 14 30 100 60 12 Low 15 20 300 60 12 Low 16 30 300 60 12 Low 17 20 100 20 8 High 18 30 100 20 8 High 19 20 300 20 8 High 20 30 300 20 8 High 21 20 100 60 8 High 22 30 100 60 8 High
23 20 300 60 8 High 24 30 300 60 8 High 25 20 100 20 12 High 26 30 100 20 12 High 27 20 300 20 12 High 28 30 300 20 12 High 29 20 100 60 12 High 30 30 100 60 12 High 31 20 300 60 12 High 32 30 300 60 12 High
III. EXPECTED RESULTS After performing the experiments and the statistical
analysis, it is expected to find that all parameters involved are significant so that a combination of levels can be proposed in order to achieve the objective presented within the research hypothesis. Also, as a complementary result, a mathematical model should be obtained expecting it to be significant enough so it can be considered as predictive. These results shall be applied in other aerospace manufacturing facilities managing GTAW processes.
ACKNOWLEDGMENT Author would like to acknowledge the school of
engineering at the Universidad Autonoma de Queretaro, as well as to the CONACyT for the valuable scholarship that supports author’s masters degree program.
REFERENCES [1] R. M’Saoubi et al., «High performance cutting of advanced aerospace
alloys and composite materials», CIRP Ann.-Manuf. Technol., vol. 64, n.o 2, pp. 557–580, 2015.
[2] A. Werner, W. Smarsly, y J. E\s slinger, «Wear Protection for Turbine Blades Made of Titanium Aluminide», Gamma Titan. Aluminide Alloys 2014 Collect. Res. Innov. Commer. Gamma Alloy Technol., pp. 111–115, 2014.
[3] Rolls_Royce - The Rolls-Royce Trent Engine Michael Cervenka Technical Assistant to Director Engineering Technology 5 October 2000 Rolls-Royce Today. 2000. Available from: https://www.coursehero.com/file/10027592/Rolls-Royce/
[4] B. Venkatesh, B. Malvi, M. Roy, y P. Sarkar, «Effect of welding conditions on erosive wear of hard-faced Co-based alloy layer», Proc. Inst. Mech. Eng. Part J J. Eng. Tribol., p. 1350650117753916, 2018.
[5] R. Shanmugam y N. Murugan, «Effect of gas tungsten arc welding process variables on dilution and bead geometry of Stellite 6 hardfaced valve seat rings», Surf. Eng., vol. 22, n.o 5, pp. 375–383, 2006.
[6] P. K. Ghosh, Pulse Current Gas Metal Arc Welding: Characteristics, Control and Applications. Springer, 2017.
[7] K.-C. Tsai, S.-L. Jeng, y J.-Y. Huang, «Prevention of delayed cracking of iron based hardfacing welds», Eng. Fail. Anal., vol. 48, pp. 210–217, 2014.
[8] A. Saha y S. C. Mondal, «Welding Parameters Optimization in MMAW Assisted Nano-Structured Hardfacing Using Desirability Function Analysis Embedded with Taguchi Method», Res. Des. Communities Vol., p. 447, 2017.
Synthesis of Micro and Nano-Sized Hydroxyapatite Fibers Through the Microwave Assisted Hydrothermal Method
R. P. Alanís-Gómez1, E. M. Rivera-Muñoz2,, and R. Velázquez-Castillo1 ∗ 1División de Investigación y Posgrado, Facultad de Ingeniería, Universidad Autónoma de Querétaro,�Cerro de las Campanas s/n, C.P. 76010
Querétaro, Qro., México� 2Centro de Física Aplicada y Tecnología Avanzada, Universidad Nacional Autónoma de México, A. P. 1-1010, Querétaro, Qro. 76000, México��
The synthesis of hydroxyapatite (HAp) fibers was performed using a microwave assisted hydrother- mal methodology. The actual reaction mixture was placed in a Teflon tube inside a microwave oven at 170 C and 80 bar. Polycrystalline hydroxyapatite nanofibers were obtained under these operat- ing conditions. The control on heating and cooling rates inside the reactor was critical as well as the use glutamic acid to guide the crystal growth. According to the results, the nanofibers showed a preferential crystalline orientation in the [300] but they grew in the [001] with high crystallinity and good purity. These nanofibers were closed packed inside hexagonal microfibers with a singular arrangement. Additionally, structural studies were done using X-ray diffraction by powders along with the chemical composition supported by infrared spectroscopy (FTIR) analyses. The morphol- ogy and microstructure characterization as well as crystalline features of the HAp nanocrystals were done through Scanning Electron Microscopy and High Resolution Electron Microscopy.
Keywords: Nanofibers, Hydroxyapatite, Biomaterials.
1. INTRODUCTION
The production of synthetic hydroxyapatite (HAp) (Ca10 (PO4 6 (OH)2 ) has become a classic for several research groups since it is considered as bioactive mate- rial. This compound has a chemical composition and struc- ture similar to that of the inorganic constituent of natural bone tissues.1 Actually, the natural HAp is the main min- eral constituent of hard human tissues such as bones and teeth. The synthetic one, on the other hand, has excellent biocompatibility and bioactivity properties. Consequently, synthetic HAp has been extensively used in health-related fields as an implant material in the restoration of dam- aged bones or teeth.2 Current additional uses of synthetic HAp are: piezoelectric material,3–5
catalyst,6–8 in water treatment9–11 and others. All these applications make the Hap quite an interesting material.
Sol–gel methods of HAp synthesis recently published, in which the precursors are blended in solution (wet chemistry) and the chemical reaction takes place at room temperature for several days.12–14 Other methods car- ried out HAp synthesis through solid state reactions.15 16
Although these papers are important due to the reported experimental procedure for the HAp synthesis, most of these works make no emphasis on the control of morphol- ogy, size and structural parameters of the HAp aggregates.
Remarkable methods of HAp synthesis used different chemical substances as surfactants agents, amino acids or halogen salts to control structural nucleation and crys- tal growth that led to featured morphology of HAp assemblies.17–20 Some of these methods use a hydrother- mal process in the synthesis reaction. The hydrothermal process has proved to be
effective for the HAp synthesis, the controlled heat supply in an aqueous solution produce steam which increases the pressure within the reactor and
as a consequence, the reaction rate can be increased. The use of this method has been improved due to low cost and simplicity to synthesize HAp in a large scale and high purity.21–24
The conventional hydrothermal method underwent a sig- nificant development when a microwave oven was used in the synthesis reaction of inorganic compounds. The microwaves provided the energy necessary to initiate the chemical reaction and they could be focused into the reac- tor in order to optimize the energy used. Nowadays, this method allows the obtaining of different materials with an excellent morphology control, size and preferential crys- tal orientation. Microwave-assisted hydrothermal method- ology has been successfully applied in synthesis of HAp nanostructures which present well-defined morphologies, high crystallinity and purity.25–31
The structures more often obtained by this method are nanoparticles, nano-rods and nanofibers.
In this work, a microwave-assisted hydrothermal method was used to prepare micro and nano-sized hydroxyapatite fibers with a high crystallinity and good purity. Gradient- less operation conditions concerning pressure, tempera- ture and composition allowed to obtain controlled heating and cooling rates to produce micro and nanofibers with a preferential crystallographic orientation in the [300]. The arrangement of nanofibers closely packed inside the microfibers which have a well-defined hexagonal cross section area, is a particular morphology not reported
before in the literature. The careful control in the thermodynamic variables during the synthesis reaction along with the use of the glutamic acid to guide and control the crystal growth of HAp were the main factors to obtain such singular nano- fibers packets.
2. EXPERIMENTAL PROCEDURE
2.1. Synthesis of HAp Structures
The procedure currently used for the HAp fibers synthesis was similar to that reported elsewhere.28 Initially, reactants are dissolved in tri-distilled water at 60 C with magnetic stirring for 2 hours in order to obtain two independent solutions; one containing glutamic acid [C5H9NO4 ·H2O] and calcium nitrate [Ca(NO3 2
·4H2O] and the other con- taining monobasic potassium phosphate [KH2PO4] mixed with potassium hydroxide [KOH]. Afterward, both solu- tions were mixed and a reacting mixture was made. The chemical composition in the reacting mixture was kept constant in order to obtain only fiber at the end of the chemical reaction. According to the commercial reagent composition and making a rough mass balance of the solu- tions, the amount of each component of the reaction mix- ture has been estimated and it is summarized on Table I.
The experimental set-up and actual reactor for the HAp synthesis were 8 plastic tubes (Teflon) placed within a microwave oven (Synthos 3000 by Anton Paar). The react- ing mixture was placed inside the plastic tube and almost
Table I. Calculated formulation of reacting mixtures. Reacting compounds in (g)
G Ca P OH
2.178 0.858 0.729 0 .552
Notes: G = glutamic acid; Ca = Calcium Nitrate; P = Potassium phosphate and OH = potassium hydroxide.
immediately the microwave oven was turned on which was considered as the initial reaction time. The power used in the oven was 1000 W. The heating rate was 7.5 C/min until 170 C which is considered being the actual reaction temperature. The final operating pressure reached 80 kPa and the reaction was kept for another 45 minutes for each experiment. It is important to consider that the heating and cooling rate were determined on the final morphology of the HAp nanostructures. Since there was no stirring, only diffusional and thermodynamic effects were the driv- ing forces for the HAp formation having the glutamic acid to guide the crystal growth. The white crystalline solid obtained from the reacting mixture was filtered and washed with cold 1:1 ethanol-water mixture and dried at 50 C in an oven with a slight vacuum.
2.2. Characterization of HAp Nanofibers
2.2.1. X-ray Diffraction (XRD)
In order to identify the crystalline components contained in the final product, XRD by powders was performed in all the samples obtained from the synthesis reactions. A diffractometer D8 Advance made by Bruker was used for the analyses and the operation conditions in the equip- ment were 35 kV of accelerating voltage and a current of 15 mA. The CuK radiation (wavelength of = 1 5406 Å) was used. All diffraction experiments were made from 10
through 90 on a 2 scale with a step size of 0.05 . Sample preparation was no required, all the samples were put inside the sample holder and
no milling process was done. The last was made to determine pos- sible preferential crystallographic orientation in the HAp nanostructures.
2.2.2. Fourier Transform Infrared (FTIR)
All the experimental products were analyzed by FTIR to assure the presence of hydroxyapatite and to determine the existence of other mineral components. The samples were taken after the washing, filtration and drying processes, and then they were mixed separately with potassium bro- mide at a 1:10 ratio volume respectively. The analyses were carried out by using a Bruker Vector 33 spectropho- tometer with a 4 cm−1
resolution frequency.
2.2.3. Scanning Electron Microscopy
Observations of the morphology and microstructure of all samples were made using a Scanning Electron Microscope (SEM) JEOL JSM-6390 LV. The accelerating voltage used in the microscope was 20 kV and all the images were formed from secondary electrons. The sample was col- lected when the dried process was over. A small portion of the filtered solid was put on a sample holder and glued by a carbon painting. Moreover, some HAp samples were observed by means of a Field Emission Scanning Electron Microscope (FESEM) Hitachi model SU8200 also using secondary electrons to obtain a detailed information of sample morphology.
Additionally the Ca/P ratio was determined by using an Energy Dispersive X-ray Spectrometer (EDS) Quantax EDS by Bruker attached to the SEM. The samples were compacted applying a slight pressure to obtain flat surfaces which were used to the elemental analyses.
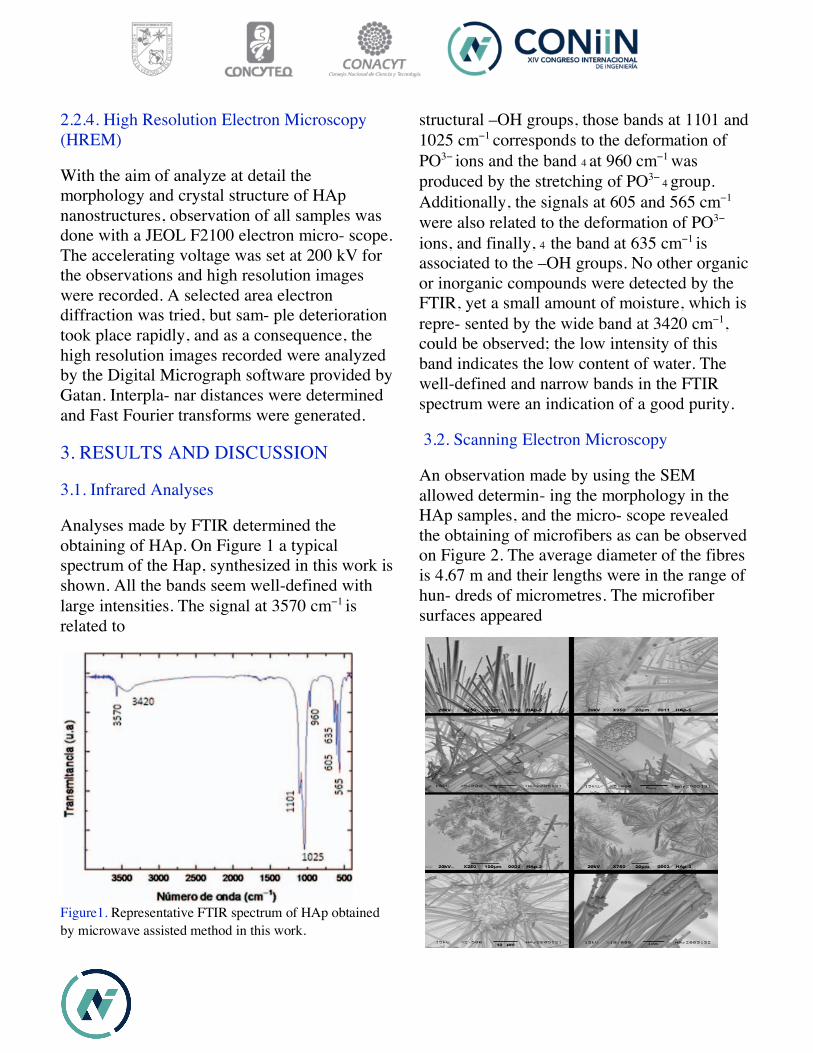
2.2.4. High Resolution Electron Microscopy (HREM)
With the aim of analyze at detail the morphology and crystal structure of HAp nanostructures, observation of all samples was done with a JEOL F2100 electron micro- scope. The accelerating voltage was set at 200 kV for the observations and high resolution images were recorded. A selected area electron diffraction was tried, but sam- ple deterioration took place rapidly, and as a consequence, the high resolution images recorded were analyzed by the Digital Micrograph software provided by Gatan. Interpla- nar distances were determined and Fast Fourier transforms were generated.
3. RESULTS AND DISCUSSION
3.1. Infrared Analyses
Analyses made by FTIR determined the obtaining of HAp. On Figure 1 a typical spectrum of the Hap, synthesized in this work is shown. All the bands seem well-defined with large intensities. The signal at 3570 cm−1 is related to
(f)
(h)
Figure1. Representative FTIR spectrum of HAp obtained by microwave assisted method in this work.
structural –OH groups, those bands at 1101 and 1025 cm−1 corresponds to the deformation of PO3− ions and the band 4 at 960 cm−1 was produced by the stretching of PO3− 4 group. Additionally, the signals at 605 and 565 cm−1
were also related to the deformation of PO3−
ions, and finally, 4�the band at 635 cm−1 is associated to the –OH groups. No other organic or inorganic compounds were detected by the FTIR, yet a small amount of moisture, which is repre- sented by the wide band at 3420 cm−1, could be observed; the low intensity of this band indicates the low content of water. The well-defined and narrow bands in the FTIR spectrum were an indication of a good purity.
3.2. Scanning Electron Microscopy
An observation made by using the SEM allowed determin- ing the morphology in the HAp samples, and the micro- scope revealed the obtaining of microfibers as can be observed on Figure 2. The average diameter of the fibres is 4.67 m and their lengths were in the range of hun- dreds of micrometres. The microfiber surfaces appeared
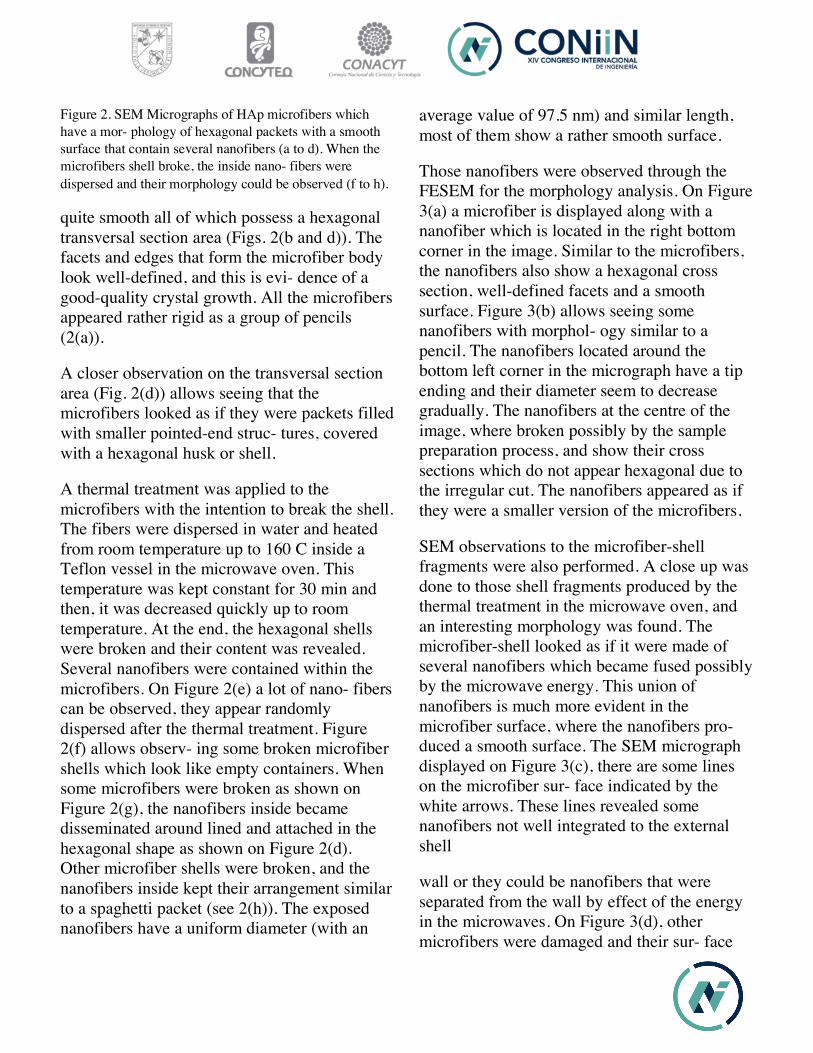
Figure 2. SEM Micrographs of HAp microfibers which have a mor- phology of hexagonal packets with a smooth surface that contain several nanofibers (a to d). When the microfibers shell broke, the inside nano- fibers were dispersed and their morphology could be observed (f to h).
quite smooth all of which possess a hexagonal transversal section area (Figs. 2(b and d)). The facets and edges that form the microfiber body look well-defined, and this is evi- dence of a good-quality crystal growth. All the microfibers appeared rather rigid as a group of pencils (2(a)).
A closer observation on the transversal section area (Fig. 2(d)) allows seeing that the microfibers looked as if they were packets filled with smaller pointed-end struc- tures, covered with a hexagonal husk or shell.
A thermal treatment was applied to the microfibers with the intention to break the shell. The fibers were dispersed in water and heated from room temperature up to 160 C inside a Teflon vessel in the microwave oven. This temperature was kept constant for 30 min and then, it was decreased quickly up to room temperature. At the end, the hexagonal shells were broken and their content was revealed. Several nanofibers were contained within the microfibers. On Figure 2(e) a lot of nano- fibers can be observed, they appear randomly dispersed after the thermal treatment. Figure 2(f) allows observ- ing some broken microfiber shells which look like empty containers. When some microfibers were broken as shown on Figure 2(g), the nanofibers inside became disseminated around lined and attached in the hexagonal shape as shown on Figure 2(d). Other microfiber shells were broken, and the nanofibers inside kept their arrangement similar to a spaghetti packet (see 2(h)). The exposed nanofibers have a uniform diameter (with an
average value of 97.5 nm) and similar length, most of them show a rather smooth surface.
Those nanofibers were observed through the FESEM for the morphology analysis. On Figure 3(a) a microfiber is displayed along with a nanofiber which is located in the right bottom corner in the image. Similar to the microfibers, the nanofibers also show a hexagonal cross section, well-defined facets and a smooth surface. Figure 3(b) allows seeing some nanofibers with morphol- ogy similar to a pencil. The nanofibers located around the bottom left corner in the micrograph have a tip ending and their diameter seem to decrease gradually. The nanofibers at the centre of the image, where broken possibly by the sample preparation process, and show their cross sections which do not appear hexagonal due to the irregular cut. The nanofibers appeared as if they were a smaller version of the microfibers.
SEM observations to the microfiber-shell fragments were also performed. A close up was done to those shell fragments produced by the thermal treatment in the microwave oven, and an interesting morphology was found. The microfiber-shell looked as if it were made of several nanofibers which became fused possibly by the microwave energy. This union of nanofibers is much more evident in the microfiber surface, where the nanofibers pro- duced a smooth surface. The SEM micrograph displayed on Figure 3(c), there are some lines on the microfiber sur- face indicated by the white arrows. These lines revealed some nanofibers not well integrated to the external shell
wall or they could be nanofibers that were separated from the wall by effect of the energy in the microwaves. On Figure 3(d), other microfibers were damaged and their sur- face
were broken in several sites. In the fragment borders there are several nanofibers exposed as it is indicated by the black arrows on Figure 3(d). On this image it is more evident how the external shell wall is made by the union of several nanofibers.
4. CONCLUSIONS
The obtaining of Hydroxyapatite micro and nanofibers through the hydrothermal assisted method was successful. All nanofibers are polycrystalline with a high purity and crystallinity which have hexagonal cross sections. Several nanofibers join to build microfibers which also have hexag- onal cross section. The union and organization of these nanofibers to form the microfibers is rather particular, such result is reported for a very first time in this work. The morphology and assembly of these nanofibers are quite interesting. The morphology of fibres with hexagonal cross sections is a crystal habit, it is a magnification of the crys- tal unit cell of the HAp. The morphology of fibers had an influence in the XRD results. A preferential crystal orientation in the [300] direc- tion was found and it was a consequence of the fibers orientation during XRD experiments. The fibers grew in the [001] direction.
The crystallographic analysis done in this work, made evident the influence of controlling synthesis reaction con- ditions (pressure, temperature and reaction time) on the morphology and preferential crystal orientation; besides, the use of a chemical substance as the glutamic acid to guide the crystalline growth had a remarkable effect.
Taking into consideration the morphology and dimen- sions of nanofibers synthesized in this work, they could be useful to obtain nano-
biomaterials which could be applied as implant materials in bone tissue, among other potential applications.
Acknowledgment: The authors would like to thank the financial support of CONACyT Fondo Salud 2013-01- 201329 and the technical assistance of José Luis Cabr- era Torres and Alicia del Real López and Carmen Peza Ledesma for the microscopy observations. Furthermore, we hereby acknowledge the editing work by Agustín Ruiz Esparza.
References and Notes
1. A. Chetty, I. Wepener, M. K. Marei, Y. E. Kamary, and R. M. Moussa, Hydroxyapatite: Synthesis, Properties and Applications, edited by V. S. Gshalaev and A. C. Demirchan, Nova Sciences Pub- lishers Inc. (2012), Chapter 2, pp. 133–164. �
2. J. Campa, S. Ulloa, L. Bucio, I. A. Belio, R. Velázquez, and E. M. Rivera, Biomateriales: Fundamentos, técnicas y aplicaciones, Ed. Universidad de Guadalajara, Centro Universitario de la Cienega, Mexico (2007), 1a Edición. �
3. C. C. Silva, A. G. Pinheiro, S. D. Figueiró, J. C. Góes, J. M. Sasaki, M. A. R. Miranda, and A. S. B. Sombra, Journal of Materials Science 37, 2061 (2002). �
4. C. R. Bowen, J. Gitting, I. G. Turner, F. Baxter, and J. B. Chaudhuri, Appl. Phys. Lett. 89, 132906 (2006). �
5. C. R. Bowen, K. V. S. Raman, and V. Y. Topolov, Advances in Science and Technology 54, 1 (2008). �
6. T. Tsuchida, T. Yoshioka, S. Sakuma, T. Takeguchi, and W. Ueda, Industrial and Engineering Chemistry. Research 47, 1443 (2008). �
7. J. Xu, T. White, P. Li, C. He, and Y. F. Han, Journal of American �
8. T. Tsuchida, J. Kubo, T. Yoshioka, S. Sakuma, T. Takegushi, and W. J. Ueda, J. Catal. 259, 183 (2008).

9. J. Shu-Dong, Y. Qi-Zhi, Z. Gen-Tao, and F. Sheng-Quan, Journal of Physical Chemistry C 116, 4484 (2012).
10. M. Ozawa, M. Hattori, and K. Satake, Proceedings of International Symposium on Ecotopia Science. ISETS07 (2007), p. 957.
11. F. Wang, Y. Guo, H. Wang, L. Yang, K. Wang, X. Ma, W. Yao, and H. Zhang, Cryst. Eng. Comm. 13, 5634 (2011).
12. D. M. Liu, T. Troczynski, and W. J. Tseng, Biomaterials 22, 1721 (2001).
13. S. K. Padmanabhan, A. Balakrishnan, M. Chu, Y. J. Lee, T. N. Kim, and S. J. Cho, Particuology 7, 466 (2009).
14. D. M. Liu, Q. Yang, T. Troczynski, and W. J. Tseng, Biomaterials 23, 1679 (2002).
15. S. Pramanik, A. K. Agarwal, K. N. Rai, and A. Garg, Ceram. Int. 33, 419 (2007).
16. X. Guo, H. Yan, S. Zhao, Z. Li, Y. Li, and X. Liang, Adv. Powder Technol. 24, 1034 (2013).
17. L. Yan, Y. Li, Z. X. Deng, J. Zhuang, and X. Sun, Int. J. Inorg. Mater. 3, 633 (2001).
18. Y. Wang, J. Chen, K. Wei, S. Zhang, and X. Wang, Mater. Lett. 60, 3227 (2006).
19. A. Goudarzi, M. Solati-Hashjin, and F. Moztarzadeh, Proceeding of 10th ECerS Conference (2007), p. 964.
20. H. G. Zhang, Q. Zhu, and Y. Wang, Chem. Mater. 17, 5824 (2005). 21. H.S.Liu,T.S.Chin,L.S.Lai,S.Y.Chiu,K.H.Chung,C.S.
Chang, and M. T. Lui, Ceram. Int. 23, 19 (1997).�22. J. Liu, X. Ye, H. Wang, M. Zhu, B. Wang, and H. Yan, Ceram. Int.
29, 629 (2003).�23. P. Hui, S. L. Meena, G. Singh, R. D. Agarawal, and S. J.
Prakash, Journal of Minerals and Materials. Characterization and
Engineering 9, 683 (2010).�24. J. S. Earl, D. J. Wood, and S. J. Milne, Journal of Physics: Confer-
ence Series 26, 268 (2006).�25. K. W. Wang, Y. J. Zhu, F. Chen, G. F. Cheng, and Y. H. Huang,
Mater. Lett. 65, 2361 (2011).�26. C. Qi, Q. L. Tang, Y. J. Zhu, X. Y. Zhao, and F. Chen, Mater. Lett.
85, 71 (2012).�27. J. M. Cao, J. Feng, S. G. Deng, X. Chang, J. Wang, J. S. Liu,
P. Lu, H. X. Lu, M. B. Zheng, and F. J. Zhang, Journal of Materials
Science 40, 6311 (2005).�28. J. L. Cabrera, R. Velázquez, and E. Rivera-Muñoz, J. Nanosci.
Nanotechnol. 11, 5555 (2011).�29. S. Meejo, W. Maneeprakorn, and P. Winotai, Thermochim. Acta
447, 115 (2006).�30. S. J. Kalita and S. Verma, Mater. Sci. Eng., C 30, 295 (2010).�31. J. K. Han, H. Y. Song, F. aito, and B. T. Lee, Mater. Chem. Phys. 99, 235 (2006).�32. B. Viswanath and N. Ravishankar, Biomaterials 29, 4855 (2008). 33. L. Chengfeng, L. Shuguang, L. Guochang, B. Jiahai, W. Weiwei, and D. Qingyang, Adv. Powder Technol. 22, 537 (2011).
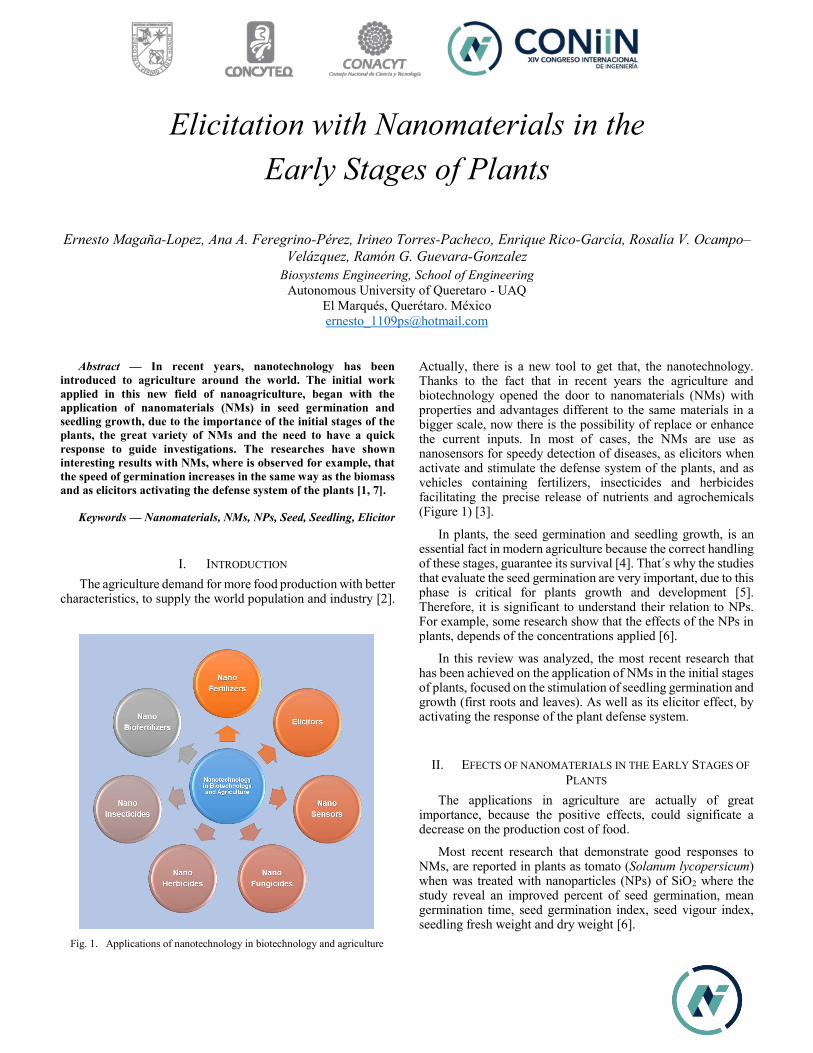
Elicitation with Nanomaterials in the Early Stages of Plants
Ernesto Magaña-Lopez, Ana A. Feregrino-Pérez, Irineo Torres-Pacheco, Enrique Rico-García, Rosalía V. Ocampo–Velázquez, Ramón G. Guevara-Gonzalez
Biosystems Engineering, School of Engineering Autonomous University of Queretaro - UAQ
El Marqués, Querétaro. México [email protected]
Abstract — In recent years, nanotechnology has been introduced to agriculture around the world. The initial work applied in this new field of nanoagriculture, began with the application of nanomaterials (NMs) in seed germination and seedling growth, due to the importance of the initial stages of the plants, the great variety of NMs and the need to have a quick response to guide investigations. The researches have shown interesting results with NMs, where is observed for example, that the speed of germination increases in the same way as the biomass and as elicitors activating the defense system of the plants [1, 7].
Keywords — Nanomaterials, NMs, NPs, Seed, Seedling, Elicitor
I. INTRODUCTION The agriculture demand for more food production with better
characteristics, to supply the world population and industry [2].
Actually, there is a new tool to get that, the nanotechnology. Thanks to the fact that in recent years the agriculture and biotechnology opened the door to nanomaterials (NMs) with properties and advantages different to the same materials in a bigger scale, now there is the possibility of replace or enhance the current inputs. In most of cases, the NMs are use as nanosensors for speedy detection of diseases, as elicitors when activate and stimulate the defense system of the plants, and as vehicles containing fertilizers, insecticides and herbicides facilitating the precise release of nutrients and agrochemicals (Figure 1) [3].
In plants, the seed germination and seedling growth, is an essential fact in modern agriculture because the correct handling of these stages, guarantee its survival [4]. That´s why the studies that evaluate the seed germination are very important, due to this phase is critical for plants growth and development [5]. Therefore, it is significant to understand their relation to NPs. For example, some research show that the effects of the NPs in plants, depends of the concentrations applied [6].
In this review was analyzed, the most recent research that has been achieved on the application of NMs in the initial stages of plants, focused on the stimulation of seedling germination and growth (first roots and leaves). As well as its elicitor effect, by activating the response of the plant defense system.
II. EFECTS OF NANOMATERIALS IN THE EARLY STAGES OF PLANTS
The applications in agriculture are actually of great importance, because the positive effects, could significate a decrease on the production cost of food.
Most recent research that demonstrate good responses to NMs, are reported in plants as tomato (Solanum lycopersicum) when was treated with nanoparticles (NPs) of SiO2 where the study reveal an improved percent of seed germination, mean germination time, seed germination index, seed vigour index, seedling fresh weight and dry weight [6].
Fig. 1. Applications of nanotechnology in biotechnology and agriculture
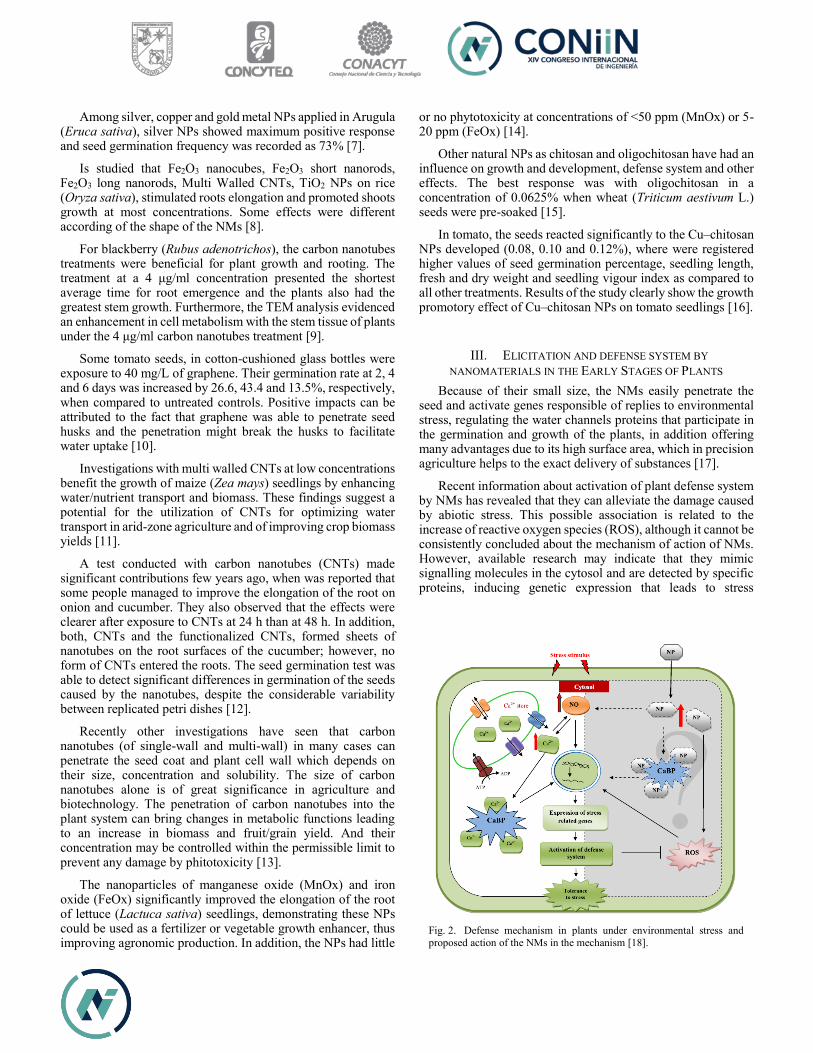
Among silver, copper and gold metal NPs applied in Arugula (Eruca sativa), silver NPs showed maximum positive response and seed germination frequency was recorded as 73% [7].
Is studied that Fe2O3 nanocubes, Fe2O3 short nanorods, Fe2O3 long nanorods, Multi Walled CNTs, TiO2 NPs on rice (Oryza sativa), stimulated roots elongation and promoted shoots growth at most concentrations. Some effects were different according of the shape of the NMs [8].
For blackberry (Rubus adenotrichos), the carbon nanotubes treatments were beneficial for plant growth and rooting. The treatment at a 4 μg/ml concentration presented the shortest average time for root emergence and the plants also had the greatest stem growth. Furthermore, the TEM analysis evidenced an enhancement in cell metabolism with the stem tissue of plants under the 4 μg/ml carbon nanotubes treatment [9].
Some tomato seeds, in cotton-cushioned glass bottles were exposure to 40 mg/L of graphene. Their germination rate at 2, 4 and 6 days was increased by 26.6, 43.4 and 13.5%, respectively, when compared to untreated controls. Positive impacts can be attributed to the fact that graphene was able to penetrate seed husks and the penetration might break the husks to facilitate water uptake [10].
Investigations with multi walled CNTs at low concentrations benefit the growth of maize (Zea mays) seedlings by enhancing water/nutrient transport and biomass. These findings suggest a potential for the utilization of CNTs for optimizing water transport in arid-zone agriculture and of improving crop biomass yields [11].
A test conducted with carbon nanotubes (CNTs) made significant contributions few years ago, when was reported that some people managed to improve the elongation of the root on onion and cucumber. They also observed that the effects were clearer after exposure to CNTs at 24 h than at 48 h. In addition, both, CNTs and the functionalized CNTs, formed sheets of nanotubes on the root surfaces of the cucumber; however, no form of CNTs entered the roots. The seed germination test was able to detect significant differences in germination of the seeds caused by the nanotubes, despite the considerable variability between replicated petri dishes [12].
Recently other investigations have seen that carbon nanotubes (of single-wall and multi-wall) in many cases can penetrate the seed coat and plant cell wall which depends on their size, concentration and solubility. The size of carbon nanotubes alone is of great significance in agriculture and biotechnology. The penetration of carbon nanotubes into the plant system can bring changes in metabolic functions leading to an increase in biomass and fruit/grain yield. And their concentration may be controlled within the permissible limit to prevent any damage by phitotoxicity [13].
The nanoparticles of manganese oxide (MnOx) and iron oxide (FeOx) significantly improved the elongation of the root of lettuce (Lactuca sativa) seedlings, demonstrating these NPs could be used as a fertilizer or vegetable growth enhancer, thus improving agronomic production. In addition, the NPs had little
or no phytotoxicity at concentrations of <50 ppm (MnOx) or 5-20 ppm (FeOx) [14].
Other natural NPs as chitosan and oligochitosan have had an influence on growth and development, defense system and other effects. The best response was with oligochitosan in a concentration of 0.0625% when wheat (Triticum aestivum L.) seeds were pre-soaked [15].
In tomato, the seeds reacted significantly to the Cu–chitosan NPs developed (0.08, 0.10 and 0.12%), where were registered higher values of seed germination percentage, seedling length, fresh and dry weight and seedling vigour index as compared to all other treatments. Results of the study clearly show the growth promotory effect of Cu–chitosan NPs on tomato seedlings [16].
III. ELICITATION AND DEFENSE SYSTEM BY NANOMATERIALS IN THE EARLY STAGES OF PLANTS
Because of their small size, the NMs easily penetrate the seed and activate genes responsible of replies to environmental stress, regulating the water channels proteins that participate in the germination and growth of the plants, in addition offering many advantages due to its high surface area, which in precision agriculture helps to the exact delivery of substances [17].
Recent information about activation of plant defense system by NMs has revealed that they can alleviate the damage caused by abiotic stress. This possible association is related to the increase of reactive oxygen species (ROS), although it cannot be consistently concluded about the mechanism of action of NMs. However, available research may indicate that they mimic signalling molecules in the cytosol and are detected by specific proteins, inducing genetic expression that leads to stress
Fig. 2. Defense mechanism in plants under environmental stress and proposed action of the NMs in the mechanism [18].

resistance, but further research is still needed to ensure that NMs are inhibitors or stress inductors (Figure 2) [18].
Some investigations have been observed that the exposure of ajowan (Carum copticum) seeds to chitosan (0.2%) could improve its germination and growth. In the same way, some treatments can reduce the harmful effect of salinity during growth. Chitosan tolerance to salt stress may be related to the influence on water content [19].
Currently, there is enough information to indicate that the application of chitosan to plants can improve tolerance to a large number of pathogenic microorganisms, adverse climatic conditions and stimulate growth, indicating that the use of natural elicitors such as chitosan could help achieve sustainable agriculture [20].
Nanoparticles of zinc oxide improved germination and caused a better tolerance to drought. Under these conditions, all germination characteristics decreased, except dry and fresh weight. That is why, the application of 1 g/L of nano zinc oxide can be positive to increase and improve the germination of soybean (Glycine max) seeds under stress drought [21].
The effect of the application of analcite nanoparticles to soil (at 0, 500, 1000 and 1500 mg/L) on the drought resistance of wheat and corn seedlings was studied. The positive effect has been established for all the doses: seed germination, seedling growth criteria and photosynthetic pigments content increased. The application of analcite caused acute accumulation of protective antioxidants (flavonoids, carotenoids) and activation of catalase (in corn) under soil drought [22].
Some results with nanoparticles of silicon showed great effects to reduce damage by salinity. But the behaviour in certain doses (high) of the treatments that have been evaluated, still do not make clear the behaviour with these NMs [23].
A research carried out on lentils (Lens culinaris) shows that the application of nanoparticles of silicon oxide can have positive effects, especially in plants stressed by the effect of salinity. The pre-planting of seeds treated with some NMs such as nanoparticles of silicon oxide, nano fertilizers, seeds covered with nanomaterials or nano-absorbing water can result in the improvement of seed germination and an increase in vigour in seedlings [24].
Pumpkin (Cucurbita sp.) seedlings treated with NaCl and nanoparticles of silicon dioxide showed significant changes in growth and physiological characteristics. When the seedlings were exposed to salt stress, the germination percentage, vigor, growth and physiobiochemical characteristics of the seed decreased. However, silicon nano dioxide significantly reduced the adverse effects of salinity by mitigating cellular oxidative damage. The effect of nanoparticles of silicon dioxide was dose dependent [25].
One study reveals that the stress caused by salinity resulted in a considerable decrease in seed germination, vegetative growth and yield of faba bean (Vicia faba). The results highlight the role of nanosilicon in the regulation of salinity responses, since it could protect bean plants from the effect of salinity [26].
The applications of NMs can stimulate the anticipated germination of the plant, interrupt the dormancy of the seed and improve the production of the plant. Significantly increase seed germination, mean germination time, germination rate, seedling weight and vigor index. It has been proposed that the application of SiO2 nanoparticles together with pre-cooling could be used as a new alternative potential for the breaking of seed dormancy in high wheat grass [27].
In Eruca sativa the applied copper nanoparticles were more stress inducing than silver and gold nanoparticles because of the fact that copper at bulk level is also more toxic than silver and gold [7]. But in pea (Pisum sativum) seedlings showed an increase in oxidative stress and alter the antioxidant defense system when exposed to silver NPs [28].
Because the first response to the influence of stress on plants, is the decrease in growth, carbon nanotubes (CNTs) can not be considered as a tensor material, because it has a positive effect on the growth of Satureja rechingeri calluses. But it was found that they can act as an elicitor by enhancing the production of rosmaniric acid, this by increasing the primary metabolites such as the amino acids tyrosine and phenylalanine. Now the production process of secondary metabolites must be studied thoroughly and reach a molecular level. And the security when using CNTs continues in debate. But at this time its use is safe for the production of secondary metabolites [29].
In tomato, the graphene penetration of vacuole and its deposition in root tips were two causing factors for reduced biomass production in tomato. Furthermore, that stems and roots were longer than those of the control. May be related to elevated gibberellic acid biosynthesis in graphene-treated seedlings, but further studies at cellular and molecular levels are needed understanding of underlying mechanisms [10].
A variety of metal oxide nanoparticles (CeO2, ZnO, CuO, TiO2, Fe3O4 and Al2O3, etc.) have been examined in seed germination, shoot/root growth, biomass production and physiological and biochemical activities. Demonstrating both, beneficial and adverse effects, on the system and production of plants. Most studies in the early stages of plant development, but that requires a long-term study to achieve results. It is expected that some of the nanomaterials will minimize the use of toxic chemicals and fertilizers in the near future [30].
IV. CONCLUSION AND FUTURE PROSPECTS After review the current information around the world, about
the application of NMs in early stages of interest plants, the general conclusion is that NMs have an effect on plants, because of their properties at this scale and there are enough information to demonstrate it, but is not concise yet.
In seed germination, the response to the activity is relate with aquaporins or water channels. In seedling growth, the NMs activate the defense system, but is missing more information to clarify the action mode and define if the NMs inhibit or induce the abiotic stress.
The necessity to research in this critical stage of plants continue, but is time to start the investigations in advance phases of growth and development to have a wide vision of the effect of NMs and guide the investigations in the productive stage.
REFERENCES
[1] Khodakovskaya, M., Dervishi, E., Mahmood, M., Xu, Y., Li, Z., Watanabe, F., and Biris, A. S. (2009). Carbon nanotubes are able to penetrate plant seed coat and dramatically affect seed germination and plant growth. ACS Nano. 3(10), pp. 3221-3227.
[2] Alvídrez-Morales, A., González-Martínez, B. E., and Jiménez-Salas, Z. (2002). Tendencias en la producción de alimentos: alimentos funcionales. RESPyN. 3(3), pp. 1-6.
[3] Duhan, J. S., Kumar, R., Kumar, N., Kaur, P., Nehra, K., Duhan, S. (2017). The new perspective in precision agriculture. Biotechnology Reports. 15 (2017), pp. 11–23.
[4] Siddiqui M.H. and Al-Whaibi M.H. (2014). Role of nano-SiO2 in germination of tomato (Lycopersicum esculentum seeds Mill.). Saudi Biol Sci. 21, pp. 13–17.
[5] Siddiqui M.H., Al-Whaibi M.H., Faisal M., Al Sahli A. A. (2014). Nano-silicon dioxide mitigates the adverse effects of salt stress on Cucurbita pepo L. Environ Toxicol Chem 33(11), pp. 2429–2437.
[6] Siddiqui M.H., Al-Whaibi M.H., Mohammad, F., Y. Al-Khaishany, M. (2015). Role of Nanoparticles in Plants. pp. 19-35. In: Nanotechnology and Plant Sciences: Nanoparticles and Their Impact on Plants. Siddiqui M.H., Al-Whaibi M.H., Mohammad, F.
[7] Zaka, M., Abbasi, B. H., Rahman, L. U., Shah, A., and Zia, M. (2016). Synthesis and characterisation of metal nanoparticles and their effects on seed germination and seedling growth in commercially important Eruca sativa. IET nanobiotechnology, 10(3), pp. 134-140.
[8] Hao, Y., Zhang, Z., Rui, Y., Ren, J., Hou, T., Wu, S., and Liu, L. (2016). Effect of Different Nanoparticles on Seed Germination and Seedling Growth in Rice. In Annual International Conference on Advanced Material Engineering.
[9] Flores, D., Chacón, R., Alvarado, L., Schmidt, A., Alvarado, C., and Chaves, J. (2014). Effect of using two different types of carbon nanotubes for blackberry (Rubus adenotrichos) in vitro plant rooting, growth and histology. American Journal of Plant Sciences, 5(24), pp. 3510.
[10] Zhang, M., Gao, B., Chen, J., and Li, Y. (2015). Effects of graphene on seed germination and seedling growth. Journal of Nanoparticle Research, 17(2), pp. 78.
[11] Tiwari, D. K., Dasgupta-Schubert, N., Cendejas, L. V., Villegas, J., Montoya, L. C., and García, S. B. (2014). Interfacing carbon nanotubes (CNT) with plants: enhancement of growth, water and ionic nutrient uptake in maize (Zea mays) and implications for nanoagriculture. Applied Nanoscience, 4(5), pp. 577-591.
[12] Cañas, J. E., Long, M. , Nations, S. , Vadan, R. , Dai, L. , Luo, M. , Ambikapathi, R. , Lee, E. H. and Olszyk, D. (2008). Effects of functionalized and nonfunctionalized single‐walled carbon nanotubes on root elongation of select crop species. Environmental Toxicology and Chemistry, 27(9), pp. 1922-1931.
[13] Husen, A., and Siddiqi, K. S. (2014). Carbon and fullerene nanomaterials in plant system. Journal of nanobiotechnology, 12(1), pp. 16.
[14] Liu, R., Zhang, H., and Lal, R. (2016). Effects of stabilized nanoparticles of copper, zinc, manganese, and iron oxides in low concentrations on lettuce (Lactuca sativa) seed germination: nanotoxicants or nanonutrients?. Water, Air, and Soil Pollution, 227(1), pp. 42.
[15] Ma, L. J., Li, Y. Y., Wang, L. L., Li, X. M., Liu, T., and Bu, N. (2014). Germination and Physiological Response of Wheat (Triticum aestivum) to Pre-soaking with Oligochitosan. International Journal of Agriculture and Biology, 16(4), pp. 766-770.
[16] Saharan, V., Sharma, G., Yadav, M., Choudhary, M. K., Sharma, S. S., Pal, A., and Biswas, P. (2015). Synthesis and in vitro antifungal efficacy of Cu–chitosan nanoparticles against pathogenic fungi of tomato. International journal of biological macromolecules, 75, pp. 346-353.
[17] Khodakovskaya, M. V., De Silva, K., Biris, A. S., Dervishi, E., and Villagarcia, H. (2012). Carbon nanotubes induce growth enhancement of tobacco cells. ACS nano, 6(3), pp. 2128-2135.
[18] Khan, M. N., Mobin, M., Abbas, Z. K., AlMutairi, K. A., and Siddiqui, Z. H. (2017). Role of nanomaterials in plants under challenging environments. Plant Physiology and Biochemistry, 110, pp. 194-209.
[19] Mahdavi, B., and Rahimi, A. (2013). Seed priming with chitosan improves the germination and growth performance of ajowan (Carum copticum) under salt stress. EurAsian Journal of BioSciences, pp. 7.
[20] Katiyar, D., Hemantaranjan, A., and Singh, B. (2015). Chitosan as a promising natural compound to enhance potential physiological responses in plant: a review. Indian Journal of Plant Physiology, 20(1), pp. 1-9.
[21] Sedghi, M., Hadi, M., and Toluie, S. G. (2013). Effect of nano zinc oxide on the germination parameters of soybean seeds under drought stress. Annals of West University of Timişoara, Ser. Biology, 16, pp. 73-78.
[22] Zaimenko, N. V., Didyk, N. P., Dzyuba, O. I., Zakrasov, O. V., Rositska, N. V., and Viter, A. V. (2014). Enhancement of Drought Resistance in Wheat and Corn by Nanoparticles of Natural Mineral Analcite. Ecologia Balkanica, 6(1).
[23] Haghighi, M., Afifipour, Z., and Mozafarian, M. (2012). The effect of N-Si on tomato seed germination under salinity levels. J Biol Environ Sci, 6(16), pp. 87-90.
[24] Sabaghnia, N., and Janmohammadi, M. (2015). Effect of nano-silicon particles application on salinity tolerance in early growth of some lentil genotypes/Wpływ nanocząstek krzemionki na tolerancję zasolenia we wczesnym rozwoju niektórych genotypów soczewicy. Annales UMCS, Biologia, 69(2), pp. 39-55.
[25] Siddiqui, M. H., Al‐Whaibi, M. H., Faisal, M., and Al Sahli, A. A. (2014). Nano‐silicon dioxide mitigates the adverse effects of salt stress on Cucurbita pepo L. Environmental toxicology and chemistry, 33(11), pp. 2429-2437.
[26] Qados, A. M. A., and Moftah, A. E. (2015). Influence of silicon and nano-silicon on germination, growth and yield of faba bean (Vicia faba L.) under salt stress conditions. American Journal of Experimental Agriculture, 5(6), pp. 509.
[27] Azimi, R., Borzelabad, M. J., Feizi, H., and Azimi, A. (2014). Interaction of SiO2 nanoparticles with seed prechilling on germination and early seedling growth of tall wheatgrass (Agropyron elongatum L.). Polish Journal of Chemical Technology, 16(3), pp. 25-29.
[28] Tripathi, D. K., Singh, S., Singh, S., Srivastava, P. K., Singh, V. P., Singh, S. and Chauhan, D. K. (2017). Nitric oxide alleviates silver nanoparticles (AgNps)-induced phytotoxicity in Pisum sativum seedlings. Plant Physiology and Biochemistry, 110, pp. 167-177.
[29] Esmaeili, H., Hadian, J., Mirjalili, M. H., and Rezadoost, H. (2015). The effect of activated charcoal and multi-walled carbon nanotubes on the growth, rosmarinic and caffeic acid content, total phenol, total flavonoid and antioxidant activity of Satureja rechingeri calluses. Journal of Biodiversity and Environmental Sciences, 6(5), pp. 297-305.
[30] Siddiqi, K. S., and Husen, A. (2017). Plant response to engineered metal oxide nanoparticles. Nanoscale research letters, 12(1), pp. 92.

Hydrophobic concrete resistant to sulfates as a protection mechanism against the presence of
seawater
Jesús Roberto Pulido Vera; José Antonio Rivas Arreola
Autonomous University of Queretaro Faculty of Engineering
Querétaro, Mexico [email protected]
G.J. Ríos-Moreno
Autonomous University of Queretaro Faculty of Engineering
Querétaro, Mexico
Summary- Exposing a concrete structure to seawater becomes more vulnerable than that which is not exposed to it, because some substances such as chlorides and sulphates attack low permeability structures that are more exposed to corrosion. The Institute of Cement, Concrete and Aggregates of Australia (CCAA) and Portland Cement Association (PCA) have found through reasearch that due to the aforementioned it is proposed to generate a concrete capable of resisting the effects of corrosion through a sulphate resistant cement and a hydrophobic coating which will give us a guarantee that the structures made in this way will have an excellent performance before this problem and to make sure of this the tests are made based on the ASTM (filtration speed test and unit weight test and empty content).
Keywords-concrete; corrosion; permeability; hydrophobic.
I. INTRODUCTION To obtain a sustainable construction [1] or a conscious use of the natural resources that are available for construction and a design or constructive process that considerably reduces the environmental impacts, a huge change of mentality in the construction industry is needed . In this same sense, the technology of concrete responds with the characteristics of sustainability that enhance the material in a new market, improve environmental conditions and save resources; This vision includes both energy, water and materials, as well as systems or strategies that affect the global concept of quality. It treats will give him solution to this problematic through a cement resistant to the sulfates and complementing with a hydrophobic coating that is a step different from which it has done in Spain where has worked with the addition of slag and volatile ashes [2 ] with which they have shown that low calcium fly ash is an effective mineral addition to improve sulfate resistance of normal portland cement [3]. The materials that are going to be used are:
Portland Cement: Industrial portland cement resistant to sulphates has been used. Additions The additions that will be used will be a granulated blast furnace slag, a fly ash and a ground siliceous sand to be used as a control [4]. a) Slag b) Fly ash c) Arena To manufacture 1 x mortar test tubes (1: 3) 1 X 6 cm natural sand has been used, with a SiOg content greater than 99%. The grain size is between 1 and 1.5 mm. On the other hand, this sand has been used as an addition to the cement, once ground until it has passed through a sieve of 88 ^ m [5]. d) Hydrophobic coating ASTM TESTS Tests will be conducted based on the ASTM standards to know the behavior of the concrete after having been created with the materials discussed above, the tests will be those of: a) unit weight and content of voids b) infiltration rate c) compressive strength UNIT WEIGHT AND VACUUM CONTENT To perform the test requires a cylindrical metal mold of 7 liters capacity, similar to that used in the test of air content for conventional concrete (ASTM C231) [6], a compaction hammer such as that used in the soil compaction test of the Proctor Standard, weighing 2.5 kg (ASTM 0698) [6], and a

Rectangular metal plate 6 mm thick and with a length and width of at least 50 mm greater than the diameter of the cylindrical mold [7]. The test consists of obtaining a concrete sample, in accordance with ASTM C172 [8]. Previously, the mold is moistened, and then filled with concrete mix in two layers of approximately equal depth. Each layer is compacted by applying 20 strokes with the Proctor hammer, which is dropped from a height of 300 mm, taking care to compact over the entire surface. Finally, the surface is flush with the rectangular plate. The unit weight and empty contents are calculated with expressions 1 to 3.
𝑃𝑈 =𝑃(𝑚+𝑐)−𝑃(𝑚)
𝑉(𝑚) (1)
%𝑉 =
𝑃(𝑡ℎ𝑒𝑜𝑟𝑖𝑐)−𝑃𝑈
𝑃(𝑡𝑒ó𝑟𝑖𝑐𝑜) (2)
𝑃𝑈(𝑡ℎ𝑒𝑜𝑟𝑖𝑐) =
𝑃(𝑡)𝑉(𝑡)
(3)
INFILTRATION SPEED
Test Method for the Field Infiltration Rate of the Porous
Concrete (ASTM C1701 Standard Test Method for Infiltration Rate of In Place Pervious Concrete), [9]. The method is
applicable to detect the possible reduction of the infiltration rate in the test zone. It does not measure the influence of the
possible obstruction and / or plugging of the voids in the infiltration velocity, for which it is necessary to extract a core from the section of the test zone. To determine the infiltration velocity of a pavement, multiple measurements must be made at several points, maintaining a distance of one meter between
measuring points and calculating the average [10]. For the test, a rigid and cylindrical metal ring of 300 mm
diameter and 50 mm diameter is required. mm height The inner surface of the ring is marked with two lines at a distance of 10 and 15 mm from the bottom of the
ring. The test consists of moistening the test area, placing the ring
sealing the contact area with the concrete surface [11]. A known volume of water is poured into the ring and the time it
takes the pavement to absorb the water is recorded. The infiltration rate is calculated with the expression 4.
𝐼 = 𝑘𝑃𝐷2𝑡
(4)
In the expression, I (in mm / h) is the infiltration rate of the porous concrete, k (in mm³ * s) / (kq * h) a constant, P (in kg), the weight of the infiltrated water, D (in mm) the diameter of the ring and t (in s) the infiltration time of the water in the test area. The constant k is 4583666000 for the International System of Units. COMPRESSION RESISTANCE The type of test must be evaluated in addition to the compaction technique, the pitch material and the appropriate cylinder size. The relationship between compression resistance obtained in cylinders and cores is also studied [13]. RESISTANCE TO FLEXION The Working Group believes that the new proposal should be very similar to the one used for conventional concrete. However, two test versions are contemplated, one of single section for porous concrete without reinforcement and another of more complex section for fiber reinforced porous concrete [14]. TESTS When performing the infiltration test we observed how quickly the water penetrated into concrete.
Figure 1.preparation for the infiltration test
Figure 2. infiltration test
RESULTS
Table 1. infiltration rate
material Infiltration rate concrete 0.1ml/min

It can be seen that an infiltration rate of 0.1ml / min is
generated for the concrete created.
CONCLUSION
BY MEANS OF THE TESTS CARRIED OUT WE CAN ASSURE THAT THE SULPHATE RESISTANT CONCRETE AND WITH A HYDROPHOBIC COATING IS TOO FEASIBLE SINCE IT HAS GOOD RESULTS THAT GENERATE GREAT RESISTANCE TO THE STRUCTURES EXPOSED TO THE SEA WATER SINCE THE RESULTS OBTAINED IN THE TEST OF INFILTRATION TELL US THAT OUR STRUCTURES WOULD BE HYDROPHOBIC AS WELL AS RESISTANT TO SULFATES.
REFERENCES
[1] Lidia M. Velez, “Permeabilidad y Porosidad en Concreto, 2005.
[2] Demetrio Gaspar-Tebar y José Luis Sagrera-Moreno. “Durabilidad del hormigón: Acción del agua de mar sobre un cemento portland resistente a los sulfates. Influencia de la adición de escorias y de cenizas volantes”
[3] Edgardo F, Oscar R., K. Elissa, “Resistencia a los sulfatos del cemento Portland normal con ceniza volante” 1989.
[4] Demetrio Gaspar-Tebar y José Luis Sagrera-Moreno. “Durabilidad del hormigón: Acción del agua de mar sobre un cemento portland resistente a los sulfates. Influencia de la adición de escorias y de cenizas volantes”
[5] Demetrio Gaspar-Tebar y José Luis Sagrera-Moreno. “Durabilidad del hormigón: Acción del agua de mar sobre un cemento portland resistente a los sulfates. Influencia de la adición de escorias y de cenizas volantes”
[6] ASTM C231 (2009). Standard Test Method for Air Content of Freshly Mixed Concrete by the Pressure Method
[7] ASTM 0698 (2007). Standard Test Method for Laboratory
Compaction Characteristics of Soil Using Standard Effort (600 kN-m/m3)
[8] ASTM C172 (2008). Standard Practice for Sampling Freshly Mixed Concrete.
[9] ASTM C1701 (2009). Standard Test Method for Infiltration Rate of In Place Pervious Concrete.
[10] Montes F., Valavala S. y Haselbach L. (2005). A New Test Method for Porosity Measurements of Portland.
Cement Pervious Concrete. Journal of ASTM.January. Vol. 2, No. 1 [11] J ASTM C944 (2005). Standard Test Metnod for Abrasion
Resistance of Concrete or Mortar Surfaces by the Rotating-Cutter Method.
[12] ASTM C231 (2009). Standard Test Method for Abrasion Resistance of Horizontal Concrete Surfaces.
[13] ASTM E303 (2008). Standard Test Method for Measuring Surface Frictional Properties Using the British Pendulum Tester.
[14] ASTM WK23367 (2011). New Test Method for Evaluating the Surface Ourability Potential of a Pervious Concrete Mixture.
Estimation of origin-destination matrices in a urban road network through RFID technology.
Case Study of the Querétaro Metropolitan Area
Reyna Alonso, Miguel Angel Autonomous University of Queretaro, Faculty of
Engineering CONACYT
Querétaro, México [email protected]
Dorado Pineda, Marco Luis Autonomous University of Queretaro, Faculty of
Engineering Mexican Institute of Transportation
Querétaro, México [email protected]
Abstract— In recent years the problem related to traffic control in large cities has been increasing, due to the exponential growth of vehicles that circulate in its road network. This growth in the number of vehicles causes the information, necessary to perform a traffic analysis, to be more complex to obtain. However, thanks to the application of recent technologies, different methodologies have been investigated to obtain passive traffic information. These investigations have obtained favorable results; for instance, origin-destination matrices, these can be used to feed the intelligent transport systems. But, it must not be forgotten that the estimated matrices must be reliable, since any serious transport analysis must be based on high quality origin-destination matrices. It has been found thanks to previous studies that the quality of an origin-destination matrix depends mainly on two factors; the precision of the input data and the location of the points where these data is collected, being the last one sometimes forgotten.
Keywords— origin-destination matrix; RFID; high quality on matrices; mobility; traffic; intelligent transport systems; Querétaro Metropolitan Area.
I. INTRODUCTION Mobility in cities contributes to their development and
strengthening, by creating a system that seeks to improve the conditions for productive activities of the population, therefore it is necessary that there is a correct traffic control that allows a stable planning enough for said system to operate without problems. Nevertheless, given the growth of cities such control has become more complex to achieve, since when the city grows there is also an increase in the demand for transport, which in turn is related to the number of vehicles that drive around the city. This behavior causes traffic analysis to be more complicated to carry out, which is why the need to apply recent technologies to control and analyze the traffic is vital; an example of these are real-time intelligent transport systems (ITS) and dynamic traffic management systems (DTMS). However, this type of intelligent systems need real-time information about the behavior of the transport network. The main source of this
behavior are origin-destination matrices; the origin-destination (O-D) matrices represent the spatial distribution of travels between traffic analysis zones in a transport network, i.e., they illustrate how many trips are made from a place A to a place B within a certain time frame.
II. REVIEW OF THE LITERATURE A revision on the topics related to the ideal location of the
RFID reading sites is presented, to serve as a background of the methods and procedures that have been carried out before. These starts talking about the traffic phenomenon; continues with an explanation of the need to estimate high quality O-D matrices; and its ended with a discussion of the recent technologies for obtaining data of the traffic behavior.
A. Traffic Phenomenon In their studies, [1] and [2] agree that since the 90s the
increase in transport demand has induced, especially in large cities, an increase in the congestion, delay times, accidents and environmental problems. In this context, [3] mentions that vehicular traffic is a complex dynamic behavior, since each vehicle behaves differently from the rest; such behavior occurs in a specific space and time, so if we want to understand the behavior of traffic it is necessary to understand these spatio-temporal characteristics. It is further explained that when traffic density is high enough, a congestion regime is generated; which is normally defined as a state of traffic resulting from a traffic jam in a road, as an inevitable consequence of an upstream flow that exceeds the capacity downstream of the traffic jam.
On the one hand, [4] propose a method of measurement for congestion composed of two traditional measurements, the speed and delays in the travels; on the other hand, [5] mentions that the base measures for congestion are the travel time and delays, moreover, [5] also points out that there are other variables capable of measuring the congestion of a city or road system. These variables are identified in [6], among which are:
• Duration: This variable is defined as the total time in which the congestion affects the trips in the system.
• Level: It is calculated by estimating the number of people or vehicles affected by congestion, and by the geographical distribution of congestion.
• Intensity: It is defined as the severity of the congestion that affects the displacements. It is used regularly to differentiate between levels of congestion.
• Reliability: It is the key component of the estimation of congestion, and is described as the variation between the three previous elements.
Another measurement approach for congestion is the economic one, which is suggested by [7], which examines how urban traffic congestion imposes economic costs within metropolitan areas. Considering that the various producers of goods and services are sensitive to congestion through their impacts on business costs, productivity and production levels.
B. Importance of the Quality on O-D Matrices A problem that has occurred in recent years in cities where
there is a socio-economic growth, is the incessant increase in displacements demand that takes place within modern cities and their metropolitan areas; which according to [8] has generated an increase in the use of vehicles thus producing problems of vehicular congestion. In this same sense, [9] considers that this increase within and between large metropolitan areas has caused an increase in the complexity of travel patterns. To understand this complexity, simulation tools are used for real-time intelligent transport systems (ITS) and dynamic traffic management systems (DTMS), which have the ability to estimate the behavior of the network and predict their evolution in the short term (REF).
According to [10], [11] and [12]; the most important source of information for the planning and management of transport networks are the origin-destination (O-D) matrices. In this sense [13] state that questionnaires are traditionally used in households, on the road or by telephone to obtain information and to estimate O-D matrices. However, this type of traditional methods of estimating O-D matrices presents some problems such as the long time from data collection for the analysis of these. Due to the above, recently methodologies have been developed for the estimation of O-D matrices in "real time".
As mentioned by [11], the estimation of high quality O-D matrices is a fundamental requirement for any serious analysis of the transport system. The quality of the O-D matrices estimated through traffic counts depends on two aspects of vital importance, the first, is the reliability and precision of the input data; while the second refers to the number and location of the counting points. Although several investigations have been carried out regarding the input data and several methodologies have been proposed for its analysis, the second point concerning the location and number of counting points has received very limited attention. One of the first studies on the subject was carried out by [14], where they proposed some heuristic procedures to identify the order in which links should be selected to estimate O-D matrices. Another contribution of interest is
those of [15] and [16], they agree in the analysis of the concept of maximum possible relative error (MPRE) with respect to the number and location of the counting points in the network. For their part, [15] mention that not all the links of text counts include the same amount of information, some of them do not include any information to the O-D matrices. Through the MPRE theory they establish four location rules for traffic counts, these rules are the O-D coverage rule, the maximum flow fraction rule, the maximum flow intercept rule, and the link independence rule.
Another approach is that of [17], they develop strategies to select additional traffic counts to improve the estimation of O-D matrices. These strategies are generated based on a screen line of traditional traffic count location models (TLC), which are expressed as whole programming formulations.
In recent years, the need has arisen to apply the aforementioned theories to the new data collection technologies for the generation of dynamic O-D matrices. Two examples of this are [18] and [19], while [18] conducted an investigation for license plate recognition devices (LPR), [19] conducted the study for bluetooth sensors. However, both agreed on the need to reduce installation costs while at the same time maximizing data collection.
C. Technologies for obtaining dynamic data For [20] the new methodologies for estimates of O-D
matrices in "real time" are based on the incorporation of Automated Vehicle Identification Systems (AVI). For its part, [21] states that AVI technologies which are being developed and implemented will increase the ease of acquiring and analyzing large volumes of detailed data on vehicle flow, which will be a primary source of information for the dynamic estimation of O-D matrices. As stated by [22], AVI systems can be categorized according to two key characteristics; the first refers to whether the cooperation of the user of the vehicle is necessary, the second is the scope, that is, if the AVI system is capable of covering the entire network. So, some of the most used AVI systems are GPS-based systems, Cell Phone Tracking, Transponders, License Plate Recognition, Bluetooth, among others.
For instance, [23] conducted studies of dynamic estimates of O-D matrices based on Bluetooth Traffic Monitoring; in their investigation by means of a computational simulation in which the Kalman filter was applied, an O-D matrix was generated thanks to the tracking of bluetooth device. In their results they found that in cases where the analysis intervals are very long, the accuracy of the estimation of the O-D matrix can vary. In contrast, [24] conducted a study for the estimation of O-D matrices through the analysis of Data from the Cellular Network; the results of this study were satisfactory, since valuable O-D matrices could be obtained. In the results was noted that a factor of great importance is the time in which the cell receives and/or sends data, since it is at this moment when the location of the vehicle is obtained.

III. CONCLUSIONS It is observed, thanks to the previous information, that at
present it is of great importance that a city has an adequate traffic control system, in order to reduce the delays caused by congestion, which may even affect economic aspects. That is why, there is a need to continue investigating methods that allow the estimation of high quality O-D matrices. However, future researches must take into account the observations made by each author, so that these investigations are closer to an optimal solution to the problem. Consequently, we intend to carry out a research in which the use of RFID technology was considered as a basis for obtaining information. Where this information will later be used to estimate an O-D matrix, which allows obtaining patterns of movement in an urban network with high precision. This precision will be obtained by taking into account the most suitable locations for installation of the RFID system, in such a way that the error in the matrix, the installation cost of the system, and the invasion of users' privacy are reduced. For the verification of the investigation, a case study will be made in the Querétaro Metropolitan Area. In this way it will be possible to verify that the elements that will be considered during the investigation generate the expected result. Therefore, this result is the determination of an algorithm that allows locating RFID readers in an urban road infrastructure network, which in turn supply the input data for O-D matrix estimation with 80% accuracy.
ACKNOWLEDGMENT The authors thank the Autonomous University of Querétaro,
the National Council of Science and Technology, and the reviewers who provided valuable suggestions and comments on an earlier version of the document.
REFERENCES [1] Tapia, J. (1998). La reducción del tráfico de automóviles: una política
urgente de promoción de la salud. Panam Salud Publica/Pan Am J Public Health, 3 (3), pp. 137-151.
[2] Thomson, I. y Bull, A. (2002). La congestion del tránsito urbano: causas y consecuencias económicas y sociales. Revista de la Cepal, 76, pp. 109-121.
[3] Kerner, B. (2009). The Physics of Traffic. Empirical Freeway Patter Features, Engineering Applications, and Theory. Springer. (688 páginas) ISBN: 978-3-642-05850-9.
[4] Hamad, K. y Kikuchi, S. (2002). Developing a Measure of Traffic Congestion: Fuzzy Inference Approach. Transportation Research Record, 1802, pp. 77-85.
[5] Dorado, M. (2014). Simulación de un agente enrutador de vehículos a través de un sistema basado en tiempos de viaje (Tesis de Maestria). Universidad Autónoma de Querétaro. Querétaro, México.
[6] Lomax, T. (1997) Quantifying Congestion. National Academy Press. pp. 38.
[7] Weisbrod, G., Vary, D. y Treyz G. (2003). Measuring the Economic Costs of Urban Traffic Congestion to Business. Transportation Research Record, 1839, pp. 98-106.
[8] Verastegui, D. (2012). Estimación de Matrices Origen-Destino y Calibración de Parámetros en el Problema de Asignación de Tráfico en Redes Congestionadas (Tesis Doctoral). Universidad Castilla-La Mancha. Ciudad Real, España.
[9] Djukic, T. (2014). Dynamic OD Demand Estimation and Prediction for Dynamic Traffic Management. TRAIL Thesis Series, 9. (138 páginas) ISBN: 978-90-5584-179-0.
[10] Calabrese, F., Di Lorenzo, G., Liu, L. y Ratti. C. (2011). Estimating Origin-Destination Flows Using Mobile Phone Location Data. Institute of Electrical and Electronics Engineers, 10 (4), pp. 36-44.
[11] Munizaga, M. y Palma, C. (2012). Estimation of a disaggregate multimodal public transport Origin–Destination matrix from passive smartcard data from Santiago, Chile. Transportation Research Part C, 24, pp. 9-18.
[12] Zhou, X. y Mahmassani, H. (2006). Dynamic Origin–Destination Demand Estimation Using Automatic Vehicle Identification Data. IEEE Transactions on Intelligent Transportation Systems, 7 (1), pp. 105-114.
[13] Hagen, L., Zhou, H. y Pirinccioglu, F. (2006). Development of Revised Methodology for Collecting Origin-Destination Data (Reporte Técnico No. FDOT: BD 544-30). Colegio de Ingeniería, Universidad del Sur de Florida. Tampa, Estados Unidos.
[14] Lam, W. y Lo, H. (1990). Accuracy of O-D estimates from traffic counts. Traffic Engineering and Control, 31, pp. 358-367.
[15] Yang, H. y Zhou, J. (1998). Optimal Traffic Counting Locations for Origin-Destination Matrix Estimation. Transportation Research Part B, 32(2), pp. 109-126.
[16] Ma, G., Li, P. y Yao, Y. (2006). Research on Location of Trafic Couning Points or Estimating Origin-Destintion Matrix. 6th Intermational Coference on ITS Teleconnnunications Proceedings. Chengdu, China.
[17] Chen, A., Pravinvongvuth, S., Chootinan, P., Lee, M. y Recker, W. (2007). Strategies for Selecting Additional Traffic Counts for Improving O-D Trip Table Estimation. Transportmetrica, 3(3), pp. 191-21.
[18] Chiou, Y., Lan, L., Tseng, C. y Fan, C. (2012). Optimal Locations of License Plate Recognition to Enhance the Origin-Destination Matrix Estimation. Asian Transport Studies, 2(1), pp. 80-92.
[19] Khliefat, I. y Shatnawi, I. (2017). An Optimization of Bluetooth Sensor Locations for Origin-Destination in an Urban Network. Journal of Transportation Technologies, 7, pp. 367-375.
[20] Antoniou, C., Ben-Akiva, M. y Koutsopoulos, H. (2004). Incorporating Automated Vehicle Identification Data into Origin–Destination Estimation. Transportation Research Record: Journal of the Transportation Research Board, 1882, pp. 37-44.
[21] Van Der Zijpp, N. (2014). Dynamic Origin-Destination Matrix Estimation from Traffic Counts and Automated Vehicle Identification Data. Transportation Research Record, 1607, pp. 87-94.
[22] Bernstein, D. y Kanaan, A. (1993). Automatic Vehicle Identification: Technologies and Functionalities. IVHS Journal: Technology, Planning, and Operations, 1(2), pp. 191-204.
[23] Barceló, J., Montero, L., Marqués, L. y Carmona, C. (2010). Travel Time Forecasting and Dynamic Origin–Destination Estimation for Freeways Based on Bluetooth Traffic Monitoring. Transportation Research Record: Journal of the Transportation Research Board, 2175, pp. 19-27.
[24] Mellegård, E., Moritz, S. y Zahoor, M. (2011). Origin/Destination-estimation using cellular network data. 11th IEEE International Conference on Data Mining Workshops. Vancouver, Canada.
Modeling greenhouses microclimates by system
dynamics
A. Escamilla-García, G.M. Soto-Zarazúa, I. Parola-Contreras, A. Jarro-Castañeda Facultad de Ingeniería, Universidad Autónoma de Querétaro
Querétaro, México [email protected]
Abstract— Two important tools that provide the ability to predict crop yields and to control the microclimate of greenhouses are modeling and simulation. However, the greenhouse as a system, is in interaction with many variables that need to be considered. That´s why, in this work, the dynamics of systems is presented like a viable methodology for modeling the microclimate of the greenhouses.
Keywords— dynamic modeling; system dynamics; microclimate control; greenhouse; methodology
I. INTRODUCTION The main direction in the activity of greenhouse production
is to replenish the market by fresh vegetables and greens during the whole year. As practice has shown, this production is expensive, power consuming, and requires compliance with the technology of growing vegetables. Climate maintenance in greenhouses is one of the priority problems since even despite good genetic properties of crops, the quality of fertilizers and soil, incorrect maintenance of temperature humidity mode of the greenhouse and poor dosing by the carbon dioxide may result in a considerable drop in productivity up to the loss of crops and, consequently to million strong losses [1].
The dynamic behavior of microclimate is a combination of physical processes involving energy transfer (radiation and heat) and mass balance (water vapor fluxes and CO2 concentration). These processes depend on the outside environmental conditions, structure of the greenhouse, type and state of the crop and on the effect of the control actuators (typically ventilation and heating to modify inside temperature and humidity conditions, shading and artificial light to change internal radiation, CO2 injection to influence photosynthesis and fogging/cooling for humidity enrichment) [2].
Modeling and simulation offer a powerful option for planning and decision-making that influence cost reduction and increase crop yield in greenhouses. The microclimate control models allow the development of the agroclimatic conditions of a greenhouse considering the elements that take part in the growth of a specific crop [3].
System dynamics have been applied in several areas. In turn, this methodology is based on a systemic approach, which is a process of thinking about systems, that is, emphasizes the relationships between the parts of the system. It is also a modeling tool due to its rigorous approach in capturing interrelations between variables and handling dynamic aspects of system behavior [4]. It is for this reason that the methodology under which the modeling of microclimate control of a greenhouse is proposed to revolve around the systems dynamics, methodology proposed by [5].
II. MODELING GREENHOUSES MICROCLIMATES Greenhouse presents two problems that limit the expansion
of this cultivation method, first the primary climate variables include temperature, humidity, CO2 concentration, and light intensity at the plant level [6]. Second, the excessive energy cost mainly due to the use of various controlled actuators such as ventilation system, heating system, humidification system, and cooling system which make the greenhouse a large consumer of energy and imply the increase of the cost of production [7].
The actuators for greenhouse climate control are usually controlled by the greenhouse process control computer. Those control systems are developed rather detached from general building control and are a domain on their own. Most of control rules in the process control computer are heuristic rules based on the experience of the growers and suppliers [6]. Dynamic simulation models use systems analysis techniques for model development. Systems analysis is a procedure for the planning, design, evaluation, study or management of large-scale systems. Systems analysis integrates the methods of synthesis and analysis used by various engineering disciplines and incorporates them into a procedure. Dynamic modeling is a crucial element for the development and elaboration of modeling greenhouses microclimate, as well as for the modeling of crop growth [3].
III. SYSTEM DYNAMICS Systems analysis is a procedure for the planning, design,
evaluation, study or management of large-scale systems. Systems analysis integrates the methods of synthesis and analysis used by various engineering disciplines and incorporates them into a procedure. In many cases, computers oversee integrating these elements. The integration of the elements is itself the modeling process Therefore; a model is a map of a system. Models can be static or dynamic. A static model is one whose output keeps with time or where time is not a variable. However, a dynamic model is one whose output varies over time and in which processes are characterized. The system dynamics facilitate the learning of complex systems through formal models and simulation methods. The difference, with other methods, is the study of feedback systems. A model based on the system dynamics can be said to be structured by policies in interaction, being understood by politics the representation of the causes of an action, since the very nature of the dynamical feedback structure of the systems tends to lead erroneously to actions that are ineffective and even counterproductive to the efficient functioning of the system [8]. The interaction of dynamic modeling with experimental research in agriculture allows for a large expansion of a scientific view of complex biological systems and guides experimental research in fruitful areas with great benefits. Dynamic simulation models use systems analysis techniques for model development. The characterization of the processes in a dynamic model consists in knowing and defining the state variables. The state variables are those necessary to define the state of the system at a point in time [9].
IV. SYSTEM DYNAMIC IN MODELING GREENHOUSE MICROCLIMATES
The greenhouse system is complex and can be divided into three main components that interact in a strong way: the internal atmosphere, the crop and the soil. The behavior of the whole system depends of these interactions, but also of the external climate and the actions that are exerted on the components of the system through the climate control. The main objective of the climate control problem is to maintain the variables that define the interior environment of the greenhouse within suitable ranges. The difficulty lies in the complexity of the phenomena that condition the ideal environment, the greenhouse system is considered as non-linear, multivariate, non-stationary and open to the external environment, that is, it is dynamic [7].
For the initial phase of dynamic model generation, is necessary to identify all of parameters that affect climate, such as temperature and humidity conditions, shading and artificial light to change internal radiation, CO2 injection to influence photosynthesis and fogging/cooling for humidity enrichment.
In addition, in this phase the limits of the study system are identified and established, as well as the different subsystems that interact in it, indicating the elements that belong to it and which are excluding it, that is, what is the scope and area of influence of the system and what elements are necessary to represent the situation or problem under study.
The next step for the modeling of greenhouses, is the conceptualization, in which the graphic representation of the problem to be solved is made (influence maps), which allows identifying the facts of the phenomenon and linking them to each other through influence, representing each event through a set of interconnected variables, thus allowing to generate behavioral relationships.
A behavioral relationship is the narration of the effect of one variable on another variable, as well as the result of that influence. In this step, the limits of the model should be fine-tuned using causal diagrams and graphs of behavior variables over time. Next, the representation or formulation of the model must be carried out, which consists in generating the dynamic model since for this point a structured model has been conceptualized, as well as its representation through an influences map also called cause-effect diagram. Following this, the representation is made of the causal diagram in a simulation model that can be interpreted by some programming language, generally the interpretation of the cause-effect diagram goes to a Forrester diagram.
Finally, to conclude the dynamic modeling, the units and the mathematical relationships that represent each of the variables in the Forrester diagram will be identified.
It is fundamental to consider that a variable that affects another variable can only be related to each other provided that the unit that represents it is coherent with each other; if it does not deal with this aspect, the behavior of the variables in the dynamic model will not simulate the reality of the problem. For each of the variables of the Forrester diagram in the simulation, equations, percentages and arithmetic units will be supplied.
Before the simulation, an evaluation of the model will be carried out, which consists of conducting sensitivity tests and evaluating the model by simulating the mathematical model using programming software.
The results obtained from the evaluation of the dynamic model allow refining and analyzing the variables and their behavior in the simulation when compared with the real historical data of the problem being analyzed. This to generate the scenario that will allow the analysis of validation and verification of the dynamic model. In addition, it is expected that the dynamic model is ready to be tested with the formulation of scenarios for decision making.
Once the dynamic model offers consistent results of the problem under study, it will be possible to visualize scenarios through the definition or redefinition of policies that affect the behavior of the variables in the system.
The modeling process is showed in Fid, 1. This process is presented in two dimensions. First dimension can be called "conceptual", which integrates the three primary phases of the project, while the second dimension, "technique", is the part that integrates the modeling tools and the simulation of the dynamic model.

Fig.1 Stages of the system dynamics methodology
In this way, the research will be carried out at the Universidad Autónoma de Querétaro, Faculty of Engineering campus Amazcala, located on the highway to Chichimequillas S / N km. 1, Amazcala, El Marqués, Querétaro.
REFERENCES [1] D.N., Gerasimov and M.V. Lyslova. «Adaptive Control of Microclimate
in Greenhouses» Journal of Computer and Systems Sciences International, vol 53, N° 6, pp- 896-907. 2014.
[2] F. Rodríguez, L.J., Yebra, M. Berenguel, S. Dormido. «Modelling and
simulation of greenhouse climate using dymola» IFAC. Pp. 79-84. 2002
[3] K. Kuma, M. Jha, K. Tiwari and A. Singh, «Modeling and evaluation of greenhouse for floriculture in subtropics,» Energy and Buildings, vol. 42, pp. 1075-1083, 2010.
[4] Y. Ho, «Application of a system dynamics model to improve the performance of make-to-order production,» South African Journal of Industrial Engineering, vol. 26, nº 2, pp. 115-127, 2015.
[5] J. W. Forrester, Industrial dynamics, Cambridge, MA: MIT Press, 1961. [6] P.J.M. van Beveren, J. Bontsema, G. van Starten, E.J. van Henten.
«Optimal control of greenhouse climate using minimal energy and grower defined bounds» Applied Energy 159. Pp. 509–519. 2015
[7] A. Maher, Kamel, E., Enrico, F., Atif, I., Abdelkader, M. «An intelligent system for the climate control and energy savings in agricultural greenhouses». Energy Efficiency. 9 pp. 1241–1255. 2016.
[8]
P. Velásquez-Restrepo, A. Rodriguez-Quintero and J. Jaén-Posada, «Metodologías cuantitativas para la optimización del servicio de urgencias: una revisión de la literatura,» Rev. Gerenc. Polit. Salud, Bogotá (Colombia), vol. 10, nº 21, pp. 196-218, 2011.
[9] J. McKinion, «Dynamic simulation: A positive feedback mechanism for experimental research in the biological sciences,» Agricultural Systems, vol. 5, pp. 239-250, 1980.
Arsenic adsorption using iron oxide nanoparticles supported on a mesoporous SBA-15 matrix
Viviana Palos-Barba; Rufino Nava-Mendoza División de Investigación y Posgrado, Facultad de Ingeniería, Universidad Autónoma de Querétaro (UAQ)
Cerro de las Campanas s/n C.P. 76000 Querétaro, Qro. México [email protected]
Abstract— The influence of the incorporation of iron oxide Fe2O3 nanoparticles in the Santa Barbara Amorphous-15 SBA-15 mesoporous on the arsenic (III) and (V) adsorption in aqueous solution will be studied. The SBA-15 material will be synthesized by sol-gel process using tetraethyl orthosilicate (TEOS) as the silica precursor and Pluronic P123 surfactant as the mesostructure shape-directing agent. The incorporation of Fe2O3 nanoparticles into the internal surface from the SBA-15 pores will be made through the pore-filling impregnation method, using iron (III) nitrate as Fe2O3 source. In order to find the optimal concentration of Fe2O3, it will be incorporated in different concentrations (wt%). The adsorbents will be characterized using N2 77 K adsorption-desorption isotherms, X-ray diffraction (XRD), ultraviolet-visible spectroscopy (UV-Vis), micro-Raman spectroscopy and scanning and transmission electron microscopy (SEM and TEM). A proper characterization of these materials will help in the understanding of the kind of interaction between the iron oxide nanoparticles (active adsorption centers) from the mesoporous Fe2O3/SBA-15 material and the arsenic ions during de adsorption process to propose an adsorption model.
Keywords—SBA-15; mesoporous; arsenic; adsorption; iron oxide
I. INTRODUCTION Arsenic is a widely distributed metalloid throughout the
world. This element can exist naturally in soils and groundwater, but anthropogenic sources have raised its concentration in water bodies, severely affecting human health. Inorganic species make it highly contaminant, mainly with its trivalent As (III) and pentavalent As (V) forms [1]. Multiple countries around the world, including México, face severe health problems related to high amounts of arsenic on drinking-water. Therefore, the World Health Organization has stablished 0.01 mg/L as the maximum concentration limit for arsenic in water bodies. Despite this, México adjusted its limit since 2005 only to 0.025 mg/L [2]. Exposure to arsenic can cause skin problems, neuronal damage and to promote different kinds of cancer [3]. There are several techniques for arsenic removal from water, such as oxidative processes, coagulation-precipitation, filtration and adsorption [4–7]. However, the adsorption method using nanostructured materials became a good alternative due to its efficiency and low cost [8]. Likewise, the convenient textural
properties, high surface areas and ideal pore volumes and sizes of porous materials are a suitable choice for heavy metals ions removal from wastewaters through the adsorption technique [9,10]. By choosing a proper functional group, nanoparticles can be incorporated into the porous materials to achieve the adsorption. In this proposal, iron oxide Fe2O3 nanoparticles are going to be scattered throughout the internal surface of the SBA-15 mesopores to reach a high adsorption capacity.
II. EXPERIMENTAL
A. Mesoporous silica synthesis The material is prepared by a sol-gel process according to
[11] as shown in Fig. 1. First, a solution is made dissolving the surfactant Pluronic P123 as a template with a 4 M hydrochloric acid aqueous solution HCl, Then, tetraethyl orthosilicate TEOS is added dropwise as the silica precursor and the mixture is stirred at room temperature until a clear solution is obtained. The solution was kept at 35°C with stirring for 24 hours and then transferred to an oven at 80°C for 24 hours to let it age. The product is filtered, washed and dried at 110°C for 18 h and then calcined at 550°C for 4 hours.
B. Iron oxide Fe2O3 incorporation A pore-filling impregnation method will be used to
incorporate iron oxide nanoparticles into the SBA-15 support material. The source of the iron oxide solutions will be iron (III) chloride hexahydrate FeCl3•6H2O. The Fe2O3 loadings will vary in a weight percentage. Then, the impregnated samples will let dry at 110°C for 18 h and calcine at 500°C for 4 h.
C. Characterization of the mesoporous support material In order to determine the SBA-15 textural properties
nitrogen physisorption studies will be performed at 77 K BET using a Quantachrome Autosorb-IQ2 surface area analyzer. These studies will give information about the pore size and volume and the surface area of the material. The morphology will be analyzed through Scanning Electron Microscopy SEM and Transmission Electron Microscopy TEM with a JEOL HRTEM with the support of the Catalysis and Petrochemisty Institute from the Superior Counseling for Scientific Investigations from Madrid, Spain.

D. Characterization of the adsorbent Micro-Raman spectra will be acquired to detect the iron
oxide presence on the mesoporous silica SBA-15 with a Labram-Dior device. The electronic transitions from de Fe2O3 will be analyzed through Ultraviolet-Visible spectroscopy UV-Vis with a Cary 5000 instrument. X-Ray Diffraction XRD patterns will be recorded to learn about the adsorbent crystallinity with a D8 Advance Bruker instrument. Finally, X-ray Photoelectron Spectroscopy XPS will be carried out to identify the elemental composition and the chemical species on the support material with a VG ESCALAB 200R from the ICP.
E. Arsenic adsorption In order to estimate the adsorption capacity for the material,
100 ppm arsenic aqueous solutions will be prepared. Different amounts of adsorbent will be added to the mentioned solutions under stirring at room temperature to monitor the contact time for the arsenic adsorption.
III. EXPECTED RESULTS It is expected to obtain a mesoporous material SBA-15 in a
short particle size functionalized with iron oxide nanoparticles. Once the SBA-15 material is obtained, its textural, thermal and structural properties will be analyzed to compare them with the iron oxide functionalized SBA-15 correspondent properties. A proper characterization of these materials will help in the understanding of the kind of interaction between the iron oxide nanoparticles (active adsorption centers) from the mesoporous Fe2O3/SBA-15 material and the arsenic ions during de adsorption process to propose an adsorption model.
REFERENCES
[1] J.Y. Chung, S. Do Yu, Y.S. Hong, Environmental source of arsenic exposure, J. Prev. Med. Public Heal. 47 (2014) 253–257. doi:10.3961/jpmph.14.036.
[2] SSA, Nom-127-SSA1-1994, 2000. [3] J.J. García Salcedo, D. Arellano Pérez-Vertti, M.C. Hernández Serrano,
L.B. Serrano Gallardo, Arsenicismo en el mundo, in: Arsénico. Perspect. Epidemiológica, Ambient. Y Salud, 2016: pp. 29–40.
[4] C. Hu, H. Liu, G. Chen, W.A. Jefferson, J. Qu, As(III) oxidation by active chlorine and subsequent removal of As(V) by Al 13 polymer coagulation using a novel dual function reagent, Environ. Sci. Technol. 46 (2012) 6776–6782. doi:10.1021/es203917g.
[5] R. Singh, S. Singh, P. Parihar, V.P. Singh, S.M. Prasad, Arsenic contamination, consequences and remediation techniques: A review, Ecotoxicol. Environ. Saf. 112 (2015) 247–270. doi:10.1016/j.ecoenv.2014.10.009.
[6] J. Iqbal, H.J. Kim, J.S. Yang, K. Baek, J.W. Yang, Removal of arsenic from groundwater by micellar-enhanced ultrafiltration (MEUF), Chemosphere. 66 (2007) 970–976. doi:10.1016/j.chemosphere.2006.06.005.
[7] D. Mohan, C.U. Pittman, Arsenic removal from water/wastewater using adsorbents-A critical review, J. Hazard. Mater. 142 (2007) 1–53. doi:10.1016/j.jhazmat.2007.01.006.
[8] M. Habuda-Stanić, M. Nujić, Arsenic removal by nanoparticles: a review, Environ. Sci. Pollut. Res. 22 (2015) 8094–8123. doi:10.1007/s11356-015-4307-z.
[9] P. Munnik, P.E. De Jongh, K.P. De Jong, Recent Developments in the Synthesis of Supported Catalysts, Chem. Rev. 115 (2015) 6687–6718. doi:10.1021/cr500486u.
[10] L.F. Giraldo, B.L. López, L. Pérez, S. Urrego, L. Sierra, M. Mesa, Mesoporous silica applications, Macromol. Symp. 258 (2007) 129–141. doi:10.1002/masy.200751215.
[11] K. Flodström, V. Alfredsson, Influence of the block length of triblock copolymers on the formation of mesoporous silica, Microporous Mesoporous Mater. 59 (2003) 167–176. doi:10.1016/S1387-1811(03)00308-1.
Figura 1. Synthesis procedure for the SBA-15 support
GROUND RUBBER IN ASPHALT MIXES ADVANTAGES OF ITS USE AS MODIFIER OF ASPHALT MIXTURES
Bocanegra Martínez Daniela Master’s degree student, Faculty of Engineering
Universidad Autónoma de Querétaro Querétaro, México
daning28bm @gmail.com
Dr. Alarcón Ibarra Jorge1, Dra. Pérez Rea María de la Luz2
Universidad Michoacana de San Nicolás de Hidalgo, [email protected];
Universidad Autónoma de Querétaro, [email protected]
Abstract- Conventional asphalt mixtures have suitable mechanical properties for certain traffic and temperature conditions, however, the increase in traffic volumes and the susceptibility of asphalt to temperature changes, cause that its performance became insufficient in relation to viscosity and fragility of the pavement, from there the need to modify asphalts, with the purpose of achieving a better performance of the mixtures.
Research carried out affirm that through the addition of ground rubber from tires out of use, a change in the performance of the asphalt is achieved, making it more stable and less deformable; also improving the fatigue behavior of the mixtures and thus increase the useful life of the pavements.
Keywords-ground rubber; modified asphalt; fatigue.
I. INTRODUCTION The repeated action of traffic loads causes structural damage
to the pavements reflected in the form of cracking due to fatigue and permanent deformation. In addition to the passage of traffic, temperature and humidity are factors that also affect the behavior of the pavement.
The phenomenon of fatigue and thermal cracking is caused, for example, by climatic changes. When microcracks appear in the surface layer, they can not be repaired by themselves, but, on the contrary, they propagate forming the so-called crocodile skin. The damage process can be accelerated if there is detachment of aggregate or asphalt from the surface of the pavement as a result of the friction generated by the passage of vehicles. Added to the above, the penetration of water in the cracks would lead to irreversible failure of the layer.
The wear and tear of pavements is often due to the gradual increase in traffic volumes observed in the roads and the magnitude of vehicle loads, so the fundamental objective for public administration is to improve performance and increase the useful life of the tracks. Although one way to achieve this is to use high quality raw materials, an alternative to improve the performance of an asphalt mix is the implementation of ground rubber from tires out of use tires (NFU, by its initials in Spanish).
The incorporation of ground rubber to asphalt, modifies its rheological properties and improves its performance as road material [1]; improves the mechanical and functional properties of asphalt mixtures under loads derived from traffic. The modification of the asphalt with ground rubber gives resistance
to climatic changes and also manages to reduce the fatigue fracturing of the mixture.
Besides the properties that the rubber gives to the asphalt mixtures, its use has been a viable alternative to reduce the environmental problems caused by the deposits of used tires. The asphalt industry can use NFUs that can not be recycled as tires, but used as a tire dust for the modification of asphalts.
The extent to which the improvements in the characteristics provided by the rubber to the mixture are achieved will depend on the incorporation technique used for the rubber, the type of mixture and its situation on the pavement.
II. STATE OF ART A bibliographic review is presented about topics related to
the modification of asphalt with ground rubber coming from NFU and the characteristics that it contributes to the mixtures used in paving. The above works as a reference for the methods exposed in this investigation.
It begins with the properties and procedures of incorporation of rubber, the fatigue phenomenon and the advantages of the use of rubber in asphalt mixtures.
III. INCORPORATION OF THE RUBBER TO THE ASPHALT MIXTURE There are two traditional ways of adding rubber to a mixture,
these are: wet and dry.
The first one refers to the addition of rubber to the asphalt in a previous way, while, in the dry way, the rubber dust is incorporated as if it were a stone aggregate.
A. Wet way Reference [2] states that the process for the manufacture of wet asphalt mixtures is normally carried out in mobile units, consisting of a rubber feed hopper and two tanks that have the function of storing and carrying out the mixing process.
In the first instance, the rubber powder is mixed with the asphalt in a first tank after being weighed. In this step it is important to keep the asphalt in agitation to conserve the dispersed rubber dust, otherwise it will decant in the tank.
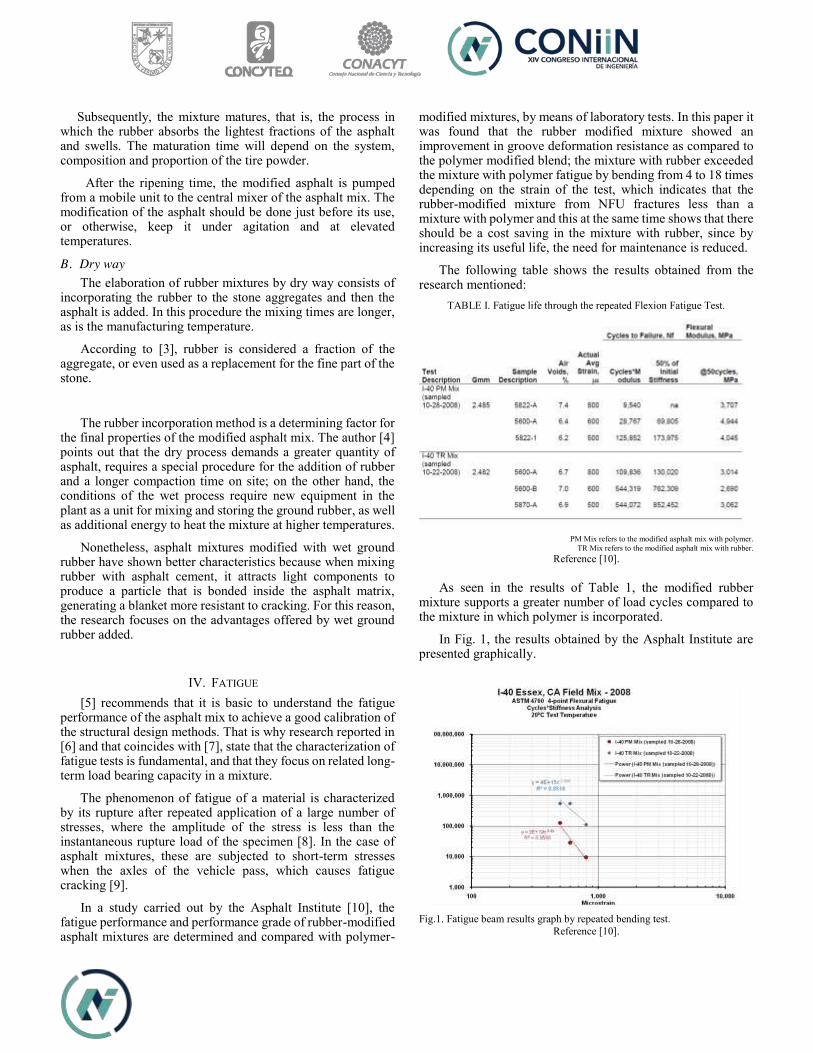
Subsequently, the mixture matures, that is, the process in which the rubber absorbs the lightest fractions of the asphalt and swells. The maturation time will depend on the system, composition and proportion of the tire powder.
After the ripening time, the modified asphalt is pumped from a mobile unit to the central mixer of the asphalt mix. The modification of the asphalt should be done just before its use, or otherwise, keep it under agitation and at elevated temperatures.
B. Dry way The elaboration of rubber mixtures by dry way consists of incorporating the rubber to the stone aggregates and then the asphalt is added. In this procedure the mixing times are longer, as is the manufacturing temperature.
According to [3], rubber is considered a fraction of the aggregate, or even used as a replacement for the fine part of the stone.
The rubber incorporation method is a determining factor for the final properties of the modified asphalt mix. The author [4] points out that the dry process demands a greater quantity of asphalt, requires a special procedure for the addition of rubber and a longer compaction time on site; on the other hand, the conditions of the wet process require new equipment in the plant as a unit for mixing and storing the ground rubber, as well as additional energy to heat the mixture at higher temperatures.
Nonetheless, asphalt mixtures modified with wet ground rubber have shown better characteristics because when mixing rubber with asphalt cement, it attracts light components to produce a particle that is bonded inside the asphalt matrix, generating a blanket more resistant to cracking. For this reason, the research focuses on the advantages offered by wet ground rubber added.
IV. FATIGUE [5] recommends that it is basic to understand the fatigue performance of the asphalt mix to achieve a good calibration of the structural design methods. That is why research reported in [6] and that coincides with [7], state that the characterization of fatigue tests is fundamental, and that they focus on related long-term load bearing capacity in a mixture.
The phenomenon of fatigue of a material is characterized by its rupture after repeated application of a large number of stresses, where the amplitude of the stress is less than the instantaneous rupture load of the specimen [8]. In the case of asphalt mixtures, these are subjected to short-term stresses when the axles of the vehicle pass, which causes fatigue cracking [9].
In a study carried out by the Asphalt Institute [10], the fatigue performance and performance grade of rubber-modified asphalt mixtures are determined and compared with polymer-
modified mixtures, by means of laboratory tests. In this paper it was found that the rubber modified mixture showed an improvement in groove deformation resistance as compared to the polymer modified blend; the mixture with rubber exceeded the mixture with polymer fatigue by bending from 4 to 18 times depending on the strain of the test, which indicates that the rubber-modified mixture from NFU fractures less than a mixture with polymer and this at the same time shows that there should be a cost saving in the mixture with rubber, since by increasing its useful life, the need for maintenance is reduced.
The following table shows the results obtained from the research mentioned:
TABLE I. Fatigue life through the repeated Flexion Fatigue Test.
PM Mix refers to the modified asphalt mix with polymer.
TR Mix refers to the modified asphalt mix with rubber. Reference [10].
As seen in the results of Table 1, the modified rubber mixture supports a greater number of load cycles compared to the mixture in which polymer is incorporated.
In Fig. 1, the results obtained by the Asphalt Institute are presented graphically.
Fig.1. Fatigue beam results graph by repeated bending test.
Reference [10].

Although it would be convenient to add specimens tested in this study to improve the accuracy of the test, a clear adaptation of the data is shown for the samples tested, with which it is possible to conclude that the mixture containing rubber is more flexible and less brittle than the one to which polymer is added. It is essential to continue with studies of the behavior of ground rubber in asphalt mixtures, because despite knowing the contributions that it can give, there is not much reference to its use with Mexican asphalts. In this sense, it is necessary to continue with investigations that justify the investment of incorporating rubber in the best way and demonstrate its operation with products of the country and through fatigue tests that allow us to quantify the possible increase in the useful life of the pavements.
V. CONCLUSIONS It has been demonstrated that the incorporation of rubber to
asphalt improves the thermal susceptibility and its rheological characteristics, providing an asphalt cement not at high temperatures nor at fragile at low temperatures.
The binders modified with rubber tire outperform the conventional products, however, a record of their behavior through laboratory tests is limited to fully justify this trend; that is why it is necessary to extend its analysis to studies that demonstrate its performance to be applied in the field and to determine with greater precision the benefit that the incorporation of rubber contributes in the design of asphalt mixtures for flexible pavements.
ACKNOWLEDGEMENT It is fair to mention gratitude to the National Council of
Science and Technology (CONACYT) for the financial support for my postgraduate studies, as well as to the Autonomous University of Querétaro for allowing me to develop research within their community.
REFERENCES [1] Centro de Estudios y Experimentación de Obras Públicas. (2007). Manual
de empleo de caucho de NFU en mezclas bituminosas. España: Ministerio de Fomento, Ministerio de Medio Ambiente.
[2] Trujillo-Valladolid, M. (2015). Evaluación de la Energía de Fractura en Mezclas Asfálticas con Caucho. México, D.F.: Tesis maestría: UNAM .
[3] Rodrígez-Talavera, R.,Castaño-Meneses, V. M., Martínez-Madrid, M. y Hernández-Padrón, G. (2001). Desarrollo de aditivos para asfaltos modificados con bajos contenidos de hule. Sanfandila, Querétaro: IMT.
[4] Alcaldía mayor de Bogotá D.C., “Estudio de las mejoras mecánicas de mezclas asfálticas con desechos de llantas” p. 303, Universidad de los Andes, Bogotá, 2002.
[5] Leiva, F. (2003). Modelación mecanística para agrietamiento por fatiga de carpetas asfálticas con bases granulares. Costa Rica: LANAMME, UCR.
[6] Koh, C. L. (2009). Development of a Dog-Bone Direct Tension Test (DBDT) for asphalt concrete. Advanced Testing and Characterization of Bituminous Materials, Vol. 1, 585-596.
[7] Valdés, G., Pérez-Jiménez, F., Miró, R., Martínez, A. y Botella, R. (2009). Development of a New Test Procedure for Evaluating Cracking Resistance in Bituminous Mixtures. XV Congreso Ibero-Latino Americano del Asfalto, (págs. 23-27). Lisboa.
[8] Lefeuvre, Y. (2001). Contribution à l'étude du comportement en fatigue des enrobés bitumineux: Étude de lállongement des éprovettes comme manifestation de léndommagement diffus, Expérimentation Modélisation. Paris: Tesis maestría: École nationale des ponts et chaussées.
[9] Flores-Flores, M., Delgado-Alamilla, H., Garnica-Anguas, P. y García, E. (2013). Determinación de la resistencia a la fatiga en mezclas asfálticas. Congreso Mexicano del Asfalto (pág. 14). AMAAC.
[10] Phillip B. Blankenship, “Project:Essex, CA, I-40 19.0mm NAMAS mixture. Compare polymer (PM) mixture to Tire Rubber (TR) terminal blend mixture”. Summary Report of PG64-28TR and PG64-28PM. Asphalt Institute: 2009.
Current trends in alternative feed sources for fish culture
Valeria Caltzontzin-Rabell, Juan Fernando García-Trejo, María de la Luz Sánchez-Estrada, Ruth Chávez-Jaime.
División de Investigación y Posgrado de la Facultad de Ingeniería. Universidad Autónoma de Querétaro, Campus Amazcala. Carretera a Chichimequillas s/n Km 1, Amazcala, el Marqués, Querétaro, 76265. Corresponding author:
Abstract— The global aquaculture production has drastically increased, and this trend suggests that this will continue in the future. This growth causes an increase in the demand of aquaculture feeds, and currently, problems in formulation, a decline in catches of wild fish and the price increase of fishmeal and fish oil result in an increase of feed prices. Because these represent 40–70% of the cost of the fish production the search for sustainable alternatives for aquaculture feeds is needed and must meet the necessary requirements: have a lower price and similar nutritional qualities. This article reviews the published results of experiments using alternative feed sources for fish. Microalgae and black soldier fly larvae are proposed to be included in tilapia diets in order to obtain a balanced aquaculture feed.
Keywords—aquaculture, alternative feeds, microalgae, black soldier fly larvae.
I. INTRODUCTION In the last five decades, an increase in world fish production
has been reported, whereas in 1974 aquaculture provided only 7% for human consumption, by 2004 it had already increased to 39% [1]. This growth also causes an increase in the demand of aquaculture feeds. Problems in formulation, a decline in catches of wild fish and the price increase of fishmeal (FM) and fish oil (FO) result in an increase of feed prices [2]. Because these represent 40–70% of the cost of the fish production [3,4] the search for sustainable alternatives for aquaculture feeds is needed and must meet the necessary requirements: have a lower price and similar nutritional qualities [2].
Protein is one of the principal components of animal tissues and therefore, it is an essential nutrient for animals. Fish need it for maintenance and growth, principally for generating new tissue; since they are limited to synthetize proteins from carbon skeletons, the implementation in the diet becomes vital [5].
The nutritive needs of fish, include a high quality and quantity of protein in their diet and it has been reported that the average dietary requirement for fish is between 30-60% [5]. To achieve a balanced nutrition, protein sources must have a high-protein content, an adequate amino acid profile (arginine, histidine, isoleucine, leucine, lysine, methionine, phenylalanine, threonine, tryptophan, and valine), high digestibility, good palatability and no anti-nutritional factors [6,7].
Aquaculture feeds are principally made of fishmeal and soy meal. Fishmeal (from whole fish) is a high-quality protein
source, it is a rich source of energy, minerals and is highly digestible and palatable to most fish [5]. Because its rising demand, it has been produced from fish by-products (wastes from fish processing) that were previously discarded. This affects the composition and quality of the fishmeal, giving it a lower protein percentage and has to be used carefully since it has more ashes that can produce mineral imbalances. About 35% of world fishmeal production was obtained from fish residues in 2012 [2].
Soybean meal has a high digestibility, high quality and quantity of protein, also has one of the best amino acid profiles of all protein-rich plant feedstuffs for meeting most of the essential amino acid requirements of fish. However, vegetable sources should be used partially due to low palatability, high portion of fiber and deficiency in certain amino acids, also their cultivation compete directly with human alimentation [8].
In addition to these limitations, there are some environmental issues. Soy cultivation causes the deforestation, high water consumption and use of pesticides. Fishmeal depends on the catch, and this affects the production, making it variable and continuously increasing its price [9].
The present article aims to review the published results of experiments using alternative feed sources for fish.
II. ALTERNATIVE SOURCES a. Cassia fistula
Legume, ornamental and medicinal plant, it is also a shade tree, there is no current production of the seed, but the trees are often found on the streets of warm countries [10]. Its main composition is Nitrogen Free Extract (505.32 ± 66.73 g kg-1 dry matter) and crude protein (257.05 ± 5.73 g kg-1 dry matter) giving this source profitable characteristics [11].
• Inclusion in aquaculture. Cassia fistula seed meal (CFSM) was included in the diets
of Oreochromis niloticus fingerlings. To obtain the CFSM the seeds were roasted in order to reduce moisture and reduce anti-nutrients, then milled and blended with other ingredients. Five diets were formulated with different quantities of the meal (0, 170, 340, 509 and 670 g kg-1). This study showed a growth depression as the portion of the seed inclusion increased in the
diet, which was attributed to high fiber content and the reduced digestibility [11].
There are reports that Cassia fistula seed contains anti-
nutritional factors, like hemagglutinin and phytin that when digested, a part of them bounds to other diet proteins making them difficult to digest [12, 13]. Therefore, this experiment suggests different pretreatments, other than roasting as an option to eliminate this hazards [11].
b. Cocoa husk Cocoa (Theobroma cacao) husk is an agricultural waste
available in cocoa plantations and its main composition is Nitrogen Free Extract (353 g kg-1 dry matter) and crude fiber (334 g kg-1 dry matter) [14].
• Inclusion in aquaculture.
This study evaluated the feed consumption, digestibility and growth of Oreochromis niloticus fingerlings fed with diets containing cocoa husk at two inclusion levels (100 and 200 g kg-1). The husk was milled and mixed with other ingredients. They found that cocoa husk in the diet is acceptable, however, there is a need to improve the low digestibility and poor feed conversion ratios [14].
c. Cereals: maize, wheat and rice
Cereals are great and cheap sources of carbohydrates. In Kenya, the most common among these by-products include maize, wheat and rice brans (MB, WB and RB) [15].
• Inclusion in aquaculture.
There have been some trials using cereals as sources of carbohydrates, however this study, focuses in semi-intensive production. In this experiment, it was found that fish that were fed maize and wheat grew faster than those who were fed with rice brans, also, fish fed with maize grew significantly better than the ones fed with wheat. It was concluded that fish grow better with decreased levels of fiber, regardless the level of dietary protein [15].
Wheat resulted in the source with more profitability and if not available, maize could replace it with higher costs. Another approach would be application of staged feeding strategy [16]. d. Waste date meal (WDM; low-quality date palm, Phoenix
dactylifera L.) Dates grow around the world and when processed, a
substantial amount of total production results inedible. The waste has low quality and usually is rejected and poorly valorized. Its main composition is Nitrogen Free Extract (853.2 g kg-1 dry matter) [17].
• Inclusion in aquaculture.
Four diets including WDM at different proportions were evaluated (0, 100, 200 and 300 g kg-1 dry matter) in Nile tilapia. In this study, they found that final body weight and specific growth rate were statistically not significantly different and that WDM could be a substitute for SBM up to 300 g kg-1 in practical Nile tilapia diets without compromising growth [17]. e. Poultry by-product meal-pet food grade and porcine meal
Animal by-products such as meat and bone meal (MBM) and poultry by-product meal (PBM), have considerable potential as feed ingredients. Their main composition of this sources are Protein (548.0 and 649.0 g kg-1 dry matter respectively), Ash (244.4 and 127 g kg-1 dry matter respectively), and Fat (101.1 and 121.1 g kg-1 dry matter respectively) [18].
• Inclusion in aquaculture. Two diets were tested, including 70% of the base diet and
30% of each ingredient. A highest nutrient digestibility for PBM-PG in comparison with PM was reported and it could be related to bioavailability of amino acids, its higher protein content and that was similar to Fishmeal. It suggests that PBM-PG could replace FM protein in diets for fingerling Nile tilapia without affecting growth performance. However, it is important to mention that in order to achieve comparable growth performance with fishmeal diets, an amino acids supplementation should be made [18].
f. Okara meal
Okara meal (OM) is a residue left from soybean after extraction of the water extractable fraction used to produce soymilk and tofu [19]. About 1.1 kg of fresh OM is produced from every kilogram of soybean processed for soymilk [20]. Since the processing of soybean leaves huge amounts of wastes it could use as feed. Is primarily composed of Protein (349 g kg-1 dry matter), Fiber (206g kg-1 dry matter), and Nitrogen Free Extract (222 g kg-1 dry matter) [21].
• Inclusion in aquaculture. In this study, five diets with different percent replacement
with okara meal were tested (0% - control diet, 25%, 50%, 75% and 100%). Fishmeal protein (18% of the diet) was used as source protein in the control diet. Results revealed that the fish fed diets 0, 25, 50 and 75% had significantly the best average body weight, weight gain, specific growth rate and feed intake compared with diet with 100% substitution, which had the lowest values. Also, it was reported that incorporation of OM in the diets increased significantly whole body fat content, this could be due to an apparent increase in digestibility These findings suggest that up to 75% of FM protein can be replaced by OM protein [21].
g. Rice wine residual
Rice wine is an alcoholic beverage that is widely produced in most Asian countries. Because its development, rice wine

brewing industries have been improving, having consistent availability and nutrition value [22, 23]. Unlike wine, rice wine goes through a process of multiple, parallel fermentations. First, Rice starch is converted to sugar by fungi and at the same time, this sugar is converted to alcohol by yeasts. After separating the liquid, the rice wine residual (RWS) is disposed as waste. This waste contains many nutritious substances, and is primarily composed of Protein (381.2 g kg-1 dry matter), so it can be especially utilized as a protein source [24].
• Inclusion in aquaculture.
To evaluate the inclusion of RWS seven diets were formulated to incorporate 0, 75, 150, 225, 300, 375 or 450 g kg-
1. It was found that growth did not differ significantly. Among all the data and taken together, RWS (at 225 g kg-1) could be used in juvenile Nile tilapia diet without negative effects [24].
h. Protein hydrolysates
As mentioned before, when processing fishes, there are wastes generated that cause environmental pollution [25]. Hydrolysis is a process that has been developed to convert fish wastes into more acceptable forms [26].
• Inclusion in aquaculture. Fish protein hydrolysate is an ingredient that has already
been used in fish feed [27]. In this study, four experimental diets were fed to turbot these diets were made with fish hydrolysate and ultra-filtered fish hydrolysate on growth performance. The hydrolysates of different sizes were produced by enzymatic treatment and size fractionated using ultra-filtration to replace fish meal protein. Fish meal was used in the control diet. Results indicate that a diet containing higher dose of the small molecular weight compounds in fish hydrolysate show the best growth and feed utilization [28].
Other study was made in juvenile red seabream. A basal diet
was used as control and three other diets were made using krill hydrolysate concentrate, shrimp hydrolysate powder or tilapia hydrolysate powder. It was reported that growth performance and feed utilization were significantly higher in the krill and shrimp diets. Also, that supplementation of the hydrolysates at approximately 5%, replacing fish meal by 10%, can improve the growth performance of juvenile red seabream [29].
i. Dry olive cake Olive pomace is a product that remains after oil is extracted
from the olive, it is available thanks to the great tonnages it reaches. This waste has fragments of skin, pulp pieces of kernel and some oil, its main composition is Fiber (231 g kg-1 dry matter) and protein (117.8 g kg-1 dry matter) [30].
• Inclusion in aquaculture. Olive pomace is already used as an alternative source for
animal feed [31]. There are studies on the use of olive pomace
and pomace oil as an oil source for aquaculture feeds [32, 33, 34]. In this study, dry olive cake was included in the diets for juvenile hybrid tilapia (Oreochromis niloticus x Oreochromis aereus). Four diets were prepared including OC at levels of 0, 120, 240 and 360 g kg-1. It was observed that growth performance, digestibility, feed conversion rate and protein efficiency rate decreased with the increase of dietary Olive cake levels. This residue can be incorporated to diets of juvenile hybrid tilapia up to 120 g kg-1 without adverse effects [30].
j. Rubber seed
Rubber seed is a by-product of natural rubber plantation (Hevea brasiliensis). China produces an estimated average of more than 1.13 million tons rubber seeds annually. This quantity is largely wasted [35] and could be used as animal feed due to its composition, which consists primarily of fat (685 g kg-1) and protein (174 g kg-1) [36].
• Inclusion in aquaculture. A feeding trial was made to evaluate the effects of replacing
plant proteins with rubber seed meal (RSM) on juvenile tilapia (Oreochromis niloticus x Oreochromis aereus). Five experimental diets were formulated with 0, 65, 130, 195 and 260 g kg-1 RSM levels. The results indicate that dietary RSM inclusion level up to 195 g kg-1 did not affect the growth and health status of tilapia. Also, inclusion of RSM might result in reduced feed digestibility [37].
k. Corn protein concentrate
Corn protein concentrate (CPC) is a newly manufactured corn protein prepared by enzymatically removing the non-protein components of the corn. This by product consists primarily of 752 g kg-1crude protein and 41 g kg-1 crude fat [38]. It has more protein than common corn gluten meal (600 g kg-
1). CPC has also a strong yellow color as it is made from yellow corn [39].
• Inclusion in aquaculture. Four diets containing 0, 50, 100 and 190 g kg-1 corn protein
concentrate (CPC) as replacement for dietary fish meal were fed to Nile tilapia Oreochromis niloticus fingerlings. The obtained results show that it is possible to replace up to 534 g kg-1 of dietary fish meal using 100 g kg-1 of CPC without any negative effect on fish [39].
l. Freshwater shrimp (Caridina nilotica) and mung
bean (Vigna radiata) meals Mung beans (Vigna radiata) are popular for human
consumption, however in Uganda there is a limited consumption even though it grows well in the area. Freshwater shrimp Caridina nilotica may be a suitable protein source since it is a natural prey of Nile tilapia [40].
• Inclusion of mug beans in animal feed.
Mung beans (Vigna radiata) have been successfully used in diets for broiler chicken [41] and Asian sea bass [42]. Results from a study suggest that V. radiata can partly replace fishmeal in the diets of juvenile Nile tilapia [43].
• Inclusion shrimp in aquaculture. A study suggests that C. nilotica can be used to partially
replace fishmeal in feed for Nile tilapia. The growth of the tilapia was best when C. nilotica replaced partially the FM and better than when FM was the only protein source [44].
• Inclusion shrimp and beans in aquaculture. This study examined the potential of shrimp Caridina
nilotica (CNM), and mung beans, Vigna radiata (VRM), to replace fishmeal (RAF) in fish feeds in East Africa. Six diets were tested on Nile tilapia. The growth performance was best in groups fed diets containing either fishmeal or C. nilotica or a combination of the two. There was poor feed conversion ratio when the diet was a combination of C. nilotica and V. radiata. Caridina nilotica is a good candidate to substitute fishmeal in practical diets for Nile tilapia [40].
m. Microalgae
Microalgae trade is successful because they can be used in several ways: for the production of food supplements, antioxidants, natural colors and polyunsaturated fatty acids. The most important applications in aquaculture are in nutrition as a single component or as an additive in food [45].
The most used species are: Chlorella, Tetraselmis,
Isochrysis, Pavlova, Phaeodactylum, Chaetoceros, Nannochloropsis, Skeletonema and Thalassiosira. To be used, they must meet certain requirements such as easy to grow, have no toxicity and have a high nutritional value [46]. It is also important that they contain polyunsaturated fatty acids; such as eicosapentaenoic acid (EPA), α-linolenic acid (ALA) and arachidonic acid (AA), are essential for several fish since they serve as precursors in the regulation of development and physiology. Most microalgae have moderate to high levels of EPA, Nannochloropsis and diatoms have the highest levels of AA (0-4%). Chlorophytes such as Dunaliella and Chlorella are deficient in polyunsaturated fatty acids (C20 and C22), therefore, they have low nutritional value and are not suitable for a diet [47].
• Inclusion in aquaculture – Spirulina
In this study, Sprirulina maxima was used as protein source for tilapia (Oreochromis mossambicus) fry. Five diets were made, with animal protein replaced with algae at ratios of 20%, 40%, 60%, 80% and 100% and a diet control with fishmeal as animal protein. Growth rate showed no significant difference between control, 20% diet and 40% diet. None of the diets showed adverse effects on carcass composition. They concluded that Spirulina can replace up to 40% of fish meal [48].
In other study, in order to develop a food chain
(phytoplankton–fish) in a recirculating aquaculture system, Spirulina platensis was fed to tilapia Oreochromis niloticus with a commercial diet as the control treatment. Fish grew efficiently and showed a high survival rate (95%), the ones fed with Spirulina had a higher protein content, a higher polar lipid content and a lower ash content than fish fed the commercial diet. The results suggest that it is feasible to use Spirulina to feed tilapia [49].
• Inclusion in aquaculture – Chlorella spp and
Scenedesmus spp In this study, the effect of partial replacement of fish meal
with dried microalgae (Chlorella spp and Scenedesmus spp) in Nile tilapia (Oreochromis niloticus) diets on fish growth performance, feed efficiency and body composition was researched. Diets were formulated with Chlorella and Scenedesmus as fish meal replacers (10, 25, 50 and 75%) and a control. Results indicated that dried Chlorella spp and Scenedesmus can replace fish meal up to 50% in Nile tilapia diets without having any adverse effects [50].
• Inclusion in aquaculture – Spirulina platensis,
Euglena gracilis and Chlorella vulgaris Three species of freshwater algae (Spirulina platensis,
Euglena gracilis and Chlorella vulgaris) were fed to larval tilapia (Oreochromis niloticus) to assess their acceptability. For all three algae, it was found that assimilation efficiency improved when larval sized increased. Spirulina was better assimilated (61.4–80%) than Euglena and Chlorella [51].
• Inclusion in aquaculture – Algal mix
Three diets containing 0 %, 35% and 100% algal supplementation were used in combination with other conventional fish feed ingredients to fed tilapia (Oreochromis mossambicus). The algal genera used were Phormidium valderianum, Spirulina subsalsa, Navicula minima, Chlorococcum infusionum and Rhizoclonium riparium. The results suggested that 35 % supplementation with composite algal mix can be used in Mozambique tilapia diet [52].
• Inclusion in aquaculture – Freshwater (Spirulina,
Chlorella) and marine (Schizochytrium) microalgae The digestibility coefficients of macronutrients, amino
acids and fatty acids for freshwater (Spirulina, SPI; Chlorella, CHL) and marine (Schizochytrium, SCI) micro algal ingredients in Nile tilapia via four diets were determined. The results showed higher coefficients in Spirulina, determining that this microalgae is a good alternative protein for tilapia diets [53].
• Inclusion in aquaculture – Schizochytrium sp.

This study determined the optimum level of fish-oil substitution with microalgae for maximum growth of Nile tilapia. When fully replaced, they found higher weight gain compared to control. Results also show that replacing fish oil with DHA-rich marine Sc improves the deposition of PUFA levels in tilapia fillet. Schizochytrium sp. proved to be a high quality candidate for complete substitution of fish oil in juvenile Nile tilapia feeds [54].
n. Insects
Since ancient times, insects have been one alternative protein source to humans for compensating the scarcity of other sources. The most existing studies have focused on the insects that have played an important role in human nutrition in Africa, Asia, and Latin America [55]. Insects could be an interesting source of protein for animal feeding. Mass rearing could ensure a constant production in quantity, quality and stability of supply and price. Rearing does not compete with feed resources or land use. Use of insects could be a high-quality animal protein source making use of environmentally sustainable technology [56].
To use insects for fish feeding, it is necessary to determine
the nutritive characteristics of these insects. In this study, 16 different species of the orders Coleoptera, Diptera and Orthoptera were examinated. The analyzed insects have a higher proportion of fat and less protein than fish meal. The amino acid profile is similar to fish meal with the exceptions of histidine, threonine and lysine, Diptera was the most similar. However, insects have higher ratios of omega 6 and monounsaturated fat, composition of fish meal has lower ratios, so this must be taken in care when inclusion in diets [57].
• Inclusion in aquaculture – Tenebrio molitor
Tenebrio molitor (Coleoptera: Tenebrionidae) is primarily composed of Protein (584.2 g kg-1 dry matter) and Fat (300.9 g kg-1 dry matter), which shows this could be a promising protein and fat source for feeds. In this work, the inclusion of Tenebrio molitor meal (TM) to replace fishmeal in Oreochromis niloticus diet was studied. The results indicated that an inclusion up to 500 g kg-1 of TM in the diet did not affect the fish [56].
• Inclusion in aquaculture – Musca domestica
The house fly Musca domestica Linnaeus (Diptera) is one of the most known and studied. A trial using housefly (Musca domestica) maggot meal (MM) in diets for Nile tilapia (Oreochromis niloticus) was conducted to assess the growth performance. Five diets where fishmeal (FM) was substituted by MM at the level of 0, 90, 180, 270 and 360 g kg-1 were fed to tilapia. No significant difference was showed in feed intake and apparent digestibility coefficient between the treatments. Replacing up to 270 g kg-1 FM did not show an impact on the growth performance and ingredient utilization, completely replacing of FM caused a lower survival rate, weight gain, specific growth rate and higher feed conversion rate [58].
• Inclusion in aquaculture – Black Soldier Fly
The black soldier fly larvae (BSFL), Hermetia illucens, has become a popular bio-recycling that breeds in various substances [59]. Due to this, BSFL are used to compost wastes (manure, and animal and vegetable food wastes). Mature larvae and prepupae grown can be used to supplement diets [60]. This meal contains >400 g kg-1 of protein and >350 g kg-1 of lipids [61, 63].
Catfish and tilapia
Black soldier fly larvae (Hermetia illucens L.) were fed to catfish and tilapia, alone, and in combination with
high-(45%) and low-(30%) protein commercial diets. The commercial diets were also fed as controls. Similar effects of the six diets were reported. Taste tests were also made with no adverse effects [59].
Rainbow trout (Oncorhynchus mykiss)
Two of the test diets included the black soldier fly, Hermetia illucens, prepupae. The total protein from black soldier fly prepupae (BSFPP) in the two test diets was 15 and 34%, respectively. Results show that a diet where fly prepupae constitute 15% of the total protein has no adverse effect. However, fish fed with BSFPP showed reduced levels of omega-3 fatty acids in their muscle fillets [61]. Other study used the Black soldier fly larvae in different levels of fishmeal replacement (0, 50, and 70%) and found negative trends when increasing its inclusion, however they concluded that it can substitute fish meal up to 50% in trout feds [62].
Other study included a partially defatted Hermetia illucens
(HI) larvae meal as potential feed ingredient in rainbow trout (Oncorhynchus mykiss Walbaum) diets. The inclusion levels were 0% (HI0, control diet), 25% (HI25) and 50% (HI50). Results showed that this larvae meal can be used as feed ingredient in trout diets up to 40% of inclusion level without impacting survival and growth performance [66].
Turbot (Psetta maxima)
Six diets were formulated to replace fish meal protein subsequently by Hermetia meal (HM) protein, they contained 0%, 17%, 33%, 49%, 64%, and 76% of HM. Feed intake was affected, it decreased when increasing HM incorporation due to low palatability. Growth performance was high, but also affected, protein retention and decreased when increasing HM. This study shows that the incorporation of HM protein in fish diets is possible, but limited [63].
Tilapia (Oreochromis niloticus)
This study evaluated the effects on the performance, feed utilization efficiency and body composition of an inclusion of Black Soldier Fly larvae meal (MM) in a commercially formulated diet for advance nursing Nile tilapia (Oreochromis niloticus). Three test diets were made with inclusions of MM
(0, 30, 50 and 80 g/kg) and poultry by-product meal substituting fish meal, fish oil and soybean meal. Growth performance, feed utilization efficiency indices and feed intake were not significantly different between treatments [64].
Atlantic salmon (Salmo salar)
Two insect meal of BSFL (different due to different nutrient isolation and processing techniques) (IM) were tested in diets for Atlantic salmon. The control diet contained 200 g kg-1 fish meal (FM), which was replaced by insect meal A and B with 25%, 50% or 100% levels of inclusion. A25, A50 and A100 performed equally well as the FM100 diet. Only Insect Meal A was suitable to replace up to 100% of dietary fish meal [65].
Jian carp (Cyprinus carpio var. Jian)
To investigate the effects of Black soldier fly inclusion in juvenile Jian carp (Cyprinus carpio var. Jian), five experimental diets were formulated by substitution of 0%, 25%, 50%, 75% and 100% soybean oil (SO) with BSO. Fatty acid composition and lipid deposition was determined, and the results showed that growth and nutritive utilization were not different. These results suggest that the growth of Jian carp is not affected by dietary BSO, while it decreased lipid deposition in the intraperitoneal fat tissue [67].
Other study was carried out to estimate the effects of fish
meal replacement by defatted black soldier fly larvae meal (DBSFLM) in Jian carp (Cyprinus carpio var. Jian) juveniles. Five diets were formulated by replacing 0%, 25%, 50%, 75%, 100% fish meal (FM). The results showed that the growth performance and nutrients utilization of fish in five groups were not different. These results suggest that the growth of Jian carp is not affected by dietary DBSFLM. The study also proves that it is viable to replace up to 50% of dietary fish meal [68].
III. CONCLUSIONS AND FUTURE CONSIDERATIONS By not having a sufficient supply of aquaculture feeds and
the existence of a constant variation in prices, the search for alternative supplies is essential. Different alternatives for protein and fat parts have been researched, obtaining good results. However, these results show that the inclusion of them until now is partially due to the low palatability and digestibility that they have when ingested by the fish. It is necessary to develop foods that improve tilapia composition, as well as increase their effectiveness when consumed. Innovative foods, environmentally and socially sustainable are needed. Still more studies should be done with these sources to reduce feed costs as much as possible. After reviewing and observing both its performance and composition, it was observed that two of the most promising supplies to be used for balanced feeds are microalgae and black soldier fly larvae. There is still a lack of results with mixes in tilapia, so both are proposed to develop an innovative feed. Under this statement, a balanced feed for tilapia with different proportions of these supplies and commercial diet was developed in the Laboratorio de
Bioingeniería and are ready to be evaluated and try to attack the presented problem.
ACKNOWLEDGMENTS The authors thank the Laboratorio de Bioingeniería, UAQ
and its leader, Dr. Juan Fernando García Trejo for all the support. We are also grateful to the Consejo Nacional de Ciencia y Tecnología (CONACyT) and the Universidad Autónoma de Querétaro for the given scholarships.
REFERENCES [1] FAO report. The state of world fisheries and aquaculture, pp. 204 pages,
2016. http://www.fao.org/3/a-i5555e.pdf [2] FAO report. The state of world fisheries and aquaculture, pp. 244 pages,
2014. http://www.fao.org/3/a-i3720e.pdf [3] Wilson, R.P. Protein and amino acids. In: Halver, J.E., Hardy, R.W.
(Eds.), Fish Nutrition. Elsevier Science, San Diego, USA, pp. 144–179, 2002.
[4] Rana, K.J., Siriwardena, S., Hasan, M.R. Impact of rising feed ingredient prices on aquafeeds and aquaculture production. In: FAO (Ed.), Fisheries and Aquaculture Technical Paper. Food, Agriculture Organization of the United Nations, Rome, Italy, pp. 63.2009.
[5] Hepher, B. Nutrition of Pond Fishes. Cambridge University Press. New York. 1988.
[6] Barrows, F.T., Bellis, D., Krogdahl, A., Silverstein, J.T., Herman, E.M., Sealey, W.M., Rust, M.B., Gatlin III, D.M. Report of plant products in aquafeeds strategic planning workshop: an integrated interdisciplinary roadmap for increasing utilization of plant feedstuffs in diets for carnivorous fish. Rev. Fish. Sci. 16, 449e455.2008.
[7] National Research Council. Nutrient Requirements of Fish, ISBN: 0-309-59629-7, 124 pages. 1993.
[8] Lock E.R., Arsiwalla T., Waagbø. Insect larvae meal as an alternative source of nutrients in the diet of Atlantic salmon (Salmo salar) postsmolt. Aquaculture Nutrition: 22; 1202–1213.2016.
[9] Sánchez-Muros María-José, Barroso Fernando G., Manzano-Agugliaro Francisco. Insect meal as renewable source of food for animal feeding: a review. Journal of Cleaner Production 65. 16e27.2014.
[10] Allen, O.N. & Allen, E.K. The leguminosae. A resource book of characteristics, uses and nodulation. College of Agricultural and life sciences, University of Wisconsin, Madison. Macmillan, London, pp. 140–148. 1981.
[11] O.T. Adebayo, O.A. Fagbenro & T. Jegede. Evaluation of Cassia fistula meal as a replacement for soybean meal in practical diets of Oreochromis niloticus fingerlings. Aquaculture Nutrition.10; 99-104. 2004.
[12] Balogun, A.M. & Fetuga, B.L. Anti-nutritional Components in some Lesser Known Leguminous Crop Seeds in Nigeria. Elsevier Science, London. 1989.
[13] Enujiugha, V.N. & Agbede, J.O. Nutritional and anti-nutritional characteristics of African oil bean (Pentaclethra macrophylla) seeds. Appl.Trop. Agric., 5, 11–14. 2000.
[14] A. E. Falaye, K. Jauncey. Acceptability and digestibility by tilapia Oreochromis niloticus of feeds containing cocoa husk. Aquaculture Nutrition, 5;157-161. 1999.
[15] D.M. Liti, R.M. Mugo, J.M. Munguti & H. Waidbacher. Growth and economic performance of Nile tilapia (Oreochromis niloticus L.) fed on three brans (maize, wheat and rice) in fertilized ponds. Aquaculture Nutrition. 12; 239–245. 2006.
[16] Diana, J.S., Lin, C.K. & Yi, Y. Timing of supplemental feeding for tilapia in production. Journal of World Aquaculture Society, 27, 410–419. 1996.
[17] M.S. Azaza, F. Mensi, W.Kammoun, A. Abdelouaheb, B.Brini & M. Kraiem. Nutritional evaluation of waste date fruit as partial substitute for soybean meal in practical diets of juvenile Nile tilapia, Oreochromis noloticus L. Aquaculture Nutrition 15; 262-272. 2009.

[18] C. Hernández, M.A. Olvera-Novoa, R.W. Hardy, A.Hermosillo, C. Reyes & B. González. Complete replacement of fish meal by porcine and poultry by-product meals in practical diets for fingerling Nile tilapia Oreochromis niloticus: digestibility and growth performance. Aquaculture Nutrition 16; 44-53. 2010.
[19] O’Toole, D.K. Characteristics and use of Okara, the soybean residue from soy milk production. J. Agric. Food. Chem., 47, 363–371. 1999.
[20] Khare, S.K., Jha, K. & Sinha, L.K. Preparation and nutritional evaluation of Okara fortified biscuits. J. Dairy Food Home Sci., 14, 91–94. 1995.
[21] D.M.S.D. El-Saidy. Effect of using okara meal, a by-product from soymilk production as dietary protein source for Nile tilapia (Oreochromis niloticus L.) mono-sex males. Aquaculture Nutrition 17; 380-386. 2011.
[22] Agrifood Consulting International. Northeast Thailand rice value chain study. 2005. Available at: http://www.agrifoodconsulting.com
[23] Asia BioBusiness. Potential World Markets for Innovative Rice Businesses in Thailand. Final Report Prepared for the National Innovation Agency, Thailand. 63 p. 2006.
[24] K. Vechklang, S. Boonanuntanasarn, S. Ponchunchoovong, N. Pirarat & C.Wanapu. The potential for rice wine residual as an alternative protein source in a practical diet for Nile tilapia (Oreochromis niloticus) at the juvenile stage. Aquaculture nutrition, 17; 685-694. 2011.
[25] Guérard F. Enzymatic methods for marine by-products recovery. In: Maximizing the Value of Marine By-products (ed. by F. Shahidi), pp. 107–143. Woodward Publishing Limited, Cambridge, UK. 2007.
[26] Gildberg A.Enzymatic processing of marine raw materials. Process Biochemistry 28, 1–15. 1993.
[27] Aguila J., Cuzon G., Pascual C., Domingues P.M., Gaxiola G., Sánchez A., Maldonado T. & Rosas C. The effects of fish hydrolysate (CPSP) level on Octopus maya (Voss and Solis) diet: digestive enzyme activity, blood metabolites, and energy balance. Aquaculture 273, 641–655. 2007.
[28] Keke Zheng, Mengqing Liang, Hongbo Yao, Jialin Wang & Qing Chang. Effect of size-fractionated fish protein hydrolysate on growth and feed utilization of turbot (Scophthalmus maximus L.) Aquaculture Research, 1–8. 2012.
[29] Hien Thi Dieu Bui, Sanaz Khosravi, Vincent Fournier, Mikaёl Herault, Kyeong-Jun Lee. Growth performance, feed utilization, innate immunity, digestibility and disease resistance of juvenile red seabream (Pagrus major) fed diets supplemented with protein hydrolysates. Aquaculture 418–419, 11–16. 2014.
[30] F.B. Harmantepe, F. Aydin & G. Dögan. The potential of dry olive cake in a practical diet for juvenile hybrid tilapia, Oreochromis niloticus x Oreochromis aereus. Aquaculture Nutrition. 2015.
[31] Nasopoulou, C. & Zabetakis, I. Agricultural and aquacultural potential of olive pomace a review. J. Agric. Sci., 5, 116–127. 2013.
[32] Yilmaz, E., Naz, M. & Akyurt, I. Effect of dietary olive pomace oil and L-carnitine on growth and chemical composition of african catfish, Clarias gariepinus (Burchell, 1822). Israeli J. Aquacult., 56, 14–21. 2004.
[33] Sicuro, B., Barbera, S., Dapra, F., Gai, F., Gasco, L., Paglialonga, G., Palmegiano, G.B. & Vilella, S. The olive oil by-product in ‘rainbow trout Onchorynchus mykyss (Walbaum)’ farming: productive results and quality of the product. Aquacult. Res., 41, 475–486. 2010.
[34] Nasopoulou, C., Stamatakis, G., Demopoulos, C.A. & Zabetakis, I. Effects of olive pomace and olive pomace oil on growth performance, fatty acid composition and cardio protective properties of gilthead sea bream (Sparus aurata) and sea bass (Dicentrarchus labrax). Food Chem., 129, 1108–1113. 2011.
[35] Ng, W.P.Q., Lim, M.T., bt Mohamad Izhar, S.M., Lam, H.L. & Yusup, S. Overview on economics and technology development of rubber seed utilisation in Southeast Asia. Clean Technol. Environ, 16, 439–453. 2014.
[36] Eka, H.D., Tajul Aris, Y. & Wan Nadiah, W.A. Potential use of Malaysian rubber (Hevea brasiliensis) seed as food, feed and biofuel. Int. Food Res. J., 17, 527–534. 2010.
[37] J.M. Deng, Y. Wang, L.Q. Chen, K.S. Mai, Z. Wang & X. Zhang. Effects of replacing plant proteins with rubber seed meal on growth, nutrient
utilization and blood biochemical parameters of tilapia (Oreochromis niloticus x Oreochromis). Aquaculture Nutrition 23; 30-39. 2017.
[38] Cook, R. L. Analysis of Florida Pompano Trachinotus carolinus performance when fed practical diets of increasing levels of cotton seed flour processed by varying methods. Thesis for Master of Science, Auburn University, Auburn, AL, USA. p. 42. 2014.
[39] N.S.A. Khalifa, I.E.H. Belal, K.A. El-Tarabily, S. Tariq, A.A. Kassab. Evaluation of replacing fish meal with corn protein concentrate in Nile tilapia Oreochromis niloticus fingerlings commercial diet. 2016.
[40] G.K. Kubiriza, A.M. Akol, J. Arnason, Ó. Sigurgeirsson, S. Snorrason, T. Tómasson, H. Thorarensen. Practical feeds for juvenile Nile tilapia (Oreochromis niloticus) prepared by replacing Rastrineobola argentea fishmeal with freshwater shrimp (Caridina nilotica) and mung bean (Vigna radiata) meals. Aquaculture Nutrition; 1–8. 2017.
[41] Creswell, D. C. Nutritional evaluation of mung beans (Phaseolus aureus) for young broiler chickens. Poultry Science, 60, 1905–1909. 1981.
[42] Eusebio, B. P. S., & Coloso, R. M. Nutritional evaluation of various plant protein sources in diets for Asian sea bass Lates calcarifer. Journal of Applied Ichthyology, 16, 56–60. 2000.
[43] De Silva, S. S., & Gunasekera, R. M. Effect of dietary protein level and amount of plant ingredient (Phaseolus aureus) incorporated into the diets on consumption, growth performance and carcass composition in Oreochromis niloticus (L.) fry. Aquaculture, 80, 121–133.1989.
[44] Mugo-Bundi, J., Oyoo-Okoth, E., Ngugi, C. C., Manguya-Lusega, D., Rasowo, J., Chepkirui-Boit, V. Njiru, J. Utilization of Caridina nilotica (Roux) meal as a protein ingredient in feeds for Nile tilapia (Oreochromis niloticus). Aquaculture Research, 46, 346–357. 2015.
[45] Spolaore Pauline, Claire Joannis-Cassan, Elie Duran and Arsène Isambert. Commercial Applications of Microalgae. Journal of Bioscience and Bioengineering: 101; 87–96, No. 2. 2006.
[46] Hemaiswarya S., R. Raja, R. Ravi Kumar, V. Ganesan, C. Anbazhagan. Microalgae: a sustainable feed source for aquaculture. World Journal of Microbiology and Biotechnology: 27; 1737–1746. 2011.
[47] Brown Malcolm R. Nutritional value of microalgae for aquaculture. Avances en Nutrición Acuícola VI. Memorias del VI Simposium Internacional de Nutrición. En: Cruz-Suárez LE, Ricque-Marie D, Tapia-Salazar M, Gaxiola-Cortés MG, Simoes N (eds). 3 al 6 de Septiembre. Cancún, Quintana Roo, México. 2002.
[48] M.A. Olvera-Novoa, L.J. Domínguez-Cen, L. Olivera-Castillo & Marínez-Palacios Carlos A. Effect of the use of microalgae Spirulina maxima as fish meal replacement in diets for tilapia, Oreochromis mossambicus, (Peters), fry. Aquaculture Research 29, 709-715. 1998.
[49] Toshio Takeuchi, Jun Lu, Goro Yoshizaki and Shuichi Satoh. Effect on the growth and body composition of juvenile tilapia Oreochromis niloticus fed raw Spirulina. Fisheries Science 68: 34–40.2002.
[50] Tartiel. M. Badwy., E. M. Ibrahim and M. M. Zeinhom. Partial replacement of fish meal with dried microalgae (Chlorella spp and Scenedesmus spp) in Nile tilapia (Oreochromis niloticus) diets. 8th International Symposium on Tilapia in Aquaculture. 2008.
[51] Jun Lu, Toshio Takeuchi, Hiroo Satoh. Ingestion and assimilation of three species of freshwater algae by larval tilapia Oreochromis niloticus. Aquaculture 238, 437–449. 2004.
[52] Sudeshna Sen Roy, Atreyee Chaudhuri, Sudeshna Mukherjee, Sumit HomeChauduri and Ruma Pal. Composite algal supplementation in nutrition of Oreochromis mossambicus. Journal of Algal Biomass Utilization, 2 (1): 10 – 20. 2011.
[53] P.K.Sarker, M.M. Gamble, S. Kelson & A.R. Kapuscinski. Nile tilapia (Oreochromis niloticus) show high digestibility of lipid and fatty acids from marine Schizochytrium sp. and of protein and essential aminoacids from freshwater Spirulina sp. feed ingredients. Aquaculture Nutrition. 2015.
[54] Sarker PK, Kapuscinski AR, Lanois AJ, Livesey ED, Bernhard KP, Coley ML. Towards Sustainable Aquafeeds: Complete Substitution of Fish Oil with Marine Microalga Schizochytrium sp. Improves Growth and Fatty Acid Deposition in Juvenile Nile Tilapia (Oreochromis niloticus). 2016.

[55] Ramos-Elorduy, J. Insects: a sustainable source of food? Ecol. Food Nutr. 36, 247–276. 1997.
[56] M.J. Sánches-Muros, C. De Haro, A. Sanz, C.E. Trenzado, S. Villareces & F.G. Barroso. Nutritional evaluation of Tenebrio molitor meal as fishmeal substitute for tilapia (Oreochromis niloticus) diet. Aquaculture Nutrition. 2015.
[57] Fernando G. Barroso, Carolina de Haro, María-José Sánchez-Muros, Elena Venegas, Anabel Martínez-Sánchez, Celeste Pérez-Bañón. The potential of various insect species for use as food for fish. Aquaculture 422–423,193–201. 2014.
[58] L. Wang, J. Li, J.N. Jin, F. Zhu, M. Roffeis, X.Z. Zhang. A comprehensive evaluation of replacing fishmeal with housefly (Musca domestica) maggot meal in the diet of Nile tilapia (Oreochromis niloticus): growth performance, flesh quality, innate immunity and water environment. Aquaculture Nutrition, 1–11. 2017.
[59] K. Bondari and D.C. Sheppard. Soldier fly larvae as feed in commercial fish production. Aquaculture, 24, 103-109. 1981.
[60] Newton, G.L., Boorman, C.V., Barker, R.W. & Hale, O.M. Dried Hermetia illucens larvae meal as a supplement for swine.J. Anim. Sci., 44, 395–400. 1977.
[61] Wendy M. Sealey, T. Gibson Gaylord, Frederic T. Barrows, Jeffery K. Tomberlin, Mark A. McGuire, Carolyn Ross and Sophie St-Hilaire. Sensory Analysis of Rainbow Trout, Oncorhynchus mykiss, Fed Enriched Black Soldier Fly Prepupae, Hermetia illucens. Journal of the World Aquaculture Society Vol. 42, No. 1. February, 2011.
[62] Andreas Stamer, Stefan Wesselss, Ralph Neidigk, G. Hoerstgen-Schwark. Black Soldier Fly (Hermetia illucens) larvae-meal as an example for a new feed ingredients’ class in aquaculture diets. Proceedings of the 4th ISOFAR Scientific Conference. 2014.
[63] S. Kroeckel, A.-G.E. Harjes, I. Roth, H. Katz, S. Wuertz, A. Susenbeth, C. Schulz. When a turbot catches a fly: Evaluation of a pre-pupae meal of the Black Soldier Fly (Hermetia illucens) as fish meal substitute — Growth performance and chitin degradation in juvenile turbot (Psetta maxima). Aquaculture 364–365, 345–352. 2012.
[64] E. Devic, W. Leschen, F. Murray, D.C. Little. Growth performance, feed utilization and body composition of advanced nursing Nile tilapia (Oreochromis niloticus) fed diets containing Black Soldier Fly (Hermetia illucens) larvae meal. Aquaculture Nutrition, 1–8. 2017.
[65] E.R. Lock, T. Arsiwalla & R. Waagbø. Insect larvae meal as an alternative source of nutrients in the diet of Atlantic salmon (Salmo salar) postsmolt. Aquaculture Nutrition, 22; 1202–1213. 2016.
[66] M. Renna, A. Schiavone, F. Gai, S. Dabbou, C. Lussiana, V. Malfatto, M. Prearo, M. T. Capucchio, I. Biasato, E. Biasibetti, M. De Marco, A. Brugiapaglia, I. Zoccarato and L. Gasco. Evaluation of the suitability of a partially defatted black soldier fly (Hermetia illucens L.) larvae meal as ingredient for rainbow trout (Oncorhynchus mykiss Walbaum) diets. Journal of Animal Science and Biotechnology 8:57. 2017.
[67] Senlin Li, Hong Ji, Binxin Zhang, Jingjing Tian, Jishu Zhou, Haibo Yu. Influence of black soldier fly (Hermetia illucens) larvae oil on growth performance, body composition, tissue fatty acid composition and lipid deposition in juvenile Jian carp (Cyprinus carpio var. Jian) Aquaculture 465; 43–52. 2016.
[68] Senlin Li, Hong Ji, Binxin Zhang, Jishu Zhou, Haibo Yu. Defatted black soldier fly (Hermetia illucens) larvae meal in diets for juvenile Jian carp (Cyprinus carpio var. Jian): Growth performance, antioxidant enzyme activities, digestive enzyme activities, intestine and hepatopancreas histological structure. Aquaculture 477; 62–70. 2017.
Use of Polyethylene Terephthalate (PET) as aggregate in concrete mixes.
Mechanical strength of the concrete added with Polyethylene Terephthalate (PET).
Chávez Piñera Miguel Angel. Faculty of Engineering.
Autonomous University of Querétaro. Querétaro, México.
Keywords—PET; Concrete; Resistance; Environment.
I. ABSTRACT. The following experimental work aims to observe the
behavior of concrete mixtures added with polyethylene terephthalate (PET) as aggregate. The foregoing, due to the disproportionate consumption that is currently given to PET, and to find an alternative that can be used in Civil Engineering, as it is needed options to reduce the impact on the environment such material.
A simple concrete pattern mixture was made, to which it was added PET in proportions of 5%, 10% and 15%, to the previous designs were replaced sand by the PET. To carry out the tests of mechanical resistance, a universal machine was used and the specimens of 15x30 cm. were subjected with an age of 28 days to axial compression.
All the designs showed similar behaviors, but the most suitable to be considered in Civil Engineering uses is the one that was added with 5% of PET, because as it increased the percentage used of PET, the resistance to compression of Concrete specimens decreased.
With this we can say that the use of PET as an aggregate in the concrete is possible, however, in need to continue investigating the impact that produces these mixtures in order to reach the proportionality that allows its implementation in Civil works.
II. INTRODUCTION.
Environmental impact of PET. Basically the elaboration of the PET is based on large
quantities of oil, in addition to its production it is necessary to use toxic substances, heavy metals, chemicals and pigments that remain in the environment and pollute it considerably.
PET also has characteristics that make its demand increase, and as a result its production. Some of them are economic, light and waterproof. However, the problem that arises from the above is that the PET slows to degrade about 700 years and if it
is not reused for other purposes, the only thing that is causing is to store in the environment all the plastic produced. It is estimated that 25 million tons of plastics accumulate in the environment each year and can remain unchanged for a period of between 100 and 500 years. [1]
We can say that the PET currently pollutes both in its production, as well as after its useful life.
History of the use of polyethylene terephthalate (PET) as construction material.
Research around the use of PET as a construction material has become important in recent years due to the problems it poses. These investigations are of a varied nature, to mention some of the uses is the one proposed by the School of Civil and Environmental Engineering, from the Concrete Structural Engineering Laboratory, in South Korea [2], which is to use recycled PET fibers to reinforce concrete.
Similar investigations have been carried out in the Department of Civil Engineering, at the University of Salermo, in Italy [3], since by the same principle of the implementation of recycled PET fibers in the concrete, the thermo-mechanic properties that this material can provide have been analyzed.
To mention initiatives in Latin America, it has to the Centro Experimental de Vivienda Económica (CEVE) of Argentina, has made bricks with PET, whose greatest benefits is that they are light bricks of about a kilo of weight.
Examples such as the above, make the implementation of PET in the construction will be a reality in the present, as well as an alternative to solve the environmental problem that the plastics represent.
III. ELABORATION OF CONCRETE MIXTURES ADDED WITH POLYETHYLENE TEREPHTHALATE (PET).
The designs were made from a mixture of simple concrete pattern calculated to have a resistance of 200 kg/cm2, from it was carried out the optimal dosage of the others, once calculated the first proceeded to calculate the percentage of PET of each of the

others and the content in kg. was disaggregated to the total of sand for each one of the proposals.
In this sense, four mixes were made, as mentioned above, the mixture pattern, the mixture with 5% of PET, the mixture with 10% of PET, and finally the one that had 15% of PET.
The PET used, was crushed in a commercial way and not carried out particle size, however, it is estimated that the material varied in dimensions of 1/8” to 1/2".
Three specimens were produced for each of the mixtures. The specimens that were of the type cylinder with dimensions of 15 x 30 cm. as marked by the standard ASTM C 31 “Standard practice for the preparation and curing of concrete test specimen in the work”.
The quantities of each component of the mixtures are presented in Table 1.
Material. Mix Types.
A B C D
PET (kg) 0 0.8875 1.775 2.6625
Cement (kg) 3.75 3.75 3.75 3.75
Sand (kg) 17.75 16.8625 15.975 15.0875
Stone (kg) 17.75 17.75 17.75 17.75
Water (l) 4.3 4.3 4.3 4.3
Table 1 | Mixing supply.
Where:
Mix A: Concrete pattern mix.
Mix B: Concrete with 5% Polyethylene Terephthalate.
Mix C: Concrete with 10% Polyethylene Terephthalate.
Mix D: Concrete with 15% Polyethylene Terephthalate.
Once the specimens were left in the moulds for 24 hours, after this period, the specimens were taken out of the moulds and cured in a curing chamber to avoid loss of moisture that will cause fissures in the tubes and modify the results of the investigation.
IV. TESTS OF CONCRETE SPECIMENS ADDED WITH POLYETHYLENE TEREPHTHALATE (PET).
The nomenclature used to name each of the specimens was as follows, the letter means the type of sample and the number the order in which they were made.
The test to which the specimens were subjected was to axial compression, using a universal machine. The essays were carried out at 28 days and basically the procedure was the following.
Before the test, all specimens were nodded with Sulphur mortar as indicated in ASTM C 617 “Normative practice for the nod of cylindrical concrete specimens”, this in order to ensure that the
load was applied perpendicularly to the specimens. After that, the cylinders were tested and the results are shown Table 2.
Cylinder. Table Column Head
Max. Load (kg) Max. Stress (kg/cm2) Avg (kg/cm2)
A-1 35900 203.15
208.7 A-2 38000 215.04
A-3 36740 207.91
B-1 35100 198.62
199.0 B-2 34700 196.36
B-3 35700 202.02
C-1 34500 195.23
194.47 C-2 33900 191.83
C-3 34700 196.36
D-1 32650 184.76
186.77 D-2 32100 181.65
D-3 32500 183.91
Table 2 | Results of the axial compression test.
In addition, it was possible to identify the type of failure that prevailed in the cylinders tested. The fault was due to adherence, which means that the interphase between the components of the mixtures was not formed, causing fissures within the specimens themselves that caused the cylinder failure at the time of loading them.
V. RESULTS AND DISCUSSION. The results obtained during the experimentation lead us to
analyze different factors that cause as the percentage of PET increases, the resistance of the mixture is affected. The main one is that by increasing this percentage and reducing the fine aggregates for obvious reasons the adhesion of the particles of the mixture will be less, factor that caused that the majority of the specimens failed by adhesion.
In relation to the above, by decreasing the amount of sand and replacing it with PET, the water in the hydration reaction of the concrete behaved in a different way, and possibly also modified the results.
The foregoing suggests that PET is a possible alternative, however, the methodology that will be carried out will have a significant impact on the mixtures. Therefore, it is advisable to continue experimenting to obtain a relationship of addition of the studied material that allows it to be employed in work, perhaps not in structural elements, but in masonry elements as in bricks or in similar applications.

VI. CONCLUSION. Throughout the experimentation, we could observe a number
of factors that make the addition of PET in concrete mixes an alternative to try to solve one of the biggest environmental problems of the last decades, and to contribute of this way to the final disposal process of polluting plastic waste.
As could be seen in the results, to extent that varies the percentage of PET and reduces the amount of fine aggregate, in this case sand, the resistance to the compression varies with visible relationship, to greater PET contains the mixture, the lower its resistance. And this may be due to different factors, but the most notable ones are that there is no adhesion in the mixture due to the addition of the plastic, besides that the irregular shape and with pronounced vertices of the particles of the PET can cause the elements to fail.
The main benefit is that reduces the amount of PET in the environment, however, it cannot be used in items involving large loads as it does not respond in the way it would be expected, on the other hand, it can be an alternative to be used in bricks or masonry blocks.
REFERENCES [1] María Laura Ortiz Hernández, “The impact of plastics on the
environment”, Center for Research in Biotechnology at the University of the state of Morelos (UAEM) , May 2013.
[2] Sung Bae Kim, Na Hyun Yi, Hyun Young Kim, Jang-Ho Jay Kim, Young-Chul Song, “Material and structural performance evaluation of recycled PET fiber reinforced concrete”, in Cement and Concrete Composites, Volume 32, Issue 3, 2010, pp. 232-240
[3] Fernando Fraternali, Vincenzo Ciancia, Rosaria Chechile, Gianvittorio Rizzano, Luciano Feo, Loredana Incarnato, “Experimental study of the thermo-mechanical properties of recycled PET fiber-reinforced concrete”, in Composite Structures, Volume 93, Issue 9, 2011, pp. 2368-2374.
Study of the profitability of a polyculture in a greenhouse ventilated naturally with CO2 injection
Luis Ángel, González Pérez Faculty of Engineering
Universidad Autónoma de Querétaro Querétaro, México.
Enrique, Rico García Faculty of Engineering
Universidad Autónoma de Querétaro Querétaro, México.
In recent years agriculture has faced a shortage in world production, a measure that has been taken is the production in greenhouses, within this there is the technique of carbon fertilization, presenting multiple benefits in the crop, mainly the increase in production in the mass of the fruit; In this article, an analysis was made of the carbon enrichment technique and the costs involved in this. This article begins with agriculture and its current state, then deals with how CO2 is involved in the process of photosynthesis and what carbonic fertilization consists of, after which the works that have been presented with respect to the subject are mentioned. Finally, the profitability analysis and the costs involved in this work are explained in more detail
Keywords—: analysis of rentability, Carbon dioxide, carbonic fertilization, CO2 management, greenhouse, increase of cultivation
I. INTRODUCTION 1.1 Agriculture today
Agriculture today faces more and more challenges, it has to produce more food in order to give food to a population that is increasing, this leads us to the need to adopt more efficient and sustainable production methods. Studies show that to feed a world population that is estimated to reach 9 100 million people in 2050, it will be necessary to increase food production by 70% between 2005/07 and 2050. Within this increase, it is estimated that around 80 % of the increase will be due to the intensification of crops and the rest to the increase of the cultivable area (FAO, 2009).
A way to intensify crops that has been gaining strength over the years is the protected agriculture, this consists of the use of greenhouses for the development of the crop; As described by Serrano (2005), it is a construction that is protected by covers, the purpose of which is to defend the plants from the action of harmful external factors. This construction also has the function of controlling and providing the optimal conditions for development; the conditions or parameters that are controlled are usually temperature, relative humidity, concentration of CO2 in the air, light intensity. By being able to control the aforementioned parameters we can have a large number of advantages such as increasing the quality, production and number of crops per year in the crop, as
well as we can decrease the water consumption and the time of the crop cycle, in addition to to be able to cultivate in climatic zones and seasonal periods in which it is not possible in open field, also it offers protection against plagues, illnesses and adverse climates, finally it will allow us to work with greater comfort and security.
1.2 Carbonic fertilization in greenhouses
As we know the development of a crop is linked to its ability to perform the process of photosynthesis, a physical-chemical process by which plants and other organisms use the energy emitted by the sun in the form of light to synthesize organic compounds, the process involves the release of molecular oxygen and the use of atmospheric CO2 (Pérez and Urria, 2009). Enoch (1990) and Lorenzo (2012) emphasize that the growth and development of crops is usually determined in large part by the photosynthetic assimilation of CO2
The procedure in which the environmental level of CO2 is increased in a greenhouse is known as carbonic enrichment or carbonic fertilization, this increase is usually between 700 and 800 ppm, this technique has been used for years in greenhouses in cold climates, however , in hot climates it becomes difficult to apply CO2 because it is necessary to keep the windows open of the greenhouses to allow a correct natural ventilation that allows to reduce the high temperatures. (Antón et al., 2011).
1.3 Study of the profitability
As we know, starting a CO2 injection system is an investment that must be analyzed in the long term to quantify the profitability of this type of project through the useful life of these systems; One way to analyze it is through a projection of money over time to do this. We must analyze the inflows and outflows of money that this type of systems will represent throughout the life of the project. The net present value is one of the most widely used economic methods in the evaluation of investment projects. It consists of determining the equivalence in time zero of the future cash flows generated by a project and comparing this equivalence with the initial outlay, when said equivalence is greater than the initial outlay it is recommendable that the project be accepted

II. MATERIALS AND METHODS The project is being carried out in the town of Amazcala,
municipality of El Marques, Queretaro within the facilities of the Autonomous University of Querétaro, Amazcala Campus. It worked with two crops, tomato (Lycopersicon esculentum Mill.) And cucumber (Cucumis sativus L.), the selection of these crops was made due to its economic importance and its high demand in the market.
The first step developed in our experiment, was the habilitation of spaces, for this the conditions of the two greenhouses were reviewed (experimentation and control), it was checked that the plastics, meshes and irrigation system were in good condition, which already They were damaged and replaced by new ones.
A CO2 injection system was installed in one of the greenhouses, consisting of a 25 Kg liquid CO2 tank with a solenoid valve, manometer and the necessary connections to connect to a gas distribution network through the greenhouse, The distribution network was made by perforated pipes through the greenhouse.
We continued with the monitoring system of climatic conditions for this we relied on two CO2 sensors model FYAD 00 CO2B10, two temperature and relative humidity sensors model FHAD462 as well as the measuring instrument with which the ALMEMO® 25904AS model sensors worked , all the equipment of the ALHBORN brand; With this equipment measurements were made and tests were done to see how the climatic conditions behaved inside the greenhouses.
III. RESULTS AND DISCUSSION At the moment the crops have not reached their flowering
stage in which it is recommended to begin with the carbonic fertilization, already beginning this stage it is expected to document the expenses that were carried out due to the liquefied CO2, as well as those implied by the system distribution and CO2 injection. Finally at the end of the harvest
the difference in production of the two greenhouses can be quantified and an estimate of the net profits due to carbonic fertilization can be made and all these numbers can be taken to a net present value to observe the profitability of these systems
IV. CONCLUSIONS It is expected to have an increase in crop yield close to 20%
considering the current conditions of the greenhouse, therefore it is expected that this activity is profitable and that more knowledge about this type of systems is generated.
ACKNOWLEDGMENT
Thanks to the National Council of Science and Technology for their support throughout this investigation. As well as the
teachers involved in this work
REFERENCES
[1] Antón Asunción, Aranda Xavier, Biel Carmen, de Herralde Felicidad, Montero José, Montero Juan Ignacio, Morales Cristian, Muñoz Pere, Savé Robert. (2011). Manual del aplicador de CO2 en cultivos hortícolas. pp. 6-7.
[2] Coss Bu Raul. (2009). Analisis y evaluacion de proyectos de inversion. 2° edicion. Limusa Noriega editores pp. 61.
[3] Enoch Herbert Zvi. (1990). Crop Responses to aerial carbon dioxide. Acta Horticulturae Vol 268(1). pp. 17-32.
[4] FAO. (2009). La agricultura mundial en la perspectiva del año 2050. Disponible en http://www.fao.org/fileadmin/templates/wsfs/docs/Issues_papers/Issues_papers_SP/La_agricultura_mundial.pdf
[5] Lorenzo P. (2012). El cultivo en invernadero y su relación con el clima. Cuadernos de estudios agroalimentarios. ISSN 2173-7568. pp. 23-44.
[6] Pérez Elena - Carril Urria. (2009). Fotosíntesis: Aspectos Básicos. Reduca (Biología). Serie Fisiología Vegetal. Vol 2 (3). pp. 1-47.
[7] Serrano Cermeño Z. (2005). Construcción de invernaderos. 3° edición. Mundi presa pp. 41.Serrano Cermeño Z. (2005). Construcción de invernaderos. 3° edición. Mundi presa pp. 41.
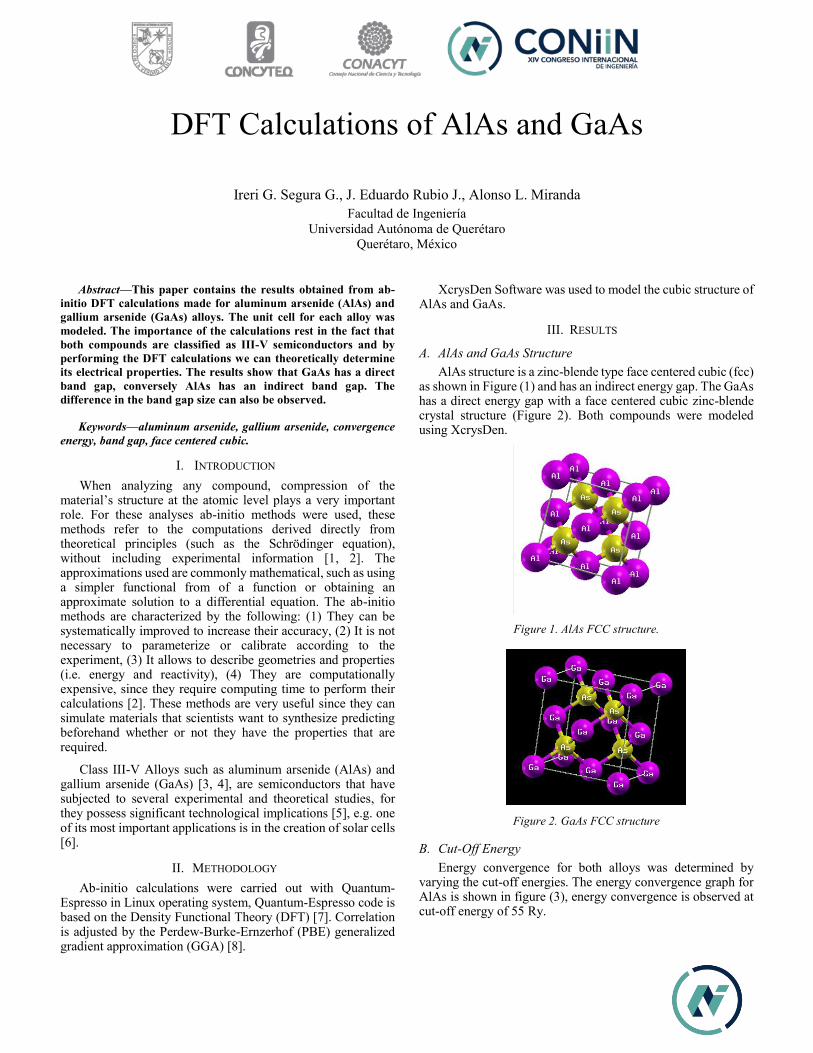
DFT Calculations of AlAs and GaAs
Ireri G. Segura G., J. Eduardo Rubio J., Alonso L. Miranda Facultad de Ingeniería
Universidad Autónoma de Querétaro Querétaro, México
Abstract—This paper contains the results obtained from ab-
initio DFT calculations made for aluminum arsenide (AlAs) and gallium arsenide (GaAs) alloys. The unit cell for each alloy was modeled. The importance of the calculations rest in the fact that both compounds are classified as III-V semiconductors and by performing the DFT calculations we can theoretically determine its electrical properties. The results show that GaAs has a direct band gap, conversely AlAs has an indirect band gap. The difference in the band gap size can also be observed.
Keywords—aluminum arsenide, gallium arsenide, convergence energy, band gap, face centered cubic.
I. INTRODUCTION When analyzing any compound, compression of the
material’s structure at the atomic level plays a very important role. For these analyses ab-initio methods were used, these methods refer to the computations derived directly from theoretical principles (such as the Schrödinger equation), without including experimental information [1, 2]. The approximations used are commonly mathematical, such as using a simpler functional from of a function or obtaining an approximate solution to a differential equation. The ab-initio methods are characterized by the following: (1) They can be systematically improved to increase their accuracy, (2) It is not necessary to parameterize or calibrate according to the experiment, (3) It allows to describe geometries and properties (i.e. energy and reactivity), (4) They are computationally expensive, since they require computing time to perform their calculations [2]. These methods are very useful since they can simulate materials that scientists want to synthesize predicting beforehand whether or not they have the properties that are required.
Class III-V Alloys such as aluminum arsenide (AlAs) and gallium arsenide (GaAs) [3, 4], are semiconductors that have subjected to several experimental and theoretical studies, for they possess significant technological implications [5], e.g. one of its most important applications is in the creation of solar cells [6].
II. METHODOLOGY Ab-initio calculations were carried out with Quantum-
Espresso in Linux operating system, Quantum-Espresso code is based on the Density Functional Theory (DFT) [7]. Correlation is adjusted by the Perdew-Burke-Ernzerhof (PBE) generalized gradient approximation (GGA) [8].
XcrysDen Software was used to model the cubic structure of AlAs and GaAs.
III. RESULTS
A. AlAs and GaAs Structure AlAs structure is a zinc-blende type face centered cubic (fcc)
as shown in Figure (1) and has an indirect energy gap. The GaAs has a direct energy gap with a face centered cubic zinc-blende crystal structure (Figure 2). Both compounds were modeled using XcrysDen.
Figure 1. AlAs FCC structure.
Figure 2. GaAs FCC structure
B. Cut-Off Energy Energy convergence for both alloys was determined by
varying the cut-off energies. The energy convergence graph for AlAs is shown in figure (3), energy convergence is observed at cut-off energy of 55 Ry.
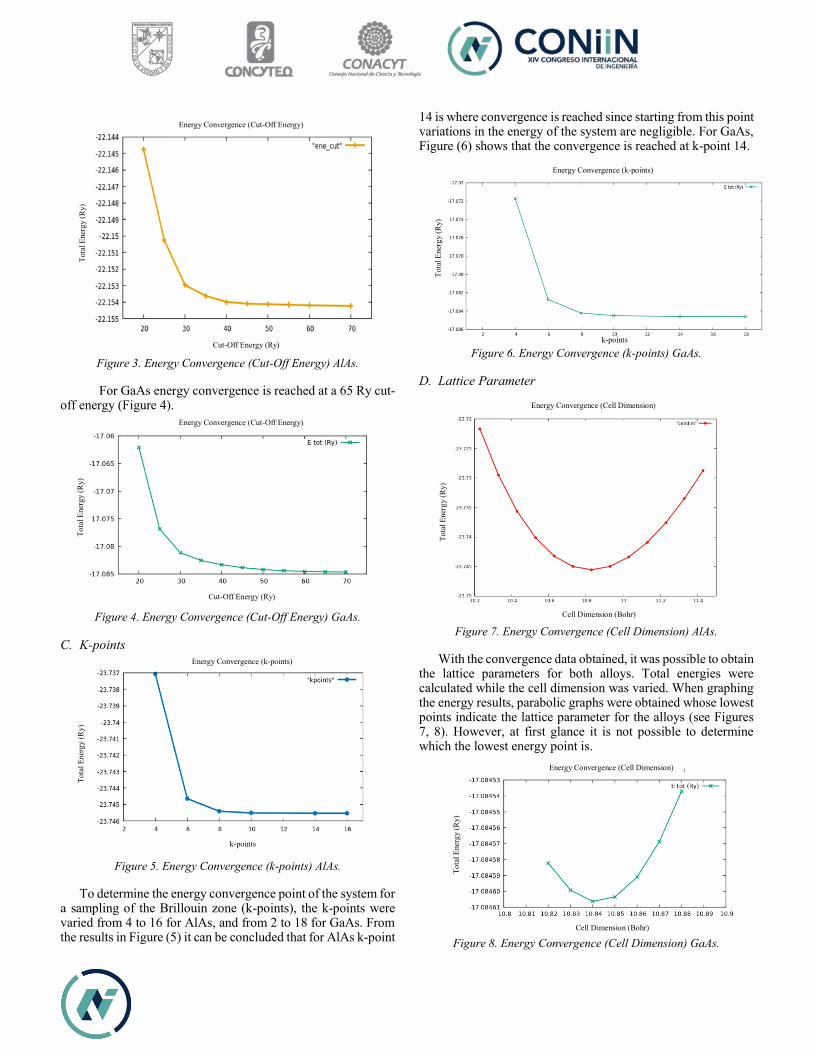
Figure 3. Energy Convergence (Cut-Off Energy) AlAs.
For GaAs energy convergence is reached at a 65 Ry cut-off energy (Figure 4).
Figure 4. Energy Convergence (Cut-Off Energy) GaAs.
C. K-points
Figure 5. Energy Convergence (k-points) AlAs.
To determine the energy convergence point of the system for a sampling of the Brillouin zone (k-points), the k-points were varied from 4 to 16 for AlAs, and from 2 to 18 for GaAs. From the results in Figure (5) it can be concluded that for AlAs k-point
14 is where convergence is reached since starting from this point variations in the energy of the system are negligible. For GaAs, Figure (6) shows that the convergence is reached at k-point 14.
Figure 6. Energy Convergence (k-points) GaAs.
D. Lattice Parameter
Figure 7. Energy Convergence (Cell Dimension) AlAs.
With the convergence data obtained, it was possible to obtain the lattice parameters for both alloys. Total energies were calculated while the cell dimension was varied. When graphing the energy results, parabolic graphs were obtained whose lowest points indicate the lattice parameter for the alloys (see Figures 7, 8). However, at first glance it is not possible to determine which the lowest energy point is.
Figure 8. Energy Convergence (Cell Dimension) GaAs.
k-points
Energy Convergence (Cut-Off Energy)
Energy Convergence (k-points)
Energy Convergence (Cut-Off Energy)
Energy Convergence (k-points)
Energy Convergence (Cell Dimension)
Energy Convergence (Cell Dimension)
Tota
l Ene
rgy
(Ry)
Tota
l Ene
rgy
(Ry)
Tota
l Ene
rgy
(Ry)
Tota
l Ene
rgy
(Ry)
Tota
l Ene
rgy
(Ry)
Tota
l Ene
rgy
(Ry)
Cut-Off Energy (Ry)
Cut-Off Energy (Ry)
k-points
Cell Dimension (Bohr)
Cell Dimension (Bohr)
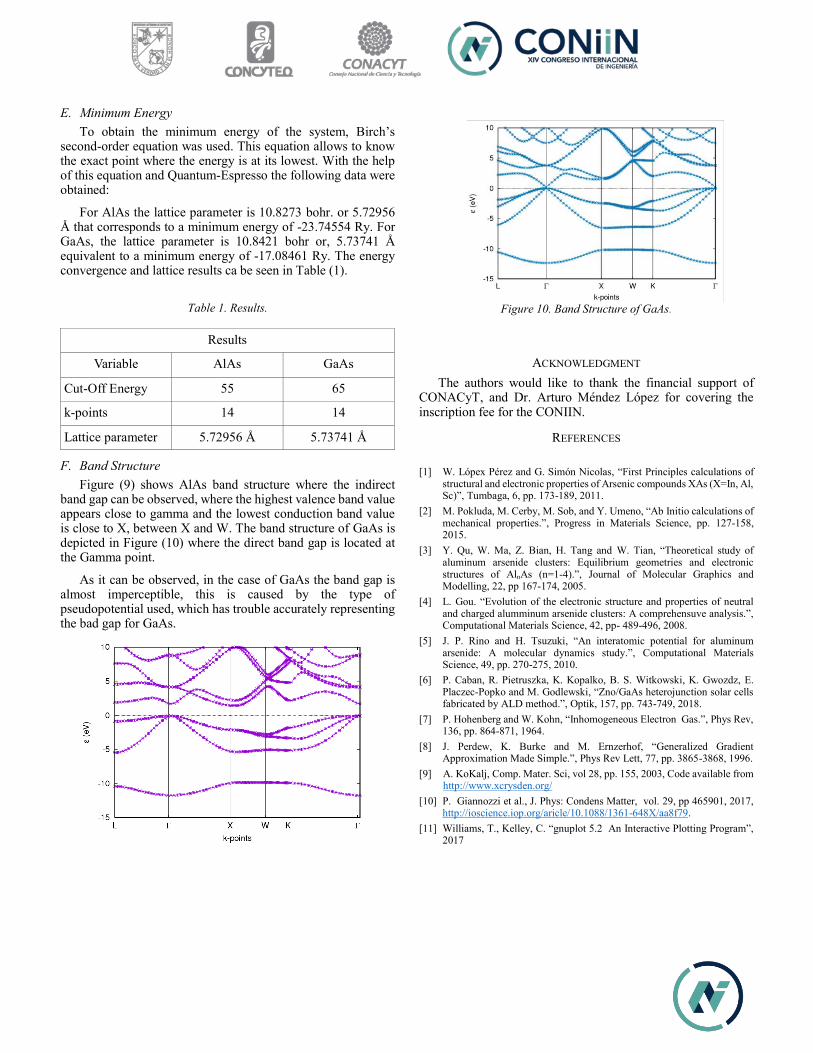
E. Minimum Energy To obtain the minimum energy of the system, Birch’s
second-order equation was used. This equation allows to know the exact point where the energy is at its lowest. With the help of this equation and Quantum-Espresso the following data were obtained:
For AlAs the lattice parameter is 10.8273 bohr. or 5.72956 Å that corresponds to a minimum energy of -23.74554 Ry. For GaAs, the lattice parameter is 10.8421 bohr or, 5.73741 Å equivalent to a minimum energy of -17.08461 Ry. The energy convergence and lattice results ca be seen in Table (1).
Table 1. Results.
Results
Variable AlAs GaAs
Cut-Off Energy 55 65
k-points 14 14
Lattice parameter 5.72956 Å 5.73741 Å
F. Band Structure Figure (9) shows AlAs band structure where the indirect
band gap can be observed, where the highest valence band value appears close to gamma and the lowest conduction band value is close to X, between X and W. The band structure of GaAs is depicted in Figure (10) where the direct band gap is located at the Gamma point.
As it can be observed, in the case of GaAs the band gap is almost imperceptible, this is caused by the type of pseudopotential used, which has trouble accurately representing the bad gap for GaAs.
Figure 10. Band Structure of GaAs.
ACKNOWLEDGMENT The authors would like to thank the financial support of
CONACyT, and Dr. Arturo Méndez López for covering the inscription fee for the CONIIN.
REFERENCES
[1] W. Lópex Pérez and G. Simón Nicolas, “First Principles calculations of structural and electronic properties of Arsenic compounds XAs (X=In, Al, Sc)”, Tumbaga, 6, pp. 173-189, 2011.
[2] M. Pokluda, M. Cerby, M. Sob, and Y. Umeno, “Ab Initio calculations of mechanical properties.”, Progress in Materials Science, pp. 127-158, 2015.
[3] Y. Qu, W. Ma, Z. Bian, H. Tang and W. Tian, “Theoretical study of aluminum arsenide clusters: Equilibrium geometries and electronic structures of AlnAs (n=1-4).”, Journal of Molecular Graphics and Modelling, 22, pp 167-174, 2005.
[4] L. Gou. “Evolution of the electronic structure and properties of neutral and charged alumminum arsenide clusters: A comprehensuve analysis.”, Computational Materials Science, 42, pp- 489-496, 2008.
[5] J. P. Rino and H. Tsuzuki, “An interatomic potential for aluminum arsenide: A molecular dynamics study.”, Computational Materials Science, 49, pp. 270-275, 2010.
[6] P. Caban, R. Pietruszka, K. Kopalko, B. S. Witkowski, K. Gwozdz, E. Placzec-Popko and M. Godlewski, “Zno/GaAs heterojunction solar cells fabricated by ALD method.”, Optik, 157, pp. 743-749, 2018.
[7] P. Hohenberg and W. Kohn, “Inhomogeneous Electron Gas.”, Phys Rev, 136, pp. 864-871, 1964.
[8] J. Perdew, K. Burke and M. Ernzerhof, “Generalized Gradient Approximation Made Simple.”, Phys Rev Lett, 77, pp. 3865-3868, 1996.
[9] A. KoKalj, Comp. Mater. Sci, vol 28, pp. 155, 2003, Code available from http://www.xcrysden.org/
[10] P. Giannozzi et al., J. Phys: Condens Matter, vol. 29, pp 465901, 2017, http://ioscience.iop.org/aricle/10.1088/1361-648X/aa8f79.
[11] Williams, T., Kelley, C. “gnuplot 5.2 An Interactive Plotting Program”, 2017

Nanoencapsulation of Lauric Acid with Chitosan for
Bacterial control.
Dr. Arturo Eduardo Elizalde Peña. Laboratory of nanostructured and functional materials.
Autonomous University of Querétaro. Querétaro, México.
Frida Yeliana Soto Nájera. Laboratory of nanostructured and functional materials.
Autonomous University of Querétaro. Querétaro, México.
Abstract— This work has studied the preparation of
chitosan(CS) particles to nanoscale for loaded and released drugs which were synthesized by ionic gelation method, using in CS particles crosslinked with sodium tripolyphosphate (TPP). Different samples were prepared (CS) with different proportions of modifier agents: crosslinker (TPP) and lauric acid (LA) for bacterial control
Keywords— Nanoparticles, chitosan, lauric acid, ionic gelation, encapsulation.
I. INTRODUCTION In last decades, the implementation of new pharmaceutical
forms of loaded and released drugs, have had great interest in representing a promising platform for the optimization of medical treatments. They are devices that provide better properties, such as stability, high ability to associate, bioadhesivity and reduction of adverse effects, improving the speed, time and place of drug release [1]. Currently, in the development of controlled release systems, a large number of polymers are used. Among them, there are two major groups: Natural polymers and Synthetic polymers [2].
Nowadays, the natural polymers are used as biomaterials. These are biodegradable, non-toxic and biocompatible. They are also abundant in nature and their extraction processes are inexpensive. From the various natural polymers, the chitosan has stood out for its characteristics and great potential. The chitosan is a linear cationic biopolymer obtained by the partial deacetylation of the chitin which is found in the shell of the shrimp, the second most abundant polysaccharide on earth [3]. Some of the functional properties of CS are biodegradability, biocompatibility, mucoadhesivity, absorption promoter, antimicrobial activity, anticholesterolemy and antioxidant. Chitosan has pharmaceutical applications as an extended drug release matrix and it has biomedical applications. From a
physicochemical point of view, CS has the special quality of gelling upon contact with anions thus allowing the formation of beads under very mild conditions [4].
The ionotropic gelation method is commonly used to prepare nanoparticles of polysaccharides. This technique has attracted considerable attention due to the fact that this process is non-toxic, organic solvent free, convenient and controllable [5]. This method allows the cross-linking of polymer chains that are ordered in nanostructures by interactions that may be intermolecular of the covalent or non-covalent type, behaving as a metastable thermodynamic system which is highly sensitive to variations in ionic strength [6].
Antibiotic resistance is an emerging problem worldwide present in many bacteria[7]. Indiscriminate use of antibiotics and the environmental selective pressure made by antiseptics and disinfectants have generated a survival answer in the microorganisms, enabling them to efficiently evade the bactericidal action of some agents [8]. The increasing antibiotic resistance is due to the acquisition of different molecular mechanisms of resistance through point chromosomal mutations and /or horizontal transfer of genetic material between related or different species [7].
In the field of microbiology, are called negative microorganisms when they have a different reaction to the Gram stain in their wall cell compared to Gram positive, as there are stained dark blue or violet, pink color. [10] Infections caused by Gram negative bacteria are highly prevalent in hospitalized patients.[11] The cell wall of gram-positive bacteria is host to a wide variety of molecules and serves a multitude of functions, most of which are critical to the viability of the cell [12].
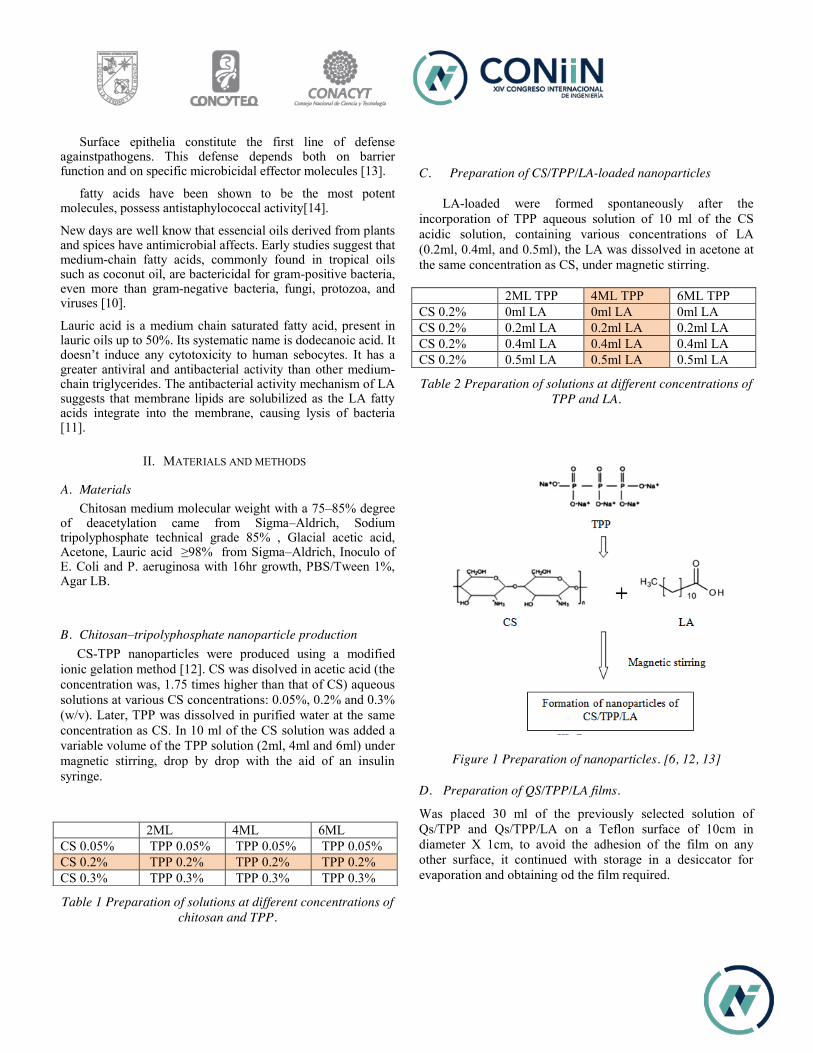
Surface epithelia constitute the first line of defense againstpathogens. This defense depends both on barrier function and on specific microbicidal effector molecules [13].
fatty acids have been shown to be the most potent molecules, possess antistaphylococcal activity[14].
New days are well know that essencial oils derived from plants and spices have antimicrobial affects. Early studies suggest that medium-chain fatty acids, commonly found in tropical oils such as coconut oil, are bactericidal for gram-positive bacteria, even more than gram-negative bacteria, fungi, protozoa, and viruses [10].
Lauric acid is a medium chain saturated fatty acid, present in lauric oils up to 50%. Its systematic name is dodecanoic acid. It doesn’t induce any cytotoxicity to human sebocytes. It has a greater antiviral and antibacterial activity than other medium-chain triglycerides. The antibacterial activity mechanism of LA suggests that membrane lipids are solubilized as the LA fatty acids integrate into the membrane, causing lysis of bacteria [11].
II. MATERIALS AND METHODS
A. Materials Chitosan medium molecular weight with a 75–85% degree
of deacetylation came from Sigma–Aldrich, Sodium tripolyphosphate technical grade 85% , Glacial acetic acid, Acetone, Lauric acid ≥98% from Sigma–Aldrich, Inoculo of E. Coli and P. aeruginosa with 16hr growth, PBS/Tween 1%, Agar LB.
B. Chitosan–tripolyphosphate nanoparticle production CS-TPP nanoparticles were produced using a modified ionic gelation method [12]. CS was disolved in acetic acid (the concentration was, 1.75 times higher than that of CS) aqueous solutions at various CS concentrations: 0.05%, 0.2% and 0.3% (w/v). Later, TPP was dissolved in purified water at the same concentration as CS. In 10 ml of the CS solution was added a variable volume of the TPP solution (2ml, 4ml and 6ml) under magnetic stirring, drop by drop with the aid of an insulin syringe.
Table 1 Preparation of solutions at different concentrations of chitosan and TPP.
C. Preparation of CS/TPP/LA-loaded nanoparticles LA-loaded were formed spontaneously after the incorporation of TPP aqueous solution of 10 ml of the CS acidic solution, containing various concentrations of LA (0.2ml, 0.4ml, and 0.5ml), the LA was dissolved in acetone at the same concentration as CS, under magnetic stirring. 2ML TPP 4ML TPP 6ML TPP CS 0.2% 0ml LA 0ml LA 0ml LA CS 0.2% 0.2ml LA 0.2ml LA 0.2ml LA CS 0.2% 0.4ml LA 0.4ml LA 0.4ml LA CS 0.2% 0.5ml LA 0.5ml LA 0.5ml LA
Table 2 Preparation of solutions at different concentrations of TPP and LA.
Figure 1 Preparation of nanoparticles. [6, 12, 13]
D. Preparation of QS/TPP/LA films.
Was placed 30 ml of the previously selected solution of Qs/TPP and Qs/TPP/LA on a Teflon surface of 10cm in diameter X 1cm, to avoid the adhesion of the film on any other surface, it continued with storage in a desiccator for evaporation and obtaining od the film required.
2ML 4ML 6ML CS 0.05% TPP 0.05% TPP 0.05% TPP 0.05% CS 0.2% TPP 0.2% TPP 0.2% TPP 0.2% CS 0.3% TPP 0.3% TPP 0.3% TPP 0.3%
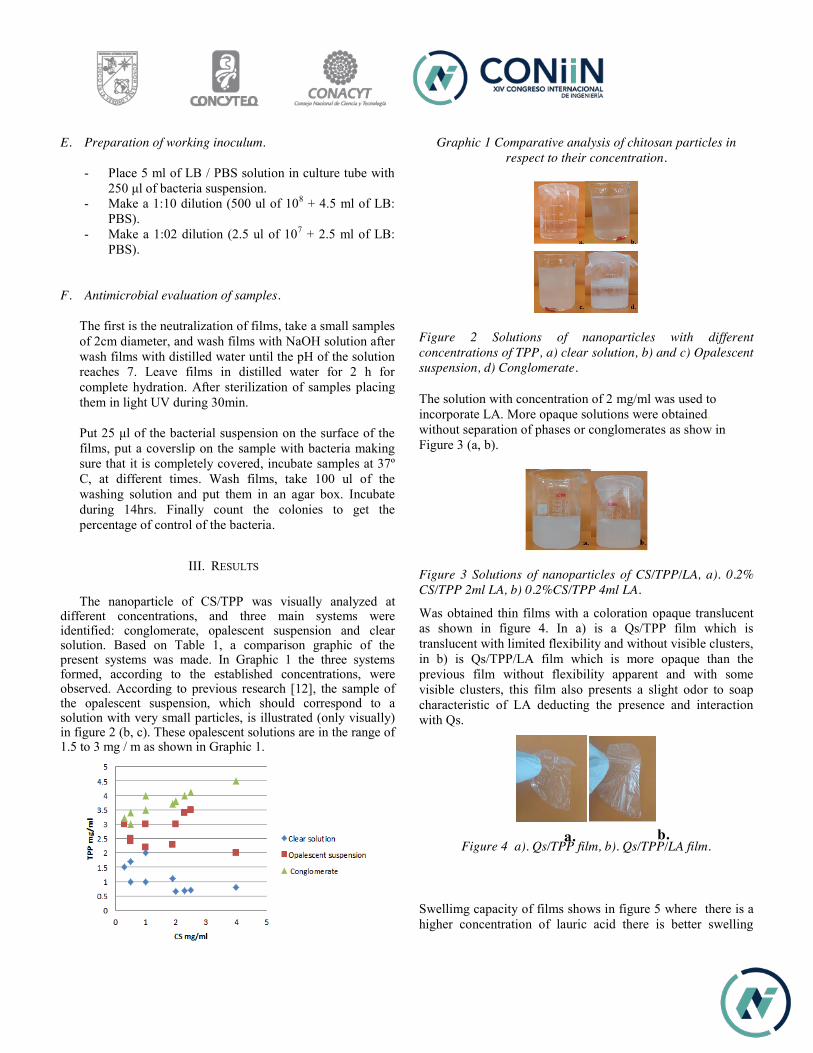
E. Preparation of working inoculum. - Place 5 ml of LB / PBS solution in culture tube with
250 μl of bacteria suspension. - Make a 1:10 dilution (500 ul of 108 + 4.5 ml of LB:
PBS). - Make a 1:02 dilution (2.5 ul of 107 + 2.5 ml of LB:
PBS).
F. Antimicrobial evaluation of samples. The first is the neutralization of films, take a small samples of 2cm diameter, and wash films with NaOH solution after wash films with distilled water until the pH of the solution reaches 7. Leave films in distilled water for 2 h for complete hydration. After sterilization of samples placing them in light UV during 30min. Put 25 μl of the bacterial suspension on the surface of the films, put a coverslip on the sample with bacteria making sure that it is completely covered, incubate samples at 37º C, at different times. Wash films, take 100 ul of the washing solution and put them in an agar box. Incubate during 14hrs. Finally count the colonies to get the percentage of control of the bacteria.
III. RESULTS
The nanoparticle of CS/TPP was visually analyzed at different concentrations, and three main systems were identified: conglomerate, opalescent suspension and clear solution. Based on Table 1, a comparison graphic of the present systems was made. In Graphic 1 the three systems formed, according to the established concentrations, were observed. According to previous research [12], the sample of the opalescent suspension, which should correspond to a solution with very small particles, is illustrated (only visually) in figure 2 (b, c). These opalescent solutions are in the range of 1.5 to 3 mg / m as shown in Graphic 1.
Graphic 1 Comparative analysis of chitosan particles in respect to their concentration.
Figure 2 Solutions of nanoparticles with different concentrations of TPP, a) clear solution, b) and c) Opalescent suspension, d) Conglomerate.
The solution with concentration of 2 mg/ml was used to incorporate LA. More opaque solutions were obtained, without separation of phases or conglomerates as show in Figure 3 (a, b).
Figure 3 Solutions of nanoparticles of CS/TPP/LA, a). 0.2% CS/TPP 2ml LA, b) 0.2%CS/TPP 4ml LA.
Was obtained thin films with a coloration opaque translucent as shown in figure 4. In a) is a Qs/TPP film which is translucent with limited flexibility and without visible clusters, in b) is Qs/TPP/LA film which is more opaque than the previous film without flexibility apparent and with some visible clusters, this film also presents a slight odor to soap characteristic of LA deducting the presence and interaction with Qs.
Figure 4 a). Qs/TPP film, b). Qs/TPP/LA film.
Swellimg capacity of films shows in figure 5 where there is a higher concentration of lauric acid there is better swelling
a. b.
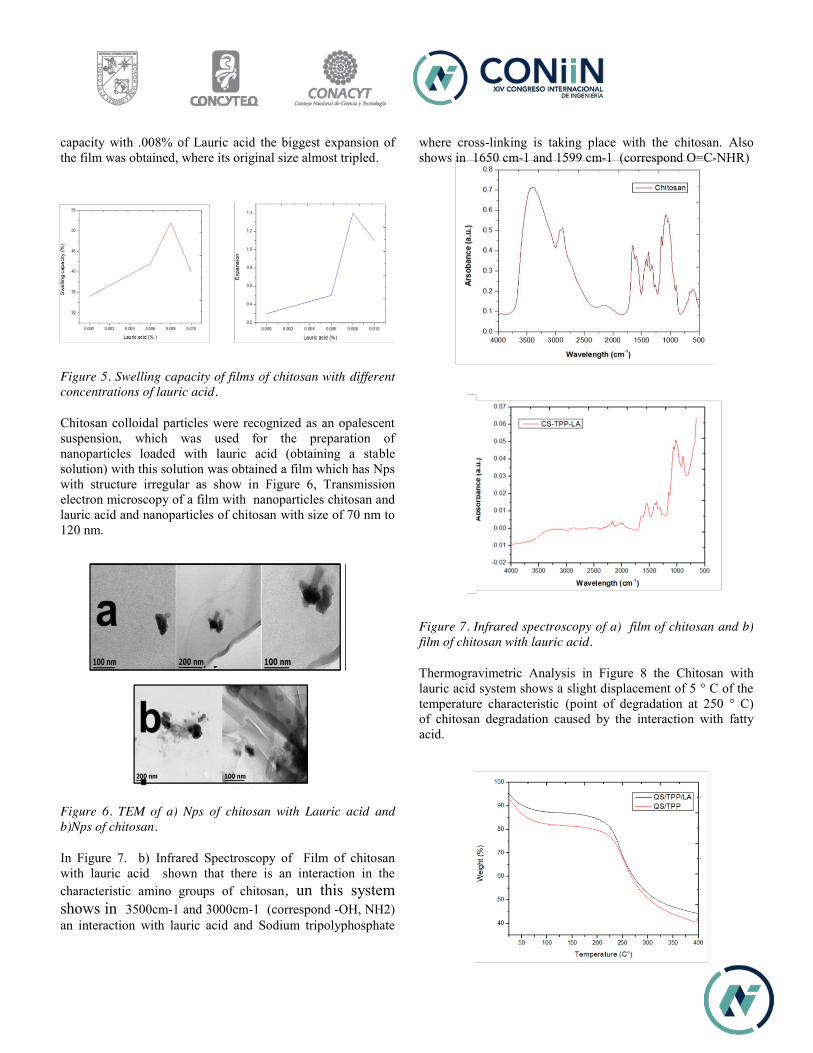
capacity with .008% of Lauric acid the biggest expansion of the film was obtained, where its original size almost tripled.
Figure 5. Swelling capacity of films of chitosan with different concentrations of lauric acid.
Chitosan colloidal particles were recognized as an opalescent suspension, which was used for the preparation of nanoparticles loaded with lauric acid (obtaining a stable solution) with this solution was obtained a film which has Nps with structure irregular as show in Figure 6, Transmission electron microscopy of a film with nanoparticles chitosan and lauric acid and nanoparticles of chitosan with size of 70 nm to 120 nm.
Figure 6. TEM of a) Nps of chitosan with Lauric acid and b)Nps of chitosan.
In Figure 7. b) Infrared Spectroscopy of Film of chitosan with lauric acid shown that there is an interaction in the characteristic amino groups of chitosan, un this system shows in 3500cm-1 and 3000cm-1 (correspond -OH, NH2) an interaction with lauric acid and Sodium tripolyphosphate
where cross-linking is taking place with the chitosan. Also shows in 1650 cm-1 and 1599 cm-1 (correspond O=C-NHR)
Figure 7. Infrared spectroscopy of a) film of chitosan and b) film of chitosan with lauric acid.
Thermogravimetric Analysis in Figure 8 the Chitosan with lauric acid system shows a slight displacement of 5 ° C of the temperature characteristic (point of degradation at 250 ° C) of chitosan degradation caused by the interaction with fatty acid.
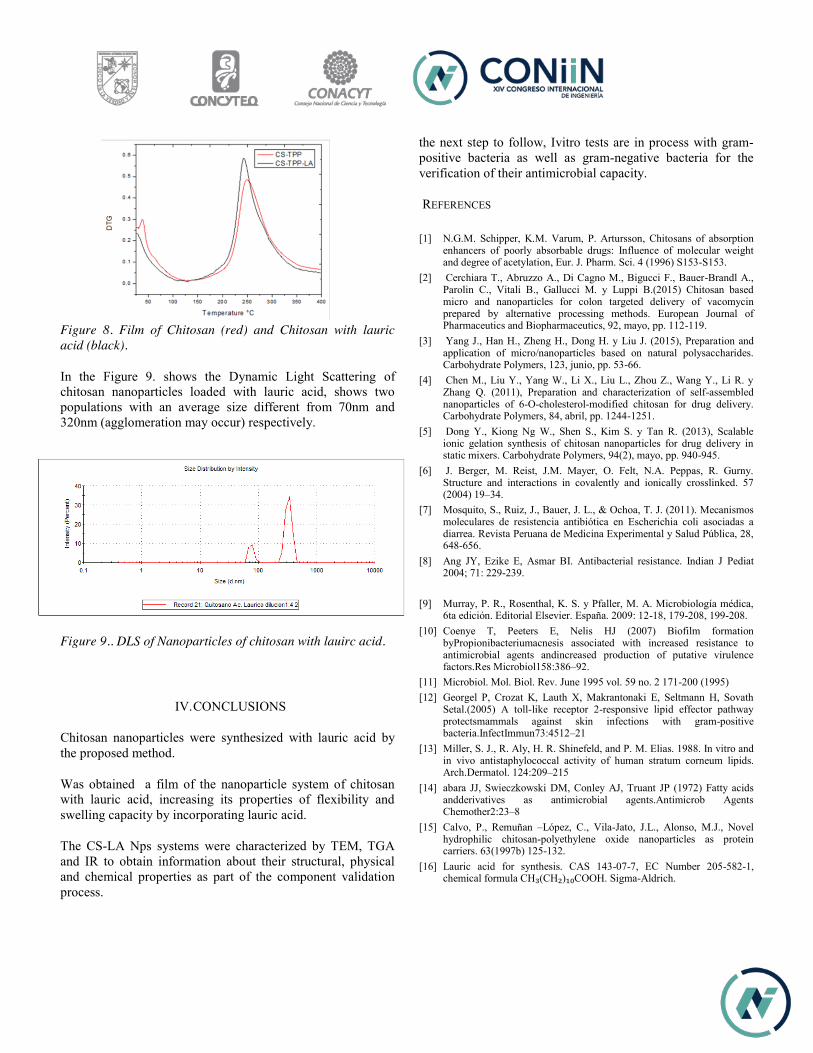
Figure 8. Film of Chitosan (red) and Chitosan with lauric acid (black).
In the Figure 9. shows the Dynamic Light Scattering of chitosan nanoparticles loaded with lauric acid, shows two populations with an average size different from 70nm and 320nm (agglomeration may occur) respectively.
Figure 9.. DLS of Nanoparticles of chitosan with lauirc acid.
IV. CONCLUSIONS
Chitosan nanoparticles were synthesized with lauric acid by the proposed method.
Was obtained a film of the nanoparticle system of chitosan with lauric acid, increasing its properties of flexibility and swelling capacity by incorporating lauric acid.
The CS-LA Nps systems were characterized by TEM, TGA and IR to obtain information about their structural, physical and chemical properties as part of the component validation process.
the next step to follow, Ivitro tests are in process with gram-positive bacteria as well as gram-negative bacteria for the verification of their antimicrobial capacity.
REFERENCES
[1] N.G.M. Schipper, K.M. Varum, P. Artursson, Chitosans of absorption enhancers of poorly absorbable drugs: Influence of molecular weight and degree of acetylation, Eur. J. Pharm. Sci. 4 (1996) S153-S153.
[2] Cerchiara T., Abruzzo A., Di Cagno M., Bigucci F., Bauer-Brandl A., Parolin C., Vitali B., Gallucci M. y Luppi B.(2015) Chitosan based micro and nanoparticles for colon targeted delivery of vacomycin prepared by alternative processing methods. European Journal of Pharmaceutics and Biopharmaceutics, 92, mayo, pp. 112-119.
[3] Yang J., Han H., Zheng H., Dong H. y Liu J. (2015), Preparation and application of micro/nanoparticles based on natural polysaccharides. Carbohydrate Polymers, 123, junio, pp. 53-66.
[4] Chen M., Liu Y., Yang W., Li X., Liu L., Zhou Z., Wang Y., Li R. y Zhang Q. (2011), Preparation and characterization of self-assembled nanoparticles of 6-O-cholesterol-modified chitosan for drug delivery. Carbohydrate Polymers, 84, abril, pp. 1244-1251.
[5] Dong Y., Kiong Ng W., Shen S., Kim S. y Tan R. (2013), Scalable ionic gelation synthesis of chitosan nanoparticles for drug delivery in static mixers. Carbohydrate Polymers, 94(2), mayo, pp. 940-945.
[6] J. Berger, M. Reist, J.M. Mayer, O. Felt, N.A. Peppas, R. Gurny. Structure and interactions in covalently and ionically crosslinked. 57 (2004) 19–34.
[7] Mosquito, S., Ruiz, J., Bauer, J. L., & Ochoa, T. J. (2011). Mecanismos moleculares de resistencia antibiótica en Escherichia coli asociadas a diarrea. Revista Peruana de Medicina Experimental y Salud Pública, 28, 648-656.
[8] Ang JY, Ezike E, Asmar BI. Antibacterial resistance. Indian J Pediat 2004; 71: 229-239.
[9] Murray, P. R., Rosenthal, K. S. y Pfaller, M. A. Microbiología médica, 6ta edición. Editorial Elsevier. España. 2009: 12-18, 179-208, 199-208.
[10] Coenye T, Peeters E, Nelis HJ (2007) Biofilm formation byPropionibacteriumacnesis associated with increased resistance to antimicrobial agents andincreased production of putative virulence factors.Res Microbiol158:386–92.
[11] Microbiol. Mol. Biol. Rev. June 1995 vol. 59 no. 2 171-200 (1995) [12] Georgel P, Crozat K, Lauth X, Makrantonaki E, Seltmann H, Sovath
Setal.(2005) A toll-like receptor 2-responsive lipid effector pathway protectsmammals against skin infections with gram-positive bacteria.InfectImmun73:4512–21
[13] Miller, S. J., R. Aly, H. R. Shinefeld, and P. M. Elias. 1988. In vitro and in vivo antistaphylococcal activity of human stratum corneum lipids. Arch.Dermatol. 124:209–215
[14] abara JJ, Swieczkowski DM, Conley AJ, Truant JP (1972) Fatty acids andderivatives as antimicrobial agents.Antimicrob Agents Chemother2:23–8
[15] Calvo, P., Remuñan –López, C., Vila-Jato, J.L., Alonso, M.J., Novel hydrophilic chitosan-polyethylene oxide nanoparticles as protein carriers. 63(1997b) 125-132.
[16] Lauric acid for synthesis. CAS 143-07-7, EC Number 205-582-1, chemical formula CH₃(CH₂)₁₀COOH. Sigma-Aldrich.
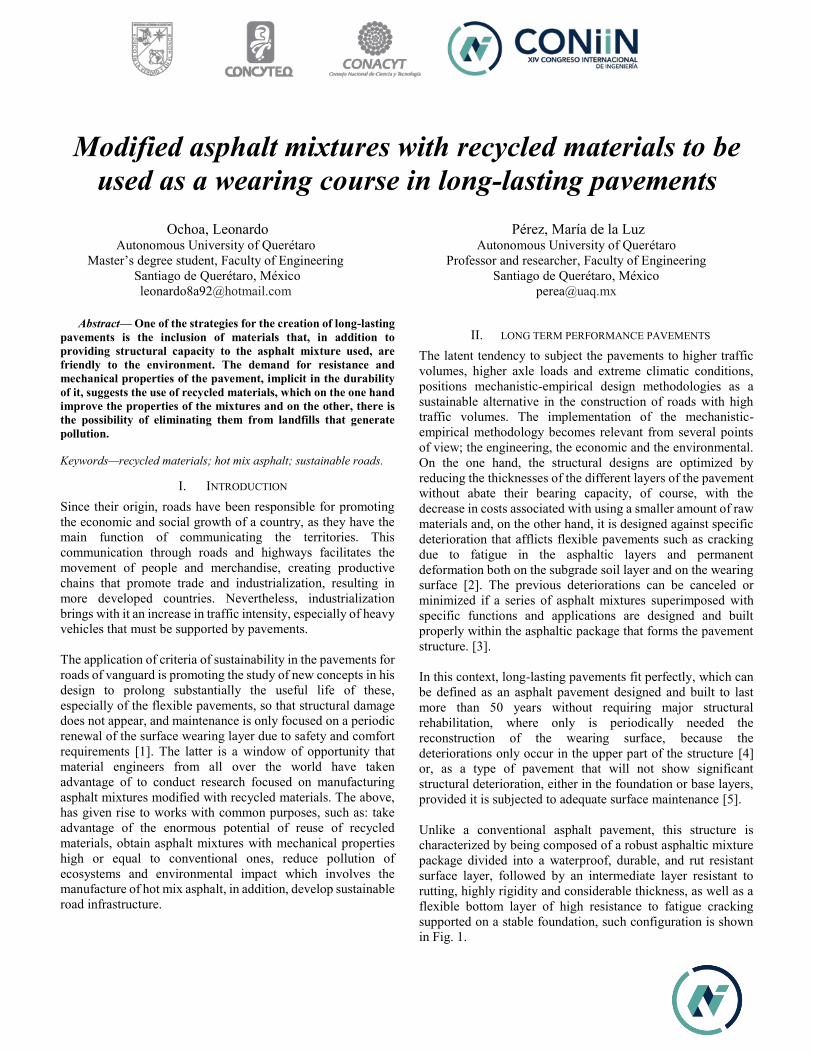
Modified asphalt mixtures with recycled materials to be used as a wearing course in long-lasting pavements
Ochoa, Leonardo Autonomous University of Querétaro
Master’s degree student, Faculty of Engineering Santiago de Querétaro, México
Pérez, María de la Luz Autonomous University of Querétaro
Professor and researcher, Faculty of Engineering Santiago de Querétaro, México
Abstract— One of the strategies for the creation of long-lasting pavements is the inclusion of materials that, in addition to providing structural capacity to the asphalt mixture used, are friendly to the environment. The demand for resistance and mechanical properties of the pavement, implicit in the durability of it, suggests the use of recycled materials, which on the one hand improve the properties of the mixtures and on the other, there is the possibility of eliminating them from landfills that generate pollution.
Keywords—recycled materials; hot mix asphalt; sustainable roads.
I. INTRODUCTION Since their origin, roads have been responsible for promoting the economic and social growth of a country, as they have the main function of communicating the territories. This communication through roads and highways facilitates the movement of people and merchandise, creating productive chains that promote trade and industrialization, resulting in more developed countries. Nevertheless, industrialization brings with it an increase in traffic intensity, especially of heavy vehicles that must be supported by pavements. The application of criteria of sustainability in the pavements for roads of vanguard is promoting the study of new concepts in his design to prolong substantially the useful life of these, especially of the flexible pavements, so that structural damage does not appear, and maintenance is only focused on a periodic renewal of the surface wearing layer due to safety and comfort requirements [1]. The latter is a window of opportunity that material engineers from all over the world have taken advantage of to conduct research focused on manufacturing asphalt mixtures modified with recycled materials. The above, has given rise to works with common purposes, such as: take advantage of the enormous potential of reuse of recycled materials, obtain asphalt mixtures with mechanical properties high or equal to conventional ones, reduce pollution of ecosystems and environmental impact which involves the manufacture of hot mix asphalt, in addition, develop sustainable road infrastructure.
II. LONG TERM PERFORMANCE PAVEMENTS The latent tendency to subject the pavements to higher traffic volumes, higher axle loads and extreme climatic conditions, positions mechanistic-empirical design methodologies as a sustainable alternative in the construction of roads with high traffic volumes. The implementation of the mechanistic-empirical methodology becomes relevant from several points of view; the engineering, the economic and the environmental. On the one hand, the structural designs are optimized by reducing the thicknesses of the different layers of the pavement without abate their bearing capacity, of course, with the decrease in costs associated with using a smaller amount of raw materials and, on the other hand, it is designed against specific deterioration that afflicts flexible pavements such as cracking due to fatigue in the asphaltic layers and permanent deformation both on the subgrade soil layer and on the wearing surface [2]. The previous deteriorations can be canceled or minimized if a series of asphalt mixtures superimposed with specific functions and applications are designed and built properly within the asphaltic package that forms the pavement structure. [3]. In this context, long-lasting pavements fit perfectly, which can be defined as an asphalt pavement designed and built to last more than 50 years without requiring major structural rehabilitation, where only is periodically needed the reconstruction of the wearing surface, because the deteriorations only occur in the upper part of the structure [4] or, as a type of pavement that will not show significant structural deterioration, either in the foundation or base layers, provided it is subjected to adequate surface maintenance [5]. Unlike a conventional asphalt pavement, this structure is characterized by being composed of a robust asphaltic mixture package divided into a waterproof, durable, and rut resistant surface layer, followed by an intermediate layer resistant to rutting, highly rigidity and considerable thickness, as well as a flexible bottom layer of high resistance to fatigue cracking supported on a stable foundation, such configuration is shown in Fig. 1.
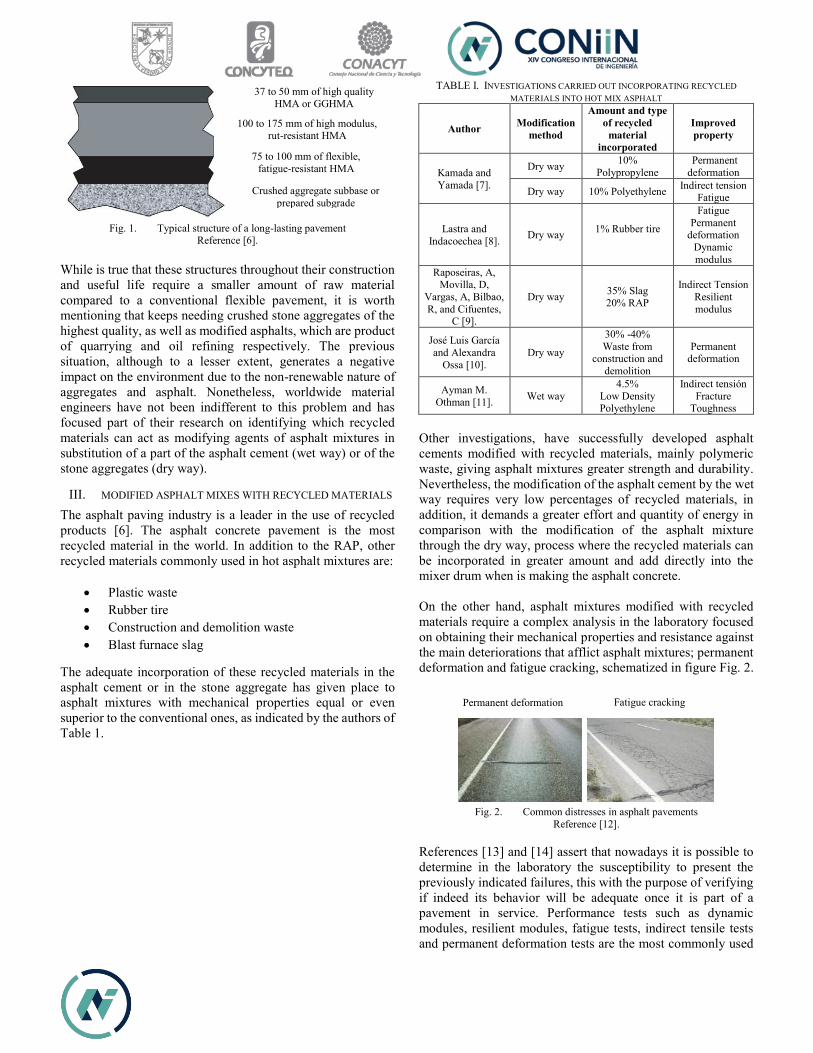
Fig. 1. Typical structure of a long-lasting pavement
Reference [6]. While is true that these structures throughout their construction and useful life require a smaller amount of raw material compared to a conventional flexible pavement, it is worth mentioning that keeps needing crushed stone aggregates of the highest quality, as well as modified asphalts, which are product of quarrying and oil refining respectively. The previous situation, although to a lesser extent, generates a negative impact on the environment due to the non-renewable nature of aggregates and asphalt. Nonetheless, worldwide material engineers have not been indifferent to this problem and has focused part of their research on identifying which recycled materials can act as modifying agents of asphalt mixtures in substitution of a part of the asphalt cement (wet way) or of the stone aggregates (dry way).
III. MODIFIED ASPHALT MIXES WITH RECYCLED MATERIALS The asphalt paving industry is a leader in the use of recycled products [6]. The asphalt concrete pavement is the most recycled material in the world. In addition to the RAP, other recycled materials commonly used in hot asphalt mixtures are:
• Plastic waste • Rubber tire • Construction and demolition waste • Blast furnace slag
The adequate incorporation of these recycled materials in the asphalt cement or in the stone aggregate has given place to asphalt mixtures with mechanical properties equal or even superior to the conventional ones, as indicated by the authors of Table 1.
TABLE I. INVESTIGATIONS CARRIED OUT INCORPORATING RECYCLED MATERIALS INTO HOT MIX ASPHALT
Author Modification method
Amount and type of recycled
material incorporated
Improved property
Kamada and Yamada [7].
Dry way 10% Polypropylene
Permanent deformation
Dry way 10% Polyethylene Indirect tension Fatigue
Lastra and Indacoechea [8]. Dry way 1% Rubber tire
Fatigue Permanent
deformation Dynamic modulus
Raposeiras, A, Movilla, D,
Vargas, A, Bilbao, R, and Cifuentes,
C [9].
Dry way 35% Slag 20% RAP
Indirect Tension Resilient modulus
José Luis García and Alexandra
Ossa [10]. Dry way
30% -40% Waste from
construction and demolition
Permanent deformation
Ayman M. Othman [11]. Wet way
4.5% Low Density Polyethylene
Indirect tensión Fracture
Toughness
Other investigations, have successfully developed asphalt cements modified with recycled materials, mainly polymeric waste, giving asphalt mixtures greater strength and durability. Nevertheless, the modification of the asphalt cement by the wet way requires very low percentages of recycled materials, in addition, it demands a greater effort and quantity of energy in comparison with the modification of the asphalt mixture through the dry way, process where the recycled materials can be incorporated in greater amount and add directly into the mixer drum when is making the asphalt concrete. On the other hand, asphalt mixtures modified with recycled materials require a complex analysis in the laboratory focused on obtaining their mechanical properties and resistance against the main deteriorations that afflict asphalt mixtures; permanent deformation and fatigue cracking, schematized in figure Fig. 2.
Fig. 2. Common distresses in asphalt pavements
Reference [12].
References [13] and [14] assert that nowadays it is possible to determine in the laboratory the susceptibility to present the previously indicated failures, this with the purpose of verifying if indeed its behavior will be adequate once it is part of a pavement in service. Performance tests such as dynamic modules, resilient modules, fatigue tests, indirect tensile tests and permanent deformation tests are the most commonly used
37 to 50 mm of high quality HMA or GGHMA
100 to 175 mm of high modulus, rut-resistant HMA
75 to 100 mm of flexible, fatigue-resistant HMA
Crushed aggregate subbase or prepared subgrade
Permanent deformation Fatigue cracking

to characterize in terms of resistance to asphalt mixtures. The tests mentioned above are performed in equipment such as those shown in Fig. 3.
Fig. 3. Simulation and performance equipment for asphalt mixtures.
Reference [6]. In the case of long-lasting pavements where its design philosophy stipulates that there should be no damage to the underlays to the wearing surface, the engineering of pavements has developed modified asphalts with polymers (elastomers and plastomers mainly) of proven quality that endow the asphalt mixtures with high rigidity and flexibility for the intermediate layers of high module anti-deformation and the bottom layers absorbing tension respectively. In this sense, there is a very wide window of opportunity to use recycled materials in asphalt mixtures whose purpose is to serve as a surface layer, as a sustainable and durable alternative to existing wearing layers. The above, based on the greater ease involved in removing or replacing the surface layer of the pavement compared to the lower layers, if the road layer formed by asphalt mix and recycled materials does not behave or have the performance expected. Evidently, the wearing course surface is the first element of contact between the structure of the pavement and the main destructive agents to which it is exposed during its useful life. The latter, represented by vehicular loads and environmental conditions, generate certain deteriorations that cannot be completely annulled by the asphaltic layer. As it is known, none hot mix asphalt can by itself withstand deformation, fatigue or moisture damage all at once, since highly rigid asphalt mixtures with low susceptibility to permanent deformation are prone to cracking and fissuring, in the same way, asphalt mixtures rich in asphalt highly flexibles and with high resistance to fatigue are prone to deformation. However, the theoretical support and the positive results obtained in various investigations encourage to continue incorporating in the asphalt mixtures recycled materials that precisely transfer that elasticity or rigidity to the mix asphalt, even using two or more recycled materials in the same mixture in search of that duality or balance of mechanical properties that a wearing course demands when is looking for a prolonged durability.
IV. CONCLUSIONS
From a perspective of environmental care, long-lasting pavements represent a great advance in the construction of sustainable roads and, even more if within their structure they are able to incorporate recycled materials that provides an increase in the useful life of their different asphalt layers, instead of being part of the pollutant landfills, thus restoring its economic value in a second life cycle, favoring a saving of energy and raw materials without prejudice to health, ecosystems or their elements.
ACKNOWLEDGMENT
The authors of this paper express their gratitude to the National Council of Science and Technology (CONACyT) as well as to the specialists responsible for reviewing this document.
REFERENCES [1] García-Santiago, J. L. (Octubre de 2008). “Pavimentos de Larga duración, Proyecto
Fénix”. En H. Campo (Presidencia). 8° Congreso Nacional de Firmes, Asociación Española de la Carretera, Congreso llevado a cabo en la ciudad de Valladolid, España.
[2] Asphalt Institute. (1996). “Background of SUPERPAVE ASPHALT MIXTURES DESIGN and ANALYSIS”. United States of America.
[3] European Commission. (1999). “COST 333 Final report of the action: Development of New Bituminous Pavement Design Method”. Directorate General Transport. Brussels, Belgium.
[4] Newcomb, D., Willis, R., and Timm, D. (2010). “Perpetual Asphalt Pavements: A Synthesis”. Asphalt Pavement Alliance, United States.
[5] Ferne B., Gáspár L., Gorski M., Van Dommelen A., Merril D., Nunn M., Larsen H. and Turstchy J. (2004). “FEHRL Report 2004/01 ELLPAG Pashe 1: A guide to the use of Long-Life Fully-Flexible Pavements”. European Long-Live Pavement Group. Brussels, Belgium.
[6] Transportation Research Board. (2011). “A Manual for Design of Hot-Mix Asphalt with Commentary”. National Cooperative Highway Research Program. NCHRP Report 673. Washington, D.C.
[7] Kamada, O. and Yamada, M. (2002). “Utilization of waste plastics in asphalt mixtures”. Memoirs of the Faculty of Engineering, Vol. 43, pp. 111-118. Osaka, Japan.
[8] Lastra-González, P and Indacoechea-Vega, I. (2014). Reporte Técnico No. 174. “Proyecto Polymix, valorizacion de residuos polímeros en mezclas bituminosas”. RETEMA: Especial de reciclaje. Vol. 27 No. 172, pp. 18-21. España.
[9] A. Raposeiras, D. Movilla, A. Vargas, R. Bilbao and C. Cifuentes. (2017). “Evaluación de rigidez Marshall, tracción indirecta y módulo resiliente en mezclas asfálticas con RAP y escoria de cobre”. Revista ingeniería de construcción. Chile, vol. 32, pp. 15-24.
[10] Ossa López A. and García Salas, J.L.(2015). “Reciclaje de residuos para uso en carpetas asfálticas”. Revista Mexicana de la Construcción. No. 616, pp. 5-10. México.
[11] Othman-Mahmoud, A. (2010). “Effect of Low-Density Polyethylene On Fracture Toughness of Asphalt Concrete Mixtures”. Journal of Materials in Civil Engineering. Vol 22, No.10, pp. 1019-1024.
[12] John S. Miller and William Y. Bellinger. (2003). “Distress Identification Manual for the Long-Term Pavement Performance Program”. Federal Highway Administration. U.S Department of Transportation.
[13] Leiva-Villacorta, F. (2005). “Diseño de una estructura de pavimentos perpetuo (Caso de estudio de una ruta nacional en Costa Rica)”. Universidad de Costa Rica, Laboratorio Nacional de Materiales y Modelos Estructurales (LANAMME), Costa Rica.
[14] Limón Garduño, L. G. (Agosto de 2015). “Innovación y Tecnología en la conservación de pavimentos flexibles”. En J.F. Verdugo (Presidencia). 9° Seminario de ingeniería vial Congreso llevado a cabo en la ciudad de San Luis Potosí, México.
Comparison between PET based prefabricated sidewalks and simple concrete sidewalks
Hernández Guerrero María Guadalupe Facultad de Ingeniería
Universidad Autónoma de Querétaro Querétaro, México
Alcantar Rodríguez Montserrat Facultad de Ingeniería
Universidad Autónoma de Querétaro Querétaro, México
Vargas Resendiz Daniel Facultad de Ingeniería
Universidad Autónoma de Querétaro Querétaro, México
Muñoz Rico Alejandro Facultad de Ingeniería
Universidad Autónoma de Querétaro Querétaro, México
Razura Navarro Gerardo Facultad de Ingeniería
Universidad Autónoma de Querétaro Querétaro, México
Abstract
In the present paper the results of some tests performed on concrete reinforced with fibers made from waste polyethylene terephthalate (PET) bottles are reported. Investigation was carried out on two groups of mortar samples, one made with only sand aggregates and, second made with PET and sand aggregates together. The cement mix for the two types of sidewalk was calculated with a water-cement proprotion of 0.8 and a strenght of 150 kgf/cm2. The fibers have been obtained by simply cutting the bottles, we got together 5.3 kg of plastic. The quantity for the mass of PET was calculated in function of the volume for the concrete mix needed. The tests are to be considered as an approach to a more extensive investigation on the use of PET as a reinforcing material for concrete in the construction industry. The main tests applied to specimens were compression strength and absorption. The results that have been obtained are very interesting, especially regarding the absorption in the mix between PET and concrete, the reduction in compressive strength as a result of PET waste inclusion obtained was expected. Is possible to use
recycled PET in concrete considering the final use of the mixture and the strength required depending on the destination of the materials, in our case for sidewalks.
Keywords
PET, Sidewalk, Concrete, Mortars, Compression strength, Absorption.
I. INTRODUCTION With the growing demand of sustainability and the boundless growth of population in cities, walking has been profiled as one of the principal means of transportation for people who travel short distances. As a consequence of this, it becomes necessary to connect all ways with sidewalks so people can make use of adequate and safe roads. (Maria V. C., 2016). Hence, it is recommended to include variables that can be associate with sidewalks, pedestrian activities and safety (Ahmed O., 2017). An example is the concrete, this represents one of the most important
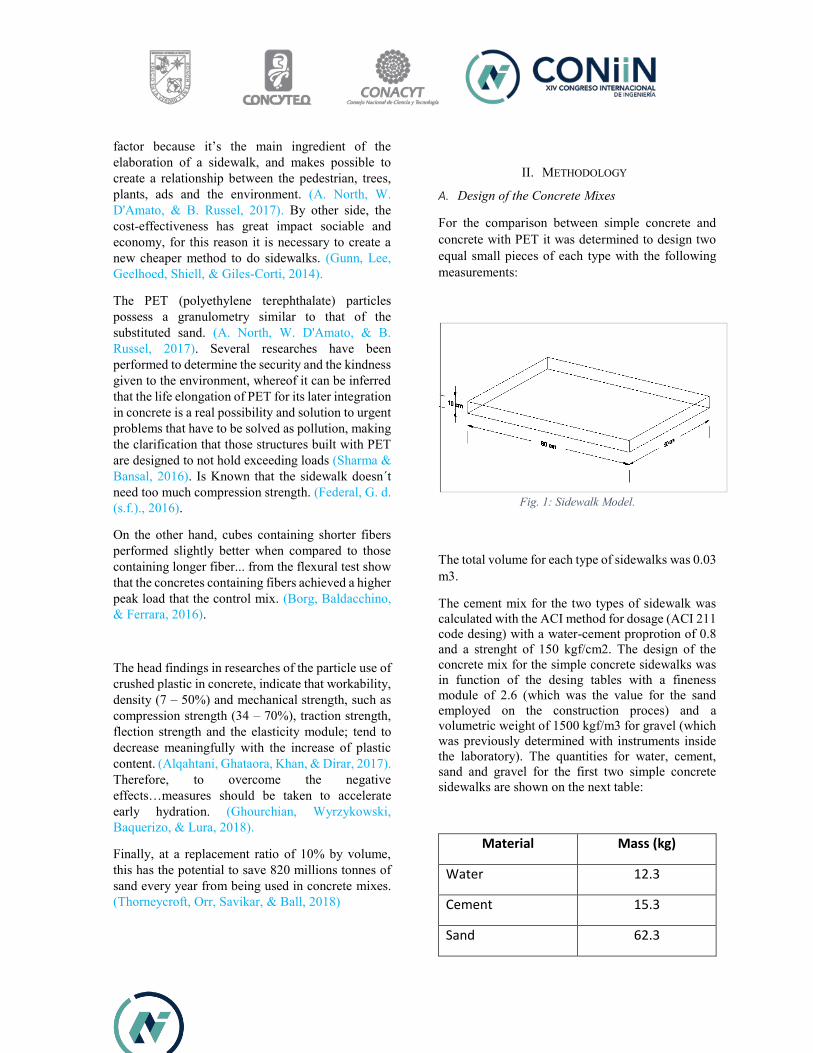
factor because it’s the main ingredient of the elaboration of a sidewalk, and makes possible to create a relationship between the pedestrian, trees, plants, ads and the environment. (A. North, W. D'Amato, & B. Russel, 2017). By other side, the cost-effectiveness has great impact sociable and economy, for this reason it is necessary to create a new cheaper method to do sidewalks. (Gunn, Lee, Geelhoed, Shiell, & Giles-Corti, 2014).
The PET (polyethylene terephthalate) particles possess a granulometry similar to that of the substituted sand. (A. North, W. D'Amato, & B. Russel, 2017). Several researches have been performed to determine the security and the kindness given to the environment, whereof it can be inferred that the life elongation of PET for its later integration in concrete is a real possibility and solution to urgent problems that have to be solved as pollution, making the clarification that those structures built with PET are designed to not hold exceeding loads (Sharma & Bansal, 2016). Is Known that the sidewalk doesn´t need too much compression strength. (Federal, G. d. (s.f.)., 2016).
On the other hand, cubes containing shorter fibers performed slightly better when compared to those containing longer fiber... from the flexural test show that the concretes containing fibers achieved a higher peak load that the control mix. (Borg, Baldacchino, & Ferrara, 2016).
The head findings in researches of the particle use of crushed plastic in concrete, indicate that workability, density (7 – 50%) and mechanical strength, such as compression strength (34 – 70%), traction strength, flection strength and the elasticity module; tend to decrease meaningfully with the increase of plastic content. (Alqahtani, Ghataora, Khan, & Dirar, 2017). Therefore, to overcome the negative effects…measures should be taken to accelerate early hydration. (Ghourchian, Wyrzykowski, Baquerizo, & Lura, 2018).
Finally, at a replacement ratio of 10% by volume, this has the potential to save 820 millions tonnes of sand every year from being used in concrete mixes. (Thorneycroft, Orr, Savikar, & Ball, 2018)
II. METHODOLOGY
A. Design of the Concrete Mixes
For the comparison between simple concrete and concrete with PET it was determined to design two equal small pieces of each type with the following measurements:
Fig. 1: Sidewalk Model.
The total volume for each type of sidewalks was 0.03 m3.
The cement mix for the two types of sidewalk was calculated with the ACI method for dosage (ACI 211 code desing) with a water-cement proprotion of 0.8 and a strenght of 150 kgf/cm2. The design of the concrete mix for the simple concrete sidewalks was in function of the desing tables with a fineness module of 2.6 (which was the value for the sand employed on the construction proces) and a volumetric weight of 1500 kgf/m3 for gravel (which was previously determined with instruments inside the laboratory). The quantities for water, cement, sand and gravel for the first two simple concrete sidewalks are shown on the next table:
Material Mass (kg)
Water 12.3
Cement 15.3
Sand 62.3
Gravel 28.8
Table 1: Base mix.
After that estimation for water, cement, sand and gravel, the quantity for the mass of PET was calculated in function of the volume for the concrete mix needed, keeping in mind that this quantity of PET was goint to replace the volume of sand. Finally, the quantities for the concrete with PET sidewalks are the next:
Material Mass (kg)
Water 12.3
Cement 15.3
Sand 35
Gravel 28.8
PET 5
Table 2: Mix with PET.
B. Obtainment of sand and gravel
For the obtainment of sand and gravel, it was necessary to sieve both sand and gravel with the sieves number 4 for sand, and the sieves number 3/4 and 4 for gravel.
Fig. 2: Sieving of Gravel.
C. Obtainment of PET
For the trituration of PET, it was first required to collect as much plastic bottles as needed inside the engineering school. They were collected in all the trash cans inside the classrooms but mostly from a big PET collector at the center of the engineering school. Approximately, 160 plastic bottles were collected, the most of 600 ml and the rest of 1000 ml. Finally, we got together 5.3 kg of plastic.
After the collection, the bottles were removed from its caps and its commercial labels, so they could be easier to cut.
First, the bottles were smashed manually and then they were perpendicularly cut with shears across their horizontal axe, having the bottle normally standing.
Fig. 3: PET bottle cut horizontally.
The next step was to locate points every centimeter with a black marker at the top and the bottom of the bottle, and then to cut again the plastic rows obtained before to finish with small pieces, approximately squares of 1 cm per side.
Fig. 5: Plastic rows cut with shears.
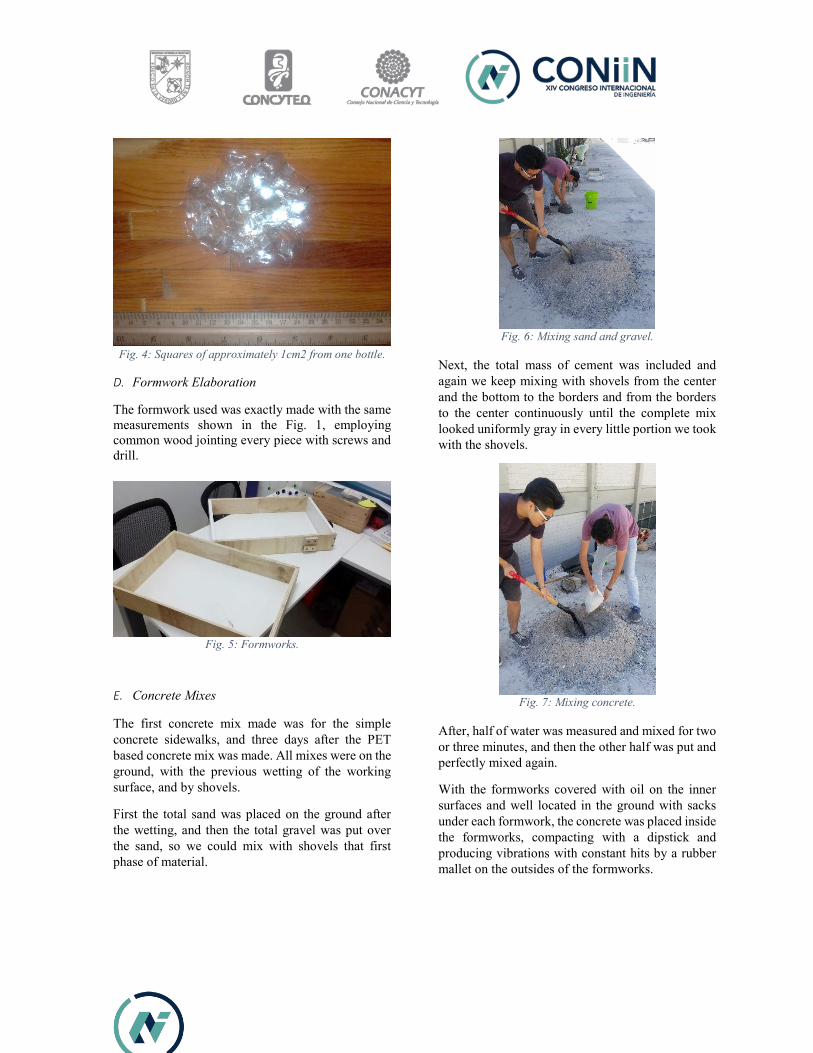
Fig. 4: Squares of approximately 1cm2 from one bottle.
D. Formwork Elaboration
The formwork used was exactly made with the same measurements shown in the Fig. 1, employing common wood jointing every piece with screws and drill.
Fig. 5: Formworks.
E. Concrete Mixes
The first concrete mix made was for the simple concrete sidewalks, and three days after the PET based concrete mix was made. All mixes were on the ground, with the previous wetting of the working surface, and by shovels.
First the total sand was placed on the ground after the wetting, and then the total gravel was put over the sand, so we could mix with shovels that first phase of material.
Fig. 6: Mixing sand and gravel.
Next, the total mass of cement was included and again we keep mixing with shovels from the center and the bottom to the borders and from the borders to the center continuously until the complete mix looked uniformly gray in every little portion we took with the shovels.
Fig. 7: Mixing concrete.
After, half of water was measured and mixed for two or three minutes, and then the other half was put and perfectly mixed again.
With the formworks covered with oil on the inner surfaces and well located in the ground with sacks under each formwork, the concrete was placed inside the formworks, compacting with a dipstick and producing vibrations with constant hits by a rubber mallet on the outsides of the formworks.

F. Sidewalks Specimens
Four specimens were fabricated, two pieces of normal simple concrete (like usual sidewalks) with f’c of 150 kgf/cm2 (for the dosage was applied the ACI 211 design code) and two PET-Based specimens with dosage described in the previous point changing only a percent of sand for PET and same water-cement ratio to compare the difference between simple concrete and PET Based Concrete Sidewalks. Specimens were poured in the formwork designed for the prototype whose dimensions were described in a previous point. After 28 days curing (inside a moist curing room) specimens were removed for testing. For testing, specimens were cut to measurements required by official norm in Mexico (NMX-C-083-ONNCCE-2014). This norm controls the procedure for compression strength. Final measurements were cubes of 100mm per edge.
G. Testing and measurements
The main tests applied to specimens were compression strength and absorption. These tests are important characteristics in sidewalks to determinate a durability degree. Compression strength test was applied with parameters and procedures of official norm in Mexico NMX-C-083-ONNCCE-2014. For absorption test were applied the parameters and procedures of official norm in Mexico NMX-C-155-ONNCCE-2014. Testing was made in the laboratory of engineering faculty of Autonomous University of Querétaro (UAQ) with machines and apparatus certified. Specimens were called as: CS1 (Control specimen 1), CS2 (Control specimen 2), PBS1 (Pet-based specimen1), PBS1 (Pet-based specimen1). In the next table results are summarized:
Specimen Compression Strength (kgf/cm2)
Absorption (%)
Volumetric Weight (kg/m3)
CS1 146.54 9.36 2237 CS2 148.33 8.97 2249
PBS1 112.83 7.46 2189 PBS2 115.57 7.09 2183
Table 3 Dates
III. RESULTS AND DISCUSSION
A. Concrete compression strength.
Results of compression strength are shown in table 3. As is measurable, compression strength in pet-based specimens are lower than control specimen. The reduction in compression strength is an average of 22.54 %. The reduction in compressive strength as a result of PET waste inclusion obtained in the current study is expected. There are many test data in the literature support this evidence. The loss in compression strength is related with non-homogeneous mix of concrete due to the pet particles. Perhaps it could be adherence problem and it would be an excellent field of investigation to enhance this idea of pet-based concrete.
In the next figure is shown the reduction in compression strength varying the pet volume in the mix (Mohammed, A. A. (2017). Flexural behavior and analysis of reinforced concrete beams made of recycled PET waste concrete. Construction and Building Materials, 593-604)
Fig 10 Flexural behavior
However, compression strength is not the only important characteristic for this investigation, in sidewalks compression strength is very low compared with structural elements in other buildings. Regularly strength in sidewalks is f’c=100 kg/cm2. For this reason, is important to think off in other benefits that pet-based sidewalks could give us. In this investigation is not considered the
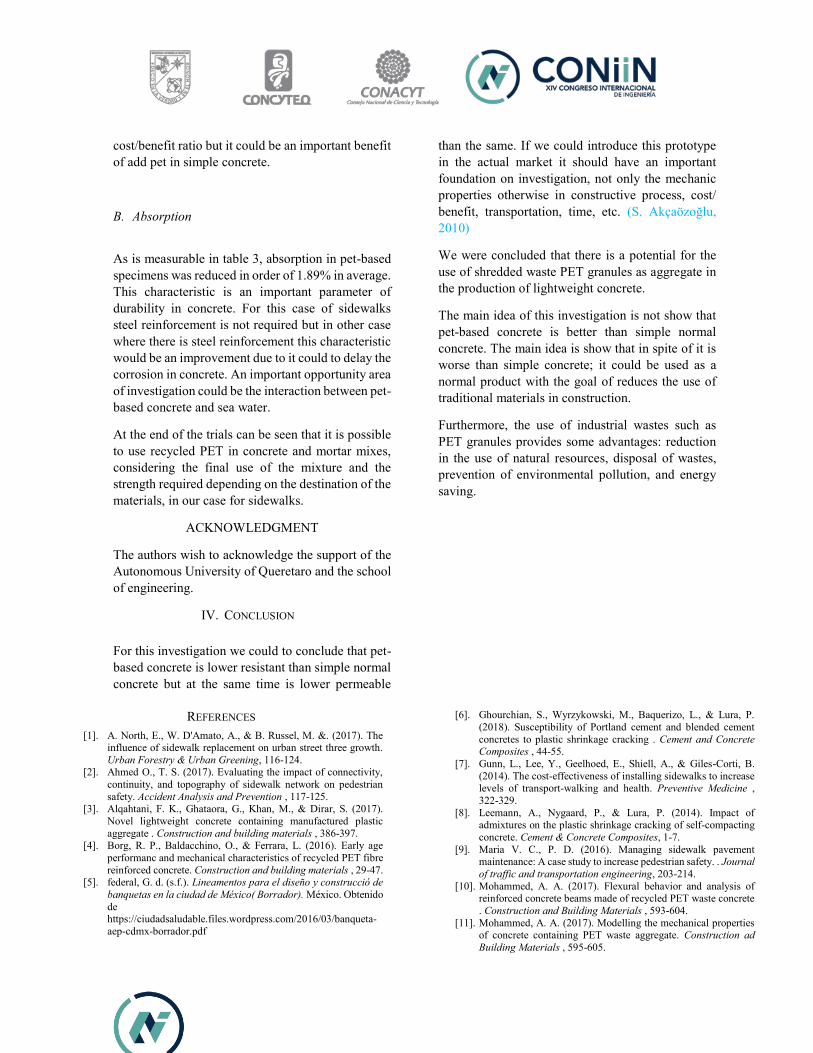
cost/benefit ratio but it could be an important benefit of add pet in simple concrete.
B. Absorption
As is measurable in table 3, absorption in pet-based specimens was reduced in order of 1.89% in average. This characteristic is an important parameter of durability in concrete. For this case of sidewalks steel reinforcement is not required but in other case where there is steel reinforcement this characteristic would be an improvement due to it could to delay the corrosion in concrete. An important opportunity area of investigation could be the interaction between pet-based concrete and sea water.
At the end of the trials can be seen that it is possible to use recycled PET in concrete and mortar mixes, considering the final use of the mixture and the strength required depending on the destination of the materials, in our case for sidewalks.
ACKNOWLEDGMENT
The authors wish to acknowledge the support of the Autonomous University of Queretaro and the school of engineering.
IV. CONCLUSION
For this investigation we could to conclude that pet-based concrete is lower resistant than simple normal concrete but at the same time is lower permeable
than the same. If we could introduce this prototype in the actual market it should have an important foundation on investigation, not only the mechanic properties otherwise in constructive process, cost/ benefit, transportation, time, etc. (S. Akçaözoğlu, 2010)
We were concluded that there is a potential for the use of shredded waste PET granules as aggregate in the production of lightweight concrete.
The main idea of this investigation is not show that pet-based concrete is better than simple normal concrete. The main idea is show that in spite of it is worse than simple concrete; it could be used as a normal product with the goal of reduces the use of traditional materials in construction.
Furthermore, the use of industrial wastes such as PET granules provides some advantages: reduction in the use of natural resources, disposal of wastes, prevention of environmental pollution, and energy saving.
REFERENCES [1]. A. North, E., W. D'Amato, A., & B. Russel, M. &. (2017). The
influence of sidewalk replacement on urban street three growth. Urban Forestry & Urban Greening, 116-124.
[2]. Ahmed O., T. S. (2017). Evaluating the impact of connectivity, continuity, and topography of sidewalk network on pedestrian safety. Accident Analysis and Prevention , 117-125.
[3]. Alqahtani, F. K., Ghataora, G., Khan, M., & Dirar, S. (2017). Novel lightweight concrete containing manufactured plastic aggregate . Construction and building materials , 386-397.
[4]. Borg, R. P., Baldacchino, O., & Ferrara, L. (2016). Early age performanc and mechanical characteristics of recycled PET fibre reinforced concrete. Construction and building materials , 29-47.
[5]. federal, G. d. (s.f.). Lineamentos para el diseño y construcció de banquetas en la ciudad de México( Borrador). México. Obtenido de https://ciudadsaludable.files.wordpress.com/2016/03/banqueta-aep-cdmx-borrador.pdf
[6]. Ghourchian, S., Wyrzykowski, M., Baquerizo, L., & Lura, P. (2018). Susceptibility of Portland cement and blended cement concretes to plastic shrinkage cracking . Cement and Concrete Composites , 44-55.
[7]. Gunn, L., Lee, Y., Geelhoed, E., Shiell, A., & Giles-Corti, B. (2014). The cost-effectiveness of installing sidewalks to increase levels of transport-walking and health. Preventive Medicine , 322-329.
[8]. Leemann, A., Nygaard, P., & Lura, P. (2014). Impact of admixtures on the plastic shrinkage cracking of self-compacting concrete. Cement & Concrete Composites, 1-7.
[9]. Maria V. C., P. D. (2016). Managing sidewalk pavement maintenance: A case study to increase pedestrian safety. . Journal of traffic and transportation engineering, 203-214.
[10]. Mohammed, A. A. (2017). Flexural behavior and analysis of reinforced concrete beams made of recycled PET waste concrete . Construction and Building Materials , 593-604.
[11]. Mohammed, A. A. (2017). Modelling the mechanical properties of concrete containing PET waste aggregate. Construction ad Building Materials , 595-605.
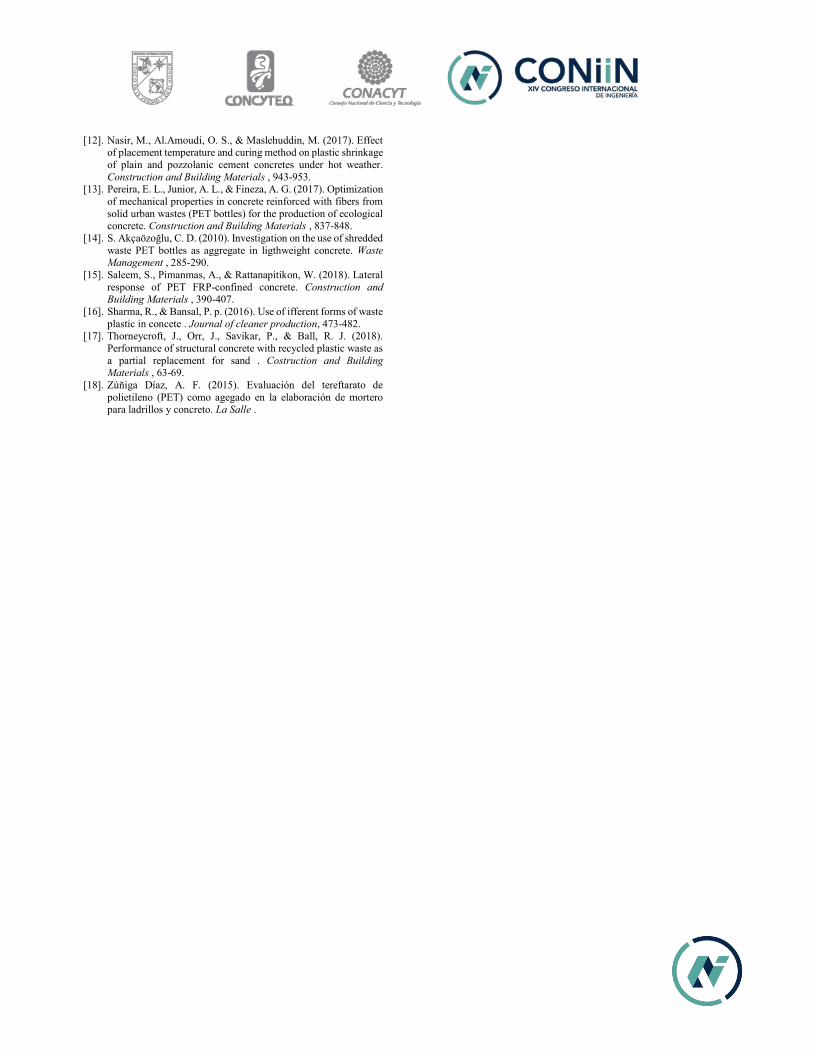
[12]. Nasir, M., Al.Amoudi, O. S., & Maslehuddin, M. (2017). Effect of placement temperature and curing method on plastic shrinkage of plain and pozzolanic cement concretes under hot weather. Construction and Building Materials , 943-953.
[13]. Pereira, E. L., Junior, A. L., & Fineza, A. G. (2017). Optimization of mechanical properties in concrete reinforced with fibers from solid urban wastes (PET bottles) for the production of ecological concrete. Construction and Building Materials , 837-848.
[14]. S. Akçaözoğlu, C. D. (2010). Investigation on the use of shredded waste PET bottles as aggregate in ligthweight concrete. Waste Management , 285-290.
[15]. Saleem, S., Pimanmas, A., & Rattanapitikon, W. (2018). Lateral response of PET FRP-confined concrete. Construction and Building Materials , 390-407.
[16]. Sharma, R., & Bansal, P. p. (2016). Use of ifferent forms of waste plastic in concete . Journal of cleaner production, 473-482.
[17]. Thorneycroft, J., Orr, J., Savikar, P., & Ball, R. J. (2018). Performance of structural concrete with recycled plastic waste as a partial replacement for sand . Costruction and Building Materials , 63-69.
[18]. Zúñiga Díaz, A. F. (2015). Evaluación del tereftarato de polietileno (PET) como agegado en la elaboración de mortero para ladrillos y concreto. La Salle .
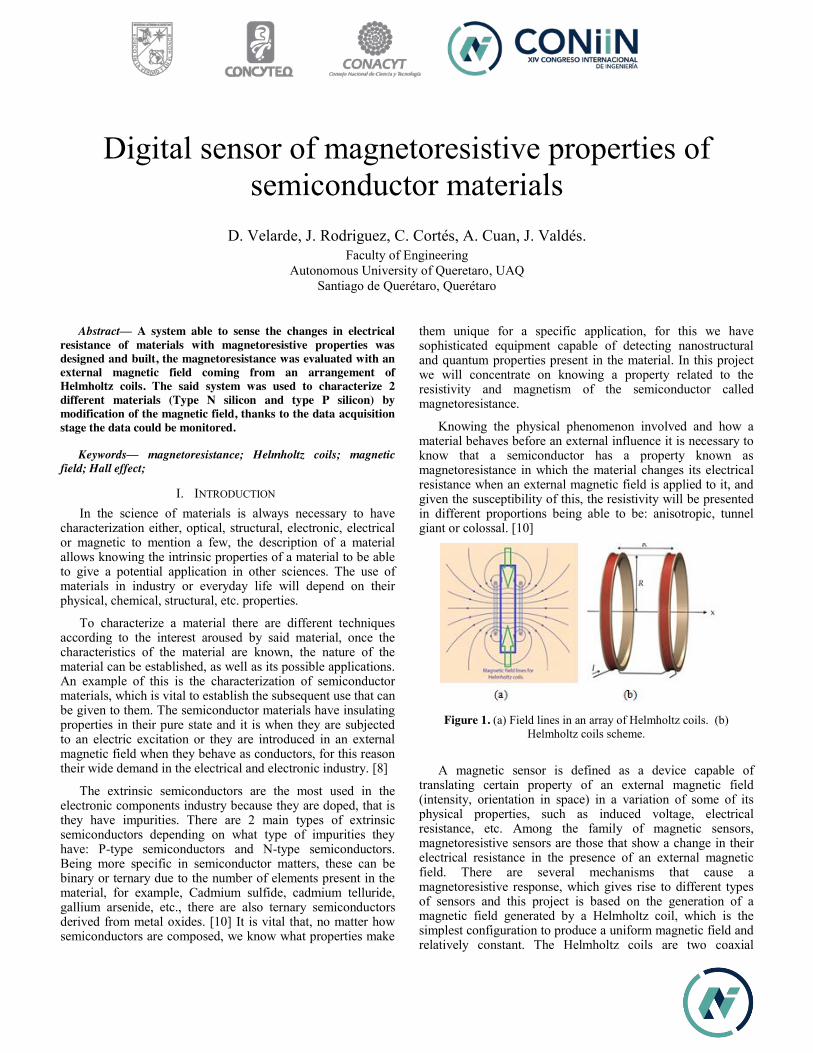
Digital sensor of magnetoresistive properties of semiconductor materials
D. Velarde, J. Rodriguez, C. Cortés, A. Cuan, J. Valdés. Faculty of Engineering
Autonomous University of Queretaro, UAQ Santiago de Querétaro, Querétaro
Abstract— A system able to sense the changes in electrical resistance of materials with magnetoresistive properties was designed and built, the magnetoresistance was evaluated with an external magnetic field coming from an arrangement of Helmholtz coils. The said system was used to characterize 2 different materials (Type N silicon and type P silicon) by modification of the magnetic field, thanks to the data acquisition stage the data could be monitored.
Keywords— magnetoresistance; Helmholtz coils; magnetic field; Hall effect;
I. INTRODUCTION In the science of materials is always necessary to have
characterization either, optical, structural, electronic, electrical or magnetic to mention a few, the description of a material allows knowing the intrinsic properties of a material to be able to give a potential application in other sciences. The use of materials in industry or everyday life will depend on their physical, chemical, structural, etc. properties.
To characterize a material there are different techniques according to the interest aroused by said material, once the characteristics of the material are known, the nature of the material can be established, as well as its possible applications. An example of this is the characterization of semiconductor materials, which is vital to establish the subsequent use that can be given to them. The semiconductor materials have insulating properties in their pure state and it is when they are subjected to an electric excitation or they are introduced in an external magnetic field when they behave as conductors, for this reason their wide demand in the electrical and electronic industry. [8]
The extrinsic semiconductors are the most used in the electronic components industry because they are doped, that is they have impurities. There are 2 main types of extrinsic semiconductors depending on what type of impurities they have: P-type semiconductors and N-type semiconductors. Being more specific in semiconductor matters, these can be binary or ternary due to the number of elements present in the material, for example, Cadmium sulfide, cadmium telluride, gallium arsenide, etc., there are also ternary semiconductors derived from metal oxides. [10] It is vital that, no matter how semiconductors are composed, we know what properties make
them unique for a specific application, for this we have sophisticated equipment capable of detecting nanostructural and quantum properties present in the material. In this project we will concentrate on knowing a property related to the resistivity and magnetism of the semiconductor called magnetoresistance.
Knowing the physical phenomenon involved and how a material behaves before an external influence it is necessary to know that a semiconductor has a property known as magnetoresistance in which the material changes its electrical resistance when an external magnetic field is applied to it, and given the susceptibility of this, the resistivity will be presented in different proportions being able to be: anisotropic, tunnel giant or colossal. [10]
Figure 1. (a) Field lines in an array of Helmholtz coils. (b)
Helmholtz coils scheme.
A magnetic sensor is defined as a device capable of translating certain property of an external magnetic field (intensity, orientation in space) in a variation of some of its physical properties, such as induced voltage, electrical resistance, etc. Among the family of magnetic sensors, magnetoresistive sensors are those that show a change in their electrical resistance in the presence of an external magnetic field. There are several mechanisms that cause a magnetoresistive response, which gives rise to different types of sensors and this project is based on the generation of a magnetic field generated by a Helmholtz coil, which is the simplest configuration to produce a uniform magnetic field and relatively constant. The Helmholtz coils are two coaxial

circular coils with the same radius that is equal to the distance between the planes of the coils. When the currents circulate in opposite directions, the configuration is called anti-Helmholtz coils, and is important in several applications such as measurements, biomedical research, calibration of tips and sensors etc. [7].
The investigation of semiconductor materials and device testing often involves determining the resistivity and Hall mobility of a sample. The calculation of its resistivity is obtained through Hall voltage measurements and the Van Der Pauw technique with the help of a SPCB-1 spring clip holder. The resistivity of the semiconductor material depends mainly on bulk doping. In a device, the resistivity can affect the capacitance, the resistance of the series and the threshold voltage. [3]
The resistivity of the semiconductor material is often determined using a four-point probe technique. With a four-probe technique, or Kelvin, two of the probes are used for the current source and the other two probes are used to measure the voltage. The use of four probes eliminates measurement errors due to the resistance of the probe, the scattering resistance under each probe and the contact resistance between each metal probe and the semiconductor material. Because a high impedance voltmeter draws very little current, the voltage drops across the probe resistance, the dispersion resistance and the contact resistance are very small. A common Kelvin technique for determining the resistivity of a semiconductor material is the Van der Pauw (VDP) method which involves applying a current and measuring the voltage using four small contacts on the circumference of a flat sample, arbitrarily, of uniform thickness. This method is particularly useful for measuring very small samples because the geometric spacing of the contacts is not important. The effects due to the size of a sample, which is the approximate spacing of the probe, are irrelevant. [9]
Using this method, the resistivity can be derived from a total of eight measurements that are made around the periphery of the sample with the configurations shown below:
Figure2. Conventional measurement of van der Pauw resistance.
Once all voltage measurements are taken, two resistivity values, ρA and ρB, are obtained as follows:
𝜌𝐴 = ( 𝜋ln2
) f𝐴t𝑆 (V1−V2+V3−V4
4𝑙) (1)
𝜌𝐵 = ( 𝜋ln 2
) f𝐵t𝑆 (V5−V6+V7−V8
4𝑙) (2)
� where: ρA and ρB are volume resistivities in ohm-cm;
� tS is the sample thickness in cm;
� V1–V8 represents the voltages measured by the voltmeter;
� I is the current through the sample in amperes;
� fA and fB are geometrical factors based on sample symmetry.
They are related to the two resistance ratios QA and QB as shown in the following equations (fA = fB = 1 for perfect symmetry).
Once the resistivity values have been obtained, we will know in what proportions the resistivity of the material changed under the influence of a uniform external magnetic field and how sensitive it is magnetically.
II. EXPERIMENTAL METHOLOGY
A. Design and making of the external magnetic field Theoretical design: the use of a Helmholtz coil system was
chosen for its ability to generate uniform magnetic fields in the center of the coil set [1], as shown in Figure 1.
Taking in account the work done by David J. DeTroye and Ronald J. Chase [2] in the design, simulation and measurement of a Helmholtz coil arrangement. A MATLAB program was developed to estimate the magnetic fields from the number of turns, the radius of the coils and the amperage supplied.
With the value of the radius of the proposed 7.5 cm coils and using the program in MATLAB, the different field strengths were calculated for each ampere of the current supplied in the coils. Magnetic fields from 0 to 25 militeslas were searched.
In Figure 3, we can observe the theoretical estimate of the magnetic field generated by each ampere of supplied current.
Figure 3. Magnetic field against supplied current evaluated
theoretically
0
0.005
0.01
0.015
0.02
0.025
0.03
0 1 2 3 4 5
Mag
netic
Fie
ld (T
)
Current (A)
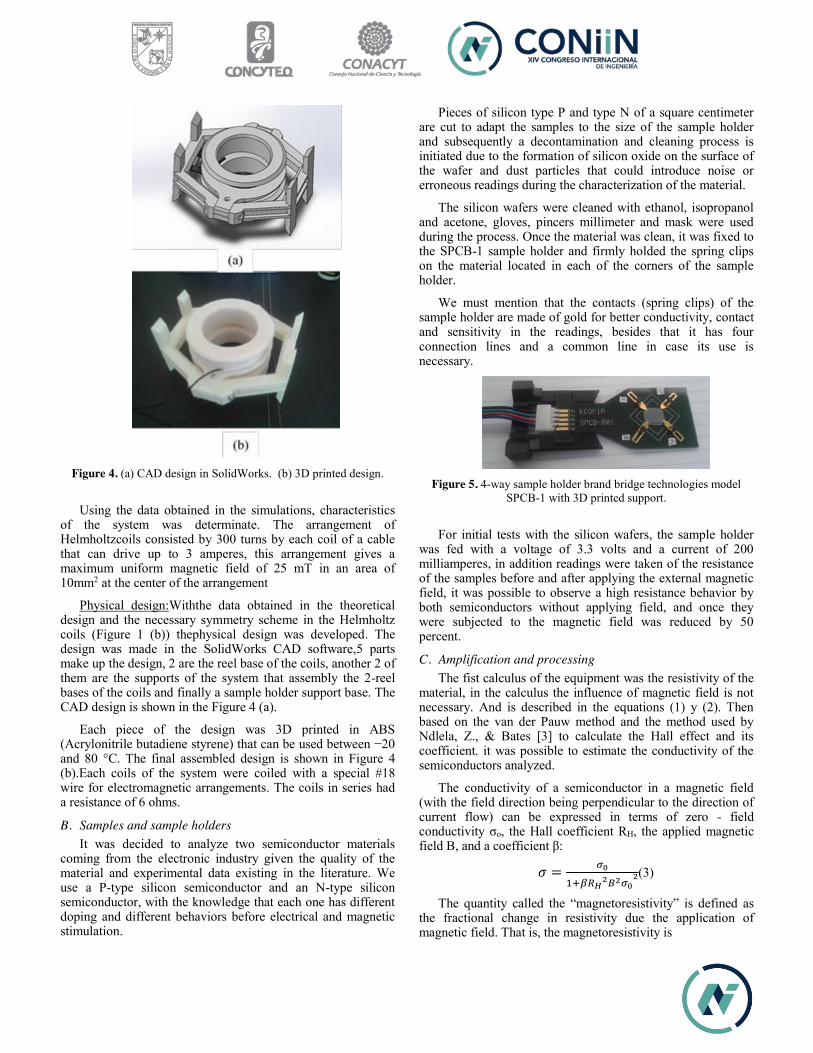
Figure 4. (a) CAD design in SolidWorks. (b) 3D printed design.
Using the data obtained in the simulations, characteristics of the system was determinate. The arrangement of Helmholtzcoils consisted by 300 turns by each coil of a cable that can drive up to 3 amperes, this arrangement gives a maximum uniform magnetic field of 25 mT in an area of 10mm2 at the center of the arrangement
Physical design:Withthe data obtained in the theoretical design and the necessary symmetry scheme in the Helmholtz coils (Figure 1 (b)) thephysical design was developed. The design was made in the SolidWorks CAD software,5 parts make up the design, 2 are the reel base of the coils, another 2 of them are the supports of the system that assembly the 2-reel bases of the coils and finally a sample holder support base. The CAD design is shown in the Figure 4 (a).
Each piece of the design was 3D printed in ABS (Acrylonitrile butadiene styrene) that can be used between −20 and 80 °C. The final assembled design is shown in Figure 4 (b).Each coils of the system were coiled with a special #18 wire for electromagnetic arrangements. The coils in series had a resistance of 6 ohms.
B. Samples and sample holders It was decided to analyze two semiconductor materials
coming from the electronic industry given the quality of the material and experimental data existing in the literature. We use a P-type silicon semiconductor and an N-type silicon semiconductor, with the knowledge that each one has different doping and different behaviors before electrical and magnetic stimulation.
Pieces of silicon type P and type N of a square centimeter are cut to adapt the samples to the size of the sample holder and subsequently a decontamination and cleaning process is initiated due to the formation of silicon oxide on the surface of the wafer and dust particles that could introduce noise or erroneous readings during the characterization of the material.
The silicon wafers were cleaned with ethanol, isopropanol and acetone, gloves, pincers millimeter and mask were used during the process. Once the material was clean, it was fixed to the SPCB-1 sample holder and firmly holded the spring clips on the material located in each of the corners of the sample holder.
We must mention that the contacts (spring clips) of the sample holder are made of gold for better conductivity, contact and sensitivity in the readings, besides that it has four connection lines and a common line in case its use is necessary.
Figure 5. 4-way sample holder brand bridge technologies model
SPCB-1 with 3D printed support.
For initial tests with the silicon wafers, the sample holder was fed with a voltage of 3.3 volts and a current of 200 milliamperes, in addition readings were taken of the resistance of the samples before and after applying the external magnetic field, it was possible to observe a high resistance behavior by both semiconductors without applying field, and once they were subjected to the magnetic field was reduced by 50 percent.
C. Amplification and processing The fist calculus of the equipment was the resistivity of the
material, in the calculus the influence of magnetic field is not necessary. And is described in the equations (1) y (2). Then based on the van der Pauw method and the method used by Ndlela, Z., & Bates [3] to calculate the Hall effect and its coefficient. it was possible to estimate the conductivity of the semiconductors analyzed.
The conductivity of a semiconductor in a magnetic field (with the field direction being perpendicular to the direction of current flow) can be expressed in terms of zero - field conductivity σo, the Hall coefficient RH, the applied magnetic field B, and a coefficient β:
𝜎 = 𝜎01+𝛽𝑅𝐻2𝐵2𝜎0
2(3)
The quantity called the “magnetoresistivity” is defined as the fractional change in resistivity due the application of magnetic field. That is, the magnetoresistivity is
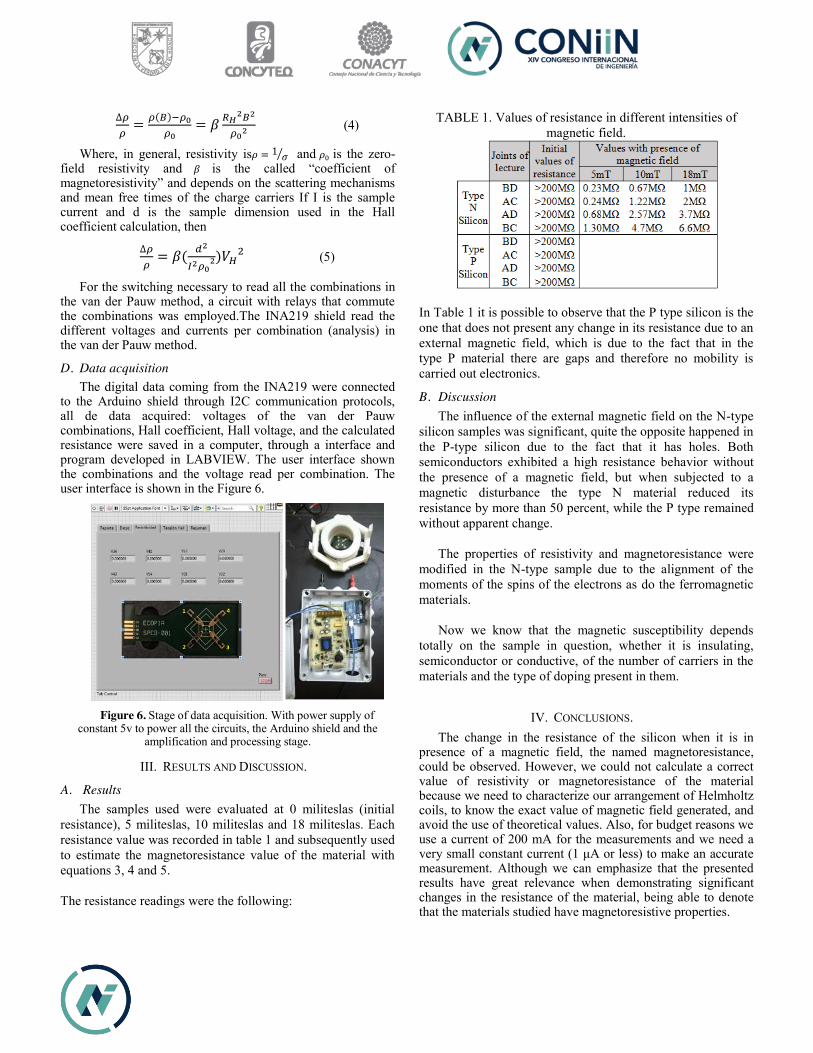
∆𝜌𝜌= 𝜌(𝐵)−𝜌0
𝜌0= 𝛽 𝑅𝐻2𝐵2
𝜌02 (4)
Where, in general, resistivity is𝜌 = 1 𝜎⁄ and 𝜌0 is the zero-field resistivity and 𝛽 is the called “coefficient of magnetoresistivity” and depends on the scattering mechanisms and mean free times of the charge carriers If I is the sample current and d is the sample dimension used in the Hall coefficient calculation, then
∆𝜌𝜌= 𝛽( 𝑑2
𝐼2𝜌02)𝑉𝐻2 (5)
For the switching necessary to read all the combinations in the van der Pauw method, a circuit with relays that commute the combinations was employed.The INA219 shield read the different voltages and currents per combination (analysis) in the van der Pauw method.
D. Data acquisition The digital data coming from the INA219 were connected
to the Arduino shield through I2C communication protocols, all de data acquired: voltages of the van der Pauw combinations, Hall coefficient, Hall voltage, and the calculated resistance were saved in a computer, through a interface and program developed in LABVIEW. The user interface shown the combinations and the voltage read per combination. The user interface is shown in the Figure 6.
Figure 6. Stage of data acquisition. With power supply of
constant 5v to power all the circuits, the Arduino shield and the amplification and processing stage.
III. RESULTS AND DISCUSSION.
A. Results The samples used were evaluated at 0 militeslas (initial
resistance), 5 militeslas, 10 militeslas and 18 militeslas. Each resistance value was recorded in table 1 and subsequently used to estimate the magnetoresistance value of the material with equations 3, 4 and 5.
The resistance readings were the following:
TABLE 1. Values of resistance in different intensities of magnetic field.
In Table 1 it is possible to observe that the P type silicon is the one that does not present any change in its resistance due to an external magnetic field, which is due to the fact that in the type P material there are gaps and therefore no mobility is carried out electronics.
B. Discussion The influence of the external magnetic field on the N-type
silicon samples was significant, quite the opposite happened in the P-type silicon due to the fact that it has holes. Both semiconductors exhibited a high resistance behavior without the presence of a magnetic field, but when subjected to a magnetic disturbance the type N material reduced its resistance by more than 50 percent, while the P type remained without apparent change.
The properties of resistivity and magnetoresistance were
modified in the N-type sample due to the alignment of the moments of the spins of the electrons as do the ferromagnetic materials.
Now we know that the magnetic susceptibility depends
totally on the sample in question, whether it is insulating, semiconductor or conductive, of the number of carriers in the materials and the type of doping present in them.
IV. CONCLUSIONS. The change in the resistance of the silicon when it is in
presence of a magnetic field, the named magnetoresistance, could be observed. However, we could not calculate a correct value of resistivity or magnetoresistance of the material because we need to characterize our arrangement of Helmholtz coils, to know the exact value of magnetic field generated, and avoid the use of theoretical values. Also, for budget reasons we use a current of 200 mA for the measurements and we need a very small constant current (1 μA or less) to make an accurate measurement. Although we can emphasize that the presented results have great relevance when demonstrating significant changes in the resistance of the material, being able to denote that the materials studied have magnetoresistive properties.

V. ACKNOWLEDGMENTS. All the autors thank FOPEFI-2017 the financial support and A. Cuán thanks PRODEP for the financial granted through the Research Project UAQ-PTC-339.
REFERENCES
[1] Trout, S. (1988). Use of Helmholtz coils for magnetic measurements. IEEE Transactions On Magnetics, 24(4), 2108-2111. http://dx.doi.org/10.1109/20.3411
[2] Army Research Laboratory. (1994). The Calculation and Measurement of Helmholtz Coil Fields. Consultado de: http://dtic.mil/dtic/tr/fulltext/u2/a286081.pdf
[3] L. J. van der Pauw, "A Method of Measuring Specific Resistivity and Hall Effect of Discs of Arbitrary Shapes," Philips Res. Repts. 13, 1-9 (1958). Ndlela, Z., & Bates, C. (1989). Sampling procedure for measuring Hall coefficients using the van der Pauw method. Review Of Scientific Instruments, 60(11), 3482-3484. http://dx.doi.org/10.1063/1.1140497
[4] Nickel, J. (1995). Magnetoresistance Overview. Computer Peripherals Laboratory.
[5] De Mey, G., Burvenich, X., & De Molder, M. (1974). Influence of sample geometry on magnetoresistance measurements. Physica Status Solidi (A), 23(1), K45-K48. http://dx.doi.org/10.1002/pssa.2210230151
[6] Marion, D., Cristoloveanu, S., & Chovet, A. (1982). High-magnetic-field Van der Pauw method Magnetoresistance measurement and applications. IEE Proceedings I Solid State And Electron Devices, 129(4), 125. http://dx.doi.org/10.1049/ip-i-1.1982.0027
[7] Fano W. G., Alonso R. y Quintana G, University of Buenos Aires, Department of Electronics, Laboratory of Electromagnetic Radiation, "The magnetic field generated by the Helmholtz coils and their application to the calibration of probes", magazine elektron, Vol. 1, No. 2, pp. 91-96 (2017).
[8] Diego Rubi, Junio 2006 “New Ferromagnetic Metal Oxides", Autonomous University of Barcelona, Department of Physics, Institute of Materials Science of Barcelona, CSIC.
[9] Tektronix, aplication note, van der Pauw and Hall Voltage Measurements with the 4200A-SCS Parameter Analyzer, 2016.
[10] Aron Josué García Moreno, Mayo 2009 “Spintronics and its impact on Communications and Electronics ", School of Mechanical and Electrical Engineering, Culhuacan Unit, National Polytechnic Institute.
Improvement of the mechanical properties of rigid pavements through polymeric additives
Ing. Luis Jaime Pantoja Peña Facultad de Ingeniería
Universidad Autónoma De Querétaro Querétaro, México
Dra. Teresa López Lara Facultad de Ingeniería
Universidad Autónoma De Querétaro Querétaro, México
Dr. Juan Bosco Hernández Zaragoza Facultad de Ingeniería
Universidad Autónoma De Querétaro Querétaro, México
Dr. Jaime Horta Rangel Facultad de Ingeniería
Universidad Autónoma De Querétaro Querétaro, México
I. ABSTRACT This work consists in search and analyze different
investigations where different types of additives are used, experimenting with different proportions, adding them to rigid pavements, in order to make a comparison to determine which are the best substances and the adequate amounts to improve the mechanical properties (mainly compression and flexion) of concrete on our roads.
Key words — Pavements, additives, compression, flexion.
II. INTRODUCTION There is a growing demand in the road infrastructure and the
rigid pavements have been transformed, aiming of improving their behavior and consolidating them as the structures with the longest durability. However, their mechanical properties are sometimes not enough due to the important vehicular flow which they are subjected and also their high cost in the short term can be the biggest disadvantages of concrete roads.
One of the main solutions that have been proposed to optimize the properties of the pavement is the use of additives, chemical substances that interfere directly in concrete by modifying their properties and particular qualities [1], they also help the concrete and reduce costs in construction, as well turn out to be perfectly compatible with the environment.
Therefore, with the use of acrylic polymeric additives in the rigid pavements of medium traffic, and improvement in its mechanical properties of up to 20% will be generated and by reducing the content of cement replacing it with additives, it will have as a consequence a reduction in its costs.
III. STATE OF THE ART At the beginning of the time, the Romans added blood, bacon
and milk to their concretes, possibly with the purpose of improving the conditions of placement.
In this way it is considered very likely that the durability that
some of the structures of ancient Rome have been due to the action of natural agents, is precisely because of the influence that these products could have had on the behavior of concrete.
Later, they have been integrated into several methods to
improve the pavements. The use of additives, which are incorporated before or during mixing and are generally used in small percentages by weight of the cement, which have been one of the innovative methods that aim to improve or modify one or several concrete properties. Its convenience always arose from a technical-economic study that determines the viability of the pavement.
However, the closest background to the use of chemical
additives in concrete dates back to the 19th century, the first addition of calcium chloride as an additive to concrete registered in 1873, whose patent was obtained in 1885. Gypsum and calcium chloride were then used towards the end of the century, to control the hardening processes, simultaneously with the use of some type of lime and water-resistant materials.
Of the investigations that have been developed in the past
related to this work, one carried out with respect to nano silica [2], has shown to have very good expectation, since replacing only 5% of cement with this innovative additive shows satisfactory results, even thus, the best results presented in the concrete are when 10% is replaced, after three days of curing. In turn, other authors [3] argue that the best replacement proportions should be around 10% by weight.
Nano silica is a colloidal silica consisting of fine micro particles of amorphous silicon dioxide (SiO2) dispersed in
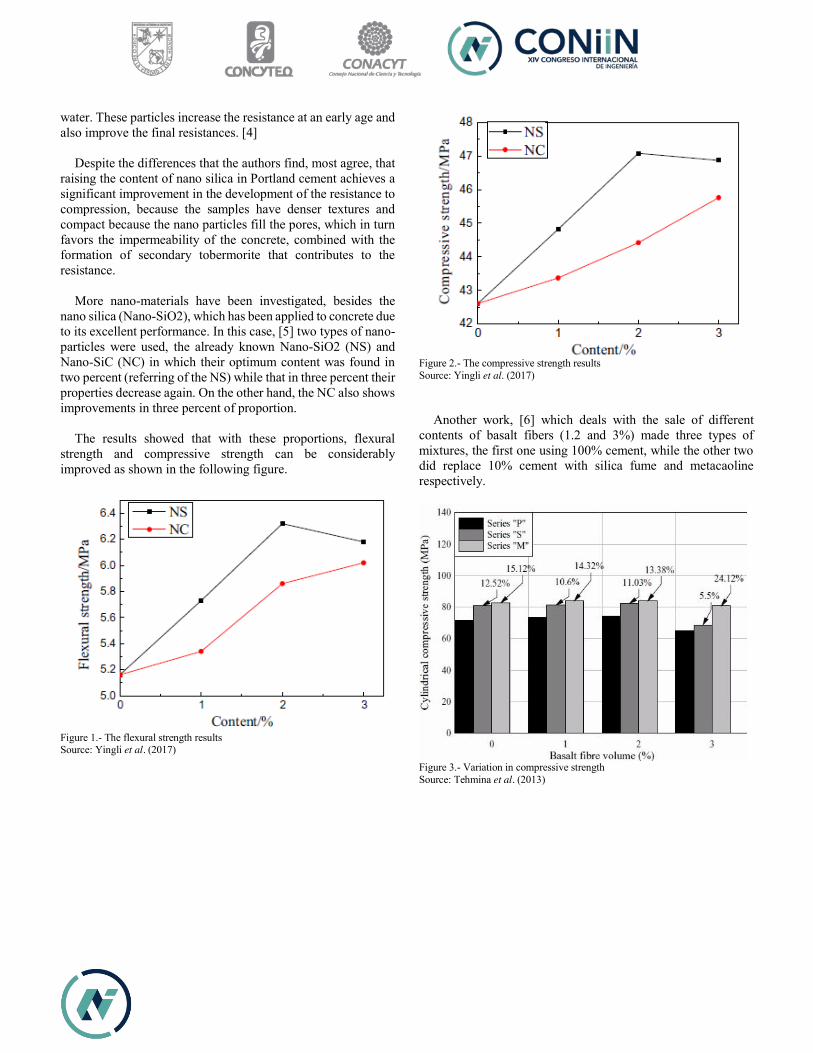
water. These particles increase the resistance at an early age and also improve the final resistances. [4]
Despite the differences that the authors find, most agree, that
raising the content of nano silica in Portland cement achieves a significant improvement in the development of the resistance to compression, because the samples have denser textures and compact because the nano particles fill the pores, which in turn favors the impermeability of the concrete, combined with the formation of secondary tobermorite that contributes to the resistance.
More nano-materials have been investigated, besides the
nano silica (Nano-SiO2), which has been applied to concrete due to its excellent performance. In this case, [5] two types of nano-particles were used, the already known Nano-SiO2 (NS) and Nano-SiC (NC) in which their optimum content was found in two percent (referring of the NS) while that in three percent their properties decrease again. On the other hand, the NC also shows improvements in three percent of proportion.
The results showed that with these proportions, flexural
strength and compressive strength can be considerably improved as shown in the following figure.
Figure 1.- The flexural strength results Source: Yingli et al. (2017)
Figure 2.- The compressive strength results Source: Yingli et al. (2017)
Another work, [6] which deals with the sale of different
contents of basalt fibers (1.2 and 3%) made three types of mixtures, the first one using 100% cement, while the other two did replace 10% cement with silica fume and metacaoline respectively.
Figure 3.- Variation in compressive strength Source: Tehmina et al. (2013)

Table 1.- Variation in the compressive strength according to different mixtures
Source: Own elaboration
As you can see both in the figure and in the table, the optimum compressive strength is in the mixture with 10% kaolin and 2% basalt fibers, because when you have 3% basalt fibers it happens a slight drop in resistance.
IV. CONCLUSIONS When analyzing the different works and their methodologies
related to the improvement of the mechanical properties of rigid pavements with additives and considering the various factors
that have been mentioned previously, such as the easy implementation of the substance, cost reduction and compatibility with the environment to mention a few, is very interesting the present of the nano particles, mainly nano silica, so we will continue the research of this work to deepen and obtain own results with emphasis on these additives. It should be mentioned that this has been only a few of the advances on the subject, there are more studies of great relevance which are aimed at deepening due to the benefits that nanoparticles contribute to the concrete.
REFERENCES
[1] American Society for Testing Materials. ASTM C 494 (2013) Standard Specification for Chemical Admixtures for Concrete. Pennsylvania, USA.
[2] Payá, J., Tobón J. I., Restrepo O. J. (2010) Comparative analysis of performance of Portland cement blended with nanosilica and silica fume. 163, 37-46 p.
[3] Li, H., Xiao, H., Ou, J. (2004) A study on mechanical and pressure-sensitive propierties of cement mortar with nanophase materials. Cement and concrete research. 34. 435-438 p.
[4] Byung-Wan, J., Chang-Hyun K., Ghi-Ho, T., Jong-Bin, P. (2006) Characteristics of cement mortar with nano-SiO2 particles. Construction and building materials.
[5] Yingli, G., Bei, H., Youyun, L., Jianliang, T., Liangchen, Q. (2017) Effects of nano-paticles on improvement in wear resistance and drying shrinkage of road fly ash concrete. Construction and Building Materials. 151, 228-235 p.
[6] Tehmina, A., Nasir, S., Fadhil, N. (2014) Mechanical propierties of high performance concrete reinforced with basalt fibers. Procedia Engineering. 77, 131-139.

THE DAMAGE FACTOR OF PAVEMENT ON THE ROADS OF MEXICO IS INCLUDED IN THE TOLL
RATE?
Ing. Cristian Asahi Vázquez Santillán Division of Graduate Studies Faculty of Engineering, UAQ
Santiago de Querétaro, México [email protected]
Dr. Eduardo Betanzo Quezada. Division of Graduate Studies Faculty of Engineering, UAQ
Santiago de Querétaro, México [email protected]
Abstract
The article aims to identify and know if within the methodologies or models that use the roads in Mexico, are considered some of the physical parameters that affect the damage to asphalt pavements and include that cost within the toll, valuing what parameters could include or exclude about its methods of collection toll. The natural wear of the pavement is accelerated by freight transport that circulates in overweight conditions and that is when the negative effects arise: the deterioration and fatigue of the pavement. Trucks with fewer axles will have the greatest damage to the pavement with respect to the others, due to the punctual load acting on the axles. In Mexico, the damage factor in tolls is not included, only investors want to see their money grown during the concession time, regardless of anything. The toll rate must include the damage factor for trucks when they are overloaded, especially.
Keywords: (freight transport, damage pavement, toll rate)
I. INTRODUCTION. In the case of Mexico, roads are the main means of
communication used by the freight transport system. According to the Statistical Manual of the Transport Sector 2015 published by the Mexican Institute of Transportation, in Mexico the amount of 522 million tons was moved by this mode of transportation, giving 86% of the total domestic movement [1]. Currently, the road network of Mexico has a total of 393,471 kilometers, of which only 12.83% represents only the federal network, 10.33% to the federal network free to toll and only 2.5% to toll highways (9,818 km); the rest is made up of 87.16% of rural roads.
It should be considered, in roads with greater traffic flow, mainly those that are in the main axes, the freight transport has its movement in these areas to be able to carry the merchandise or services that the population requires in short times. For this reason, because of these actions, the freight transport circulates too much on these roads and most are overweight, and as a result the deterioration of the pavement, due to different aspects of safety such as economic and comfort [2].
Within this perspective, the presence of vehicles in the vehicle flow significantly impacts the operations of the roads due to its large size, causing a lower operating capacity than other vehicles [3]. In the same way, vehicle dynamics play an important role in deterioration, as well as vehicle body, suspension, braking and tires; which are those that have direct interaction with the bearing surface [4]. Therefore, it is known that the weight by the freight vehicles that circulate on the road, accelerate the process of fatigue and fracture of the pavement [5].
Obviously, load is the most basic and important factor in the problem of overweight in the vehicle, for this, the trucks have a capacity of both tonnage and volume and dimensions specified in the Official Mexican NOM-012-SCT-2-2017, which deals with the weight and maximum dimensions with which the motor transport vehicles that pass through the general communication channels of federal jurisdiction of the Secretary of Communications and Transportation [6], can circulate. In this deterioration of the pavement are involved physical factors of vehicles that interact directly with the surface and identified as: a) gross vehicle weight, b) tires of the vehicle, c) pavement temperature and d) weight per axle. These factors mentioned above have a relationship between vehicle-infrastructure, which will be those that ultimately damage the pavement.
Previously it was mentioned that the road network tolling has a lower percentage with respect to the total of the national network, and an advantage of these roads over the others, is that they have revenue insured for a set time by means of concessions of road sections , and these in turn, through the toll charged to the users of their roads perceive the figures that would have to cover part of the amounts allocated to conservation. In Mexico, for the period of January-August of 2016, the costs for conservation were high, 8,200 million pesos were allocated by the Government, this numbers only for federal highways, without considering the rural roads that likewise they have a high number [7]. However, this situation of overload on the roads in Mexico is more frequent every day and the affectations to the infrastructure are evident [8]. As this continues, the freight
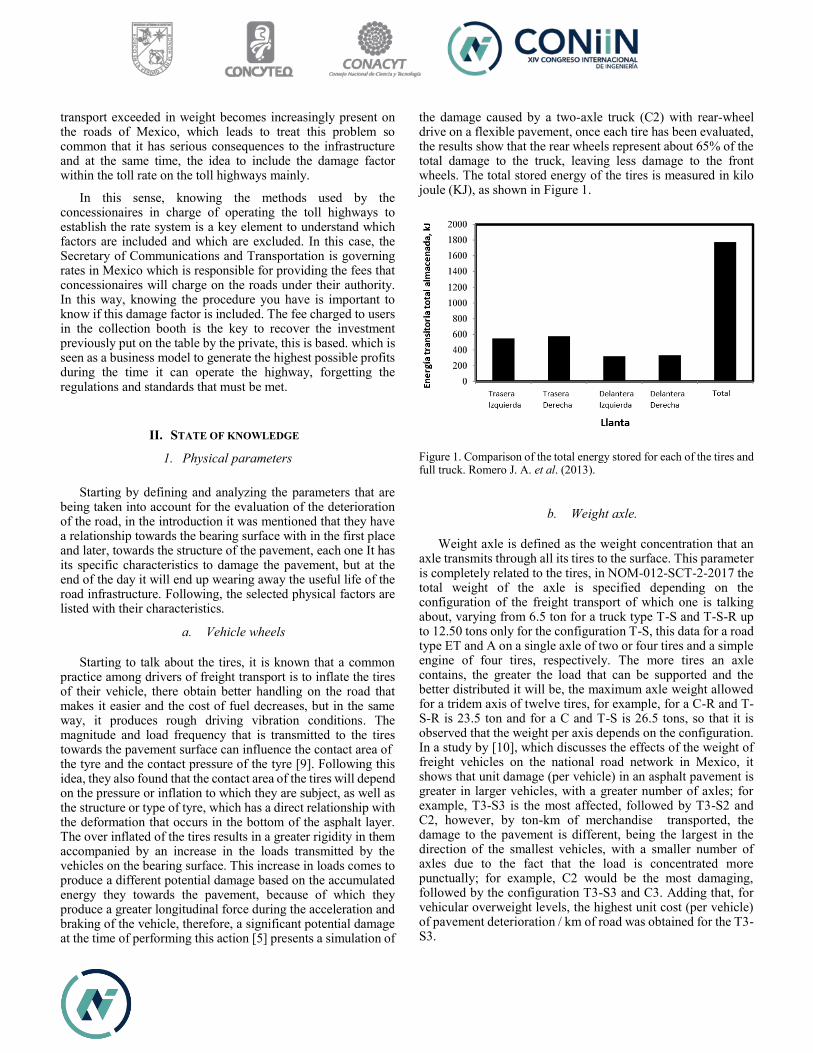
transport exceeded in weight becomes increasingly present on the roads of Mexico, which leads to treat this problem so common that it has serious consequences to the infrastructure and at the same time, the idea to include the damage factor within the toll rate on the toll highways mainly.
In this sense, knowing the methods used by the concessionaires in charge of operating the toll highways to establish the rate system is a key element to understand which factors are included and which are excluded. In this case, the Secretary of Communications and Transportation is governing rates in Mexico which is responsible for providing the fees that concessionaires will charge on the roads under their authority. In this way, knowing the procedure you have is important to know if this damage factor is included. The fee charged to users in the collection booth is the key to recover the investment previously put on the table by the private, this is based. which is seen as a business model to generate the highest possible profits during the time it can operate the highway, forgetting the regulations and standards that must be met.
II. STATE OF KNOWLEDGE
1. Physical parameters
Starting by defining and analyzing the parameters that are being taken into account for the evaluation of the deterioration of the road, in the introduction it was mentioned that they have a relationship towards the bearing surface with in the first place and later, towards the structure of the pavement, each one It has its specific characteristics to damage the pavement, but at the end of the day it will end up wearing away the useful life of the road infrastructure. Following, the selected physical factors are listed with their characteristics.
a. Vehicle wheels
Starting to talk about the tires, it is known that a common practice among drivers of freight transport is to inflate the tires of their vehicle, there obtain better handling on the road that makes it easier and the cost of fuel decreases, but in the same way, it produces rough driving vibration conditions. The magnitude and load frequency that is transmitted to the tires towards the pavement surface can influence the contact area of the tyre and the contact pressure of the tyre [9]. Following this idea, they also found that the contact area of the tires will depend on the pressure or inflation to which they are subject, as well as the structure or type of tyre, which has a direct relationship with the deformation that occurs in the bottom of the asphalt layer. The over inflated of the tires results in a greater rigidity in them accompanied by an increase in the loads transmitted by the vehicles on the bearing surface. This increase in loads comes to produce a different potential damage based on the accumulated energy they towards the pavement, because of which they produce a greater longitudinal force during the acceleration and braking of the vehicle, therefore, a significant potential damage at the time of performing this action [5] presents a simulation of
the damage caused by a two-axle truck (C2) with rear-wheel drive on a flexible pavement, once each tire has been evaluated, the results show that the rear wheels represent about 65% of the total damage to the truck, leaving less damage to the front wheels. The total stored energy of the tires is measured in kilo joule (KJ), as shown in Figure 1.
Figure 1. Comparison of the total energy stored for each of the tires and full truck. Romero J. A. et al. (2013).
b. Weight axle.
Weight axle is defined as the weight concentration that an axle transmits through all its tires to the surface. This parameter is completely related to the tires, in NOM-012-SCT-2-2017 the total weight of the axle is specified depending on the configuration of the freight transport of which one is talking about, varying from 6.5 ton for a truck type T-S and T-S-R up to 12.50 tons only for the configuration T-S, this data for a road type ET and A on a single axle of two or four tires and a simple engine of four tires, respectively. The more tires an axle contains, the greater the load that can be supported and the better distributed it will be, the maximum axle weight allowed for a tridem axis of twelve tires, for example, for a C-R and T-S-R is 23.5 ton and for a C and T-S is 26.5 tons, so that it is observed that the weight per axis depends on the configuration. In a study by [10], which discusses the effects of the weight of freight vehicles on the national road network in Mexico, it shows that unit damage (per vehicle) in an asphalt pavement is greater in larger vehicles, with a greater number of axles; for example, T3-S3 is the most affected, followed by T3-S2 and C2, however, by ton-km of merchandise transported, the damage to the pavement is different, being the largest in the direction of the smallest vehicles, with a smaller number of axles due to the fact that the load is concentrated more punctually; for example, C2 would be the most damaging, followed by the configuration T3-S3 and C3. Adding that, for vehicular overweight levels, the highest unit cost (per vehicle) of pavement deterioration / km of road was obtained for the T3-S3.
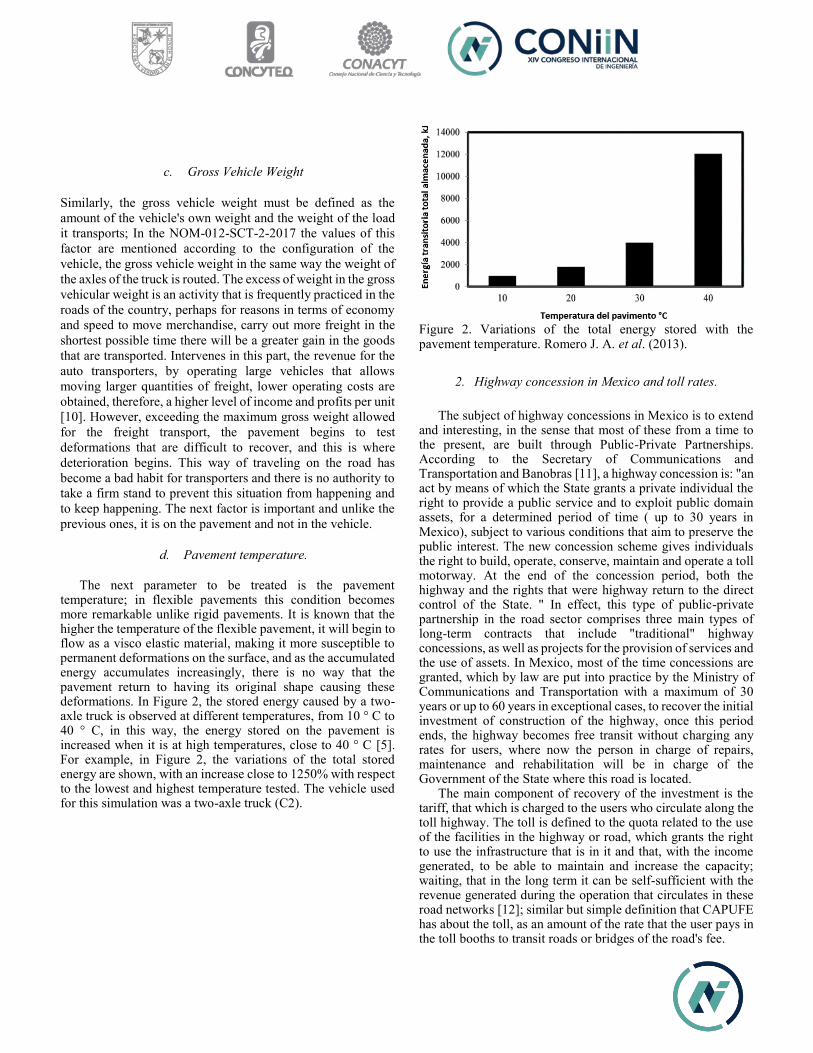
c. Gross Vehicle Weight Similarly, the gross vehicle weight must be defined as the amount of the vehicle's own weight and the weight of the load it transports; In the NOM-012-SCT-2-2017 the values of this factor are mentioned according to the configuration of the vehicle, the gross vehicle weight in the same way the weight of the axles of the truck is routed. The excess of weight in the gross vehicular weight is an activity that is frequently practiced in the roads of the country, perhaps for reasons in terms of economy and speed to move merchandise, carry out more freight in the shortest possible time there will be a greater gain in the goods that are transported. Intervenes in this part, the revenue for the auto transporters, by operating large vehicles that allows moving larger quantities of freight, lower operating costs are obtained, therefore, a higher level of income and profits per unit [10]. However, exceeding the maximum gross weight allowed for the freight transport, the pavement begins to test deformations that are difficult to recover, and this is where deterioration begins. This way of traveling on the road has become a bad habit for transporters and there is no authority to take a firm stand to prevent this situation from happening and to keep happening. The next factor is important and unlike the previous ones, it is on the pavement and not in the vehicle.
d. Pavement temperature.
The next parameter to be treated is the pavement temperature; in flexible pavements this condition becomes more remarkable unlike rigid pavements. It is known that the higher the temperature of the flexible pavement, it will begin to flow as a visco elastic material, making it more susceptible to permanent deformations on the surface, and as the accumulated energy accumulates increasingly, there is no way that the pavement return to having its original shape causing these deformations. In Figure 2, the stored energy caused by a two-axle truck is observed at different temperatures, from 10 ° C to 40 ° C, in this way, the energy stored on the pavement is increased when it is at high temperatures, close to 40 ° C [5]. For example, in Figure 2, the variations of the total stored energy are shown, with an increase close to 1250% with respect to the lowest and highest temperature tested. The vehicle used for this simulation was a two-axle truck (C2).
Figure 2. Variations of the total energy stored with the pavement temperature. Romero J. A. et al. (2013).
2. Highway concession in Mexico and toll rates.
The subject of highway concessions in Mexico is to extend and interesting, in the sense that most of these from a time to the present, are built through Public-Private Partnerships. According to the Secretary of Communications and Transportation and Banobras [11], a highway concession is: "an act by means of which the State grants a private individual the right to provide a public service and to exploit public domain assets, for a determined period of time ( up to 30 years in Mexico), subject to various conditions that aim to preserve the public interest. The new concession scheme gives individuals the right to build, operate, conserve, maintain and operate a toll motorway. At the end of the concession period, both the highway and the rights that were highway return to the direct control of the State. " In effect, this type of public-private partnership in the road sector comprises three main types of long-term contracts that include "traditional" highway concessions, as well as projects for the provision of services and the use of assets. In Mexico, most of the time concessions are granted, which by law are put into practice by the Ministry of Communications and Transportation with a maximum of 30 years or up to 60 years in exceptional cases, to recover the initial investment of construction of the highway, once this period ends, the highway becomes free transit without charging any rates for users, where now the person in charge of repairs, maintenance and rehabilitation will be in charge of the Government of the State where this road is located.
The main component of recovery of the investment is the tariff, that which is charged to the users who circulate along the toll highway. The toll is defined to the quota related to the use of the facilities in the highway or road, which grants the right to use the infrastructure that is in it and that, with the income generated, to be able to maintain and increase the capacity; waiting, that in the long term it can be self-sufficient with the revenue generated during the operation that circulates in these road networks [12]; similar but simple definition that CAPUFE has about the toll, as an amount of the rate that the user pays in the toll booths to transit roads or bridges of the road's fee.

Starting from this point, the rate must contemplate all these factors to have a safe infrastructure where the vehicles decide to travel on that road for the quality service it offers because it is also paying for a service and the user has the right to demand.
The importance of charging a toll rate for the need to cover all costs of construction, maintenance, updating, maintenance, and operation of a highway, are key points to establish the amount of the fee for each type of vehicle [13].
According to the current internal regulations of the Ministry of Communications and Transportation, the General Directorate of Road Development (DGDC) is responsible for establishing prices on roads and bridges in accordance with laws, regulations, concessions, permits, authorizations, and official standards. The DGDC determines the type of concession model under which the highway will be managed, by determining the maximum average fare in the concession title granted to the concessionaire.
3. Methodology.
The methodology used for this investigation is in five steps, as shown below as a conceptual map. Step 1. Step 2. Step 3. Step 4. Step 5.
III. RESULTS AND DISCUSSION.
The damage to the pavement is reflected in the roads of Mexico, where different factors are involved such as the quality of materials of the road infrastructure, the vehicles that transit and, the weight of these that is the main cause of the pavement deterioration. By means of the results obtained by the measurement stations of weights and dimensions and the level of load transported by the trucks by [10], it shows that for the overall damage experienced in that section it was: 35% at T3-S2, 25% at C2, 20% at T3-S3, 15% at C3 and 5% at T3-S2-R4, show in Figure 3. For ton-km transported the proportions vary somewhat: 42% to C2, 23% to T3-S2, 20% to C3, 13% to T3-S3 and 2% to T3-S2-R4, show in Figure 4. With this it is observed that the vehicles T3-S2 and C2 are those that appear in the first places due to the combined effect of their frequency and the level of load.
Figure 3. Percentage of global damage truck. [10].
Figure 4. Percentage of damage by ton-km load transported. [10]. However, in recent years, that transportation planning has
changed due to the increased need in the development of the road infrastructure, causing a financial problem within the public sector for its construction, as consequence emphasizes recourse to private sectors to achieve the goal of construction of the communication channel [14]. With this, public - private partnerships arise; responsible for the design, construction,
Identify and analyze the parameters that cause
pavement damage.
Selection of the field research: interviews and
request information from different concessionaires.
Analyze and know the methodology used by road
operators to determine the toll in the collection
booths.
Proposal to include the toll cost based on the
damage to the pavement.
Analysis and comparison of results.
05101520253035
T3-S2 C2 T3-S3 C3 T3-S2-R4
3525
2015
5
PERCENTAGE OF GLOBAL DAMAGE TRUCK
01020304050
C2 T3-S2 C3 T3-S3 T3-S2-R4
4223 20 13
2
PERCENTAGE OF DAMAGE BY TON-KM LOAD TRANSPORTED
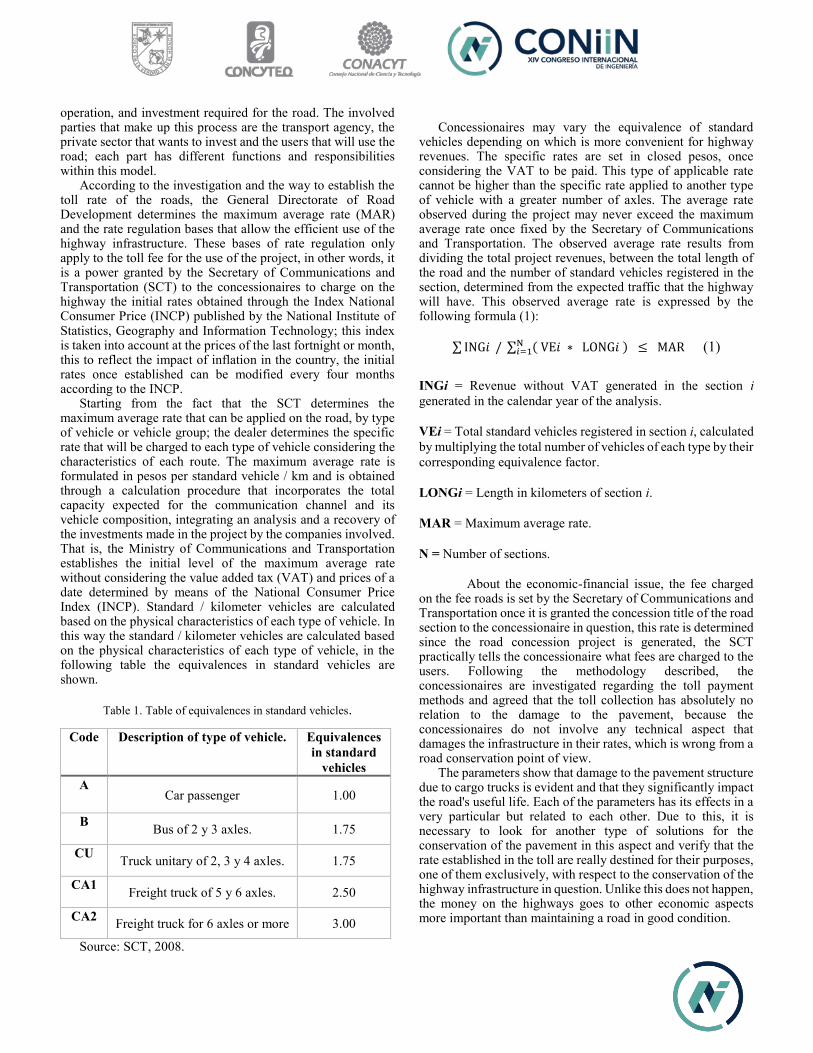
operation, and investment required for the road. The involved parties that make up this process are the transport agency, the private sector that wants to invest and the users that will use the road; each part has different functions and responsibilities within this model.
According to the investigation and the way to establish the toll rate of the roads, the General Directorate of Road Development determines the maximum average rate (MAR) and the rate regulation bases that allow the efficient use of the highway infrastructure. These bases of rate regulation only apply to the toll fee for the use of the project, in other words, it is a power granted by the Secretary of Communications and Transportation (SCT) to the concessionaires to charge on the highway the initial rates obtained through the Index National Consumer Price (INCP) published by the National Institute of Statistics, Geography and Information Technology; this index is taken into account at the prices of the last fortnight or month, this to reflect the impact of inflation in the country, the initial rates once established can be modified every four months according to the INCP.
Starting from the fact that the SCT determines the maximum average rate that can be applied on the road, by type of vehicle or vehicle group; the dealer determines the specific rate that will be charged to each type of vehicle considering the characteristics of each route. The maximum average rate is formulated in pesos per standard vehicle / km and is obtained through a calculation procedure that incorporates the total capacity expected for the communication channel and its vehicle composition, integrating an analysis and a recovery of the investments made in the project by the companies involved. That is, the Ministry of Communications and Transportation establishes the initial level of the maximum average rate without considering the value added tax (VAT) and prices of a date determined by means of the National Consumer Price Index (INCP). Standard / kilometer vehicles are calculated based on the physical characteristics of each type of vehicle. In this way the standard / kilometer vehicles are calculated based on the physical characteristics of each type of vehicle, in the following table the equivalences in standard vehicles are shown.
Table 1. Table of equivalences in standard vehicles.
Source: SCT, 2008.
Concessionaires may vary the equivalence of standard
vehicles depending on which is more convenient for highway revenues. The specific rates are set in closed pesos, once considering the VAT to be paid. This type of applicable rate cannot be higher than the specific rate applied to another type of vehicle with a greater number of axles. The average rate observed during the project may never exceed the maximum average rate once fixed by the Secretary of Communications and Transportation. The observed average rate results from dividing the total project revenues, between the total length of the road and the number of standard vehicles registered in the section, determined from the expected traffic that the highway will have. This observed average rate is expressed by the following formula (1):
∑ ING𝑖 / ∑ ( VE𝑖 ∗ LONG𝑖 ) N
𝑖=1 ≤ MAR (1)
INGi = Revenue without VAT generated in the section i generated in the calendar year of the analysis. VEi = Total standard vehicles registered in section i, calculated by multiplying the total number of vehicles of each type by their corresponding equivalence factor. LONGi = Length in kilometers of section i. MAR = Maximum average rate. N = Number of sections.
About the economic-financial issue, the fee charged on the fee roads is set by the Secretary of Communications and Transportation once it is granted the concession title of the road section to the concessionaire in question, this rate is determined since the road concession project is generated, the SCT practically tells the concessionaire what fees are charged to the users. Following the methodology described, the concessionaires are investigated regarding the toll payment methods and agreed that the toll collection has absolutely no relation to the damage to the pavement, because the concessionaires do not involve any technical aspect that damages the infrastructure in their rates, which is wrong from a road conservation point of view.
The parameters show that damage to the pavement structure due to cargo trucks is evident and that they significantly impact the road's useful life. Each of the parameters has its effects in a very particular but related to each other. Due to this, it is necessary to look for another type of solutions for the conservation of the pavement in this aspect and verify that the rate established in the toll are really destined for their purposes, one of them exclusively, with respect to the conservation of the highway infrastructure in question. Unlike this does not happen, the money on the highways goes to other economic aspects more important than maintaining a road in good condition.
Code Description of type of vehicle. Equivalences in standard
vehicles A
Car passenger 1.00
B Bus of 2 y 3 axles. 1.75
CU Truck unitary of 2, 3 y 4 axles. 1.75
CA1 Freight truck of 5 y 6 axles. 2.50
CA2 Freight truck for 6 axles or more 3.00
IV. CONCLUSIONS. The concession model in Mexico is designed to focus the
cash flows received from a collection booth in a circle of investors, where the money is concentrated during the time of the concession in those small groups. An idea to avoid this type of situation is that in a certain fair way it was based on an Internal Rate of Return (IRR), where the investor recovers his money once the money invested is reached and in a much shorter time so as not to centralize the riches in the hands of a few people. In this business model that revolves around road concessions, the most unprotected is always the user, nobody thinks about security. Based on a collection system based on the principle that "the one that damages, pays", the rate is not to do justice to users in terms of damage and safety of the pavement, is designed to do business only, in a model purely economic-financial.
Since the General Direction of Road Development establishes the rates for future highway concessionaires through the concession title and the bases for tariff regulation, a restructuring of a new concession model would be a good measure considering the road infrastructure in long terms and not have making repairs at unforeseen times, this with the aim of having more in mind the user and not see 100% a business model to the roads. With this, that the toll rate is fairer for those who damage the infrastructure more, specifically the trucks.
The NOM-012-SCT-2-2017 must be executed without any exception, the regulatory authorities of the weights and dimensions must focus attention on the freight transport and regulate this situation; both parties (the authority / concessionaire and freight transport) have this obligation to comply.
Remarking that overloaded trucks are a very marked and frequent problem in the roads of the country, due to various factors that have been mentioned, that transporters facilitate their tasks and that they are reflected in the benefits through the movement of merchandise, giving more movement to goods in a shorter time, but at a high cost for flexible pavement. It is true, it is difficult to have to load trucking in terms of weights and dimensions, because the authorities charged with regularizing these aspects give attention to other interests and completely ignore the infrastructure of the road. That is why it is important to be making constant repairs to the road infrastructure, and at the same time, recognize what type of units are circulating and that are allowed within the NOM-012-SCT-2-2017, therefore, be in order in terms of their already established specifications, because they are the vehicles that most damage the pavement.
REFERENCES
[1] Martínez Antonio Jorge Jerónimo, Moreno Martínez María Aurora, Morales Pérez María del Carmen Ernestina Guadalupe, Herrera García Alfonso, Balbuena Cruz José Alfonso, Pérez Sánchez José Arturo, Bustos Rosales Agustín y Zamora Domínguez Alma Rosa (2015), Manual Estadístico del Sector Transporte 2015, Secretaria de Comunicaciones y Transportes Instituto Mexicano de Transporte, 306 pp. Carretera El Colorado - Galindo Km. 12, Pedro Escobedo, Querétaro, México.
[2] Harwood, D.W., LB Potts, D.J. Torbic, y W.D. Glauz (2003), Synthesis 3: Highway/heavy vehicle interaction. Commercial truck and bus safety synthesis program, Federal Motor Carrier Safety Administration, Transportation Research Board, 1-59.
[3] Ahmed Umama, Drakopoulos Alexander y Ng ManWo (2013), Impact of Heavy Vehicles on Freeway Operating Characteristics Under Congested Conditions, Transportation Research Record: Journal of the Transportation Research Board, Washington, D.C., 2396, 28-37.
[4] Shaopu Yang, Yongjie Lu y Shaohua Li (2013). An overview on vehicle dynamics, International Journal of Dynamics and Control, 1, 385-395.
[5] Romero J., Lozano A., Betanzo E. y Obregon S. (2013), A flexible pavement damage metric for a straight truck, Internacional Journal Heavy Vehicle Systems, 20, 209-221.
[6] SCT (2017). Norma Oficial Mexicana NOM-012-SCT-2-2017. Sobre el peso y dimensiones máximas con los que pueden circular los vehículos de autotransporte que transitan en las vías generales de comunicación de jurisdicción federal. Secretaría de Comunicaciones y Transportes. Diario Oficial de la Federación. 26 de Diciembre de 2017.
[7] SCT (2017). Cuarto Informe de Labores 2016 – 2017. Secretaría de Comunicaciones y Transportes. Informe. D.F. México, 145 pp.
[8] Lozano Guzmán Alejandro, Romero Navarrete Jose Antonio, Hernández Jiménez José Ricardo, Carrión Miramontes Francisco y Vázquez Vega David (1999), Aspectos de la dinámica de vehículos pesados y su relación con el daño a pavimentos, Publicacion Técnica No. 119, Instituto Mexicano del Transporte, 73 pp. Carretera El Colorado - Galindo Km. 12, Pedro Escobedo, Querétaro, México.
[9] Sebaaly P.E. & Tabatabaee N. (1992), “Effect of tyre parameter on pavement damage and load equivalency factors”, Journal of Transportation Engineering, (118), 805-819
[10] Mendoza Diaz Alberto y Gutierrez Hernandez Jose Luis (1994), Analisis economico de los efectos del peso de los vehiculos de carga autorizados en la Red Nacional de Carreteras, Publicación Técnica No. 52, Instituto Mexicano del Transporte, 121 pp. Carretera El Colorado - Galindo Km. 12, Pedro Escobedo, Querétaro, México.
[11] Torres-Vargas G., González-García J.A., Arroyo-Osorno J.A., Cruz-González G. y Hernández-García S. (2017), “Concesiones carreteras en México, una aproximación a su productividad económica como medida de desempeño”, Publicación Técnica No. 497, Instituto Mexicano de Transporte, Carretera El Colorado - Galindo Km. 12, Pedro Escobedo, Querétaro, México.
[12] FHWA (2016). Office of Innovative Program Delivery: Revenue, (2016), Road Pricing Defined. U.S. Departament of Transportation Federal Highway Administration. http://www.fhwa.dot.gov/ipd/revenue/road_pricing/defined/ Consultado 04/09/2016.
[13] León Méndez Lucia Alheli, Romero Valle Socorro y De Vivar Luna Daniel Díaz (2014). “ Sistema tarifario de la Red Carretera Nacional Mexicana”, Cal y Mayor y Asociados: Planeación de Transporte. 22 pp.
[14] Wu H.i & Zhang Z. (2013), “Managing Transportation Facilities in Design-Build-Finance-Operate Partnerships”, Transportation Research Record: Journal of the Transportation Research Board, Washington, D.C., 2345, 92-99.
Review of recent advances of four refrigeration cycles
Marco Antonio Gómez Guzmán Universidad Autónoma de Querétaro
Querétaro, México [email protected]
Abstract— This document reviews the four types of refrigeration methods most commonly used in domestic refrigerators. As well as mentioning important data of each cycle, what they consist of, their performance and the environmental impact that they have. Refrigerators in general are based on a vapor compression cycle (VCC), so this cycle is the first to be reviewed. Non-in-kind technologies that are not based on VCC, such as the absorption, thermoelectric and adsorption cycle, are presented for the application of domestic refrigerators. Although they have not been widely used for domestic refrigerators due to insufficient reliability and poor performance, their performance and comparison with the VCC will be discussed in this document.
Keywords— Refrigerator; vapor compression cycle; thermoelectric effect, adsorption cycle, absorption cycle.
I. INTRODUCTION The demand for energy increases steadily every year due to
the population growth and the improvement of life. The consumption of energy is one of the causes of the emission of carbon dioxide, which is a major concern due to this happens climate change, in addition to pollution. In residential areas, domestic refrigerators play an important role in the continuous consumption of energy. These respond for approximately 6% of the electric power produced worldwide [2]. Currently there are several refrigeration cycles [26], for example: vapor compression cycle (VCC) [25], thermoelectric effect or Peltier effect [22], thermoacustic effect, thermoelastic effect [2], magnetic effect [5, 21, 23, 24], absorption and adsorption method [26]. In this document we will discuss four of them, starting with the VCC technology that although it is one of the most energy consuming, it will also be discussed that its performance is optimal and is one of the best options in terms of performance. The technologies are not commonly used for domestic refrigerators, such as the thermoelectric cycle, absorption and adsorption, which will be discussed later. These technologies are not usually used for domestic refrigerators due to lower performance compared to VCC options. However, the adsorption cycle is the most promising solar cooling methods, in addition to being environmentally friendly, as well as low cost and very few maintenance requirements. For this reason, research is currently being carried out to improve the performance of this refrigeration cycle, since achieving this
would result in better performance and significant energy savings.[28].
II. VAPOR COMPRESION CYCLE Most refrigerators are based in vapor compression technologies. This consists of a capillary tube that is generally used as an expansion device for domestic refrigerators. For VCC-based refrigerators, the suction line heat exchanger (SLHX) is basically applied to improve the efficiency of the VCC. The heat is exchanged between the subcooled liquid refrigerant and the superheated steam refrigerant in the SLHX. The SLHX is located between the condenser outlet and the capillary tube inlet and between the evaporator outlet and the compressor inlet. VCC technologies are classified into three groups, which are: 1) evaporation cycles, 2) loss-loss recovery cycles and 3) multi-stage cycles. The double evaporator cycles include parallel circuit, bypass and parallel cycles, and Lorenz-Meutzner cycle (LM) according to the connection of the evaporators. Currently, serial, bypass and parallel circuit circuits are available in the market, but the LM cycle is being studied in the laboratory and the prototypes are in the development stages. The long-term reliability of the proposed coolant mixture for the LM cycle has not yet been resolved [2, 11]. The conventional steam compression cycle is currently marketed more than non-in-kind technologies [28]. The multi-stage cycles include a two-stage compression cycle and a double-loop system. The two-stage cycle is found as emerging technology to further improve the performance of the VCC cycle. Double loop systems are commercially available, but generally apply to large capacity refrigerators that cannot handle thermal loads with a single compressor. The compressor is the most expensive component and generally requires 8% to approximately 15% of the total cost of the material of a domestic refrigerator. Therefore, when two compressors are applied, the cycle increases in cost compared to the other cycles that have a compressor, since having two compressors must also be invested in additional devices that support it. [2].
III. THERMOELECTRIC CYCLE For domestic refrigerators, non-in-kind technologies can’t fully replace vapor compression technology. Thermoelectric cooling technology is one of the most developed non-in-kind technologies in recent years. Thermoelectric cooling involves the use of the Peltier effect to transform electricity into heat to cool and / or heat [22]. Thermoelectric cooling is operated by a direct current that passes through a circuit formed by two different conductors or semiconductors that produce a temperature difference at the junction of two conductors. This is called the Peltier effect and the thermoelectric cooler uses the Peltier module interspersed by two heat exchangers. The Peltier module consists of a series of n-type and p-type semiconductors connected in series by copper bands and covered with ceramic plates. The heat is pumped from one side of the module to the other through the heat exchangers. This technology is commercially available in small-scale refrigerators. The coefficient of performance (COP) of the thermoelectric cooler is also as low as that of the absorption coolers. The energy efficiency of the thermoelectric cooler is determined by the COP of the Peltier module and the effectiveness of the heat transfer of the heat exchangers. On the other hand, the low performance of this method prevents it from expanding. However, it is an effective method to cool, so the development of a domestic refrigerator, based only on the thermoelectric cycle, would be able to compete in the market with those based on VCC, as long as it has a higher performance than it currently has. [29, 30].
IV. ABSORTION CYCLE Absorption cooling is mainly based on the affinity of two substances at different states to form a solution or a mixture. This process depends on the temperature and the pressure levels. At a low temperature and pressure level, the liquid absorbent absorbs the refrigerant vapor and at a high level it releases it. This phenomenon is exploited to pump the refrigerant from the evaporator to the condenser using a solution pump instead the intensive energy consuming vapor compressor .The first machine patented in 1859 by the French engineer Ferdinand Carré used water as absorbent and ammonia as refrigerant [19].The absorption refrigeration technology consists of a generator, a pump and an absorber that are collectively capable of compressing the refrigerant vapor. The evaporator draws the vapor refrigerant by absorption into the absorber. The extra thermal energy separates the refrigerant vapor from the rich solution. The refrigerant is condensed by rejecting the heat in a condenser, and then the cooled liquid refrigerant is expanded by the evaporator, and the cycle is completed. The refrigerant side of the absorption system essentially works under the same principle as the vapor compression system. However, the mechanical compressor used in the vapor compression cycle is replaced by a thermal compressor in the absorption system. The thermal compressor consists of the absorber, the generator, the solution pump, and the expansion valve [9].
The cooling technology based on the VCC is the most common and leading technology, but there are some disadvantages such as periodic compressor noise and the environmental impact of refrigerants associated with the ozone layer and global warming. For these reasons, the absorption cycle is being used for refrigeration applications. A large number of absorption refrigerators have been designed and marketed with cooling capacities of between 10 and 1000 kW [2,10, 15]. The different absorption systems are classified as: 1) Single-effect solar absorption cycle, 2) Half-effect solar absorption cycle, 3) Double-effect solar absorption cycle and 4) Triple-effect solar absorption cycle.
V. ADSORTION REFRIGERATION CYCLES
Adsorption is a process by which the molecules of a substance are commonly fixed on a porous surface or material. Adsorption occurs at the surface, where the cohesion forces, including electrostatic forces and hydrogen bonds, act between molecules of all categories, regardless of their state of aggregation, and this process is reversible. Unbalanced surface forces at the phase boundary cause changes in the concentration of molecules at the interface of the solid or fluid. The adsorption process involves the separation of one substance and its concentration on the surface of another. The adsorption phase in the adsorbent, and the material concentrated or adsorbed on the surface of that phase in the adsorbate. Adsorption is an exothermic process associated with the evolution of heat, the amount of release of calories depends on the magnitude of the electrostatic forces involved, the late heat, the energies of electrostatic and chemical bonding. Since in the adsorbed phase, the adsorbate molecules are in a more, ordered, entropy, decreases [28].
A. Basic solar adsortion refrigeration cycle. Solar energy is the source of most adsorption systems operating with the basic cycle. In the remaining cases the components are kept unchanged, the main difference being the heat collection method. A solar adsorption refrigerator based on the basic adsorption refrigeration cycle does not require any other energy, just thermal energy, and it operates intermittently according to the daily cycle. These adsorption systems are closed systems, like a simple vapor compression system, comprising a compressor, a condenser and an evaporator. However, in this case, the compressor is an adsorber powered by the thermal energy, and the cooling effect is achieved by the evaporation of a refrigerant while the vapor produced is adsorbed by the adsorbent layer in the adsorber. The adsorbed content of refrigerant varies cyclically, depending on the adsorbent temperature and system pressure, which varies between a maximum limit set by the condensation pressure and a minimum limit imposed by the evaporation pressure [16, 26].
The cycle consists of four processes [28]:
1. Heating and pressurization 2. Heating and desorption & condensation 3. Cooling and Depressurization 4. Cooling and adsorption & evaporation
B. Heat recovery cycle. The heat recovery cycle begins when after switching between adsorption and desorption, the cooling or heating medium flows immediately between the hot adsorber and the cold adsorber in a closed loop. Then, a part of the heat of the hot adsorber is recovered and the coefficient of performance of the system increases. It is also used in the system with two or more beds. According to the corresponding research, heat recovery can improve COP by 25% [6, 8].
C. Heat and mass recovery cycle. The massive recovery process occurs after the change between adsorption and desorption and before heat recovery, the mass channels between the high pressure desorbent and the low pressure adsorbent are connected together. The desorber desorbed more and the adsorber adsorbs more. This process increases the cyclic adsorption capacity and the specific cooling power (SCP) is correspondingly improved. The cycle of recovery of heat and mass, in most cases is the mass recovery and the recovery of heat in combination. The COP and SCP increase the recovery time and the recovery time of the adequate mass. The recovery cycle of calories and mass is one of the most used and successful cycles nowadays. The adsorption cycle with massive recovery also increases the capacity of an adsorption cooler to utilize low temperature heat sources. In working conditions, the cycle of recovery of the mass with the performance of the system, with the conventional cycle of feeding the low-temperature heat source [6, 28].
D. Thermal wave cycle. The high temperature heat medium flows to the desorber once heated by the heater; the thermal medium is cooled by the desorber and then flows into the cooler; the temperature of the environment decreases in the cooler; and the low temperature heat medium flows into the adsorber to cool it; At the end, the heat cycle returns to the heater to warm up, this cycle is called the thermal wave cycle and a large temperature rise in the adsorber and a large temperature drop in the desorber are needed for this cycle. Then the high heat transfer performance of the adsorber / desorber is very important. But it is difficult to improve the performance of the transfer of calories to meet the requirements of the thermal wave cycle. Thermal wave cycle is better for the COP of the system, but not for SCP since it prolongs the fluidity of the heating medium in the beds or decreases the energy flow of the environment, the energy density of the systems will decrease [6, 8]. The concept of
thermal wave cycle is firstly proposed by Shelton (March 10th, 1990) [31]. According to his analysis, 80% heat required in desorption process can be provided by the heat released in adsorption process. Therefore, the heat is effectively utilized in this cycle and the heat, from external heat source, needed in the desorption process is greatly reduced.
ACKNOWLEDGMENT This research was supported by Universidad Autónoma de Querétaro, who is the provider of knowledge and supports the publication of scientific articles. Dr. Roberto Valentin Carrillo Serrano who has supported my research and clarified my doubts on the innovation of a new product in the issue of domestic refrigerators and CONACYT that grants financing for research that allows technological and scientific growth in my country.
REFERENCES [1] Langdon-Arms Samue, Gschwendtner Michael, Neumaier Martin,
“Development of a solar-powered liquid piston Stirling refrigerator,” Energy Procedia 142 (2017) 570–575.
[2] Seyoung Choi, Ukmin Han, Honghyun Cho, Hoseong Lee, “Review: Recent advances in household refrigerator cycle technologies,” Applied Thermal Engineering 132 (2018) 560–574.
[3] R. Opoku, S. Anane, I.A. Edwin, M.S. Adaramola, R. Seidu, “Comparative techno-economic assessment of a converted DC refrigerator and a conventional AC refrigerator both powered by solar PV,” Int. J. of refrigeration 72 ( 2016 ) 1–11.
[4] K.O. Daffallah, M. Benghanem, S.N. Alamri, A.A. Joraid, A.A. Al-Mashraqi, “Experimental evaluation of photovoltaic DC refrigerator under different thermostat settings,” Renewable Energy 113 (2017) 1150-1159.
[5] Bingfeng Yu, Min Liu, Peter W. Egolf, Andrej Kitanovski, “A review of magnetic refrigerator and heat pump prototypes built before the year 2010,” Int. J. Of refrigeration, 33 (2010) 1029-1060.
[6] D.C. Wanga, Y.H. Li, D. Li, Y.Z. Xia, J.P. Zhang, “A review on adsorption refrigeration technology and adsorption deterioration in physical adsorption systems,” Renewable and Sustainable Energy Reviews 14 (2010) 344–353.
[7] T.M.I. Mahlia, R. Saidur, “A review on test procedure, energy efficiency standards and energy labels for room air conditioners and refrigerator–freezers,” Renewable and Sustainable Energy Reviews 14 (2010) 1888–1900.
[8] Parash Goyal, Prashant Baredar,Arvind Mittal,Ameenur R. Siddiqui, “Adsorption refrigeration technology – An overview of theory and its solar energy applications,” Renewable and Sustainable EnergyReviews 53 (2016)1389–1410.
[9] Ioan Sarbu, Calin Sebarchievici, “General review of solar-powered closed sorption refrigeration systems,” Energy Conversion and Management 105 (2015) 403–422.
[10] Jing Tao, Suiran Yu, “Implementation of energy efficiency standards of household refrigerator/freezer in China: Potential environmental and economic impacts” Applied Energy 88 (2011) 1890–1905.
[11] Asmaa Ahmed M. El-Bahloul, Ahmed Hamza H. Ali, Shinichi Ookawara, “Performance and sizing of solar driven dc motor vapor compression refrigerator with thermal storage in hot arid remote areas,” Energy Procedia 70 ( 2015 ) 634 – 643.
[12] M.S. Fernandes, G.J.V.N.Brites, J.J.Costa, A.R.Gaspar, V.A.F.Costa, “Review and future trends of solar adsorption refrigeration systems,” Renewable and Sustainable Energy Reviews 39(2014)102–123.

[13] Giuseppe Marco Tina, Alfio Dario Grasso, “Remote monitoring system for stand-alone photovoltaic power plants: The case study of a PV-powered outdoor refrigerator,” Energy Conversion and Management 78 (2014) 862–871.
[14] Nidal H. Abu Hamdeh, Mu’taz A. Al-Muhtase, “Optimization of solar adsorption refrigeration system using experimental and statistical techniques,” Energy Conversion and Management 51 (2010) 1610–1615.
[15] C.O. Rivera, W. Rivera, “Modeling of an intermittent solar absorption refrigeration system operating with ammonia–lithium nitrate mixtu,” Solar Energy Materials & Solar Cells 76 (2003) 417–427.
[16] Todd Otanicar, Robert A. Taylor, Patrick E. Phelan, “Prospects for solar cooling – An economic and environmental assessment,” Solar Energy 86 (2012) 1287–1299.
[17] Guoliang Ding, Chunlu Zhang, Zhili Lu, “Dynamic simulation of natural convection bypass two-circuit cycle refrigerator–freezer and its application Part I: Component models,” Applied Thermal Engineering 24 (2004) 1513–1524.
[18] Zhili Lu, Guoliang Ding, “Temperature and time-sharing running combination control strategy of two-circuit cycle refrigerator–freezer with parallel evaporators,” Applied Thermal Engineering 26 (2006) 1208–1217.
[19] A.Aliane, S.Abboudi , C.Seladji , B.Guendouz, “An illustrated review on solar absorption cooling experimental studies,” Renewable and Sustainable Energy Reviews 65(2016)443–458.
[20] Bilal A. Akash, Salem A. Said, “Assessment of LPG as a possible alternative to R-12 in domestic refrigerators,” Energy Conversion and Management 44 (2003) 381–388.
[21] Andrej Kitanovski, Peter W.Egolf, “Application of magnetic refrigeration and its assessment,” Journal of Magnetism and Magnetic Materials 321(2009)777–781.
[22] A. Martinez, D. Astrain, A. Rodriguez, P. Aranguren, “Advanced computational model for Peltier effect based refrigerators,” Applied Thermal Engineering 95 (2016) 339–347.
[23] Luis Rosario, Muhammad M. Rahman, “Analysis of a magnetic refrigerator,” Applied Thermal Engineering 31 (2011) 1082-1090.
[24] F. Scarpa, G. Tagliafico, L.A. Tagliafico, “Classification proposal for room temperature magnetic refrigerators,” Int. J. of refrigeration 35 (2012 ) 453 -458.
[25] Behzad Monfared, Richard Furberg, Bjo¨rn Palm, “Magnetic vs. vapor-compression household refrigerators: A preliminary comparative life cycle assessment,” Int. J. of refrigeration 42 (2014) 69 -76.
[26] K.R. Ullah, R.Saidur, H.W.Ping, R.K.Akikur, N.H.Shuvo, “A review of solar thermal refrigeration and cooling methods,” Renewable and Sustainable Energy Reviews 24 (2013)499–513.
[27] Maamar Laidi, Salah Hanini, “Optimal solar COP prediction of a solar-assisted adsorption refrigeration system working with activated carbon/methanol as working pairs using direct and inverse artificial neural network, Int. J. of refrigeration 36 ( 2 013) 247 -257.
[28] Sur A, Das RK. “Review on solar adsorption refrigeration cycle”. Int J Mech Eng Technol 1 (2010) 190-226.
[29] G. Min, D.M. Rowe, Experimental evaluation of prototype thermoelectric domestic-refrigerators, Appl. Energy 83(2006), 133-152.
[30] A. Martinez, D. Astrain, A. Rodriguez, P. Aranguren, “Advanced computational model for Peltier effect based refrigerators”, Appl. Therm. Eng. 95(2016), 330-347.
[31] Shelton SV. Rampwave analysis of the solid/vapor heat pump. ASME Journal of Energy Resource, 112 (1990) 69–78.

Portable optical device for the non-destructive and insitu measurement of lycopene and degree of maturity
in ball tomato.
Lucía Limones-Pérez, Luis Miguel Contreras-Medina, R. Gerardo Guevara-González, J. Carlos Pedraza-OrtegaFaculty of Engineering
UAQQuerétaro, México
Digital image processing has proved to be useful for the analysisof organic compounds. Therefore, the present project proposes thedevelopment of an optical system for non-destructive and in situlycopene quantification, as well as its classification by maturationstage by studying the coloration present on the surface of balltomato fruits. This by means of a CMOS sensors arrangement andsegmentation techniques based on by thresholding andphotometry.
Keywords: Lycopene; portable; in situ; non-destructive; imageprocessing
I. INTRODUCTION
Lycopersicum sculentum is the scientific name given to thefruit of the tomato, this name has its origin from the nahuatlword "xitomatl". Its chemical composition is affected mainly byits maturation, where about 400 compounds participate that areresponsible for determining its flavor, aroma, texture, firmnessand color. In Mexico, the main varieties of tomatoes are: bola,saladette, cherry and large river. The ball tomato is characterizedby its round shape with an average weight between 70 and 100gand, with a diameter that goes from 4 to 8cm [1].
The tomato contains natural substances called carotenoids,which are organic pigments that are found on the surface of theplant. Carotenoids are composed by carotenes and xanthophylls.Within the group of carotenoids is the lycopene, which is thecompound responsible for red pigmentation of the fruit [2] andalso has high antioxidant activity. Lycopene acts against thedestruction of free radicals, preventing the generation ofdegenerative diseases [3].
Experts in neurobiology [4] link lycopene with theprevention of different types of cancer (lung, prostate, tumors,atherosclerosis, among others) and with the prevention of heartattacks. The lycopene content in a fruit depends mainly on thedegree of maturation and is directly related with the redcoloration, lycopene also is dependent on the selected varietyand the cultivation practices (light exposure, soil type,irrigation).
The Secretary of Economy and SAGARPA generated adocument called "Mexico supreme quality" for the specific useof the brand "MADE IN MEXICO" [5]. The certificationcontains specific requirements regarding the attributes of thetomato fruit. The documents has as objective the developmentof high value markets with high quality products, assuring theconsumer that the product they are acquiring has a high qualityfruit of tomato. For this, six stages of maturation of tomato weredefined based on the physical characteristics of the fruit. Thephysical features related with each ripening stages are presentedin Fig. 1 and described in Table 1.
Fig. 1. Ripening stages for the red tomato.
TABLE 1. STAGE OF MATURITY OF RED TOMATE DEFINED BY [5]
Stage Color Characteristics1 Green Tomato skin of green color.
2 BreakingBreaking of the green color towards yellow, pinkor red colors in no more than 10% of the surfaceof the fruit.
3 ScratchedBetween 10 and 30% of the surface of the fruitshows a change of nest from green to yellow,pink or red, or a mixture of them.
4 Pink Between 30 and 60% of the tomato surface ispink or red.
5 Light Red Between 60 and 90% of the surface of the tomatoshows pink or red colors.
6 Red More than 90% of the super cinema of the tomatohas red color.
A. HypothesisThe quantification of color by digital images processing of a
surface area of at least 40% of the tomato ball (Lycopersicumsculentum var. Beef), will generate a predictive model todetermine in situ and non-destructively, the amount of lycopene
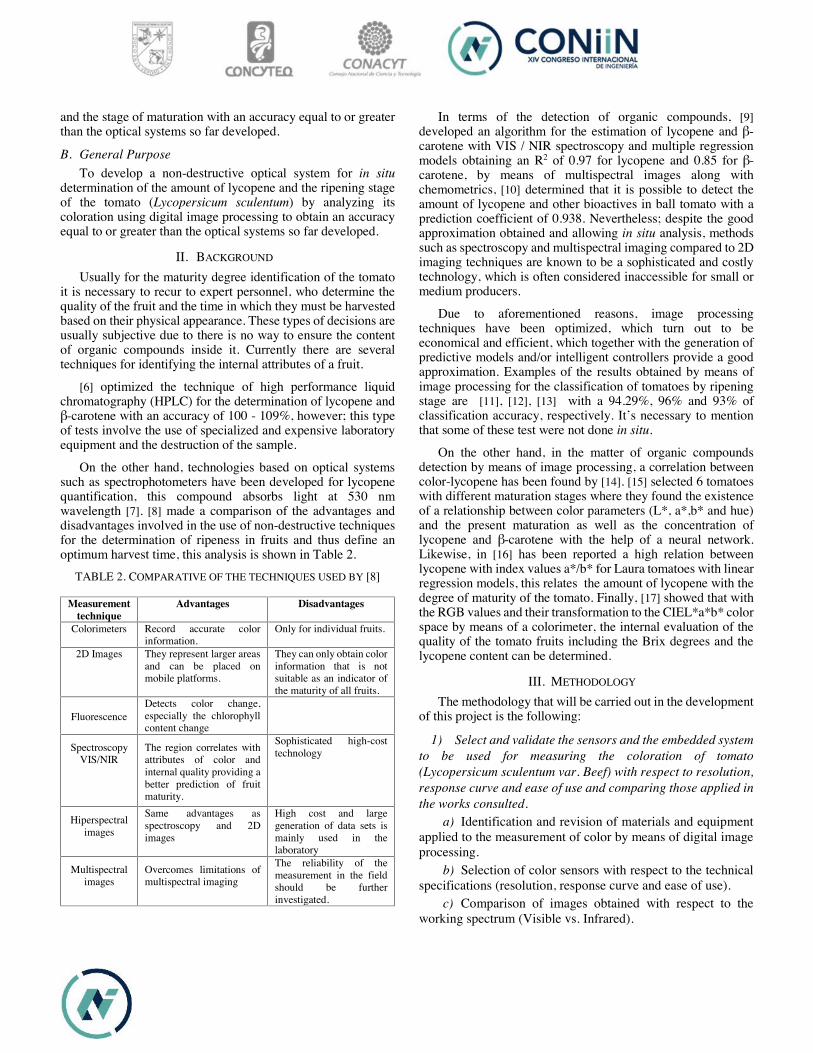
and the stage of maturation with an accuracy equal to or greaterthan the optical systems so far developed.
B. General PurposeTo develop a non-destructive optical system for in situ
determination of the amount of lycopene and the ripening stageof the tomato (Lycopersicum sculentum) by analyzing itscoloration using digital image processing to obtain an accuracyequal to or greater than the optical systems so far developed.
II. BACKGROUND
Usually for the maturity degree identification of the tomatoit is necessary to recur to expert personnel, who determine thequality of the fruit and the time in which they must be harvestedbased on their physical appearance. These types of decisions areusually subjective due to there is no way to ensure the contentof organic compounds inside it. Currently there are severaltechniques for identifying the internal attributes of a fruit.
[6] optimized the technique of high performance liquidchromatography (HPLC) for the determination of lycopene andβ-carotene with an accuracy of 100 - 109%, however; this typeof tests involve the use of specialized and expensive laboratoryequipment and the destruction of the sample.
On the other hand, technologies based on optical systemssuch as spectrophotometers have been developed for lycopenequantification, this compound absorbs light at 530 nmwavelength [7]. [8] made a comparison of the advantages anddisadvantages involved in the use of non-destructive techniquesfor the determination of ripeness in fruits and thus define anoptimum harvest time, this analysis is shown in Table 2.
TABLE 2. COMPARATIVE OF THE TECHNIQUES USED BY [8]
Measurementtechnique
Advantages Disadvantages
Colorimeters Record accurate colorinformation.
Only for individual fruits.
2D Images They represent larger areasand can be placed onmobile platforms.
They can only obtain colorinformation that is notsuitable as an indicator ofthe maturity of all fruits.
FluorescenceDetects color change,especially the chlorophyllcontent change
SpectroscopyVIS/NIR
The region correlates withattributes of color andinternal quality providing abetter prediction of fruitmaturity.
Sophisticated high-costtechnology
Hiperspectralimages
Same advantages asspectroscopy and 2Dimages
High cost and largegeneration of data sets ismainly used in thelaboratory
Multispectralimages
Overcomes limitations ofmultispectral imaging
The reliability of themeasurement in the fieldshould be furtherinvestigated.
In terms of the detection of organic compounds, [9]developed an algorithm for the estimation of lycopene and β-carotene with VIS / NIR spectroscopy and multiple regressionmodels obtaining an R2 of 0.97 for lycopene and 0.85 for β-carotene, by means of multispectral images along withchemometrics, [10] determined that it is possible to detect theamount of lycopene and other bioactives in ball tomato with aprediction coefficient of 0.938. Nevertheless; despite the goodapproximation obtained and allowing in situ analysis, methodssuch as spectroscopy and multispectral imaging compared to 2Dimaging techniques are known to be a sophisticated and costlytechnology, which is often considered inaccessible for small ormedium producers.
Due to aforementioned reasons, image processingtechniques have been optimized, which turn out to beeconomical and efficient, which together with the generation ofpredictive models and/or intelligent controllers provide a goodapproximation. Examples of the results obtained by means ofimage processing for the classification of tomatoes by ripeningstage are [11], [12], [13] with a 94.29%, 96% and 93% ofclassification accuracy, respectively. It’s necessary to mentionthat some of these test were not done in situ.
On the other hand, in the matter of organic compoundsdetection by means of image processing, a correlation betweencolor-lycopene has been found by [14]. [15] selected 6 tomatoeswith different maturation stages where they found the existenceof a relationship between color parameters (L*, a*,b* and hue)and the present maturation as well as the concentration oflycopene and β-carotene with the help of a neural network.Likewise, in [16] has been reported a high relation betweenlycopene with index values a*/b* for Laura tomatoes with linearregression models, this relates the amount of lycopene with thedegree of maturity of the tomato. Finally, [17] showed that withthe RGB values and their transformation to the CIEL*a*b* colorspace by means of a colorimeter, the internal evaluation of thequality of the tomato fruits including the Brix degrees and thelycopene content can be determined.
III. METHODOLOGY
The methodology that will be carried out in the developmentof this project is the following:
1) Select and validate the sensors and the embedded systemto be used for measuring the coloration of tomato(Lycopersicum sculentum var. Beef) with respect to resolution,response curve and ease of use and comparing those applied inthe works consulted.
a) Identification and revision of materials and equipmentapplied to the measurement of color by means of digital imageprocessing.
b) Selection of color sensors with respect to the technicalspecifications (resolution, response curve and ease of use).
c) Comparison of images obtained with respect to theworking spectrum (Visible vs. Infrared).

d) Comparison and selection of the embedded system forthe digital processing of images.
e) Selection of the lighting source to be used to obtain adiffused light to avoid the generation of shadows and internalreflections.
2) Design and manufacture a robust and versatilemechanism for the non-destructive and in situ measurement ofthe coloration of the tomato ball (Lycopersicum sculentum var.Beef), using the SolidWorks software.
a) Conceptual design of the prototype for the non-destructive and in situ quantification of lycopene in ball tomatoby optical systems.
b) Manufacturing and assembly of the prototype andintegration of sensors and actuators with the manufacturedhousing.
3) Generate a model based on the existing correlationbetween lycopene - color - maturity stage through the analysisof images that allows a correlation greater than or equal tothose proposed by existing optical devices.
a) Calibration of the selected sensor for the imageacquisition and light testing system in the inspection chamber.
b) Selection of 25 ball tomatoes with different maturationstages.
c) Acquisition and pre-processing of images obtained.d) Conversion of the image to CIEL * a * b * color space
and application of the processing method to the obtainedimages.
e) Obtaining the lycopene quantity of the tomatoesselected by HPLC tests.
f) Generation of the model based on the relationshipbetween lycopene - color - maturity stage to obtain a correlationgreater than or equal to those proposed by existing opticaldevices.
4) Implement the algorithm with the model generated fornon-destructive and in situ quantification of lycopene andmaturity stage in tomato (Lycopersicum sculentum var. Beef)with an accuracy greater than or equal to the models currentlygenerated.
a) Development of the programming code for theestimation of lycopene in ball tomato with respect to itscoloration.
b) Implementation of the algorithm in the selectedembedded system for the non-destructive and in situquantification of lycopene in tomato ball to obtain an equal orgreater accuracy to the optical systems found.
5) Reduce the system error by means of HPLC to apercentage of accuracy greater than or equal to the systemsdeveloped until now.
a) Experimentation, data analysis and validation of thegenerated model.
b) Decrease in the error rate found by means of hardware/ software adjustment.
c) Field tests will be done at the Autonomous Universityof Querétaro, Amazcala.
d) Synthesis of results and improvements to the prototype.e) Generation of the margin of error obtained in the field
for an adjustment not to the model and / or prototype to obtainan accuracy equal to or greater than the optical systems found.
ACKNOWLEDGMENT
The present investigation has been supported by “ConsejoNacional de Ciencia y Tecnología” (CONACYT) with registrynumber 554419 and CVU 662447.
REFERENCES
[1] C. Notario and M. Sosa, “El jitomate (Solanum lycopersicum): aporte nutrimental,enfermedades postcosecha y tecnologías para su almacenamiento en fresco,” Temasselectos de Ingeniería de Alimentos, vol. 6, no. 1. pp. 40–53, 2012.
[2] C. (CIAD) Hernández, “Tomate mexicano fuente de betacaroteno y licopeno,” Centrode Investigación en Alimentación y Desarrollo (CIAD), 2016. [Online]. Available:https://www.ciad.mx/notas/1640-tomate-mexicano-fuente-de-betacaroteno-y-licopeno.html. [Accessed: 22-Jan-2018].
[3] K. N. Waliszewski and G. Blasco, “Propiedades nutracéuticas del licopeno.,” SaludPublica Mex., vol. 52, no. 3, pp. 254–265, 2010.
[4] D. H. Covarrubias*, C. F. Pomares, G. E. A. Abreu, M. Á. D. Ortiz, and M. E. H.Aguilar, “No Title,” Centro de Investigaciones Cerebrales Universidad Veracruzana,2018. [Online]. Available:https://www.uv.mx/eneurobiologia/vols/2013/8/Herrera/HTML.html#.
[5] SAGARPA and S. de Economía, “MEXICO CALIDAD SUPREMA,” Secr. Econ.,pp. 1–22, 2005.
[6] A. I. O. Barba, M. C. Hurtado, M. C. S. Mata, V. F. Ruiz, and M. L. S. de Tejada,“Application of a UV–vis detection-HPLC method for a rapid determination oflycopene and β-carotene in vegetables,” Food Chem., vol. 95, no. 2, pp. 328–336,Mar. 2006.
[7] O. A. Zamudio Ramírez, “Procesamiento de imágenes implementado en FPGA paraestimar licopeno y b-caroteno en tomate rojo y zanahoria.” Querétaro, México, p. 104,2015.
[8] B. Li, N. Emr, E. Malling, and K. Me, “Advances in Non-Destructive EarlyAssessment of Fruit Ripeness towards Defining Optimal Time of Harvest and YieldPrediction — A Review,” no. December, pp. 1–20, 2018.
[9] S. Tilahun, D. S. Park, A. M. Taye, and C. S. Jeong, “Effect of ripening conditions onthe physicochemical and antioxidant properties of tomato (Lycopersicon esculentumMill.),” Food Sci. Biotechnol., vol. 26, no. 2, pp. 473–479, 2017.
[10] C. Liu, W. Liu, W. Chen, J. Yang, and L. Zheng, “Feasibility in multispectral imagingfor predicting the content of bioactive compounds in intact tomato fruit,” Food Chem.,vol. 173, pp. 482–488, 2015.
[11] N. Goel and P. Sehgal, “Fuzzy classification of pre-harvest tomatoes for ripenessestimation - An approach based on automatic rule learning using decision tree,” Appl.Soft Comput. J., vol. 36, pp. 45–56, 2015.
[12] Y. Zhao, L. Gong, B. Zhou, Y. Huang, and C. Liu, “Detecting tomatoes in greenhousescenes by combining AdaBoost classifier and colour analysis,” Biosyst. Eng., vol.148, no. 2009, pp. 127–137, 2016.
[13] Y. Zhao, L. Gong, Y. Huang, and C. Liu, “Robust tomato recognition for roboticharvesting using feature images fusion,” Sensors (Switzerland), vol. 16, no. 2, 2016.
[14] A. G. Saad, P. Jaiswal, and S. N. Jha, “Non-destructive quality evaluation of intacttomato using VIS-NIR spectroscopy,” vol. 2, no. 12, pp. 632–639, 2014.
[15] M. A. Vazquez-Cruz et al., “Application of neural networks to estimate carotenoidcontent during ripening in tomato fruits (Solanum lycopersicum),” Sci. Hortic.(Amsterdam)., vol. 162, pp. 165–171, 2013.
[16] R. Arias, T. C. Lee, L. Logendra, and H. Janes, “Correlation of lycopene measuredby HPLC with the L*, a*, b* color readings of a hydroponic tomato and therelationship of maturity with color and lycopene content,” J. Agric. Food Chem., vol.48, no. 5, pp. 1697–1702, 2000.
[17] G. Niño-Medina, J. C. Rivera-Castro, J. A. Vidales-Contreras, H. Rodriguez-Fuentes,and A. I. Luna-Maldonado, “PhysicoChemical Parameters for Obtaining PredictionModels in the Postharvest Quality of Tomatoes (Solanum Lycopersicum L.),” Mda,vol. 6, no. 2, pp. 54–66, 201
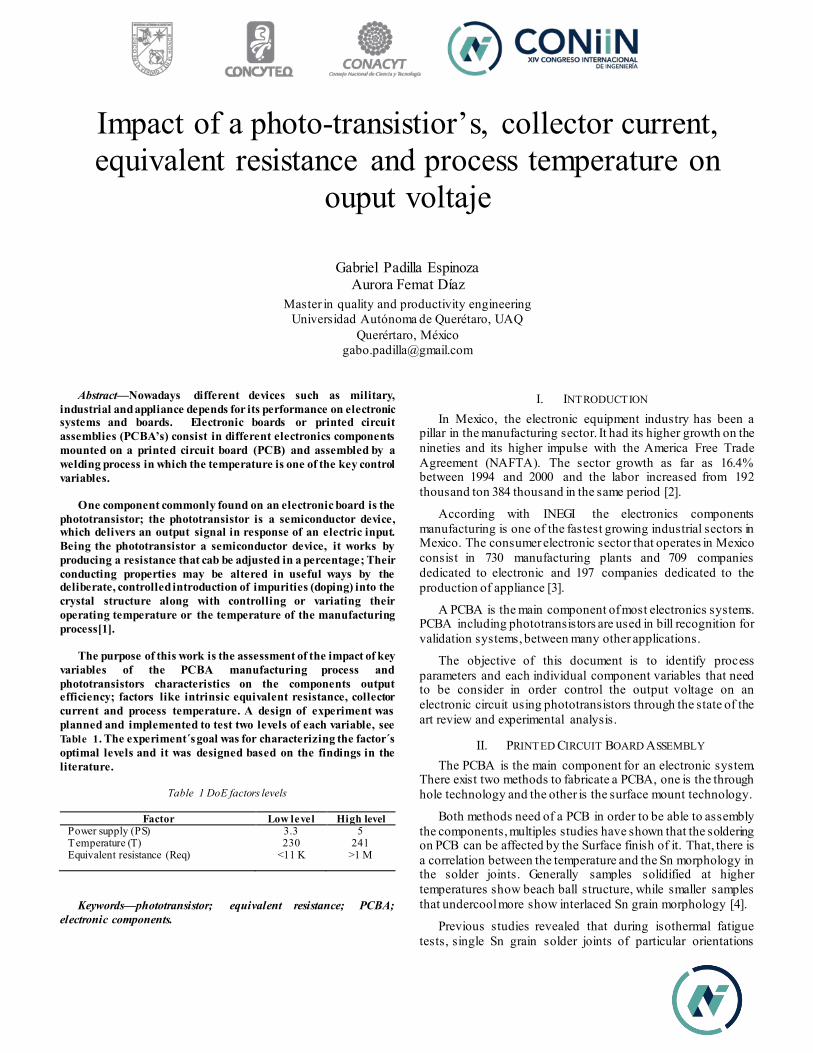
Impact of a photo-transistior’s, collector current, equivalent resistance and process temperature on
ouput voltaje
Gabriel Padilla Espinoza Aurora Femat Díaz
Master in quality and productivity engineering Universidad Autónoma de Querétaro, UAQ
Querértaro, México [email protected]
Abstract—Nowadays different devices such as military, industrial and appliance depends for its performance on electronic systems and boards. Electronic boards or printed circuit assemblies (PCBA’s) consist in different electronics components mounted on a printed circuit board (PCB) and assembled by a welding process in which the temperature is one of the key control variables.
One component commonly found on an electronic board is the phototransistor; the phototransistor is a semiconductor device, which delivers an output signal in response of an electric input. Being the phototransistor a semiconductor device, it works by producing a resistance that cab be adjusted in a percentage; Their conducting properties may be altered in useful ways by the deliberate, controlled introduction of impurities (doping) into the crystal structure along with controlling or variating their operating temperature or the temperature of the manufacturing process[1].
The purpose of this work is the assessment of the impact of key variables of the PCBA manufacturing process and phototransistors characteristics on the components output efficiency; factors like intrinsic equivalent resistance, collector current and process temperature. A design of experiment was planned and implemented to test two levels of each variable, see Table 1. The experiment´s goal was for characterizing the factor´s optimal levels and it was designed based on the findings in the literature.
Table 1 DoE factors levels
Factor Low level High level Power supply (PS) 3.3 5 Temperature (T) 230 241 Equivalent resistance (Req) <11 K >1 M
Keywords—phototransistor; equivalent resistance; PCBA; electronic components.
I. INTRODUCTION In Mexico, the electronic equipment industry has been a
pillar in the manufacturing sector. It had its higher growth on the nineties and its higher impulse with the America Free Trade Agreement (NAFTA). The sector growth as far as 16.4% between 1994 and 2000 and the labor increased from 192 thousand ton 384 thousand in the same period [2].
According with INEGI the electronics components manufacturing is one of the fastest growing industrial sectors in Mexico. The consumer electronic sector that operates in Mexico consist in 730 manufacturing plants and 709 companies dedicated to electronic and 197 companies dedicated to the production of appliance [3].
A PCBA is the main component of most electronics systems. PCBA including phototransistors are used in bill recognition for validation systems, between many other applications.
The objective of this document is to identify process parameters and each individual component variables that need to be consider in order control the output voltage on an electronic circuit using phototransistors through the state of the art review and experimental analysis.
II. PRINTED CIRCUIT BOARD ASSEMBLY The PCBA is the main component for an electronic system.
There exist two methods to fabricate a PCBA, one is the through hole technology and the other is the surface mount technology.
Both methods need of a PCB in order to be able to assembly the components, multiples studies have shown that the soldering on PCB can be affected by the Surface finish of it. That, there is a correlation between the temperature and the Sn morphology in the solder joints. Generally samples solidified at higher temperatures show beach ball structure, while smaller samples that undercool more show interlaced Sn grain morphology [4].
Previous studies revealed that during isothermal fatigue tests, single Sn grain solder joints of particular orientations
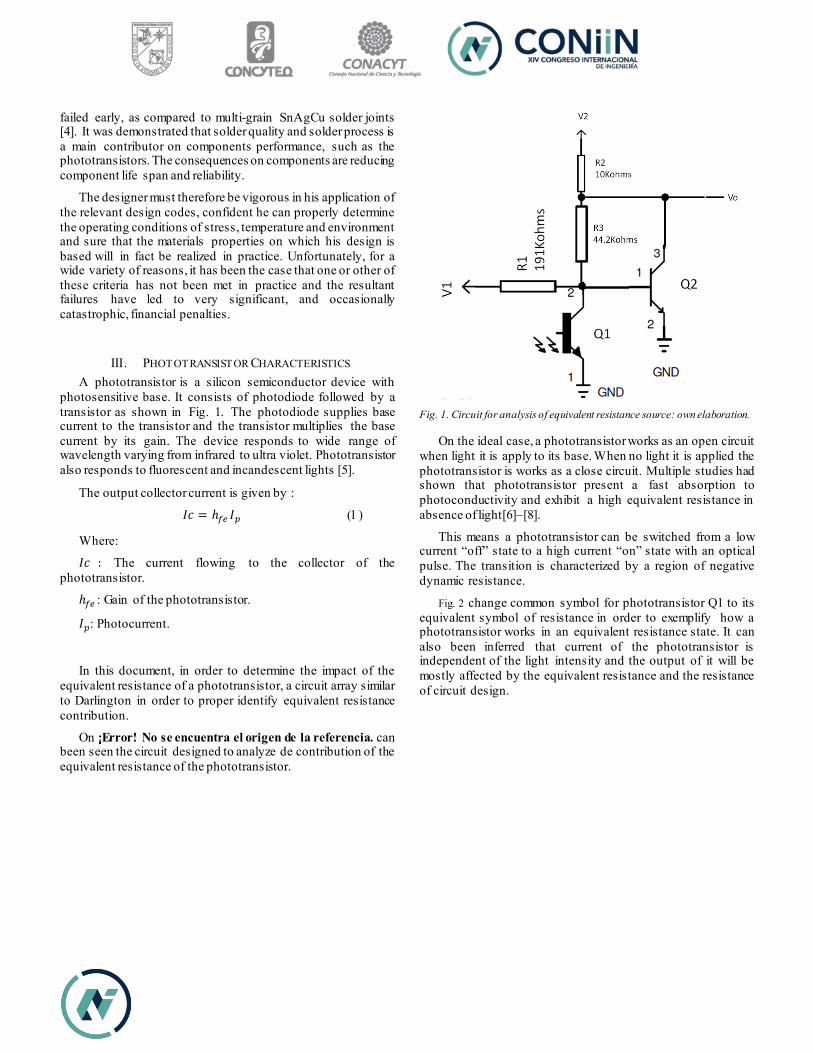
failed early, as compared to multi-grain SnAgCu solder joints [4]. It was demonstrated that solder quality and solder process is a main contributor on components performance, such as the phototransistors. The consequences on components are reducing component life span and reliability.
The designer must therefore be vigorous in his application of the relevant design codes, confident he can properly determine the operating conditions of stress, temperature and environment and sure that the materials properties on which his design is based will in fact be realized in practice. Unfortunately, for a wide variety of reasons, it has been the case that one or other of these criteria has not been met in practice and the resultant failures have led to very significant, and occasionally catastrophic, financial penalties.
III. PHOTOTRANSISTOR CHARACTERISTICS A phototransistor is a silicon semiconductor device with
photosensitive base. It consists of photodiode followed by a transistor as shown in Fig. 1. The photodiode supplies base current to the transistor and the transistor multiplies the base current by its gain. The device responds to wide range of wavelength varying from infrared to ultra violet. Phototransistor also responds to fluorescent and incandescent lights [5].
The output collector current is given by :
𝐼𝑐 = ℎ𝑓𝑒 𝐼𝑝�� � � ����
Where:
𝐼𝑐 : The current flowing to the collector of the phototransistor.
ℎ𝑓𝑒 : Gain of the phototransistor.
𝐼𝑝: Photocurrent.
In this document, in order to determine the impact of the equivalent resistance of a phototransistor, a circuit array similar to Darlington in order to proper identify equivalent resistance contribution.
On ¡Error! No se encuentra el origen de la referencia. can been seen the circuit designed to analyze de contribution of the equivalent resistance of the phototransistor.
Fig. 1. Circuit for analysis of equivalent resistance source: own elaboration.
On the ideal case, a phototransistor works as an open circuit when light it is apply to its base. When no light it is applied the phototransistor is works as a close circuit. Multiple studies had shown that phototransistor present a fast absorption to photoconductivity and exhibit a high equivalent resistance in absence of light[6]–[8].
This means a phototransistor can be switched from a low current “off” state to a high current “on” state with an optical pulse. The transition is characterized by a region of negative dynamic resistance.
Fig. 2 change common symbol for phototransistor Q1 to its equivalent symbol of resistance in order to exemplify how a phototransistor works in an equivalent resistance state. It can also been inferred that current of the phototransistor is independent of the light intensity and the output of it will be mostly affected by the equivalent resistance and the resistance of circuit design.

Fig. 2. Circuit for analysis of equivalent resistance modified source: own elaboration
In order to calculate the equivalent resistance of the phototransistor we use a mesh analysis on the circuit, resulting in the following equation:
𝐼𝐵 = 𝐼1 + 𝐼3 − 𝐼𝑒𝑞 (2)
IV. METHODOLOGY In order to be able to develop the analysis presented in this
document. Is proposed a design of experiments (DoE) using the variables defined above, equivalent resistance (req), collector current measured through the voltage input (Ps) and process temperature (t).
For the DoE, a full factorial design was chosen to develop the experimental trials . This way the DoE will be formed by eight experimental trial runs in three replicates as show in Table 2.
Table 2 DoE proposed
Trial Power Supply Temperature Equivalent Resistance 1 3.3 230 < 11 K 2 5 230 < 11 K 3 3.3 241 < 11 K 4 5 241 < 11 K 5 3.3 230 > 1 M 6 5 230 > 1 M 7 3.3 241 > 1 M 8 5 241 > 1 M
Output voltage will be measured through an analogic digital converted using a receiver board and an analysis software for internal use only.
To develop the DoE, eight electronic boards with phototransistors were selected in order to have these components unaffected by any kind of handling and low and high Req levels respectively. For the remaining factor levels, boards will be modify as necessary following IPC-A-610F standard.
An ANOVA analysis will be done to compare treatment contribution to response. Then a homogeneity test will be perform to the variance and residual results for data validation of the ANOVA, ANOVA will be perform with a confidence level of 95% and realized on RStudio 1.1.423.
V. RESULTS After the analysis of the results of the DoE proposed in this
document, is expected to find the equivalent resistance of the phototransistors as a significant parameter for the output voltage in an electronic circuit, so that a combination of levels can be proposed in order to achieve the objective presented within this document.
Whit this validation equivalent resistance can be consider as an important factor on the design of electronic circuits and PCBA in order to improve devices reliability.
ACKNOWLEDGMENT Author would like to acknowledge the to the UAQ school of
engineering, M. Luis Lucia M. for useful comments and assistance and CONACYT for the valuable scholarship support.
REFERENCES [1] R. L. Boylestad y L. Nashelsky, Electronic Devices and Circuit Theory,
11 edition. Upper Saddle River, N.J: Pearson, 2012. [2] V. H. Guadarrama y M. Casalet, «La industria electrónica y la
evolución de la industria de software en dos regiones de México», Com. Económica Para América Lat. El Caribe CEPAL Deslocalización Serv. Cadenas Glob. Valor Nuevos Factores Cambios Estructurales En América Lat. El Caribe, 2012.
[3] «Censos Económicos 2014. Resultados Definitivos», INEGI. [En línea]. Disponible en: http://www.inegi.org.mx/est/contenidos/proyectos/ce/ce2014/default.aspx. [Accedido: 18-mar-2018].
[4] A. Babak, F. Mutuku, y E. Cotts, «Effect of PCB Surface Finish on Sn Grain Morphology and Thermal Fatigue Performance of Lead-Free Solder Joints - Journal of SMT», 2015, vol. 28, pp. 13-20, 2015.
[5] D. G. M. Rebeiz, «Phototransistor characteristics», Experiment-45, p. 7, mar-2003.
[6] V. S. Chava et al., «Evidence of minority carrier injection efficiency> 90% in an epitaxial graphene/SiC Schottky emitter bipolar junction phototransistor for ultraviolet detection», Appl. Phys. Lett., vol. 108, n.o 4, p. 043502, 2016.
[7] T .-T. Kao, J. Kim, T. Detchprohm, R. D. Dupuis, y S.-C. Shen, «High-Responsivity GaN/InGaN Heterojunction Phototransistors», IEEE Photonics Technol. Lett., vol. 28, n.o 19, pp. 2035–2038, 2016.

[8] T .-T. Kao et al., «Performance evaluation of GaN/InGaN heterojunction phototransistors», en CLEO: Science and Innovations, 2015, pp. SW4N–3.

Asphalts Mixtures Asphalt Rubber Mixtures
Javier de la Cruz Gutiérrez
Engineering Faculty Universidad Autónoma de Querétaro
Querétaro, Mexico [email protected]
Mauricio Mejia Mejia Engineering Faculty
Universidad Autónoma de Querétaro Querétaro, Mexico
“The Warm Mix Asphalt (WMA) technology has become an important new research topic in the field of pavement materials as it offers a potential solution for the reduction of energy consumption and GHG emissions during the production and placement of asphalt mixtures”[1]
Keywords—asphalt rubber; pavement noise; pavement desing; hot mix asphalt; plastic waste;
I. INTRODUCTION “The waste of tire rubber becomes a major environmental
concern. The use of crumb rubber, which is the recycled tire rubber, as an additive in hot mix asphalt mixture is considered
as a sustainable construction method.” [2] ” Asphalt rubber mixtures continue to receive great attention from many
transportation agencies world-wide because of their ability to improve pavement performance compared to conventional
designs.”[3] In this work we wanna present the main idea or the importance of reducing the waste of rubber tires
employing this material in a new method of pavements in which we can reduce the contamination all over the world and
the new highways will be more efficient.
II. PRECEDENTS “The seasonal change in temperature and loading nature has
a significant effect on asphalt behavior because of its visco-elastic nature. Several types of flexible pavement failure/distress occur due to this behavior of asphalt binder, among which rutting and fatigue cracks are very common.”[4]
“Mexico according to the National Association of Distributors of Rims (Andellac), every year 40 million old tires are rejected.
Between the possible applications in the public work, one of those of major interest is the manufacture of asphalt miscellanies for highways, since the rubber of the tires endures progress in its
behavior, it is more economic than other alternative modifiers and it allows to consume a considerable residue quantity.” [5]
The rims for vehicles at the end of its useful life cycle, turn into not biodegradable waste. Also its physical form and its geographical dispersion raise a big challenge for its handling and final disposition.
The elimination of the rims of waste is a world serious problem. Due to the big number of rims of waste generated annually and its long life, the rims have a substantial problem in its handling like garbage. At present most of the rims of waste are piled up or used like filling in big area extensions, creating you would be sanitary and environmental threats.
The rims rubbish dumps have been from time behind, subjects of big discussions; still before there were the modern technologies in the manufacture of rims and the complex and vast system of distributors worried by the ecology.
Although in fact, the industry of the recovery of the rubber of the rims, it started practically as soon as the first tires of the first vehicles came to its final wear and were rejected. When the rims manufacture became more sophisticated with the incorporation of synthetics and radial belts of steel, the process of re-using the rubber was more and more difficult.
A. Rubber recycling and two methods The dust of rubber recycling it is obtained crushing the entire
tires up to the wished size and separating the metals and textiles that they could incorporate. The form of grinding, the grain of the particles and the metallic and textile remaining content of pollutants affect to the properties of the dust of obtained rubber. The use in asphalt miscellanies requires that the recycled rubber should be in the shape of thin particles of sizes lower than 2 mm, or 0,5 mm, according to the applications. The incorporation of pneumatic dust to an asphalt miscellany modifies its properties reológicas and improves its services as material for highways. This incorporation can be done of two ways: One of them is the miscellany previous to the rubber dust with the asphalt for its later employment as ligante in the asphalt miscellany. This form of incorporation of the pneumatic dust to the asphalt miscellanies for addition before to the asphalt is known as “a humid route”. The second procedure consists of introducing the pneumatic dust straight in the plant of manufacture of asphalt miscellanies, together with the asphalt and the aggregations. The tire dust acts partly how arid, but the thinnest particles intergesticulate with the asphalt modifying its properties, managing to improve this way the behavior of the asphalt miscellany. This form of modification in which the pneumatic dust joins straight like one more component of the asphalt miscellany, is known as “a dry route”.
B. Asphalt In the first term it is necessary to know the conceptual part of what is the asphalt as ligant material derived from the refinement of the oil and of supreme importance for the construction industry for its properties of consistency, adherence, impermeability and durability. Nevertheless, it is a very capable product to the changes of temperature, the aging for elements, the oxidation and the photo degradation. The asphalt is composed of asphalt molecules, the same ones that shape chemical structures (linear), aromatic and cyclical alifáticas.
It is good to know with largeness what means the chemical structure of the asphalt in order to determine its real behavior and it not to work simply like a residual refinement material.
So next the types of asphalts are described most used at present for the production and use in the construction industry:
1. Rusty or blown asphalts:
These are asphalts submitted to a process of dehydrogenation and then to a process of polymerization. An air current one makes him go on to high temperature with the target to improve its characteristics and to adapt them to more specializing applications.
2. Solid or hard asphalts:
Asphalts with a penetration to temperature ambience less than 10ºC. In addition to its agglutinative properties and impermeabilizantes, it possesses typical of flexibility, durability and high resistance to the action of most of the acids, you go out and tar.
3. Fluxante or oil fluxante:
Fraction of relatively slightly volatile oil that can be used to moderate to the asphalt up to the wished consistency; often it is used like commodity for the manufacture of asphalt materials for covering revetments.
4. Asphalts fillerizados:
Asphalts that contain mineral matters elegantly ground that spend for the sifter # 200.
5. Liquid asphalts:
Also so called reduced asphalts or cutbacks, there are asphalt materials of soft or fluid consistency for what they leave of the field in which normally there is applied the essay of penetration, which maximum limit is 300. They are composed by an asphalt phase and a volatile fluidificante, which can be a benzine, kerosine or oil. The fluidificantes evaporate (I process of treated), staying the asphalt residue which wraps and cohesiona the particles of the aggregation. Liquid asphalts are the following products:
6. Asphalts emulsions:
1. Asphalt emulsions: There are a part of the liquid asphalts. It is a heterogeneous system of two phases normally inmiscibles, as there are the asphalt and the water, into that surface activator incorporates a small quantity of an agent, tensoactivo or emulsifier, of soapy base or alkaline solution, which maintains in dispersion the system, being the phase continues the water and discontinues the globules of the asphalt, in size, between one to ten microns.
2. Inverse asphalt emulsion: asphalt emulsion in which the continuous phase is an asphalt, usually of liquid type, and the discontinuous phase is constituted by tiny water globules in relatively small portion. This type of emulsion can be also aniónica or catiónica.
On the market they can be a big variety of additional asphalts to earlier mentioned this because the action of the modifiers collaborates in the tendency to which the asphalt presents less consistency changes for changes of temperature. With the use of modified asphalts, the asphalt miscellanies can optimize its performance; the grade and type of improvement will depend on the interaction asphalt - modifier. Between the possible progress they can be mentioned: · To diminish the thermal susceptibility · To increase the internal cohesion · To improve the elasticity and flexibility to low temperatures · To improve the behavior to the fatigue · To increase the resistance to the aging · To reduce the permanent distortion It is necessary to mention that only one modifier cannot achieve all this progress in the performance of the modified asphalt miscellany; in fact, the substantial progress of an important property (example, permanent distortion) will bear to the decrease of other one (example, fatigue). Composition of the rubber The changes in the composition of the rubber proceeding from the tire of waste are not usually significant. Incorporation of compatible oils and other additives The main function of the oils is to limit the stickiness to facilitate the application of the product, as well as to diminish its module to low temperatures. Other frequent additives are polymers with suppressed high place of natural rubber, which decompose and incorporate in the asphalt to temperatures lower than the tires rubber, providing to the biggest modified ligante adherence and flexibility but they do not reduce the thermal susceptibility so much like the tires rubber. Rubber content in the miscellany On having increased the content of the rubber, there increases the grade of modification of the asphalt modified with rubber. After 60/70 realize tests with an asphalt AC-20 of approximately penetration, with less rubber to 1. 25mm, the interaction period was 90 minutes to 176°C and using the same miscellany method it goes over to the conclusion that to major

rubber content on the asphalt, the stickiness increases clearly, as well as the point of softening and the percentage of flexible comeback. Grain of the rubber Less all that is the size of the particles of rubber, major will be its specific surface and with her the interaction grade with the asphalt; as the opposite effect has observed that the smallest particles tend to despolimerizarse, what supposes a decrease of the stickiness. Specific surface This property not only depends on the grain of the rubber but also it is related to the procedure of grinding to which it has been submitted. Impurities of the rubber These impurities are from moisture, steel and fibres, up to any pollutant. The moisture can provoke water vapor on having mixed rubber and asphalt. For it, the rubber must be analyzed periodically introducing samples in heater to 100°C, up to constant weight Used mixer In general, the asphalts modified with rubber made by appropriate mechanical means present a less dispersion in the stickiness (homogeneity) and a slightly more placed decrease of cyclical, talking each other therefore of an interaction asphalt - rubber more finished.
III. REFERENCIAS [1]Alloza, A. M. (s.f.). asphalt rubbermixtures white warm
mix asphalt additives. Obtenido de oa.upm.es
[2]DanielTjandra, P. S. (21 de february de 2017). elservier. Obtenido de www.sciencedirect.com/science/article/pii/S1877705817304617
[3]E.Kaloush, K. (2014). experts.asu. Obtenido de Asphalt rubber: Performance tests and pavement design issues: https://asu.pure.elsevier.com/en/publications/asphalt-rubber-performance-tests-and-pavement-design-issues
[4]F.Almansoor, I. M. (20 de May de 2016). elservier. Obtenido de https://www.sciencedirect.com/science/article/pii/S187770581630203X
[5]Duarte, J. M. (s.f.). Evaluación de mezclas asfálticas modificados con hule de neumático, mediante diseño volumétrico, TSR y deformación permanente . Obtenido de www.amaac.org.mx
[6]George B. Way, D. D. (16 de jun de 2010). experts.asu. Obtenido de 39th International Congress on Noise Control Engineering 2010, INTER-NOISE 2010: George B. Way, Douglas D. Carlson, Jorge B. Sousa, Kamil E. Kaloush, Krishna P. Biligiri
[7]Ibañes, I. C. (s.f.). ASFALTOS MODIFICADOS. Obtenido de www.amaac.org.mx
[8]Lizcano, F. A. (s.f.). Congreso Mexicano del Asfalto. Obtenido de www.amaac.org.mx

Evaluation of the properties of concrete with the addition of rubber particles for structural elements
Review
Sandoval Jimena *, Molina Priscilla, Olvera Luis G. and Clemente-Chávez A. Facultad de Ingeniería
Universidad Autónoma de Querétaro Querétaro, México
Abstract
In the development of the review, we will revise the behavior under tests that have been made in concretes that work with crushed rubber particles, which have been carried out in different countries around the world, you are tests of compression, bending, Flotation among others, giving results varied according to the methodology that was followed. It will show some results compared in tables pretending to have a greater perception of the situation.
Keywords: Concrete, rubber, environmental care, recycling.
I. INTRODUCTION
Tires pollute the environment from its manufacture since only one tyre requires 35 liters of oil for its production. The tires are made of various materials such as steel, sulfur, copper, cadmium and lead, so the waste of these materials is an environmental problem of great importance. The component that interests us most in this research is the rubber of the tires discarded.
The number of tires that contribute to environmental pollution is of great concern as they are an important part of the solids that currently contaminate the country. In Mexico there is no strategy to reduce the damage they cause. Research has made known that over 90% of these wastes end up in vacant lots, rivers, roads and other inappropriate places. The use of rubber is increasing while its decomposition takes a very slow process (it takes about 100 years), being higher production than its degradation.
All this happens without having an idea of the properties that these materials possess, properties that, explotándolas in an efficient way in the area of the construction could bring benefits. We talk about acoustic and thermal properties, which allow to eliminate the radiation generated at temperatures higher than 30 degrees Celsius as well as isolate sound frequencies.
There have been studies of the behavior of rubber added in other materials such as asphalt and concrete, in order to reduce the percentage of waste on the planet, which attracted our attention and gave rise to this research.
In this review is intended to gather the largest number of articles and theses developed to put in context readers of what was done and is currently done worldwide and review what is missing to do or in what field has not been investigated enough to reach Concl Usiones and determine a way to go with respect to rubber waste on the planet.
II. RECYCLED RUBBER It is not new that in the world there is concern about pollution of the environment, and speaking in terms of rubber as material from tyres, there are already several investigations concerning the importance of recycling this material that is very difficult To degrade as this process takes according to some references 100 years, while others mention it takes 600 years. In the research carried out by Pan Song, Xiaoyu Wu and Shifeng Wang (2017) [1] There is talk about the difference between the degradation of SBR rubber and natural rubber (NR). Research was conducted on the evolution of morphology and the degradation mechanism; In addition, we tested Fourier transform infrared spectroscopy and a thermogravimetric analysis. The results obtained were that the degradation between SBR and NR differed at 300 °c and in terms of molecular chains, the increase in SBR content, the sun fraction consisted mainly of small chains of NR, and the fraction of gel was chains Molecular of SBR crosslinked.
A. SELF-COMPACTING CONCRETE In 2016, Nahla Naji Hilal [2] assessed the effect of size and
rubber content on self-compacting concrete, performing tests
on different mixture designs to a constant ratio of water to binder of 0.35 and 520 kg/m3 of folder contents. The results obtained from the use of crumb rubber are negative in the hardened properties of self-compacting concrete, while there was an improvement in ductility when all types of tyre waste were added.
B. ASPHALT In addition to finding results in the research on rubber
added in particular, there are also studies on asphalt, among these, we can mention the work done by Shubham Bansal, Anil Kumar Misra, and Purnima Bajpai (2017) [3] who in addition to using Rubber wastes use polyethylene plastic bags, bottles and glass parts, these materials partially replaced the asphalt. The following results were obtained: the mixture with rubber increased by 50% the resistance compared with the conventional mixture, whereas the one that had plastic increase by 16% in the resistance; Thus obtaining favorable results.
On the other hand, we also have the study carried out by Luis A. Moreno Anselmi [4] in his document on the behavior of asphalt mixtures added with rubber and leather, where he conducted the study of the deformation parameter in his samples with the Marshall press; Having as a result the conventional asphalt mixture had a minimum deformation of 2.90 mm, whereas in the samples manufactured with rubber-leather addition to 1, 2, 3 and 4% had minimal deformations smaller than that of the conventional one. Obtaining that the specimens that had less deformation were those added to 1%.
C. RUBBER FLOTATION An important aspect to evaluate according to Han Zhu, Bin
Rong, Rong Xie and Ziheng Yang [5], is the flotation of rubber particles, since they consider already has been reported on the favorable qualities that presents the concrete of crumb rubber. For its investigation, this equipment tested the compression resistance of the rubber concrete cube, the density and distribution of rubber particles in the specimens to measure the flotation. The results for the flotation are that it is more evident when there is more vibration time. With regard to settlements, if these are low, the floating of the particles is not apparent, while the high and rising settlements yield a more apparent floating effect.
D. TENACITY AND ELÁSTICIDAD MODULE IN CONCRETE ADDED WITH RUBBER. The tenacity and modulus of elasticity of the concrete
added with rubber are two concepts of utmost importance because they allow us to know what is the greatest resistance that the concrete has before breaking or breaking. For the study of these concepts are necessary tests of circular plate, square plate and residual tension in beams like those carried out by Javier R. Alfonso Rodríguez and Oscar O. Badillo Peralta [6], in which the results that threw all his tests carried out in Added
concrete with rubber (not crushed rubber, if not in strips), they obtained that the contribution in terms of tenacity to the concrete added with rubber, is low, due to the little adhesion presented between the two materials. In one of his essays in this type of concrete they obtained an absorbed energy at the 40mm of displacement of 20.4 joules. The rubber strips did not fail, but instead, they detached from the concrete matrix, generating a mechanism of failure that does not bring tenacity to the concrete. The low compatibility of deformations between the concrete and the rubber strips allowed them to Desprendieran, because their cross section decreases and loses contact with the concrete matrix.
On the other hand referring to the studies of Herwin Felipe Eraseo and Natalia Ramos [7] In his study on the modulus of elasticity in the substitution of ground rubber by fine aggregate in a mixture of concrete, obtained that the modulus of elasticity decreases to As the percentage of ground rubber is increased in the mixture, due to the decrease of the compression resistance as the aggregate of crushed rubber is increased. They obtained, also speaking of the absorption of energy, that as the deformation of the concrete with rubber is greater compared with that of the normal concrete with respect to the same load applied; This opens up new research on this subject.
E. CONCRETE ADDED WITH THICK PARTICLES OF RUBBER. The mixtures with a percentage of coarse crushed rubber,
as mentioned by Juan C. Pérez Oyola and Yeison L. Arrieta Ballén [8] In his study on the addition of this material to concrete, provide better characteristics to concrete and even improve the Adhesion between the concrete mixture and the rubber, this could be observed because when applying the load to the specimens, these thanks to the properties of ductility of the rubber and its capacity of absorption of energy.
F. IMPROVEMENTS TO THE COMPRESSION RESISTANCE, CONCRETE WITH RUBBER. The main problem of the addition of rubber to concrete
mixes with different proportions is its resistance to compression, because it decreases greatly. Unlike bending strength where the concrete added with rubber is placed almost at the level of conventional concrete.
An observation that is made in the document of Paola G. Bastidas Sosa and Mauro P. Viñán Audino [9] In his analysis of the physical and mechanical properties of the concrete in question, where they obtained a decrease in the resistance to the compression of 28% at 28 days , is that a way to improve the compression resistance in the addition of rubber to concrete this aggregate should undergo a pre-treatment which can ensure a good addition between the rubber particles and cementing mixture.
In a study carried out at the University of Civil and Transportation Engineering, Guangdong University of
Identify applicable sponsor/s here. If no sponsors, delete this text box (sponsors).

Technology in China [10], where five types of mixtures were proposed with different percentages of rubber ranging from 10 to 50%, comparison with the mixture Conventional and what was obtained is shown in the following charts:
Figure 1. Types of mixtures and graph of stress deformation [10].
Figure 2. Comparison of the resistances of the different types of
mixtures [10].
The results shown in this study show that the introduction of the rubber particles reduce the resistance to both traction and compression and that we can not replace beyond between 10% and 20% of the fine aggregate, because the reduction of resistance can Be more than 50%.
G. CONCRETE RUPTURE MODULE ADDED WITH RUBBER. At the University of New South Wales, in Australia [11]
The experimentation of concrete beams added with rubber was carried out, this project shows the particle size of the material they used, which is shown in the following graph:
Figure 3. Comparison of the resistances of the different types of
mixtures [11].
The results of the mixing design:
Figure 4. Graphic of effort deformation of the concrete type 40R1
[11].

Figure 5. Graphic of effort deformation of the concrete type
30R1 [11].
Figure 6. Stress graphic deformation of concrete 40R2 type [11]
Figure 7. Stress graphic deformation of concrete 30R2 type
[11].
Figure 8. Stress graphic deformation of concrete 40R3 type
[11].
Figure 9. Stress graphic deformation of concrete 30R3 type
[11].
In this work, the cutting behavior of CRCs reinforced beams of similar compression strength was investigated. Adjustment of stirrups, capacity of cutting of reinforced beams, pattern of fault and the behavior of deviation of the load, were examined from experimental study. In addition, the cutting capacities were compared with the design guidelines available for conventional concrete. Finally, the compatibility of using available material models of conventional concrete for the numerical analysis of the shearing behavior of the CRC beam was evaluated.
In the experiments, the stirrup-free beams failed due to cutting after reaching their cutting capacity. The experimental results showed that there is a 10-15% variation in the cutting-to-flexion capacities between beams made from CRCs of similar strength. They also indicate that the rubber content had an impact on the CRC's cutting capacity. However, the results were insufficient to conclude determining the relationship between the rubber content and the cutting capacity of the rays that emphasizes the need for further research.
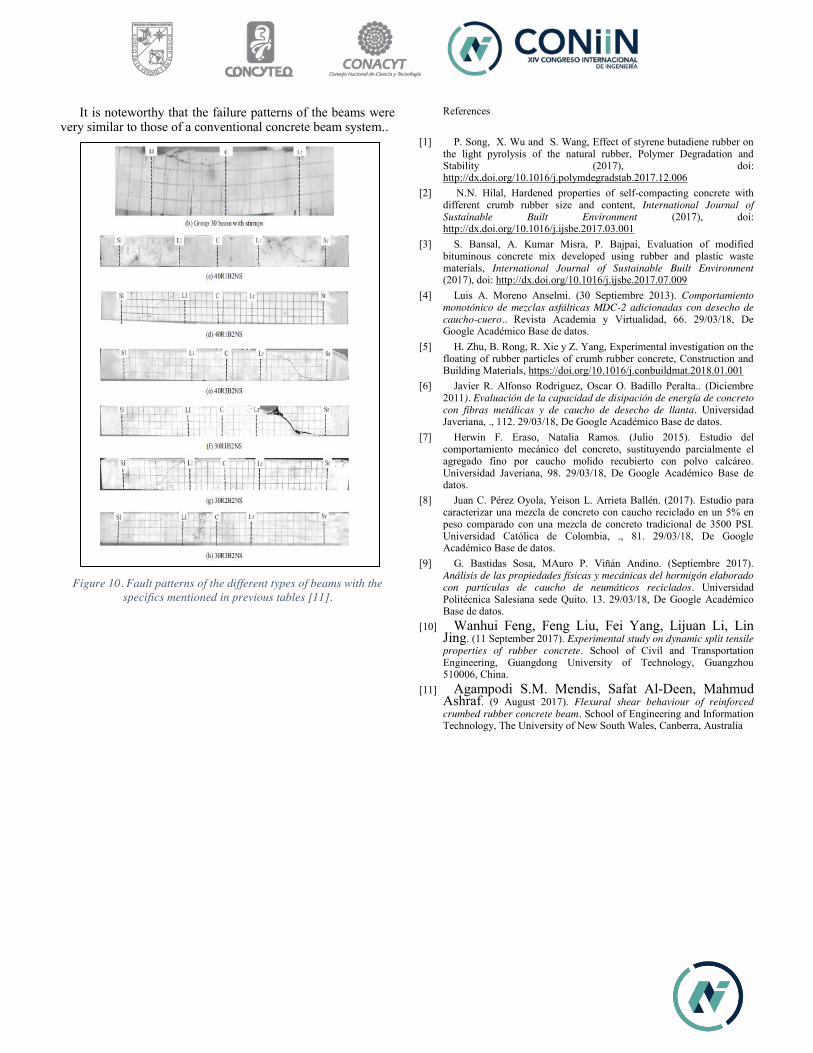
It is noteworthy that the failure patterns of the beams were very similar to those of a conventional concrete beam system..
Figure 10. Fault patterns of the different types of beams with the
specifics mentioned in previous tables [11].
References
[1] P. Song, X. Wu and S. Wang, Effect of styrene butadiene rubber on the light pyrolysis of the natural rubber, Polymer Degradation and Stability (2017), doi: http://dx.doi.org/10.1016/j.polymdegradstab.2017.12.006
[2] N.N. Hilal, Hardened properties of self-compacting concrete with different crumb rubber size and content, International Journal of Sustainable Built Environment (2017), doi: http://dx.doi.org/10.1016/j.ijsbe.2017.03.001
[3] S. Bansal, A. Kumar Misra, P. Bajpai, Evaluation of modified bituminous concrete mix developed using rubber and plastic waste materials, International Journal of Sustainable Built Environment (2017), doi: http://dx.doi.org/10.1016/j.ijsbe.2017.07.009
[4] Luis A. Moreno Anselmi. (30 Septiembre 2013). Comportamiento monotónico de mezclas asfálticas MDC-2 adicionadas con desecho de caucho-cuero.. Revista Academia y Virtualidad, 66. 29/03/18, De Google Académico Base de datos.
[5] H. Zhu, B. Rong, R. Xie y Z. Yang, Experimental investigation on the floating of rubber particles of crumb rubber concrete, Construction and Building Materials, https://doi.org/10.1016/j.conbuildmat.2018.01.001
[6] Javier R. Alfonso Rodriguez, Oscar O. Badillo Peralta.. (Diciembre 2011). Evaluación de la capacidad de disipación de energía de concreto con fibras metálicas y de caucho de desecho de llanta. Universidad Javeriana, ., 112. 29/03/18, De Google Académico Base de datos.
[7] Herwin F. Eraso, Natalia Ramos. (Julio 2015). Estudio del comportamiento mecánico del concreto, sustituyendo parcialmente el agregado fino por caucho molido recubierto con polvo calcáreo. Universidad Javeriana, 98. 29/03/18, De Google Académico Base de datos.
[8] Juan C. Pérez Oyola, Yeison L. Arrieta Ballén. (2017). Estudio para caracterizar una mezcla de concreto con caucho reciclado en un 5% en peso comparado con una mezcla de concreto tradicional de 3500 PSI. Universidad Católica de Colombia, ., 81. 29/03/18, De Google Académico Base de datos.
[9] G. Bastidas Sosa, MAuro P. Viñán Andino. (Septiembre 2017). Análisis de las propiedades físicas y mecánicas del hormigón elaborado con partículas de caucho de neumáticos reciclados. Universidad Politécnica Salesiana sede Quito. 13. 29/03/18, De Google Académico Base de datos.
[10] Wanhui Feng, Feng Liu, Fei Yang, Lijuan Li, Lin Jing. (11 September 2017). Experimental study on dynamic split tensile properties of rubber concrete. School of Civil and Transportation Engineering, Guangdong University of Technology, Guangzhou 510006, China.
[11] Agampodi S.M. Mendis, Safat Al-Deen, Mahmud Ashraf. (9 August 2017). Flexural shear behaviour of reinforced crumbed rubber concrete beam. School of Engineering and Information Technology, The University of New South Wales, Canberra, Australia

Quantum mechanics: simulation and calculations CdSe and PbSe
Ing. Dulce Victoria Estrada Osorio División de Investigación y Posgrado de la Facultad de
Ingeniería Universidad Autónoma de Querétaro
Santiago de Querétaro, Querétaro [email protected]
Ing. América Eileen Mendoza Rojas División de Investigación y Posgrado de la Facultad de
Ingeniería Universidad Autónoma de Querétaro
Santiago de Querétaro, Querétaro [email protected]
Dr. José Alonso López Miranda División de Investigación y Posgrado de la Facultad de Ingeniería
Universidad Autónoma de Querétaro Santiago de Querétaro, Querétaro
Abstract—In this paper, a complete ab initio calculations of
energy bands, density of states and electronic density are presented. Two compounds (semiconductors) have been analyzed, PbSe and CdSe, using computational software Quantum Espresso® as simulation program and Linux as SO. The results have been compared with experimental data with good agreement, and an error less than 1% was obtained for two compounds.
Keywords—cadmium selenide, lead selenide, semiconductor, ab initio, electronic structure.
I. INTRODUCTION Cadmium selenide and lead selenide are used in many
applications, such as: thermoelectric, cooling materials, optical filters, optical recording materials, solar cells, biosensors, etc. [1], [2] due their properties.
Quantum Espresso® is a software based on set of density functional theory (DFT) codes, which is employed when an analysis of compounds is needed, i.e., Cadmium selenide (CdSe) and lead selenide (PbSe), these are two semiconductors with body centered cubic (BCC) structure, space group [225] and applications in electronics. Table 1 presents the basic information necessary for the analysis of these compounds.
TABLE I. BASIC INFORMATION OF CDSE AND PBSE
Compound Space group Lattice parameter [Å/Bohr]
CdSe 225 5.748/10.862
PbSe 225 6.227/11.767
Previous works have studied the mechanical properties and the electronic structure of these compounds using scalar-relativistic full-potential linearized augmented plane wave (FP-LAPW) method. The first comparative of both compounds was developed using PBE (Perdew-Burke-Erzenhof) pseudopotencial.
Computational Simulations with good accuracy, are important because they give information with a considerable low time compared with experimental processes
II. PROGRAMS AND INFORMATION In this paper the information and the pseudopotencials used
were obtained from two major databases “Materials Project” and “Quantum Espresso” web site [3], [4]. The computers used were personal, a Lenovo ideapad 500-15ACZ with Mint Linux, AMD FX-8800P Radeon R7 processor, 12 Compute Cores 4C+8G 2.10 GHz, 16 GB in RAM, and a Gateway with Ubuntu Linux, Intel Core i5 processor and 4 Gb in RAM memory.
As basis program, the Open Source Suite Quantum Espresso was used, this suite is integrated for electronic-structure calculations developed in computers and materials modeling at nanoscale.
III. RESULTS Simulations for CdSe and PbSe have been realized, and the main obtained results are shown in this section.
Structure of CdSe is shown in Figure 1, and convergence values of Total Energy for the two compounds were obtained with equation (1) for two compounds (CdSe and PbSe), here value(i) refers to current value and value(i-1) to previous value. A convergence criterion of 1e-3 has been set for Total Energy
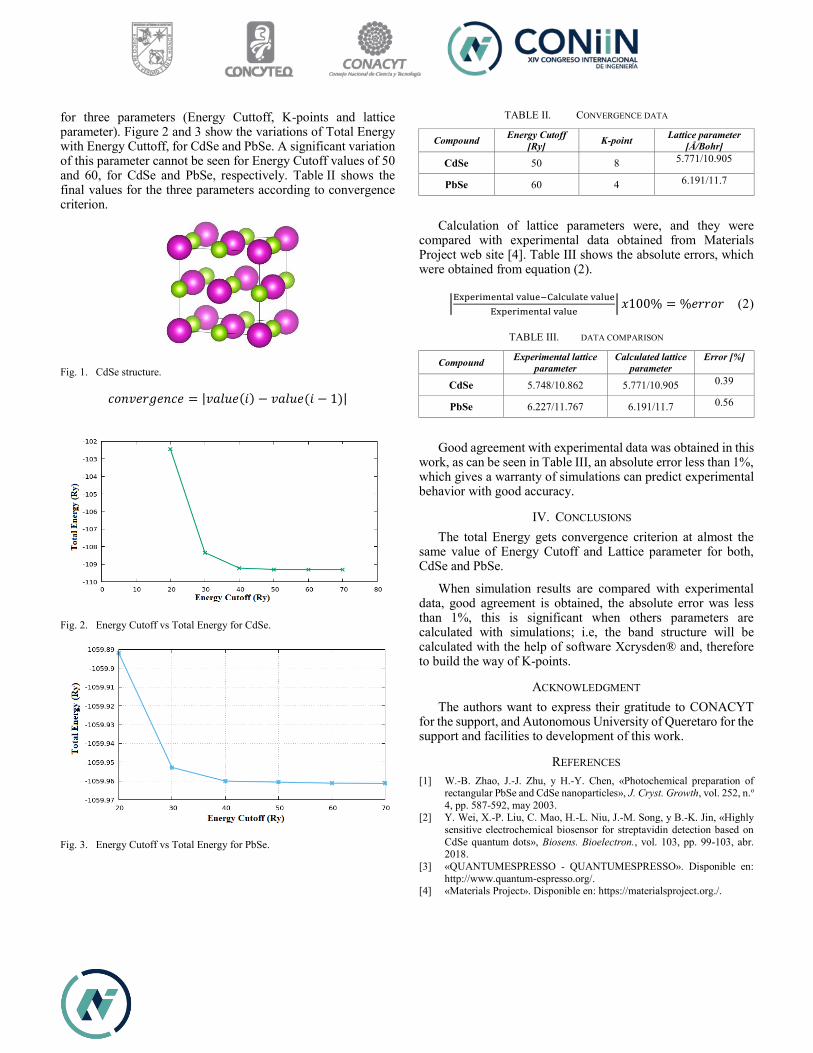
for three parameters (Energy Cuttoff, K-points and lattice parameter). Figure 2 and 3 show the variations of Total Energy with Energy Cuttoff, for CdSe and PbSe. A significant variation of this parameter cannot be seen for Energy Cutoff values of 50 and 60, for CdSe and PbSe, respectively. Table II shows the final values for the three parameters according to convergence criterion.
Fig. 1. CdSe structure.
𝑐𝑜𝑛𝑣𝑒𝑟𝑔𝑒𝑛𝑐𝑒 = |𝑣𝑎𝑙𝑢𝑒(𝑖) − 𝑣𝑎𝑙𝑢𝑒(𝑖 − 1)|
Fig. 2. Energy Cutoff vs Total Energy for CdSe.
Fig. 3. Energy Cutoff vs Total Energy for PbSe.
TABLE II. CONVERGENCE DATA
Compound Energy Cutoff [Ry] K-point Lattice parameter
[Å/Bohr]
CdSe 50 8 5.771/10.905
PbSe 60 4 6.191/11.7
Calculation of lattice parameters were, and they were compared with experimental data obtained from Materials Project web site [4]. Table III shows the absolute errors, which were obtained from equation (2).
� |Experimental value−Calculate valueExperimental value
| 𝑥100% = %𝑒𝑟𝑟𝑜𝑟� ����
TABLE III. DATA COMPARISON
Compound Experimental lattice parameter
Calculated lattice parameter
Error [%]
CdSe 5.748/10.862 5.771/10.905 0.39
PbSe 6.227/11.767 6.191/11.7 0.56
Good agreement with experimental data was obtained in this work, as can be seen in Table III, an absolute error less than 1%, which gives a warranty of simulations can predict experimental behavior with good accuracy.
IV. CONCLUSIONS The total Energy gets convergence criterion at almost the
same value of Energy Cutoff and Lattice parameter for both, CdSe and PbSe.
When simulation results are compared with experimental data, good agreement is obtained, the absolute error was less than 1%, this is significant when others parameters are calculated with simulations; i.e, the band structure will be calculated with the help of software Xcrysden® and, therefore to build the way of K-points.
ACKNOWLEDGMENT The authors want to express their gratitude to CONACYT
for the support, and Autonomous University of Queretaro for the support and facilities to development of this work.
REFERENCES [1] W.-B. Zhao, J.-J. Zhu, y H.-Y. Chen, «Photochemical preparation of
rectangular PbSe and CdSe nanoparticles», J. Cryst. Growth, vol. 252, n.o 4, pp. 587-592, may 2003.
[2] Y. Wei, X.-P. Liu, C. Mao, H.-L. Niu, J.-M. Song, y B.-K. Jin, «Highly sensitive electrochemical biosensor for streptavidin detection based on CdSe quantum dots», Biosens. Bioelectron., vol. 103, pp. 99-103, abr. 2018.
[3] «QUANTUMESPRESSO - QUANTUMESPRESSO». Disponible en: http://www.quantum-espresso.org/.
[4] «Materials Project». Disponible en: https://materialsproject.org./.
An study of classification movements of the lower limb based on up to 4-EMG channels
Toledo-Pérez D. C.1, Martínez-Prado M. A.2, Rodríguez-Reséndiz J.3
1División de Posgrado, Facultad de Ingeniería. Universidad Autónoma de Querétaro, Centro Universitario, Cerro de las Campanas s/n. C.P. 76010, Santiago de Querétaro, Qro. México
[email protected] [email protected] [email protected]
Abstract—The quantity and origin of the EMG signals have
been studied extensively due to the necessity to improve the precision of the classification from de intention movement. Nevertheless, by increasing the number of channels used for the classification, the processing time also increase. This work presents a comparison of precision of the classification based on the different amounts of EMG signal channels (one to four) placed in a right lower limb from four healthy subjects (one male and three females). The analysis was made using Mean Absolute Values, Zero Crossings, Waveform Length and Slope Sign Changes. The algorithm used for the classification is the Support Vector Machine after to applied a Principal Component Analysis to the features. The results show that it is possible to high more than 90% of classification accuracy using four or three channels while using only barely more than 50%.
Keywords—intention movement classification; EMG signals; Support Vector Machine.
I. INTRODUCTION In recent decades, the use of signals taken from de muscles
has become popular for its demand for different uses, such as health monitoring, assistive technology, and prosthetic control. This is due to the increase of technological development in wearable electronics for the exploration of muscle signals.
When a contraction or relaxation muscle occurs, it generates an electrical potential that is measured by an electromyography sensor. Exists two different ways to place this kind of sensor, the invasive and the non-invasive methods. The second one is the surface electromyography (sEMG) and is the most common technique due to not needs surgical intervention through the sensor is placed on the skin surface.
In this paper, sEMG signals were recorded over four opposite muscles on the lower limb are used to compare the classification accuracy offered by each of them and the combination of different amounts. The muscles selected to place the sensors were tibials anterior (TA), gastrocnemius medials (GM), bíceps femoris (BF) and vastus lateralis (VL), which presents the better signal of the movement [1].
The analysis signal methods involve time-domain and frequency-domain features, time-frequency analysis methods,
power spectrum density and higher order spectra [2]. To analyze the sEMG signals, this work only considers time-domain features, due to they are easy to calculate and not required any transformation. Mean Absolute Value (MAV), Zero Crossings (ZC), Waveform Length (WL) and Slope Sign Changes (SSC) are recommended for a better classifier performance [3]–[8].
Because of the dimensionality problem, the desired performance of the classifier is deteriorated with the increase in the number of channels [9]. There are some tools that can be used to analyzed signals in order to improve the classification accuracy without increase the quantity of analyzed signals like the Empirical Mode Decomposition used only in a single-channel [10].
In contrast, other researchers have looked for other ways to attack the dimensionality problem, by the reduction, like Principal Component Analysis (PCA), Independent Component Analysis (ICA), Linear Discriminant Analysis (LDA), Canonical Correlation Analysis (CCA), among others.
The PCA principal goals are to find an optimal linear transformation that represents the data and reduce the dimensionality of the features vector [11]–[13]. But in this research only it was used to improve the classification accuracy by the linear transformation.
For the classification, the Support Vector Machines (SVMs) were used, due to they have a high potential to classify in myoelectric control systems since they are capable to recognize patterns that are more complex [14].
The remaining paper is organized as follows. Section II gives a brief background of the conventional techniques used for sEMG signals analysis and the most common used features. General description of the Support Vector Machine algorithm and Principal Component Analysis are also explained here. In section III, the experimental design and the analysis of sEMG signals are described. Comparison results from the SVM classifier varying the amount of channels and their origin are presented in section IV. Section V concludes the work.
II. BACKGROUND
A. Analysis of sEMG signals Myoelectric control success depends highly on the
classification accuracy. Classification methods and feature extraction are important to reach high performance in the classification of pattern recognition [14].
Depending on the level of muscle contraction, they vary the amplitude, variance, energy, and frequency of sEMG signals, due to this a variety of features is extracted from them to their analysis. Then, the most recommended [3]–[5], [7], [8], [14]–[16], Mean Absolute Value (MAV), Zero Crossings (ZC), Slope Sign Changes (SSC) and Waveform Length (WL) are described.
Considering xi as i-th sample of an arrangement of input, xi+1 the next sample and xi-1 the previous sample. With a total of N samples:
1) MAV: It consists in obtain the average of the sum of the absolute values that make up the whole input signal, as in 1 ).
¦
N
iix
NMAV
1
1� ������
2) ZC: It consists in count the number of times that the signal crosses by a cero, whether it goes from a negative value to a positive one or the other way around, as in 2 ).
� �xfZC ZC¦ � ������
Donde:
°
°®
!��!
�
�
caseother 00x&0xor
0x&0xif,1)(
1ii
1ii
xfZC
3) WL: It is the accumulated variation of a signal that can indicate the grade of signal oscillation and is given by 3 ).
� �¦�
� �
1
11
N
iii xxWL � ������
4) SSC: It counts the number of times that the slope of the signal change of sign, which make necessary to evaluate where it is, where it was and where the signal goes. SSC is calculated with 4 ).
� �xfSSC SSC¦ � ������
Donde:
°
°®
!!��
��
��
caseother 0xx&xxor
xx&xxif,1)(
1ii1ii
1ii1ii
xfSSC
B. Principal Component Analysis PCA is a statistic technic that performs a linear
transformation from an original set of values into a smaller one of correlated variables; which represents the most information from the original set. This reduces the dimensionality of it. The idea was conceived by K. Pearson [17] and later developed by Hotelling [18].
PCA technique uses the covariance matrix from the original set (X) and the correlation between every one of this components, in such a way that a smaller Y output space is found, representing the statistical information given in X, of form 5 )
XCY � ������
Where Cmxn is the matrix with the principal component selected, where n < m, which implies the dimensionality reduction from the original set.
The procedure to find C consist in to construct the covariance matrix, then find eigenvalues and eigenvectors to project the data matrix with the eigenvectors corresponding in order. Finally, it is only necessary to consider the desired information and select the number of vectors that compose it.
C. Support Vector Machines SVMs are very used as classification algorithm, either of
body movements, images, sounds, etc. An SVM builds an optimum separation hyperplane in a feature space which is said to be of high dimension when the inputs are mapped using non-linear functions, for to be able to distinguish between two or more object types. In 1995 this theory was introduced by [19].
In an SVM, the training algorithm is reformulated as a problem to solve using Quadratic Programming (QP), which is global and unique. For input training data � � � � ^ `1,,,, 11 ru� N
mm Ryxyx . , where ix corresponds to the
input value and iy the assigned value of the object type to which it belongs (also it knows as a class); if these data are not linearly separable, they are a map (linearly transforms) by
FRN D:I within a characteristic space. In this way, the obtained linear hyperplanes that separate the object types can be seen as 6 ).
� � RbRwbxw N �� �u ,0I � ������
Constructing an optimal hyperplane with the maximum value of the separation margin and a closed error ξ in the training of the algorithm, the QP problem is proposed as 7 ):
¦
�m
iibw Cw
1
2, 2
1min [ � ������
s. a.
� �� � .,,1,1 mibxwy iii . �t�u [I
The first term in cost function generates a maximum separation margin between classes, while the second provides an upper bound for mistakes in training data. Finally, the constant
> �f� ,0C creates a compensation between the number of poorly classified samples from training set and the separation of the rest of samples with a maximum margin [14].
III. METHODS AND EXPERIMENTATION
A. Data Collection The data in this research were acquired from four healthy
subjects, three females and one male. All subjects, which were aged between 23 and 27 years old, were normally limbed and without muscle disorders.
The sensors system were placed on the skin on the surface of the muscle, and it contains nine electrodes, eight of them functioned as an acquisition the potential difference from muscles, and the last one functioned as a reference. Signals were amplified and filtered by an analog 60 Hz Notch filter to remove line interference. It was used INA114 as an amplification instrument and sampled by using a 10-bit converter (The Arduino Nano) at 1000 Hz (Fig. 1).
Fig. 1. Basic experiment diagram.
Every sensor was placed following the distances and separated 2.5 cm between the electrodes described in [1] in order to obtain the better signal quality: for VL the best place is at 66% from muscle length while for the TA is at 47.5%. The electrode
position in GM at 38% of its length and in BF at 50% presents the better signal.
B. Data processing For the data processing, it was used MATLAB® and the
LIBSVM library version 3.2 was used in this work [20]. This library provides a section dedicated to apply a variety of kernels, as linear, polynomial, RBF (Radial Basis Function) and sigmoid, but none was used.
In software, they were applied two different digital filters filtered the collected sEMG signals, first 60 Hz Notch filter and second an elliptical bandpass filter between 10 and 500 Hz.
The feature vector was built with MAV, ZC, WL, and SSC of windows of different sizes and each one of the channels, so as to make different comparatives of the results. Then a PCA analysis was made without removing vectors from the transformation matrix.
C. Experimentation Six classes of foot movement plus rest were considered for
the research: lift the toe (LP), lift the heel (LT), move the toe to the right (PD), move the toe to the left (PI), recharge on the heel (AT), recharge on the toe (AP) and rest of the foot (RR). In the experiment, the subjects were sitting and started from a relaxation state and the followed by holding the movement for a period of 5 s. The movements were repeated 20 times with 25 s of resting period between the trials by each subject.
Finally, the collected data were divided into two groups, the training, and the testing data. Ten samples for each one.
IV. RESULTS The results of the classification accuracy made with the four
channels shown in Table 1. The variation is not more than 15% of each number of samples per subject, and the minimum is only 5.71%.
TABLE 1ACCURACY WITH CHANNELS TA, GM, BF Y VL.
Channel Channel TA, GM, BF y VL Highest difference No. 250 500 1000
Female 1 84.29% 90.00% 90.00% 5.71% Female 2 80.00% 87.14% 90.00% 10.00% Female 3 65.71% 80.00% 80.00% 14.29% Male 1 91.43% 97.14% 98.57% 7.14%
Average 80.36% 88.57% 89.64% 9.29%
Table 2,
Channel Channel TA, GM y VL Highest difference No. 250 500 1000
Female 1 80.00% 90.00% 90.00% 10.00% Female 2 77.14% 85.71% 88.57% 11.43% Female 3 67.14% 67.14% 75.71% 8.57% Male 1 94.29% 100.00% 97.14% 5.71%
Average 79.64% 85.71% 87.86% 8.21%
ADC converter
Post-processing
stage
Lower limb with sensors
placed
Amplification and filteringINA114
Transmission to the PC

Table 4 and Table 5 show the accuracy classification obtained by combining the variation of three different channels, besides the change in the number of samples used for feature extraction. In this case, any sample is not superior to 10%, but in
Channel Channel TA, GM y VL Highest difference No. 250 500 1000
Female 1 80.00% 90.00% 90.00% 10.00% Female 2 77.14% 85.71% 88.57% 11.43% Female 3 67.14% 67.14% 75.71% 8.57% Male 1 94.29% 100.00% 97.14% 5.71%
Average 79.64% 85.71% 87.86% 8.21%
Table 4, the only without TA channel, the results are the best, with the highest difference equal to 5.71% and the lowest to 1.43%, which corresponds to a one sample.
TABLE 2. ACCURACY WITH CHANNELS TA, GM Y BF.
Channel Channel TA, GM y BF Highest difference No. 250 500 1000
Female 1 80.00% 88.57% 88.57% 8.57% Female 2 78.57% 80.00% 84.29% 5.71% Female 3 70.00% 80.00% 80.00% 10.00% Male 1 91.43% 92.86% 98.57% 7.14%
Average 80.00% 85.36% 87.86% 7.86%
TABLE 3. ACCURACY WITH CHANNELS TA, GM Y VL.
Channel Channel TA, GM y VL Highest difference No. 250 500 1000
Female 1 80.00% 90.00% 90.00% 10.00% Female 2 77.14% 85.71% 88.57% 11.43% Female 3 67.14% 67.14% 75.71% 8.57% Male 1 94.29% 100.00% 97.14% 5.71%
Average 79.64% 85.71% 87.86% 8.21%
TABLE 4. ACCURACY WITH CHANNELS GM, BF Y VL.
Channel Channel GM, BF y VL Highest difference No. 250 500 1000
Female 1 90.00% 92.86% 90.00% 2.86% Female 2 90.00% 88.57% 90.00% 1.43% Female 3 78.57% 72.86% 78.57% 5.71% Male 1 94.29% 90.00% 94.29% 4.29%
Average 88.21% 86.07% 88.21% 2.14%
The previous results are not yet completely determinant about the influence of each of the channels on the classification
accuracy. Due to this, experiments were also carried out with the combinations of two channels (Table 5 -Table 10).
TABLE 5. ACCURACY WITH CHANNELS TA Y GM.
Channel Channel TA y GM Highest difference No. 250 500 1000
Female 1 81.43% 82.86% 88.57% 7.14% Female 2 61.43% 80.00% 87.14% 25.71% Female 3 61.43% 68.57% 78.57% 17.14% Male 1 88.57% 94.29% 92.86% 5.71%
Average 73.21% 81.43% 86.79% 13.57%
TABLE 6. ACCURACY WITH TA Y BF.
Channel Channel TA y BF Highest difference No. 250 500 1000
Female 1 75.71% 81.43% 80.00% 5.71% Female 2 65.71% 85.71% 78.57% 20.00% Female 3 68.57% 77.14% 75.71% 8.57% Male 1 85.71% 92.86% 95.71% 10.00%
Average 73.93% 84.29% 82.50% 10.36%
TABLE 7. ACCURACY WITH CHANNELS TA Y VL
Channel Channel TA y VL Highest difference No. 250 500 1000
Female 1 75.71% 78.57% 77.14% 2.86% Female 2 64.29% 77.14% 84.29% 20.00% Female 3 50.00% 57.14% 61.43% 11.43% Male 1 88.57% 88.57% 90.00% 1.43%
Average 69.64% 75.36% 78.21% 8.57%
TABLE 8. ACCURACY WITH CHANNELS GM Y BF.
Channel Channel GM y BF Highest difference No. 250 500 1000
Female 1 82.86% 84.29% 81.43% 2.86% Female 2 72.86% 78.57% 85.71% 12.86% Female 3 57.14% 71.43% 78.57% 21.43% Male 1 81.43% 85.71% 85.71% 4.29%
Average 73.57% 80.00% 82.86% 9.29%
TABLE 9. ACCURACY WITH CHANNELS GM Y VL.
Channel Channel GM y VL Highest difference No. 250 500 1000
Female 1 84.29% 90.00% 91.43% 7.14% Female 2 77.14% 80.00% 82.86% 5.71% Female 3 68.57% 62.86% 77.14% 14.29% Male 1 84.29% 85.71% 88.57% 4.29%
Average 78.57% 79.64% 85.00% 6.43%
TABLE 10. ACCURACY WITH CHANNELS BF Y VL.
Channel Channel BF y VL Highest difference No. 250 500 1000
Female 1 77.14% 88.57% 90.00% 12.86% Female 2 84.29% 85.71% 90.00% 5.71% Female 3 71.43% 68.57% 75.71% 7.14% Male 1 87.14% 90.00% 92.86% 5.71%
Average 80.00% 83.21% 87.14% 7.14%
The best results were obtained when the sensors combination were placed in muscles with opposite function, i. e. by considering one muscle in front and one in the back. Also, the best results were obtained without channel TA. When 1000 sample are used, the results do not vary much between every pair of signals.
Finally, the results obtained with a single channel are shown in Table 11 to Table 14. The TA and BF channels show the most consistent results having the smallest variation, as well in TA the most of the differences are the minimal and in GM the maxims. Although, in TA the classification accuracy is lowest than in the other three.
TABLE 11. ACCURACY WITH CHANNEL TA.
Channel Channel TA Highest difference No. 250 500 1000
Female 1 68.57% 67.14% 68.57% 1.43% Female 2 58.57% 52.86% 58.57% 5.71% Female 3 57.14% 44.29% 57.14% 12.86% Male 1 82.86% 78.57% 82.86% 4.29%
Average 66.79% 60.71% 66.79% 6.07%
TABLE 12. ACCURACY WITH CHANNEL GM.
Channel Channel GM Highest difference No. 250 500 1000
Female 1 72.86% 81.43% 84.29% 11.43% Female 2 45.71% 58.57% 65.71% 20.00% Female 3 52.86% 61.43% 64.29% 11.43% Male 1 70.00% 80.00% 84.29% 14.29%
Average 60.36% 70.36% 74.64% 14.29%
TABLE 13. ACCURACY WITH CHANNEL BF.
Channel Channel BF Highest difference No. 250 500 1000
Female 1 57.14% 70.00% 62.86% 12.86% Female 2 60.00% 65.71% 70.00% 10.00% Female 3 60.00% 64.29% 64.29% 4.29% Male 1 80.00% 82.86% 88.57% 8.57%
Average 64.29% 70.71% 71.43% 7.14%
TABLE 14. ACCURACY WITH CHANNEL VL.
Channel Channel VL Highest difference No. 250 500 1000
Female 1 70.00% 65.71% 68.57% 4.29% Female 2 68.57% 75.71% 77.14% 8.57% Female 3 50.00% 51.43% 65.71% 15.71% Male 1 75.71% 81.43% 88.57% 12.86%
Average 66.07% 68.57% 75.00% 8.93%
Finally, in order to make a final comparison, the averages obtained from comparatives tables are shown. In Fig. 2 the calculated results with a single channel, VL exhibits the best rank of 88.57%.
Fig. 2. Classification accuracy with a single channel.
Fig. 3 shows the comparative between two channels, BF and VL present a better performance with respect to the others including the result with 250 samples. Besides, the performance with 1000 samples is more consistent than the others. Fig. 4 shows that the combination with GM, BF y VL is better than the others that include channel TA. This combination offers similar results to those obtained by the combination of the four channels.
Fig. 3. Classification accuracy with two channels.
50%
55%
60%
65%
70%
75%
80%
T A G M B F V LSAMPLES
250 500 1000
60%
65%
70%
75%
80%
85%
90%
T A & G M
T A & B F
T A & V L
G M & B F
G M & V L
B F & B L
250 500 1000
Fig. 4. Classification accuracy with three channels.
V. CONCLUSIONS The obtained results with four channels were better that
those with a single channel but the difference between two and three channels is not very high. The muscle with the worst performance was the TA. Also, the best results are obtained by taking the signal of the muscles above the knee. Increase the number of channels also provides some times 100% of the classification accuracy, but computational cost also augment. If the purpose is always, get 100% of classification accuracy without increasing both the processing time, the best way is to use another kind of tools.
ACKNOWLEDGMENT To Faculty of Engineering, graduate division of Universidad
Autónoma de Querétaro by allow me to make PhD studies and CONACYT for make it possible.
REFERENCES [1] I. C. N. Sacco, A. A. Gomes, M. E. Otuzi, D. Pripas, and A. N. Onodera,
“A method for better positioning bipolar electrodes for lower limb EMG recordings during dynamic contractions,” J. Neurosci. Methods, vol. 180, no. 1, pp. 133–137, May 2009.
[2] A. Phinyomark, P. Phukpattaranont, and C. Limsakul, “Feature reduction and selection for EMG signal classification,” Expert Syst. Appl., vol. 39, no. 8, pp. 7420–7431, Jun. 2012.
[3] B. Hudgins, P. Parker, and R. N. Scott, “A new strategy for multifunction myoelectric control,” IEEE Trans. Biomed. Eng., vol. 40, no. 1, pp. 82–94, Jan. 1993.
[4] K. Englehart and B. Hudgins, “A robust, real-time control scheme for multifunction myoelectric control,” IEEE Trans. Biomed. Eng., vol. 50, no. 7, pp. 848–854, Jul. 2003.
[5] Y. Huang, K. B. Englehart, B. Hudgins, and A. D. C. Chan, “A Gaussian mixture model based classification scheme for myoelectric control of powered upper limb prostheses,” IEEE Trans. Biomed. Eng., vol. 52, no. 11, pp. 1801–1811, Nov. 2005.
[6] M. A. Oskoei and H. Hu, “GA-based Feature Subset Selection for Myoelectric Classification,” in 2006 IEEE International Conference on Robotics and Biomimetics, 2006, pp. 1465–1470.
[7] Q. She, Z. Luo, M. Meng, and P. Xu, “Multiple kernel learning SVM-based EMG pattern classification for lower limb control,” in 2010 11th International Conference on Control Automation Robotics Vision (ICARCV), 2010, pp. 2109–2113.
[8] J. D. Miller, M. S. Beazer, and M. E. Hahn, “Myoelectric Walking Mode Classification for Transtibial Amputees,” IEEE Trans. Biomed. Eng., vol. 60, no. 10, pp. 2745–2750, Oct. 2013.
[9] A. Al-Ani, I. Koprinska, G. R. Naik, and R. N. Khushaba, “A dynamic channel selection algorithm for the classification of EEG and EMG data,” in 2016 International Joint Conference on Neural Networks (IJCNN), 2016, pp. 4076–4081.
[10] A. H. Al-Timemy, G. Bugmann, N. Outram, and J. Escudero, “Single channel-based myoelectric control of hand movements with Empirical Mode Decomposition,” in 2011 Annual International Conference of the IEEE Engineering in Medicine and Biology Society, 2011, pp. 6059–6062.
[11] G. H. Dunteman, Principal Components Analysis. SAGE, 1989. [12] I. T. Jolliffe, Principal Component Analysis, 2nd ed. New York:
Springer-Verlag, 2002. [13] M. Yang, H. Zheng, H. Wang, and S. McClean, “Feature selection and
construction for the discrimination of neurodegenerative diseases based on gait analysis,” in 2009 3rd International Conference on Pervasive Computing Technologies for Healthcare, 2009, pp. 1–7.
[14] M. A. Oskoei and H. Hu, “Support vector machine-based classification scheme for myoelectric control applied to upper limb,” IEEE Trans. Biomed. Eng., vol. 55, no. 8, pp. 1956–1965, Aug. 2008.
[15] E. Ceseracciu et al., “SVM classification of locomotion modes using surface electromyography for applications in rehabilitation robotics,” in 2010 IEEE RO-MAN, 2010, pp. 165–170.
[16] F. AlOmari and G. Liu, “Novel hybrid soft computing pattern recognition system SVM–GAPSO for classification of eight different hand motions,” Opt. - Int. J. Light Electron Opt., vol. 126, no. 23, pp. 4757–4762, Dec. 2015.
[17] K. Pearson F.R.S, “LIII. On lines and planes of closest fit to systems of points in space,” Philos. Mag. Ser. 6, vol. 2, no. 11, pp. 559–572, Nov. 1901.
[18] H. Hotelling, “Analysis of a complex of statistical variables into principal components,” J. Educ. Psychol., vol. 24, no. 6, pp. 417–441, Sep. 1933.
[19] V. Vapnik and C. Corinna, “Support-Vector Networks,” Mach. Learn., vol. 20, no. 3, pp. 273–297, Sep. 1995.
[20] C.-C. Chang and C.-J. Lin, “LIBSVM: A Library for Support Vector Machines,” ACM Trans Intell Syst Technol, vol. 2, no. 3, pp. 27:1–27:27, May 2011.
60%
65%
70%
75%
80%
85%
90%
T A , G M & B F T A , G M & V L G M , B F & V L
250 500 1000
Applications of recycled polyethylene terephthalate (PET) and its use in construction
Clemente Chávez Alejandro. Facultad de Ingeniería Universidad Autónoma de Querétaro, UAQ. Querétaro, México [email protected]
Guerra Castillo Ariadna | Torres Barajas Liliana María Isabel Facultad de Ingeniería Universidad Autónoma de Querétaro, UAQ. Querétaro, México [email protected] | [email protected]
Abstract—In this research, the use of recycled PET containers is proposed for the manufacture of ribbed slab moulds. The aim is to characterize compounds based on recycled polyethylene and resin, to evaluate their physical properties such as hardness, tensile strength and modulus of elasticity in traction. The expected results are a resistant material, with a low level of absorption, that can easily be produced in mass.
Keywords—polyethylene; recycled material; ribbed slab mould.
I. INTRODUCTION The materials that are currently used in ribbed slab moulds
can cause environmental problems since there is a mishandling of these wastes. Having as an alternative a ribbed slab mould made of recycled materials, in this case polyethylene, would represent a lower cost since it has a longer useful life than the one existing in the market.
On the other hand, it is intended to innovate in the construction field because in this area there is a very low applied innovation and it is still an expensive product that is available to very few people.
The present review is a compilation of the state of the art on the use of recycled polyethylene in construction materials, where different properties and scopes that can be achieved with this material are shown.
A. The Sustainable Innovation Forum [1] During the United Nations Conference on Climate Change, held on December 12, 2015, 195 nations reached an historic agreement to combat climate change and promote measures and investments for a future that is low in carbon emissions, resilient and sustainable. The Paris Agreement and the results
of the conference cover crucial areas considered essential for an emblematic conclusion:
Mitigation: reduce emissions fast enough to achieve the temperature objective. A system of transparency and global balance: an accounting for climate action. Adaptation: strengthen the ability of countries to cope with climate impacts. Loss and damage: strengthen the ability to recover from climate impacts. Support: including financial support for nations to build clean and resilient futures. [2]
Mexico must take actions that reflect its commitment to the Paris Agreement, so it must question the materials it uses today and look for the best alternatives that allow sustainable development. According to the National Inventory of Greenhouse Gases (GHG), issued by the INECC (2015) with data from 2013, Mexico issues: 665,304.92 Gg of CO2e, which represents 1.4% of global GHG emissions. The Mexico climate action plan seeks an unconditional reduction of 25% of GHG emissions and short-lived climate pollutants (CCVC), that is, 22% of GHG and 56% of black carbon.[3].
B. The world's rubbish dump: a tip that stretches from Hawaii to Japan
Among the consequences of the contaminants that can be found in the trash or garbage, is also known. It is an extension of the cable with a capacity of up to 500 nautical miles. (Figure 1)

Figure 1. Graph of the zones of concurrence in the pacific ocean. (Papanlian and Bradley) The oceanographer Charles Moores, moved this area of convergence that did not reduce the use of disposable plastics is doubled in size in the next decade, it requires more research on this and take action to counteract it because the sea of garbage is translucent and It is located just below the surface of the water, it is not detectable in satellite photographs. According to the United Nations Environment Program, plastic waste causes the deaths of over one million seabirds each year, as well as more than 100,000 marine mammals. Syringes, lighters and toothbrushes have been found inside the stomachs of dead seabirds, which they mistake for food. It is believed that plastic is 90% of all garbage that floats in the oceans. The United Nations Environment Program estimated in 2006 that every square mile of ocean contains 46,000 pieces of floating plastic [4]
C. Waste in Mexico
The current lifestyle of high consumption has lead to the manufacture of non-biodegradable products that meet the demands of the market, but have a short lifespan which leads to the accumulation of large volumes of waste. In the particular case of Mexico, there is no adequate management of these wastes; Around 40 million tons of waste are generated each year. Specifically in the city of Querétaro (in 2015), a monthly production of 28 thousand tons of garbage is reported. The goal of waste management is to manage the resources in such a way that they are compatible with the environment and public health through an integral management of solid waste, the recovered materials are reincorporated into the economic and productive cycle in an efficient manner. "In the country, during the last years the technology to recycle solid waste has evolved, not so the practices to create incentives to recover them in an economically viable way. In 2008, only 3.6% of the recoverable waste was recycled, with paper and cardboard being the main ones. Plastics, in general,
represent 11% of urban solid waste in Mexico. The plastics industry in the country grows at a rate of more than 7% per year, generating a per capita consumption of 50 kg / year. In the specific case of PET, it is one of the most used materials by the beverage bottling industry, due to its durability, chemical resistance, low weight and adequate energy dissipation capacity in the face of the application of external forces, among others. . Which places it as the third most used plastic. In Mexico in 2008, each inhabitant consumed approximately 250 bottles per year. For 2010, the country became the first consumer of bottled water worldwide (in one part for advertising and in another for the poor quality of water supply in most states of the country) and the second in beverages carbonated (carbonated) Finally, it is necessary to consider that a PET bottle takes about 500 years to degrade, so that the first PET waste generated in the world has not yet been degraded. It is important to take into account that the reuse of plastics in Mexican companies, as raw material, is minimal. In most cases, the process of transforming PET bottles into new raw material is only carried out until the bottles are crushed. "[5]
II. REVIEW
A. Development of a habitation module from recycled material
The work involves the installation of a habitation module,
through the design and construction of plastic bricks and beams. For this purpose, we used plastic waste packaging processes in different companies. As sustainable housing are used photovoltaic and solar collector systems to supply electricity and heat demands, besides having rain waterstorage tank.
This is the construction of houses by blocks and modular bricks made of waste material in packaging processes of soft drinks and chips, the type of plastic used in low and high density polyethylene, polyethylene terephthalate PET (bottles) and polypropylene (PP). [6]
B. Recycled plastic bricks and panels for self construction This paper is about a research carried out in Centro Experimental de la Vivienda Económica (CEVE) on constructive elements made of recycled plastics materials. The research had a series of objectives which were reached as followed: The technological objective was to develop light constructive components with a good thermal insulation, and mechanical resistance to be used in housing side closing function. The ecological one was to collaborate in environmental decontamination. The economical was to lower costs of social housing construction creating cheaper housing construction materials. The social one was to provide self – constructors with the know how to make construction
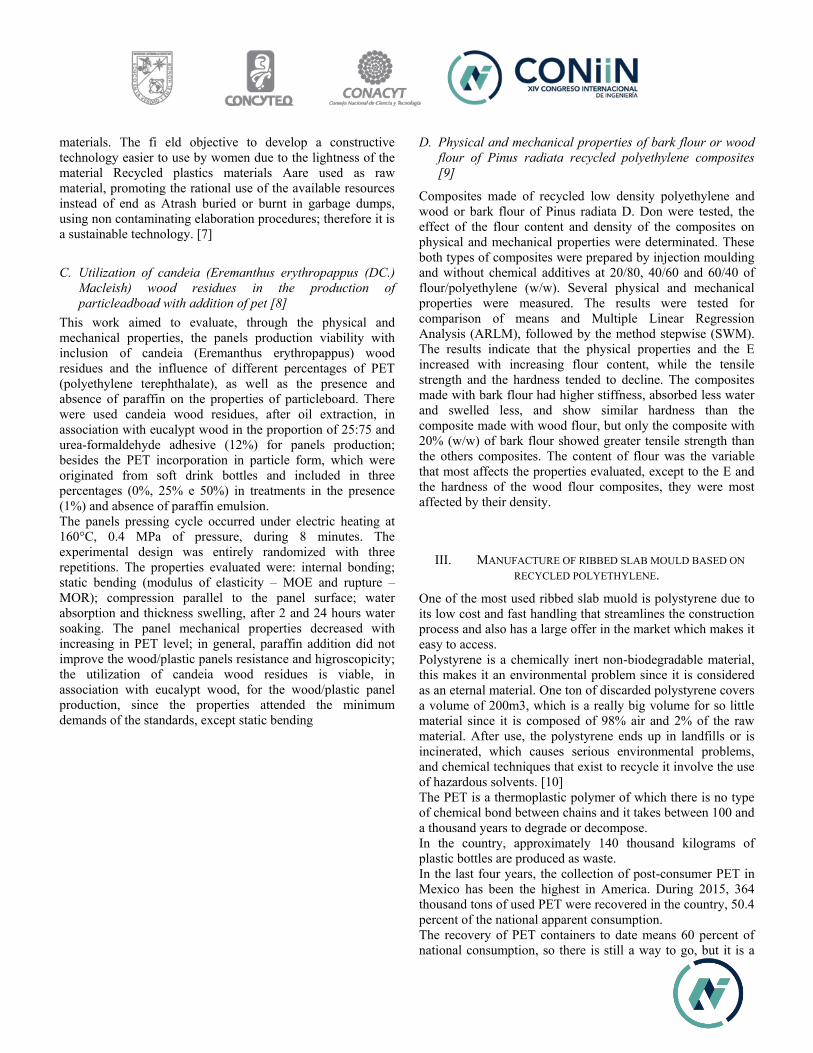
materials. The fi eld objective to develop a constructive technology easier to use by women due to the lightness of the material Recycled plastics materials Aare used as raw material, promoting the rational use of the available resources instead of end as Atrash buried or burnt in garbage dumps, using non contaminating elaboration procedures; therefore it is a sustainable technology. [7]
C. Utilization of candeia (Eremanthus erythropappus (DC.) Macleish) wood residues in the production of particleadboad with addition of pet [8]
This work aimed to evaluate, through the physical and mechanical properties, the panels production viability with inclusion of candeia (Eremanthus erythropappus) wood residues and the influence of different percentages of PET (polyethylene terephthalate), as well as the presence and absence of paraffin on the properties of particleboard. There were used candeia wood residues, after oil extraction, in association with eucalypt wood in the proportion of 25:75 and urea-formaldehyde adhesive (12%) for panels production; besides the PET incorporation in particle form, which were originated from soft drink bottles and included in three percentages (0%, 25% e 50%) in treatments in the presence (1%) and absence of paraffin emulsion. The panels pressing cycle occurred under electric heating at 160°C, 0.4 MPa of pressure, during 8 minutes. The experimental design was entirely randomized with three repetitions. The properties evaluated were: internal bonding; static bending (modulus of elasticity – MOE and rupture – MOR); compression parallel to the panel surface; water absorption and thickness swelling, after 2 and 24 hours water soaking. The panel mechanical properties decreased with increasing in PET level; in general, paraffin addition did not improve the wood/plastic panels resistance and higroscopicity; the utilization of candeia wood residues is viable, in association with eucalypt wood, for the wood/plastic panel production, since the properties attended the minimum demands of the standards, except static bending
D. Physical and mechanical properties of bark flour or wood flour of Pinus radiata recycled polyethylene composites [9]
Composites made of recycled low density polyethylene and wood or bark flour of Pinus radiata D. Don were tested, the effect of the flour content and density of the composites on physical and mechanical properties were determinated. These both types of composites were prepared by injection moulding and without chemical additives at 20/80, 40/60 and 60/40 of flour/polyethylene (w/w). Several physical and mechanical properties were measured. The results were tested for comparison of means and Multiple Linear Regression Analysis (ARLM), followed by the method stepwise (SWM). The results indicate that the physical properties and the E increased with increasing flour content, while the tensile strength and the hardness tended to decline. The composites made with bark flour had higher stiffness, absorbed less water and swelled less, and show similar hardness than the composite made with wood flour, but only the composite with 20% (w/w) of bark flour showed greater tensile strength than the others composites. The content of flour was the variable that most affects the properties evaluated, except to the E and the hardness of the wood flour composites, they were most affected by their density.
III. MANUFACTURE OF RIBBED SLAB MOULD BASED ON RECYCLED POLYETHYLENE.
One of the most used ribbed slab muold is polystyrene due to its low cost and fast handling that streamlines the construction process and also has a large offer in the market which makes it easy to access. Polystyrene is a chemically inert non-biodegradable material, this makes it an environmental problem since it is considered as an eternal material. One ton of discarded polystyrene covers a volume of 200m3, which is a really big volume for so little material since it is composed of 98% air and 2% of the raw material. After use, the polystyrene ends up in landfills or is incinerated, which causes serious environmental problems, and chemical techniques that exist to recycle it involve the use of hazardous solvents. [10] The PET is a thermoplastic polymer of which there is no type of chemical bond between chains and it takes between 100 and a thousand years to degrade or decompose. In the country, approximately 140 thousand kilograms of plastic bottles are produced as waste. In the last four years, the collection of post-consumer PET in Mexico has been the highest in America. During 2015, 364 thousand tons of used PET were recovered in the country, 50.4 percent of the national apparent consumption. The recovery of PET containers to date means 60 percent of national consumption, so there is still a way to go, but it is a
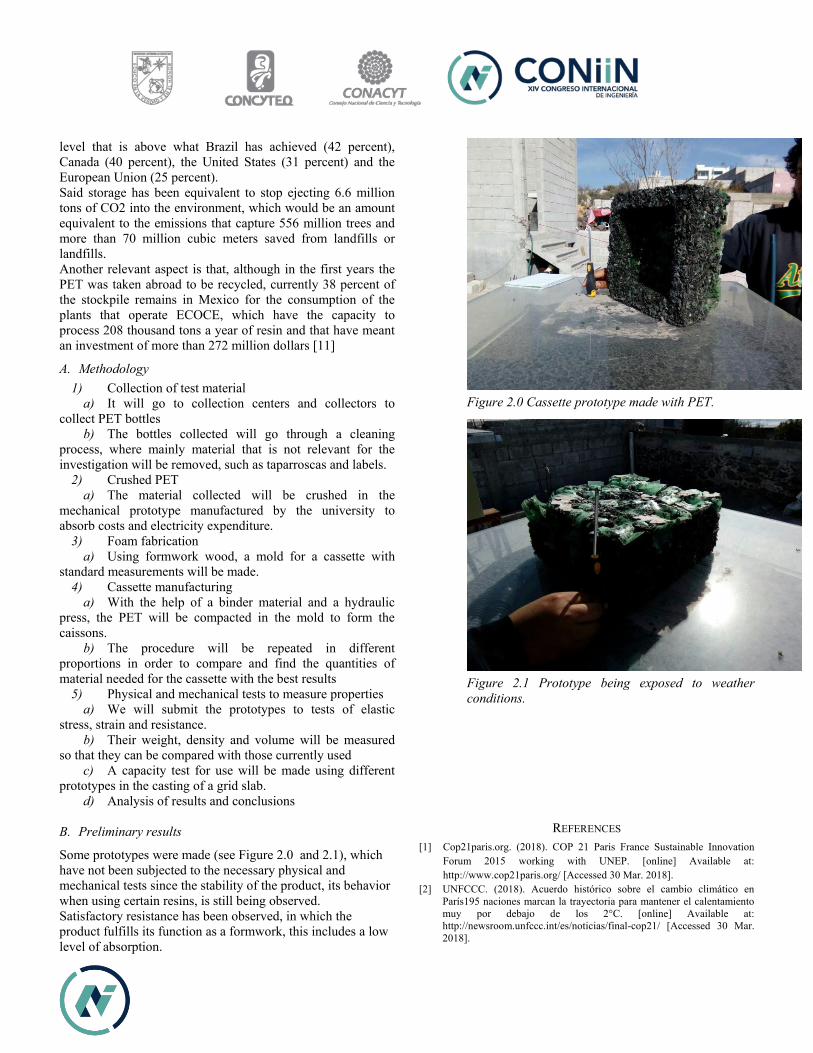
level that is above what Brazil has achieved (42 percent), Canada (40 percent), the United States (31 percent) and the European Union (25 percent). Said storage has been equivalent to stop ejecting 6.6 million tons of CO2 into the environment, which would be an amount equivalent to the emissions that capture 556 million trees and more than 70 million cubic meters saved from landfills or landfills. Another relevant aspect is that, although in the first years the PET was taken abroad to be recycled, currently 38 percent of the stockpile remains in Mexico for the consumption of the plants that operate ECOCE, which have the capacity to process 208 thousand tons a year of resin and that have meant an investment of more than 272 million dollars [11]
A. Methodology 1) Collection of test material
a) It will go to collection centers and collectors to collect PET bottles
b) The bottles collected will go through a cleaning process, where mainly material that is not relevant for the investigation will be removed, such as taparroscas and labels.
2) Crushed PET a) The material collected will be crushed in the
mechanical prototype manufactured by the university to absorb costs and electricity expenditure.
3) Foam fabrication a) Using formwork wood, a mold for a cassette with
standard measurements will be made. 4) Cassette manufacturing
a) With the help of a binder material and a hydraulic press, the PET will be compacted in the mold to form the caissons.
b) The procedure will be repeated in different proportions in order to compare and find the quantities of material needed for the cassette with the best results
5) Physical and mechanical tests to measure properties a) We will submit the prototypes to tests of elastic
stress, strain and resistance. b) Their weight, density and volume will be measured
so that they can be compared with those currently used c) A capacity test for use will be made using different
prototypes in the casting of a grid slab. d) Analysis of results and conclusions
B. Preliminary results
Some prototypes were made (see Figure 2.0 and 2.1), which have not been subjected to the necessary physical and mechanical tests since the stability of the product, its behavior when using certain resins, is still being observed. Satisfactory resistance has been observed, in which the product fulfills its function as a formwork, this includes a low level of absorption.
Figure 2.0 Cassette prototype made with PET.
Figure 2.1 Prototype being exposed to weather conditions.
REFERENCES [1] Cop21paris.org. (2018). COP 21 Paris France Sustainable Innovation
Forum 2015 working with UNEP. [online] Available at: http://www.cop21paris.org/ [Accessed 30 Mar. 2018].
[2] UNFCCC. (2018). Acuerdo histórico sobre el cambio climático en París195 naciones marcan la trayectoria para mantener el calentamiento muy por debajo de los 2°C. [online] Available at: http://newsroom.unfccc.int/es/noticias/final-cop21/ [Accessed 30 Mar. 2018].

[3] Instituto Mexicano para la Competitividad A.C. (2018). México ratifica el Acuerdo de París sobre el cambio climático - Instituto Mexicano para la Competitividad A.C.. [online] Available at: https://imco.org.mx/medio_ambiente/mexico-ratifica-el-acuerdo-de-paris-sobre-el-cambio-climatico/ [Accessed 30 Mar. 2018].
[4] Asia-Pacific Correspondent, K. (2018). The world's rubbish dump: a tip that stretches from Hawaii to Japan. [online] The Independent. Available at: http://www.independent.co.uk/environment/green-living/the-worlds-rubbish-dump-a-tip-that-stretches-from-hawaii-to-japan-778016.html [Accessed 2 Mar. 2018].
[5] Botero Jaramillo, Eduardo; Muñoz, Liliana; OSSA, Alexandra and Romo, Miguel P. Comportamiento mecánico del Polietileno Tereftalato (PET) y sus aplicaciones geotécnicas. Rev.fac.ing.univ. Antioquia [online]. 2014, n.70 [cited 2017-11-08], pp.201-219. Available from: <http://www.scielo.org.co/scielo.php?script=sci_arttext&pid=S0120-62302014000100020&lng=en&nrm=iso>. ISSN 0120-6230.
[6] Salazar Marín, Edgar Alonso, Arroyave Londoño, Juan Felipe, Yepes, Carlos Rene, Desarrollo de un módulo habitacional a partir de materiales reciclados.. Scientia Et Technica [en línea] 2013, 18 (Abril-Sin mes) : [Fecha de consulta: 8 de noviembre de 2017] Disponible en:<http://www.redalyc.org/articulo.oa?id=84927487036> ISSN 0122-1701
[7] Gaggino, R., Arguello, R., Gatani, M. and Berretta, H. (2006). Gestión de tecnología sustentable para viviendas experiencia con reciclados de origen urbano-industrial. Fundación principe claus para la cultura y el desarrollo.
[8] Moya Villablanca, C., Poblete Wilson, H. and Valenzuela Hurtado, L. (2017). Propiedades físicas y mecánicas de compuestos de polietileno reciclado y harinas de corteza y madera de Pinus radiata fabricados mediante moldeo por inyección.
[9] Rosimeire Cavalcante dos Santos, Lourival Marin Mendes, Angélica de Cássia Oliveira Carneiro, Fábio Akira Mori, Renato Vinícius Oliveira Castro, Rafael Farinassi Mendes. (2011) Utilization of Candeia (Eremanthus erythropappus (DC.) Macleish) wood residues in the production of particleboad with addition of PET.
[10] Martínez López, C. and Laines Canepa, J. (2013). Poliestireno Expandido (EPS) y su problemática ambiental. Kuxulkab, XIX(36), pp.63-65.
[11] Bastida Maricela, 2016 Capital media. PET: plástico que México acumula y no aprovecha. [online] Available at: http://www.capitalmexico.com.mx/especial/pet-plastico-que-mexico-acumula-y-no-aprovecha/ [Accessed Marzo 2017].
Undestructive Methods: An Alternative to Determine Capsaicin
Otorres Adrianes Department of Biosystems.
Universidad Autónoma de Querétaro. Querétaro, México.
Rico García Enrique Department of Biosystems.
Universidad Autónoma de Querétaro. Querétaro, México. [email protected]
Abstract— The traditional methods to measure the capsaicin molecule are expensive, slow and usually are in places outside the crop, looking to substitute with the following investigation and that could be the guideline to measure the capsaicin in situ, in stages including the fruit in the plant that allow to respond towards the best harvest time; with the complications of what the capsaicin molecule representsas the one of being its greater percentage in the internal part of the fruit imbibed in vesicles, this search presents possible solutions by the engineering to determine its capsaicin concentration.
Keywords—capsaicin, bioimpedance, electric nose, infrared spectroscopy
Introduction
Capsaicin determination is very important for the scientific reasons, for therapeutic reasons and for agroindustrial production. Analytical techniques have been varying for determining capsaicin in chili pepper, it´s very important to have a direct method where the producers could confidence because the quantity, the quality obtained of capsaicin gives economic advantages. Capsicum genre produces one of the most popular additives of the world [13] capsaicin. Capsaicin produces hot or pungency only in mammals by eating capsicum fruit. Capsaicin is a lipophilic alkaloid [29] the biosynthesis occurs in the placental epidermis cells, where they are secreted towards the outer cell wall, and finally accumulate within structures named ‘‘blisters’’ located on the placenta surface [2], defining the capsaicinoid presence on the seeds or pericarp. The proportion of capsaicin varies between 0,1 to 1% in weight [3]. Capsaicinoid accumulation is a genetically determined trait in chili pepper fruits as different cultivars or genotypes exhibit differences in pungency; furthermore, this characteristic is also developmentally and environmentally regulated [2].
The chemist Wilbur Scoville in 1912 developed a scale of pungency degree chili pepper through an organoleptic examination [21] , the scale is from 0 for sweet pepper to 300,000 or more like habanero pepper.
The researchers and producers require reliable, safe and standardized methods for comparing levels of pungency between different samples of chili pepper. Detecting the non-pungency trait in chili peppers during the early stages of development can certainly reduce the selection time for breeding programs that cater to consumer and industrial requirements [2].
Table 1. Pungency degree of chili peppers[21] . Fruit Pungency degree
Sweet pepper < 100 Mexican pepper 100-500 Cayena pepper 30 000-50 000
Habanero pepper 100 000-350 000 Capsaicin 16 000 000
The most developed instrumental methods for determining the capsaicin molecule are such as Gas Chromatography (GC), Mass Spectrophotometry and Mass Chromatography (GC-MS) and with greater performance is liquid chromatography (HPLC ) with more confidence and accuracy. In the last years surge a method called ultra performance liquid chromatography (UHPLC) derive of HPLC which allows shorter times o9f answers of all compounds of capsaicinoids in less than 9 minutes [1], these methods are equivalent to sending the samples makes an analysis with long wait times,
this represents a difficulty for decision making in the field, itself equipments are of a high economic value. Analytical approaches such as immunoassays, voltammetric determination [29] and electronic noses [14] have been suggested. Taking into account the variability of the content of capsaicin in the fruits of chili and the quick answer, this review takes this necessity and presents different methods that allow for the reader which and how a non-destructive method would make possible determine quantitatively the presence of capsaicin in the fruits of chili.
I. UNDESTRUCTIVE METHODS
a) Capsaicin Common Methods The first method developed for pungency of pepper chili was Scoville Organoleptic Test [21] consisted of a group of five evaluators which taked to taste of chili and registered the flavor level. In the actuality was replaced for various methods based in chromatography and spectrophotometry either in mass or liquid are being been more reliable and precise (Marston, 2007). Usman et al. in 2014 [27] reported a method called Ultra Fast Liquid Chromatography (UFCL) that multiple samples analised with higher speed but is more expensive than the previous methods. All of this methods have some common that destroy samples, high cost, time to responses and is neccesary to send the test to laboratory for know the answers. B) Undestructive methods: Overview for capsaicin. The producers make the decision on when to harvest the fruits based mainly on experience; however, human judgment is always subjective. The development of new technologies is supported by the collection decision so has the highest priority for producers before and after harvest (Herrera et al., 2003). All imply needed to develop a standardized and automated technology for evaluating the ripeness of the fruit (capsaicin concentration) quickly and objectively in the field. These with undestructive methods, not altering the permanent shape and its physical, chemical, mechanical or dimensional properties, and without involving a perceptible damage. Undestructive techniques for the determination of the properties and characteristics of vegetable fruits play a role fundamentally for quality and innocuousness control. The sensors development has been key to identify the product properties, constituting an active research area (Diezma Iglesias et al., 2006). The biological fruits are material that is affected by the time, the processes, the environmental
conditions, generally any process which are subjected. The quality inspect makes essential in each of the phases, where only the sensors can provide objective and economically viable solutions (Diezma Iglesias et al., 2006). Therefore, the application of undestructive technologies requires combining sensors with sophisticated models and mathematical algorithms to establish a robust connection between the physicochemical properties and the quality attributes of the product (Diezma Iglesias et al., 2006). The main undestructive technologies have a different degree of introduction in the commercial sector of fruits and vegetables, first, the mechanical methods are for firmness, size and shapes; then the artificial vision is for internal evaluation and external quality (hyperspectral image, thermography image, X-ray, UV / VIS/NIR and fluorescence spectroscopy); later the acoustic systems, the nuclear magnetic resonance, the wireless sensor and radio frequency identification (RFID) networks for monitoring enclosed and open spaces and for last the sensors for the identification of volatile gases. There are more than fifty methods to determine the maturity of the fruits (Diezma Iglesias et al., 1994). The electronic nose was used to evaluate the maturity of tomatoe [8] this approach by volatile aromatic compounds is an option to use in the fruits of Capsicum spp, not done and reported so far. The undestructible technologies have been used in the maturity of the tomato are chemometric methods, magnetic resonance [30], optical techniques such as near-infrared spectroscopy [25], the Raman spectroscopy [22], the image formation (Rupanagudi et al., 2014), the mechanical learning and diffuse classification (El-Bendary et al., 2015, Goel and Sehgal, 2015), the carbon nanomaterials with chemical sensors (Greenshields et al. ., 2015). All these methods have been used several plants whose secondary metabolites have characteristic color unlike capsaicin important point that is colorless, due to which it represents a challenge for researchers to provide these technologies.
c) Images: Undestructive Methods. The pungency distribution of the red chili pepper is in relation between the dry weight and the capsaicin content in each part of the dried pepper; on the placenta is of 3.9% of the total weight and contains almost 96.9% of all capsaicinoids which form the pungency component (Figure 1).The chemical assays such as HPLC, GC or NIRS uses a small amount of sample or takes measurement at a single point then show large deviations of pungency that depends on the location, distribution and inclusion of placenta in red powder chili
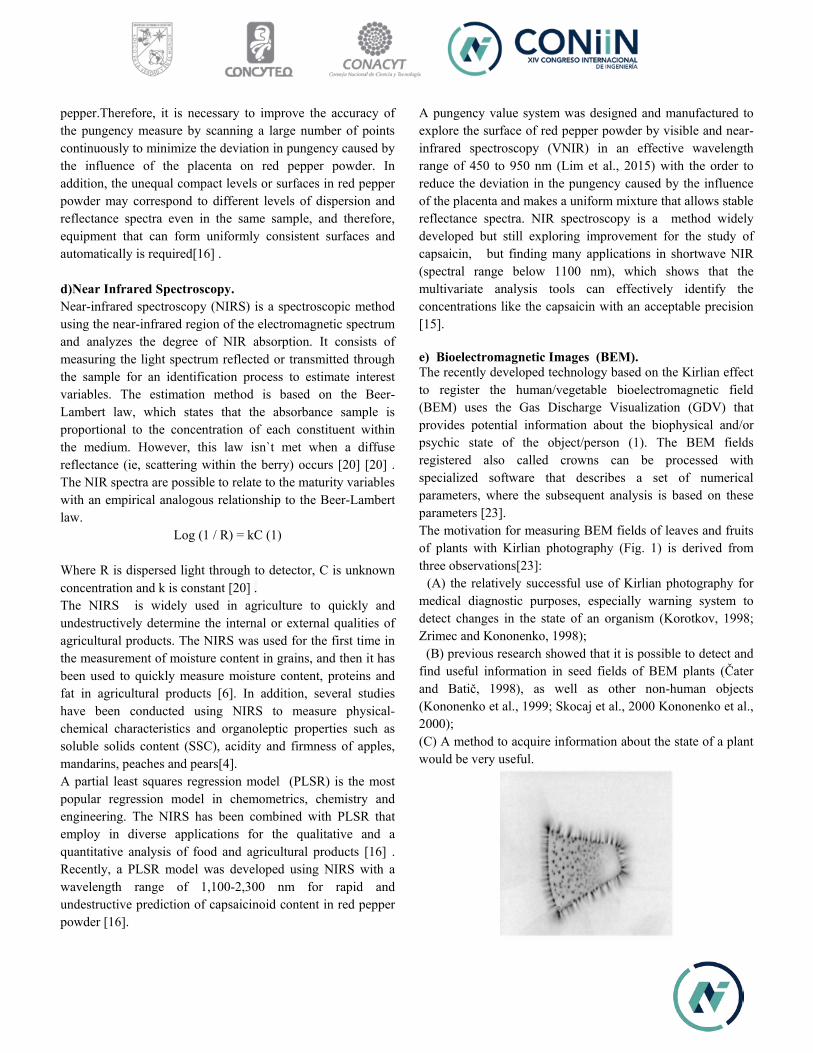
pepper.Therefore, it is necessary to improve the accuracy of the pungency measure by scanning a large number of points continuously to minimize the deviation in pungency caused by the influence of the placenta on red pepper powder. In addition, the unequal compact levels or surfaces in red pepper powder may correspond to different levels of dispersion and reflectance spectra even in the same sample, and therefore, equipment that can form uniformly consistent surfaces and automatically is required[16] . d)Near Infrared Spectroscopy. Near-infrared spectroscopy (NIRS) is a spectroscopic method using the near-infrared region of the electromagnetic spectrum and analyzes the degree of NIR absorption. It consists of measuring the light spectrum reflected or transmitted through the sample for an identification process to estimate interest variables. The estimation method is based on the Beer-Lambert law, which states that the absorbance sample is proportional to the concentration of each constituent within the medium. However, this law isn`t met when a diffuse reflectance (ie, scattering within the berry) occurs [20] [20] . The NIR spectra are possible to relate to the maturity variables with an empirical analogous relationship to the Beer-Lambert law.
Log (1 / R) = kC (1) Where R is dispersed light through to detector, C is unknown concentration and k is constant [20] . The NIRS is widely used in agriculture to quickly and undestructively determine the internal or external qualities of agricultural products. The NIRS was used for the first time in the measurement of moisture content in grains, and then it has been used to quickly measure moisture content, proteins and fat in agricultural products [6]. In addition, several studies have been conducted using NIRS to measure physical-chemical characteristics and organoleptic properties such as soluble solids content (SSC), acidity and firmness of apples, mandarins, peaches and pears[4]. A partial least squares regression model (PLSR) is the most popular regression model in chemometrics, chemistry and engineering. The NIRS has been combined with PLSR that employ in diverse applications for the qualitative and a quantitative analysis of food and agricultural products [16] . Recently, a PLSR model was developed using NIRS with a wavelength range of 1,100-2,300 nm for rapid and undestructive prediction of capsaicinoid content in red pepper powder [16].
A pungency value system was designed and manufactured to explore the surface of red pepper powder by visible and near-infrared spectroscopy (VNIR) in an effective wavelength range of 450 to 950 nm (Lim et al., 2015) with the order to reduce the deviation in the pungency caused by the influence of the placenta and makes a uniform mixture that allows stable reflectance spectra. NIR spectroscopy is a method widely developed but still exploring improvement for the study of capsaicin, but finding many applications in shortwave NIR (spectral range below 1100 nm), which shows that the multivariate analysis tools can effectively identify the concentrations like the capsaicin with an acceptable precision [15].
e) Bioelectromagnetic Images (BEM). The recently developed technology based on the Kirlian effect to register the human/vegetable bioelectromagnetic field (BEM) uses the Gas Discharge Visualization (GDV) that provides potential information about the biophysical and/or psychic state of the object/person (1). The BEM fields registered also called crowns can be processed with specialized software that describes a set of numerical parameters, where the subsequent analysis is based on these parameters [23]. The motivation for measuring BEM fields of leaves and fruits of plants with Kirlian photography (Fig. 1) is derived from three observations[23]: (A) the relatively successful use of Kirlian photography for medical diagnostic purposes, especially warning system to detect changes in the state of an organism (Korotkov, 1998; Zrimec and Kononenko, 1998); (B) previous research showed that it is possible to detect and find useful information in seed fields of BEM plants (Čater and Batič, 1998), as well as other non-human objects (Kononenko et al., 1999; Skocaj et al., 2000 Kononenko et al., 2000); (C) A method to acquire information about the state of a plant would be very useful.

Figure 1. Apple piece crown [23].
A study was carried through the processing of data on bioelectric fields of grape berries with a learning machine by mathematical algorithms, this technique has been applied successfully in different experiments (Kononenko et al., 1999, Trampuž et al., 1999; Čater and Batič, 1998).The vitality of the plants subjected to various scenarios monitored with the use of Kirlian photography, emphasizing the early detection of the decrease of the vitality of the plants due to infections or inadequate conditions [23]. Sadikov and Kononeko [23] describes some of the numerical parameters used to support the hypothesis that the BEM fields of leaves and fruits contain useful information to evaluate the state of a plant are: absolute area of the crown, noise suppressed from the image, coefficient form, shape deviation, crown entropy, fractal dimension, medium brightness, brightness deviation, brightness appearance, brightness stability, brightness entropy, number of separate fragments in the image and 7 parameters based on the geometric moments defined by Hu [11].
f) Electronic nose (E-nose) Organoleptic Method. The instrumental viewpoint has an obvious correlation between the human senses and the application of optical, chemical and tactile sensors. The instrumental measure of fruit quality has been based mainly on properties such as texture and firmness [28]; An extensive research has focused on the development of undestructive techniques to measure the quality of fruit attributes and the detection of aromas is a promising method [8]. Alternative strategy to determine the state of maturity is from the volatile aromatic compounds emitted by the fruits using electronic olfactory systems[8]; these systems are concerned with the exploitation of the information contained in the surface of fruits where some specific compounds have been identified as responsible for the particular fruit aroma. In the last decade, the e-nose technology has opened to the possibility of exploiting the information contained in the aromatic space where the food analysis is certainly one of the most practiced. The e-nose offers a fast and undestructive alternative to detect the aroma can be used to predict the optimal collection date [9] of vegetables and fruits, with possible applications to avoid the concentration of capsaicin.
Some authors reported positive applications of the electronic technology of the nose to the discrimination of the quality of the different fruits, and many experiments were carried out, such as: oranges, melons, berries, pears, peaches , bananas, apples [24] and nectarines. g) Bioimpedance. All biological bodies have electrical properties according to the physical structure, to the internal chemical processes and / or the combination of both [3]. Electric impedance is a passive electrical property that determines how a flow of alternating current applied by an external electric field is "impeded" by biological tissues (or any other material) [19]. The response of electric fields in a biological tissue can be considered as a volume transistor-conductor (due to specific conductivities) or a dielectric (due to relative permittivities), and ions as charge carriers [18]. Generally, a cell membrane can be represented as a capacitor because it is considered a dielectric field, while intracellular and extracellular fluids can simulate a resistance [19] . The electrical energy that flows through the biological tissue (or any material) by means of charge carriers can be dissipated by said resistors, and stored by capacitors. Electrical impedance is a passive electrical property that determines how an alternating current flow applied by an external electric field is "impeded" by biological tissues (or any other material) [19] . Electrical impedance measurements have been studied to determine the physiological state of the plant, such as [17] who analyzed potato tubers and carrot roots using a double layer model; [12] detected damaged tissue in bruised apples; [17] determined a relationship between the electrical impedance and the biochemical properties of the fruit (pH, sugar content, maturation). There are few impedance studies for the nutritional states of the plants, where Greenham and collaborators[19] studied the electrical impedance in measurements taken from plants Trifolium subterraneum deficient in phosphorus and potassium, and Tomckiewicz and Piskier [26] evaluated stress caused by lack of nutrients. III. References. [1] Alothman, Z.A.; Wabaidur, S.M.; Kahn, M.R.; Ghafar, A.A.; Habila, M.A.; Ahmed, Y.B.H.; 2012; Determination of capsaicinoids in Capsicum species using ultra performance liquid chromatography-mass spectrometry; Journal of Separation Science; 35(21):2892-2896. [2] Aza-González, R., H.G. Núñez-Palenius & N. Ochoa-Alejo (2011). Molecular biology of capsaicinoids biosynthesis

in chili pepper (Capsicum spp.). Plant Cell Reports 30: 695-706. [3] Azzarello, E.; Masi, E.; Mancuso, S; 2012; Electrochemical Impedance Spectroscopy: In Plant Electrophysiology;Plant Electrophysiology;205–223.
[4] Bobelyn, E., Serban, A., Nicu, M., Lammertyn, J., Nicolaï, B and W. Saeys; 2010; Postharvest quality of apple predicted by NIR-spectroscopy: study of the effect of biological variability on spectra and model performance.; Postharvest Biology and Technology; 55(3):133-143.
[5] Cedrón, A. C.; 2013; La capsaicina; Revista de Química PUCP; 27(1-2): 7-8.
[6] Davies, A. M and A. Grant.; 1987; Review: near-infra-red analysis of food.; International Journal of Food Science and Technology; 22(3):191-207.
[7] Diezma-Iglesias; B.; Valero, C.; García-Ramos, F.J.; Ruiz-Altisen; M.; 2005; Monitoring of firmness evaluation of peaches during storage by combining acoustic and impact methods; Journal iof Food Engineering; 77(4): 926-935. [8] Gómez, A. H., Hu, G., Wang, J. y Pereira, A. G.; 2006; Evaluation of tomato maturity by electronic nose; Computers and electronics in agriculture; 54(1), 44-52. [9] Hai, Z. ; Wang, J.; 2006; Detection of adulteration in camellia seed oil and sesame oil using an electronic nose; Eur. J. Lipid Sci. Tech.; 108 (2): 116-124. [10] Herrera, J.; Guesalaga, A.; Agosin, E.; 2003; Shortwave-near infrared spectroscopy for non-destructive determination of maturity of wine grapes; Measurement Science and Technology; 14(5). [11] Hu, M.K.; 1962; Visual Pattern Recognition by Moment Invariants; IEEE Tr. on Information Theory; 8: 179-187. [12] Jackson, P.J.; Harker, F.R.; 2000; Apple bruise detection by electrical impedance measurement.; HortScience; 35: 104–107. [13] Kachoosangi, R.T.; Wildgoose, G.G.; Compton, R.G.; 2008; Carbon nanotube-based electrochemical sensors for quantifying the 'heat' of chilli peppers: The adsorptive stripping voltammetric determination of capsaicin.; Analyst; 133 (7): 888–895.
[14] Korel, F.; Bagdatlioglu, N.; Balaban, M.O.; Hisil, Y.; 2002; Ground Red Peppers: Capsaicinoids Content, Scoville Scores, and Discrimination by an Electronic Nose; J. Agric. Food. Chem.; 50(11): 3257-3261.
[15] Larrain, M., Guesalaga, A. R., and Agosín, E; 2008; A multipurpose portable instrument for determining ripeness in wine grapes using NIR spectroscopy.; IEEE Transactions on Instrumentation and Measurement, 57(2), 294-302.
[16] Lim, J; Mo, C.; Kim, G.; Kim M. S.; Lee, H; Developrment of Models for the Prediction of Domestic Red Pepper (Capsicum annuum L.) Powder Capsaicinoid Content using Visible and Near-infrared Spectroscopy; Journal of Byosistems Engineering; 40(1):47-60. [17] Liu, X.; 2006; Electrical Impedance Spectroscopy Applied in Plant Physiology Studies ; M.Sc. Thesis; RMIT University: Melbourne, Australia. [18] Martinsen, O.G.; Grimnes, S.;2011; Bioimpedance and Bioelectricity Basics; Academic Press; Oxford,UK,: 1–3.
[19] Muñoz-Huerta, R. F; Ortiz-Melendez, A.J.; Guevara-Gonzalez, R.G.; Torres-Pacheco, I.; Herrera-Ruiz, G.; Contreras-Medina, L.M.; Prado-Olivarez, J.; Ocampo-Velazquez- R. V.; 2014; An Analysis of Electrical Impedance Measurements Applied fro Plant N Status Estimation in Lettuce (Lactuca sativa; Sensors; 14(7): 11492-11503.
[20] Osborne, B.; 2000; "Near-infrared spectroscopy in food analysis" in Encyclopedia of Analytical Chemistry; 5: 4069-4082.
[21] Parrish, M.; 1996; Liquid chromatographic method of determining capsaicinoids in capsicums and their extractives: collaborative study.; J. Assoc. Off. Anal. Chem.; 79: 738-745. [22] Qin, J.; Chao, K.; Kim, M. S.; Nondestructive evaluation of internal maturity of tomatoes using spatially offset Raman spectroscopy; Postharvest Biology and Technology; 7: 21-31. [23] Sadikov, A.; Kononenko, I; 2002; Information Stored in Coronas Fruits and Leaves; 5th International Multi-Conference Information Society: http://www.cobiss.si/scripts/cobiss?command=search&base=50070&select=(id=3487316) [24] Saevels, S.; Lammertyn, J.; Berna A.Z.; Veraverbeke, , E.A.; Di Natale, C.; Nicolaï, B.M.; 2003; Electronic nose as a non-destructive tool to evaluate the optimal harvest date of apples; Postharvest Biol. Technol.; 30: 3-14. [25] Sirisomboon; P.; Tanaka, M.; Kojima, T.; Williams, P.; 2012; Journal of Food Engineering; 112(3): 218-226. [26] Tomkiewicz, D.; Piskier, T.; 2012; A plant based sensing method for nutrition stress monitoring; Precis. Agric.; 13: 370–383. [27] Usman, M.G.; Rafii, M.Y.; Ismail, M.R.; Malek, M.A.; Latif, M.A.; 2014; Capsaicin and dihydrocapsaicin

determination in chili pepper genotypes using ultra-fast liquid chromatography; Molecules; 19: 6474–6488. [28] Wang, J.; Teng, B.; Yu, Y.; 2004; Pear dynamic characteristics and firmness detection; Eur. Food Res. Technol.; 218 (3): 289-294. [29] Yardim, Y.; Senturk, Z.; 2013; Electrochemical evaluation and adsorptive stripping voltammetric determination of capsaicin or dihydrocapsaicin on a disposable pencil graphite electrode.;Talanta; 112 :11–19. [30] Zhang, L.; McCarthy, M. J.; 2011; Measurement and evaluation of tomato maturity using magnetic resonance imaging; Postharvest Biology and Technology; 67: 37-43.
Use of Unmanned Aircraf Vehicle (UAVs-drone) as main tool of work in engineering. A review.
Fernández García Abril Engineering Student
Autonomous University of Querétaro. Querétaro, México
Omar Chavez Engineering Faculty
Autonomous University of Queretaro Querétaro, México
Abstract— As incredible as it may seem, in civil works, in any of its different modalities, there is a great security risk because the different tasks to be executed require a preliminary visualization for the activities to be carried out, such as, among others: slope stability, supervision of construction of high buildings, which entails in most of the cases not to have easy access and safety means for the worker, mainly. Recently, the development of technology and the availability of the Unmanned Air Vehicles (UAVs-drones) can provide a better point of view and it can determine the feasibility and work actions before the exposition of a real human life. UAVs could be used, in certain cases, as the same instrument for the execution of the maneuvers; reducing labor risk, stoppage of industrial activities due to maintenance work, analysis and interpretation of a particular area, among others. This paper presents different, and original applications of this technology, and presents a possibility to explore new applications that can help to reduce human risks, costs and work time.
Keywords— UAV, unmanned air vehicles, drone, flight, construction, engineering.
I. INTRODUCTION Autonomous unmanned aerial vehicles (UAV -
Drone) recently have been received increasing interest for environmental and natural disaster areas monitoring, border, and general surveillance, emergency assistance, search and rescue missions, and relay communications even only geo-position location [1-7]. UAVs, also call drones, do not carry a human operator, they fly remotely or autonomously, and they can carry lethal or nonlethal payloads [8]. Recent achievements made in digital technologies, and additional methods of documentation have emerged, owing to the enhanced affordability and accessibility of UAVs [9-11]. Many Information of Technology platforms are based on technologically simple devices, like sensor or small actuators. Other solutions require more complex devices [12]. Additionally, technological development and the cost reduction of drones are encouraging their use for industrial and professional systems [13-15]. Approaches for controlling drones would be classified in: Direct teleoperation, and
Specifying flight plants/destination point. Moving drones in outdoor environments is usually easier than moving in indoor environments. Most flight plans are based on GPS locations [16]. Advances in fabrication, navigation, remote control capabilities, and power storage systems have made possible the development of a wide range of drones which can be utilized in various situations where the presence of humans is difficult, impossible, or dangerous, [17-18] the main problem is the battery, those devices have, commonly, only a free support of fifteen minutes.
The system is also valid for monitoring tasks, it shows data from drone sensors, and it is designed for including extra external sensor. Drones can provide assistance in different tasks at a minimum cost [19-20] by reducing, almost in the most of time, the cost of operator. In addition to that, for fewer financial restrictions, other important benefits of drone technology include the ability to acquire high-resolution vertical and oblique imagery or low altitude, cloud-free imagery, the ability to program precise flight paths, and easy-to-master manipulation of drone [21-22]. Martin et al [23] and Greenwood [24] have stressed that despite the obvious benefits of drones, there a variety of technical and operational limitations, such as fisheye photography distortion, weather dependency, and consideration of aviation safety regulations and licensing, which may complete the routine usage of drones, as well as have a limited flight time. For time-critical missions with changing objectives, distributed coordination and reliable sensing and networking are required, the path plan can be generated before the mission in a centralized station, and sensed data can be processed offline, relaxing the constraints on communication, the diversity of application demands supports the analysis of multiUAVs systems from coordination, sensing and communication viewpoints [25]. Depending on the flight missions of the drones, the size and type of installed equipment are different [6]. Watts et al. [26] described a variety of platforms, they identified advantages of each as relevant to the demands of users in the scientific research sector, and also they classified the drone´s
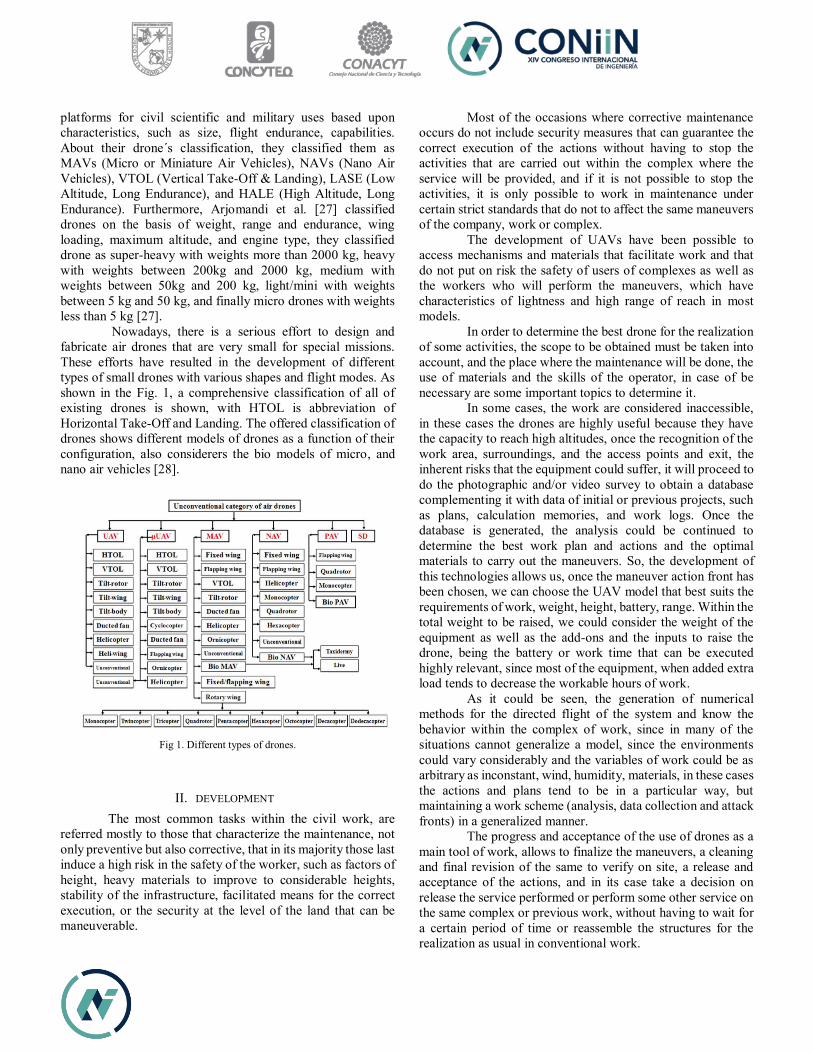
platforms for civil scientific and military uses based upon characteristics, such as size, flight endurance, capabilities. About their drone´s classification, they classified them as MAVs (Micro or Miniature Air Vehicles), NAVs (Nano Air Vehicles), VTOL (Vertical Take-Off & Landing), LASE (Low Altitude, Long Endurance), and HALE (High Altitude, Long Endurance). Furthermore, Arjomandi et al. [27] classified drones on the basis of weight, range and endurance, wing loading, maximum altitude, and engine type, they classified drone as super-heavy with weights more than 2000 kg, heavy with weights between 200kg and 2000 kg, medium with weights between 50kg and 200 kg, light/mini with weights between 5 kg and 50 kg, and finally micro drones with weights less than 5 kg [27]. Nowadays, there is a serious effort to design and fabricate air drones that are very small for special missions. These efforts have resulted in the development of different types of small drones with various shapes and flight modes. As shown in the Fig. 1, a comprehensive classification of all of existing drones is shown, with HTOL is abbreviation of Horizontal Take-Off and Landing. The offered classification of drones shows different models of drones as a function of their configuration, also considerers the bio models of micro, and nano air vehicles [28].
Fig 1. Different types of drones.
II. DEVELOPMENT The most common tasks within the civil work, are
referred mostly to those that characterize the maintenance, not only preventive but also corrective, that in its majority those last induce a high risk in the safety of the worker, such as factors of height, heavy materials to improve to considerable heights, stability of the infrastructure, facilitated means for the correct execution, or the security at the level of the land that can be maneuverable.
Most of the occasions where corrective maintenance occurs do not include security measures that can guarantee the correct execution of the actions without having to stop the activities that are carried out within the complex where the service will be provided, and if it is not possible to stop the activities, it is only possible to work in maintenance under certain strict standards that do not to affect the same maneuvers of the company, work or complex.
The development of UAVs have been possible to access mechanisms and materials that facilitate work and that do not put on risk the safety of users of complexes as well as the workers who will perform the maneuvers, which have characteristics of lightness and high range of reach in most models.
In order to determine the best drone for the realization of some activities, the scope to be obtained must be taken into account, and the place where the maintenance will be done, the use of materials and the skills of the operator, in case of be necessary are some important topics to determine it.
In some cases, the work are considered inaccessible, in these cases the drones are highly useful because they have the capacity to reach high altitudes, once the recognition of the work area, surroundings, and the access points and exit, the inherent risks that the equipment could suffer, it will proceed to do the photographic and/or video survey to obtain a database complementing it with data of initial or previous projects, such as plans, calculation memories, and work logs. Once the database is generated, the analysis could be continued to determine the best work plan and actions and the optimal materials to carry out the maneuvers. So, the development of this technologies allows us, once the maneuver action front has been chosen, we can choose the UAV model that best suits the requirements of work, weight, height, battery, range. Within the total weight to be raised, we could consider the weight of the equipment as well as the add-ons and the inputs to raise the drone, being the battery or work time that can be executed highly relevant, since most of the equipment, when added extra load tends to decrease the workable hours of work.
As it could be seen, the generation of numerical methods for the directed flight of the system and know the behavior within the complex of work, since in many of the situations cannot generalize a model, since the environments could vary considerably and the variables of work could be as arbitrary as inconstant, wind, humidity, materials, in these cases the actions and plans tend to be in a particular way, but maintaining a work scheme (analysis, data collection and attack fronts) in a generalized manner.
The progress and acceptance of the use of drones as a main tool of work, allows to finalize the maneuvers, a cleaning and final revision of the same to verify on site, a release and acceptance of the actions, and in its case take a decision on release the service performed or perform some other service on the same complex or previous work, without having to wait for a certain period of time or reassemble the structures for the realization as usual in conventional work.
Of course, one of the main problems is considering the normative of each country and/or each place because we have different rules near to an airport in comparison with an open area. As a summary, we have a good opportunity to develop our own methodology, model or logarithm embedded in a properly drone in order to distinguish between a good or bad preliminary reconnaissance before spend money, time or put a human life in serious risk.
CONCLUSION
The UAVs can allow us to explore new areas avoiding
the conventional risks of the workplace by obtaining better accessibility, mainly because the drone can provide us the facility of executing actions of reconnaissance on an irregular surveying or even in evaluation of natural and anthropic disasters. The high cost for use of moving the necessary equipment in a conventional technique, by reducing maneuver times as well as to ensure the safety of the workers or even the reduction due to the stop control of regular activities in the workplace by reducing and leaving traditional techniques that increase human risks. All this characteristics give the properly drone a surplus over other conventional techniques.
REFERENCES [1] A. Rayan, M. Zennaro, A. Howell, R. Septura, J. Hendrick, An overview
of emerging results in corporative UAV control, in Proc. IEEE Conf. Decision and Control, 1, 2004. Pp. 602-607. doi: 10.1109/CDC.2004.1428700.
[2] M. Kovacina, D Palmer, G. Yang, R. Vaidyanathan, Multi-agent control algorithms for chemical cloud detection and mapping using unmmanned air vehicles, in Proc. IEEE/RSJ Intl Conf. on Intelligent Robots and Systems, 3, 2002, pp. 2782-2788.
[3] R.C. Palat, A. A nnamalai, J.H. Reed, Cooperative relaying for ad hoc groung net-works using swarms, in Proc. IEEE Milit Comm. Conf, (MILCOM’05), 3, 2005, pp.1588-1594.
[4] D. Cole, A. Goktogan, P. Thompson, S. Sukkariek, Mapping and tracking, IEEE Robotics Automation Magazine 16 (2) (2009) pp. 22-34.
[5] Q. Lindsey, D. Millinger, V. Kumar, Construction of cubic structures with quadrotor teams, in Proc. Of Robotics: Science and Systems, Los Angeles, CA, USA, 2011.
[6] S. Hayat, E. Yanmaz, R, Muzaffar, Survey on unmanned aerial vehicle networks for civil applications: a communications viewpoint, IEEE Communications Surveys Tutorials 18 (4) (2016) 2624-2661.
[7] M. Erdelj, E. Natalizio, K.R. Chowdhury, I.F. Akyildiz, Help from the sky: lever-aging UAVs for disaster management, IEEE Pervasive Comput. 16 (1) (2017) pp. 24-32.
[8] U.K. MoD, Joint Doctrine Note 2/11 the UK Approach to Unmanned Aircraft Systems, UK MoD The Development, Concepts and Doctrine Centre, SWINDON, Wiltshire, 2011.
[9] P. Urbanova, M. Jurda, T. Vojtisek, J. Krajsa, Using drone-mounted cameras for on-site body documentation 3D mapping and active survey, in Press: Forensic Sience International 281 (2017) pp. 52-62.
[10] P. Mier, et al., UAVs and humanitarians response, in K. Kakaes (Ed.), Drones and Aerial Observation: New Technologies for Property Rights, Human Rights, and Global Development, A Primer, New America, 2015, pp. 57-62.
[11] B.A.J. Fisher Techniques of Crime Scene Investigation, 8th edition, CRC Press, Boca Raton, 2012.
[12] M. Ashwini, S. Gowrishankar, Siddaraju, Internet of things based intelligent monitoring and reporting from agricultural fields, Int. J. Control Theory Appl. 9 (2016) 4311-4320.
[13] K. Ichihara, Technologies and applications in the drone industry, J. Japna Inst. Electron. Packag. 19 (2016) 408-415.
[14] A.B. Rice, Drone technology as applied to the cement industry, in IEEE Cem. Ind. Tech Conf., 2016. doi: 10.1109/CITCON.2016.7742662
[15] D. Hill, Researchers have high hopes for drone use in transportation, Civ. Eng. 84 (2014) 38-39.
[16] A.A. Pereira et al., Platform for controling and getting data drom network connected drones indoor environments, Future Generation Computer Systems (2018). doi: 10.1016/j.future.2018.01.011.
[17] R.J. Bachmann, F.J. Boria, R. Vaidyanathan, P.G. Ifju, R.D. Quinn, A biologically inspired micro-vehicle capable of aerial terrestrial locomotion, Mech. Mach. Teheory 44 (2009) 513-526.
[18] M. Hassanalian, H. Khaki, M. Khosrawi, A new mothod for desing of fixed wing micro air vehicle, Proc. Inst. Mech. Eng. J. Aerosp. Eng. 229 (2014) 837-850.
[19] A.I. Phillips, L.M. Tormos, Use of unmanned Aerial Vehicles (UAVs) for docummenting the forensic scene and body retrievak I. A case of mind-air collision between aircfrat, Proceedings of the 67th American Academu of Forensic Sciences Meeting, Orlando, Fl., 2015, pp. 71-78.
[20] M. Isaacks, D.J. Wescott, The use of near-infra remote sensing in the detection of clandestine human remains, Proceedings of the 67th American Academy of Forensic Sciences Meeting, Orlando, Fl., 20155, pp. 522.
[21] A.M. DesMarais, Detection of cadavereis remains by thermal imaging cameras, J. Forensic Identif. 64 (5) (2014) 489-510.
[22] P. Rowan, M. Hill, G.A. Gresham, E. Goodall, T. Moore, The use of infrares aided photography in identification of sites of bruises after evidence of the bruise is absent to the naked eye, J. Forensic Leg. Med. 17 (6) (2010) 293-297.
[23] J. Martin, A. Martin, G.H. Naisbitt, Technical consideration for Drone-Mounte GoPro® camera for crime scene measurements, Proceeedings of the 68th Academy of Forensic Sciences Meeting, Las Vegas, NV, 2016, pp.493.
[24] F. Greenwood, et al., Case study-inside the world’s largest Drone Archeology program, in K. Kakaes (Ed.) Drones and Aerial Observation: New Technoligies for Property Rights, Human Rights, and Global, A Primer, New America, 2015, pp. 79-85.
[25] E. Yanmaz, M. Quaritsch, S. Yahyanejad, B. Rinner, H. Hellwagner, C. Bettstetter, Communication and coordination for drone networks, in: Y. Zhou (Ed.), In Proc. ADHOCNETS 2016, Springer, 2016.
[26] A. Cavoukina, Privacy and Drones: Unmanned Aerial Vehicles, Information and Privacy Commissioner of Ontario, Canada, 2012, pp. 1-30.
[27] A. Arjomandi, S. Agostino, M. Mammone, M, Nelson, T. Zhou, Classification of Unmanned Aerial Vehicle, Report for Mechanical Engineering class, University of Adelaide, Adelaide, Australia, 2006. M. Hassanalian, A. Abdelkefi, Classifications, applications, and desing challenge of drones: A review, Progress in Aeroespace Sciences 91 (2017) 99-131.
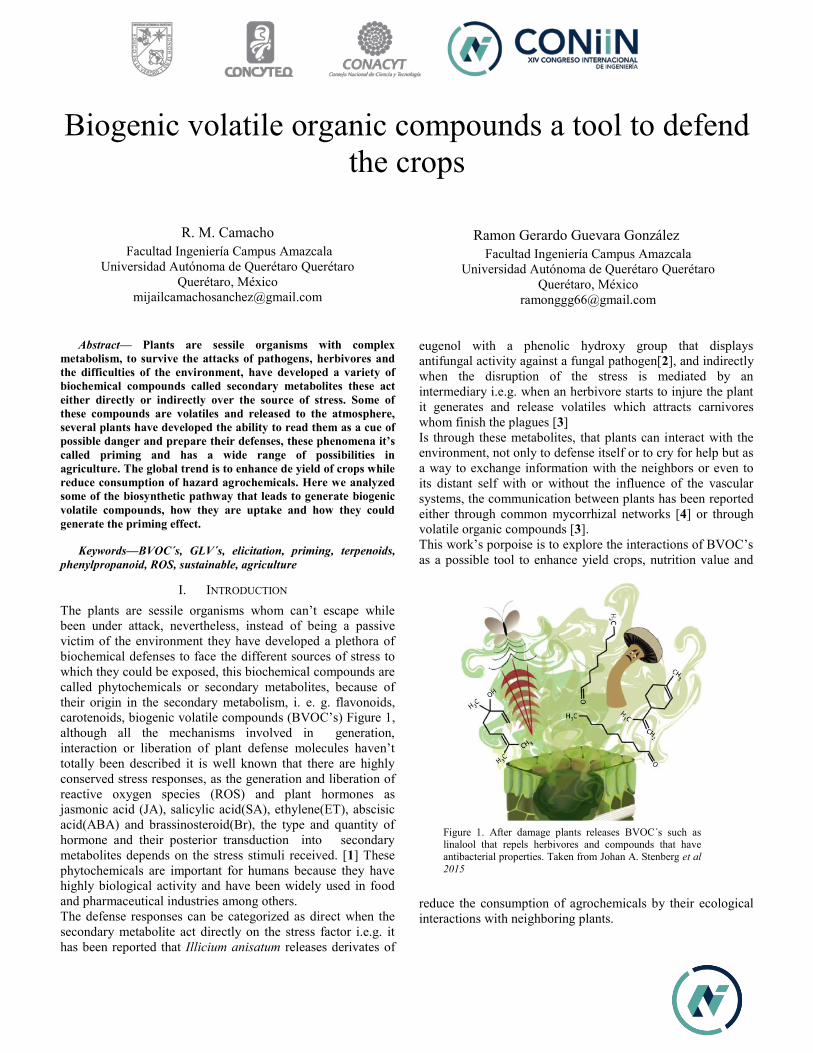
Biogenic volatile organic compounds a tool to defend the crops
R. M. Camacho Facultad Ingeniería Campus Amazcala
Universidad Autónoma de Querétaro Querétaro Querétaro, México
Ramon Gerardo Guevara González Facultad Ingeniería Campus Amazcala
Universidad Autónoma de Querétaro Querétaro Querétaro, México
Abstract— Plants are sessile organisms with complex metabolism, to survive the attacks of pathogens, herbivores and the difficulties of the environment, have developed a variety of biochemical compounds called secondary metabolites these act either directly or indirectly over the source of stress. Some of these compounds are volatiles and released to the atmosphere, several plants have developed the ability to read them as a cue of possible danger and prepare their defenses, these phenomena it’s called priming and has a wide range of possibilities in agriculture. The global trend is to enhance de yield of crops while reduce consumption of hazard agrochemicals. Here we analyzed some of the biosynthetic pathway that leads to generate biogenic volatile compounds, how they are uptake and how they could generate the priming effect.
Keywords—BVOC´s, GLV´s, elicitation, priming, terpenoids, phenylpropanoid, ROS, sustainable, agriculture
I. INTRODUCTION The plants are sessile organisms whom can’t escape while been under attack, nevertheless, instead of being a passive victim of the environment they have developed a plethora of biochemical defenses to face the different sources of stress to which they could be exposed, this biochemical compounds are called phytochemicals or secondary metabolites, because of their origin in the secondary metabolism, i. e. g. flavonoids, carotenoids, biogenic volatile compounds (BVOC’s) Figure 1, although all the mechanisms involved in generation, interaction or liberation of plant defense molecules haven’t totally been described it is well known that there are highly conserved stress responses, as the generation and liberation of reactive oxygen species (ROS) and plant hormones as jasmonic acid (JA), salicylic acid(SA), ethylene(ET), abscisic acid(ABA) and brassinosteroid(Br), the type and quantity of hormone and their posterior transduction into secondary metabolites depends on the stress stimuli received. [1] These phytochemicals are important for humans because they have highly biological activity and have been widely used in food and pharmaceutical industries among others. The defense responses can be categorized as direct when the secondary metabolite act directly on the stress factor i.e.g. it has been reported that Illicium anisatum releases derivates of
eugenol with a phenolic hydroxy group that displays antifungal activity against a fungal pathogen[2], and indirectly when the disruption of the stress is mediated by an intermediary i.e.g. when an herbivore starts to injure the plant it generates and release volatiles which attracts carnivores whom finish the plagues [3] Is through these metabolites, that plants can interact with the environment, not only to defense itself or to cry for help but as a way to exchange information with the neighbors or even to its distant self with or without the influence of the vascular systems, the communication between plants has been reported either through common mycorrhizal networks [4] or through volatile organic compounds [3]. This work’s porpoise is to explore the interactions of BVOC’s as a possible tool to enhance yield crops, nutrition value and
reduce the consumption of agrochemicals by their ecological interactions with neighboring plants.
Figure 1. After damage plants releases BVOC´s such as linalool that repels herbivores and compounds that have antibacterial properties. Taken from Johan A. Stenberg et al 2015
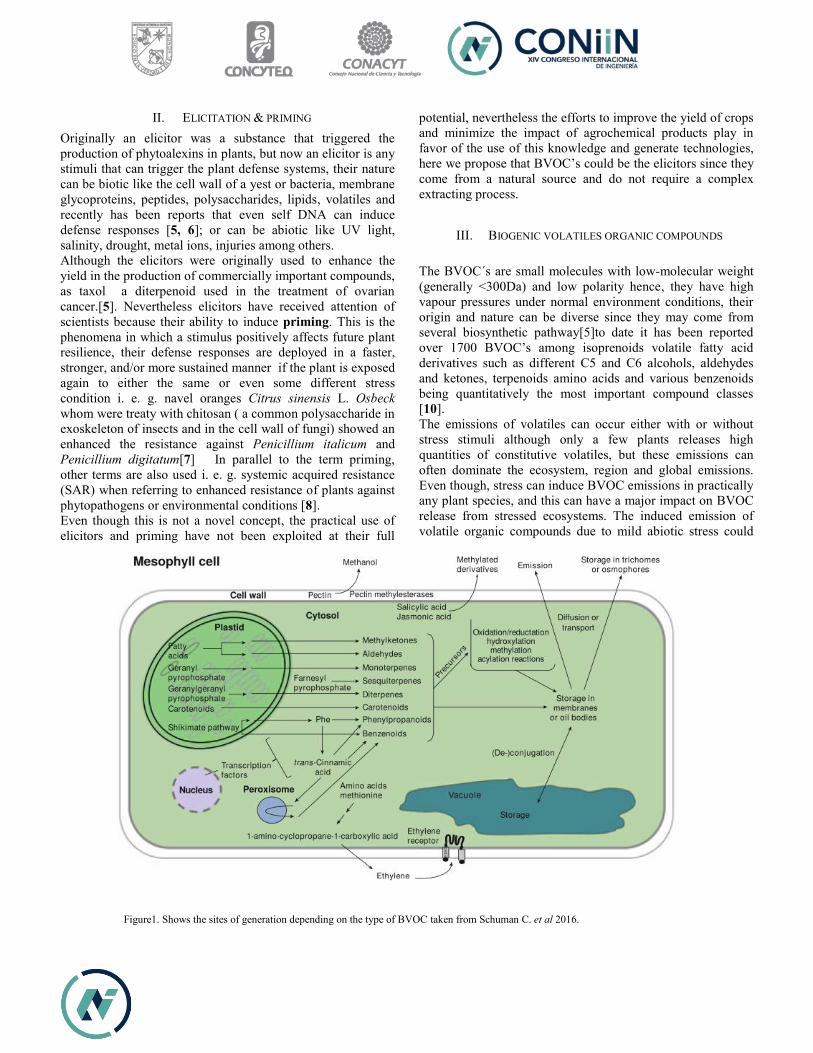
II. ELICITATION & PRIMING Originally an elicitor was a substance that triggered the production of phytoalexins in plants, but now an elicitor is any stimuli that can trigger the plant defense systems, their nature can be biotic like the cell wall of a yest or bacteria, membrane glycoproteins, peptides, polysaccharides, lipids, volatiles and recently has been reports that even self DNA can induce defense responses [5, 6]; or can be abiotic like UV light, salinity, drought, metal ions, injuries among others. Although the elicitors were originally used to enhance the yield in the production of commercially important compounds, as taxol a diterpenoid used in the treatment of ovarian cancer.[5]. Nevertheless elicitors have received attention of scientists because their ability to induce priming. This is the phenomena in which a stimulus positively affects future plant resilience, their defense responses are deployed in a faster, stronger, and/or more sustained manner if the plant is exposed again to either the same or even some different stress condition i. e. g. navel oranges Citrus sinensis L. Osbeck whom were treaty with chitosan ( a common polysaccharide in exoskeleton of insects and in the cell wall of fungi) showed an enhanced the resistance against Penicillium italicum and Penicillium digitatum[7] In parallel to the term priming, other terms are also used i. e. g. systemic acquired resistance (SAR) when referring to enhanced resistance of plants against phytopathogens or environmental conditions [8]. Even though this is not a novel concept, the practical use of elicitors and priming have not been exploited at their full
potential, nevertheless the efforts to improve the yield of crops and minimize the impact of agrochemical products play in favor of the use of this knowledge and generate technologies, here we propose that BVOC’s could be the elicitors since they come from a natural source and do not require a complex extracting process.
III. BIOGENIC VOLATILES ORGANIC COMPOUNDS
The BVOC´s are small molecules with low-molecular weight (generally <300Da) and low polarity hence, they have high vapour pressures under normal environment conditions, their origin and nature can be diverse since they may come from several biosynthetic pathway[5]to date it has been reported over 1700 BVOC’s among isoprenoids volatile fatty acid derivatives such as different C5 and C6 alcohols, aldehydes and ketones, terpenoids amino acids and various benzenoids being quantitatively the most important compound classes [10]. The emissions of volatiles can occur either with or without stress stimuli although only a few plants releases high quantities of constitutive volatiles, but these emissions can often dominate the ecosystem, region and global emissions. Even though, stress can induce BVOC emissions in practically any plant species, and this can have a major impact on BVOC release from stressed ecosystems. The induced emission of volatile organic compounds due to mild abiotic stress could
Figure1. Shows the sites of generation depending on the type of BVOC taken from Schuman C. et al 2016.
prime the defense responses of plants upon exposure to a biotic stress [12, 13] The liberation of these compounds depends on light temperature, the site of synthesis depend of the type of compound see Figure 2.
A. Terpenoids
This is the most diverse group of secondary metabolites. Also called isoprenoids are synthesized from isoprene a five carbon (5C) units derivate from two common 5C precursors, isopentenyl diphosphate (IPP) and dimetylallyl diphosphate (DMAPP). In higher plants two independent pathways are responsible for the formation of these isoprene units, the mevalonic acid pathway which results in volatile sesquiterpens (15C), whereas the isoprene units synthesized in the methylerythritol phosphate pathway leads the formation of volatile hemiterpenes (5C), monoterpenes (10C), or diterpenes (20C). The two different pathways are compartmentalized and separated, while MAV happens in the cytosol, endoplasmic reticulum and peroxisomes the MEP pathway occurs in the plastids. [10]. Monoterpenoids and sesquiterpenoids are generally volatile when not conjugated to polar or large (> 200 Da) moieties. Higher order terpenoids are generally not volatile. [14] In vivo the functions of terpenoids involve primary and secondary metabolism since binding with proteins so these become hydrophobic and participate as electron transporter, participate in the photosystem as carotenoids or protecting the plant from different abiotic stress among others. [14] These molecules also function as volatile messengers Marlies Riedlmeier et al. In 2017 reported that monoterpenes α-β pinene released by Arabidopsis thaliana induced the defense system en neighboring plants.
B. Phenylpropanoids and benzenoids
It´s estimated that this group constitutes the 20% of the BVOC´s and thus the second most diverse. These compounds are generated in the cytosol through the conversion of L- phenylalanine into trans-cinnamic acid via L-phenylalanine ammonia lyasa (PAL) further conversion of trans-cinnamic acid to other phenylpropanoids is shared with the lignin biosynthetic pathway through the steps of monolignol biosynthesis. Benzenoids originate from the same biosynthetic pathway, but the side chain of trans cinnamic acid is enzymatically shortened by two carbons. L -phenylalanine derivatives with a C2 side chain compete with phenylpropanoids and benzenoids for substrate and are synthesized via different pathways [7] It has been reported many function of l benzenoids since attractor molecules for pollinators, as a constituent of flavor, even involved in tritrophic relations attracting carnivores among others [9, 11, 15]
C. Amino acids derivates
These group is constituted by acids aldehydes, alcohols, esters, nitrogen and Sulphur containing BVSc’s derived from amino acids such as alanine, valine, leucine, isoleucine, and methionine, or intermediates in their biosynthesis, and contain nitrogen and sulfur but no L-phenylalanine, the synthesis of these compounds is conserved through bacteria and yest[7] these are synthesized when amino acids are deaminated or transaminated to form α -keto acids, which are carboxylate and may subsequently be reduced, oxidized or esterified. Amino acids may also be precursors for acyl coA molecules used in esterification reactions catalyzed by alcohol acyltransferases Ethylene is derived from methionine and thus belongs in this category [9].
These volatiles are involved in the scent and flavor of many fruits i.e.g. (2- and 3-methylbutanal, 3-methylbutanol derivate of isoleucine and leucine contribute positively to tomato flavor [16] Volatiles derived from amino acids are major contributors
to melon aroma. Both aromatic and non-aromatic varieties possess amino acid derived volatiles. In the aromatic varieties
these volatiles are mostly esterified, and their levels are usually higher than in the non-aromatic varieties. In the non-aromatic varieties, they occur as aldehydes and alcohols. [17]
D. Fatty acid derivates
These can be categorized in jasmonates, green leaf volatiles 6C and nine carbon volatile aldehydes alcohols and esters, these, arise from 18C unsaturated fatty acids, linoleic or linolenic fatty acid, which is deoxygenated either by a lipoxygenase (LOX) the lipoxygenase can act either over the 13C or the 9C which are further metabolized via the two branches of the LOX pathway yielding volatile compounds, Although for the formation of 6c and 9 C both compounds 9-hydroperoxy and 13-hydroperoxy are intermediaries the jasmonic acid pathway can only be synthesized from and 13-hydroperoxy.[11] The jasmonic acid, play a major role in the activation of downstream defense responses, and these can be triggered either by biotic and abiotic stress as herbivores, necrotrophic pathogens, nematodes and other micro-organism besides alleviating abiotic stresses including UV-stress, osmotic stress, salt stress, cold stress, temperature stress, heavy metal stress, ozone stress etc. [18]. GLV´s are triggered when the tissue is wounded, they are the reason of the characteristically odor of “cut grass”, they are important in the recognition of flavor components, serve to repel or attract herbivores and their natural enemies; and they can induce plant defenses or prime plants for enhanced defense against herbivores and pathogens and can have direct toxic effects on bacteria and fungi. Unlike other volatiles, GLVs are released almost instantly upon mechanical damage and abiotic stress and could thus function as an immediate and
informative signal for many organisms in the plant’s environment. [19]
IV. UPTAKING & SENSING
It has been reported that many plants react to the volatiles released by their neighbors, nevertheless the reasons of the releaser plant to “alert” their neighbors remain unclear because there have not been identified benefits to justify the metabolic expense that this implies. On the other hand it has been hypothesized that the liberation of the volatiles is just the response against hostility and the neighboring plants use them as a cue to prepare themselves against a possible threat [20]. The transport of volatiles form the environment to their site of action has often been discussed in the context of the toxicological effects of volatile pollutants in the atmosphere, and it has been described that plants take up volatiles through the stomata and by adsorption on the leaf surface and that the efficiency of transdermal uptake from the air depends on the proper ties of each volatile compound, such as hydrophobicity and molecular weight, implying that the uptake is a physicochemical process[21,22]. In order that a cell responds to a volatile “call” it has to be able to “hear” it, usually this should occur by the intervention of membrane receptors, but to date there have not been reports of novel receptors other than those for ET and JA that are also phytohormones, nevertheless it is hypothesized that due their low polarity volatiles can cross through plasmatic membrane and interfere in the chemical balance of the current biochemical process [22].
V. CONCLUTIONS
Although there are several unanswered questions about the mechanisms involved in the releasing, storing, sensing and the general effects of BVOC´s for their use as an elicitor, the interest in the concept of priming through natural compounds is gaining ground, and would become an interesting tool to face the coming food crisis.
ACKNOWLEDGMENT We thank to the Universidad Autónoma de Querétaro and
CONACYT for the support to carry this research
REFERENCES
[1] Naghmeh Nejat and Nitin Mantri Plant Immune System: Crosstalk Between Responses to Biotic and Abiotic Stresses the Missing Link in Understanding Plant Defence Curr. Issues Mol. Biol. 23: 1-16. 2017
[2] T. Koeduka, K. Sugimoto, B. Watanabe, N. Someya, D. Kawanishi, T. Gotoh, R. Ozawa, J. Takabayashi, K. Matsui & J. Hiratake Bioactivity of naturalO-prenylated phenylpropenes fromIllicium anisatumleaves and their derivatives against spidermites and fungal pathogens Plant Biology 16 (2014) 451–456 2013
[3] Johan A. Stenberg, Martin Heil, Inger Åhman, and Christer Björkman; Optimizing Crops for Biocontrol of Pests and Disease; Trends in Plant Science, Vol. 20, No.11 2015.
[4] L. Gilbert , D. Johnson Plant-Plant Communication Through Common Mycorrhizal Networks dvances in Botanical Research, Volume 82 83-97 (2017)
[5] Romeo Radman, Teresa Saez, Christopher Bucke and Tajalli Keshavarz; Elicitation of plants and microbial cell systems Biotechnol. Appl. Biochem. 37, 91–102 (Printed in Great Britain) (2003)
[6] Dalia Duran-Flores, Martin Heil ; (DAMP) Extracellular self-DNA as a damage-associated molecular pattern that triggers self-specific immunity induction in plants Brain Behav. Immun. (2017).
[7] Kaifang Zeng Yuyan Denga Jian Minga Lili Denga; Induction of disease resistance and ROS metabolism in navel oranges by chitosan Scientia Horticulturae; Volume 126, Issue 2, , Pages 223-228 (2010)
[8] Uwe Conrath, Gerold J.M. Beckers, Caspar J.G. Langenbach, and Michal R. Jaskiewicz Priming for Enhanced Defense; Annu. Rev. Phytopathol. 53:97–119 (2015)
[9] Schuman C. Meredith; Valim A. Henrique and Joo Youngsung Termporary dynamics of plant volatiles: mechanistics bases and functional consequences James D. Blande, Robert Glinwood Editors Deciphering Chemical Language of plant Communication.3-34 Switzerland Springer 2016
[10] Lucian Copolovici and U¨lo Niinemets; Environmental Impacts on Plant Volatile Emission consequences James D. Blande, Robert Glinwood Editors Deciphering Chemical Language of plant Communication.3-34 Switzerland Springer 2016
[11] Natalia Dudareva , Antje Klempien , Jo € elle K. Muhlemann and Ian Kaplan Biosynthesis, function and metabolic engineering of plant volatile organic compounds New Phytologist 198: 16–32 (2013)
[12] Stefania Caparrotta, Sara Boni, Cosimo Taiti, Emily Palm, Stefano Mancuso, Camilla Pandolfi; Induction of priming by salt stress in neighboring plants Environmental and Experimental Botany 147 261–270 (2018)
[13] Martin Heil and Juan Carlos Silva Bueno Within-plant signaling by volatiles leads to induction and priming of an indirect plant defense in nature; PNAS, vol. 104 no. 13 5467–5472 (2007)
[14] Eran Pichersky and Robert A. Raguso Why do plants produce so many terpenoid compounds? New Phytologist (2016)
[15] Uta Effmert, Sandra Saschenbrecker, Jeannine Ross, Florence Negre, Chris M. Fraser, Joseph P. Noel, Natalia Dudareva, Birgit Piechulla Floral benzenoid carboxyl methyltransferases: From in vitro to in planta function Phytochemistry 66 1211–1230 (2005)
[16] Stephen A. Goff and Harry J. Klee Plant Volatile Compounds: Sensory Cues for Health and Nutritional Value? SCIENCE VOL 311 815-819 (2006)
[17] Muna Ahmed Mohamed El Hadi, Feng-Jie Zhang, Fei-Fei Wu, Chun-Hua Zhou * and Jun Tao Advances in Fruit Aroma Volatile Research Molecules , 18 8200-8229 (2013)
[18] Tariq Ahmad Dar , Moin Uddin, M. Masroor A. Khan, K. R. Hakeem, Hassan jaleel; Jasmonates counter plant stress: A Review Environmental and Experimental Botany Volume 115, Pages 49-57 (2015)
[19] Maarten Ameye, Silke Allmann, Jan Verwaeren, Guy Smagghe, Geert Haesaert, Robert C. Schuurink and Kris Audenaert Green leaf volatile production by plants: a meta-analysis New Phytologist (2017)
[20] Martin Heil and Richard Karban; Explaining evolution of plant communication by airborne signals; Trends in Ecology and Evolution Vol.25 No.3 (2010)

[21] Kenji Matsui; A Portion of plant airborne communication is endorsed by uptake and metabolism of volatile organic compounds; Current Opinion In Plant Biology, 32:24–30 (2016)
[22] Koichi Sugimoto, Kenji Matsui, and Junji Takabayashi Uptake and Conversion of VolatileCompounds in Plant–Plant Communication;
James D. Blande, Robert Glinwood Editors Deciphering Chemical Language of plant Communication.3-34 Switzerland Springer 2016
[23]
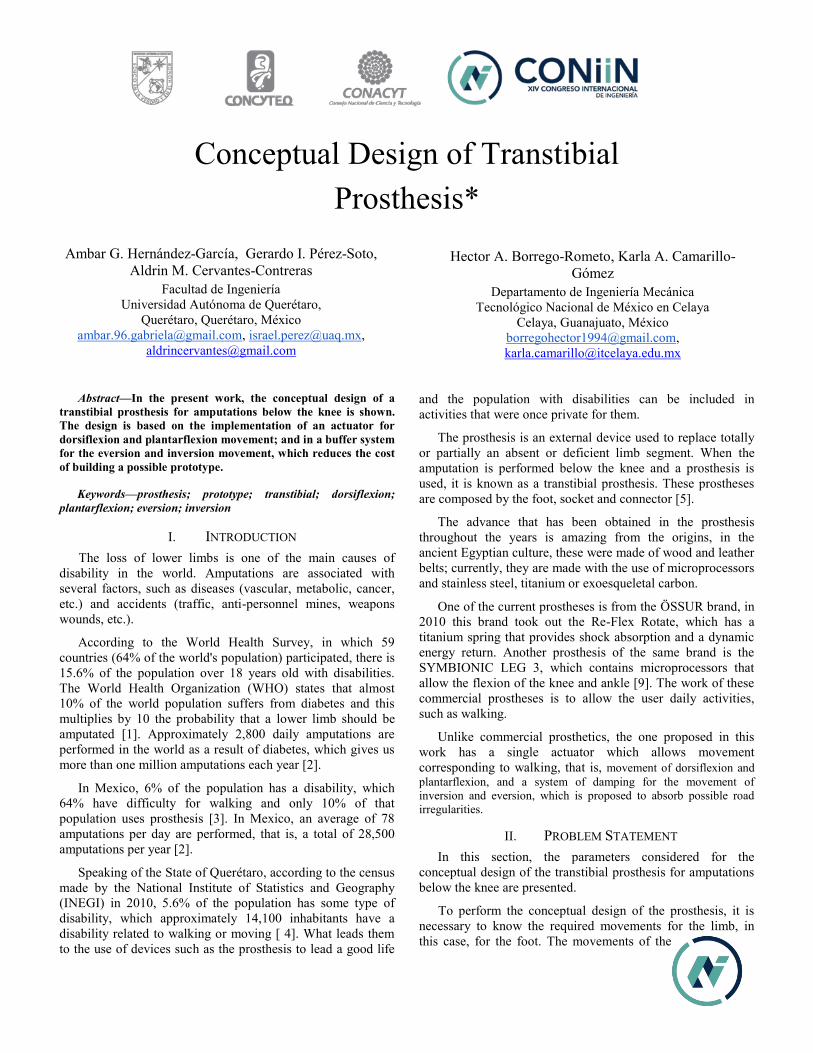
Conceptual Design of Transtibial Prosthesis*
Ambar G. Hernández-García, Gerardo I. Pérez-Soto, Aldrin M. Cervantes-Contreras
Facultad de Ingeniería Universidad Autónoma de Querétaro,
Querétaro, Querétaro, México [email protected], [email protected],
Hector A. Borrego-Rometo, Karla A. Camarillo-Gómez
Departamento de Ingeniería Mecánica Tecnológico Nacional de México en Celaya
Celaya, Guanajuato, México [email protected], [email protected]
Abstract—In the present work, the conceptual design of a transtibial prosthesis for amputations below the knee is shown. The design is based on the implementation of an actuator for dorsiflexion and plantarflexion movement; and in a buffer system for the eversion and inversion movement, which reduces the cost of building a possible prototype.
Keywords—prosthesis; prototype; transtibial; dorsiflexion; plantarflexion; eversion; inversion
I. INTRODUCTION The loss of lower limbs is one of the main causes of
disability in the world. Amputations are associated with several factors, such as diseases (vascular, metabolic, cancer, etc.) and accidents (traffic, anti-personnel mines, weapons wounds, etc.).
According to the World Health Survey, in which 59 countries (64% of the world's population) participated, there is 15.6% of the population over 18 years old with disabilities. The World Health Organization (WHO) states that almost 10% of the world population suffers from diabetes and this multiplies by 10 the probability that a lower limb should be amputated [1]. Approximately 2,800 daily amputations are performed in the world as a result of diabetes, which gives us more than one million amputations each year [2].
In Mexico, 6% of the population has a disability, which 64% have difficulty for walking and only 10% of that population uses prosthesis [3]. In Mexico, an average of 78 amputations per day are performed, that is, a total of 28,500 amputations per year [2].
Speaking of the State of Querétaro, according to the census made by the National Institute of Statistics and Geography (INEGI) in 2010, 5.6% of the population has some type of disability, which approximately 14,100 inhabitants have a disability related to walking or moving [ 4]. What leads them to the use of devices such as the prosthesis to lead a good life
and the population with disabilities can be included in activities that were once private for them.
The prosthesis is an external device used to replace totally or partially an absent or deficient limb segment. When the amputation is performed below the knee and a prosthesis is used, it is known as a transtibial prosthesis. These prostheses are composed by the foot, socket and connector [5].
The advance that has been obtained in the prosthesis throughout the years is amazing from the origins, in the ancient Egyptian culture, these were made of wood and leather belts; currently, they are made with the use of microprocessors and stainless steel, titanium or exoesqueletal carbon.
One of the current prostheses is from the ÖSSUR brand, in 2010 this brand took out the Re-Flex Rotate, which has a titanium spring that provides shock absorption and a dynamic energy return. Another prosthesis of the same brand is the SYMBIONIC LEG 3, which contains microprocessors that allow the flexion of the knee and ankle [9]. The work of these commercial prostheses is to allow the user daily activities, such as walking.
Unlike commercial prosthetics, the one proposed in this work has a single actuator which allows movement corresponding to walking, that is, movement of dorsiflexion and plantarflexion, and a system of damping for the movement of inversion and eversion, which is proposed to absorb possible road irregularities.
II. PROBLEM STATEMENT In this section, the parameters considered for the
conceptual design of the transtibial prosthesis for amputations below the knee are presented.
To perform the conceptual design of the prosthesis, it is necessary to know the required movements for the limb, in this case, for the foot. The movements of the
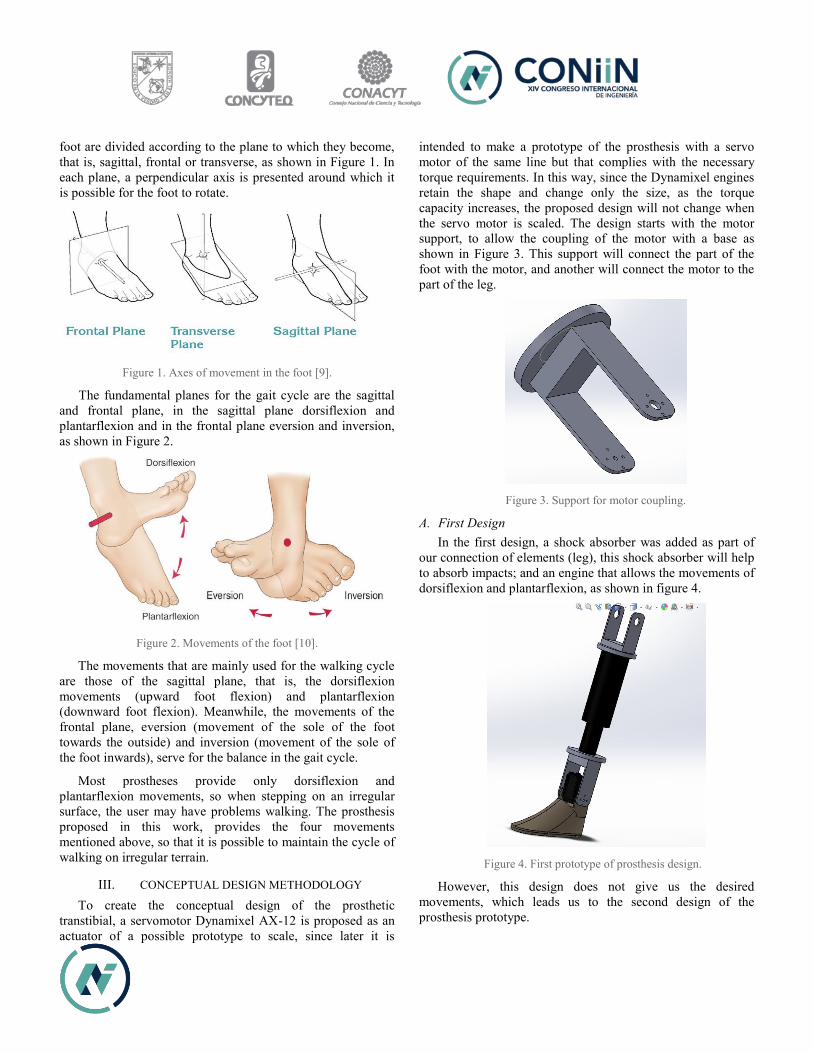
foot are divided according to the plane to which they become, that is, sagittal, frontal or transverse, as shown in Figure 1. In each plane, a perpendicular axis is presented around which it is possible for the foot to rotate.
Figure 1. Axes of movement in the foot [9].
The fundamental planes for the gait cycle are the sagittal and frontal plane, in the sagittal plane dorsiflexion and plantarflexion and in the frontal plane eversion and inversion, as shown in Figure 2.
Figure 2. Movements of the foot [10].
The movements that are mainly used for the walking cycle are those of the sagittal plane, that is, the dorsiflexion movements (upward foot flexion) and plantarflexion (downward foot flexion). Meanwhile, the movements of the frontal plane, eversion (movement of the sole of the foot towards the outside) and inversion (movement of the sole of the foot inwards), serve for the balance in the gait cycle.
Most prostheses provide only dorsiflexion and plantarflexion movements, so when stepping on an irregular surface, the user may have problems walking. The prosthesis proposed in this work, provides the four movements mentioned above, so that it is possible to maintain the cycle of walking on irregular terrain.
III. CONCEPTUAL DESIGN METHODOLOGY To create the conceptual design of the prosthetic
transtibial, a servomotor Dynamixel AX-12 is proposed as an actuator of a possible prototype to scale, since later it is
intended to make a prototype of the prosthesis with a servo motor of the same line but that complies with the necessary torque requirements. In this way, since the Dynamixel engines retain the shape and change only the size, as the torque capacity increases, the proposed design will not change when the servo motor is scaled. The design starts with the motor support, to allow the coupling of the motor with a base as shown in Figure 3. This support will connect the part of the foot with the motor, and another will connect the motor to the part of the leg.
Figure 3. Support for motor coupling.
A. First Design In the first design, a shock absorber was added as part of
our connection of elements (leg), this shock absorber will help to absorb impacts; and an engine that allows the movements of dorsiflexion and plantarflexion, as shown in figure 4.
Figure 4. First prototype of prosthesis design.
However, this design does not give us the desired movements, which leads us to the second design of the prosthesis prototype.

B. Second Design In the second design we decided to add two shock
absorbers to obtain the movement of the frontal plane, that is, the eversion and inversion movement; and the motor was left to allow the movement of the sagittal plane, as we can see in figure 5.
Figure 5. Second prototype of prosthesis design.
Even with the fact of with the help of the shock absorbers, it was sought to have the required movements; the design does not contain the necessary piece to allow the free movement of the frontal plane. So to improve the design we have to add a piece that allows such degrees of freedom and have the movements that we are looking for, which leads us to a third design.
C. Final Design In the final design, a different support of figure 3 was
added, this new support contains extra limbs, as shown in figure 6.
Figure 6. Support for the coupling of the third design.
With this new limb and with the help of a Hooke joint, the coupling between the motor, the foot, and the shock absorbers is achieved, as well as the coupling between the motor, the
connection element and the shock absorbers; which achieves the desired movement for the frontal plane, as we can see in figure 7.
Figure 7. Third prototype of prosthesis design.
IV. CONCLUSIONS With this new limb and with the help of a Hooke joint, the
coupling between the motor, the foot, and the shock absorbers is achieved, as well as the coupling between the motor, the connection element and the shock absorbers; which achieves the desired movement for the frontal plane, as we can see in figure 7.
REFERENCES [1] OMS. (2013). Estadísticas sanitarias mundiales 2013: Una mina
de información sobre salud pública mundial. Geneva: Organización Mundial de la Salud.
[2] Gutiérrez, A. (2014). Amputaciones de extremidades. ¿Van a la alza?. ANGIOLOGIA, 42(3), pp 112-114
[3] INEGI. (2014). Marco conceptual de la entrevistadora de la Encuesta Nacional de la Dinámica Demográfica 2014. México, Aguascalientes: INEGI.
[4] INEGI. (2015). Anuario estadístico y geográfico de Querétaro. [5] Luis, B. J. (2010) Diccionario enciclopédico del
estudiante.Diccionario enciclopédico del estudiante. [6] Gómez, J. (2006). Las Prótesis: Restauración del Individuo, de
CONACYT. [7] Esperanza Camargo C. (2012). Respuesta a carga de una prótesis
transtibial con elementos infinitos durante el apoyo y balanceo, (C. Casallas, Ed.) Visión Electrónica, 6(2), 92.
[8] OSSUR. (2010). Re-Flex Rotate. Site web: https://www.ossur.es/soluciones-protesicas/productos/impact-solutions/re-flexrotate
[9] Don Buethorn, CPO. Tibial Varum: Recognizing its presence and accommodating it in bracing, of Cascade DAFO, Inc.
[10] Orchard Health Clinic. (2015). Osteopathy Singapore.
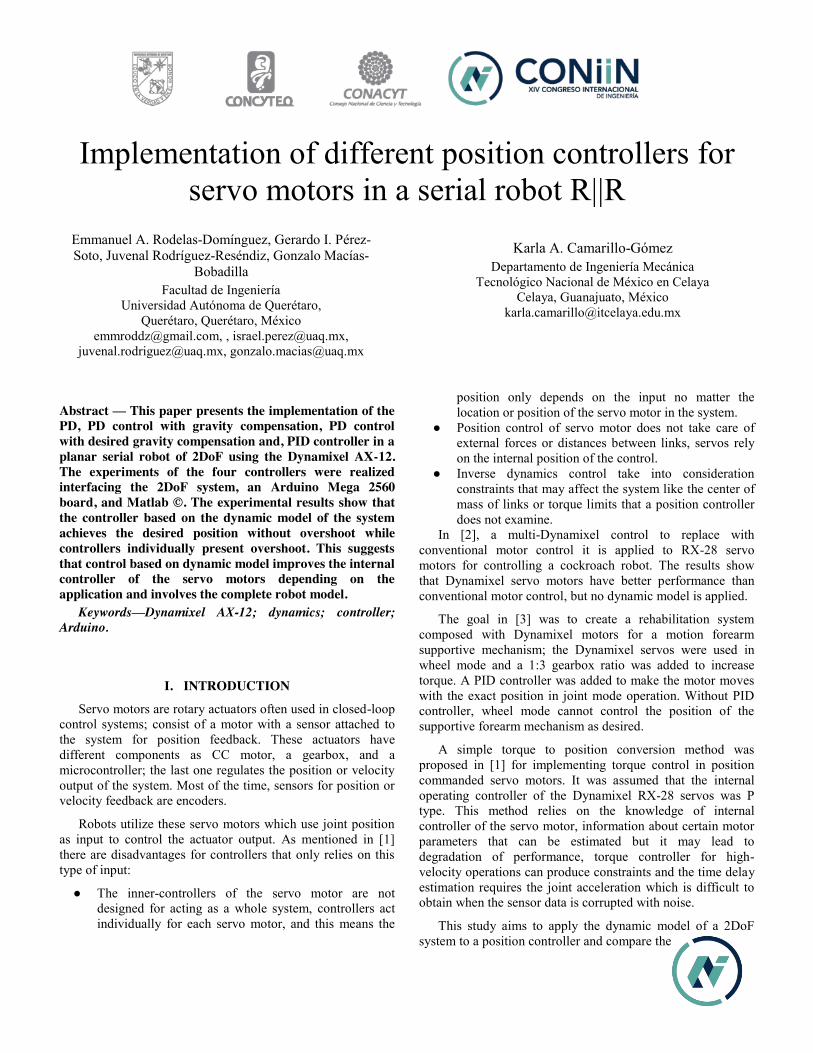
Implementation of different position controllers for servo motors in a serial robot R||R
Emmanuel A. Rodelas-Domínguez, Gerardo I. Pérez-Soto, Juvenal Rodríguez-Reséndiz, Gonzalo Macías-
Bobadilla Facultad de Ingeniería
Universidad Autónoma de Querétaro, Querétaro, Querétaro, México
[email protected], , [email protected], [email protected], [email protected]
Karla A. Camarillo-Gómez Departamento de Ingeniería Mecánica
Tecnológico Nacional de México en Celaya Celaya, Guanajuato, México
Abstract — This paper presents the implementation of the PD, PD control with gravity compensation, PD control with desired gravity compensation and, PID controller in a planar serial robot of 2DoF using the Dynamixel AX-12. The experiments of the four controllers were realized interfacing the 2DoF system, an Arduino Mega 2560 board, and Matlab ©. The experimental results show that the controller based on the dynamic model of the system achieves the desired position without overshoot while controllers individually present overshoot. This suggests that control based on dynamic model improves the internal controller of the servo motors depending on the application and involves the complete robot model.
Keywords—Dynamixel AX-12; dynamics; controller; Arduino.
I. INTRODUCTION
Servo motors are rotary actuators often used in closed-loop control systems; consist of a motor with a sensor attached to the system for position feedback. These actuators have different components as CC motor, a gearbox, and a microcontroller; the last one regulates the position or velocity output of the system. Most of the time, sensors for position or velocity feedback are encoders.
Robots utilize these servo motors which use joint position as input to control the actuator output. As mentioned in [1] there are disadvantages for controllers that only relies on this type of input:
● The inner-controllers of the servo motor are not designed for acting as a whole system, controllers act individually for each servo motor, and this means the
position only depends on the input no matter the location or position of the servo motor in the system.
● Position control of servo motor does not take care of external forces or distances between links, servos rely on the internal position of the control.
● Inverse dynamics control take into consideration constraints that may affect the system like the center of mass of links or torque limits that a position controller does not examine.
In [2], a multi-Dynamixel control to replace with conventional motor control it is applied to RX-28 servo motors for controlling a cockroach robot. The results show that Dynamixel servo motors have better performance than conventional motor control, but no dynamic model is applied.
The goal in [3] was to create a rehabilitation system composed with Dynamixel motors for a motion forearm supportive mechanism; the Dynamixel servos were used in wheel mode and a 1:3 gearbox ratio was added to increase torque. A PID controller was added to make the motor moves with the exact position in joint mode operation. Without PID controller, wheel mode cannot control the position of the supportive forearm mechanism as desired.
A simple torque to position conversion method was proposed in [1] for implementing torque control in position commanded servo motors. It was assumed that the internal operating controller of the Dynamixel RX-28 servos was P type. This method relies on the knowledge of internal controller of the servo motor, information about certain motor parameters that can be estimated but it may lead to degradation of performance, torque controller for high-velocity operations can produce constraints and the time delay estimation requires the joint acceleration which is difficult to obtain when the sensor data is corrupted with noise.
This study aims to apply the dynamic model of a 2DoF system to a position controller and compare the
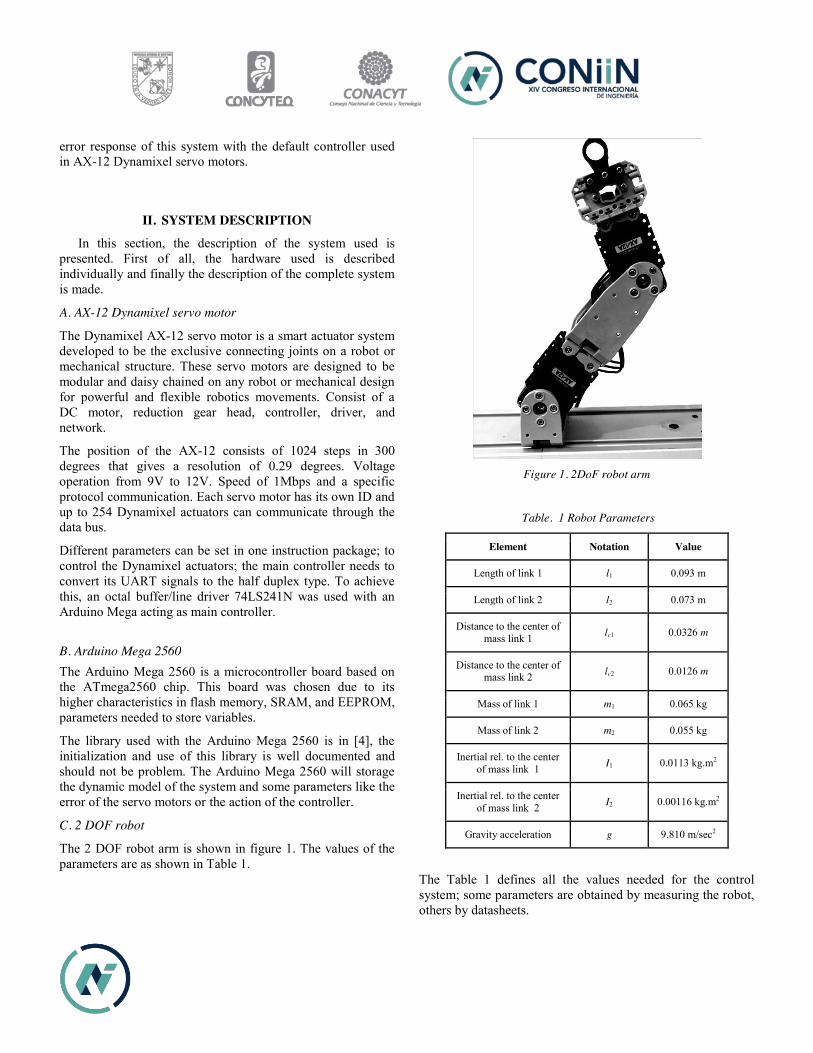
error response of this system with the default controller used in AX-12 Dynamixel servo motors.
II. SYSTEM DESCRIPTION
In this section, the description of the system used is presented. First of all, the hardware used is described individually and finally the description of the complete system is made.
A. AX-12 Dynamixel servo motor
The Dynamixel AX-12 servo motor is a smart actuator system developed to be the exclusive connecting joints on a robot or mechanical structure. These servo motors are designed to be modular and daisy chained on any robot or mechanical design for powerful and flexible robotics movements. Consist of a DC motor, reduction gear head, controller, driver, and network.
The position of the AX-12 consists of 1024 steps in 300 degrees that gives a resolution of 0.29 degrees. Voltage operation from 9V to 12V. Speed of 1Mbps and a specific protocol communication. Each servo motor has its own ID and up to 254 Dynamixel actuators can communicate through the data bus.
Different parameters can be set in one instruction package; to control the Dynamixel actuators; the main controller needs to convert its UART signals to the half duplex type. To achieve this, an octal buffer/line driver 74LS241N was used with an Arduino Mega acting as main controller.
B. Arduino Mega 2560 The Arduino Mega 2560 is a microcontroller board based on the ATmega2560 chip. This board was chosen due to its higher characteristics in flash memory, SRAM, and EEPROM, parameters needed to store variables.
The library used with the Arduino Mega 2560 is in [4], the initialization and use of this library is well documented and should not be problem. The Arduino Mega 2560 will storage the dynamic model of the system and some parameters like the error of the servo motors or the action of the controller.
C. 2 DOF robot
The 2 DOF robot arm is shown in figure 1. The values of the parameters are as shown in Table 1.
Figure 1. 2DoF robot arm
Table. 1 Robot Parameters
Element Notation Value
Length of link 1 l1 0.093 m
Length of link 2 l2 0.073 m
Distance to the center of mass link 1 lc1 0.0326 m
Distance to the center of mass link 2 lc2 0.0126 m
Mass of link 1 m1 0.065 kg
Mass of link 2 m2 0.055 kg
Inertial rel. to the center of mass link 1 I1 0.0113 kg.m2
Inertial rel. to the center of mass link 2 I2 0.00116 kg.m2
Gravity acceleration g 9.810 m/sec2
The Table 1 defines all the values needed for the control system; some parameters are obtained by measuring the robot, others by datasheets.
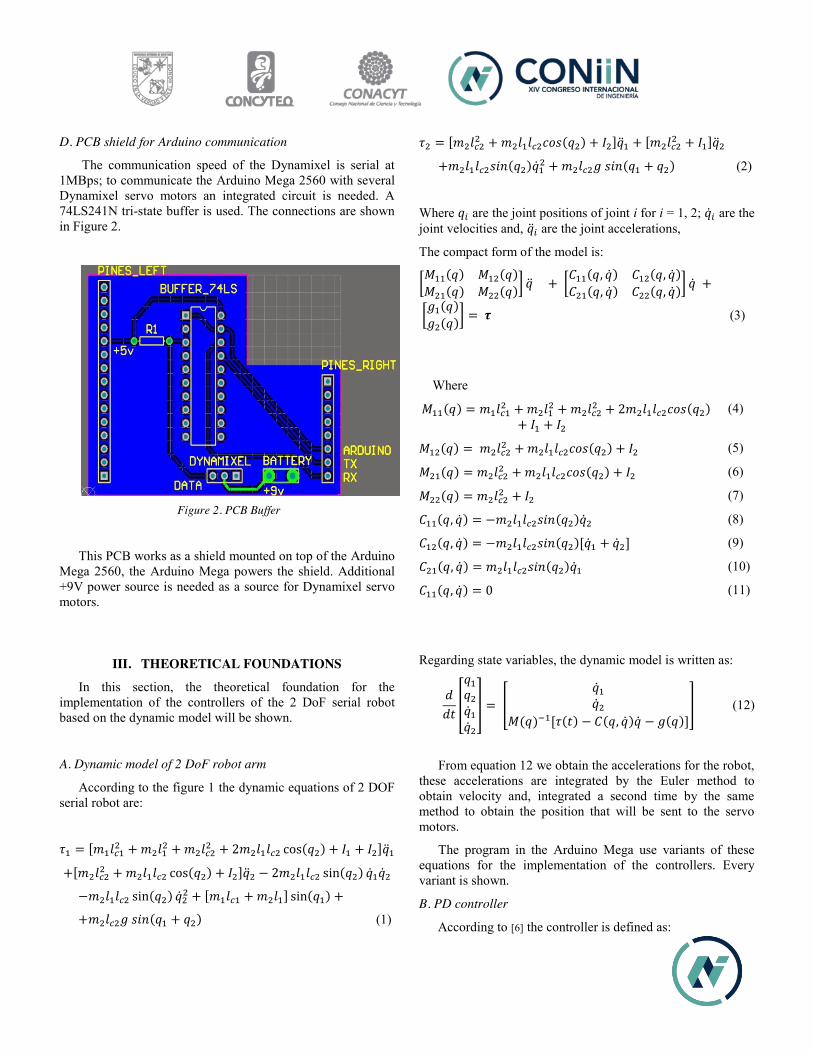
D. PCB shield for Arduino communication
The communication speed of the Dynamixel is serial at 1MBps; to communicate the Arduino Mega 2560 with several Dynamixel servo motors an integrated circuit is needed. A 74LS241N tri-state buffer is used. The connections are shown in Figure 2.
Figure 2. PCB Buffer
This PCB works as a shield mounted on top of the Arduino Mega 2560, the Arduino Mega powers the shield. Additional +9V power source is needed as a source for Dynamixel servo motors.
III. THEORETICAL FOUNDATIONS
In this section, the theoretical foundation for the implementation of the controllers of the 2 DoF serial robot based on the dynamic model will be shown.
A. Dynamic model of 2 DoF robot arm
According to the figure 1 the dynamic equations of 2 DOF serial robot are:
(1)
(2)
Where are the joint positions of joint i for i = 1, 2; are the joint velocities and, are the joint accelerations,
The compact form of the model is:
(3)
Where
(4)
(5)
(6)
(7)
(8)
(9)
(10)
(11)
Regarding state variables, the dynamic model is written as:
(12)
From equation 12 we obtain the accelerations for the robot, these accelerations are integrated by the Euler method to obtain velocity and, integrated a second time by the same method to obtain the position that will be sent to the servo motors.
The program in the Arduino Mega use variants of these equations for the implementation of the controllers. Every variant is shown.
B. PD controller
According to [6] the controller is defined as:
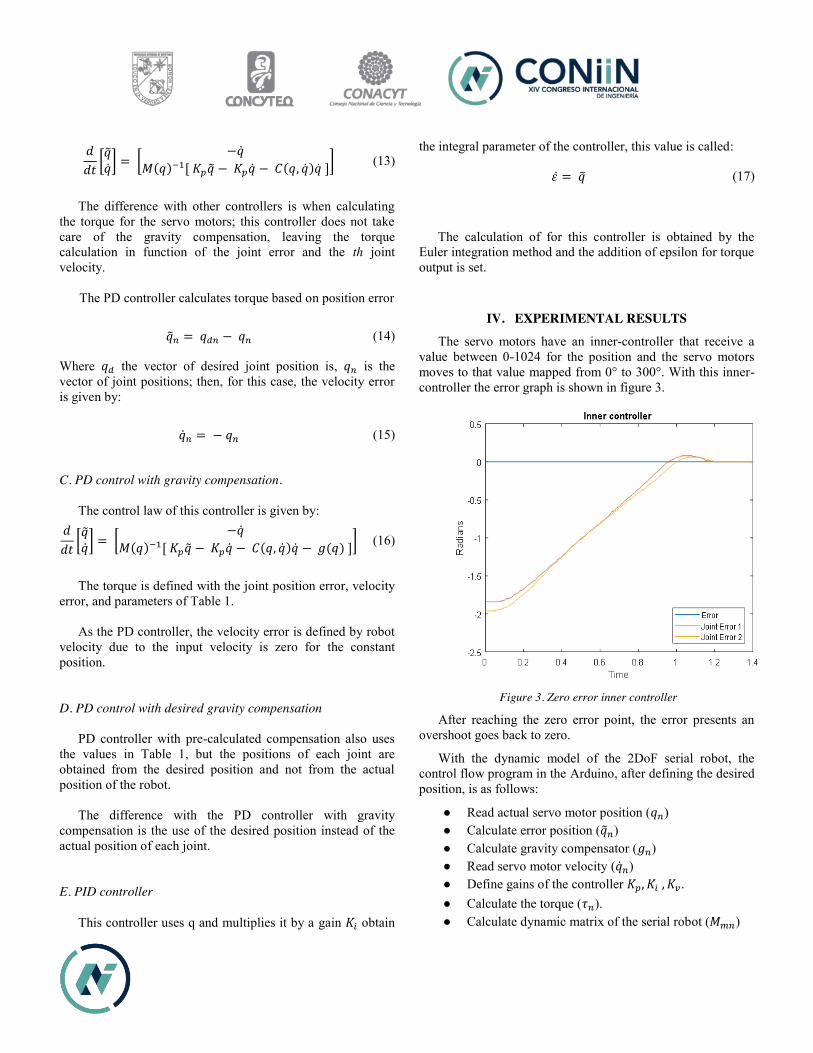
(13)
The difference with other controllers is when calculating
the torque for the servo motors; this controller does not take care of the gravity compensation, leaving the torque calculation in function of the joint error and the th joint velocity.
The PD controller calculates torque based on position error
(14)
Where the vector of desired joint position is, is the vector of joint positions; then, for this case, the velocity error is given by:
(15)
C. PD control with gravity compensation.
The control law of this controller is given by:
(16)
The torque is defined with the joint position error, velocity
error, and parameters of Table 1.
As the PD controller, the velocity error is defined by robot velocity due to the input velocity is zero for the constant position. D. PD control with desired gravity compensation
PD controller with pre-calculated compensation also uses the values in Table 1, but the positions of each joint are obtained from the desired position and not from the actual position of the robot.
The difference with the PD controller with gravity
compensation is the use of the desired position instead of the actual position of each joint.
E. PID controller
This controller uses q and multiplies it by a gain obtain
the integral parameter of the controller, this value is called:
(17)
The calculation of for this controller is obtained by the Euler integration method and the addition of epsilon for torque output is set.
IV. EXPERIMENTAL RESULTS The servo motors have an inner-controller that receive a
value between 0-1024 for the position and the servo motors moves to that value mapped from 0° to 300°. With this inner-controller the error graph is shown in figure 3.
Figure 3. Zero error inner controller
After reaching the zero error point, the error presents an overshoot goes back to zero.
With the dynamic model of the 2DoF serial robot, the control flow program in the Arduino, after defining the desired position, is as follows:
● Read actual servo motor position ( ) ● Calculate error position ( ) ● Calculate gravity compensator ( ) ● Read servo motor velocity ( ) ● Define gains of the controller . ● Calculate the torque ( ). ● Calculate dynamic matrix of the serial robot ( )
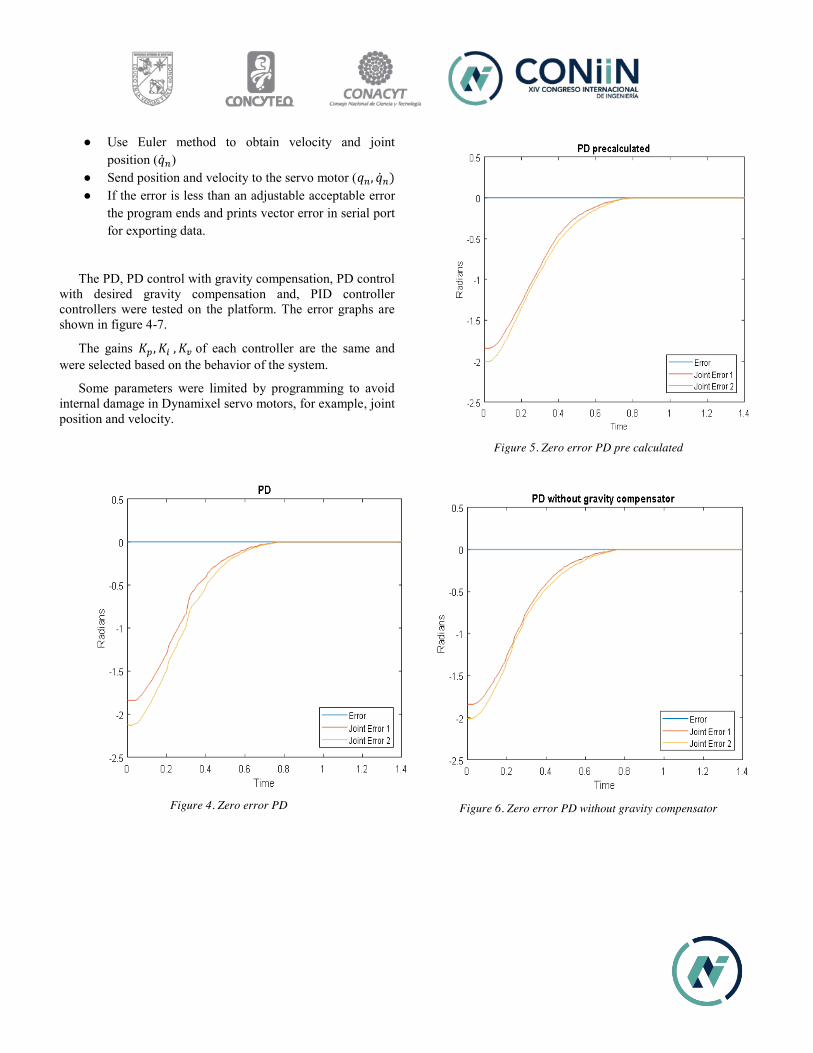
● Use Euler method to obtain velocity and joint position ( )
● Send position and velocity to the servo motor ( ● If the error is less than an adjustable acceptable error
the program ends and prints vector error in serial port for exporting data.
The PD, PD control with gravity compensation, PD control with desired gravity compensation and, PID controller controllers were tested on the platform. The error graphs are shown in figure 4-7.
The gains of each controller are the same and were selected based on the behavior of the system.
Some parameters were limited by programming to avoid internal damage in Dynamixel servo motors, for example, joint position and velocity.
Figure 4. Zero error PD
Figure 5. Zero error PD pre calculated
Figure 6. Zero error PD without gravity compensator
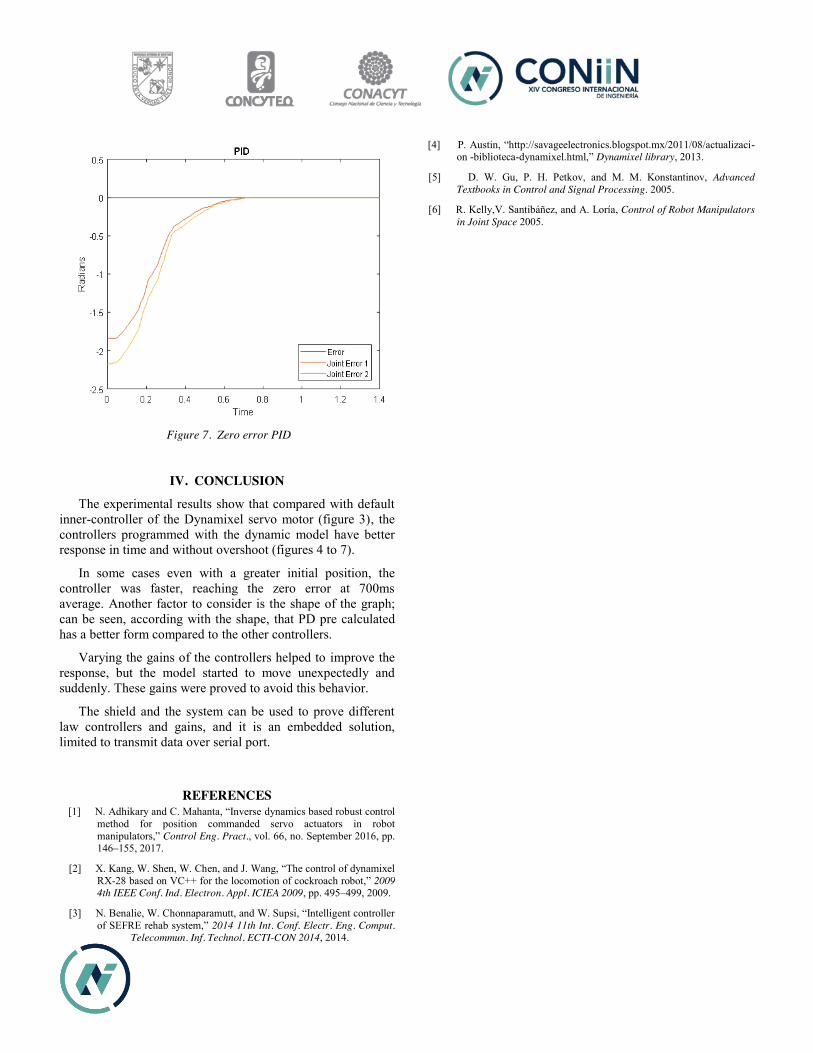
Figure 7. Zero error PID
IV. CONCLUSION
The experimental results show that compared with default inner-controller of the Dynamixel servo motor (figure 3), the controllers programmed with the dynamic model have better response in time and without overshoot (figures 4 to 7).
In some cases even with a greater initial position, the controller was faster, reaching the zero error at 700ms average. Another factor to consider is the shape of the graph; can be seen, according with the shape, that PD pre calculated has a better form compared to the other controllers.
Varying the gains of the controllers helped to improve the response, but the model started to move unexpectedly and suddenly. These gains were proved to avoid this behavior.
The shield and the system can be used to prove different law controllers and gains, and it is an embedded solution, limited to transmit data over serial port.
REFERENCES [1] N. Adhikary and C. Mahanta, “Inverse dynamics based robust control
method for position commanded servo actuators in robot manipulators,” Control Eng. Pract., vol. 66, no. September 2016, pp. 146–155, 2017.
[2] X. Kang, W. Shen, W. Chen, and J. Wang, “The control of dynamixel RX-28 based on VC++ for the locomotion of cockroach robot,” 2009 4th IEEE Conf. Ind. Electron. Appl. ICIEA 2009, pp. 495–499, 2009.
[3] N. Benalie, W. Chonnaparamutt, and W. Supsi, “Intelligent controller of SEFRE rehab system,” 2014 11th Int. Conf. Electr. Eng. Comput.
Telecommun. Inf. Technol. ECTI-CON 2014, 2014.
[4] P. Austin, “http://savageelectronics.blogspot.mx/2011/08/actualizaci- on -biblioteca-dynamixel.html,” Dynamixel library, 2013.
[5] D. W. Gu, P. H. Petkov, and M. M. Konstantinov, Advanced Textbooks in Control and Signal Processing. 2005.
[6] R. Kelly,V. Santibáñez, and A. Loría, Control of Robot Manipulators in Joint Space 2005.
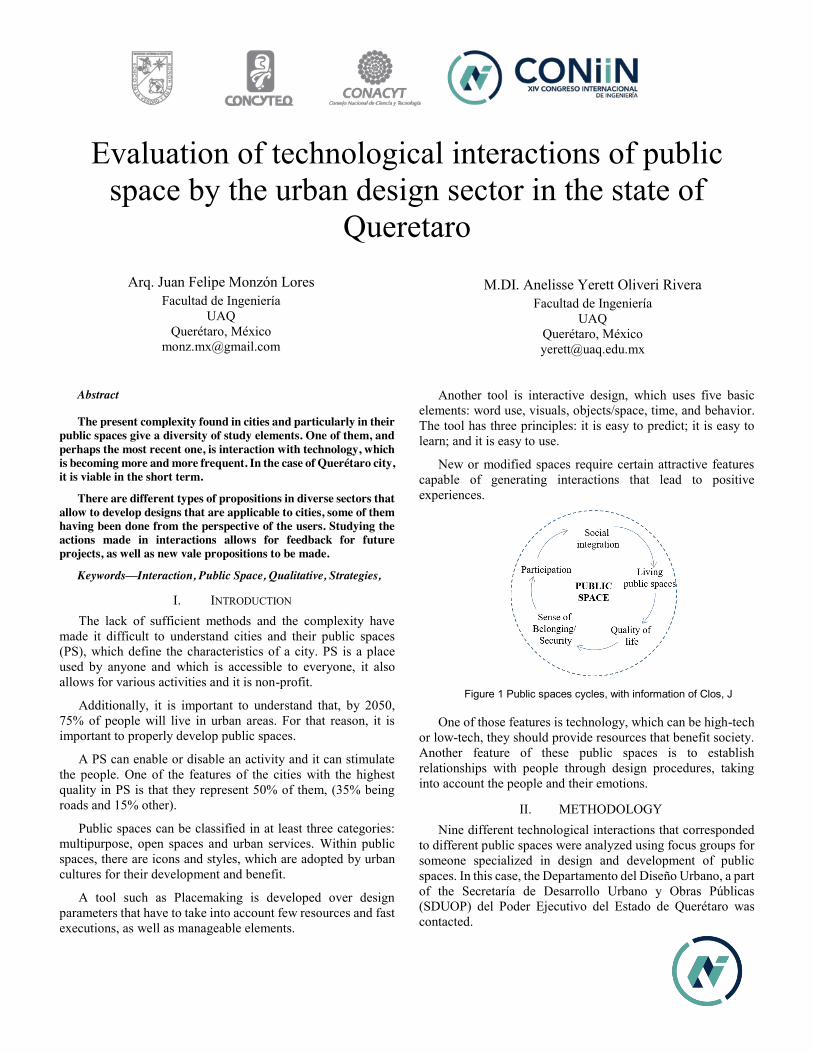
Evaluation of technological interactions of public space by the urban design sector in the state of
Queretaro Arq. Juan Felipe Monzón Lores
Facultad de Ingeniería UAQ
Querétaro, México [email protected]
M.DI. Anelisse Yerett Oliveri Rivera Facultad de Ingeniería
UAQ Querétaro, México [email protected]
Abstract
The present complexity found in cities and particularly in their public spaces give a diversity of study elements. One of them, and perhaps the most recent one, is interaction with technology, which is becoming more and more frequent. In the case of Querétaro city, it is viable in the short term.
There are different types of propositions in diverse sectors that allow to develop designs that are applicable to cities, some of them having been done from the perspective of the users. Studying the actions made in interactions allows for feedback for future projects, as well as new vale propositions to be made.
Keywords—Interaction, Public Space, Qualitative, Strategies,
I. INTRODUCTION The lack of sufficient methods and the complexity have
made it difficult to understand cities and their public spaces (PS), which define the characteristics of a city. PS is a place used by anyone and which is accessible to everyone, it also allows for various activities and it is non-profit.
Additionally, it is important to understand that, by 2050, 75% of people will live in urban areas. For that reason, it is important to properly develop public spaces.
A PS can enable or disable an activity and it can stimulate the people. One of the features of the cities with the highest quality in PS is that they represent 50% of them, (35% being roads and 15% other).
Public spaces can be classified in at least three categories: multipurpose, open spaces and urban services. Within public spaces, there are icons and styles, which are adopted by urban cultures for their development and benefit.
A tool such as Placemaking is developed over design parameters that have to take into account few resources and fast executions, as well as manageable elements.
Another tool is interactive design, which uses five basic elements: word use, visuals, objects/space, time, and behavior. The tool has three principles: it is easy to predict; it is easy to learn; and it is easy to use.
New or modified spaces require certain attractive features capable of generating interactions that lead to positive experiences.
One of those features is technology, which can be high-tech or low-tech, they should provide resources that benefit society. Another feature of these public spaces is to establish relationships with people through design procedures, taking into account the people and their emotions.
II. METHODOLOGY Nine different technological interactions that corresponded
to different public spaces were analyzed using focus groups for someone specialized in design and development of public spaces. In this case, the Departamento del Diseño Urbano, a part of the Secretaría de Desarrollo Urbano y Obras Públicas (SDUOP) del Poder Ejecutivo del Estado de Querétaro was contacted.
Figure 1 Public spaces cycles, with information of Clos, J
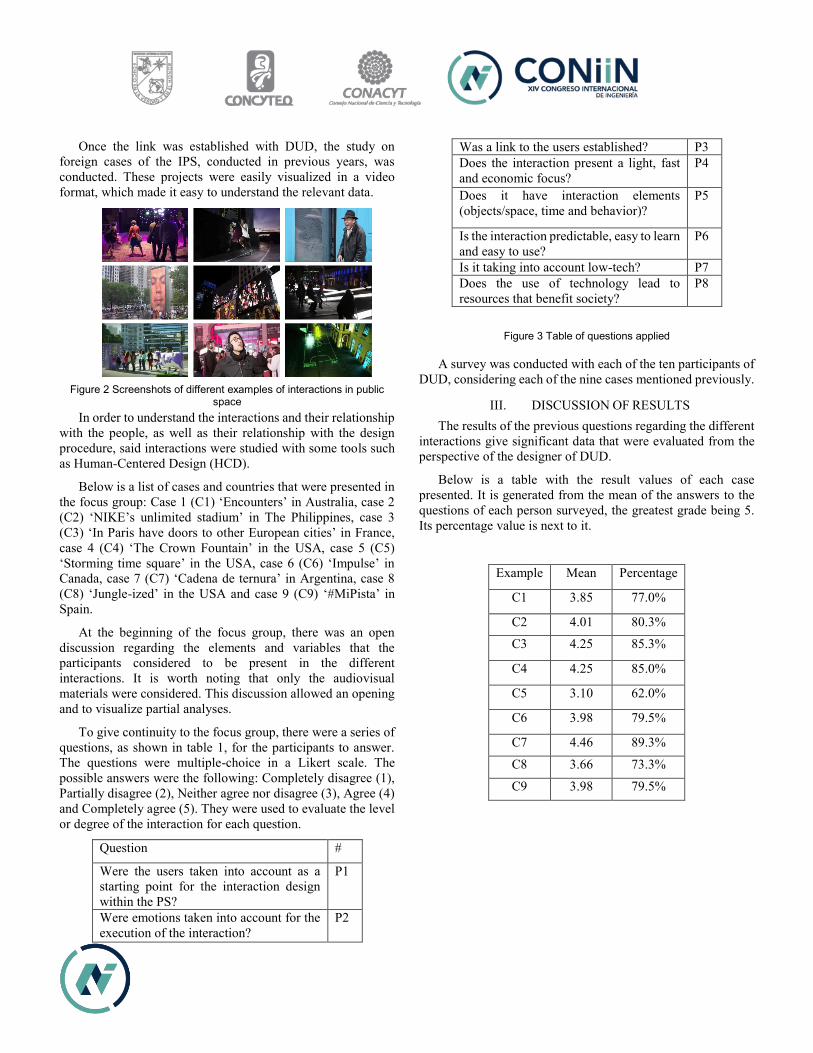
Once the link was established with DUD, the study on foreign cases of the IPS, conducted in previous years, was conducted. These projects were easily visualized in a video format, which made it easy to understand the relevant data.
In order to understand the interactions and their relationship with the people, as well as their relationship with the design procedure, said interactions were studied with some tools such as Human-Centered Design (HCD).
Below is a list of cases and countries that were presented in the focus group: Case 1 (C1) ‘Encounters’ in Australia, case 2 (C2) ‘NIKE’s unlimited stadium’ in The Philippines, case 3 (C3) ‘In Paris have doors to other European cities’ in France, case 4 (C4) ‘The Crown Fountain’ in the USA, case 5 (C5) ‘Storming time square’ in the USA, case 6 (C6) ‘Impulse’ in Canada, case 7 (C7) ‘Cadena de ternura’ in Argentina, case 8 (C8) ‘Jungle-ized’ in the USA and case 9 (C9) ‘#MiPista’ in Spain.
At the beginning of the focus group, there was an open discussion regarding the elements and variables that the participants considered to be present in the different interactions. It is worth noting that only the audiovisual materials were considered. This discussion allowed an opening and to visualize partial analyses.
To give continuity to the focus group, there were a series of questions, as shown in table 1, for the participants to answer. The questions were multiple-choice in a Likert scale. The possible answers were the following: Completely disagree (1), Partially disagree (2), Neither agree nor disagree (3), Agree (4) and Completely agree (5). They were used to evaluate the level or degree of the interaction for each question.
Question #
Were the users taken into account as a starting point for the interaction design within the PS?
P1
Were emotions taken into account for the execution of the interaction?
P2
Was a link to the users established? P3 Does the interaction present a light, fast and economic focus?
P4
Does it have interaction elements (objects/space, time and behavior)?
P5
Is the interaction predictable, easy to learn and easy to use?
P6
Is it taking into account low-tech? P7 Does the use of technology lead to resources that benefit society?
P8
A survey was conducted with each of the ten participants of DUD, considering each of the nine cases mentioned previously.
III. DISCUSSION OF RESULTS The results of the previous questions regarding the different
interactions give significant data that were evaluated from the perspective of the designer of DUD.
Below is a table with the result values of each case presented. It is generated from the mean of the answers to the questions of each person surveyed, the greatest grade being 5. Its percentage value is next to it.
Example Mean Percentage
C1 3.85 77.0%
C2 4.01 80.3%
C3 4.25 85.3%
C4 4.25 85.0%
C5 3.10 62.0%
C6 3.98 79.5%
C7 4.46 89.3%
C8 3.66 73.3%
C9 3.98 79.5%
Figure 2 Screenshots of different examples of interactions in public space
Figure 3 Table of questions applied
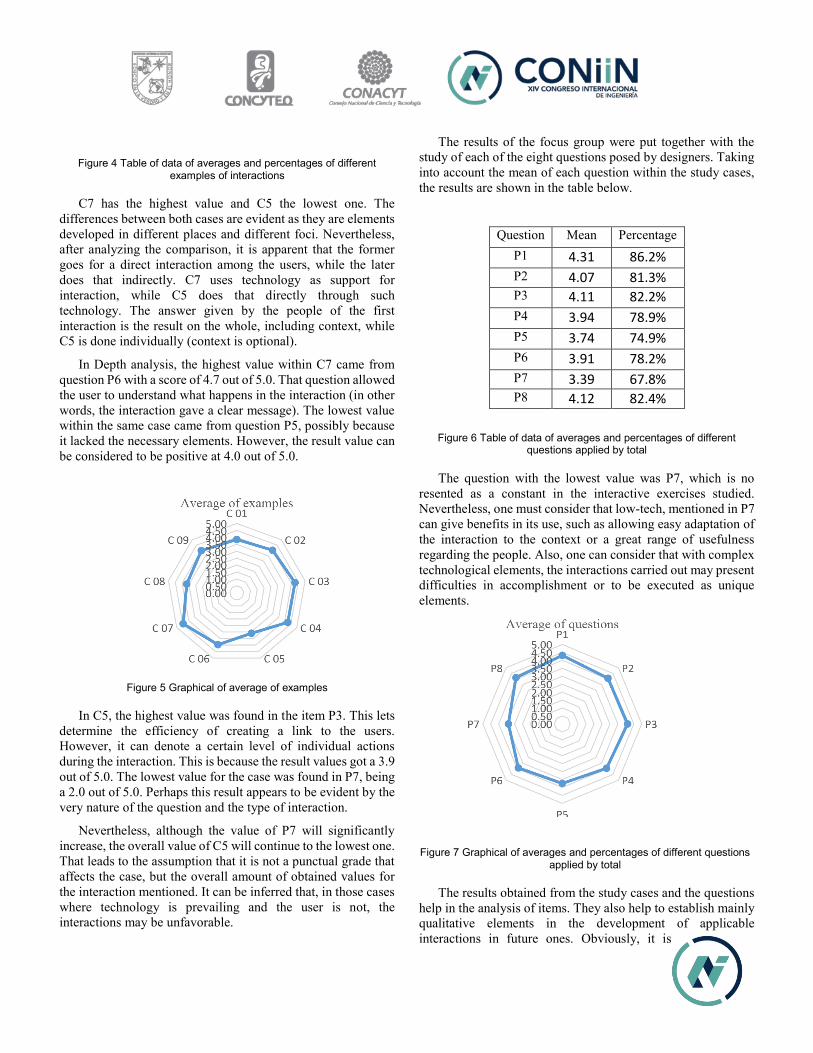
C7 has the highest value and C5 the lowest one. The differences between both cases are evident as they are elements developed in different places and different foci. Nevertheless, after analyzing the comparison, it is apparent that the former goes for a direct interaction among the users, while the later does that indirectly. C7 uses technology as support for interaction, while C5 does that directly through such technology. The answer given by the people of the first interaction is the result on the whole, including context, while C5 is done individually (context is optional).
In Depth analysis, the highest value within C7 came from question P6 with a score of 4.7 out of 5.0. That question allowed the user to understand what happens in the interaction (in other words, the interaction gave a clear message). The lowest value within the same case came from question P5, possibly because it lacked the necessary elements. However, the result value can be considered to be positive at 4.0 out of 5.0.
In C5, the highest value was found in the item P3. This lets determine the efficiency of creating a link to the users. However, it can denote a certain level of individual actions during the interaction. This is because the result values got a 3.9 out of 5.0. The lowest value for the case was found in P7, being a 2.0 out of 5.0. Perhaps this result appears to be evident by the very nature of the question and the type of interaction.
Nevertheless, although the value of P7 will significantly increase, the overall value of C5 will continue to the lowest one. That leads to the assumption that it is not a punctual grade that affects the case, but the overall amount of obtained values for the interaction mentioned. It can be inferred that, in those cases where technology is prevailing and the user is not, the interactions may be unfavorable.
The results of the focus group were put together with the study of each of the eight questions posed by designers. Taking into account the mean of each question within the study cases, the results are shown in the table below.
Question Mean Percentage P1 4.31 86.2% P2 4.07 81.3% P3 4.11 82.2% P4 3.94 78.9% P5 3.74 74.9% P6 3.91 78.2% P7 3.39 67.8% P8 4.12 82.4%
The question with the lowest value was P7, which is no resented as a constant in the interactive exercises studied. Nevertheless, one must consider that low-tech, mentioned in P7 can give benefits in its use, such as allowing easy adaptation of the interaction to the context or a great range of usefulness regarding the people. Also, one can consider that with complex technological elements, the interactions carried out may present difficulties in accomplishment or to be executed as unique elements.
The results obtained from the study cases and the questions help in the analysis of items. They also help to establish mainly qualitative elements in the development of applicable interactions in future ones. Obviously, it is
Figure 5 Graphical of average of examples
Figure 7 Graphical of averages and percentages of different questions applied by total
Figure 4 Table of data of averages and percentages of different examples of interactions
Figure 6 Table of data of averages and percentages of different questions applied by total

necessary to consider their nature and objectives, as well as the user within design procedures. Also, they help to both establish evaluation tools in similar design sectors and allow create strategies to make technological interactions in different PS.
IV. CONCLUSIONS With the different elements found in the cities, as well as the
constant change within in favour of their own development, the study of the components of a city is a task with multiple variables. Establishing success routes from notable projects may allow for the creation of new strategies that include a constant feedback, while at the same time allowing a link to the users, a link to the place of execution, a type of pertinent technology and the correct execution to reach the planed objectives.
It is understandable that subjectivity represents a relevant factor in the qualitative validations. However, the media that allow the comprehension of interaction will not only guarantee the execution, but also gather data for their study and implementation in future actions. Future jobs in diverse technological interactive design areas for public spaces will have to comprehend the relationship between their factors, planed or otherwise.
A city’s, or its components’ design must not be exclusive to a sector, but inclusive. The relationship it has with its users must not be forgotten either because in it lies mainly a generator of interaction values.
REFERENCES
[1] Jones, G., & Ward, P. (2004). THE END OF PUBLIC SPACE IN LATIN AMERICA CITY? CONFERENCE PROCEEDINGS OF A RESEARCH WORKSHOP.
[2], [6], [7] Clos, J. (2017). Public Space Training Conducted During The ICCASU II Conference. Yaounde.
[3] Sukhdev, A., Vol, J., Brandt, K., & Yeoman, R. (2016). Cities in the circular economy: The role of digital technology.
[4] Cabezas, C. (10 de 03 de 2018). Archdaily. Obtenido de https://www.archdaily.mx/mx/02-285882/claves-para-proyectar-espacios-publicos-confortables-indicador-del-confort-en-el-espacio-publico
[5] Trachana, A. (2012). PROCESOS EMERGENTES DE TRANSFORMACIÓN DEL ESPACIO PÚBLICO.
[8] Pallasma, J. &. (2012). La mano que piensa: Sabiduria existencial y corporal en la arquitectura. Barcelona, Espana: Editorial Gustavo Gili, SL.
[9] Project for public spaces. (2014). PPS. Obtenido de https://www.pps.org/reference/ten-strategies-for-transforming-cities-through-placemaking-public-spaces/
[10], [11] Cao, J. (2017). Interaction design best practices. [12] Rukzio, E., Väänänen-Vainio-Mattila, K., Häkkilä, J., Schmidt, A.,
Cassinelli, A., & Müller, J. (2013). Experiencing Interactivity in Public Spaces.
[13] Agudo-Martinez, M. J. (2015). Espacios híbridos y Low-Tech. [14] Llop, C. (2016). ¿Afecta negativamente la tecnología en el desarrollo de
las ciudades? Obtenido de https://www.vice.com/es/article/vvdpqa/afecta-la-tecnologa-negativamente-al-desarrollo-de-las-ciudades
[15] Brignull, H., & Rogers, Y. (2003). Enticing People to Interact with Large Public Displays in Public Spaces.
[16] Cortés, C., & Berenice, A. (2010). Luz y Emociones Estudio sobre La Influencia de la illuminación urbna en las emociones tomando como base el diseño emocional.
[17] IDEO. (2015). The Field Guide to Human-Centered Design. (978-0-9914063-1-9).
Retrieval of materials in civil construction for its reuse in creating new construction
materials.
Abstract — In recent years, a whole recycling and non-pollution movement has established in almost every country in the world. Each day, it's more evident that the planet is being polluted by different situations, like garbage, industries, water contamination, CO2 emissions and the amount of people living in cities that everyday increase. Although it's not very common to listen about polluting structures, it is a problem that increases world pollution. Producing construction materials such as steel, blocks and concrete requires a big amount of energy and many times the structures built with these end up with no use and even sometimes demolished. It is estimated that 80% of the energy required to produce these materials is consumed in the production and transportation. This project looks forward to recycle construction materials, such as steel, concrete, filling, brick and some other common materials used in residential, commercial and public structures. Through the analysis of the elements of a house plan, we could determine which elements could be reused or recycled in the supposed situation of a demolition or not use of the house at all. This analysis was based on Mexican norm NADF-007-RNAT-2004. As a result, approximately 25% of the materials used in a house or facility can be reused. Specifically, concrete, compression layer, red brick, steel, filling and lime.
Keywords — Construction materials, recycling,
retrieval, pollution, demolition, sustainable,
optimization.
I. INTRODUCTION In recent years, an increasing amount of CO2 levels has been registered and a high pollution index in all of the world. This situation is due to different factors and situations such as the increasing number of population, water contamination, aquifer exploitation, garbage accumulation through years, unlimited water usage, CO2 emissions and industrial waste thrown into rivers and sea, provoking earth’s deterioration and a pollution increase that has never been seen. Anyway, we can number a lot of factors affecting the planet but definitely CO2 emissions are the most determinant. These emissions affect directly to earth's deterioration and unfortunately it is a situation that hasn't been able to control. Figure 1 shows the increment of CO2 emissions through years. This graph was made by “The 2 Degrees Institute”, one of the most important organizations regarding environmental recovery.
T. M. Diego Alberto, R.C. José Pablo. G. de G. Enrique Octavio. A. M. Jorge. [email protected]; [email protected]; [email protected]; [email protected]; Facultad de Ingeniería, Universidad Autónoma de Querétaro.
José Gabriel Ríos Moreno. [email protected] Departamento de Ingeniería Civil, Universidad Autónoma de Querétaro Querétaro de Arteaga-QRO, México.

Fig. 1 Annual CO2 register measured by “The 2 Degrees Institute”. [14].
Figure 1 shows CO2 levels have increased every year since 1990, which is an alarming situation. In all the factors mentioned before, there is one that produces a lot of polluting emissions; construction materials fabrication. These materials are extremely important to society, because they are necessary to build structures and they are used everyday to develop infrastructure in every part of the world. It is estimated that 80% of the energy used to produce a civil construction is used in the production and transportation of materials. The 20% is attributed to construction processes and workforce. Some of the materials that are considered (according to the European Waste Catalogue), C&D (Construction & Demolition) wastes are classified as: • Concrete, bricks, tiles and ceramics. • Wood, glass and plastic. • Bituminous mixtures, coal tar and tarred products. • Metals. • Soil (including soil excavated from contaminated sites), stones and dredging spoil. • Insulation materials and asbestos-containing construction materials. • Gypsum-based construction material. It is important to mention that reinforced concrete made buildings have an estimated lifetime and in many occasions when they reach this lifetime they are demolished to build a new structure or use the space. Every construction phase of a building generates waste, this is inevitable. The point is recycling this materials so they can be used more times or use them to create a new material. The intention is to use as much material possible to avoid it going to waste and therefore increasing pollution. The following graph shows the percentage of material that is being recycled by different European countries:
TABLE 1. RECYCLED MATERIALS IN EUROPE
Amount of recycled materials
Country Tons of material
(million tons)
Percentage (%)
1 Austria 6.6 60
2 Belgium 11.02 68
3 Denmark 5.27 94
4 Estonia 1.51 92
5 France 85.65 14
6 Germany 72.4 86
7 Netherlands 23.9 98
8 Poland 38.19 28
9 Portugal 11.42 5
10 Slovenia 2 53
11 Spain 31.34 14
12 UK 99.1 75
(European Waste catalogue - 2011)
Table 1 shows that some countries like Poland and Denmark are recycling more than 90% of material waste, reducing drastically the pollution. Also recovering millions of euros that would have otherwise gone to waste. The Concrete waste can go through a trituration process, which can be used to make more concrete structures. Or even plastic waste can be used to make pet bricks. We can analyze all constructions, and theoretically review how much material could be recycled if the construction were to be demolished according to regulations from each country. Economically we can review the profit from recycling as much material as possible. Environmentally we can review the amount of waste reduction. We will review the different processes that the materials have to go through and analyze how much material can be recovered from demolished buildings.
II. THEORETICAL CONSIDERATIONS

The minimum size for the recycled coarse aggregate is of 4.75mm (mesh #4). The content of particles that pass the mesh #4 should not be higher than 5%. The content of lumps of clay in the recycled coarse aggregate should not be higher than 0.6% and in the natural coarse aggregate to 0.15%. In the recycled concrete with content of recycled coarse aggregate lower than 20%, the absorption of this aggregate needs to be lower than 7%, in addition, the absorption of the natural coarse aggregate needs to be lower than 4.5%. For the weathering resistance of the gravel the requirement applied for the natural aggregates maintains: Coefficient not gather than 40% in resistance to degradation (Los Angeles Machine). According to the norm “NORMA AMBIENTAL PARA EL DISTRITO FEDERAL NADF-007-RNAT-2004” at least 25% of the virgin materials must be replaced by recycled materials. TABLE 2 PROPOSED USES OF CONSTRUCTION AND DEMOLITION WASTE MADE BY THE CMIC. Recycled Materials Classification
Residue Recycled Material
Application
1 Mixed rubble from concrete and mortar.
Recycled aggregate
Hydraulic bases on roads and parking lots.
2 Milling of asphalt binders
Asphalt material mixtures
Asphaltic or black bases. Hot, temperate and cold asphalts Highways.
3 Mixed rubble
Solid material.
Solid material.
4 Mixed rubble
Recycled sand
landfills, substitute for tepetate. Manufacture of blocks, partitions, adocretos, adopastos, tiles, poles, curbs, linings.
5 Mixed rubble
Fine aggregates
Walkers and bike path
6 Mixed rubble
Recycled aggregates
Pipe beds, ribs and filling. Filling of foundations Pedraplenes Fillings of roofs and planters. Conformation of land
7 Concrete waste
Recycled gravel and sand
Sidewalks Concrete Construction of walls
8 Hydraulic concrete
Recycled in cold
Black and hydraulic base.
Classification of recycled materials by CMIC. Table 2 gives us information about types of residues and what type of material they are. Then each material has some examples in the construction field in which we can use those recycled materials we extracted. TABLE 3 DEMOLITION ELEMENTS
Demolition elements
Activity Object Principal component
s
Observations

Demolition Household
Other buildings
Public Work
Old: masonry, brick, wood, plaster, tiles. Recent: brick, concrete, iron, steel, metals and plastics. Industrial: concrete, steel, brick, masonry. Services: Concrete, brick, masonry, iron, wood.
The materials depend on the age of the building and the concrete use of it in the case of services.
Table 3 shows in specific constructions like which are the main materials we can extract to recycle. It is very important that that person who is in charge of the demolition observe the age of those material so to be sure how possible would it be to recycle them.
III. METHODOLOGY AND RESULTS By using the architectural plan of a common house, the amount of materials used to make slabs and walls was analyzed and accounted. This in order to analyze according to the country in subject (Mexico) and its norms and regulations regarding recycled materials, to account how much material can be retrieved if this house were to be demolished. Everything based on the theoretical considerations detailed before, the total weight of materials recycled is analyzed, to list the environmental benefits of this practice. The ideal demolish process is considered for the results.
Fig 2, Slab and joist vault plan Figure 2 shows the slab and joist plan for the common house which is being analyzed. It uses the architectural plan and it clearly shows the the distribution of slab and joist. In the following table, materials are quantified by thickness and weight. Tables 4 and 5 show specifically all the components of a slab. Then gives us how much does it weights and loads that this types of slabs will present TABLE 4. MATERIALS BREAK DOWN FOR JOIST AND VAULT
Joist and vault
Material Thickness
(m)
Volumetric weight kg/m3 W kg/m2
Waterproofing
0 0 0
Concrete 0.03 2400 72
Vault 90-20-13
90
Mallarmex 0.004 1.32 0.00528
Filling 0.04 1200 48
Steel Rod 3/8 0.0095 7800 74.1
Lime caulking
0.01 1100 11
Additional dead load
By concrete 20
By mortar 20
Total Dead Load 335.105
Live Load (rooftop) 100
Total Load in the slab 435.105
Joist and Vault Materials breakdown in the plant.

Fig. 3 Joist and Vault Figure 3 shows the joist and vault profile plan. Lengths taken by the waterproofing, and other materials can be analyzed from the figure. Following table shows the break down for solid slab. Break down from table 4 corresponds to Figure 3. TABLE 5. MATERIALS BREAK DOWN FOR SOLID SLAB
Solid slab
Material Thickness (m)
Volumetric weight kg/m3
W kg/m2
Waterproofing 0 0 0
Concrete 0.03 2400 72
Compression layer
0.03 2400 72
Red brick 7x14x28
0.1 1600 160
Mallarmex 0.008 1.32 0.01056
Filling 0.04 1200 48
Lime caulking 0.01 1100 11
Additional dead load
By concrete
20
By mortar 20
Total dead weight 403.01
Live load (rooftop) 100
Total load in the slab 503.01
Solid Slab breakdown in the plant.
Fig. 4 Solid Slab Solid slab profile plan is shown in figure 4. From this figure the break down of materials for table 5 can be more clearly analyzed.
A. Architectural plant The architectural design of a home is defined by: dimensions, characteristics and spaces, all of this to make a clear and specific project. The dimensions of the house are the following:
The top floor has the following chambers: a) Principal chamber (4 m x 4.5 m) b) Service chamber (4 m x 3.5 m) c) Full bathroom (1.35 m x 3m) d) Kitchen (2.15 m x 3 m) e) Living room (3 m x 2.50 m) f) Dinning room (3 m x 3.50 m) g) Garage (5.50 m x 3 m) h) TV room (4 m x 3m) i) Yard 5.50 m x 7 m j) Garden 4.20 m x 4 m The total ground area is 140 m^2. The construction area is 52.32 m^2.
B. Materials description
Definition of the different materials which are used in the construction of a house:
● Vault Vaulted space which is used to cover the gap between two beams, reducing the forged weight. It may be formed by timber, bricks, etc. It’s application is fast and easy.
● Welded mesh Steel network of small diameter, which contact points are united by electric welds, each side is used as a reinforcement armed of steel rod and it is put above the rod, in the case of solid slabs. It absorbs the contraction and temperature efforts por slabs with big surfaces.

● Prestressed joist
Annealed mud, without presenting any imperfections.
● Mixtures Also known as mortars, are made of pebble materials (sand and gravel), binders and water. It is used to bound pre made or natural materials.
● Wire Also called steel reinforcement, it is principally used to take diagonal tension efforts. It is made from steel fy=2320 kg/cm^2.
● Concrete Sole material which has its resistance rise within time, as long as the humidity process after its fabrication is correctly made. If the concrete dries the chemical reactions in its interior will stop, and these are the ones responsible for the increase in the resistance. This material is made from cement, pebble materials (sand and gravel), water and additives for different specifications. Tables 6, 7, 8 and 9 shows us the parts of some walls the thickness of each layer and the weight of every component and finally the load that it has TABLE 6. BATHROOM WALL (DIVIDER)
Material Thickness (m)
Volumetric weight (kg/m3)
W (kg/m2)
Tile - - 15
Mortar 0.03 2100 63
Red annealed partition 7x14x24
0.14 1500 210
Mortar 0.02 1500 30
Dead load 318
TABLE 7. LOADING WALL
Material Thickness (m)
Volumetric
weight (kg/m3)
W (kg/m2)
Mortar 0.02 1500 30
Red annealed partition 7x14x24
0.14 1500 210
cast 0.015 1500 23 Dead
load 263
Fig 5. Load division walls C. Results TABLE 8. HOUSE’S MATERIAL AMOUNT
Total material amount
Material Volumetric weight (kg/m3)
W (kg/m2)
Concrete 4800 148
Compression layer 2400 72
Red brick (7x14x28)
1600 160
Mallarmex 2.64 0.01584
Filling 2400 96
Lime caulking 2200 22
Total amount of materials from plant.
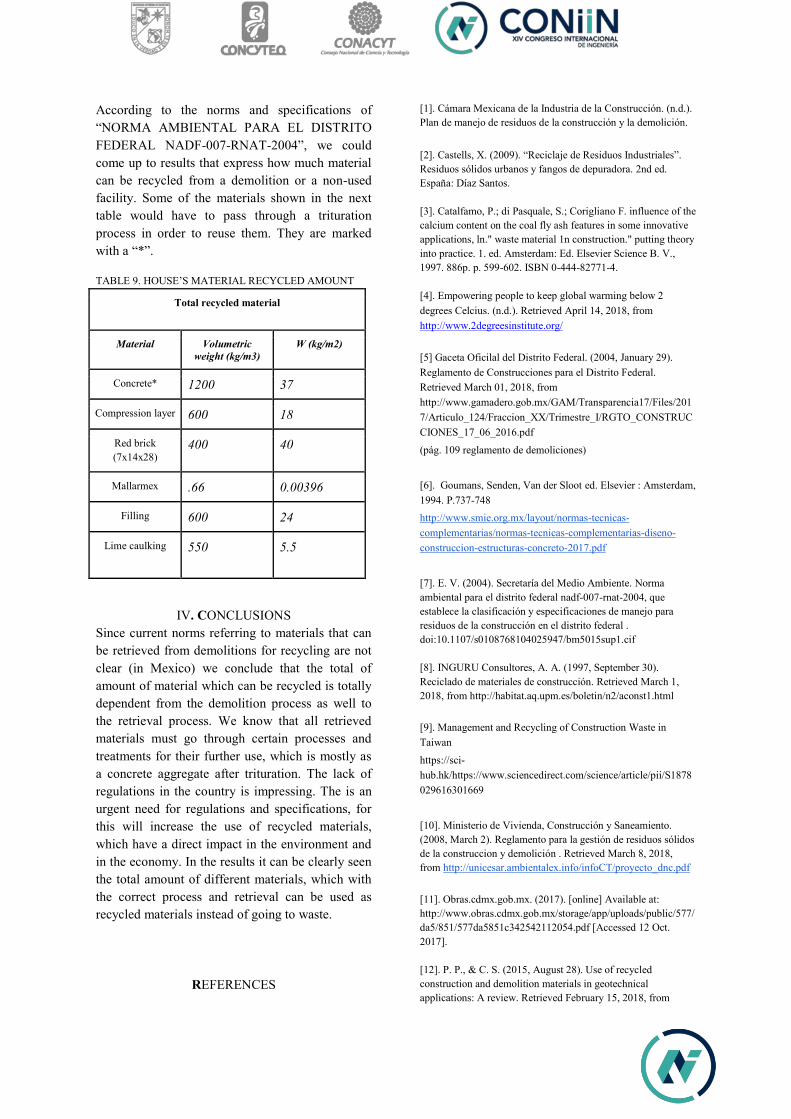
According to the norms and specifications of “NORMA AMBIENTAL PARA EL DISTRITO FEDERAL NADF-007-RNAT-2004”, we could come up to results that express how much material can be recycled from a demolition or a non-used facility. Some of the materials shown in the next table would have to pass through a trituration process in order to reuse them. They are marked with a “*”. TABLE 9. HOUSE’S MATERIAL RECYCLED AMOUNT
Total recycled material
Material Volumetric weight (kg/m3)
W (kg/m2)
Concrete* 1200 37
Compression layer 600 18
Red brick (7x14x28)
400 40
Mallarmex .66 0.00396
Filling 600 24
Lime caulking 550 5.5
IV. CONCLUSIONS Since current norms referring to materials that can be retrieved from demolitions for recycling are not clear (in Mexico) we conclude that the total of amount of material which can be recycled is totally dependent from the demolition process as well to the retrieval process. We know that all retrieved materials must go through certain processes and treatments for their further use, which is mostly as a concrete aggregate after trituration. The lack of regulations in the country is impressing. The is an urgent need for regulations and specifications, for this will increase the use of recycled materials, which have a direct impact in the environment and in the economy. In the results it can be clearly seen the total amount of different materials, which with the correct process and retrieval can be used as recycled materials instead of going to waste.
REFERENCES
[1]. Cámara Mexicana de la Industria de la Construcción. (n.d.). Plan de manejo de residuos de la construcción y la demolición.
[2]. Castells, X. (2009). “Reciclaje de Residuos Industriales”. Residuos sólidos urbanos y fangos de depuradora. 2nd ed. España: Díaz Santos. [3]. Catalfamo, P.; di Pasquale, S.; Corigliano F. influence of the calcium content on the coal fly ash features in some innovative applications, ln." waste material 1n construction." putting theory into practice. 1. ed. Amsterdam: Ed. Elsevier Science B. V., 1997. 886p. p. 599-602. ISBN 0-444-82771-4. [4]. Empowering people to keep global warming below 2 degrees Celcius. (n.d.). Retrieved April 14, 2018, from http://www.2degreesinstitute.org/
[5] Gaceta Oficilal del Distrito Federal. (2004, January 29). Reglamento de Construcciones para el Distrito Federal. Retrieved March 01, 2018, from http://www.gamadero.gob.mx/GAM/Transparencia17/Files/2017/Articulo_124/Fraccion_XX/Trimestre_I/RGTO_CONSTRUCCIONES_17_06_2016.pdf
(pág. 109 reglamento de demoliciones)
[6]. Goumans, Senden, Van der Sloot ed. Elsevier : Amsterdam, 1994. P.737-748
http://www.smie.org.mx/layout/normas-tecnicas-complementarias/normas-tecnicas-complementarias-diseno-construccion-estructuras-concreto-2017.pdf
[7]. E. V. (2004). Secretaría del Medio Ambiente. Norma ambiental para el distrito federal nadf-007-rnat-2004, que establece la clasificación y especificaciones de manejo para residuos de la construcción en el distrito federal . doi:10.1107/s0108768104025947/bm5015sup1.cif [8]. INGURU Consultores, A. A. (1997, September 30). Reciclado de materiales de construcción. Retrieved March 1, 2018, from http://habitat.aq.upm.es/boletin/n2/aconst1.html
[9]. Management and Recycling of Construction Waste in Taiwan
https://sci-hub.hk/https://www.sciencedirect.com/science/article/pii/S1878029616301669
[10]. Ministerio de Vivienda, Construcción y Saneamiento. (2008, March 2). Reglamento para la gestión de residuos sólidos de la construccion y demolición . Retrieved March 8, 2018, from http://unicesar.ambientalex.info/infoCT/proyecto_dnc.pdf
[11]. Obras.cdmx.gob.mx. (2017). [online] Available at: http://www.obras.cdmx.gob.mx/storage/app/uploads/public/577/da5/851/577da5851c342542112054.pdf [Accessed 12 Oct. 2017]. [12]. P. P., & C. S. (2015, August 28). Use of recycled construction and demolition materials in geotechnical applications: A review. Retrieved February 15, 2018, from

https://www.sciencedirect.com/science/article/pii/S0921344915300562 [13]. Tukker, A.; Gielen, D.J. a concept for the environmental evaluation of waste management benefits. In: Environmental Aspects of Construction with Waste Materials. [14]. V. M. John and S. E. Zordan . (2000). Research & Development Methodology for Recycling Residues as Building Materials -. 7/02/2018, de Science direct Sitio web: https://sci-hub.tw/https://www.sciencedirect.com/science/article/pii/S0713274300800628
Parameters of crispness in a breakfast cereal enriched with nopal powdered
Guerrero-Perez M.G Faculty of Engineering.
Autonomous University of Queretaro, Cerro de las campanas s/n, 76010. Santiago de Queretaro,
Querétaro.México [email protected]
Contreras-Padilla M. CAIDEP. Faculty of Engineering.
Autonomous University of Queretaro, Cerro de las campanas s/n, 76010. Santiago de Queretaro,
Querétaro.México [email protected]
Abstract— Different studies mention the incorporation of nopal powdered to different food products, to integrate this ingredient the texture changes. The crispness in cereals for breakfast is one of the important attributes to be considered by consumers, an essential property in the quality of the breakfast cereals, which is lost when exceed the 15% humidity. In the present study compared a formula of cereal for breakfast of amaranth with nopal, in relation to 2.3:1 respectively, against a control sample of trademark. It was found that the quality parameters analyzed are the same for both samples, so that this type of food accepts a higher percentage of nopal powder without changing the quality standards for the texture in a cereal for breakfast.
Keywords—Crispy, Nopal, breakfast cereal, texture, moisture.
I. INTRODUCTION Different studies mention the incorporation of nopal
powdered to different products such as bread, soups, pies and puddings, which have been able to add in different percentages ranging from 16% to 5%, since adding more nopal texture of the food changes, resulting in unpleasant [1][2].
It is common knowledge that the texture plays an important role, as this affects the sensory quality in terms of food [3]. The crispy in breakfast cereals is one of the important attributes to be considered by consumers.
The analysis of texture of foods are made with various tests, such as the compression, the penetration and the bending of three points, and the graphs of displacement of force resulting. The analysis of the data was considered in the first place in terms of rheological parameters [4].
The property of the crispy texture is also associated with other physico-chemical parameters, one of these is that the moisture remains below 15% to ensure a satisfactory quality [5].
The objective of this work is to evaluate the crunchiness of an amaranth breakfast cereal, enriched with dehydrated nopal pads, in a ratio of 2.3: 1 respectively, compared to a branded breakfast cereal already established in the market, taking into account the moisture as parameters of quality in the texture of the same.
II. MATERIALS AND METHOD
A. Biological Material It was used Nopal pads (Opuntia Ficus Indica) powdered
which was acquired in Silao, Guanajuato.
The amaranth used was purchased in whole grain and toasty, also used a control sample, of a trademark with oatmeal whole grain and whole wheat flour, which were bought in a self-service store in the city of Querétaro.
B. Texture Analysis The texture analysis was done in a texturometer TA Plus
Lloyd Instruments An AMETEK Company, together with the NEXYGEN Plus program, a compression force of 1mm to 15mm before and after, at a distance of 5mm, with an angle of 45°, 15 repetitions was done to the test. For the test of crispy the number of peaks was takin into account and in the case of hardness data were reported in newtons (N).
C. Moisture The analysis was done based on the AOAC method 925.09
of 2002 [6]. It was used 2g of each sample. Were placed in an oven at 110°C for 2 hours. Subsequently took the samples to a desiccator, record the weight. The entire procedure was performed in triplicate. The percentage of moisture was obtained using the equation 1.
% 𝑀𝑜𝑖𝑠𝑡𝑢𝑟𝑒
= [ 𝑖𝑛𝑖𝑡𝑖𝑎𝑙 𝑤𝑒𝑖𝑔ℎ𝑡 𝑜𝑓 𝑡ℎ𝑒 𝑠𝑎𝑚𝑝𝑙𝑒 − 𝑓𝑖𝑛𝑎𝑙 𝑤𝑒𝑖𝑔ℎ𝑡 𝑜𝑓 𝑡ℎ𝑒 𝑠𝑎𝑚𝑝𝑙𝑒
𝑖𝑛𝑖𝑡𝑖𝑎𝑙 𝑤𝑒𝑖𝑔ℎ𝑡 𝑜𝑓 𝑡ℎ𝑒 𝑠𝑎𝑚𝑝𝑙𝑒] 𝑥100
D. Statistical analysis The statistical analysis was done with the program
Statgraphics Centurion XVI, an ANOVA test was applied to compare with a commercial product used as a control sample, with a confidence level of 95%, in case of statistical difference

found, the Tukey test was applied to determine in sampling differences.
III. RESULTS AND DISCUSSION No statistically significant differences were found in any of
the three parameters assessed and described in the methodology, in Table 1 is the average of the number of peaks, newtons and humidity, both for the formula developed as of the control sample.
TABLE I. AVERAGE FOR NUMBER OF PEAKS, NEWTONS AND MOISTURE
Samples Parameters
Number of peaks Newtons Moisture
A-03 4.93± 1.48 32.02± 6.04 5.19± 0.54
CN-01 4.53± 1.59 27.96± 11.41 4.70± 0.15
A-03 corresponds to the formula 2.3:1 and CN-01 corresponds to the control sample.
The total number of peaks is a main parameter that identifies the crispness [7]. Both samples have similar number of peaks, this fact indicate that the prototype of cereal developed is comparable with the commercial sample.
However, the hardness is a bit higher than expected, since the foods that are considered crispy must fracture at a lower hardness [8], this could be due to the amount of fiber that samples of prototype contain, the nopal powdered contains 60% insoluble fiber and 25% soluble fiber [9] and the sample control declares, in its nutritional information, 9g of dietary fiber per 100g of product.
On the other hand, the percentage of moisture remained below 7%, which ensures the crispness texture because above of this percentage begins to lose the crunchy texture [10].
IV. CONCLUSION It is possible to enrich a food, such as breakfast cereal, with
a high percentage of nopal powdered, this food to be of low moisture content agree better the amount of fiber that contains the nopal, so their physical quality characteristics do not change compared to branded breakfast cereal.
ACKNOWLEDGMENT We would like to thank to CAIDEP of the Faculty of
Engineering of the Autonomous University of Queretaro, as well as the CFATA-UNAM for the support of these project.
REFERENCES
[1] C. Sáenz, E. Sepulveda, N. Pak and X. Vallejos, “ Uso de fibra dietética de nopal en la formulación de un polvo para flan”, Archivos Latinoamericanos de Nutrición 52(4), pp.134-138, 2002.
[2] W.M. Ayadi, “Cladodes from Opuntia Ficus-Indica as a Source of dietary fiiber” Efe. 2009
[3] R.L. Heiniö, M. W. J. Noort, K. Katina, S. A. Alam, N. Sozer, H. L. de Kock, M. Hersleth, and K. Poutanen., “Sensory characteristics of wholegrain and bran-rich cereal foods” – A review, Trends Food Sci. Technol. 47, pp.25–38, 2016. doi:10.1016/j.tifs.2015.11.002
[4] B.V. Pamies, G. Roudaut, C. Dacremont, M. Le Meste and J. R. Mitchell, “Understanding the texture of low moisture cereal products: mechanical and sensory measurements of crispness”, J. Sci. Food Agric. 80, pp.1679–1685, 2000.
[5] D. Sumczynski, Z. Bubelova, J. Sneyd, S. Erb-Weber and J. Mlcek.”Total phenolics, flavonoids, antioxidant activity, crude fibre and digestibility in non-traditional wheat flakes and muesli”, Food Chem. 174, pp.319–32, 2015. doi:10.1016/j.foodchem.2014.11.065.
[6] AOAC. 2000.Official Methods of Analysis. Association of Official Analytical Chemists, 17 Ed., Gaithersburg, MD, USA.
[7] M. Alonzo-Macías, G. Montejano-Gaitán, and K. Allaf “Impact of Drying Processes on Strawberry (F ragaria var. Camarosa) Texture: Identification of Crispy and Crunchy Features by Instrumental Measurement: Texture Measurement of Dried Strawberry Slices”, J. Texture Stud. 45, pp. 246–259, 2014.
[8] M. Saeleaw and G. Schleining, “Effect of frying parameters on crispiness and sound emission of cassava crackers”, J. Food Eng., pp.103:229–236, 2011. doi:10.1016/j.jfoodeng.2010.10.010.
[9] M. Hernández-Urbiola, M. Contreras-Padilla, E. Pérez-Torrero, G. Hernández-Quevedo, J. I. Rojas-Molina, E. Gutierrez- Cortes and others, “Study of nutritional composition of nopal (opuntia ficus indica vs. redonda) at different maturity stages”, The Open Nutr. J., pp.11-16, 2010.
[10] F. Sauvageot and G. Blond, “Effect of water activity on crispness of breakfast cereals”, J. Texture Studies 22, pp.423-442, 1991.


