Embed Size (px)
Citation preview

Instructions for use
TitleMetabolite profiling and assessment of metabolomecompartmentation of soybean leaves using non-aqueousfractionation and GC-MS analysis
Author(s) Benkeblia, Noureddine; Shinano, Takuro; Osaki, Mitsuru
Citation Metabolomics, 3(3): 297-305
Issue Date 2007-09
Doc URL http://hdl.handle.net/2115/30185
Right The original publication is available at www.springerlink.com
Type article (author version)
AdditionalInformation
Hokkaido University Collection of Scholarly and Academic Papers : HUSCAP

Metabolite Profiling and Assessment of Metabolome Compartmentation of Soybean
Leaves using Non-Aqueous Fractionation and GC-MS Analysis
Noureddine Benkeblia1, Takuro Shinano2*, and Mitsuru Osaki1
1 Graduate School of Agriculture, Hokkaido University, Sapporo, 060-8589, Japan
2 CRIS, Hokkaido University, Sapporo, 001-0021, Japan
*To whom correspondence should be addressed.
E-mail: [email protected]
1

In the present study, non-aqueous fractionation (NAQF) and GC-MS were used to obtain a
spatially resolved view of metabolism in mature leaves of soybean (Glycine max Merr.).
NAQF of lyophilized soybean leaves was performed using CCl4-n-heptane and
ultracentrifugation that yielded a gradient comprised of six fractions. Chlorophyll content,
and marker enzyme activities, phosphoenolpyruvate carboxylase (PEPC) and α-
mannosidase, were utilized as stroma, cytosol and vacuole markers, respectively. GC-MS
analyses of each fraction resulted in the identification of around 100 different metabolites.
The distribution of these identified compounds showed a decreasing order from the
vacuole to cytosol to chloroplast stroma. In other words, a greater number of identified
compounds were found in the vacuole when compared to the cytosol or stroma.
Levels of sugars, organic acids and fatty acids showed greater relative abundances in the
vacuole with 50%, 55% and 50% of the respective pools. A greater relative abundance of
amino acids was observed in the cytosol where 45% of the total of amino acids content
was recorded. The relatively large pool of sugars and phenolic acids in the vacuole
compartment implies high levels of starch metabolism and phenylpropanoid biosynthesis.
The low amino acids pool, on the other hand, suggests low nitrogen accumulation in the
leaves of soybean. Hierarchical cluster analysis on the most abundant metabolites revealed
three clusters containing 10, 20 and 2 of the 32 selected metabolites. The data were
discussed in term of NAQF and GC-MS analysis of soybean mature leaves, and also in
term of distribution and compartmentation of metabolites at subcellular levels.
KEY WORDS: Compartmentation; GC-MS; Metabolome; Non-aqueous fractionation;
Metabolite Profiling; Soybean (Glycine max Merr.)
2

1. Introduction
A principal goal of metabolomics is the measurement of the complete range of primary and
secondary metabolites present within, or transported from, a biological system as a means
to better understand the precise biological role or function of that system at a defined
developmental stage or under specific environmental factors. The search for new trait-
enhanced crops, of course, renders it necessary to continue to develop new insights into the
response of plants to genetic and environmental changes induced by biotic or abiotic
stresses. Metabolite profiling and metabolic pathways mapping, can be considered as
critical steps (Fiehn et al., 2000; Kell, 2004) in providing such information.
A metabolomics experiment typically extends from sampling and sample preparation
through analytical strategies for data acquisition to statistical and bioinformatics
approaches to raw data processing and data analysis (Brown et al., 2005). Given the
diverse physico-chemical nature of different metabolites, no single analytical technology
can suffice to cover the entire metabolome. However, the range of current comprehensive
technologies, including chromatographic techniques coupled to mass-spectrometry,
currently facilitate extensive coverage of a wide array of metabolites associated with
important biosynthetic pathways and processes (Dunn and Ellis, 2005). Yet a somewhat
underrepresented approach to metabolomic studies relates to assessments of the relative
distribution of metabolites in different plant compartments. Whilst clearly a technical
challenge, approaches to sub-cellular fractionation that minimize biochemical degradation
during sample preparation are known. In principle, these can be combined with current
developments in metabolic profiling to more accurately reflect the distribution of
3

metabolic processes within a cell or tissue. We have initiated preliminary evaluations of
this approach when applied to soybean leaf and this is the focus of this paper.
Compartmentalization of metabolites and metabolic process is an important aspect of
metabolic regulation; metabolite compartmentalization constitutes a principal regulatory
characteristic of plant metabolism (Fridman and Pichersky, 2005, Goodacre et al., 2004;
Lunn, 2007). Typically, metabolic pathways are highly segregated in different subcellular
organelles (Browsher and Tobin, 2001; Lunn, 2007). Thus, a fundamental understanding
of plant metabolism requires a qualitative and quantitative description of the metabolome
within different compartments of the cell. The chloroplast, cytosol and vacuole constitute
the main compartments of photosynthetic and other metabolic activities, including
biosynthetic and hydrolytic activities, in the leaves of plants. Knowledge of metabolic
networks and their regulation can therefore be further developed based upon increased
understanding of relative distributions of metabolites in these compartments as determined
by experimental analyses. A cellular fractionation process which minimizes loss or
degradation of metabolites is clearly of immense value as a prelude to such
compartmentation analysis. Given the dynamic and highly labile nature of most
metabolites, it is essentially that such fractionation processes are conducted under as inert
an environment as possible. One of the most promising approaches to the study of
compartmentalized metabolism in leaf tissue is the non-aqueous fractionation (NAQF)
procedure used to separate subcellular compartments under biochemically and
enzymatically inactive conditions (Gerhardt and Heldt, 1984; Stitt et al., 1989). There
have been many investigations in soybean leaf including for example studies on
4
carbohydrate metabolism (Allen et al., 1998) that could, at least in principle, benefit from
spatially resolved metabolic profiling. Therefore the primary objectives of this study were
to (i) effectively implement NAQF for soybean leaves, (ii) profile the soybean leaf
metabolome using GC-MS, and (iii) determine compartmentation at the subcellular level
of the profiled metabolites, and their relative abundances in each compartment. This
information will serve as an important prelude to detailed comparative experiments
(unpublished studies ongoing).
2. Materials and Methods
2.1. Plant material
Soybean (Glycine max Merr. cv. Kitamusume) was grown in Hokkaido University Farm,
Sapporo, Japan, from May to August. Leaves were sampled from mature (10 weeks) plants
early morning (from 8 to 9 a.m) and immediately plunged in liquid nitrogen to quench
further metabolism. Afterwards, leaves were freeze-dried for 5 days. The major veins
were removed, and samples were re-dried for two additional days for complete drying.
Freeze-dried samples were stored in air-tight tubes at - 80ºC until use. Three set of plants
were used for NAQF and metabolite analysis. The NAQF was run on each set of plants to
provide one biological replicate.
2.2 Non-aqueous fractionation
NAQF of plant material was carried out, with slight modification, by the method of
Gerhardt and Heldt (1984). All operations were carried out on ice and/or 4ºC unless
otherwise stated. A sample of 300-350 mg of freeze-dried leaves was ground in a mortar
5

and 20 ml carbon tetrachloride (CCl4) and n-heptane mixture (d = 1.28), dried using
molecular sieve beads (4A, Merck) at 10:1 v/w ratio, was added to the sample. The
mixture was sonicated for 30 s × 3 times with an interval of 30 s during which samples
were cooled with ice to avoid overheating. The homogenate was filtered through a layer of
quartz wool to discard coarse material and one volume of n-heptane was added to the
filtrate, vortexed and centrifuged at 3000 × g for 15 min. The supernatant was discarded
and the pellet was resuspended in 3 ml of CCl4-n-heptane mixture (d = 1.28). Two
samples of 250 μl each were withdrawn for enzyme marker and metabolite analyses. The
remainder was used for NAQF. An exponential gradient of CCl4-n-heptane mixtures was
made by layering, from the bottom to the top, 1 ml of the following densities: 1.59 (pure
CCl4), 1.54, 1.49, 1.44, 1.40, 1.36, 1.32, and 1.28. The remainder (~2.5 ml) was layered on
the top of the gradient and centrifuged at 25,000 × g for 3 h (Beckman Coulter, model
Optima L-XP). The content of the tube was collected as 6 fractions, one of ~1.5 ml and
five of ~2 ml each. From each fraction, 500 μl was withdrawn for enzymatic analysis. To
each portion one volume of n-heptane was added and microcentrifuged for 3 min at room
temperature. The supernatant was discarded and the pellet was dried overnight under low
pressure in a desiccator containing silica gel and paraffin. For chlorophyll content and
enzyme marker activities, 500 μl of 100 mM Bicine (pH. 7.8), 50 μl of 5 mM MgCl2 and
50 μl of 1 mM EDTA were added to the sample. After a 30 s sonication pulse, samples
were left for 5 min at room temperature, then microcentrifuged for 5 min. The aqueous
supernatant was collected and used for marker enzyme assays, while the pellet was used
for chlorophyll determination.
6

2.3. Enzymes and chlorophyll content assays
Chlorophyll content (stroma marker) was determined by the method of Wintermans and
De Mots (1965). Phosphoenolpyruvate carboxylase (cytosol marker) was assayed
spectrophotometrically by following the rate of NADH oxidation as described by Lane et
al. (1969). The assay of α-mannosidase (vacuole marker) was determined
spectrophotometrically by the method of Li (1967) based on the utilization of ρ-
nitrophenyl-α-D-mannoside as substrate and the liberation of ρ-nitrophenol.
2.4. Extraction and derivatization for GC-MS analysis
The six NAQF fractions were dried and the metabolites derivatized, prior to GC-MS
analysis, as described by Broeckling et al. (2005) with some modifications. The dried
portions of the NAQF fractions were resuspended in 500 µl of water containing ribitol (10
µl ml-1) as internal standard, vortexed and sonicated in a sonication-bath until total
resuspension of the dry pellet. The samples were then dehydrated under a low stream of
nitrogen until dryness. Afterwards, the metabolites of the dry pellet were first derivatized
by methoxyamination using 60 µl of 15 mg ml-1 of methoxyamine-HCl in pyridine (dried
prior to use over molecular sieve beads), vortexed and incubated at 50ºC for 1 h.
Subsequently, metabolites were then derivatized with 60 µl of N-methyl
trimethylsilylfluoroacetamide (MSTFA) + 1% trichlormethylchlorsilane (TMCS) for 1h at
50ºC. The samples were then transferred to a 300 µl glass insert and analyzed by GC-MS.
2.5. GC-MS and mass spectra analyses
7

Samples were analyzed by GC-MS (HP 6890 Gas chromatograph coupled with an HP
5973 MS detector and HP 6890 Series autosampler, Agilent Technologies Inc.) as
described previously (Broeckling et al., 2005; Roessner et al., 2000). The mass spectral
data were then analyzed using the AMDIS software (Automated Mass Spectra
Deconvolution and Identification System, http://chemdata.nist.gov/mass-spectra/amdis/)
and comparison was made using commercial NIST 02 Mass Spectral Library or a custom
internal database generated from authentic compounds. The data files were aligned, and
quantitative and qualitative data extracted using MET-IDEA software (Noble Foundation,
Ardmore. OK, USA) (Broeckling et al., 2006).
2.6. Data and statistical analysis
The data and calculation were obtained from the measurements of three density gradient of
the same leaf material. The evaluation of the subcellular compartmentation of metabolites
was performed using the deconvolution method of Riens et al. (1991) which is based upon
the assumption that the metabolites are confined to the stroma, cytosol and vacuole
designated by the distribution of the corresponding marker enzymes in the six fractions
collected after NAQF.
Correlation analysis was performed with GraphPad Prism 4.03 software (GraphPad
Software Inc., San Diego, CA, USA). Hierarchical cluster analysis (HCA) was performed
with SPSS 10.0 software (SPSS Inc., Chicago, IL. USA). In order to ensure that groups
share good correlation, the Pearson correlation coefficients were selected as the
measurement between the three compartments, and the cluster method in use was furthest
neighbor.
8

3. Results and Discussion
3.1. Fractionation of subcellular organelles
Subcellular fractionation, which consists of disruption of the cellular organization
(homogenization) followed by fractionation of the homogenate to separate the different
organelles, was applied to plant material by Gerhardt and Heldt (1984) and developed later
by Stitt et al. (1989). This methodology has been consistently improved and many
solvents have been recommended instead of CCl4, such as tetrachloethylene (Riens et al.,
1991) or dichlorobromoethane (Hartwell et al., 2002). The former solvent was suggested
because of its low toxicity, while the latter was shown to allow effective separation of
vacuolar from cytosol material when applied to mature leaves of Bryophyllum.
In Figure 1A, the chloroplastic material appeared, as expected, mainly in the middle
density fractions, while the cytosolic material appeared mainly in the middle or heaviest
fractions. On the other hand, the vacuolar material was concentrated in the highest density
fractions which contain more than 70% of the total activity of α-mannosidase. The linear
regression analysis of the fractionated material and collection of six fractions showed that
the goodness of fit was 0.93 (Figure 1B). The calculated P value was high with a low
deviation from zero intercept, indicating good reproducibility and separation into 6
fractions (data not shown). This good distribution is likely due to the number of fractions
collected. Although previous studies made no recommendation on the number of density
fractions to be collected, we suggest that six or seven fractions should be considered very
appropriate for the calculation based on the model of Riens et al. (1991). Although we did
not observe significant difference in the distribution of the markers when 8 fractions were
9

collected (data not shown), however, a high (n ≥ 8) or low (n ≤ 5) number of fractions
could falsify criteria for the best fit for the calculation of the distribution of metabolites
between the compartments. The reader is referred to Riens et al. for details of calculations
used in assessing compartmental distribution of metabolites and on goodness-of-fit criteria
used. Overall, the distribution of the chlorophyll and the marker enzymes in the six
fractions is comparable with many other previous works carried out on leaves of spinach
(Gerhardt and Heldt, 1984; Riens et al., 1991; Stitt et al., 1989; Weiner et al., 1989) and
pea (Sharkey and Vanderveer, 1989). More specifically, Sharkey and Vanderveer (1989)
suggested chlorophyll as a chloroplastic marker because they did not find significant
differences between this marker and glyceraldehyde-3-P-dehydrogenase). They also noted
high proportion of chlorophyll in fractions two and three (lightest fractions) which may
reflect challenges in fractionating leaf material since a typical plant cell contains fragile
subcellular organelles, while being surrounded by a strong cell wall.
3.2. Spatially profiling of metabolites by GC-MS
To our knowledge, there are few published reports on the metabolic profiles of soybean
leaves. Our GC-MS analyses of the fractionated soybean leaf material in this study
identified over 200 resolved peaks. Approximately 50% of these peaks could be identified
as discrete metabolites with known chemical structure (Table 1). These identified
metabolites represent numerous metabolic pathways and photosynthates involved in
biosynthesis and breakdown, including processes such as starch biosynthesis (e.g. hexoses
and phosphorylated metabolites), starch breakdown (e.g. maltose), phenolic and related
compound metabolism (e.g. shikimic acid). The identification of cyclitols (e.g. pinitol and
10

inositol) suggests also that our plant material was exposed to environmental stress since
plant leaves were harvested at maturity during a drought period during summer, although
samples were collected early morning. We also noted the presence of compounds, such as
ribonic acid and pipecolic acid, which are considered as intermediary moieties of specific
pathways such as alkaloid biosynthesis. Thus, from a purely fundamental point of view,
our metabolite profiling approach should be able to rapidly and accurately identify diverse
metabolic changes and the data can contribute to understanding physiological processes
that operate as a response to developmental, genetic and/or environmental changes (Lange,
2006; Weckwerth and Fiehn, 2002).
In addition to reporting on a large number of identified metabolites, the relative ratios of
profiled metabolite classes were estimated. Approximately 30% of identified components
were soluble sugars and sugar alcohols, while around 4% were represented by inositol,
myo-inositol, ascorbic acid and dehydroascorbic acid. Organic acids, primarily comprised
of TCA cycle intermediates, represented 20% of the identified metabolites, fatty acids 12%,
amino acids 16% and other compounds (e.g. glucaric acid, galactonic acids, saccharic acid)
represented 5%, while phenolic compounds represented around 10%. We also noted that
the most relatively abundant metabolites in stroma, cytosol and vacuoles (see later) are:
citric, succinic, malic and fumaric acids, glucose, fructose and sucrose, pinitol and myo-
inositol, and, β-alanine and glycine.
3.3 Compartmentation Analysis
11

The compartmentation of the major classes of metabolite was estimated by the three
compartmentation analysis method of Riens et al. (1991). As illustrated by Figure 2,
sugars, organic acids and fatty acids had a greater relative abundance in the vacuole with
50%, 55% and 50%, respectively, whereas amino acids showed a greater relative
abundance in the cytosol with 45%. Based on the calculation method adopted here, it is
apparent that the compartmental distribution showed a decreasing order from vacuole to
chloroplasts: vacuole > cytosol > stroma. Whilst we must of course consider the
interconnected issues of synthesis, transport and catabolism this decreasing order of
metabolite abundance suggests, at least in the soybean leaf studied here, that
photosynthates accumulate in compartments associated with biosynthetic activities i.e. the
vacuole and cytosol, to a greater extent than in the chloroplasts.
It was of considerable interest to note that not only major TCA cycle intermediates
accumulate in the vacuole compartment, but also other primary metabolites such as
maltose and mannitol, derived from starch breakdown or physiological stress, do also. The
presence of a high proportion of phenolic acids (p-coumaric, caffeic acid and ferulic acid)
in the vacuole also implies consistent phenylpropanoid biosynthesis suggesting metabolism
induced by one or more biotic or abiotic stresses (Dixon and Pavla, 1995; Wingler et al.,
2000). The phenylpropanoid pathway leads to lignin biosynthesis suggesting, at least in
part, the beginning of senescence. The low levels of glutamic acid and alanine in the
vacuolar compartment (Table 2) and the high portion of glycine in chloroplast
compartment (Table 2) may suggest low storage of nitrogen in leaves, and the ready export
12

of amino acid, as it has been earlier reported that amino acids accumulation is greater in
the sink than in the source in soybean leaves (VerNooy and Lin, 1986).
These and other findings highlight the complexity of metabolism where all pathways are
interconnected and plant tissues are comprised of more than one cell type giving
heterogenic organelle preparations (Lunn, 2007). Only through greater spatial resolution
can we understand the role of subcellular synthesis and different transport phenomena in
plants. As such, this highlights the value in studying metabolome compartmentation. This
can be illustrated by considering sucrose which, as we all know, has a central role in
carbohydrate metabolism. A vast literature reports that sucrose metabolism takes place in
the cytosol (Baroja-Fernández et al., 2001; Koch, 1996). Its distribution in the cytosol was
shown to be 100% in spinach leaves (Riens et al., 1991), while in potato tubers the figure
is only 17% (Farré et al., 2001). New findings in the regulation of carbohydrate continue
apace. For example, it was recently hypothesized that the presence of maltose during light
periods is a bridge between transitory starch breakdown and the plant’s adaptation to
change in environmental conditions. Since the biochemical pathways of synthesis and
degradation of transitory starch is still not fully understood (Lu and Sharkey, 2006;
Zeeman et al., 2004), a role for spatial metabolic profiling methods is clearly suggested.
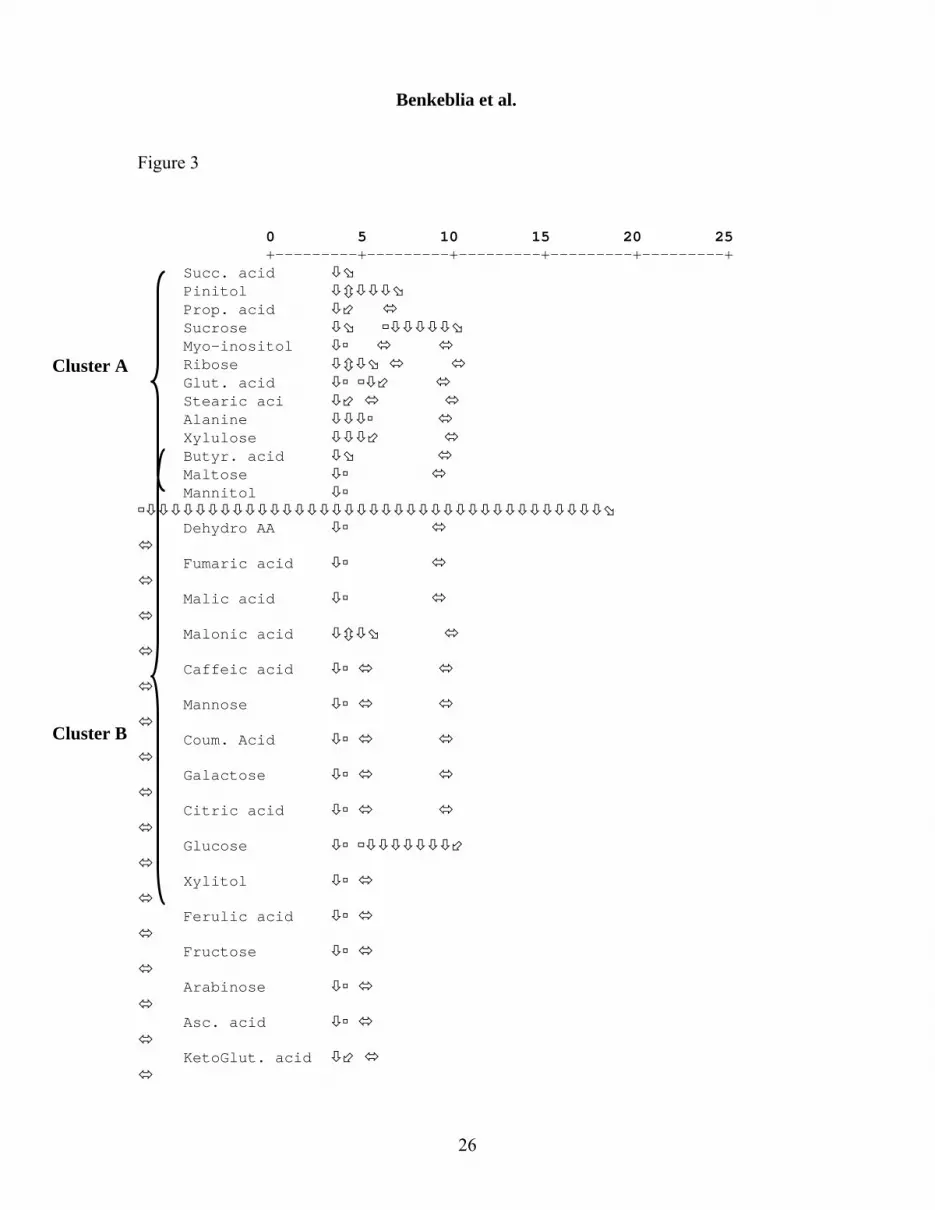
Hierarchical cluster analysis (HCA) was also performed on the highest abundant
metabolites from the total identified metabolites. The distribution of these metabolites is
shown in Table 2. We noted that first cluster (A) contains compounds which are present at
higher relative abundances in the cytosol, while cluster B and cluster C comprise the most
13

abundant compounds in the vacuole and stroma, respectively. Surprisingly and given the
variability of the different metabolites, we did not observe from one compartment any
value for a given metabolite less than 5% of the overall abundance. Values ≤ 20%
represented only 17% of the total values reported in Table 2. Given this variability within
the calculated values, we might suggest that it is not appropriate to consider a distribution
value below 5% and this value could constitute the limit of detection required to presume
the presence of a given metabolite.
Whilst the compounds in the cluster A are relatively abundant in the cytosol, their relative
distribution in stroma and vacuole still represents over 20% of total abundance. Cluster A
also included stress related compounds such as pinitol and myo-inositol. We noted that a
great portion of glutamic acid and alanine was compartmentalized in the cytosol, while a
greater portion of glycine was observed in the stroma (Cluster C). The greater portion of
glutamic acid and alanine in the cytosol is likely due to the difficult situation where no
appropriate separation of the mitochondria and the cytosol compartments has been
achieved using NAQF procedure (Gerhardt and Heldt, 1984). The reactions of amino
acids are compartmentalized mainly in mitochondria (Oaks and Bidwell, 1970) although
there is evidence that many enzymes involved in amino acid biosynthesis are found also in
the cytosol (Miflin and Lea, 1977).
The compounds in cluster B are abundant and preferrentially compartmentalized in the
vacuole, while their relative abundances in the stroma very low except for glucose. Cluster
B included the main part of sugars and almost total secondary metabolites indicating that
major carbohydrate, flavonoid and phenylpropanoid accumulation occurs in the vacuole
during this mature stage. Major part of TCA cycle organic acids were found to be in
14

vacuole, and this suggests that there is a large pool of organic acids located in this
organelle, while a relatively small one in other organelles. This high amount of organic
acids in vacuole has also been reported in many species (Martinoia and Rentsch, 1994,
Martinoia et al., 2000). As for organic acids, major sugars also accumulate in vacuole,
because it is generally admitted that these organelles are storage compartments of a large
variety of organic compounds, and have multiple functions ((Martinoia et al., 2007; Matile,
1977).
Cluster C is minor and the two compounds are distributed one half in stroma and one half
is almost equally divided between cytosol and vacuole. Biologically, no specific metabolic
pathway, such as glycolate pathway, suggests itself. We did not confirm the presence of
glyoxylate, easily oxidized to oxalic acid (Richardson and Tolbert, 1961), although
glycolate is known to play a role as an activator of fatty acids biosynthesis (Castelfranco et
al., 1955).
4. Concluding Remarks
In conclusion, a procedure for NAQF and GC-MS analysis of soybean leaf tissue as
described above has been described. A large number of metabolites have been identified
and our prelimnary analysis suggest we can demonstrate the degree of subcellular
compartmentalization of these metabolites. This can, at least in principle, lead to
hypotheses on the role of compartmentalization in the regulation of metabolite synthesis.
Comparative analyses of plants exposed to different abiotic and biotic stresses will prove
particularly useful and unpublished studies are pending.
15

Acknowledgements
The authors would like to thank Dr L.W. Sumner, and The Samuel Roberts Noble
Foundation, Ardmore, Oklahoma, USA, for their hosting and their technical assistance to
Dr. N. Benkeblia. The assistance of Dr. E. Urbanczyk-Wochniak is also acknowledged.
This research was partially supported by the Ministry of Education, Science, Sports and
Culture, Grant-in-Aid for Scientific Research (B), 17658144, 2005.
References
Allen, L.H., Bisbal, E.C. and Boote, K.J. (1998) Nonstructural carbohydrates of soybean
plants grown in subambiant and superambiant levels of CO2. Photosynth. Res. 56, 143–
155.
Baroja-Fernández, E., José Muñoz, F., Akazawa, T. and Pozueta-Romero, J. (2001)
Reappraisal of the currently prevailing model of starch biosynthesis in photosynthetic
tissues: A proposal involving the cytosolic production of ADP-glucose by synthase and
occurrence of cyclic turnover of starch in chloroplast. Plant Cell 42, 1311–1319.
Broeckling, C.D., Huhman, D.V., Farag, M.A., Smith, J.T., May, G.D., Mendes, P., Dixon,
R.A. and Sumner, L.W. (2005) Metabolic profiling of Medicago truncatula cell
cultures reveals the effects of biotic and abiotic elicitors on metabolism. J. Exp. Bot. 56,
323–336.
Broeckling, C.D., Reddy, I.R., Duran, A.L., Zhao, X., and Sumner, L.W. (2006) MET-
IDEA: a data extraction tool for mass spectrometry-based metabolomics. Anal. Chem.
78, 4334–4341.
16

Brown, M., Dunn, W.B., Ellis, D.I., Goodacre, R., Handl, J., Knowles, J.D., O’Hagan, S.,
Spasić, I. and Kell, D.B. (2005) A metabolome pipeline: from concept to data to
knowledge. Metabolomics 1, 39–51.
Browsher, C.G. and Tobin, A.K. (2001) Compartmentation of metabolism within
mitochondria and plastids. J. Exp. Bot. 52, 513–527.
Castelfranco, P., Stumpf, P.K. and contopoulou, R. (1955) Fat metabolism in higher plants.
J. Biol. Chem. 217, 567–277.
Dixon, R.A. and Pavla, N.L. (1995) Stress-induced phenylpropanoid metabolism. Plant
Cell 7, 1085–1097.
Dunn, W.B. and Ellis, D.I. (2005) Metabolomics, Current analytical platforms and
methodologies. Trends Anal. Chem. 24, 285–294.
Farré, E.M., Tiessen, A., Roessner, U., Geigenberg, P., Trethewey, R.N. and Willmitzer, L.
(2001) Analysis of the compartmentation of glycolytic intermediates, nucleotides,
sugars, organic acids, amino acids, and sugat alcohols in potato tubers using a
nonaqueous fractionation method. Plant Physiol. 127, 685–700.
Fridman, E. and Pichersky, E. (2005) Metabolomics, genomics, proteomics, and the
identification of enzymes and their substrates and products. Curr. Opin. Plant Biol. 8,
242–248.
Gerhardt, R. and Heldt, H.W. (1984) Measurement of subcellular metabolite levels in
leaves by fractionation of freeze-stopped material in nonaqueous media. Plant Physiol.
75, 542–547.
17
Goodacre, R., Vaidyanathan, S., Dunn, W.B., Harrigan, G.G. and Kell, D.B. (2004)
Metabolimics by numbers: acquiring and understanding global metabolite data. Trends
Biotechnol. 22, 245–252.
Hartwell, J., Nimmo, G.A., Wilkins, M.B., Jenkins, G.I. and Nimmo, H.G. (2002) Probing
the circadian control of phosphoenolpyruvate carboxylase kinase expression in
Kalanchoë fedtschenkoi. Funct. Plant Biol. 29, 663–668.
Kell, D. (2004) Metabolomics and systems biology: making sense to the soup. Curr. Opin.
Microbiol. 7, 296–307.
Koch, K.E. (1996) Carbohydrate-modulated gene expression in plants. Annu. Rev. Plant
Physiol. Plant Mol. Biol. 47, 509–540.
Lane, M.D,, Maruyama, H. and Easterday R.L. (1969) Phosphoenolpyruvate carboxylase
from peanut cotyledons. Methods Enzymol. 13, 277–283.
Lange, B.M. (2006) Integrative analysis of metabolic networks: from peaks to flux model.
Curr. Opin. Plant Biol. 9, 220–226.
Li, Y. (1967) Studies on the glycosidases in Jack bean meal. J. Biol. Chem. 26, 5474–5480.
Lu, Y. and Sharkey, T.D. (2006) The importance of maltose in transitory starch breakdown.
Plant Cell Environ. 29, 353–366.
Lunn, J.E. (2007) Compartmentation in plant metabolism. J. Exp. Bot. 58, 3–547.
Martinoia, E. and Rentsch, D. (1994) Malate compartmentation–responses to a complex
metabolism. Annu. Rev. Plant Physiol. 45, 447–467.
Martinoia, E., Massonneau, A. and Frangne, N. (2000) Transport processes of solutes
across the vacuolar membrane of higher plants. Plant Cell Physiol. 41, 1175–1186.
18

Martinoia, E., Maeshima, M. and Neuheus, E. (2007) Vacuolar transporters and their
essential role in plant metabolism. J. Exp. Bot. 58, 83–102.
Matile, P. (1977) Biochemistry and function of vacuoles. Annu. Rev. Plant Plant Physiol.
29, 193–213.
Miflin, B.J. and Lea, P.J. (1977) Amino acid metabolism. Annu. Rev. Plant Physiol. 28,
299–329.
Oaks, A. and Bidwell, R.G.S. (1970) Compartmentation of intermediary metabolites. Annu.
Rev. Plant Physiol. 21, 43–66.
Richardson, K.E. and Tolbert, N.E. (1961) Oxidation of glyoxilic acid to oxalic acid by
glycolic acid oxidase. J. Biol. Chem. 236, 1280–1284.
Riens, B., Lohaus, G., Heineke, D. and Heldt, H.W. (1991) Amino acid, and sucrose
content determination in the cytosolic, chloroplastic, and vacuolar compartments and in
the phloem sap of spinach leaves. Plant Physiol. 97, 227–233.
Roessner, U., Wagner, C., Kopka, J., Trethewey, R.N. and Willmitzer, L. (2000)
Simultaneous analysis of metabolites in potato tuber by gas chromatography-mass
spectrometry. Plant J. 23, 131–142.
Sharkey, T.D. and Vanderveer, P.J. (1989) Stromal phosphate concentration is low during
feedback limited photosynthesis. Plant Physiol. 91, 679–684.
Stitt, M., McC. Lilley, R., Gerhardt, R. and Heldt, H. (1989) Metabolite level in specific
cells and subcellular compartments of plant leaves. Methods Enzymol. 174, 518–552.
VerNooy, C.D. and Lin, W. (1986) Amino acid transport in protoplast isolated from
soybean leaves. Plant Physiol. 81, 8–11.
19

Weckwerth, W. and Fiehn, O. (2002) Can we discover novel pathways using metabolomic
analysis? Curr. Opin. Biotechnol. 13, 156–160.
Weiner, H., Stitt, M. and Heldt, H.W. (1987) Subcellular compartmentation of
pyrophosphate and alkaline pyrophosphate in leaves. Biochim. Biophys. Acta 893, 13–
21.
Wingler, A., Lea, P.J., Quick, W.P. and Leegood, R.C. (2000) Photorespiration: metabolic
pathways and their role in stress protection. Phil. Trans. R. Soc. Lond. B 355, 1517–
1529.
Wintermans, J.F.G.M. and De Mots, A. (1965) Spectrophotometric characteristics of
chlorophylls a and b and their pheophytins in ethanol. Biochem. Biophys. Acta 109,
448–453.
Zeeman, S.C., Smith, S.M. Smith, A.M. (2004) The breakdown of starch in leaves. New
Phytol. 163, 247–261.
20
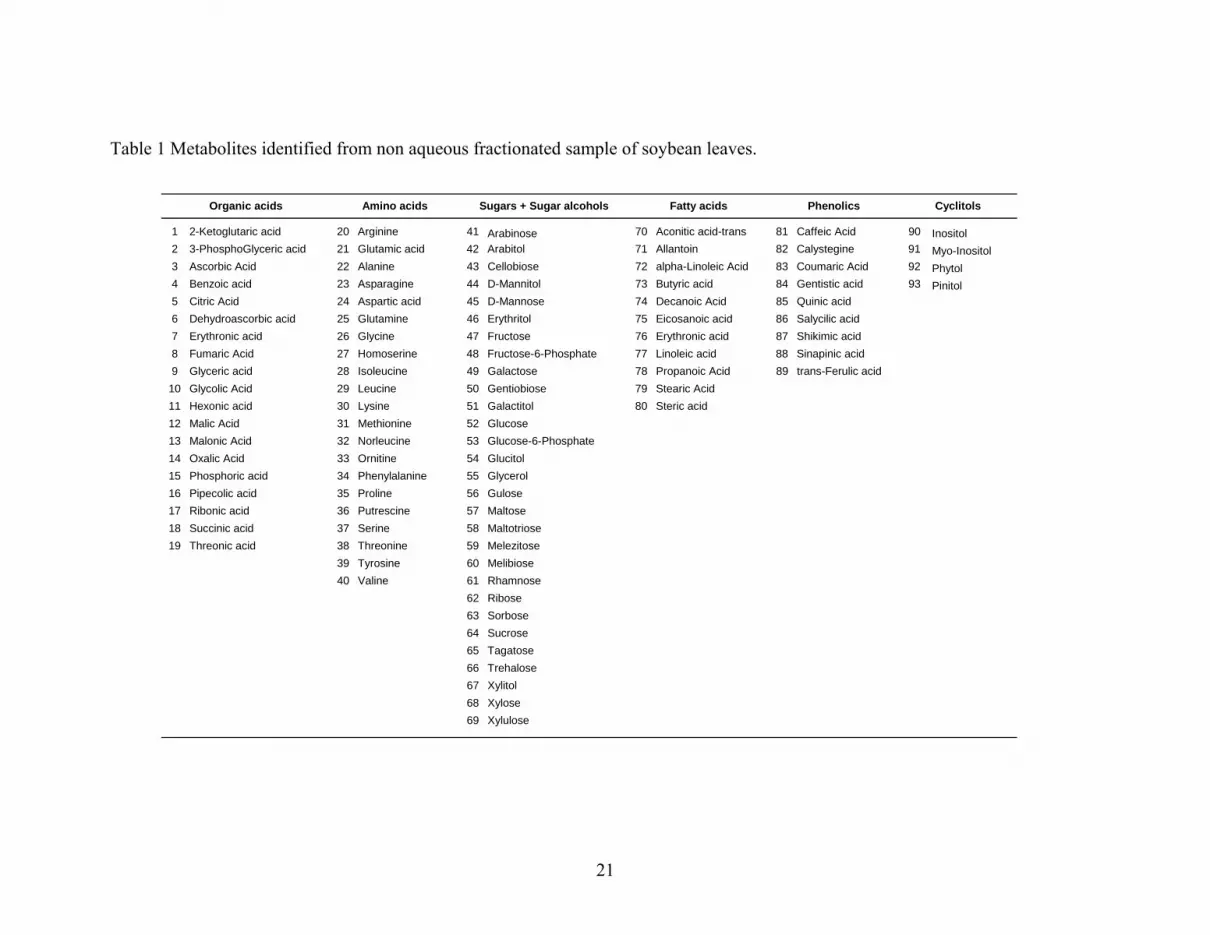
Table 1 Metabolites identified from non aqueous fractionated sample of soybean leaves.
1 2-Ketoglutaric acid 20 Arginine 41 Arabinose 70 Aconitic acid-trans 81 Caffeic Acid 90 Inositol2 3-PhosphoGlyceric acid 21 Glutamic acid 42 Arabitol 71 Allantoin 82 Calystegine 91 Myo-Inositol3 Ascorbic Acid 22 Alanine 43 Cellobiose 72 alpha-Linoleic Acid 83 Coumaric Acid 92 Phytol4 Benzoic acid 23 Asparagine 44 D-Mannitol 73 Butyric acid 84 Gentistic acid 93 Pinitol5 Citric Acid 24 Aspartic acid 45 D-Mannose 74 Decanoic Acid 85 Quinic acid6 Dehydroascorbic acid 25 Glutamine 46 Erythritol 75 Eicosanoic acid 86 Salycilic acid7 Erythronic acid 26 Glycine 47 Fructose 76 Erythronic acid 87 Shikimic acid8 Fumaric Acid 27 Homoserine 48 Fructose-6-Phosphate 77 Linoleic acid 88 Sinapinic acid9 Glyceric acid 28 Isoleucine 49 Galactose 78 Propanoic Acid 89 trans-Ferulic acid
10 Glycolic Acid 29 Leucine 50 Gentiobiose 79 Stearic Acid11 Hexonic acid 30 Lysine 51 Galactitol 80 Steric acid12 Malic Acid 31 Methionine 52 Glucose13 Malonic Acid 32 Norleucine 53 Glucose-6-Phosphate14 Oxalic Acid 33 Ornitine 54 Glucitol15 Phosphoric acid 34 Phenylalanine 55 Glycerol16 Pipecolic acid 35 Proline 56 Gulose17 Ribonic acid 36 Putrescine 57 Maltose18 Succinic acid 37 Serine 58 Maltotriose19 Threonic acid 38 Threonine 59 Melezitose
39 Tyrosine 60 Melibiose40 Valine 61 Rhamnose
62 Ribose63 Sorbose64 Sucrose65 Tagatose66 Trehalose67 Xylitol68 Xylose69 Xylulose
Phenolics CyclitolsOrganic acids Amino acids Sugars + Sugar alcohols Fatty acids
21

Table 2 Subcellular distribution of the relatively most abundant and important
metabolites profiled in mature soybean leaves. Estimation was calculated using the three-
compartment calculation as described in Materials and Methods.
Stroma Cytosol Vacuole3 Succinic acid 27 38 3528 Pinitol 27 39 3411 Propionic acid 26 40 3429 Myo-inositol 32 38 3113 Glucose 29 31 409 Glutamic acid 21 50 29
Cluster A 19 Ribose 26 49 2512 Stearic acid 18 57 2415 Sucrose 25 55 218 Alanine 30 61 921 Xylulose 36 48 161 Oxalic acid 52 29 187 Glycine 44 29 2714 Fructose 12 27 6123 Xylitol 11 26 645 Malic acid 12 24 624 Fumaric acid 11 23 6625 α ketoglutaric acid 10 32 58
Cluster B 26 Ascorbic acid 12 30 5916 Maltose 7 35 5817 Galactose 24 27 4922 Arabinose 22 31 4710 Butyric acid 14 36 5020 Cellobiose 12 42 466 Citric acid 5 17 7818 Mannose 7 17 7631 Ferulic acid nd 22 78
Cluster C 24 Mannitol nd nd 10027 Dehydroascorbic acid nd nd 1002 Malonic acid nd 8 9232 Caffeic acid nd 9 9130 ρ-Coumaric acid nd 12 88
22

Legends to Figures
Figure 1. Distribution and fractionation (A), and comparative regression correlations (B)
of marker enzymes and chlorophylls in a non aqueous gradient obtained from dried
mature soybean leaves.
Figure 2. Subcellular distribution of the relatively most abundant profiled metabolites in
mature soybean leaves evaluated from six fraction and calculated as described in
Materials and Methods.
Figure 3. Dendogram showing the Hierarchical Cluster Analysis (HCA) of the relatively
most abundant and important profiled metabolites in mature soybean leaves. HCA was
done on extracts obtained from non-aqueous fractionated plant material and subcellular
distributed metabolites.
23

Figure 1
0.0 0.5 1.0 1.5 2.0 2.50.0
0.5
1.0
1.5
2.0
2.5y = 1.02 x - 0.32
R2 = 0.93
Chl / PEPC
Man
n / P
EPC
1 2 3 4 5 60
10
20
30
40
50
60 Chl Mannosidase PEPC
Low d High dFraction
% T
otal
A
B
24

Benkeblia et al.
Figure 2
Sugars
Organic acids
Amino acids
Fatty acids
Profiled metabolites
50%
20% 38% 43%
15% 35% 50%
29%45%
27%
21% 24%55%
17%33%
Stroma Cytosol Vacuole
25
Benkeblia et al.
Figure 3
0 5 10 15 20 25 +---------+---------+---------+---------+---------+ Succ. acid Pinitol Prop. acid Sucrose Myo-inositol Ribose Glut. acid Stearic aci Alanine Xylulose Butyr. acid Maltose Mannitol
Dehydro AA
Fumaric acid
Malic acid
Malonic acid
Caffeic acid
Mannose
Coum. Acid
Galactose
Citric acid
Glucose
Xylitol
Ferulic acid
Cluster A
Cluster B
Fructose
Arabinose
Asc. acid
KetoGlut. acid
26

Cellobiose
Oxalic acid
Cluster C
Glycine
27


