Embed Size (px)
Citation preview

ORIGINAL PAPER
Metabolism, Compartmentation, Transport and Productionof Acetate in the Cortical Brain Tissue Slice
Caroline Rae • Aurelie D. Fekete •
Mohammed A. Kashem • Fatima A. Nasrallah •
Stefan Broer
Received: 30 January 2012 / Revised: 12 July 2012 / Accepted: 13 July 2012 / Published online: 1 August 2012
� Springer Science+Business Media, LLC 2012
Abstract Acetate is a two carbon intermediate in metab-
olism. It is an accepted marker of astrocytic metabolism, and
a substrate for production of metabolites such as glutamine,
glutamate and GABA. However, anomalies exist in the
current explanations of compartmentation and metabolism
of acetate. Here, we investigated these anomalies by exam-
ining transport, production and metabolism of acetate.
Acetate is a good substrate for the neuronal monocarboxylate
transporter MCT2 (KM = 2.58 ± 0.8) and the glial MCT1
but a poor substrate for the glial MCT4. Acetate is accu-
mulated by brain cortical tissue slices to concentrations in
excess of those in the media, suggesting active transport,
possibly via the sodium dependent SMCT. [2-13C]Acetate is
produced from [3-13C]pyruvate, [3-13C]lactate and
[1-13C]glucose with the rate of production related to acetyl-
CoA levels, which is likely generated in a ubiquitous cyto-
solic compartment via acetyl-CoA hydrolase. Citrate
breakdown occurs in response to demand for acetyl-CoA
units; this citrate is not derived from acetate carbon but its
fate is influenced by acetate levels. Finally, use of acetate is
altered by levels of nicotinamide or NAD?. This suggests
that metabolism of acetate is controlled rigorously at the
enzyme level, via changes in the acetylation status of acetyl-
CoA synthetase and is not regulated by restriction of uptake.
Keywords Acetate � 13C NMR spectroscopy �Neuron-glia interactions
Introduction
Glucose is the mandatory substrate for energy supply in the
brain. Brain can also use the glucose catabolites lactate,
pyruvate and acetate. Both pyruvate [1] and lactate have
been shown to be adequate substrates for brain metabolism
(Fig. 1) although there is some debate about the full extent
to which they can subserve brain activity [2, 3]. Acetate has
long been considered a marker for glial metabolism where
it is incorporated mostly into glutamine, with label also
reported from a small glutamate pool [4].
Acetate must be metabolized by conversion to acetyl-
CoA in a reaction catalysed by acetyl-CoA synthetase (E.C.
6.2.1.1); this reaction requires ATP and releases pyrophos-
phate. Two isoforms are known in mammalian cells [5].
AceCS2 is a mitochondrial isoform channeling acetate into
the TCA cycle, while AceCS1 is a cytosolic isoform, which
provides acetyl-CoA for fatty acid biosynthesis. Acetate
units (Fig. 1) are also used in the brain for lipid synthesis [6],
for acetylation of histone proteins in the nucleus [7], for
synthesis of the neurotransmitter acetylcholine [8] and for
many other acetylated compounds such as N-acetylaspartate,
N-acetylaspartylglutamate and acetylcarnitine.
Both AceCS isoforms are subject to complex layers of
regulation; the cytosolic form is increased by the presence
of acetate which may come from a variety of sources, such
as via blood from oxidation of ingested ethanol, from
histone deacetylases, or by the activity of the ubiquitous
acetyl-CoA hydrolase. AceCS2 levels are induced by
ketogenic conditions but the mechanisms of this induction
Special Issue: In Honor of Leif Hertz.
C. Rae (&) � A. D. Fekete � M. A. Kashem � F. A. Nasrallah
Neuroscience Research Australia, and Brain Sciences,
University of New South Wales, Barker St, Randwick,
NSW 2031, Australia
e-mail: [email protected]
S. Broer
Research School of Biology, The Australian National University,
Canberra, ACT 0200, Australia
123
Neurochem Res (2012) 37:2541–2553
DOI 10.1007/s11064-012-0847-5

remain unclear. In the brain AceCS activity is found in
both neurons and glia with a mostly mitochondrial distri-
bution, although a small but significant fraction of it is also
likely to be found in the cytosol [9, 10].
AceCS isoforms are also subjected to post-translational
regulation via acetylation under control of the deacetylat-
ing silent information regulator protein family, the Sirtuins.
Specifically, AceCS1 is regulated by SIRT1 and AceCS2
by SIRT3 [11]. Sirtuins are under cellular control via
NAD?; nicotinamide is an inhibitor of the deacetylase
reaction such that low-energy status may turn off energy
consuming reactions such as AceCS. In the brain, SIRT1 is
located mostly, if not exclusively, in neurons [12].
Acetate is taken up and metabolized by neurons in
culture [13] as well as by hippocampal nerve terminals [8]
and in whole rat brain [14]. It is a poor substrate for cortical
tissue slices and needs to be used in conjunction with
substrates such as glucose for adequate slice respiration
[15, 16]. In vivo, acetate is rapidly incorporated into glu-
tamine, GABA, glutamate and aspartate, with the highest
specific activity in glutamine.
Acetate is a substrate for the monocarboxylate trans-
porters (MCTs). These are members of the SLC16 family
and are proton symporters with a wide range of monocarb-
oxylate substrates. MCT1 is a low affinity transporter found
mainly in the blood–brain barrier. Lower levels are found in
astrocytes throughout the brain. MCT2 on the other hand is
generally a higher affinity transporter found in neurons in the
post-synaptic density [17, 18]. MCT4 is a low affinity
transporter and is selectively expressed in astrocytes [19].
Recently another lactate transporter family has been
described which is sodium dependent. SMCT1 (sodium-
dependent monocarboxylate transporter 1; SLC5A8) is a
high-affinity transporter found in neurons, while SMCT2
(SLC5A12) has been reported in glial cells [20].
Waniewski and Martin [21] suggested that the reason
acetate is a relatively poor substrate for neurons was due to
transporter affinity, based on poor uptake of acetate by syn-
aptosomal fractions compared to astrocytes. The uptake of
acetate by neurons was not measured in this work, and their
findings disagreed with the earlier results of Clarke et al. who
showed that acetate is taken up avidly by synaptosomes,
where, rather than being metabolized, it is used to acetylate
synaptosomal proteins. This acetate is released upon activa-
tion of sodium channels, suggesting that acetylation reactions
are involved in dynamic regulation of synaptic activity [22].
Here, we investigated the basis of the compartmentation of
acetate metabolism by studying its metabolic fates in Guinea
pig brain cortical tissue slices along with a range of competing
substrates, and its transport in Xenopus oocytes to clarify
which MCT isoforms are capable of transporting acetate.
Methods
Materials
Guinea pigs (Dunkin-Hartley), weighing 400–800 g, were fed
ad libitum on standard Guinea pig/rabbit pellets, with fresh
cabbage leaves and lucerne hay roughage. Animals were main-
tained on a 12 h light/dark cycle. All experiments were con-
ducted in accordance with the guidelines of the National Health
and Medical Research Council of Australia and were approved
by the institutional (UNSW) Animal Care Ethics Committee.
Sodium [3-13C]pyruvate, sodium [3-13C]L-lactate, sodium
[2-13C]acetate and [1-13C]D-glucose and sodium [13C]formate
Fig. 1 Cartoon showing metabolism of acetate in the brain
2542 Neurochem Res (2012) 37:2541–2553
123

were purchased from Cambridge Isotope Laboratories Inc
(Andover, MA, USA). Sodium pyruvate, sodium lactate,
sodium acetate, nicotinamide, NAD? and ethylenediamine-
tetraacetic acid (EDTA) were purchased from Sigma-Aldrich
(St Louis, MO). All other reagents were of Analytical Reagent
grade.
Other data were taken from experiments that have
already been published, including those with AR-C122982,
a potent, specific MCT inhibitor [23], those with ligands
active at GABA(B) receptors [24] and those examining the
effect of blocking transport of alanine [25]. 1H MRS
spectra obtained from these experiments were used to
measure the amount of 13C-labelled acetate present using
the resolved 13C-satellite resonance at d = 1.78 ppm. The
data from a previously published experiment examining
metabolism of 5 mM [1-13C]D-glucose in the presence of
the inhibitor 4-hydroxycyanocinnamate (7 mM) [23] was
also examined for acetate production.
Acetate Uptake in Xenopus Oocytes
Uptake of [14C]acetate in Xenopus laevis oocytes was
carried out as described in detail previously [26–28]. A
series of concentrations were used and the uptake rate
calculated using [14C]acetate standards to obtain KM. In
flux experiments the activity of non-injected oocytes was
subtracted at all substrate concentrations to correct for
endogenous uptake of monocarboxylates. Endogenous
uptake of monocarboxylates in oocytes is Na?-dependent
and therefore is not observed when monocarboxylate
uptake is monitored by pH-sensitive microelectrodes [29].
Preparation of Brain Cortical Tissue Slices
Following cervical dislocation, guinea pig brains were
removed from the cranial vault and 350 lm paraxial cortical
slices were obtained using a McIlwain tissue chopper. The
slices were then washed three times in a modified Krebs-
Henseleit buffer [15], resuspended for 1 h in fresh buffer
containing 10 mmol/L unlabelled glucose and gassed with
95 % O2/5 % CO2 in a shaking water bath, maintained at
37 �C, to allow metabolic recovery [30]. Slices were then
washed three times in glucose-free buffer and resuspended in
fresh buffer with the substrate of choice.
Synthesis of Acetate from Various Substrates in Brain
Cortical Tissue Slices
To determine labeling patterns from each substrate a
number of experiments were made where label fate and
pool sizes were monitored in the presence and absence of
competing monocarboxylates. The scope of these experi-
ments was limited by the requirement to maintain brain
slice respiration at maximal rates so that changes in
metabolism did not reflect simple limitations on mito-
chondrial respiration rates due to substrate unavailability.
The following experiments were performed:
To determine the effect of competing acetate with
pyruvate:
1. 2 mM sodium [3-13C]pyruvate
2. 2 mM sodium [3-13C]pyruvate plus 5 mM sodium
acetate
3. 2 mM sodium pyruvate plus 5 mM sodium
[2-13C]acetate
Five mM acetate was chosen to fully saturate both MCT1
and MCT2. Historically, this concentration of acetate has
been shown to be metabolized mostly in an astrocyte pool if
metabolism is limited to a short time frame [15].
To determine the effect of competing acetate with
lactate:
1. 0.74 mM sodium [3-13C]lactate and 2 mM D-glucose
2. 0.74 mM sodium [3-13C]lactate and 2 mM D-glucose
plus 5 mM sodium acetate
3. 0.74 mM sodium lactate and 2 mM D-glucose plus
5 mM sodium [2-13C]acetate.
This concentration of lactate was chosen to compete
mainly at MCT2 (KM = 0.74 mM, Table 1) and less so at
MCT1 (KM = 5.6 mM, Table 1). We added 2 mM glucose
to allow the slices to maintain their respiratory rate at
adequate levels as 0.74 mM lactate is an insufficient
amount of substrate to maintain respiration [30].
To determine the effect of competing lactate with
pyruvate:
1. 2 mM sodium [3-13C]pyruvate
2. 2 mM sodium [3-13C]pyruvate plus 0.74 mM sodium
lactate
3. 2 mM sodium pyruvate plus 0.74 mM sodium
[3-13C]lactate
To determine the effect of modulating levels of NAD?
or nicotinamide on acetate metabolism:
1. 5 mM D-glucose and 5 mM sodium [2-13C]acetate
2. 5 mM D-glucose and 5 mM sodium [2-13C]acetate plus
250 lM NAD?
3. 5 mM D-glucose and 5 mM sodium [2-13C]acetate plus
250 lM nicotinamide.
All experiments with lactate and pyruvate as substrates
were incubated for 60 min, while the experiment with
glucose was incubated for 90 min.
To measure citrate in the 13C spectrum, 4 mM EDTA was
added to the samples to chelate paramagnetic species and
sharpen the resonance [15] and 13C NMR spectra of these
samples were reacquired. This was not successful with the
Neurochem Res (2012) 37:2541–2553 2543
123
experiment with lactate and pyruvate as the samples had
deteriorated due to repeated removal from the NMR tubes
and signal to noise was poor. Instead the citrate concentration
was estimated from the broadened metal-bound resonance.
The number of samples was N = 4 in all cases.
Preparation of Samples and NMR Analysis
On completion of the incubation period, slices were removed
from the incubation buffer by rapid filtration and extracted in
methanol/chloroform according to the method of Le Belle
[31]. Extracts were lyophilized, and the pellet retained for
protein estimation by the Lowry technique. Lyophilized
supernatants were stored at -20 �C until required for NMR
analysis. Samples were resuspended in 0.60 mL D2O con-
taining 2 mM sodium [13C]formate as an internal intensity
and chemical shift reference (13C d 171.8). Fully relaxed 1H
and 1H[13C-decoupled] spectra (total cycle of 30 s, compris-
ing 24 s relaxation delay, 4 s water suppression and *1 s
acquisition time), WURST-40 [32] with a 112-step phase
cycle [33], decoupling during acquisition) were obtained at
800.15 MHz on a Bruker Avance-III 800 MHz spectrometer
equipped with a TCI cryoprobe probe, followed by 13C
[1H-decoupled] spectra (800 transients, cycle of 4 s com-
prising 2 s relaxation delay and *2 s acquisition time, con-
tinuous WALTZ-65 decoupling, 185180 data points).
Assignments were made as described previously [34].13C [1H-Decoupled] spectra were Fourier transformed
using 1 Hz exponential line-broadening and peak areas
were determined by integration using standard Bruker
software (TOPSPIN, Version 1.3, or 2.5) following base-
line correction. Peak areas were adjusted for nuclear
Overhauser effect, saturation and natural abundance effects
and quantified by reference to the area of the internal
standard resonance of [13C]formate. Glu C3 was not
quantified due to resonance overlap with pyruvate signal.
Metabolite pool sizes (lactate, alanine, GABA, glutamate,
glutamine and aspartate) were determined by integration of
resonances in fully relaxed 800 MHz 1H[13C-decoupled]
spectra using [13C]formate as the internal intensity refer-
ence. The amount of acetate labeled with 13C at C2 was
also determined from the 13C satellite at d = 1.776 ppm in
the fully-relaxed 1H NMR spectrum.
Experimental data (N = 4) are given as means (standard
deviation). Statistical analysis was done using ANOVA for
comparing experimental interventions with control (N = 4,
followed, only where statistical significance was indicated by
Scheffe F test, by a nonparametric (Mann–Whitney U) test
(Statview Student)). Significance was assumed at a = 0.05.
Principal Components Analysis
In order to discover what metabolic factors influence the
presence of labeled acetate in the cortical tissue slice we
constructed a statistical model using data from previously
published experiments [35, 36], but also including integrals
from the CH313C satellites of acetate C2. Fifteen variables
from 163 experiments were used as input for a principal
components model using Simca P? (v11.5, Umetrics,
Umea, Sweden). Each dataset for a particular manipulation
was imported as the relative change from the average value
obtained from the control group for that particular experi-
ment. Data were univariance scaled to standardize variance
between the high and low concentration metabolites [37],
to ensure that the 13C labelling and steady state pool size
concentrations equally contributed to the model.
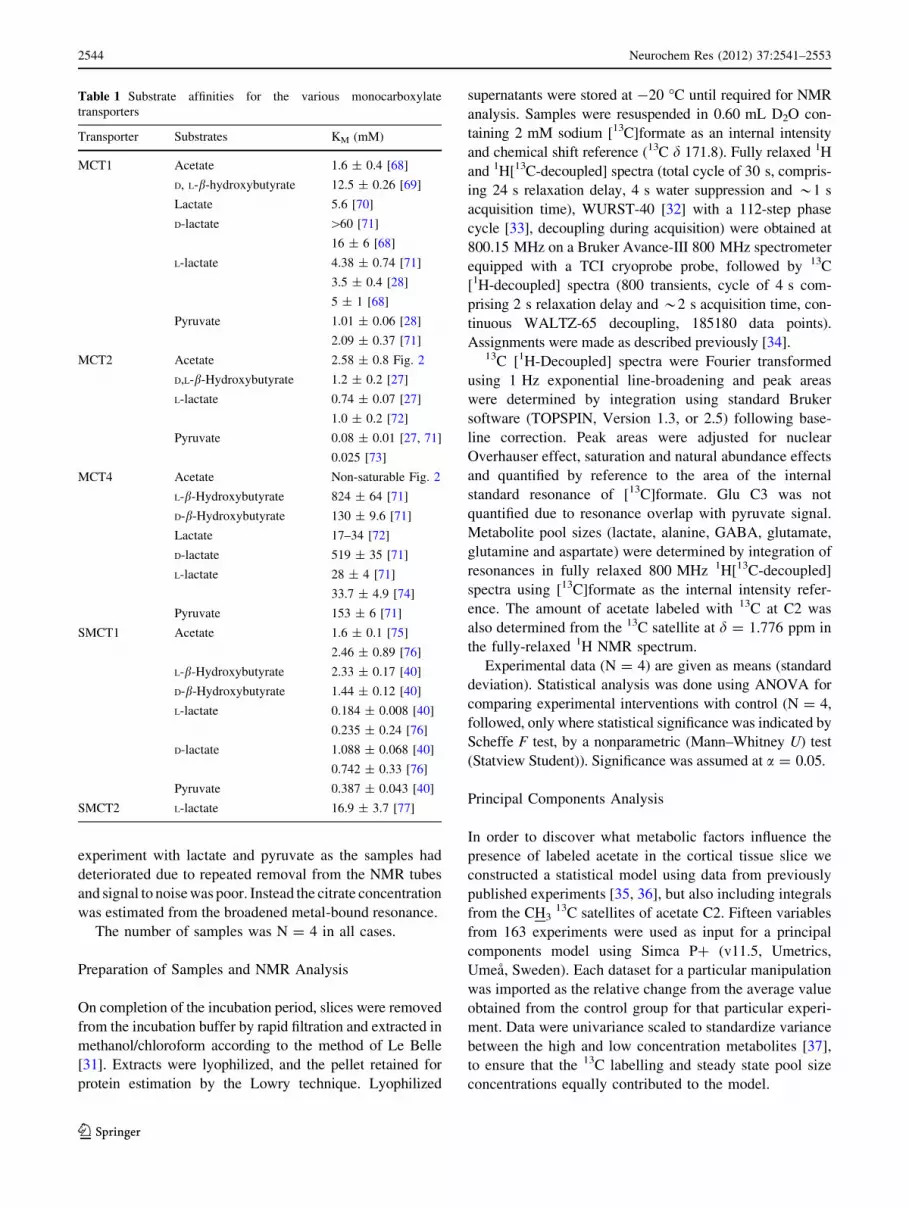
Table 1 Substrate affinities for the various monocarboxylate
transporters
Transporter Substrates KM (mM)
MCT1 Acetate 1.6 ± 0.4 [68]
D, L-b-hydroxybutyrate 12.5 ± 0.26 [69]
Lactate 5.6 [70]
D-lactate [60 [71]
16 ± 6 [68]
L-lactate 4.38 ± 0.74 [71]
3.5 ± 0.4 [28]
5 ± 1 [68]
Pyruvate 1.01 ± 0.06 [28]
2.09 ± 0.37 [71]
MCT2 Acetate 2.58 ± 0.8 Fig. 2
D,L-b-Hydroxybutyrate 1.2 ± 0.2 [27]
L-lactate 0.74 ± 0.07 [27]
1.0 ± 0.2 [72]
Pyruvate 0.08 ± 0.01 [27, 71]
0.025 [73]
MCT4 Acetate Non-saturable Fig. 2
L-b-Hydroxybutyrate 824 ± 64 [71]
D-b-Hydroxybutyrate 130 ± 9.6 [71]
Lactate 17–34 [72]
D-lactate 519 ± 35 [71]
L-lactate 28 ± 4 [71]
33.7 ± 4.9 [74]
Pyruvate 153 ± 6 [71]
SMCT1 Acetate 1.6 ± 0.1 [75]
2.46 ± 0.89 [76]
L-b-Hydroxybutyrate 2.33 ± 0.17 [40]
D-b-Hydroxybutyrate 1.44 ± 0.12 [40]
L-lactate 0.184 ± 0.008 [40]
0.235 ± 0.24 [76]
D-lactate 1.088 ± 0.068 [40]
0.742 ± 0.33 [76]
Pyruvate 0.387 ± 0.043 [40]
SMCT2 L-lactate 16.9 ± 3.7 [77]
2544 Neurochem Res (2012) 37:2541–2553
123

Results
Acetate Uptake by MCT2 and MCT4
Acetate was found to be a good substrate for MCT2 with a
Michaelis–Menten constant comparable to that of MCT1
(Fig. 2a). Acetate is a very poor substrate for MCT4 (Fig. 2b).
The potential use of acetate by any cell type in the brain
will depend on the availability of transport proteins and
metabolic enzymes that can convert acetate to acetyl-CoA.
In situ hybridization data from the Allen Brain Atlas
(http://mouse.brain-map.org) suggest that expression of the
mitochondrial acetyl-CoA synthetase 2 (AceCS2) in the
brain is extremely low. The cytosolic AceCS1, by contrast,
is found in significant amounts in all brain areas. In terms
of transport, the brain expresses MCT1, MCT2, MCT4 and
SMCT1. It appears that MCT2 and SMCT1 are largely
neuronal transporters, while MCT1 and MCT4 are
expressed in astrocytes. Apart from MCT4, all of these are
capable of transporting acetate with similar KM-values
(Fig. 2, Table 1). There is an argument that although the
KM for acetate is low enough, capacity is limited by low
levels of MCT2 expression in neurons. However, it is
evident from the residual 13C acetate signal that acetate
was accumulated by at least one brain compartment to
levels higher than in the medium. If this accumulation were
limited to just the astrocytic pool which is thought to me-
tabolise acetate (estimated at around 30 % of brain vol-
ume) this would mean that the concentration of acetate in
this compartment would be in the order of [30 mM.
Thus, it can be reasonably expected that acetate could
penetrate both astrocytes and neurons, but that this may
involve transporters other than MCTs.
Acetate Synthesis and Presence in NMR Spectra
Acetate is reliably present in 1H NMR spectra of cortical
tissue slices, appearing as a singlet resonance which is co-
resonant with the bCH2 of GABA at 1.8 ppm (Fig. 3). It is
difficult to know whether this acetate is endogenous or
whether it might arise due to a putative breakdown of N-
acetylaspartate in the extraction process. There is a doublet
(1JCH = 127.1 ± 0.03 Hz) which is collapsed by broad-
band 13C decoupling of the 1H spectrum, indicating that a
portion of the acetate present is also labeled with 13C at C2
(i.e. in excess of natural abundance at 1.1 %). This doublet
is present in 1H NMR spectra of brain slice extracts fol-
lowing incubation with [3-13C]pyruvate, [3-13C]lactate and
[1-13C]glucose and indicates that acetate labeled at C2 is
synthesized from these substrates (Fig. 3).
Acetate Compartmentation—Pyruvate and Lactate
The effects of adding 0.74 mM L-lactate to 2 mM pyruvate
are shown in Fig. 4. The amount of label incorporated into
acetate C2 was reduced by addition of unlabelled lactate
(control acetate C2 = 1.04 (0.21) cf. 0.76 (0.12) lmol/h/
100 mg protein.). When the label is transferred to lactate
by use of 0.74 mM [3-13C]lactate and 2 mM pyruvate label
was also incorporated into acetate C2. Acetate is therefore
also made in a compartment accessible to 0.74 mM lactate.
Scrutiny of the predicted vs actual labeling of the other
isotopomers revealed that the labeling of Gln C4 from
[3-13C]pyruvate was not significantly different in the
A
B
Fig. 2 Transport of acetate by monocarboxylate transporters.
Oocytes were injected with cRNA encoding MCT2 (20 ng) or
MCT4 (10 ng). After 3–5 days, uptake of [14C]acetate was measured
over a period of 20 min at the indicated concentrations. Each datapoint represents the mean ± SD uptake activity of 8–10 oocytes
Neurochem Res (2012) 37:2541–2553 2545
123

presence (0.11 (0.03) lmol/h/100 mg protein) or absence
of lactate (0.11 (0.02) lmol/h/100 mg protein). It was not
possible to detect labeling of Gln C4 from 0.74 mM
[3-13C]lactate. This suggests that the astrocyte compart-
ment where glutamine is labeled is not accessible to lactate
under these conditions. Labelling of citrate was not sig-
nificantly affected by addition of lactate, and only a small
amount of citrate was labeled from [3-13C]lactate.
There was also little significant change in total metab-
olite pool sizes due to addition of lactate (Fig. 4b).
Acetate Compartmentation—Pyruvate and Acetate
Incubation of 2 mM [3-13C]pyruvate with 5 mM unlabelled
acetate resulted generally in increased labelling from
[3-13C]pyruvate into all isotopomers measured apart from Gln
C4 and Lac C3, which were unchanged (Fig. 5). Labelling of
acetate C2 increased significantly (0.72 (0.1) cf (1.16 (0.14)
lmol/h/100 mg protein as did labeling of citrate (1.47 (0.38)
cf 2.77 (0.5) lmol/h/100 mg protein) as well as Glu C2 and
GABA C2. When the label source was exchanged, incorpo-
ration into measured isotopomers dropped significantly. In
comparison with the control (2 mM [3-13C]pyruvate and no
acetate) experiment, little label was incorporated. Gln C4 was
the most highly labeled isotopomer and was labeled to
*30 % of the levels of the control experiment. Interestingly,
citrate was not labeled from acetate at all; it was not detected in
any spectra from the experiment with 2 mM pyruvate and
5 mM [2-13C]acetate, showing that citrate was not made from
acetyl-CoA which had been synthesized from acetate under
these circumstances.
The total pool size of glutamate and aspartate were sig-
nificantly increased by addition of [2-13C]acetate (Fig. 5b).
Acetate Compartmentation—Lactate and Acetate
Incubation of 0.74 mM [3-13C]L-lactate with 2 mM glu-
cose and unlabelled acetate (5 mM) had no significant
effect on the incorporation of label from [3-13C]L-lactate
into isotopomers of Glu, GABA or Asp (Fig. 6a). Incor-
poration of label into Gln C4 and Ala C3 was significantly
lower and there was no significant effect of acetate on label
incorporation into citrate. When the label source was
exchanged to [2-13C]acetate, label incorporation dropped
significantly. Label was incorporated above natural abun-
dance in Gln C4, Glu C4 and Ala C3.
Addition of acetate, either labeled or unlabelled, resul-
ted in a significant decrease in the total pool sizes of glu-
tamate, lactate, GABA, aspartate and alanine but had no
significant effect on the total pool size of glutamine.
Acetate Metabolism—Effect of NAD?
and Nicotinamide
When slices were incubated with 5 mM D-glucose and 5 mM
[2-13C]acetate, label was incorporated into Glu C4, GABA
C2 and Gln C4 to levels above natural abundance (Fig. 7).
Gln C4 was labeled more from 5 mM [2-13C]acetate in the
Fig. 3 Sections of fully-relaxed 600 MHz 1H NMR spectra of brain
cortical tissue slice extracts following metabolism of added 13C-
labelled substrates showing 13C-labelled acetate. Spectra in the toprow are [13C]-decoupled, while those in the bottom row are not. Left-most spectra are extracts following one hour of incubation with 2 mM
[3-13C]pyruvate [24], the middle spectra are extracts following
30 min of incubation with 10 mM [1-13C]glucose under depolarizing
(40 mM K?) conditions [23] and the right hand spectra are extracts
following 1 h of incubation with 8 mM [3-13C]lactate [16]. Fully
relaxed 1H and 1H[13C-decoupled] spectra (total cycle of 30 s,
comprising 24 s relaxation delay, 4 s water suppression and *2 s
acquisition time), WURST-40 [32] with a 112-step phase cycle [33],
decoupling during acquisition) were obtained at 600.13 MHz on a
Bruker DRX-600 spectrometer with a 5 mm dual 1H/13C probe
2546 Neurochem Res (2012) 37:2541–2553
123

presence of 5 mM glucose (11.7 %) than in the presence of
2 mM pyruvate (8.8 %) or 0.74 mM lactate and 2 mM
glucose (3.9 %).
Addition of 250 lM NAD? resulted in a significant
decrease in labelling from [2-13C]acetate into Gln C4 and
citrate. There was also a significant decrease in the total
pool size of aspartate and glutamine (Fig. 7b).
Addition of 250 lM nicotinamide resulted in significant
decreases in label incorporation into Glu C2 and C4 and
Gln C4. Total lactate was significantly increased (Fig. 7).
Acetate Production in the Presence of 4-
hydroxycyanocinnamate
The inhibitor 4-hydroxycyanocinnamate (4-CIN) is a broad
spectrum inhibitor of monocarboxylate transporters at
7 mM [38] and also of the mitochondria pyruvate carrier
[39]. It therefore has a significant effect on mitochondrial
metabolism. The effect of this inhibitor on production of
[2-13C]acetate from [1-13C]glucose is shown in Fig. 8.
Labelling of [2-13C]acetate was significantly decreased by
4CIN but the degree of reduction was relatively minor
compared to the reduction of label into mitochondrially
produced metabolites such as glutamate. Labeling of
metabolites produced in the cytosol, such as aspartate C2
and C3, was increased.
Pattern Recognition
Principal components analysis of the data from 163
experiments [35, 36] generated a two component model
accounting for 69 % of the variance in the data (45 and
24 %, respectively) with a Q2 of 60 %. Q2 is a measure of
the goodness of fit of the model. The two principal com-
ponents of the model are shown in Fig. 9, along with the
variables in a ‘‘Bi-plot’’. Inspection of this plot shows that
acetate C2 lies closest to Lactate C3 and is at the opposite
side of the plot to variables such as Glu C2 and C4, Asp C2
and C4 and Gln C4.
A
B
Fig. 4 Effects of competing 0.74 mM lactate with 2 mM pyruvate in
brain cortical tissue slices for 60 min. a Incorporation of 13C. b Total
metabolite pool sizes. Clear bars 2 mM [3-13C]pyruvate (control);
hatched bars 2 mM [3-13C]pyruvate plus 0.74 mM sodium L-lactate;
spotted bars 2 mM sodium pyruvate plus 0.74 mM [3-13C]- L-lactate.
* significantly different to control (P \ 0.05); # significantly different
to 2 mM [3-13C]pyruvate plus 0.74 mM sodium L-lactate
A
B
Fig. 5 Effects of competing 5 mM acetate with 2 mM pyruvate in
brain cortical tissue slices for 60 min. a Incorporation of 13C. b Total
metabolite pool sizes. Clear bars 2 mM [3-13C]pyruvate (control);
hatched bars 2 mM [3-13C]pyruvate plus 5.0 mM sodium acetate;
spotted bars 2 mM sodium pyruvate plus 5.0 mM [2-13C]- acetate.
* Significantly different to control (P \ 0.05); # significantly different
to 2 mM [3-13C]pyruvate plus 5.0 mM sodium acetate
Neurochem Res (2012) 37:2541–2553 2547
123

Discussion
Uptake of Acetate
Acetate proved to be a poor substrate for the low affinity
lactate transporter MCT4 with a KM [ 2 M, but a rela-
tively good substrate for the high-affinity (mostly) neuronal
transporter MCT2 (KM = 2.5 mM; Table 1, Fig. 2). This
value compares well with the reported KM for MCT1 of
1.6 mM (Table 1). It is therefore unlikely that failure of the
monocarboxylate transporter to take up acetate into neu-
rons is an adequate explanation for neuronal failure to use
acetate as a substrate with any efficacy [21]. Moreover,
neurons express the sodium dependent monocarboxylate
transporter (SMCT1, [40]), which has an affinity for acetate
comparable to that of the monocarboxylate transporters
MCT1 and MCT2 (Table 1). This transporter may there-
fore also be involved in accumulating acetate. SMCT1 is a
neuronal transporter but we cannot rule out involvement of
SMCT2. The affinity of SMCT2 for acetate as far as we can
determine has not yet been established, nor has the brain
cellular location of this transporter, although the transporter
is described as a low affinity transporter and has been
reported in Muller cells in the retina [20]. When slices are
incubated with 5 mM [2-13C]acetate, acetate is accumu-
lated to high levels, giving a calculated concentration of
8.85 (0.99) lmol/h/100 mg protein. However, only 9 % of
this acetate was actually metabolized into Krebs cycle
intermediates or their metabolites under the conditions
used (i.e. in competition with 2 mM pyruvate). It has
previously been reported that acetate is taken up into brain
after cisternal injection at high specific radioactivity to a
greater extent than lactate, pyruvate or glucose [41] and
also rapidly (within 2 min) incorporated into the lipid
fraction. The fact that acetate is accumulated further
A
B
Fig. 6 Effects of competing 5 mM acetate with 0.74 mM lactate in
brain cortical tissue slices for 60 min. a Incorporation of 13C. b Total
metabolite pool sizes. Clear bars 0.74 mM [3-13C]lactate (control);
hatched bars 0.74 mM [3-13C]lactate plus 5.0 mM sodium acetate;
spotted bars 2 mM sodium lactate plus 5.0 mM [2-13C]-acetate.
* Significantly different to control (P \ 0.05); # significantly different
to 0.74 mM [3-13C]lactate plus 5.0 mM sodium acetate. Slices were
also incubated with 2 mM D-glucose to provide adequate respiratory
support
A
B
Fig. 7 Effects of addition of NAD? and nicotinamide to incorpo-
ration of label supplied from 5 mM [2-13C]acetate. Slices were
incubated with 5 mM D-glucose and 5 mM [2-13C]acetate (clear bars;
control); 250 lM NAD? (hatched bars) or 250 lM nicotinamide
(spotted bars)
2548 Neurochem Res (2012) 37:2541–2553
123

supports a role of SMCT1 in brain acetate transport,
because MCTs only equilibrate intracellular and extracel-
lular pools of monocarboxylates in the absence of sub-
stantial pH gradients [38].
Other workers have shown uptake of acetate by neurons
[8, 13] and also by synaptosomes [42] in contrast to the
conclusions of Waniewski and Martin [21]. Here, we have
shown that the neuronal MCT2 is capable of transporting
acetate, plus provided corroborating evidence that brain
accumulates acetate, suggesting a role for active uptake in
acetate transport.
Production of Acetate
It is apparent from the data that acetate is synthesized in
non-trivial amounts from a range of different substrates
supplied to brain tissue cortical slices. While it might be
expected that acetate be synthesized from 2 mM pyruvate,
since this relatively high substrate concentration is likely to
cause accumulation of acetyl-CoA [43], acetate is also
synthesized from added lactate and also from glucose.
Pyruvate is the most efficacious substrate, producing the
most labeled acetate (mean value *0.35 lmol (h mmol
substrate 100 mg protein)-1, but lactate (used at 5 mM
concentration [23]) also produces non-trivial amounts
(*0.16 lmol (h mmol substrate 100 mg protein)-1,
exceeded when lower amounts of lactate (0.74 mM) are
used *0.54 lmol (h mmol substrate 100 mg protein)-1.
Glucose is also a good source when adjusted for the
amount of label (*0.22 lmol/(90 min mmol substrate
100 mg protein)-1; data taken from the control experiment
with 4-CIN using 5 mM glucose).
Acetate is made by hydrolysis of acety-lCoA by the
ubiquitous enzyme acetylCoA hydrolase [44] an enzyme
which may be product-stimulated by acetate [45, 46].
Acetyl-CoA can come from citrate via the ATP-citrate
lyase an enzyme which is expressed in both neurons and
glia [47].
Free acetate has been detected in brain by NMR in areas
of ischemia and ischemic penumbra [48] but not in normal
brain tissue in vivo. Levels of free acetate have been
measured by enzymatic assay at 1.51 ± 0.34 lmol/g tissue
in mouse brain, significantly higher than levels in liver
[49]. Acetate is reported as a common metabolite across a
Fig. 8 Effects of 4-hydroxycyanocinnamate on incorporation of 13C
in brain cortical tissue slices incubated with [1-13C]glucose for
90 min. Clear bars, control (N = 4); hatched bars, 7 mM 4-CIN
(N = 4). Values shown are means, while error bars show standard
deviations. * Significantly different to control
Fig. 9 Bi-plot showing principal components and variable clustering.
The figure shows the two principal components generated by the
model plus the individual variables and allows us to interpret the
observations in terms of the variables. Data from 163 experiments
(observations) [35, 36] was used as input, with 15 variables as shown
on the plot. Data were univariance scaled to standardize variance
between the high and low concentration metabolites [37], to ensure
that the 13C labelling and steady state pool size concentrations equally
contributed to the model, and were expressed as the relative change
from the average value obtained from the control group for that
particular experiment. Observations are shown as grey squares,
variables as black stars with labels
Neurochem Res (2012) 37:2541–2553 2549
123

range of primary cell cultures, including in neurons,
astrocytes and oligodendrocytes [50].
Acetate production was not significantly impacted by
inhibition of the mitochondrial pyruvate carrier with the
broad spectrum inhibitor 4-CIN (Fig. 8). This is in keeping
with the cytosolic location of acetyl-CoA hydrolase [46].
Inspection of Fig. 9 shows that acetate C2 is on the
opposite side of the principal components plot to variables
such as GluC2, C4, Asp C2 and C3 and Gln C4 indicating
that production of acetate occurs when Krebs cycle flux is
low. Acetate C2 is located near to lactate C3, indicating
that acetate production relates to pyruvate clearance. One
could go a step further and infer that acetate C2 production
relates to clearance of acetyl-CoA; i.e. high levels of
acetyl-CoA due to lowered flux in the Krebs cycle corre-
spond to high rates of acetate C2 production.
Metabolism of Acetate
It is apparent from the data that acetate is used to make
glutamine. This likely occurs in the so-called ‘‘small
compartment’’ and has been the subject of many previous
reports [15, 51–54]. Acetate has previously been reported
to label citrate. Citrate is problematic to study by NMR due
to its role in chelation of paramagnetic ions which results in
broadening of the NMR spectrum. It is possible to reduce
the linewidth of the two citrate CH2 carbons in the 13C
NMR spectrum through addition of the chelating agent
EDTA [55]. Here, we found that addition of lactate to
2 mM pyruvate did not significantly alter incorporation of
label into citrate, while addition of unlabelled acetate
almost doubled incorporation of label from [3-13C]pyru-
vate into citrate. By contrast, very little labelling of citrate
was detected when label was supplied as 5 mM
[2-13C]acetate (less than 4 % of that labelled by pyruvate).
Very little label was incorporated into citrate when
0.74 mM [3-13C]lactate was supplied as labelled substrate
and this incorporation was not altered by addition of ace-
tate. Incorporation of label into citrate from [2-13C]acetate,
although minimal, was reduced further by addition of
NAD? and nicotinamide.
Citrate has been shown to be synthesised in both neu-
rons and astrocytes [56], with astrocytes exporting a much
higher fraction of citrate than neurons [57]. Waagepetersen
has described two separate mitochondrial compartments in
astrocytes that metabolise acetate; one that produces glu-
tamine and one that preferentially produces citrate [58].
This is in agreement with earlier work showing that the
citrate, which enters the small metabolic pool that also
labels glutamine, does not fully interact with glutamine
labelling from acetate [41], and with work that has sug-
gested further subdivision of the ‘‘small’’ glutamate pool
[59]. Here, it is apparent that acetate is influencing the rate
of synthesis of citrate, since incorporation of label into
citrate from [3-13C]pyruvate doubles when unlabelled
5 mM acetate is present. It is also apparent that the added
acetate does not participate fully in this reaction, as very
little label is incorporated from added 5 mM [2-13C]ace-
tate. This is consistent with the subdivision of the small
glutamate pool proposed previously [41, 59]. There was no
significant increase in anaplerotic activity (as measured by
the difference between label incorporation into Asp C3 vs.
C2) in the presence of added acetate [0.23 (0.07) vs. 0.23
(0.01) lmol/h/100 mg protein] suggesting that the synthe-
sis of citrate was not a net cataplerotic process.
We would suggest that, rather than seeing a reduction in
citrate synthesis, we are seeing an alteration in the break-
down of citrate. Citrate is in an equilibrium with acetyl-
CoA, and with acetate [60]. Therefore, in situations where
acetate is plentiful (and by inference, acetyl-CoA) the
activity of ATP-citrate lyase is reduced. This may explain
why adding acetate appears to increase the amount of cit-
rate that is labeled; it does this by inhibiting the breakdown
of citrate.
Alteration of Acetate Metabolism by NAD?
and Nicotinamide
Modulation of enzyme activity by acetylation is emerging
as a major metabolic control mechanism [61]. The major
acetate metabolising enzymes, acetyl-CoA synthetases 1
and 2 are but one set of enzymes whose activity is con-
trolled by reversible acetylation. De-acetylaction of these
enzymes is under the control of the silent information
regulator enzymes, the NAD?-dependent deacetylases
known as sirtuins [62]. Nicotinamide is a potent non-
competitive inhibitor of SIRT1 [63]while NAD? is a sub-
strate although the effect of altering NAD? on SIRT
activity is not well understood[64]. Extracellular NAD?
has been shown to enter cells and influence metabolic
activity [65, 66]. Here, we conducted preliminary experi-
ments to determine whether or not nicotinamide or NAD?
could influence acetate metabolism.
Both molecules decreased the amount of acetate being
used as a substrate for glutamine synthesis along with a
reduction in label incorporation into citrate, which we have
postulated is due to increased breakdown of citrate by
ATP-citrate lyase. This points to a lower availability of
acetyl-CoA.
This is important information to consider when inter-
preting data acquired using the acetate/glucose model of
metabolism. The original papers describing the model all
contained a warning that using this approach from a strictly
compartmentalised viewpoint had limitations [55, 67]. The
possibilities opened up by considering changes in metab-
olism of acetate caused by cellular energy and acetylation
2550 Neurochem Res (2012) 37:2541–2553
123

status offer a potentially more interesting and useful
interpretation of data obtained using this model.
Summary
We have shown that acetate is transported by the neuronal
MCT2, that acetate is actively accumulated by tissue slices
but not catabolised to the same degree as other mono-
carboxylates such as pyruvate or lactate. A likely expla-
nation for the lack of enthusiasm for catabolism of acetate
resides in the control of metabolism via acetylation of
enzymes, in particular acetylation of acetyl-CoA synthetase
[5]. Our data suggest that levels of acetyl-CoA are strictly
controlled and that acetate and citrate are key metabolites
in this control.
AcetylCo-A is a central metabolite in many key reac-
tions (see Fig. 1) and plainly we have much further to go to
reach a full understanding of how these reactions are reg-
ulated in the brain.
Acknowledgments The authors are grateful to Dr Ann Kwan of the
School of Molecular Biosciences at the University of Sydney for
expert technical assistance. This work was supported by the Austra-
lian National Health and Medical Research Council (Grant #568767
to CR and Fellowship to CR #630516).
References
1. Gonzalez SV, Nguyen NHT, Rise F, Hassel B (2005) Brain
metabolism of exogenous pyruvate. J Neurochem 95:284–293
2. Cox DWG, Bachelard HS (1988) Partial attenuation of dentate
granule cell evoked activity by the alternative substrates, lactate
and pyruvate: evidence for a postsynaptic action. Exp Brain Res
69:368–372
3. Tarasenko AS, Linetska MV, Storchak LG, Himmelreich NH
(2006) Effectiveness of extracellular lactate/pyruvate for sus-
taining synaptic vesicle proton gradient generation and vesicular
accumulation of GABA. J Neurochem 99:787–796
4. Berl S, Frigyesi TL (1969) Turnover of glutamate glutamine
aspartate and GABA labeled with 1–14C acetate in caudate
nucleus thalamus and motor cortex (cat). Brain Res 12:444–455
5. Starai VJ, Escalante-Semerena JC (2004) Acetyl-coenzyme A
synthetase (AMP forming). Cell Mol Life Sci 61:2020–2030
6. Dadamo AF, Yatsu FM (1966) Acetate metabolism in nervous
system. N-acetyl-L-aspartic acid and biosynthesis of brain lipids.
J Neurochem 13:961
7. Soliman ML, Rosenberger TA (2011) Acetate supplementation
increases brain histone acetylation and inhibits histone deace-
tylase activity and expression. Mol Cell Biochem 352:173–180
8. Carroll PT (1997) Evidence to suggest that extracellular acetate is
accumulated by rat hippocampal cholinergic nerve terminals for
acetylcholine formation and release. Brain Res 753:47–55
9. Ariyannur PS, Moffett JR, Madhavarao CN, Arun P, Vishnu N,
Jacobowitz DM, Hallows WC, Denu JM, Namboodiri AMA
(2010) Nuclear-cytoplasmic localization of acetyl coenzyme A
synthetase-1 in the rat brain. J Comp Neurol 518:2952–2977
10. Tucek S (1967) Subcellular distribution of acetyl-CoA synthe-
tase, ATP citrate lyase, citrate synthase, choline acetyltransferase,
fumarate hydratase and lactate dehydrogenase in mammalian
brain tissue. J Neurochem 14:531–545
11. Hirschey MD, Shimazu T, Capra JA, Pollard KS, Verdin E
(2011) SIRT1 and SIRT3 deacetylate homologous substrates:
AceCS1,2 and HMGCS1,2. Aging-US 3:635–642
12. Ramadori G, Lee CE, Bookout AL, Lee S, Williams KW,
Anderson J, Elmquist JK, Coppari R (2008) Brain SIRT1: ana-
tomical distribution and regulation by energy availability.
J Neurosci 28:9989–9996
13. Brand A, Richter-Landsberg C, Leibfritz D (1997) Metabolism of
acetate in rat brain neurons, astrocytes and cocultures: metabolic
interactions between neurons and glia cells, monitored by NMR
spectroscopy. Cell Mol Biol 43:645–657
14. Chapa F, Cruz F, Garcia-Martin ML, Garcia-Espinosa MA,
Cerdan S (1999) Metabolism of (1–13C) glucose and (2–13C,
2–2H3) acetate in the neuronal and glial compartments of the
adult rat brain as detected by 13C, 2H NMR spectroscopy.
Pergamon-Elsevier Science Ltd, Wierzba
15. Badar-Goffer R, Bachelard H, Morris P (1990) Cerebral metab-
olism of acetate and glucose studied by 13C NMR spectroscopy.
Biochem J 266:133–139
16. Rae C, Hare N, Bubb WA, McEwan SR, Broer A, McQuillan JA,
Balcar VJ, Conigrave AD, Broer S (2003) Inhibition of glutamine
transport depletes glutamate and GABA neurotransmitter pools:
further evidence for metabolic compartmentation. J Neurochem
85:503–514
17. Bergersen LH, Magistretti PJ, Pellerin L (2005) Selective post-
synaptic co-localisation of MCT2 with AMPA receptor GluR2/3
subunits at excitatory synapses exhibiting AMPA receptor traf-
ficking. Cereb Cortex 15:361–370
18. Pierre K, Pellerin L (2005) Monocarboxylate transporters in the
central nervous system: distribution, regulation and function.
J Neurochem 94:1–14
19. Rafiki A, Boulland JL, Halestrap AP, Ottersen OP, Bergersen LH
(2003) Highly differential expression of the monocarboxylate
transporters MCT2 and MCT4 in the developing rat brain. Neu-
roscience 122:677–688
20. Martin PM, Dun Y, Mysona B, Ananth S, Roon P, Smith SB,
Ganapathy V (2007) Expression of the sodium-coupled mono-
carboxylate transporters SMCT1 (SLC5A8) and SMCT2
(SLC5A12) in retina. Invest Ophthalmol Vis Sci 48:3356–3363
21. Waniewski R, Martin D (1998) Preferential utilization of acetate
by astrocytes is attributable to transport. J Neurosci 18:5225–
5233
22. Berl S, Nunez R, Colon AD, Clarke DD (1983) Acetylaction of
synaptosomal protein—inhibition by veratridine. J Neurochem
40:176–183
23. Rae C, Nasrallah F, Broer S (2009) Metabolic effects of blocking
lactate transport in brain cortical tissue slices using an inhibitor
specific to MCT1 and MCT2. Neurochem Res 34:1783–1791
24. Nasrallah F, Griffin JL, Balcar VJ, Rae C (2007) Understanding
your inhibitions. Modulation of brain cortical metabolism by
GABA-B receptors. J Cereb Blood Flow Metab 27:1510–1520
25. Broer S, Broer A, Hansen JT, Bubb WA, Balcar VJ, Nasrallah
FA, Garner B, Rae C (2007) Alanine metabolism, transport and
cycling in the brain. J Neurochem 102:1758–1770
26. Broer S (2010) Xenopus laevis oocytes. Methods Mol Biol 637:
295–310
27. Broer S, Broer A, Schneider HP, Stegen C, Halestrap AP, Deit-
mer JW (1999) Characterization of the high-affinity monocarb-
oxylate transporter MCT2 in Xenopus laevis oocytes. Biochem J
341:529–535
28. Broer S, Schneider HP, Broer A, Rahman B, Hamprecht B,
Deitmer JW (1998) Characterization of the monocarboxylate
transporter 1 expressed in Xenopus laevis oocytes by changes in
cytosolic pH. Biochem J 333:167–174
Neurochem Res (2012) 37:2541–2553 2551
123

29. Tosco M, Orsenigo MN, Gastaldi G, Faelli A (2000) An endoge-
nous monocarboxylate transport in Xenopus laevis oocytes. Am J
Physiol-Regul Integr Comp Physiol 278:R1190–R1195
30. McIlwain H, Bachelard H (1985) Biochemistry and the central
nervous system. Churchill Livingstone, Edinburgh, pp 7–29
31. Le Belle JE, Harris NG, Williams SR, Bhakoo KK (2002) A
comparison of cell and tissue extraction techniques using high-
resolution 1H NMR spectroscopy. NMR Biomed 15:37–44
32. Kupce E, Freeman R (1995) Adiabatic pulses for wideband
inversion and broadband decoupling. J Mag Reson A 115:
273–276
33. Skinner TE, Bendall MR (1997) A phase-cycling algorithm for
reducing sidebands in adiabatic decoupling. J Magn Reson 124:
474–478
34. Rae C, Lawrance ML, Dias LS, Provis T, Bubb WA, Balcar VJ
(2000) Strategies for studies of potentially neurotoxic mecha-
nisms involving deficient transport of L-glutamate: antisense
knockout in rat brain in vivo and changes in the neurotransmitter
metabolism following inhibition of glutamate transport in guinea
pigs brain slices. Brain Res Bull 53:373–381
35. Nasrallah FA, Balcar VJ, Rae CD (2011) Activity dependent
GABA release controls brain cortical tissue slice metabolism.
J Neurosci Res 89:1935–1945
36. Nasrallah F, Griffin JL, Balcar VJ, Rae CD (2009) Understanding
your inhibitions. Effects of GABA and GABAA receptors on
brain cortical metabolism. J Neurochem 108:57–71
37. Wold S, Antti H, Lindgren F, Ohman J (1998) Orthogonal signal
correction of near-infrared spectra. Chemom Intell Lab Syst
44:175–185
38. Halestrap AP, Price NT (1999) The proton-linked monocarb-
oxylate transporter (MCT) family: structure, function and regu-
lation. Biochem J 343:281–299
39. Halestrap AP, Denton RM (1974) Specific inhibition of pyruvate
transport in rat liver mitochondria and human erythrocytes by
a-cyano-4-hydroxycinnamate. Biochem J 138:313–316
40. Martin PM, Gopal E, Ananth S, Zhuang L, Itagaki S, Prasad BM,
Smith SB, Prasad PD, Ganapathy V (2006) Identify of
SMCT1(SLC5A8) as a neuron-specific Na?-coupled transporter
for active uptake of L-lactate and ketone bodies in the brain.
J Neurochem 98:279–288
41. Tucek S, Cheng SC (1974) Provenance of acetyl group of ace-
tylcholine and compartmentation of acetyl-CoA and Krebs cycle
intermediates in brain in vivo. J Neurochem 22:893–914
42. Berl S, Clarke DD, Colon A, Nunez R (1983) H-3-Labelled acetate
incorporation into protein of synaptosomes—effect of Na? chan-
nel toxins. Hoppe Seylers Z Physiol Chem 364:1098–1099
43. Nakamura R, Cheng SC, Naruse H (1970) A study on precursors
of acetyl moiety of acetylcholine in brain slices—observations on
compartmentalization of acetyl-coenzyme A pool Biochem J
118:443
44. Kirkby B, Roman N, Kobe B, Kellie S, Forwood JK (2010)
Functional and structural properties of mammalian acyl-coen-
zyme A thioesterases. Prog Lipid Res 49:366–377
45. Robinson JB, Mahan DE, Koeppe RE (1976) Studies on rat brain
acyl-coenzyme-A hydrolase (short chain). Biochem Biophys Res
Commun 71:959–965
46. Matsuda T, Yonehara N, Yoshida H (1976) Metabolism of pre-
cursors of acetylcholine synthesis in central nervous system—
some properties of acetyl-CoA hydrolase in cytoplasmic soluble
fraction from rat brain. Folia Pharmacol Jap 72:P63
47. Beigneux AP, Kosinski C, Gavino B, Horton JD, Skarnes WC,
Young SG (2004) ATP-citrate lyase deficiency in the mouse.
J Biol Chem 279:9557–9564
48. Alf MF, Lei H, Berthet C, Hirt L, Gruetter R, Mlynarik V (2012)
High-resolution spatial mapping of changes in the neurochemical
profile after focal ischemia in mice. NMR Biomed 25:247–254
49. Madhavarao CN, Arun P, Moffett JR, Szucs S, Surendran S,
Matalon R, Garbern J, Hristova D, Johnson A, Jiang W, Nam-
boodiri MAA (2005) Defective N-acetylaspartate catabolism
reduces brain acetate levels and myelin lipid synthesis in Cana-
van’s disease. Proc Natl Acad Sci USA 102:5221–5226
50. Urenjak J, Williams SR, Gadian DG, Noble M (1993) Proton
nuclear magnetic resonance spectroscopy unambiguously identi-
fies different neural types. J Neurosci 13:981–989
51. Berl S, Clarke DD, Nicklas WJ (1970) Compartmentation of
citric acid cycle metabolism in brain—effect of aminooxyacetic
acid, ouabain and Ca2? on labelling of glutamate, glutamine,
aspartate and GABA by 1-C-14acetate, U-C-14glutamate and
U-C-14 aspartate. J Neurochem 17:999–1007
52. Berl S, Lajtha A, Waelsch H (1961) Amino acid and protein
metabolism -VI Cerebral compartments of glutamic acid metab-
olism. J Neurochem 7:186–197
53. Sonnewald U, Westergaard N, Hassel B, Muller TB, Unsgard G,
Fonnum F, Hertz L, Schousboe A, Petersen SB (1993) NMR
spectroscopy studies of 13C acetate and 13C glucose metabolism
in neocortical astrocytes: evidence for mitochondrial heteroge-
neity. Dev Neurosci 15:351–358
54. Wyss MT, Magistretti PJ, Buck A, Weber B (2011) Labeled
acetate as a marker of astrocytic metabolism. J Cereb Blood Flow
Metab 31:1668–1674
55. Badar-Goffer R, Bachelard H, Morris P (1992) Neuronal-glial
metabolism under depolarising conditions. Biochem J 282:225–
230
56. Westergaard N, Sonnewald U, Unsgard G, Peng L, Hertz L,
Schousboe A (1994) Uptake, release and metabolism of citrate in
neurons and astrocytes in primary cultures. J Neurochem 62:
1727–1733
57. Sonnewald U, Westergaard N, Krane J, Unsgard G, Petersen SB,
Schousboe A (1991) First direct demonstration of preferential
release of citrate from astrocytes using C-13 NMR spectroscopy
of cultured neurons and astrocytes. Neurosci Lett 128:235–239
58. Waagepetersen HS, Sonnewald U, Larsson OM, Schousboe A
(2001) Multiple compartments with different metabolic charac-
teristics are involved in biosynthesis of intracellular and released
glutamine and citrate in astrocytes. Glia 35:246–252
59. Cheng SC, Nakamura R (1972) Metabolism related to tricar-
boxylic acid cycle in rat brain slices—observations on CO2 fix-
ation and metabolic compartmentation. Brain Res 38:355
60. Wellen KE, Hatzivassiliou G, Sachdeva UM, Bui TV, Cross JR,
Thompson CB (2009) ATP-citrate lyase links cellular metabolism
to histone acetylation. Science 324:1076–1080
61. Shin JY, Zhang D, Chen D (2011) Reversible acetylation of
metabolic enzymes celebration: SIRT2 and p300 join the party.
Mol Cell 43:3–5
62. Hallows WC, Lee S, Denu JM (2006) Sirtuins deacetylate and
activate mammalian acetyl-CoA synthetases. Proc Natl Acad Sci
USA 103:10230–10235
63. Bitterman KJ, Anderson RM, Cohen HY, Latorre-Esteves M,
Sinclair DA (2002) Inhibition of silencing and accelerated aging
by nicotinamide, a putative negative regulator of yeast Sir2 and
human SIRT1. J Biol Chem 277:45099–45107
64. Canto C, Auwerx J (2012) Targeting Sirtuin 1 to improve
metabolism: all you need is NAD(?)? Pharmacol Rev 64:
166–187
65. Billington RA, Travelli C, Ercolano E, Galli U, Roman CB,
Grolla AA, Canonico PL, Condorelli F, Genazzani AA (2008)
Characterization of NAD uptake in mammalian cells. J Biol
Chem 283:6367–6374
66. Pittelli M, Felici R, Pitozzi V, Giovannelli L, Bigagli E, Cialdai
F, Romano G, Moroni F, Chiarugi A (2011) Pharmacological
effects of exogenous NAD on mitochondrial bioenergetics, DNA
repair, and apoptosis. Mol Pharmacol 80:1136–1146
2552 Neurochem Res (2012) 37:2541–2553
123

67. Clarke DD (1999) Acetate and fluoroacetate as possible markers
for glial metabolism: an historical perspective. J Neurochem
72:S2
68. Galic S, Schneider HP, Broer A, Deitmer JW, Broer S (2003) The
loop between helix 4 and helix 5 in the monocarboxylate trans-
porter MCT1 is important for substrate selection and protein
stability. Biochem J 376:413–422
69. Carpenter L, Halestrap AP (1994) The kinetics, substrate and
inhibitor specificity of the lactate transporter of ehrlich-lettre
tumor cells studied with the intracellular pH indicator BCECF.
Biochem J 304:751–760
70. Broer S, Rahman B, Pellegri G, Pellerin L, Martin JL, Verleys-
donk S, Hamprecht B, Magistretti PJ (1997) Comparison of
lactate transport in astroglial cells and transporter 1 (MCT 1)
expressing Xenopus laevis oocytes. Expression of two different
monocarboxylate transporters in astroglial cells and neurons.
J Biol Chem 272:30096–30102
71. Fox JEM, Meredith D, Halestrap AP (2000) Characterisation of
human monocarboxylate transporter 4 substantiates its role in
lactic acid efflux from skeletal muscle. J Physiol Lond 529:
285–293
72. Ovens MJ, Manoharan C, Wilson MC, Murray CM, Halestrap AP
(2010) The inhibition of monocarboxylate transporter 2 (MCT2)
by AR-C155858 is modulated by the associated ancillary protein.
Biochem J 431:217–225
73. Lin RY, Vera JC, Chaganti RSK, Golde DW (1998) Human
monocarboxylate transporter 2 (MCT2) is a high affinity pyruvate
transporter. J Biol Chem 273:28959–28965
74. Dimmer KS, Friedrich B, Lang F, Deitmer JW, Broer S (2000)
The low-affinity monocarboxylate transporter MCT4 is adapted
to the export of lactate in highly glycolytic cells. Biochem J
350:219–227
75. Babu E, Ramachandran S, CoothanKandaswamy V, Elangovan S,
Prasad PD, Ganapathy V, Thangaraju M (2011) Role of SLC5A8,
a plasma membrane transporter and a tumor suppressor, in the
antitumor activity of dichloroacetate. Oncogene 30:4026–4037
76. Miyauchi S, Gopal E, Fei YJ, Ganapathy V (2004) Functional
identification of SLC5A8, a tumor suppressor down-regulated in
colon cancer, as a Na?-coupled transporter for short-chain fatty
acids. J Biol Chem 279:13293–13296
77. Gopal E, Umapathy NS, Martin PM, Ananth S, Gnana-Prakasam
JP, Becker H, Wagner CA, Ganapathy V, Prasad PD (2007)
Cloning and functional characterization of human SMCT2
(SLC5A12) and expression pattern of the transporter in kidney.
Biochim Biophys Acta 1768:2690–2697
Neurochem Res (2012) 37:2541–2553 2553
123