Embed Size (px)
Citation preview
ORIGINAL ARTICLE
Metabolomic analysis of urine and serum in Parkinson’s disease
Andrew W. Michell Æ David Mosedale ÆDavid J. Grainger Æ Roger A. Barker
Received: 1 February 2008 / Accepted: 23 April 2008 / Published online: 8 May 2008
� Springer Science+Business Media, LLC 2008
Abstract Objective To investigate the metabolic profile
of serum and urine samples from 23 female patients with
Parkinson’s disease (PD) and 23 age and sex-matched
controls. Methods We used gas chromatography coupled to
mass spectrometry to detect metabolites (approximately
1,600 in total), then supervised statistical analysis (using
projection to latent structures discriminant analysis) to
study the differences between control and PD samples.
Results Supervised statistical analysis yielded models that
possessed statistically significant predictive value for blind
samples on the basis of the metabolic profile of urine but
not of serum. However, whilst no individual biomarkers
were identified, suggesting that any metabolic disturbance
associated with PD is comparatively minor, a multivariate
metabolic signature associated with PD was identified in
urine. Interpretation There is a relatively subtle, yet
distinct, metabolic signature of PD present in the urine of
patients with early disease. The signature may itself act as a
useful biomarker for PD, although larger studies will be
required to validate our present findings.
Keywords Biomarker � Metabolomics � GC-MS �Parkinson’s disease
1 Introduction
Parkinson’s disease (PD) is a common neurodegenerative
disease, affecting about one million people in the United
States (Olanow and Tatton 1999) and classically presents
with a triad of bradykinesia, tremor and rigidity (Parkinson
1817). In some cases the diagnosis can be difficult to make
given that the disease has a gradual onset after a long
presymptomatic phase (Fearnley and Lees 1991), and that
there are a number of conditions that can present with a
similar clinical phenotype such as progressive supranuclear
palsy (Burn and Lees 2002) and multiple system atrophy
(Poewe and Wenning 2002). Pathological studies have
estimated that in specialist centres the positive predictive
value of the clinical diagnosis of idiopathic PD is 99%,
with a sensitivity of 91% (Hughes et al. 2002), but it is
considerably worse outside the specialist setting (Hughes
et al. 1992). There is therefore great need for a biomarker
to improve diagnosis both in the outpatient clinic and for
clinical trials. Furthermore, a great effort is being made to
identify biomarkers of disease progression that might not
only help demonstrate whether newly developed therapies
are truly neuroprotective, but also aid in the identification
of subgroups within this heterogeneous disease population
(Lewis et al. 2005).
The search for molecular biomarkers that reflect the
underlying pathology in PD has been wide, encompassing a
range of compounds assayed from a variety of different
David J. Grainger and Roger A. Barker are the senior authors of this
manuscript.
A. W. Michell � R. A. Barker (&)
Cambridge Centre for Brain Repair, Forvie Site, Robinson Way,
Cambridge CB2 2PY, UK
e-mail: [email protected]
A. W. Michell � R. A. Barker
Department of Clinical Neuroscience, Addenbrooke’s Hospital,
University of Cambridge, Hills Road, Cambridge CB2 2QQ, UK
D. Mosedale � D. J. Grainger
Translational Research Unit, Papworth Hospital NHS
Foundation Trust, Papworth Everard, Cambridge CB3 8RE, UK
D. J. Grainger
Department of Medicine, Addenbrooke’s Hospital, University
of Cambridge, Hills Road, Cambridge CB2 2QQ, UK
123
Metabolomics (2008) 4:191–201
DOI 10.1007/s11306-008-0111-9
body fluids and tissues (Sato et al. 2005; Michell et al.
2005; Scherzer et al. 2007; Abdi et al. 2006) reviewed in
(Michell et al. 2004). However, it seems unlikely that any
single test will suffice given that PD pathology extends
beyond nigral dopaminergic cell loss, to affect much of the
brain (Braak et al. 2003), and even the gut (Edwards et al.
1992), including abnormalities in other neurotransmitters
such as noradrenaline and serotonin (Scatton et al. 1983),
acetyl choline (Bohnen et al. 2003), substance P (Mauborgne
et al. 1983) and enkephalins (Taquet et al. 1983). This
complex pathology occurs on a background of marked
heterogeneity of the genetic and environmental aetiologies
of the disease (Vila et al. 2004; Di Monte 2003), such that
although trends and influences can be identified within a
population they are rarely directly causal for an individual.
These myriad factors conspire to give a varied clinical
phenotype encompassing affective and cognitive abnor-
malities (Mayeux et al. 1990), autonomic defects (Visser
et al. 2004) and other symptoms in addition to the classical
triad described above. Biomarkers of PD must ultimately
reflect this clinical and pathological heterogeneity, but
given the complexity of the disease it is extremely difficult
to select the best candidates. It is therefore logical to adopt
non-hypothesis driven systems biology approaches to
identify candidate patterns of biomarkers that together
provide a fingerprint that is robustly linked to diagnosis and
disease progression. Some preliminary promise has been
shown by systems biology RNA and proteomic approaches
(Scherzer et al. 2007; Abdi et al. 2006).
Metabolomics, the study of the entire complement of
metabolites in a tissue or biofluid, provides an overview of
the dynamic metabolic status of the organism, reflecting
the complex interaction of genes, proteins and environ-
ment. The metabolic profile at a point in time reflects the
complex hierarchical network of metabolic interactions
(Ravasz et al. 2002) and is affected by internal influences
such as gut flora (Nicholson and Wilson 2003), as well as
external factors such as the environment, medication and so
on. Metabolomics, therefore, represents an attractive
approach to biomarker identification.
There is no single way of performing a metabolomic
screen—nuclear magnetic resonance spectroscopy, mass
spectrometry, high-performance liquid chromatography,
optical spectroscopic analyses or a combination of tech-
niques, each with their own advantages and pitfalls, can all
be applied (Nicholson et al. 2002; Dunn et al. 2005; Griffin
2003). The output is a complex n-dimensional metabolic
fingerprint from which patterns are sought using mega-
variate analytical approaches (see methods).
Many metabolomic techniques are sensitive to meta-
bolic abnormalities, and have been used to detect the
relatively minor metabolic differences resulting from
genetic strain differences in mice (Gavaghan et al. 2000),
from otherwise silent genetic mutations (Raamsdonk et al.
2001), or due to diet and cultural differences (Lenz et al.
2004). Metabolomic analysis of serum has also been used
to detect the presence of various diseased states, including
the presence and severity of coronary heart disease (Brindle
et al. 2002), although detection of lipid abnormalities may
be more difficult in patients taking lipid-lowering medi-
cations (Kirschenlohr et al. 2006). An association between
metabolic profiles and blood pressure has also been
reported (Brindle et al. 2003), as well as an association
with epithelial ovarian cancer (Odunsi et al. 2005). Meta-
bolomic analyses of other body fluids have also shown
encouraging results, including the use of urine to diagnose
interstitial cystitis and bacterial cystitis (Van et al. 2003)
and CSF to distinguish patients with Alzheimer’s disease
from controls (Ghauri et al. 1993) and to confirm the
presence and predict outcome of aneurysmal subarachnoid
haemorrhage (Dunne et al. 2005).
Metabolic profiling by our group has already yielded an
interesting insight into the neurodegenerative condition of
Huntington’s disease (HD) (Underwood et al. 2006).
Comparison of metabolic profiles from human HD patients
and mice expressing a mutant huntingtin gene product
identified a common pro-catabolic phenotype, consistent
with idea that disturbed energy expenditure is a contributor
to the pathogenesis of HD. This study provided a number
of candidate biomarkers (such as serum malonate and
valine levels) which may be useful for monitoring HD
progression, although further larger studies will be required
to validate these markers. Finally, this study provided the
first application of metabolomics to validate an animal
model of a human condition, confirming that the system-
wide metabolic perturbations in the transgenic mouse were
very similar to those in HD patients.
Here, we have applied the same approach to investigate
differences between subjects with PD and controls, analy-
sing both serum and urine metabolite profiles. As for the
HD studies, our aim was to identify candidate biomarkers
to assist in the clinical diagnosis and monitoring of PD, and
also to gain insight into the molecular pathogenesis of the
disease.
2 Methods
2.1 Subjects and samples
Subjects were recruited from the PD research clinic at the
Cambridge Centre for Brain Repair, and all met the UK
PDS brain bank criteria for idiopathic PD (Gibb and Lees
1988) (Table 1). To minimise metabolic variability single
sex subjects were chosen, in this case female, and subjects
were all in the relatively early stages of disease, without
192 A. W. Michell et al.
123
overt dementia or motor complications such as dyskinesias
or on-off fluctuations. Age and sex-matched controls were
female partners or carers of patients attending the clinic.
The study was approved by the Local Regional Ethics
Committee, with written information provided and
informed consent obtained from all subjects. Prior to
sample collection all subjects completed a questionnaire
encompassing a wide range of social, environmental and
medical factors that might affect the metabolic profile
(Table 2). Details of clinical assessment from their most
recent research clinic visit were recorded.
A 10 ml venous blood sample was taken from the
antecubital fossa of all subjects using a 19-gauge needle. It
was transferred into a polypropylene tube and allowed to
clot for between 2 and 3 h at room temperature, the exact
duration being noted. After clotting the tube was centri-
fuged (3,650 g, 5 min), following which the clot was
loosened from the wall of the tube and spun again using the
same protocol. The serum supernatant was carefully
removed into a fresh polypropylene tube and spun once
more using the same settings. Serum from the top third of
this final supernatant was carefully removed and a 1 ml
aliquot stored at -80�C.
All subjects provided a urine sample in a polypropylene
container. This was kept on ice for between 2 and 3 h, the
exact duration being noted. 10 ml from the top third of the
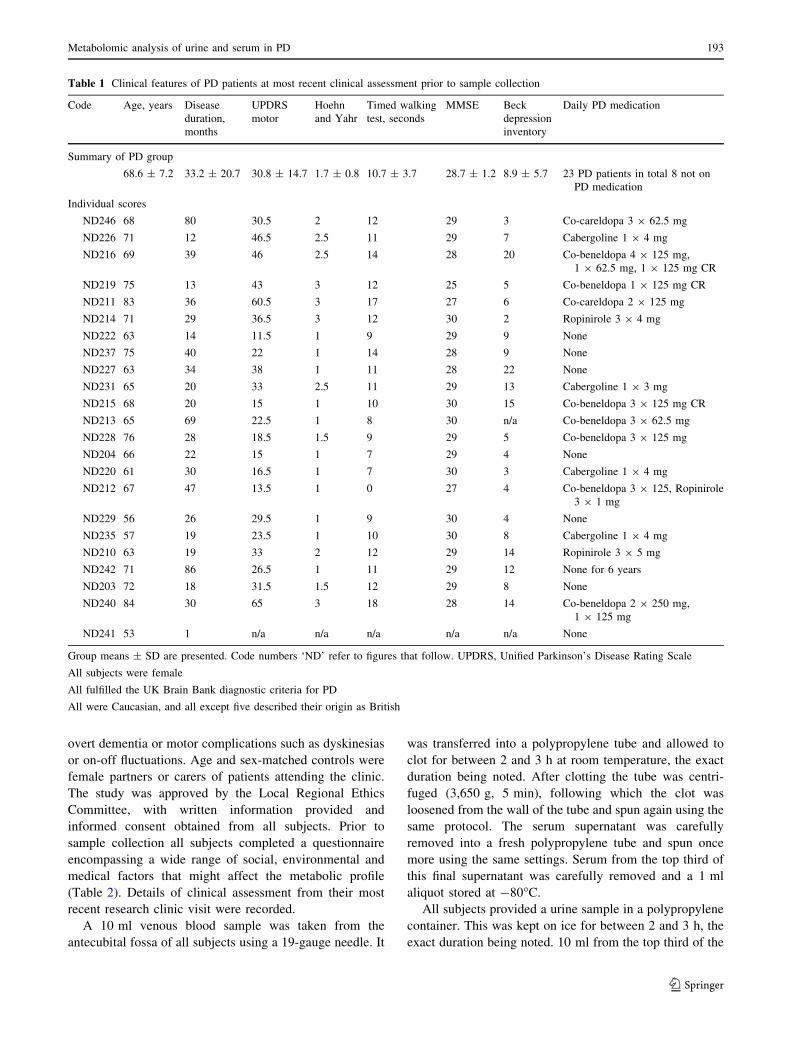
Table 1 Clinical features of PD patients at most recent clinical assessment prior to sample collection
Code Age, years Disease
duration,
months
UPDRS
motor
Hoehn
and Yahr
Timed walking
test, seconds
MMSE Beck
depression
inventory
Daily PD medication
Summary of PD group
68.6 ± 7.2 33.2 ± 20.7 30.8 ± 14.7 1.7 ± 0.8 10.7 ± 3.7 28.7 ± 1.2 8.9 ± 5.7 23 PD patients in total 8 not on
PD medication
Individual scores
ND246 68 80 30.5 2 12 29 3 Co-careldopa 3 9 62.5 mg
ND226 71 12 46.5 2.5 11 29 7 Cabergoline 1 9 4 mg
ND216 69 39 46 2.5 14 28 20 Co-beneldopa 4 9 125 mg,
1 9 62.5 mg, 1 9 125 mg CR
ND219 75 13 43 3 12 25 5 Co-beneldopa 1 9 125 mg CR
ND211 83 36 60.5 3 17 27 6 Co-careldopa 2 9 125 mg
ND214 71 29 36.5 3 12 30 2 Ropinirole 3 9 4 mg
ND222 63 14 11.5 1 9 29 9 None
ND237 75 40 22 1 14 28 9 None
ND227 63 34 38 1 11 28 22 None
ND231 65 20 33 2.5 11 29 13 Cabergoline 1 9 3 mg
ND215 68 20 15 1 10 30 15 Co-beneldopa 3 9 125 mg CR
ND213 65 69 22.5 1 8 30 n/a Co-beneldopa 3 9 62.5 mg
ND228 76 28 18.5 1.5 9 29 5 Co-beneldopa 3 9 125 mg
ND204 66 22 15 1 7 29 4 None
ND220 61 30 16.5 1 7 30 3 Cabergoline 1 9 4 mg
ND212 67 47 13.5 1 0 27 4 Co-beneldopa 3 9 125, Ropinirole
3 9 1 mg
ND229 56 26 29.5 1 9 30 4 None
ND235 57 19 23.5 1 10 30 8 Cabergoline 1 9 4 mg
ND210 63 19 33 2 12 29 14 Ropinirole 3 9 5 mg
ND242 71 86 26.5 1 11 29 12 None for 6 years
ND203 72 18 31.5 1.5 12 29 8 None
ND240 84 30 65 3 18 28 14 Co-beneldopa 2 9 250 mg,
1 9 125 mg
ND241 53 1 n/a n/a n/a n/a n/a None
Group means ± SD are presented. Code numbers ‘ND’ refer to figures that follow. UPDRS, Unified Parkinson’s Disease Rating Scale
All subjects were female
All fulfilled the UK Brain Bank diagnostic criteria for PD
All were Caucasian, and all except five described their origin as British
Metabolomic analysis of urine and serum in PD 193
123
sample was removed into a polypropylene tube and
centrifuged (3,650 g, 5 min). 1 ml from the top third of this
sample was removed and stored at -80�C.
2.1.1 Metabolite profiling
Sample preparation for GC-MS was performed exactly as
previously described (Underwood et al. 2006). Briefly,
175 ll of each serum sample was spiked with 20 ll
internal standard solution (1.53 mg/ml succinic d4 acid,
2.34 mg/ml malonic d2 acid, 1.59 mg/ml glycine d5;
Sigma-Aldrich, Gillingham, UK), then deproteinised by
addition of 450 ll of acetonitrile followed by centrifuga-
tion (13,385 g, 15 min) and freeze drying.
Urine samples were treated in a similar way. 175 ll of
each sample was spiked with 20 ll internal standard
solution as above. Because of the very high urea content of
urine, 50 ll urease solution (10 mg/ml) was added and the
mixture warmed for 20 min at 30�C. 400 ll acetonitrile
was added followed by centrifugation and freeze drying.
Urine and serum residues were chemically derivatised
to increase their volatility and thermal stability, using
70 ll O-methylhydroxylamine (20 mg/ml in pyridine)
at 40�C for 90 min to enhance oxime formation, then
70 ll MSTFA (N-acetyl-N-(trimethylsilyl)-trifluoroaceta-
mide, 20 mg/ml in pyridine) at 40�C for 90 min to
enhance trimethylsilylation. The final solution was spiked
with 20 ll retention index solution (6 mg/ml n-decane,
n-dodecane, n-pentadecane, n-nonadecane, n-docosane
dissolved in hexane).
Samples were vaporised and analysed using an Agilent
6890N gas chromatograph and 7683 autosampler (Agilent
Technologies, Stockport, UK) coupled to a LECO Pegasus
III electron impact time-of-flight mass spectrometer
(LECO Corporation, St Joseph, USA). Optimised instru-
mental conditions for serum have been described elsewhere
(O’Hagan et al. 2005). Initial processing of raw data was
undertaken using LECO ChromaTof v2.12 software to
construct a data matrix (metabolite peak versus sample
number) using response ratios (peak area metabolite/peak
area succinic-d4 internal chromatographic standard) to give
the relative amount of each metabolite in each sample,
and this table was used for all subsequent chemometric
modelling. Approximately 900 unique mass spectral sig-
natures were distinguished in the urine and 700 (some of
which may be due to the same metabolites as in urine) in
the serum for each of the 46 individuals (a total of almost
81,000 data points).
2.1.2 Chemometric modelling
There are a number of approaches to the megavariate data
output from GC-MS (see, for example Valafar 2002). Here,
we used unsupervised principal components analysis
(PCA) to look for clustering and remove extreme outliers.
Further supervised methods were then employed to search
for signatures associated with disease status, using a blind
hold-out set for validation.
Following removal of extreme outliers, projection to
latent structures discriminant analysis (PLS-DA) was
applied. Since supervised methods are well known to
overfit models, the robustness of the models obtained were
checked in two ways. Firstly, as an initial screen for
overfitting, the cross-validation parameter Q2 for the model
was compared with Q2 for 20 models built with a randomly
permuted Y-vector (with predictive models generally
showing an intercept on this test which is close to 0).
Secondly, and more importantly, the model based on the 31
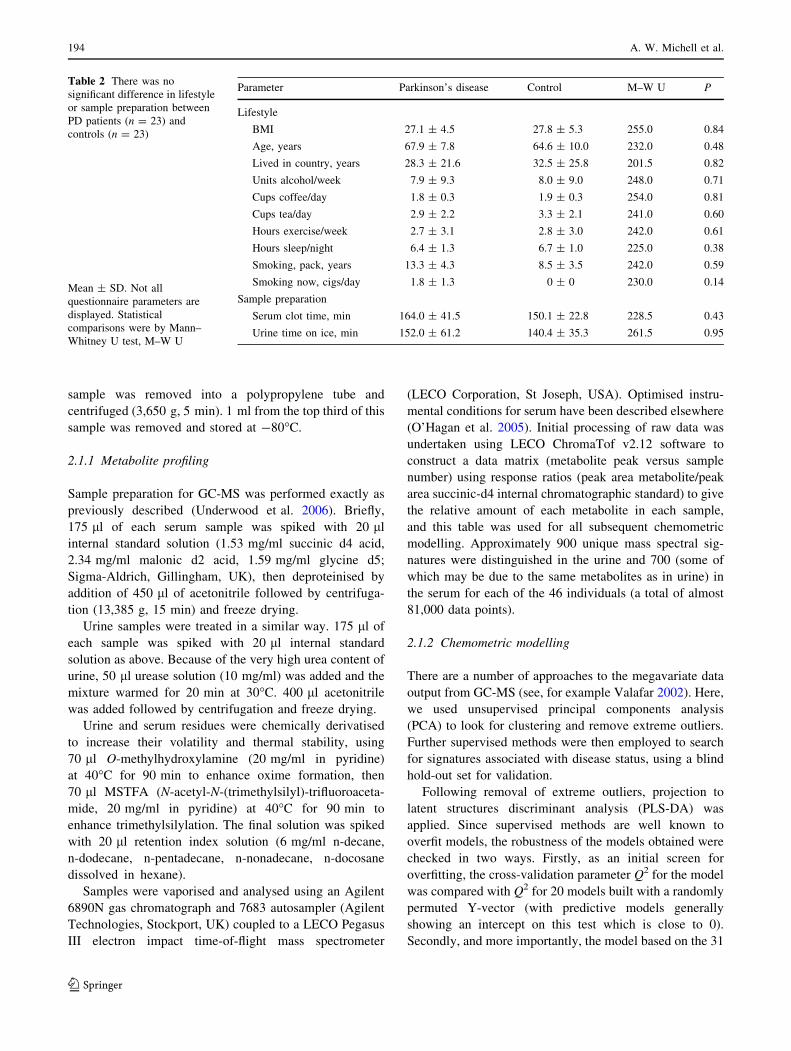
Table 2 There was no
significant difference in lifestyle
or sample preparation between
PD patients (n = 23) and
controls (n = 23)
Mean ± SD. Not all
questionnaire parameters are
displayed. Statistical
comparisons were by Mann–
Whitney U test, M–W U
Parameter Parkinson’s disease Control M–W U P
Lifestyle
BMI 27.1 ± 4.5 27.8 ± 5.3 255.0 0.84
Age, years 67.9 ± 7.8 64.6 ± 10.0 232.0 0.48
Lived in country, years 28.3 ± 21.6 32.5 ± 25.8 201.5 0.82
Units alcohol/week 7.9 ± 9.3 8.0 ± 9.0 248.0 0.71
Cups coffee/day 1.8 ± 0.3 1.9 ± 0.3 254.0 0.81
Cups tea/day 2.9 ± 2.2 3.3 ± 2.1 241.0 0.60
Hours exercise/week 2.7 ± 3.1 2.8 ± 3.0 242.0 0.61
Hours sleep/night 6.4 ± 1.3 6.7 ± 1.0 225.0 0.38
Smoking, pack, years 13.3 ± 4.3 8.5 ± 3.5 242.0 0.59
Smoking now, cigs/day 1.8 ± 1.3 0 ± 0 230.0 0.14
Sample preparation
Serum clot time, min 164.0 ± 41.5 150.1 ± 22.8 228.5 0.43
Urine time on ice, min 152.0 ± 61.2 140.4 ± 35.3 261.5 0.95
194 A. W. Michell et al.
123
individuals was used to predict the disease status of a blind
external hold-out set of 15 individuals, with the statistical
significance of that prediction tested using the v2 statistic.
Only this second test, with prediction of the blind hold-out
set, was used to infer validity of the model. Finally,
significant loadings associated with disease status were
reported, and, where possible, identified with reference to
library searches of mass spectra (MPI/Golm and NIST/
EPA libraries, reported provided s [ 600).
Supervised models were constructed using PLS-DA for
urine, serum and the combined data set. Further models
were constructed to check the effect of medication on the
observed results, including the effect of L-dopa, dopamine
agonists, diuretics, statins, antidepressants and thyroxine.
PCA and PLS-DA was performed using Simca version 10
(Umetrics AB, Umea, Sweden). Analysis was performed on
log transformed data (primarily to eliminate zeros, where a
given mass spectral signature was undetectable in a partic-
ular sample), and default selections were made to exclude
variables with low variance in one or both groups. All
models were constructed on unscaled data, without center-
ing, to preserve weighting in accordance with the inter-
person variance in each metabolite, unless indicated
otherwise.
3 Results
Samples of serum and urine were collected from a total of
23 female PD patients and 23 female controls. The clinical
characteristics of the patients are shown in Table 1, and
lifestyle parameters, as well as details on the preparation of
samples are shown in Table 2. The control and PD groups
did not differ significantly on any lifestyle parameter
measured.
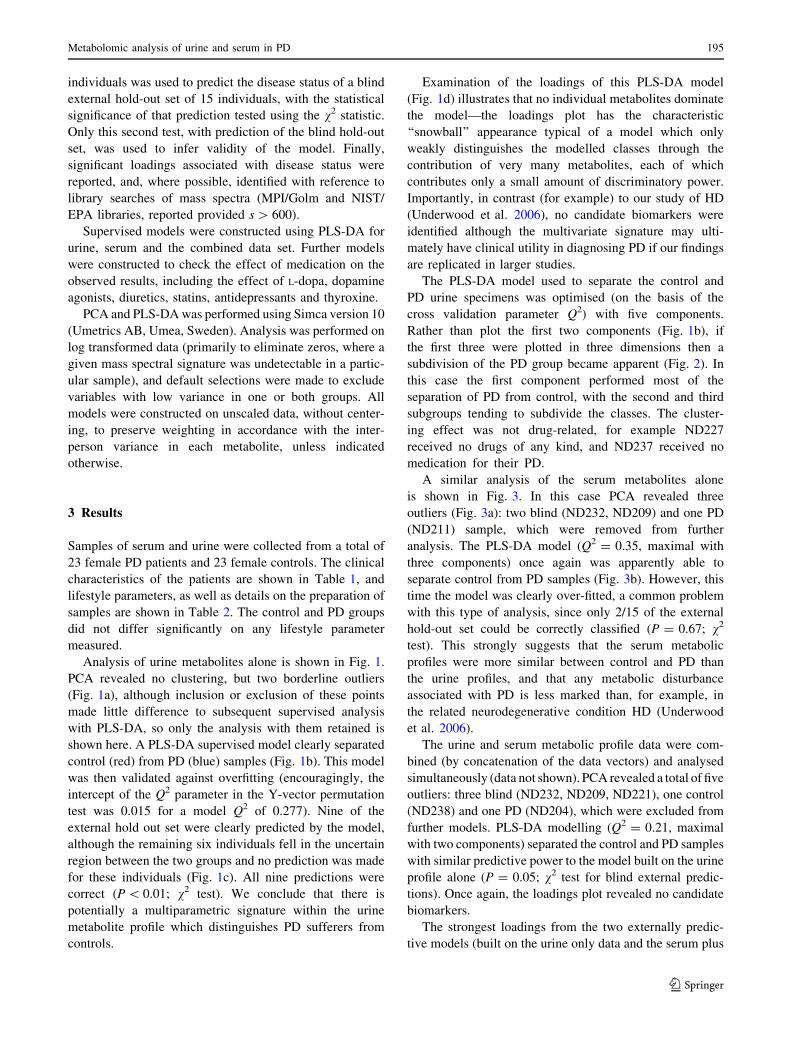
Analysis of urine metabolites alone is shown in Fig. 1.
PCA revealed no clustering, but two borderline outliers
(Fig. 1a), although inclusion or exclusion of these points
made little difference to subsequent supervised analysis
with PLS-DA, so only the analysis with them retained is
shown here. A PLS-DA supervised model clearly separated
control (red) from PD (blue) samples (Fig. 1b). This model
was then validated against overfitting (encouragingly, the
intercept of the Q2 parameter in the Y-vector permutation
test was 0.015 for a model Q2 of 0.277). Nine of the
external hold out set were clearly predicted by the model,
although the remaining six individuals fell in the uncertain
region between the two groups and no prediction was made
for these individuals (Fig. 1c). All nine predictions were
correct (P \ 0.01; v2 test). We conclude that there is
potentially a multiparametric signature within the urine
metabolite profile which distinguishes PD sufferers from
controls.
Examination of the loadings of this PLS-DA model
(Fig. 1d) illustrates that no individual metabolites dominate
the model—the loadings plot has the characteristic
‘‘snowball’’ appearance typical of a model which only
weakly distinguishes the modelled classes through the
contribution of very many metabolites, each of which
contributes only a small amount of discriminatory power.
Importantly, in contrast (for example) to our study of HD
(Underwood et al. 2006), no candidate biomarkers were
identified although the multivariate signature may ulti-
mately have clinical utility in diagnosing PD if our findings
are replicated in larger studies.
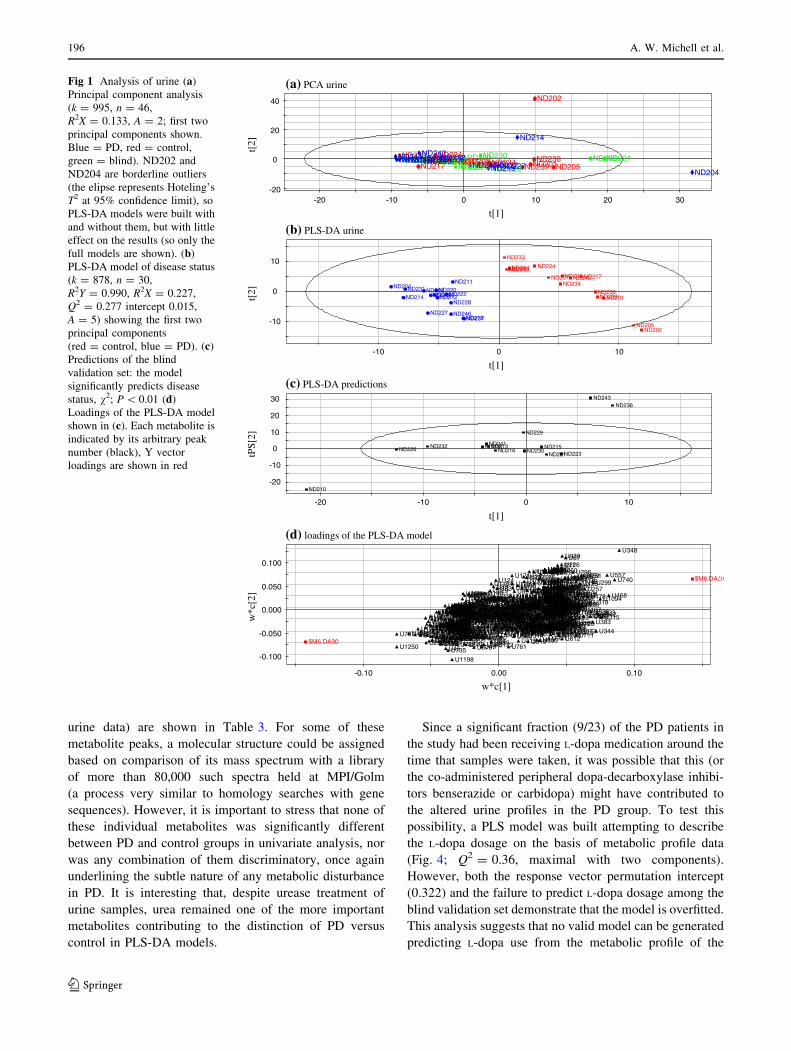
The PLS-DA model used to separate the control and
PD urine specimens was optimised (on the basis of the
cross validation parameter Q2) with five components.
Rather than plot the first two components (Fig. 1b), if
the first three were plotted in three dimensions then a
subdivision of the PD group became apparent (Fig. 2). In
this case the first component performed most of the
separation of PD from control, with the second and third
subgroups tending to subdivide the classes. The cluster-
ing effect was not drug-related, for example ND227
received no drugs of any kind, and ND237 received no
medication for their PD.
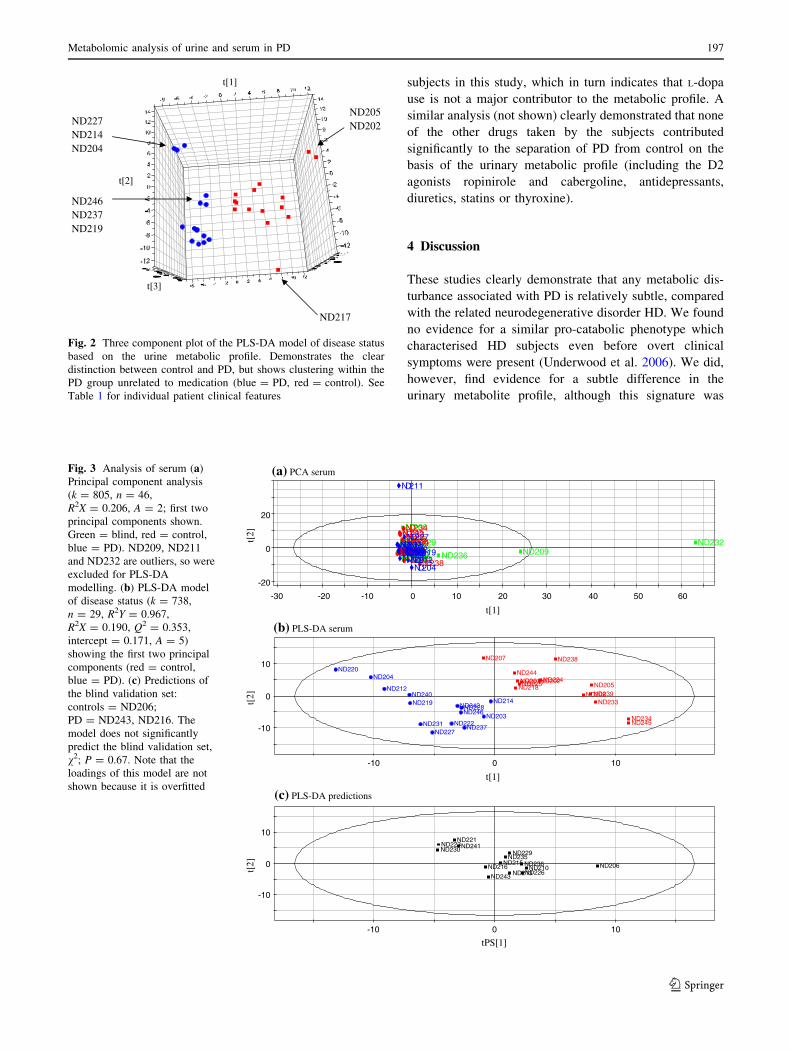
A similar analysis of the serum metabolites alone
is shown in Fig. 3. In this case PCA revealed three
outliers (Fig. 3a): two blind (ND232, ND209) and one PD
(ND211) sample, which were removed from further
analysis. The PLS-DA model (Q2 = 0.35, maximal with
three components) once again was apparently able to
separate control from PD samples (Fig. 3b). However, this
time the model was clearly over-fitted, a common problem
with this type of analysis, since only 2/15 of the external
hold-out set could be correctly classified (P = 0.67; v2
test). This strongly suggests that the serum metabolic
profiles were more similar between control and PD than
the urine profiles, and that any metabolic disturbance
associated with PD is less marked than, for example, in
the related neurodegenerative condition HD (Underwood
et al. 2006).
The urine and serum metabolic profile data were com-
bined (by concatenation of the data vectors) and analysed
simultaneously (data not shown). PCA revealed a total of five
outliers: three blind (ND232, ND209, ND221), one control
(ND238) and one PD (ND204), which were excluded from
further models. PLS-DA modelling (Q2 = 0.21, maximal
with two components) separated the control and PD samples
with similar predictive power to the model built on the urine
profile alone (P = 0.05; v2 test for blind external predic-
tions). Once again, the loadings plot revealed no candidate
biomarkers.
The strongest loadings from the two externally predic-
tive models (built on the urine only data and the serum plus
Metabolomic analysis of urine and serum in PD 195
123
urine data) are shown in Table 3. For some of these
metabolite peaks, a molecular structure could be assigned
based on comparison of its mass spectrum with a library
of more than 80,000 such spectra held at MPI/Golm
(a process very similar to homology searches with gene
sequences). However, it is important to stress that none of
these individual metabolites was significantly different
between PD and control groups in univariate analysis, nor
was any combination of them discriminatory, once again
underlining the subtle nature of any metabolic disturbance
in PD. It is interesting that, despite urease treatment of
urine samples, urea remained one of the more important
metabolites contributing to the distinction of PD versus
control in PLS-DA models.
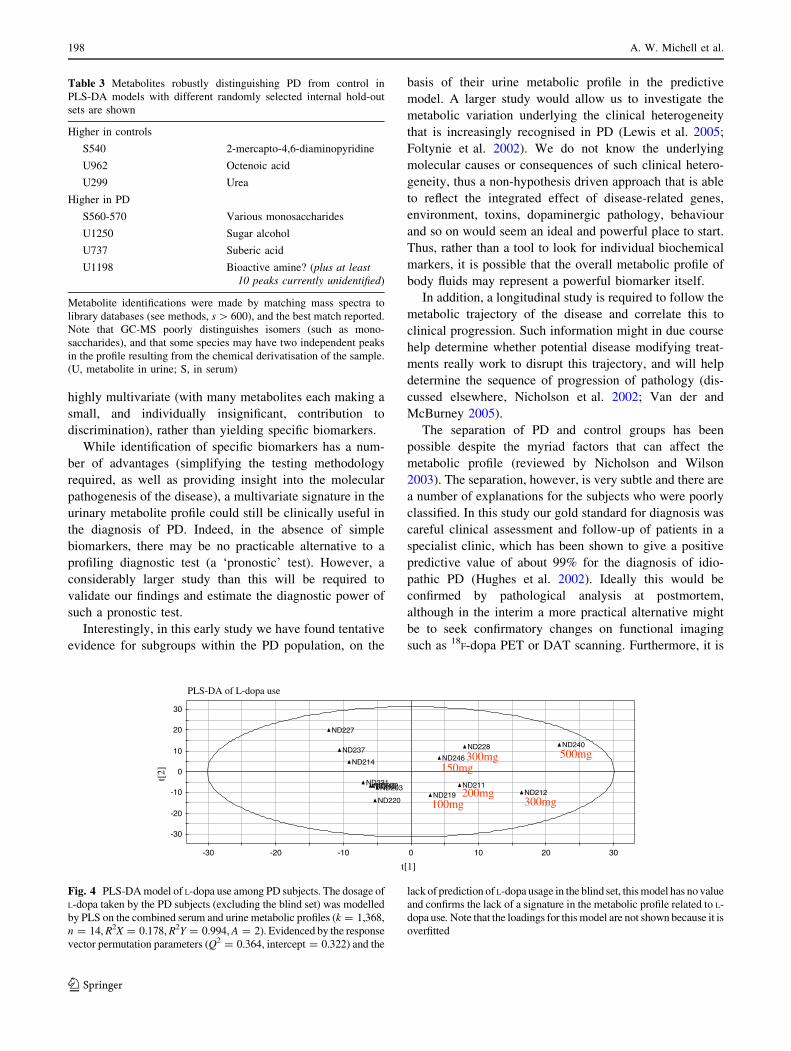
Since a significant fraction (9/23) of the PD patients in
the study had been receiving L-dopa medication around the
time that samples were taken, it was possible that this (or
the co-administered peripheral dopa-decarboxylase inhibi-
tors benserazide or carbidopa) might have contributed to
the altered urine profiles in the PD group. To test this
possibility, a PLS model was built attempting to describe
the L-dopa dosage on the basis of metabolic profile data
(Fig. 4; Q2 = 0.36, maximal with two components).
However, both the response vector permutation intercept
(0.322) and the failure to predict L-dopa dosage among the
blind validation set demonstrate that the model is overfitted.
This analysis suggests that no valid model can be generated
predicting L-dopa use from the metabolic profile of the
-20
0
20
40
-20 -10 0 10
-20 -10 0 10
20 30
ND206ND209ND210ND213 ND215ND216 ND221ND223 ND226
ND229 ND230ND232ND235ND236
ND241ND243 ND201
ND202
ND205ND207ND208ND217
ND218ND224ND225
ND233ND234 ND238
ND239ND244 ND245ND203
ND204
ND211 ND212
ND214
ND219ND220ND222
ND227ND228ND231
ND237ND240ND242
ND246
(a) PCA urine
-10
0
10
100-10
ND201
ND202ND205
ND207ND208 ND217ND218 ND224ND225
ND233
ND234
ND238ND239
ND244
ND245
ND203ND204
ND211
ND212ND214
ND219
ND220ND222
ND227
ND228
ND231
ND237
ND240ND242
ND246
-20
-10
0
10
20
30
ND210
ND213 ND215ND216
ND221ND223ND226
ND229
ND230ND232 ND235
ND236
ND241
ND243
(b) PLS-DA urine
(c) PLS-DA predictions
-0.100
-0.050
0.000
0.050
0.100
0.100.00-0.10
U999U998 U994 U992
U991
U990
U99U988
U987
U982
U981
U98
U979
U978
U976U974
U972
U970
U968U964U962
U960U959
U958
U955
U953
U952
U951U95
U949
U948
U947
U944
U943U942
U940
U939
U938 U937U936
U935U934
U933
U930U929
U928U927
U925
U922U921U920
U92U918
U913
U911
U909
U906
U904 U903
U901
U900
U9
U899U898
U897
U895
U893
U891U890U89
U888
U887
U886
U885
U883U882
U881
U88
U879
U876
U874
U873
U872
U87
U869
U867
U866 U865 U863U862
U860
U858U857U856
U853U852 U851
U850
U849
U848
U847U846U843
U842
U841
U840
U84
U838U837
U836U835
U834U832
U830
U83
U828U825U823
U822
U821
U819
U817
U816
U813
U812U811U810U809
U807U806
U805U802 U801
U8
U799
U798U797 U796
U793
U792
U791U790
U789
U786
U785 U783U782
U781
U78
U776 U775
U773
U772U770
U77U769
U768U764
U763
U762
U761
U760
U76
U759U758U757 U756U755
U754
U753
U752
U751
U750
U75
U748U747
U746U745
U744
U743
U742
U741
U740
U739U738
U737 U736
U735
U733
U732U730 U73
U728
U726U725
U723U720U718
U717U716
U714
U712
U711U710
U709
U707U705
U704
U703U701
U700
U70
U699U696
U695U693U692
U69
U689
U687
U686
U685
U684
U682
U681U680
U68U679
U678 U677U676
U675
U674U672
U671
U670
U67
U669
U667U666
U663
U662
U66
U657
U655
U654
U653
U652U651
U650
U647
U643
U641
U640
U64
U639
U638
U636U635U634U632U631U630
U629
U628
U627
U626
U625
U624
U622
U621
U620
U62
U619
U616
U614
U613
U612
U61
U609
U608
U606
U605
U604
U600
U60U598U597U596 U595U594
U593
U592
U591
U590
U59U589
U588
U587 U586
U585
U584
U583
U582
U581
U580
U58U579U578
U576
U574
U573U572
U570U57
U569
U564
U563
U562
U561U559
U558
U557
U556
U555
U554
U553
U552
U551
U550
U55
U549
U547
U546
U545U543
U542
U540
U54
U539
U537
U536
U534 U533
U532U531
U53
U529U528
U527
U525
U524
U523
U522
U521
U520 U52
U519U518
U516
U515
U514
U513
U512
U510
U508
U507
U506
U505U501
U500U5
U499
U497
U496U495
U494
U493
U492
U491
U490
U49U489
U488
U487U486
U485U483
U481
U480U48
U479
U478
U477U473
U472
U470
U469
U468
U467
U466
U465 U463
U462
U459U455
U453
U451
U45
U449
U448
U447
U444
U443
U442U440
U439
U438 U437U435
U434U432
U430
924U34U
U427
U426 U425U423U42
U419U415
U411U410
U408U407
U405U404
U403
U402
U4
U399
U398
U397
U395
U394
U392
U391
U390
U39
U388
U387
U386
U385U384
U383
U382U380
U378U377
U376U375
U373U371
U370
U369U367
U366
U364
U363
U361
U360U358
U357
U355
U354
U353
U352
U351
U350U349
U348
U347
U346
U344U343
U342
U341U340U339
U338
U337
U334U333U332
U331
U330
U328
U326
U325
U324
U323U322
U321
U320U319
U318U317
U316
U315
U314
U313
U311
U310
U31
U309
U308
U307
U303
U301
U300
U30
U3
U299
U298
U296
U295
U294
U293
U291
U290
U29
U289 U288
U287
U285
U284
U283
U282U281
U280
U28
U279U278
U275
U274U273U272
U271U270
U27 U267
U266U265 U264
U263U261
U258
U257U254U253
U252
U251
U250U249
U248
U246 U245
U242U241
U240
U239U237
U236
U235
U234U233U231
U230
U229
U228
U227
U226
U224
U223
U221U220U22
U217
U216
U214
U212
U211
U210
U21
U209U208
U207U206
U205
U204
U203
U202
U201
U199
U198U197
U195U194
U193U192
U191
U190U19U189
U188
U187U186 U185
U184U182
U180
U18U179
U178
U177
U176
U175 U173
U172
U171
U169
U168
U167
U165 U163
U160
U159
U158 U157U156
U154
U151
U150 U149U147
U146
U145
U144
U142
U141
U140
U139U138
U137
U136
U134
U133
U131
U130
U13
U1299
U1293
U1288
U1285
U1284
U1283U1280
U128U1279
U1276
U1273U1272
U1271
U1267U1264U1263
U1262U1259
U1258
U1257
U1256
U1255
U1254
U1253
U1252U1251
U1250
U125
U1248
U1246
U1244
U1243U1242
U1241
U124
U1239
U1237
U1235
U1233
U1231
U1230
U1229
U1226
U1225U1224
U1223
U1221U1220
U122
U1219
U1218
U1216U1213
U1211
U1210
U121U1209
U1208U1207
U1206 U1204 U120
U12
U1198
U1197
U1194
U1193
U1190 U1189U1188
U1187
U1186U1185
U1183
U1182
U1181
U118
U1179
U1176 U1174
U1173
U117
U1169U1167
U1166
U1164
U1161
U116
U1158U1156
U1154
U1149
U1148
U1146
U1145
U1142
U1141U1140
U114
U1139
U1138U1137
U1135
U1134
U1133
U1131
U1130
U113
U1129U1126U1125
U1121
U1120
U112U1119
U1118
U1116
U1114U1112
U111
U1108
U1107U1106U1104U1103
U1102
U1101
U1100
U110
U11
U1099
U1098
U1095
U1094
U1091
U1090
U109
U1089U1088
U1087
U1086
U1085
U1083
U1082
U1081
U1080U108
U1079U1078 U1077U1076
U1074U1073U1072
U1071
U107
U1069
U1068
U1067U1065U1064
U1063U1062U106
U1059
U1058
U1057U1055
U1053U1052
U1051
U1050
U105U1049
U1048
U1046
U1045
U1043
U1042
U1040U104U1039
U1038
U1037U1036
U1034
U1033
U1032
U1031U1029
U1027
U1026U1025
U1024
U1022
U1021
U102
U1019U1018
U1017U1016
U1015U1013U1010
U1009
U1008U1007
U1006
U1005
U1004
U1003U1002U1000
U100
U1
$M6.DA20
$M6.DA30
(d) loadings of the PLS-DA model
t[1]
t[1]
t[2]
t[
2]
tPS[
2]
t[1]
w*c[1]
w*c
[2]
Fig 1 Analysis of urine (a)
Principal component analysis
(k = 995, n = 46,
R2X = 0.133, A = 2; first two
principal components shown.
Blue = PD, red = control,
green = blind). ND202 and
ND204 are borderline outliers
(the elipse represents Hoteling’s
T2 at 95% confidence limit), so
PLS-DA models were built with
and without them, but with little
effect on the results (so only the
full models are shown). (b)
PLS-DA model of disease status
(k = 878, n = 30,
R2Y = 0.990, R2X = 0.227,
Q2 = 0.277 intercept 0.015,
A = 5) showing the first two
principal components
(red = control, blue = PD). (c)
Predictions of the blind
validation set: the model
significantly predicts disease
status, v2; P \ 0.01 (d)
Loadings of the PLS-DA model
shown in (c). Each metabolite is
indicated by its arbitrary peak
number (black), Y vector
loadings are shown in red
196 A. W. Michell et al.
123
subjects in this study, which in turn indicates that L-dopa
use is not a major contributor to the metabolic profile. A
similar analysis (not shown) clearly demonstrated that none
of the other drugs taken by the subjects contributed
significantly to the separation of PD from control on the
basis of the urinary metabolic profile (including the D2
agonists ropinirole and cabergoline, antidepressants,
diuretics, statins or thyroxine).
4 Discussion
These studies clearly demonstrate that any metabolic dis-
turbance associated with PD is relatively subtle, compared
with the related neurodegenerative disorder HD. We found
no evidence for a similar pro-catabolic phenotype which
characterised HD subjects even before overt clinical
symptoms were present (Underwood et al. 2006). We did,
however, find evidence for a subtle difference in the
urinary metabolite profile, although this signature was
ND205ND202
ND217
ND246ND237ND219
ND227ND214ND204
t[1]
t[2]
t[3]
Fig. 2 Three component plot of the PLS-DA model of disease status
based on the urine metabolic profile. Demonstrates the clear
distinction between control and PD, but shows clustering within the
PD group unrelated to medication (blue = PD, red = control). See
Table 1 for individual patient clinical features
-20
0
20
-30 -20 -10 0 10 20 30 40 50 60
ND206
ND209ND210ND213
ND215ND216ND221ND223
ND226ND229
ND230
ND232ND235 ND236ND241
ND243ND201ND202ND205
ND207
ND208ND217ND218ND224ND225
ND233ND234
ND238
ND239ND244
ND245
ND203
ND204
ND211
ND212ND214ND219ND220ND222
ND227
ND228ND231ND237
ND240ND242ND246
(a) PCA serum
-10
0
10
100-10
ND201ND202ND205
ND207
ND208
ND217ND218
ND224ND225
ND233
ND234
ND238
ND239
ND244
ND245ND203
ND204
ND212
ND214ND219
ND220
ND222ND227
ND228
ND231 ND237
ND240
ND242ND246
(b) PLS-DA serum
-10
0
10
100-10
ND210ND213
ND215ND216
ND221ND223
ND226
ND229ND230ND235
ND236
ND241
ND243
ND206
(c) PLS-DA predictions
t[1]
t[1]
tPS[1]
t[2]
t[
2]
t[2]
Fig. 3 Analysis of serum (a)
Principal component analysis
(k = 805, n = 46,
R2X = 0.206, A = 2; first two
principal components shown.
Green = blind, red = control,
blue = PD). ND209, ND211
and ND232 are outliers, so were
excluded for PLS-DA
modelling. (b) PLS-DA model
of disease status (k = 738,
n = 29, R2Y = 0.967,
R2X = 0.190, Q2 = 0.353,
intercept = 0.171, A = 5)
showing the first two principal
components (red = control,
blue = PD). (c) Predictions of
the blind validation set:
controls = ND206;
PD = ND243, ND216. The
model does not significantly
predict the blind validation set,
v2; P = 0.67. Note that the
loadings of this model are not
shown because it is overfitted
Metabolomic analysis of urine and serum in PD 197
123
highly multivariate (with many metabolites each making a
small, and individually insignificant, contribution to
discrimination), rather than yielding specific biomarkers.
While identification of specific biomarkers has a num-
ber of advantages (simplifying the testing methodology
required, as well as providing insight into the molecular
pathogenesis of the disease), a multivariate signature in the
urinary metabolite profile could still be clinically useful in
the diagnosis of PD. Indeed, in the absence of simple
biomarkers, there may be no practicable alternative to a
profiling diagnostic test (a ‘pronostic’ test). However, a
considerably larger study than this will be required to
validate our findings and estimate the diagnostic power of
such a pronostic test.
Interestingly, in this early study we have found tentative
evidence for subgroups within the PD population, on the
basis of their urine metabolic profile in the predictive
model. A larger study would allow us to investigate the
metabolic variation underlying the clinical heterogeneity
that is increasingly recognised in PD (Lewis et al. 2005;
Foltynie et al. 2002). We do not know the underlying
molecular causes or consequences of such clinical hetero-
geneity, thus a non-hypothesis driven approach that is able
to reflect the integrated effect of disease-related genes,
environment, toxins, dopaminergic pathology, behaviour
and so on would seem an ideal and powerful place to start.
Thus, rather than a tool to look for individual biochemical
markers, it is possible that the overall metabolic profile of
body fluids may represent a powerful biomarker itself.
In addition, a longitudinal study is required to follow the
metabolic trajectory of the disease and correlate this to
clinical progression. Such information might in due course
help determine whether potential disease modifying treat-
ments really work to disrupt this trajectory, and will help
determine the sequence of progression of pathology (dis-
cussed elsewhere, Nicholson et al. 2002; Van der and
McBurney 2005).
The separation of PD and control groups has been
possible despite the myriad factors that can affect the
metabolic profile (reviewed by Nicholson and Wilson
2003). The separation, however, is very subtle and there are
a number of explanations for the subjects who were poorly
classified. In this study our gold standard for diagnosis was
careful clinical assessment and follow-up of patients in a
specialist clinic, which has been shown to give a positive
predictive value of about 99% for the diagnosis of idio-
pathic PD (Hughes et al. 2002). Ideally this would be
confirmed by pathological analysis at postmortem,
although in the interim a more practical alternative might
be to seek confirmatory changes on functional imaging
such as 18F-dopa PET or DAT scanning. Furthermore, it is
Table 3 Metabolites robustly distinguishing PD from control in
PLS-DA models with different randomly selected internal hold-out
sets are shown
Higher in controls
S540 2-mercapto-4,6-diaminopyridine
U962 Octenoic acid
U299 Urea
Higher in PD
S560-570 Various monosaccharides
U1250 Sugar alcohol
U737 Suberic acid
U1198 Bioactive amine? (plus at least10 peaks currently unidentified)
Metabolite identifications were made by matching mass spectra to
library databases (see methods, s [ 600), and the best match reported.
Note that GC-MS poorly distinguishes isomers (such as mono-
saccharides), and that some species may have two independent peaks
in the profile resulting from the chemical derivatisation of the sample.
(U, metabolite in urine; S, in serum)
PLS-DA of L-dopa use
-30
-20
-10
0
10
20
30
-30 -20 -10 0 10 20 30
ND203 ND211ND212
ND214
ND219ND220
ND222
ND227
ND228
ND231
ND237ND240
ND242
ND246 500mg 300mg
300mg 200mg
150mg
100mg
t[1]
t[2]
Fig. 4 PLS-DA model of L-dopa use among PD subjects. The dosage of
L-dopa taken by the PD subjects (excluding the blind set) was modelled
by PLS on the combined serum and urine metabolic profiles (k = 1,368,
n = 14, R2X = 0.178, R2Y = 0.994, A = 2). Evidenced by the response
vector permutation parameters (Q2 = 0.364, intercept = 0.322) and the
lack of prediction of L-dopa usage in the blind set, this model has no value
and confirms the lack of a signature in the metabolic profile related to L-
dopa use. Note that the loadings for this model are not shown because it is
overfitted
198 A. W. Michell et al.
123
possible that some of our control group have presymp-
tomatic disease since incidental Lewy body pathology
occurs in approximately 10% of the elderly population
(Mikolaenko et al. 2005; Tsuboi et al. 2001), and up to
50% of the nigral dopaminergic neurons need to be lost
before any motor symptoms of PD develop (Fearnley and
Lees 1991).
There is of course variation inherent in the technique,
both in the reproducibility of GC-MS analysis, but more
importantly in the samples themselves. For example, an
early morning urine sample will provide a different meta-
bolic profile to one taken later in the day, and both blood
and urine will be affected by diet, exercise and so on. The
standardisation of such factors in the experimental protocol
might reduce variability. Any biomarker must be shown to
be reproducible: the same sample needs to be re-run on the
same machine and on different machines with different
operators, a repeat sample should be compared, and the
whole study needs replication in a different population.
Such reproducibility issues are already being investigated
for nuclear magnetic resonance (1H NMR) spectroscopic
analysis of metabolites (Lindon et al. 2003), and as we
learn more about these emerging techniques it should be
possible to adopt protocols that reduce experimental vari-
ation considerably.
This study deliberately examined only a relatively small
number of subjects since, by restricting the size of the
study, we were able to perform a more comprehensive
phenotypic and biochemical characterisation of each indi-
vidual. This reflects a trade-off between sample size and
the amount of data collected on each individual for a given
resource commitment. Additionally, since the discrimina-
tory power of multivariate statistical modelling increases
very slowly with increasing sample size (DJG, unpublished
observations) in many cases biochemical markers likely to
be of clinical relevance will be identified from studies with
20–40 individuals per group. On this basis, we conclude
that the degree of metabolic perturbation seen in PD is
close to the limits for detection by this metabolomic
approach.
In summary, our findings strongly suggest that the pro-
catabolic metabolic state we identified among HD patients
is not present among PD sufferers. Any metabolic distur-
bances associated with PD are relatively subtle, frustrating
biomarker discovery through a metabolomic approach
(consistent with the lack of success identifying metabolite
biomarkers through a conventional candidate approach
over many years). Changes in urine composition may be
more promising, yielding both a candidate multiparametric
metabolic signature of PD as well as the possibility of
defining PD subtypes but substantially larger studies
(possibly employing additional metabolomic approaches)
are required.
Acknowledgements We thank Dave Broadhurst, Rick Dunn, Dave
Ellis and Douglas Kell for assistance with the analyses. Funding: DJG
is a British Heart Foundation Senior Research Fellow. AWM held a
Parkinson’s Disease Society studentship and Sackler award.
References
Abdi, F., Quinn, J. F., Jankovic, J., McIntosh, M., Leverenz, J. B.,
Peskind, E., Nixon, R., Nutt, J., Chung, K., Zabetian, C., Samii,
A., Lin, M., Hattan, S., Pan, C., Wang, Y., Jin, J., Zhu, D., Li, G.
J., Liu, Y., Waichunas, D., Montine, T. J., & Zhang, J. (2006).
Detection of biomarkers with a multiplex quantitative proteomic
platform in cerebrospinal fluid of patients with neurodegenera-
tive disorders. Journal of Alzheimer’s Disease, 9(3), 293–348.
Bohnen, N. I., Kaufer, D. I., Ivanco, L. S., Lopresti, B., Koeppe, R.
A., Davis, J. G., Mathis, C. A., Moore, R. Y., & DeKosky, S. T.
(2003). Cortical cholinergic function is more severely affected in
parkinsonian dementia than in Alzheimer disease: An in vivo
positron emission tomographic study. Archives of Neurology, 60,
1745–1748. doi:10.1001/archneur.60.12.1745.
Braak, H., Del Tredici, K., Rub, U., de Vos, R. A., Jansen Steur, E. N., &
Braak, E. (2003). Staging of brain pathology related to sporadic
Parkinson’s disease. Neurobiology of Aging, 24, 197–211. doi:
10.1016/S0197-4580(02)00065-9.
Brindle, J. T., Antti, H., Holmes, E., Tranter, G., Nicholson, J. K.,
Bethell, H. W., Clarke, S., Schofield, P. M., McKilligin, E.,
Mosedale, D. E., & Grainger, D. J. (2002). Rapid and
noninvasive diagnosis of the presence and severity of coronary
heart disease using 1H-NMR-based metabonomics. NatureMedicine, 8, 1439–1444. doi:10.1038/nm802.
Brindle, J. T., Nicholson, J. K., Schofield, P. M., Grainger, D. J., &
Holmes, E. (2003). Application of chemometrics to 1H NMR
spectroscopic data to investigate a relationship between human
serum metabolic profiles and hypertension. Analyst, 128, 32–36.
doi:10.1039/b209155k.
Burn, D. J., & Lees, A. J. (2002). Progressive supranuclear palsy:
Where are we now? Lancet Neurology, 1, 359–369. doi:10.1016/
S1474-4422(02)00161-8.
Di Monte, D. A. (2003). The environment and Parkinson’s disease: Is the
nigrostriatal system preferentially targeted by neurotoxins? LancetNeurology, 2, 531–538. doi:10.1016/S1474-4422(03)00501-5.
Dunn, W. B., Bailey, N. J., & Johnson, H. E. (2005). Measuring the
metabolome: Current analytical technologies. Analyst, 130, 606–
625. doi:10.1039/b418288j.
Dunne, V. G., Bhattachayya, S., Besser, M., Rae, C., & Griffin, J. L.
(2005). Metabolites from cerebrospinal fluid in aneurysmal sub-
arachnoid haemorrhage correlate with vasospasm and clinical
outcome: A pattern-recognition 1H NMR study. NMR in Biomed-icine, 18, 24–33. doi:10.1002/nbm.918.
Edwards, L. L., Quigley, E. M., & Pfeiffer, R. F. (1992). Gastroin-
testinal dysfunction in Parkinson’s disease: Frequency and
pathophysiology. Neurology, 42, 726–732.
Fearnley, J. M., & Lees, A. J. (1991). Ageing and Parkinson’s disease:
Substantia nigra regional selectivity. Brain, 114(Pt 5), 2283–2301.
doi:10.1093/brain/114.5.2283.
Foltynie, T., Brayne, C., & Barker, R. A. (2002). The heterogeneity of
idiopathic Parkinson’s disease. Journal of Neurology, 249, 138–145.
doi:10.1007/PL00007856.
Gavaghan, C. L., Holmes, E., Lenz, E., Wilson, I. D., & Nicholson, J.
K. (2000). An NMR-based metabonomic approach to investigate
the biochemical consequences of genetic strain differences:
Application to the C57BL10J and Alpk:ApfCD mouse. FEBSLetters, 484, 169–174. doi:10.1016/S0014-5793(00)02147-5.
Ghauri, F. Y., Nicholson, J. K., Sweatman, B. C., Wood, J., Beddell, C.
R., Lindon, J. C., & Cairns, N. J. (1993). NMR spectroscopy of
Metabolomic analysis of urine and serum in PD 199
123
human post mortem cerebrospinal fluid: Distinction of Alzhei-
mer’s disease from control using pattern recognition and statistics.
NMR in Biomedicine, 6, 163–167. doi:10.1002/nbm.1940060210.
Gibb, W. R., & Lees, A. J. (1988). The relevance of the Lewy body to
the pathogenesis of idiopathic Parkinson’s disease. Journal ofNeurology, Neurosurgery, and Psychiatry, 51, 745–752.
Griffin, J. L. (2003). Metabonomics: NMR spectroscopy and pattern
recognition analysis of body fluids and tissues for characterisation
of xenobiotic toxicity and disease diagnosis. Current Opinion inChemical Biology, 7, 648–654. doi:10.1016/j.cbpa.2003.08.008.
Hughes, A. J., Daniel, S. E., Ben Shlomo, Y., & Lees, A. J. (2002).
The accuracy of diagnosis of parkinsonian syndromes in a
specialist movement disorder service. Brain, 125, 861–870. doi:
10.1093/brain/awf080.
Hughes, A. J., Daniel, S. E., Kilford, L., & Lees, A. J. (1992).
Accuracy of clinical diagnosis of idiopathic Parkinson’s disease:
A clinico-pathological study of 100 cases. Journal of Neurology,Neurosurgery, and Psychiatry, 55, 181–184.
Kirschenlohr, H. L., Griffin, J. L., Clarke, S. C., Rhydwen, R., Grace, A.
A., Schofield, P. M., Brindle, K. M., & Metcalfe, J. C. (2006). Proton
NMR analysis of plasma is a weak predictor of coronary artery
disease. Nature Medicine, 12(6), 705–710. doi:10.1038/nm1432.
Lenz, E. M., Bright, J., Wilson, I. D., Hughes, A., Morrisson, J.,
Lindberg, H., & Lockton, A. (2004). Metabonomics, dietary
influences and cultural differences: A 1H NMR-based study of
urine samples obtained from healthy British and Swedish
subjects. Journal of Pharmaceutical and Biomedical Analysis,36, 841–849. doi:10.1016/j.jpba.2004.08.002.
Lewis, S. J., Foltynie, T., Blackwell, A. D., Robbins, T. W., Owen, A.
M., & Barker, R. A. (2005). Heterogeneity of Parkinson’s disease
in the early clinical stages using a data driven approach. Journal ofNeurology, Neurosurgery, and Psychiatry, 76, 343–348. doi:
10.1136/jnnp.2003.033530.
Lindon, J. C., Nicholson, J. K., Holmes, E., Antti, H., Bollard, M. E.,
Keun, H., Beckonert, O., Ebbels, T. M., Reily, M. D., Robertson,
D., Stevens, G. J., Luke, P., Breau, A. P., Cantor, G. H., Bible, R.
H., Niederhauser, U., Senn, H., Schlotterbeck, G., Sidelmann, U.
G., Laursen, S. M., Tymiak, A., Car, B. D., Lehman-McKeeman,
L., Colet, J. M., Loukaci, A., & Thomas, C. (2003). Contem-
porary issues in toxicology the role of metabonomics in
toxicology and its evaluation by the COMET project. Toxicologyand Applied Pharmacology, 187, 137–146. doi:10.1016/S0041-
008X(02)00079-0.
Mauborgne, A., Javoy-Agid, F., Legrand, J. C., Agid, Y., & Cesselin,
F. (1983). Decrease of substance P-like immunoreactivity in the
substantia nigra and pallidum of parkinsonian brains. BrainResearch, 268, 167–170. doi:10.1016/0006-8993(83)90403-1.
Mayeux, R., Chen, J., Mirabello, E., Marder, K., Bell, K., Dooneief,
G., Cote, L., & Stern, Y. (1990). An estimate of the incidence of
dementia in idiopathic Parkinson’s disease. Neurology, 40,
1513–1517.
Michell, A. W., Lewis, S. J., Foltynie, T., & Barker, R. A. (2004).
Biomarkers and Parkinson’s disease. Brain, 127, 1693–1705.
doi:10.1093/brain/awh198.
Michell, A. W., Luheshi, L. M., & Barker, R. A. (2005). Skin and
platelet alpha-synuclein as peripheral biomarkers of Parkinson’s
disease. Neuroscience Letters, 381, 294–298. doi:10.1016/j.neulet.
2005.02.030.
Mikolaenko, I., Pletnikova, O., Kawas, C. H., O’Brien, R., Resnick, S.
M., Crain, B., & Troncoso, J. C. (2005). Alpha-synuclein lesions
in normal aging, Parkinson disease, and Alzheimer disease:
evidence from the Baltimore Longitudinal Study of Aging
(BLSA). Journal of Neuropathology and Experimental Neurol-ogy, 64, 156–162.
Nicholson, J. K., Connelly, J., Lindon, J. C., & Holmes, E. (2002).
Metabonomics: A platform for studying drug toxicity and gene
function. Nature Reviews Drug Discovery, 1, 153–161. doi:
10.1038/nrd728.
Nicholson, J. K., & Wilson, I. D. (2003). Opinion: understanding
‘global’ systems biology: metabonomics and the continuum of
metabolism. Nature Reviews Drug Discovery, 2, 668–676. doi:
10.1038/nrd1157.
O’Hagan, S., Dunn, W. B., Brown, M., Knowles, J. D., & Kell, D. B.
(2005). Closed-loop, multiobjective optimization of analytical
instrumentation: gas chromatography/time-of-flight mass spec-
trometry of the metabolomes of human serum and of yeast
fermentations. Analytical Chemistry, 77, 290–303. doi:
10.1021/ac049146x.
Odunsi, K., Wollman, R. M., Ambrosone, C. B., Hutson, A., McCann,
S. E., Tammela, J., Geisler, J. P., Miller, G., Sellers, T., Cliby,
W., Qian, F., Keitz, B., Intengan, M., Lele, S., & Alderfer, J. L.
(2005). Detection of epithelial ovarian cancer using 1H-NMR-
based metabonomics. International Journal of Cancer, 113,
782–788. doi:10.1002/ijc.20651.
Olanow, C. W., & Tatton, W. G. (1999). Etiology and pathogenesis of
Parkinson’s disease. Annual Review of Neuroscience, 22, 123–144.
doi:10.1146/annurev.neuro.22.1.123.
Parkinson, J. (1817). An essay on the shaking palsy. London:
Sherwood, Neely and Jones.
Poewe, W., & Wenning, G. (2002). The differential diagnosis of
Parkinson’s disease. European Journal of Neurology, 9(Suppl 3),
23–30. doi:10.1046/j.1468-1331.9.s3.3.x.
Raamsdonk, L. M., Teusink, B., Broadhurst, D., Zhang, N., Hayes,
A., Walsh, M. C., Berden, J. A., Brindle, K. M., Kell, D. B.,
Rowland, J. J., Westerhoff, H. V., van Dam, K., & Oliver, S. G.
(2001). A functional genomics strategy that uses metabolome
data to reveal the phenotype of silent mutations. NatureBiotechnology, 19, 45–50. doi:10.1038/83496.
Ravasz, E., Somera, A. L., Mongru, D. A., Oltvai, Z. N., & Barabasi, A.
L. (2002). Hierarchical organization of modularity in metabolic
networks. Science, 297, 1551–1555. doi:10.1126/science.1073374.
Sato, S., Mizuno, Y., & Hattori, N. (2005). Urinary 8-hydrox-
ydeoxyguanosine levels as a biomarker for progression of
Parkinson disease. Neurology, 64, 1081–1083.
Scatton, B., Javoy-Agid, F., Rouquier, L., Dubois, B., & Agid, Y.
(1983). Reduction of cortical dopamine, noradrenaline, serotonin
and their metabolites in Parkinson’s disease. Brain Research,275, 321–328. doi:10.1016/0006-8993(83)90993-9.
Scherzer, C. R., Eklund, A. C., Morse, L. J., Liao, Z., Locascio, J. J., Fefer,
D., Schwarzschild, M. A., Schlossmacher, M. G., Hauser, M. A.,
Vance, J. M., Sudarsky, L. R., Standaert, D. G., Growdon, J. H.,
Jensen, R. V., & Gullans, S. R. (2007). Molecular markers of early
Parkinson’s disease based on gene expression in blood. Proceedingsof the National Academy of Sciences, 104(3), 955–960. doi:10.1073/
pnas.0610204104.
Taquet, H., Javoy-Agid, F., Hamon, M., Legrand, J. C., Agid, Y., &
Cesselin, F. (1983). Parkinson’s disease affects differently Met5-
and Leu5-enkephalin in the human brain. Brain Research, 280,
379–382. doi:10.1016/0006-8993(83)90071-9.
Tsuboi, Y., Ahlskog, J. E., Apaydin, H., Parisi, J. E., & Dickson, D.
W. (2001). Lewy bodies are not increased in progressive
supranuclear palsy compared with normal controls. Neurology,57, 1675–1678.
Underwood, B. R., Broadhurst, D., Dunn, W. B., Ellis, D. I.,
Michell, A. W., Vacher, C., Mosedale, D. E., Kell, D. B.,
Barker, R. A., Grainger, D. J., & Rubinsztein, D. C. (2006).
Huntington disease patients and transgenic mice have similar
pro-catabolic serum metabolite profiles. Brain, 129, 877–886.
doi:10.1093/brain/awl027.
Valafar, F. (2002). Pattern recognition techniques in microarray data
analysis: A survey. Annals of the New York Academy of Sciences,980, 41–64.
200 A. W. Michell et al.
123

Van, Q. N., Klose, J. R., Lucas, D. A., Prieto, D. A., Luke, B., Collins, J.,
Burt, S. K., Chmurny, G. N., Issaq, H. J., Conrads, T. P., Veenstra,
T. D., & Keay, S. K. (2003). The use of urine proteomic and
metabonomic patterns for the diagnosis of interstitial cystitis and
bacterial cystitis. Disease Markers, 19, 169–183.
Van der, G. J., & McBurney, R. N. (2005). Innovation: Rescuing drug
discovery: In vivo systems pathology and systems pharmacology.
Nature Reviews Drug Discovery, 4, 961–967. doi:10.1038/nrd1904.
Vila, M., & Przedborski, S. (2004). Genetic clues to the pathogenesis
of Parkinson’s disease. Nature Medicine, 10(Suppl), S58–S62.
doi:10.1038/nm1068.
Visser, M., Marinus, J., Stiggelbout, A. M., & Van Hilten, J. J. (2004).
Assessment of autonomic dysfunction in Parkinson’s disease:
The SCOPA-AUT. Movement Disorders, 19, 1306–1312. doi:
10.1002/mds.20153.
Metabolomic analysis of urine and serum in PD 201
123