Embed Size (px)
Citation preview
�����������������
Citation: Maniscalco, M.; Paris, D.;
Cuomo, P.; Fuschillo, S.; Ambrosino,
P.; Tramice, A.; Palomba, L.; Motta, A.
Metabolomics of COPD Pulmonary
Rehabilitation Outcomes via Exhaled
Breath Condensate. Cells 2022, 11,
344. https://doi.org/10.3390/cells
11030344
Academic Editor: Katsutoshi
Nakayama
Received: 12 December 2021
Accepted: 17 January 2022
Published: 20 January 2022
Publisher’s Note: MDPI stays neutral
with regard to jurisdictional claims in
published maps and institutional affil-
iations.
Copyright: © 2022 by the authors.
Licensee MDPI, Basel, Switzerland.
This article is an open access article
distributed under the terms and
conditions of the Creative Commons
Attribution (CC BY) license (https://
creativecommons.org/licenses/by/
4.0/).
cells
Article
Metabolomics of COPD Pulmonary Rehabilitation Outcomesvia Exhaled Breath CondensateMauro Maniscalco 1,*,† , Debora Paris 2,†, Paola Cuomo 2, Salvatore Fuschillo 1, Pasquale Ambrosino 3 ,Annabella Tramice 2, Letizia Palomba 4 and Andrea Motta 2,*
1 Pulmonary Rehabilitation Unit of Telese Terme Institute, Istituti Clinici Scientifici Maugeri IRCCS,82037 Telese Terme, Italy; [email protected]
2 Institute of Biomolecular Chemistry, National Research Council, 80078 Pozzuoli, Italy;[email protected] (D.P.); [email protected] (P.C.); [email protected] (A.T.)
3 Cardiac Rehabilitation Unit of Telese Terme Institute, Istituti Clinici Scientifici Maugeri IRCCS,82037 Telese Terme, Italy; [email protected]
4 Department of Biomolecular Sciences, University of Urbino “Carlo Bo”, 61029 Urbino, Italy;[email protected]
* Correspondence: [email protected] (M.M.); [email protected] (A.M.)† These authors contributed equally to this work.
Abstract: Chronic obstructive pulmonary disease (COPD) is characterized by different phenotypesand clinical presentations. Therefore, a single strategy of pulmonary rehabilitation (PR) does notalways yield the expected clinical outcomes as some individuals respond excellently, others discreetly,or do not respond at all. Fifty consecutive COPD patients were enrolled. Of them, 35 starting a 5-weekPR program were sampled at admission (T0), after 2 (T2W) and 5 (T5W) weeks, while 15 controls notyet on PR were tested at T0 and T5W. Nuclear magnetic resonance (NMR) profiling of exhaled breathcondensate (EBC) and multivariate statistical analysis were applied to investigate the relationshipbetween biomarkers and clinical parameters. The model including the three classes correctly locatedT2W between T0 and T5W, but 38.71% of samples partially overlapped with T0 and 32.26% withT5W, suggesting that for some patients PR is already beneficial at T2W (32.26% overlapping withT5W), while for others (38.71% overlapping with T0) more time is required. Rehabilitated patientspresented several altered biomarkers. In particular, methanol from T0 to T5W decreased in parallelwith dyspnea and fatigue, while the walk distance increased. Methanol could be ascribed to lunginflammation. We demonstrated that the metabolic COPD phenotype clearly evolves during PR, witha strict relationship between clinical and molecular parameters. Methanol, correlating with clinicalparameters, represents a useful biomarker for monitoring personalized outcomes and establishingmore targeted protocols.
Keywords: chronic obstructive pulmonary disease; biomarkers; metabolomics; NMR; outcomes;personalized therapies; rehabilitation; exercise; disability
1. Introduction
Currently, chronic obstructive pulmonary disease (COPD) is the third leading cause ofdeath worldwide [1]. In recent years, given the rising social and economic costs, COPDprevention and treatment have received growing attention [2], and pulmonary rehabili-tation (PR), although underused [3], has become essential for COPD management. PR isa multidisciplinary approach based on exercise training and pharmacological and non-pharmacological (e.g., physical, psychological, educational, and nutritional) interven-tions [4]. Expected PR outcomes are improvement in dyspnea, quality of life, exercisetolerance, and a reduction in hospitalization [4]. However, COPD remains a disease with awide spectrum of clinical presentations, with different phenotypes even in patients witha comparable degree of airflow limitation [5]. Therefore, the individual response to PR
Cells 2022, 11, 344. https://doi.org/10.3390/cells11030344 https://www.mdpi.com/journal/cells
Cells 2022, 11, 344 2 of 17
is highly variable and sometimes unpredictable [6], because “there is currently no stan-dardized way to assess which model would best suit which patient (and vice versa)” [3].As a consequence, COPD management would highly benefit from unbiased molecularbiomarkers of PR outcomes.
Since metabolomics can identify and quantify the small molecules produced duringbiological processes, it has become an essential tool for phenotyping respiratory diseases [7].Furthermore, metabolomics can map metabolic pathways altered by the diseases’ patho-physiology, thus having a key role in discovering novel biomarkers and monitoring treat-ment response [8]. Recently, nuclear magnetic resonance (NMR)-based metabolomics ofexhaled breath condensate (EBC) has been proposed as a rapid and non-invasive tool for in-vestigating airway diseases [9,10]. EBC is a natural matrix that can be easily, non-invasively,and repeatedly obtained by cooling exhaled air from spontaneous tidal breathing. Be-cause of its origin, it likely reflects airway inflammation [11], and its study by NMR-basedmetabolomics has become a standardized method with practical clinical applications inchronic respiratory diseases [12].
We postulated that EBC metabolomics and clinics could usefully interact for phenotyp-ing rehabilitating COPD patients, carefully describing physiological changes and detectingpossible biomarkers that could define PR outcomes and personal rehabilitation treatment.By using NMR-based metabolomics of EBC, we here identified dysregulated biomarkers ofclinical and functional response in a cohort of COPD patients undergoing in-hospital PR.
2. Materials and Methods2.1. Patients
For this single-center prospective controlled study, consecutive COPD patients refer-ring to the Pulmonary Rehabilitation Unit of Istituti Clinici Scientifici Maugeri Spa SB,IRCCS of Telese Terme (Benevento), Italy, were screened for eligibility. COPD patientsundergoing PR were enrolled as cases, while those not yet on PR served as controls.
The only major inclusion criterion was the presence of an objectively confirmeddiagnosis of COPD, according to Global Obstructive Lung Disease (GOLD) guidelines [6].Exclusion criteria were a history of asthma or any respiratory disease other than COPD;a diagnosis of alpha-1 antitrypsin deficiency; any previous lung surgery; a history of anyimmune-mediated chronic inflammatory disease; history of cardiovascular diseases (acutemyocardial infarction, congestive heart failure, stroke); current malignant disease or adiagnosis of malignancy in the 2 years prior to the first visit; an exacerbation of COPD;hospitalization or change in drug treatment during the 4 weeks prior to the first visit;inability to walk; any blood transfusion 4 weeks prior to the first visit; suspicion of alcoholor drug abuse, or non-complete adherence to exercise training and time schedule, as wellas motivation.
The study was conducted in accordance with the Declaration of Helsinki of the WorldMedical Association. The study was approved by the Institutional Review Board of IstitutoNazionale Tumori, Fondazione Pascale, Naples, Italy, with reference number ICS 2/17,and all patients provided written informed consent to use their de-identified data forfuture research.
2.2. Study Procedures
After informed consent signature, a detailed medical history was recorded for eachpatient. For COPD patients starting the 5-week PR program, all study procedures wereperformed at admission (T0) and repeated after 2 (T2W) and 5 (T5W) weeks. For controlsubjects (COPD patients not on PR), only two evaluation time-points were considered (T0and T5W).
2.3. Pulmonary Function Tests (PFTs)
For each patient, post-bronchodilator forced expiratory volume in the first second(FEV1) and forced vital capacity (FVC) were measured using standardized spirometry. Their
Cells 2022, 11, 344 3 of 17
ratio (FEV1/FVC) was also calculated. Lung volumes, flow rates, and single breath carbonmonoxide diffusing capacity (DLCO) were determined using an automated equipment(Vyasis, Milan, Italy) in agreement with standardized procedures [13]. A comprehensiveassessment of symptoms and risk of exacerbations was performed at admission in theframe of the refined ABCD risk assessment tool [14].
2.4. 6-Minute-Walk Test (6MWT)
The 6MWT was performed at each time-point according to American Thoracic Society(ATS) recommendations [15]. The test was performed along an air-conditioned hospitalcorridor 15 m long. The walk was symptom-limited, allowing patients to pause if necessary,and continue after they had rested. The covered distance was expressed in meters. Duringthe test, the oxygen saturation was continuously monitored by a pulse oxymeter via a fingerelectrode. Patients were asked to rate their symptoms at the beginning and at the end of thetest using the modified Borg CR10 scale [16]. The Borg CRD10 scale represents a valid andwidespread tool for measuring the intensity of perceived dyspnea and physical exertionin a numerical range between 0 and 10. Before the 6MWT, each patient was instructed totransform the severity of perceived dyspnea and muscle fatigue into a numerical valueknowing that 0 expresses the absence and 10 the maximum of perceived severity of bothdyspnea and fatigue.
2.5. Pulmonary Rehabilitation
Patients underwent a 5-week PR program with daily sessions (6 sessions/week). Theprogram consisted of 30 sessions following the official ATS/ERS statement [17], includingphysical exercise training, dietary and psychosocial counseling. Physical exercise trainingincluded exercises to strengthen groups of muscle in the upper and lower extremities, tread-mill walking and stationary cycling. Lower limb strengthening exercises were performedusing body weight (squats, sit-to-stands, and step-ups), and fixed weights (leg extensionand leg press) at a load that could be supported for 8–10 repetitions before muscle exhaus-tion. A similar overload stimulus was considered for upper extremities, with both free andfixed weights (pull downs and chest press) being used. Resistances were increased onceparticipants were able to complete three sets of 8–10 repetitions in two consecutive trainingsessions. Arm ergometry was performed for 10 min per session at an intensity of 3–4 onthe Rating of Perceived Exertion (RPE) 0–10 scale [18]. Initial treadmill walking durationwas 15 min and was progressed to 30 min within the first 2 weeks from admission, aimingat an RPE score of 3–4. Similarly, lower limb cycling intensity was set at an intensity aimedat scoring dyspnea or perceived exertion from 3 to 4 on the modified 0–10 category-ratioscale [19]. All patients also underwent flexibility and stretching exercises. Participationwas supervised and monitored by physiotherapists.
2.6. EBC Collection
All subjects were asked to refrain from food intake for 8 h, and from alcoholic drinksfor 18 h, which they confirmed before sample collection. EBC was collected in a randomorder and in the same room with a TURBO-DECCS condenser (Medivac, Pilastrello, Parma,Italy, www.medivac.it, accessed on 30 November 2021) set at −5.0 ± 1.0 ◦C as reported [20].We obtained, on average, 2.0 ± 0.3 mL (mean ± SD) of EBC from each subject. Salivarycontamination of the samples was tested by measuring their α-amylase activity, and using1D-NMR spectra, in which contaminated spectra present signals from carbohydrates (absentin EBC spectra). The room temperature remained constant (24 ± 1.0 ◦C) throughout thesampling period. Possible air contaminants in the collecting room were monitored with adedicated sampling pump for air monitoring (Zambelli EGO PLUS TT; Zambelli, Milan,Italy), working at a flow rate of 8 min per liter and tidal volume (500 mL) into the condenser,so as to simulate human breath. The pump was connected to the condenser outlet for15 min, and special filters (3M Particulate Filters P100; 3M Italia, Milan, Italy; tested againstparticles approximately 0.3 µm in size) for respiratory protection were applied to the
Cells 2022, 11, 344 4 of 17
one-way valve of the mouthpiece condenser used for the whole set of experiments. NMRspectra of condensed room air from the collecting device were devoid of signals, confirmingthe absence of air pollutants (data not shown).
To reduce the risk of contamination by inhaling hospital air, subjects were sampledafter a 30 min rest in the greenhouse of the Department of Respiratory Medicine, whichwas shown to be contaminant free as described above for the collecting room.
2.7. NMR Sample Preparation and Spectra Acquisition
EBC samples were rapidly defrosted. To provide a field frequency lock, 70 µL of a2H2O solution (deuterated water, containing 0.1 mmol per liter 3-(Trimethylsilyl)propionic-2,2,3,3-d4 acid sodium salt (TSP) as a chemical shift reference for 1H spectra and sodiumazide at 3 mmol per liter as a bacteriostatic agent) was added to 630 µL of EBC, reaching700 µL of total volume. NMR spectra were recorded on a Bruker Avance III 600 MHzspectrometer (BrukerBioSpin GmbH, Rheinstetten, Germany) equipped with a CryoProbeand an automatic and cooled sample changer of 24 positions controlled by the softwareICON-NMR program suite (TOPSPIN 3.60 version, BrukerBioSpin GmbH, Rheinstetten,Germany). Sample temperature was kept constant at 300 K (27 ◦C). 1D spectra includ-ing water suppression with excitation sculpting sequence [21], together with homo- andheteronuclear 2D experiments (1H-1H clean TOCSY and 1H-13C HSQC) were acquired aspreviously described [9,10].
2.8. Power Analysis
For projection methods, the power of the analysis cannot be evaluated by standardizedmethods. In metabolomics studies, a priori power analysis is not possible because biomark-ers and their concentration variations are not known before analysis [22]. For an estimation,the 1 − α and 1 − β parameters were varied from 95% to 99.9% and from 80% to 99.9%,respectively. Using the accuracy percentages obtained in our validation tests (see Resultsand [22]) for 1 − α = 95% and 1 − β = 80%, we derived 22 ± 3 COPD patients for all classes,while for 1 − α = 1 − β = 99.9% we obtained 25 ± 2 patients. To account for possibledrop-outs or protocol adherence issues, we screened 100 COPD patients for eligibility, withthe final patients exceeding the numbers obtained from the backward analysis. Normally,1 − α = 95% and 1 − β = 80%, while 99.9% represents an extreme condition.
2.9. Multivariate Data Analysis
EBC proton spectra ranging from 8.60 to 0.60 ppm were automatically binned into400 integrals of 0.02 ppm each using the AMIX 3.9.15 software package (Bruker BiospinGmbH, Rheinstetten, Germany). The residual water resonance region (5.10–4.60 ppm) wasexcluded, and each integrated region was normalized to the total spectrum area to avoidpossible dilution effects on the signals. The obtained NMR data format, expressed by amatrix (X matrix), was then imported into the software package Soft Independent Modelingof Class Analogy P version 14 (SIMCA-P+14) (Umetrics, Umeå, Sweden) where PrincipalComponents Analysis (PCA) and Orthogonal Projections to Latent Structures DiscriminantAnalysis (OPLS-DA) were performed, after unit variance (UV) scaling. Initially, PCA wasused to reduce data dimensionality and to explore possible trends and outliers. Onceclass homogeneity was assessed for each group, supervised OPLS-DA was applied toemphasize categories’ discrimination, where dummy variables were assigned to defineclass belonging (Y matrix). Supervised regressions were conducted comparing EBC groupsat T0, T2W, and T5W to generate predictive models that better relate metabolites variationto PR stages. Moreover, spectroscopic data were integrated with physical parameters likethe 6MWT, fatigue, and dyspnea experienced at each time point to monitor the globalPR effects on patients. For this, we applied OPLS searching for latent variables thatmaximize correlations between NMR and clinical parameters (treated as Y-variables).Each model quality was evaluated by using the goodness-of-fit parameter (R2) and thegoodness-of-prediction parameter (Q2) [23] together with an internal iterative 7-round cross-
Cells 2022, 11, 344 5 of 17
validation and permutation test (800 repeats) and ANalysis Of VAriance testing of Cross-Validated predictive residuals (CV-ANOVA). To quantify the discriminatory metabolites,we selected the bins containing non-overlapping NMR signals, and used OriginPro 9.1software package (OriginLab Corporation, Northampton, MA, USA) for the analysis.Statistical significance for selected metabolites was determined by parametric (ANOVAwith Bonferroni correction) or non-parametric (Mann-Whitney U) tests according to theresults of normality test performed on data to evaluate each distribution (Shapiro-Wilk,Kolgomorov-Smirnov test). p < 0.05 was considered as statistically significant. Finally,by combining clinical test values and selected bin integrals of significant metabolites, acorrelation map with hierarchical clustering was also generated with the R software (www.R-project.org/, accessed on 30 November 2021). The Euclidean distance was consideredfor the metrics, and the centroid method for clustering criterion.
Statistical analysis was performed with Prism 8.4.3 software package (GraphPadSoftware Inc, San Diego, CA, USA). Continuous data were expressed as mean ± standarddeviation. Unpaired t-test was used for comparisons between rehabilitated COPD andcontrols. Paired t-test was used to evaluate differences between COPD before and after PR.
3. Results3.1. Patients
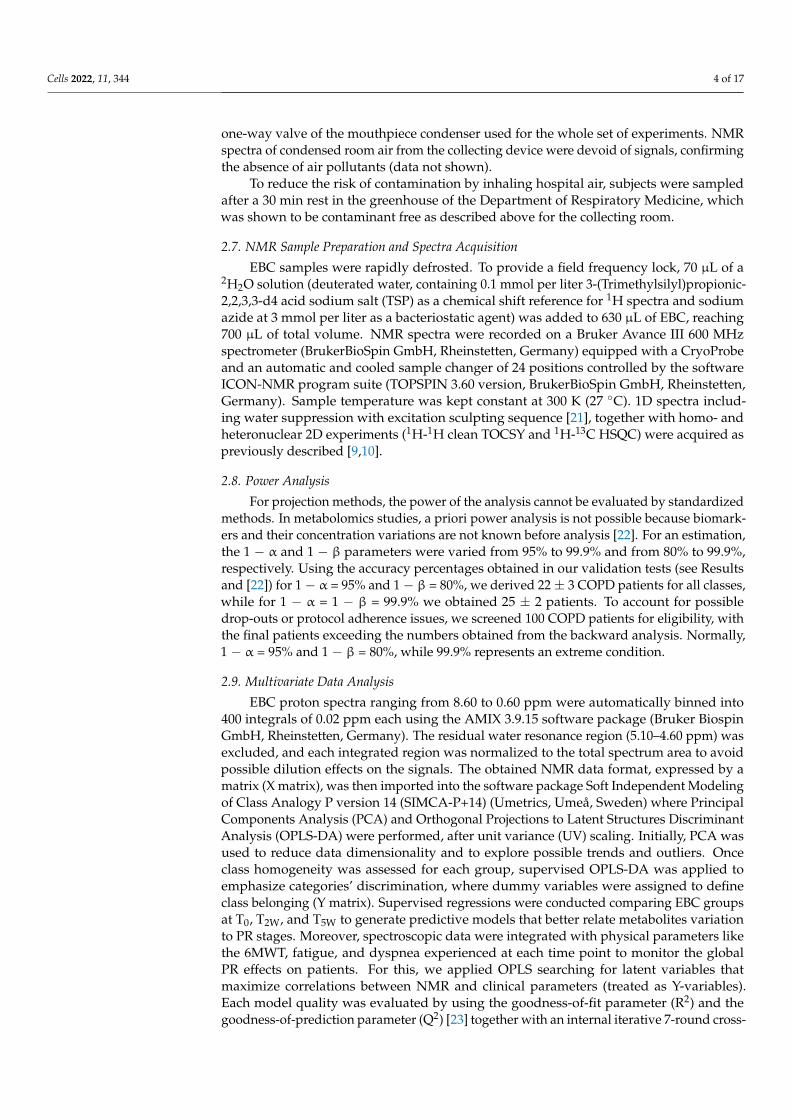
The study design is presented in Figure 1. We screened 100 consecutive COPDpatients for eligibility. Twenty of them were excluded for protocol adherence, 15 because ofexacerbations and/or change in the therapy during the study, while five refused to sign theinformed consent. Ten patients dropped out before completion because of exacerbationand asked for removal of their data. Thus, 50 patients were enrolled: 35 starting a 5-weekPR program, and 15 matched patients not on PR as controls. Except for six samples from T0,4 from T2W, and 4 from T5W, which presented saliva contamination and/or NMR spectraldistortion, the 91 final samples (29 T0, 31 T2W, and 31 T5W) were analyzed. The controlgroup was sampled at T0 and T5W, for a total of 30 samples from all 15 patients. Threeout of 35 cases and 1 out of 15 controls were Group C (high risk, less symptoms), while32 out of 35 patients and 14 out of 15 controls were Group D (high risk, more symptoms)according to the refined ABCD risk assessment tool [15].
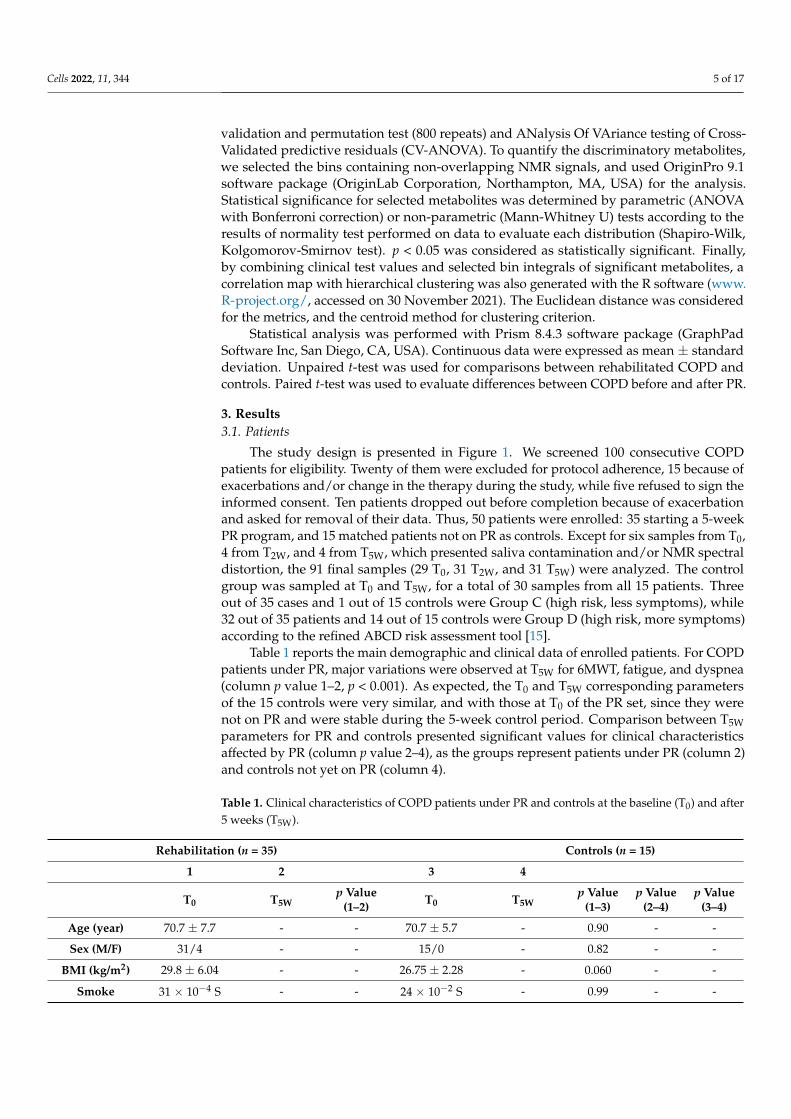
Table 1 reports the main demographic and clinical data of enrolled patients. For COPDpatients under PR, major variations were observed at T5W for 6MWT, fatigue, and dyspnea(column p value 1–2, p < 0.001). As expected, the T0 and T5W corresponding parametersof the 15 controls were very similar, and with those at T0 of the PR set, since they werenot on PR and were stable during the 5-week control period. Comparison between T5Wparameters for PR and controls presented significant values for clinical characteristicsaffected by PR (column p value 2–4), as the groups represent patients under PR (column 2)and controls not yet on PR (column 4).
Table 1. Clinical characteristics of COPD patients under PR and controls at the baseline (T0) and after5 weeks (T5W).
Rehabilitation (n = 35) Controls (n = 15)
1 2 3 4
T0 T5Wp Value
(1–2) T0 T5Wp Value
(1–3)p Value
(2–4)p Value
(3–4)
Age (year) 70.7 ± 7.7 - - 70.7 ± 5.7 - 0.90 - -
Sex (M/F) 31/4 - - 15/0 - 0.82 - -
BMI (kg/m2) 29.8 ± 6.04 - - 26.75 ± 2.28 - 0.060 - -
Smoke 31 × 10−4 S - - 24 × 10−2 S - 0.99 - -
Cells 2022, 11, 344 6 of 17
Table 1. Cont.
Rehabilitation (n = 35) Controls (n = 15)
1 2 3 4
T0 T5Wp Value
(1–2) T0 T5Wp Value
(1–3)p Value
(2–4)p Value
(3–4)
GOLD C (n) 2 - - 1 - 0.99 - -
GOLD D (n) 33 - - 14 - 0.99 - -
FEV1 (L) 1.19 ± 0.40 1.24 ± 0.43 0.29 1.22 ± 0.39 1.21 ± 0.31 0.80 0.81 0.61
FEV1 (%) 48.03 ± 13.66 50.35 ± 15.39 0.21 42.27 ± 8.63 42.17 ± 7.53 0.12 0.056 0.63
FVC (L) 2.59 ± 0.72 2.50 ± 0.80 0.56 2.48 ± 0.52 2.47 ± 0.45 0.56 0.030 0.82
FVC (%) 80.57 ± 16.14 78.44 ± 20.51 0.37 68.67 ± 11.24 69.17 ± 10.24 0.010 0.073 0.52
FEV1/FVC 47.4 ± 15.45 50.68 ± 13. 96 0.01 47.40 ± 10.26 47.55 ± 10.19 0.99 0.44 0.66
FEF25-75 (L/s) 1.99 ± 1.68 2.14 ± 1.6 0.04 1.08 ± 0.52 1.18 ± 0.51 0.040 0.028 0.21
SaO2 (%) 92.51 ± 5.06 93.42 ± 5.12 0.03 91.52 ± 5.41 92.12 ± 5.01 0.80 0.41 0.45
6MWT (m) 191.11 ± 50.26 298.54 ± 66.74 <0.001 211.23 ± 48.36 210.24 ± 55.71 0.31 <0.0001 0.62
Fatigue 8.31 ± 2.23 2.71 ± 2.08 <0.001 7.81 ± 2.13 7.73 ± 2.18 0.52 <0.0001 0.34
Dyspnea 9.06 ± 1.61 2.86 ± 1.97 <0.001 8.76 ± 1.82 8.73 ± 1.57 0.36 <0.0001 0.71
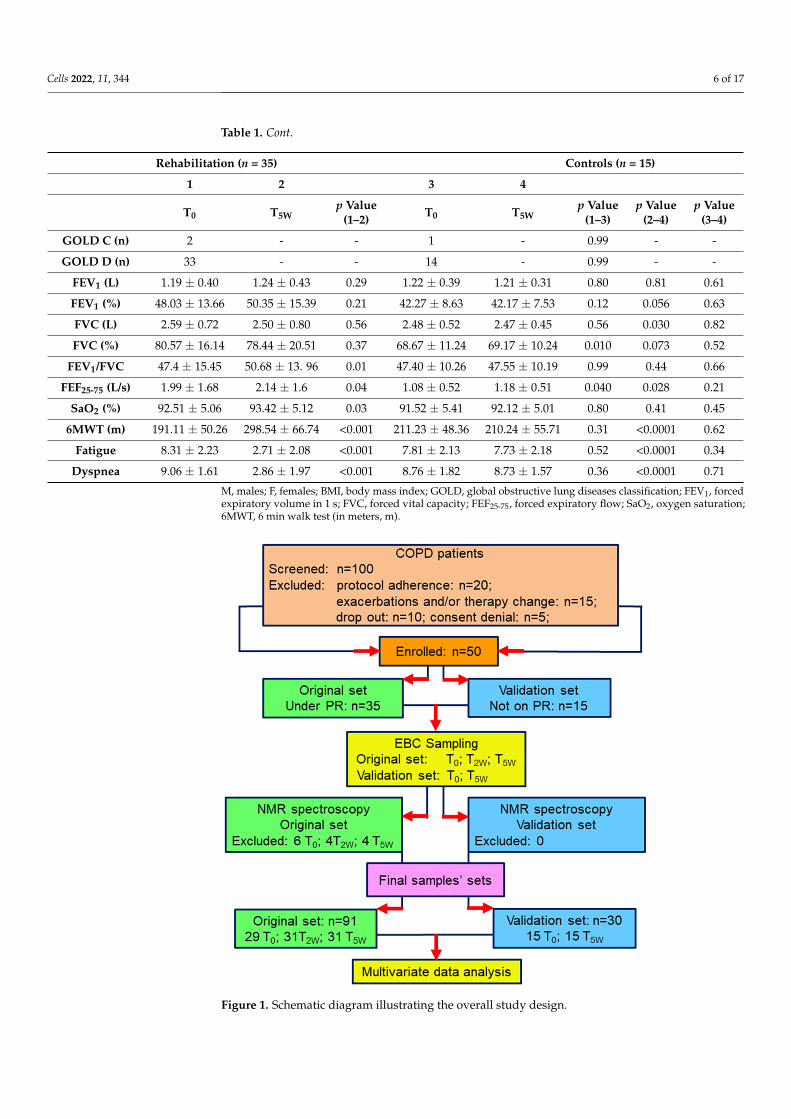
M, males; F, females; BMI, body mass index; GOLD, global obstructive lung diseases classification; FEV1, forcedexpiratory volume in 1 s; FVC, forced vital capacity; FEF25-75, forced expiratory flow; SaO2, oxygen saturation;6MWT, 6 min walk test (in meters, m).
Cells 2022, 11, x FOR PEER REVIEW 6 of 17
Figure 1. Schematic diagram illustrating the overall study design.
Table 1 reports the main demographic and clinical data of enrolled patients. For COPD patients under PR, major variations were observed at T5W for 6MWT, fatigue, and dyspnea (column p value 1–2, p < 0.001). As expected, the T0 and T5W corresponding parameters of the 15 controls were very similar, and with those at T0 of the PR set, since they were not on PR and were stable during the 5-week control period. Comparison between T5W parameters for PR and controls presented significant values for clinical characteristics affected by PR (column p value 2–4), as the groups represent patients under PR (column 2) and controls not yet on PR (column 4).
Table 1. Clinical characteristics of COPD patients under PR and controls at the baseline (T0) and after 5 weeks (T5W).
Rehabilitation (n = 35) Controls (n = 15) 1 2 3 4
T0 T5W p Value (1–2) T0 T5W p Value
(1–3) p Value
(2–4) p Value
(3–4) Age (yr) 70.7 ± 7.7 - - 70.7 ± 5.7 - 0.90 - -
Sex (M/F) 31/4 - - 15/0 - 0.82 - - BMI (kg/m2) 29.8 ± 6.04 - - 26.75 ± 2.28 - 0.060 - -
Smoke 31 × 10−4 S - - 24 × 10−2 S - 0.99 - - GOLD C (n) 2 - - 1 - 0.99 - - GOLD D (n) 33 - - 14 - 0.99 - -
FEV1 (L) 1.19 ± 0.40 1.24 ± 0.43 0.29 1.22 ± 0.39 1.21 ± 0.31 0.80 0.81 0.61 FEV1 (%) 48.03 ± 13.66 50.35 ± 15.39 0.21 42.27 ± 8.63 42.17 ± 7.53 0.12 0.056 0.63
Figure 1. Schematic diagram illustrating the overall study design.
Cells 2022, 11, 344 7 of 17
3.2. NMR Profiling of EBC
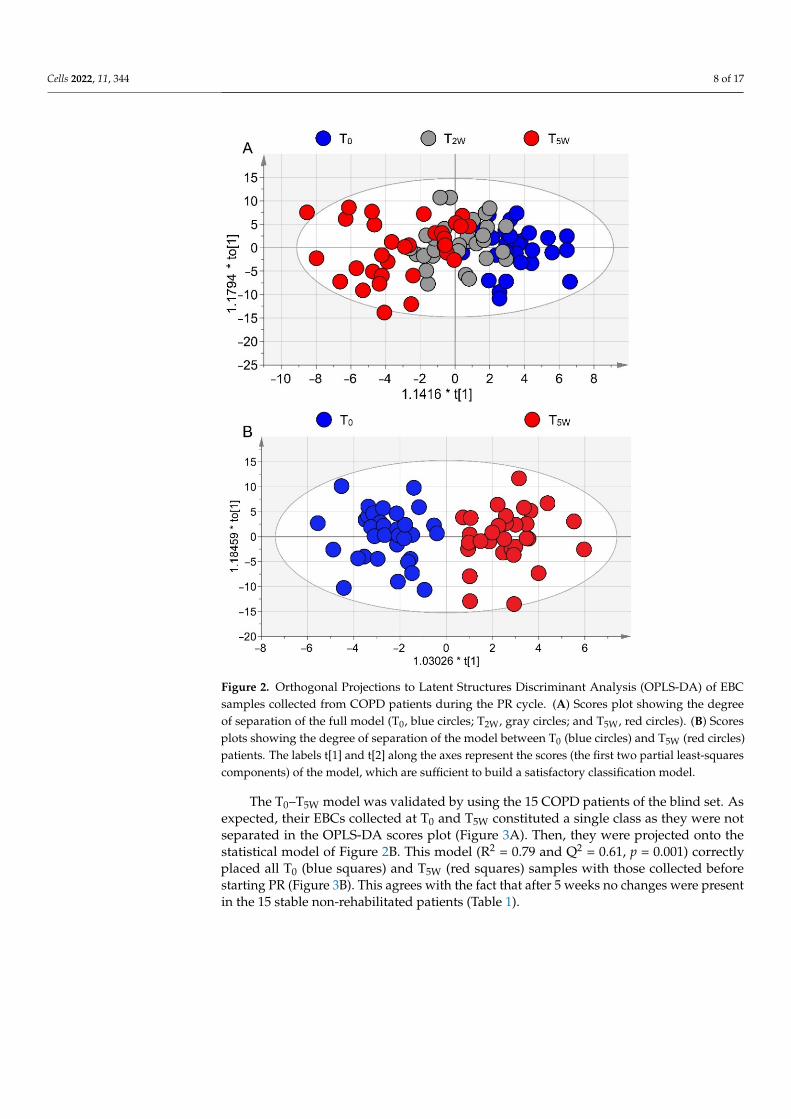
EBC samples from patients under PR collected at T0, T2W, and T5W were profiled viaNMR-based metabolomics. After spectra acquisition, we applied unsupervised PCA (i.e.,no prior knowledge is used in the calculations) to exclude class inhomogeneity and outliers.Supervised OPLS-DA of the three classes yielded the model (R2 = 0.69, Q2 = 0.49, and CV-ANOVA p = 0.010) depicted in the scores plot of Figure 2A. It shows a clear class evolutionalong t[1], with T0 (blue circles) and T5W (red circles) well separated, but T2W samples(gray circles) are equally distributed around the origin of the predictive component, witha partial overlap with the T0 group at positive t[1] and with the T5W samples at negativet[1]. Such graphical overlap originates from “molecular overlap” that reflects similarpathophysiological states [24].
This suggests that PR does not progress linearly and homogeneously for all patients,and that its dynamics follow a variable induction period typical for each patient. Indeed, asshown in the misclassification Table 2 (Fisher’s p = 6.7 × 10⁻⁷), only 29.03% of T2W samplesresulted correctly classified (9/31), while the remaining 70.97% were partly categorized inT0 (12/31) and in T5W (10/31) classes.
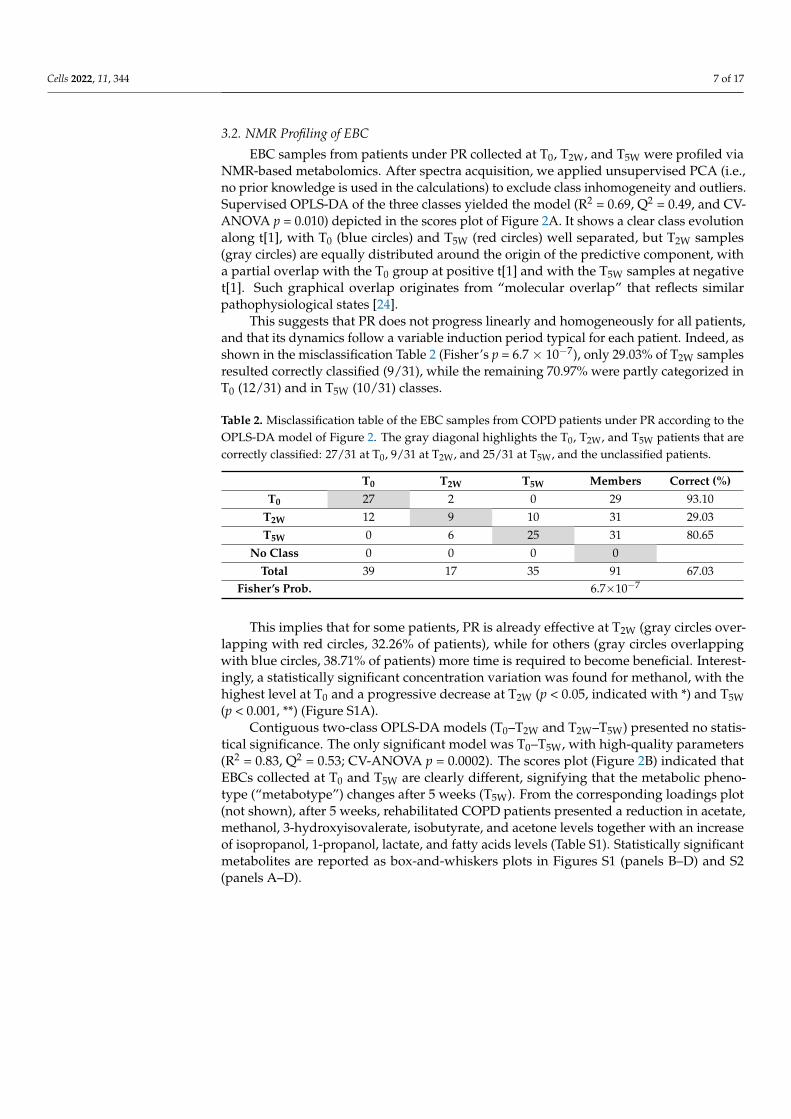
Table 2. Misclassification table of the EBC samples from COPD patients under PR according to theOPLS-DA model of Figure 2. The gray diagonal highlights the T0, T2W, and T5W patients that arecorrectly classified: 27/31 at T0, 9/31 at T2W, and 25/31 at T5W, and the unclassified patients.
T0 T2W T5W Members Correct (%)T0 27 2 0 29 93.10
T2W 12 9 10 31 29.03T5W 0 6 25 31 80.65
No Class 0 0 0 0Total 39 17 35 91 67.03
Fisher’s Prob. 6.7×10⁻⁷
This implies that for some patients, PR is already effective at T2W (gray circles over-lapping with red circles, 32.26% of patients), while for others (gray circles overlappingwith blue circles, 38.71% of patients) more time is required to become beneficial. Interest-ingly, a statistically significant concentration variation was found for methanol, with thehighest level at T0 and a progressive decrease at T2W (p < 0.05, indicated with *) and T5W(p < 0.001, **) (Figure S1A).
Contiguous two-class OPLS-DA models (T0–T2W and T2W–T5W) presented no statis-tical significance. The only significant model was T0–T5W, with high-quality parameters(R2 = 0.83, Q2 = 0.53; CV-ANOVA p = 0.0002). The scores plot (Figure 2B) indicated thatEBCs collected at T0 and T5W are clearly different, signifying that the metabolic pheno-type (“metabotype”) changes after 5 weeks (T5W). From the corresponding loadings plot(not shown), after 5 weeks, rehabilitated COPD patients presented a reduction in acetate,methanol, 3-hydroxyisovalerate, isobutyrate, and acetone levels together with an increaseof isopropanol, 1-propanol, lactate, and fatty acids levels (Table S1). Statistically significantmetabolites are reported as box-and-whiskers plots in Figures S1 (panels B–D) and S2(panels A–D).
Cells 2022, 11, 344 8 of 17Cells 2022, 11, x FOR PEER REVIEW 8 of 17
Figure 2. Orthogonal Projections to Latent Structures Discriminant Analysis (OPLS-DA) of EBC samples collected from COPD patients during the PR cycle. (A) Scores plot showing the degree of separation of the full model (T0, blue circles; T2W, gray circles; and T5W, red circles). (B) Scores plots showing the degree of separation of the model between T0 (blue circles) and T5W (red circles) patients. The labels t[1] and t[2] along the axes represent the scores (the first two partial least-squares components) of the model, which are sufficient to build a satisfactory classification model.
Contiguous two-class OPLS-DA models (T0–T2W and T2W–T5W) presented no statistical significance. The only significant model was T0–T5W, with high-quality parameters (R2 = 0.83, Q2 = 0.53; CV-ANOVA p = 0.0002). The scores plot (Figure 2B) indicated that EBCs collected at T0 and T5W are clearly different, signifying that the metabolic phenotype (“metabotype”) changes after 5 weeks (T5W). From the corresponding loadings plot (not shown), after 5 weeks, rehabilitated COPD patients presented a reduction in acetate, methanol, 3-hydroxyisovalerate, isobutyrate, and acetone levels together with an increase of isopropanol, 1-propanol, lactate, and fatty acids levels (Table S1). Statistically significant metabolites are reported as box-and-whiskers plots in Figures S1 (panels B–D) and S2 (panels A–D).
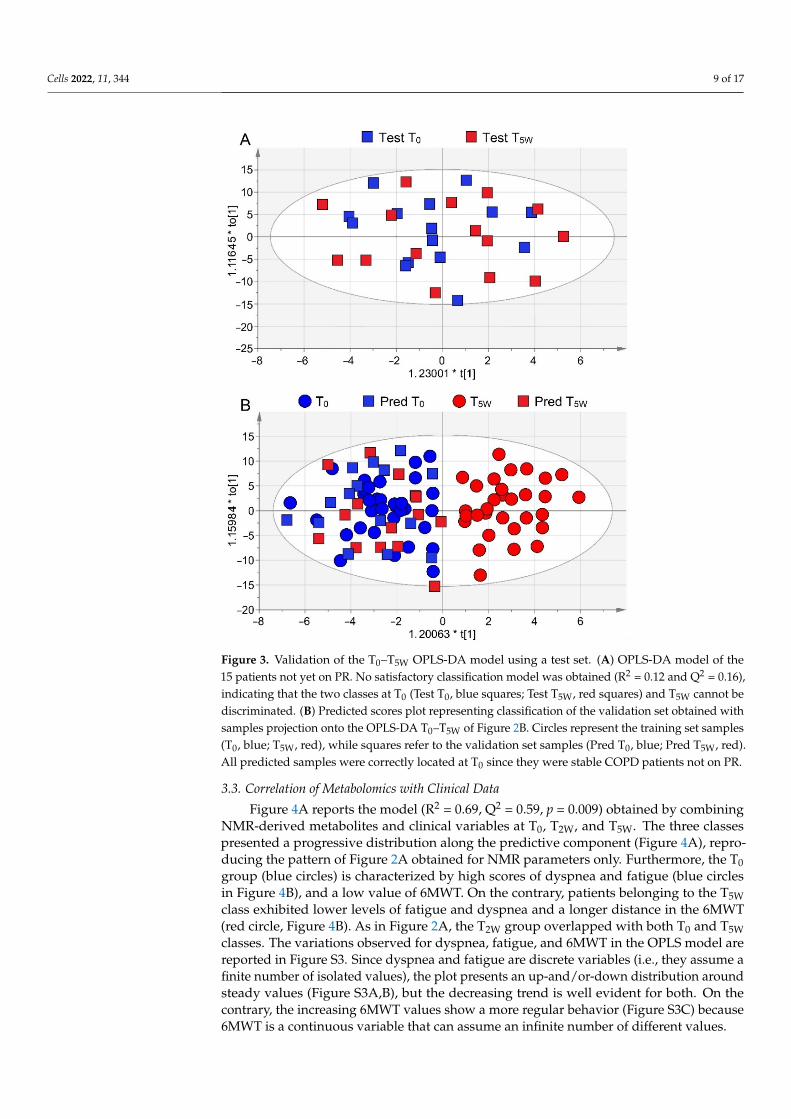
The T0–T5W model was validated by using the 15 COPD patients of the blind set. As expected, their EBCs collected at T0 and T5W constituted a single class as they were not separated in the OPLS-DA scores plot (Figure 3A). Then, they were projected onto the statistical model of Figure 2B. This model (R2 = 0.79 and Q2 = 0.61, p = 0.001) correctly placed all T0 (blue squares) and T5W (red squares) samples with those collected before starting PR (Figure 3B). This agrees with the fact that after 5 weeks no changes were present in the 15 stable non-rehabilitated patients (Table 1).
Figure 2. Orthogonal Projections to Latent Structures Discriminant Analysis (OPLS-DA) of EBCsamples collected from COPD patients during the PR cycle. (A) Scores plot showing the degreeof separation of the full model (T0, blue circles; T2W, gray circles; and T5W, red circles). (B) Scoresplots showing the degree of separation of the model between T0 (blue circles) and T5W (red circles)patients. The labels t[1] and t[2] along the axes represent the scores (the first two partial least-squarescomponents) of the model, which are sufficient to build a satisfactory classification model.
The T0–T5W model was validated by using the 15 COPD patients of the blind set. Asexpected, their EBCs collected at T0 and T5W constituted a single class as they were notseparated in the OPLS-DA scores plot (Figure 3A). Then, they were projected onto thestatistical model of Figure 2B. This model (R2 = 0.79 and Q2 = 0.61, p = 0.001) correctlyplaced all T0 (blue squares) and T5W (red squares) samples with those collected beforestarting PR (Figure 3B). This agrees with the fact that after 5 weeks no changes were presentin the 15 stable non-rehabilitated patients (Table 1).
Cells 2022, 11, 344 9 of 17Cells 2022, 11, x FOR PEER REVIEW 9 of 17
Figure 3. Validation of the T0–T5W OPLS-DA model using a test set. (A) OPLS-DA model of the 15 patients not yet on PR. No satisfactory classification model was obtained (R2 = 0.12 and Q2 = 0.16), indicating that the two classes at T0 (Test T0, blue squares; Test T5W, red squares) and T5W cannot be discriminated. (B) Predicted scores plot representing classification of the validation set obtained with samples projection onto the OPLS-DA T0–T5W of Figure 2B. Circles represent the training set samples (T0, blue; T5W, red), while squares refer to the validation set samples (Pred T0, blue; Pred T5W, red). All predicted samples were correctly located at T0 since they were stable COPD patients not on PR.
3.3. Correlation of Metabolomics with Clinical Data Figure 4A reports the model (R2 = 0.69, Q2 = 0.59, p = 0.009) obtained by combining
NMR-derived metabolites and clinical variables at T0, T2W, and T5W. The three classes presented a progressive distribution along the predictive component (Figure 4A), reproducing the pattern of Figure 2A obtained for NMR parameters only. Furthermore, the T0 group (blue circles) is characterized by high scores of dyspnea and fatigue (blue circles in Figure 4B), and a low value of 6MWT. On the contrary, patients belonging to the T5W class exhibited lower levels of fatigue and dyspnea and a longer distance in the 6MWT (red circle, Figure 4B). As in Figure 2A, the T2W group overlapped with both T0 and T5W classes. The variations observed for dyspnea, fatigue, and 6MWT in the OPLS model are reported in Figure S3. Since dyspnea and fatigue are discrete variables (i.e., they assume a finite number of isolated values), the plot presents an up-and/or-down distribution around steady values (Figure S3A,B), but the decreasing trend is well evident for both. On the contrary, the increasing 6MWT values show a more regular behavior (Figure S3C)
Figure 3. Validation of the T0–T5W OPLS-DA model using a test set. (A) OPLS-DA model of the15 patients not yet on PR. No satisfactory classification model was obtained (R2 = 0.12 and Q2 = 0.16),indicating that the two classes at T0 (Test T0, blue squares; Test T5W, red squares) and T5W cannot bediscriminated. (B) Predicted scores plot representing classification of the validation set obtained withsamples projection onto the OPLS-DA T0–T5W of Figure 2B. Circles represent the training set samples(T0, blue; T5W, red), while squares refer to the validation set samples (Pred T0, blue; Pred T5W, red).All predicted samples were correctly located at T0 since they were stable COPD patients not on PR.
3.3. Correlation of Metabolomics with Clinical Data
Figure 4A reports the model (R2 = 0.69, Q2 = 0.59, p = 0.009) obtained by combiningNMR-derived metabolites and clinical variables at T0, T2W, and T5W. The three classespresented a progressive distribution along the predictive component (Figure 4A), repro-ducing the pattern of Figure 2A obtained for NMR parameters only. Furthermore, the T0group (blue circles) is characterized by high scores of dyspnea and fatigue (blue circlesin Figure 4B), and a low value of 6MWT. On the contrary, patients belonging to the T5Wclass exhibited lower levels of fatigue and dyspnea and a longer distance in the 6MWT(red circle, Figure 4B). As in Figure 2A, the T2W group overlapped with both T0 and T5Wclasses. The variations observed for dyspnea, fatigue, and 6MWT in the OPLS model arereported in Figure S3. Since dyspnea and fatigue are discrete variables (i.e., they assume afinite number of isolated values), the plot presents an up-and/or-down distribution aroundsteady values (Figure S3A,B), but the decreasing trend is well evident for both. On thecontrary, the increasing 6MWT values show a more regular behavior (Figure S3C) because6MWT is a continuous variable that can assume an infinite number of different values.
Cells 2022, 11, 344 10 of 17
Cells 2022, 11, x FOR PEER REVIEW 10 of 17
because 6MWT is a continuous variable that can assume an infinite number of different values.
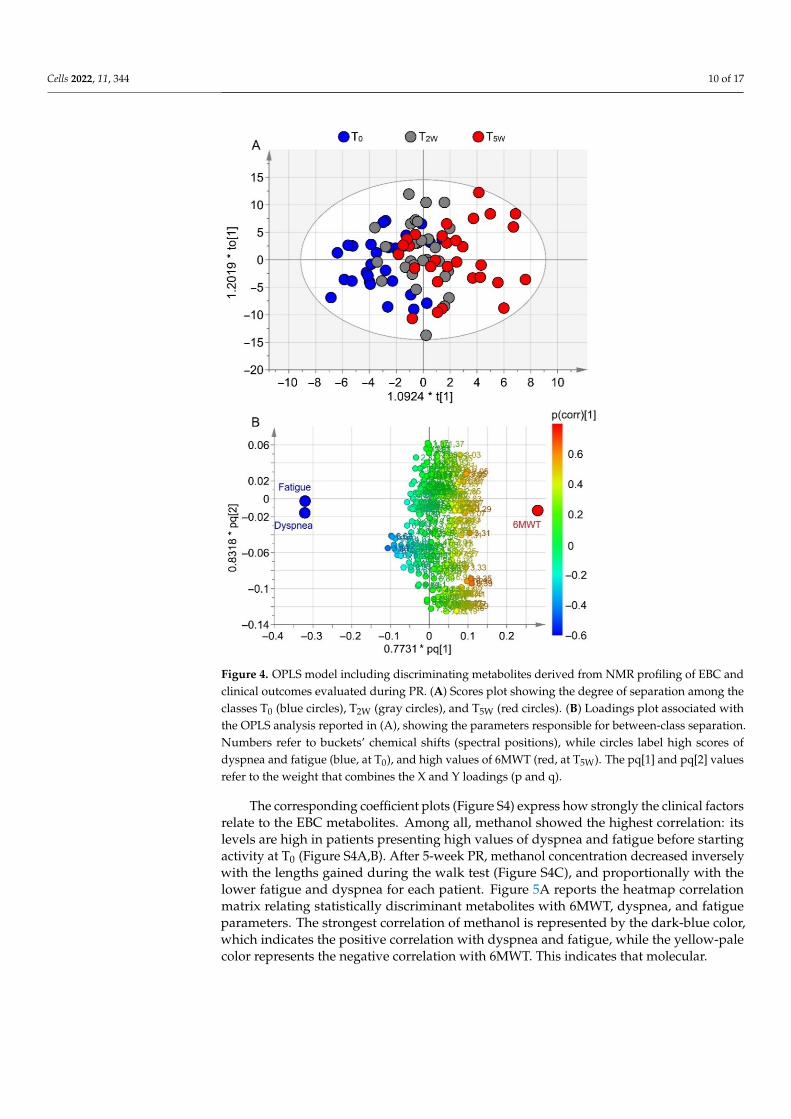
Figure 4. OPLS model including discriminating metabolites derived from NMR profiling of EBC and clinical outcomes evaluated during PR. (A) Scores plot showing the degree of separation among the classes T0 (blue circles), T2W (gray circles), and T5W (red circles). (B) Loadings plot associated with the OPLS analysis reported in (A), showing the parameters responsible for between-class separa-tion. Numbers refer to buckets’ chemical shifts (spectral positions), while circles label high scores of dyspnea and fatigue (blue, at T0), and high values of 6MWT (red, at T5W). The pq[1] and pq[2] values refer to the weight that combines the X and Y loadings (p and q).
The corresponding coefficient plots (Figure S4) express how strongly the clinical fac-tors relate to the EBC metabolites. Among all, methanol showed the highest correlation: its levels are high in patients presenting high values of dyspnea and fatigue before starting activity at T0 (Figure S4A,B). After 5-week PR, methanol concentration decreased in-versely with the lengths gained during the walk test (Figure S4C), and proportionally with the lower fatigue and dyspnea for each patient. Figure 5A reports the heatmap correlation matrix relating statistically discriminant metabolites with 6MWT, dyspnea, and fatigue parameters. The strongest correlation of methanol is represented by the dark-blue color, which indicates the positive correlation with dyspnea and fatigue, while the yellow-pale color represents the negative correlation with 6MWT. This indicates that molecular
Figure 4. OPLS model including discriminating metabolites derived from NMR profiling of EBC andclinical outcomes evaluated during PR. (A) Scores plot showing the degree of separation among theclasses T0 (blue circles), T2W (gray circles), and T5W (red circles). (B) Loadings plot associated withthe OPLS analysis reported in (A), showing the parameters responsible for between-class separation.Numbers refer to buckets’ chemical shifts (spectral positions), while circles label high scores ofdyspnea and fatigue (blue, at T0), and high values of 6MWT (red, at T5W). The pq[1] and pq[2] valuesrefer to the weight that combines the X and Y loadings (p and q).
The corresponding coefficient plots (Figure S4) express how strongly the clinical factorsrelate to the EBC metabolites. Among all, methanol showed the highest correlation: itslevels are high in patients presenting high values of dyspnea and fatigue before startingactivity at T0 (Figure S4A,B). After 5-week PR, methanol concentration decreased inverselywith the lengths gained during the walk test (Figure S4C), and proportionally with thelower fatigue and dyspnea for each patient. Figure 5A reports the heatmap correlationmatrix relating statistically discriminant metabolites with 6MWT, dyspnea, and fatigueparameters. The strongest correlation of methanol is represented by the dark-blue color,which indicates the positive correlation with dyspnea and fatigue, while the yellow-palecolor represents the negative correlation with 6MWT. This indicates that molecular.
Cells 2022, 11, 344 11 of 17
Cells 2022, 11, x FOR PEER REVIEW 11 of 17
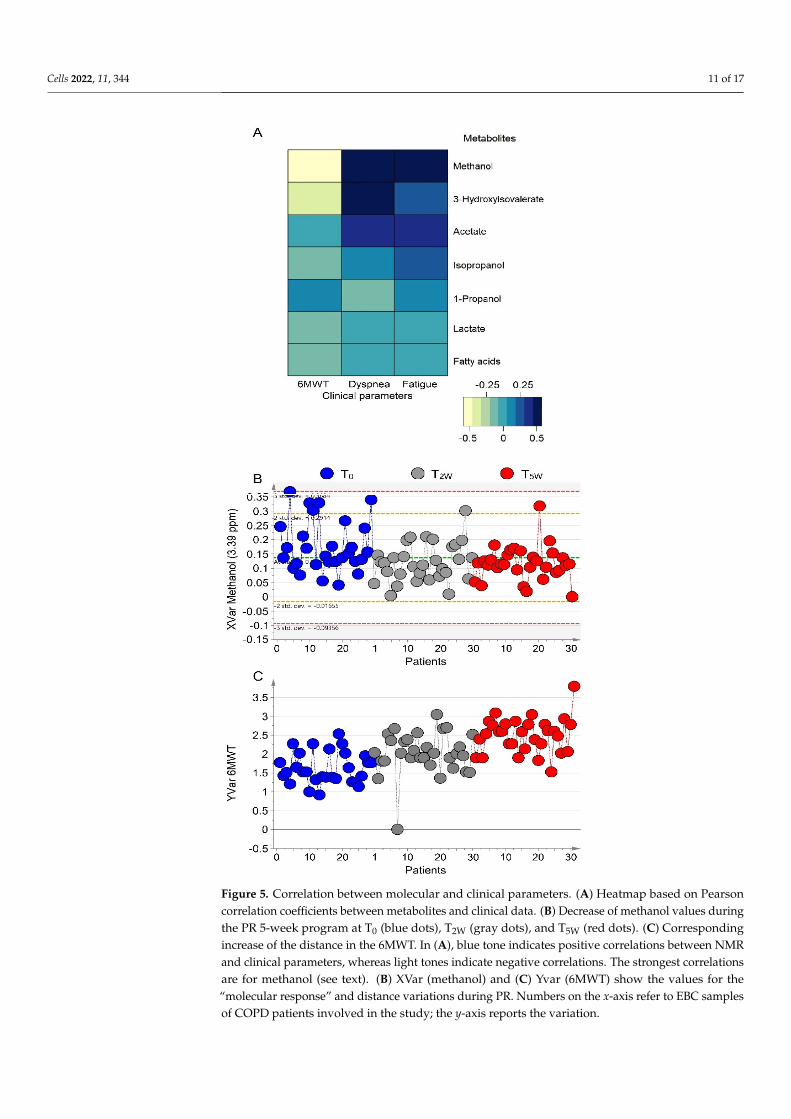
Figure 5. Correlation between molecular and clinical parameters. (A) Heatmap based on Pearson correlation coefficients between metabolites and clinical data. (B) Decrease of methanol values dur-ing the PR 5-week program at T0 (blue dots), T2W (gray dots), and T5W (red dots). (C) Corresponding increase of the distance in the 6MWT. In (A), blue tone indicates positive correlations between NMR and clinical parameters, whereas light tones indicate negative correlations. The strongest correla-tions are for methanol (see text). (B) XVar (methanol) and (C) Yvar (6MWT) show the values for the “molecular response” and distance variations during PR. Numbers on the x-axis refer to EBC sam-ples of COPD patients involved in the study; the y-axis reports the variation.
Figure 5. Correlation between molecular and clinical parameters. (A) Heatmap based on Pearsoncorrelation coefficients between metabolites and clinical data. (B) Decrease of methanol values duringthe PR 5-week program at T0 (blue dots), T2W (gray dots), and T5W (red dots). (C) Correspondingincrease of the distance in the 6MWT. In (A), blue tone indicates positive correlations between NMRand clinical parameters, whereas light tones indicate negative correlations. The strongest correlationsare for methanol (see text). (B) XVar (methanol) and (C) Yvar (6MWT) show the values for the“molecular response” and distance variations during PR. Numbers on the x-axis refer to EBC samplesof COPD patients involved in the study; the y-axis reports the variation.
Cells 2022, 11, 344 12 of 17
And clinical parameters are strictly related, as illustrated in Figure 5B,C, which depictthe lowering concentration of methanol (panel 5B), and the “physical outcome”, expressedby the increase of the distance in 6MWT (panel 5C). Such a relationship strongly suggeststhat methanol can become a useful biomarker to monitor PR outcomes.
3.4. Metabolomics and Walk-Distance Paths
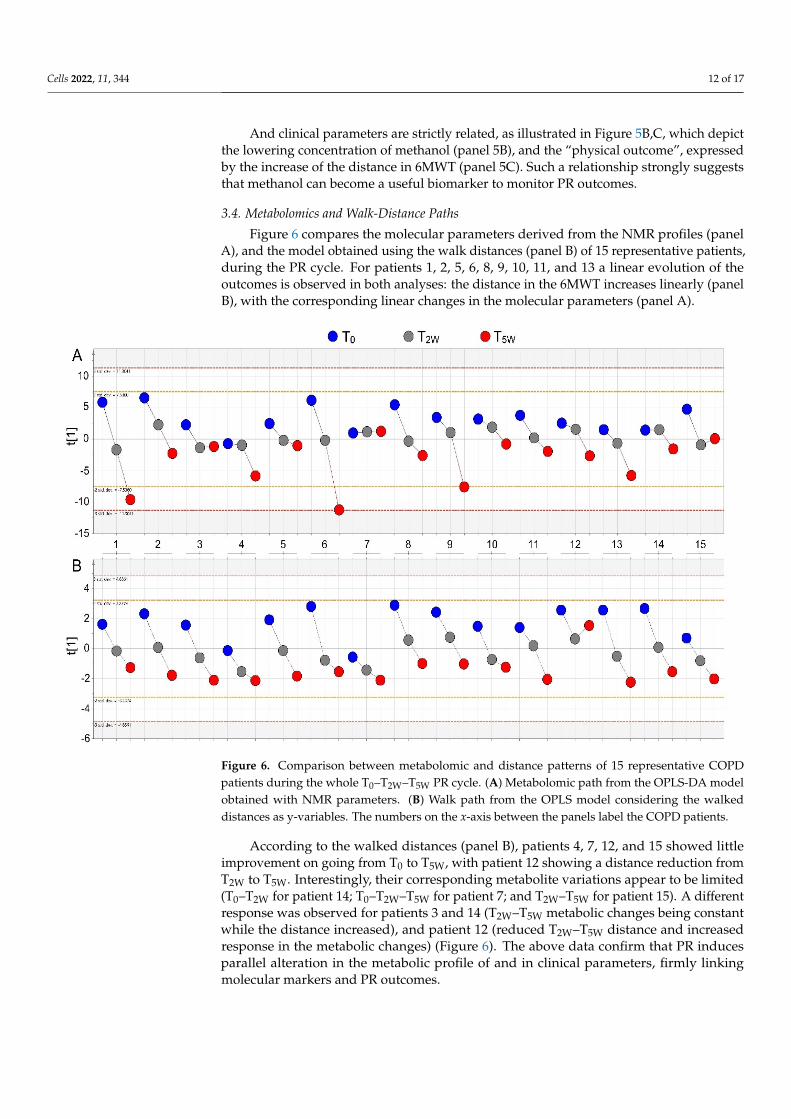
Figure 6 compares the molecular parameters derived from the NMR profiles (panelA), and the model obtained using the walk distances (panel B) of 15 representative patients,during the PR cycle. For patients 1, 2, 5, 6, 8, 9, 10, 11, and 13 a linear evolution of theoutcomes is observed in both analyses: the distance in the 6MWT increases linearly (panelB), with the corresponding linear changes in the molecular parameters (panel A).
Cells 2022, 11, x FOR PEER REVIEW 12 of 17
And clinical parameters are strictly related, as illustrated in Figures 5B and 5C, which depict the lowering concentration of methanol (panel 5B), and the “physical outcome”, expressed by the increase of the distance in 6MWT (panel 5C). Such a relationship strongly suggests that methanol can become a useful biomarker to monitor PR outcomes.
3.4. Metabolomics and Walk-Distance Paths Figure 6 compares the molecular parameters derived from the NMR profiles (panel
A), and the model obtained using the walk distances (panel B) of 15 representative pa-tients, during the PR cycle. For patients 1, 2, 5, 6, 8, 9, 10, 11, and 13 a linear evolution of the outcomes is observed in both analyses: the distance in the 6MWT increases linearly (panel B), with the corresponding linear changes in the molecular parameters (panel A).
Figure 6. Comparison between metabolomic and distance patterns of 15 representative COPD pa-tients during the whole T0–T2W–T5W PR cycle. (A) Metabolomic path from the OPLS-DA model ob-tained with NMR parameters. (B) Walk path from the OPLS model considering the walked distances as y-variables. The numbers on the x-axis between the panels label the COPD patients.
According to the walked distances (panel B), patients 4, 7, 12, and 15 showed little improvement on going from T0 to T5W, with patient 12 showing a distance reduction from T2W to T5W. Interestingly, their corresponding metabolite variations appear to be limited (T0–T2W for patient 14; T0–T2W–T5W for patient 7; and T2W–T5W for patient 15). A different response was observed for patients 3 and 14 (T2W–T5W metabolic changes being constant while the distance increased), and patient 12 (reduced T2W–T5W distance and increased re-sponse in the metabolic changes) (Figure 6). The above data confirm that PR induces par-allel alteration in the metabolic profile of and in clinical parameters, firmly linking molec-ular markers and PR outcomes.
Figure 6. Comparison between metabolomic and distance patterns of 15 representative COPDpatients during the whole T0–T2W–T5W PR cycle. (A) Metabolomic path from the OPLS-DA modelobtained with NMR parameters. (B) Walk path from the OPLS model considering the walkeddistances as y-variables. The numbers on the x-axis between the panels label the COPD patients.
According to the walked distances (panel B), patients 4, 7, 12, and 15 showed littleimprovement on going from T0 to T5W, with patient 12 showing a distance reduction fromT2W to T5W. Interestingly, their corresponding metabolite variations appear to be limited(T0–T2W for patient 14; T0–T2W–T5W for patient 7; and T2W–T5W for patient 15). A differentresponse was observed for patients 3 and 14 (T2W–T5W metabolic changes being constantwhile the distance increased), and patient 12 (reduced T2W–T5W distance and increasedresponse in the metabolic changes) (Figure 6). The above data confirm that PR inducesparallel alteration in the metabolic profile of and in clinical parameters, firmly linkingmolecular markers and PR outcomes.
Cells 2022, 11, 344 13 of 17
4. Discussion
Our data indicate that the COPD metabotype evolves during PR. In particular, clearchanges in dyspnea, fatigue, and 6MWT alter the metabotype during in-hospital PR. Amongthe metabolites, methanol decline in EBC well correlated with reduction of dyspnea andfatigue and increase of walk distance in the 6MWT, becoming a potential biomarker ofCOPD rehabilitation. Such a finding is of importance because methanol can become a toolto verify the effectiveness of PR in COPD patients. This is expected to remove the biasstemming from personal evaluation of the outcomes. In particular, patients will not berequired to rate the evolution of the symptoms during PR or transform the severity ofdyspnea and muscle fatigue into a numerical value. Possibly, a direct measurement of EBCmethanol could indicate the adherence of a COPD patient to a specific PR program, and itsassessment could eliminate all possible variables (personal response to a protocol, personalapplication, motivation, etc.). We are currently working on a methanol-based sensor fora portable instrument to be used in PR. Comparison between metabolic data and clinicalparameters (Figure 6) suggests that PR and metabolic variations fuel each other, withpositive clinical outcomes “requiring” a downgrading of metabolites worsening COPD.
Methanol occurs naturally in humans. It derives from the intestinal flora, fruit, veg-etable, or alcoholic beverage consumption. Another endogenous source of methanol isvia protein carboxymethylation (i.e., the methylation of amino acid COOH groups) thatis catalyzed by methyltransferases or methyl esterase, which produces methanol (for adetailed review see [25]). The main way of elimination of methanol is oxidation. In humans,the oxidation of methanol (and ethanol) requires several stages of conversion; the mostimportant one involves alcohol dehydrogenase (ADH) 1b, which catalyzes up to 90% ofmethanol (and ethanol) oxidation in the liver. Methanol is oxidized to formaldehyde, andformaldehyde to formic acid, which can either be excreted in the urine, or further oxidizedto carbon dioxide. Formaldehyde, the main oxidation product of methanol, exacerbatesairways inflammation in A549 alveolar and BEAS-2B bronchial cell lines [26], and in maleWistar rats [27]. In COPD, methanol levels increased with respect to asthma, with consider-ably reduced levels of formate [28], which is known to exert a protective role on lung cancercell lines. The exhaled breath concentration of methanol is amplified in lung cancer, andCOPD is characterized by an increased risk of lung carcinoma [29]. Therefore, methanoldecline during PR might be related to an endogenous (direct or indirect) mechanism acti-vated by PR to reduce pulmonary inflammation. As a consequence, the patients manifestan evident reduction of dyspnea and fatigue paralleled by an increased walk distance.This is in line with the observed improvements in skeletal muscle function and exercisecapacity in COPD patients under PR [30], although no reduction of mediators of systemicinflammation was observed in urine. Most likely, “average” biological matrices like serumand urine reflect systemic rather respiratory inflammation [31], while the bronchoalveolarlavage (BAL) fluid and EBC appear to be a possible representation of lung metabolism withrespect to plasma and urine [32,33].
This is the first report demonstrating that NMR metabolic profiling of EBC can be usedto follow the PR outcomes of COPD patients, and that such profiling may be considereda fingerprinting of PR. Furthermore, the dynamical changes of EBC metabotype can berapidly identified, and methanol is a potential biomarker of PR.
COPD is characterized by different phenotypes and clinical presentations [5]. There-fore, the principle “one size fits all” in PR [4] does not always yield the expected clinicaloutcomes as some individuals respond excellently, others discreetly, or do not respondat all [34–36]. Disease severity, the presence of comorbidities, motivation, as well as thenumber of sessions per week, the intensity and length of the treatment all affect the out-comes. Different time may be required by each patient, and failure to respond to a protocolindicates that it is not suitable for the patient while a different protocol could give the ex-pected response. As stated [4], biomarkers should be one of the “future research directions”in PR: “Development of valid behavioral and physiological biomarkers that identify thesuitability of a patient for a particular type of PR model. What factors determine which
Cells 2022, 11, 344 14 of 17
model best suits which type of patient? More evidence is urgently needed to help healthprofessionals and patients make informed decisions on the basis of patient characteristics.This aligns with the emergence of personalized medicine”. Such a personalized strategywould favor the “right” delivery model and time for each patient and eliminate any bias inthe evaluation of outcomes.
Our study, however, presents some limitations. First, although the number of patientsexceeds that suggested by backward analysis, the sample size was relatively small. How-ever, several measures were taken for quality control of the data. For EBC collection weminimized the external influence and contamination, all patients were well characterizedaccording to current international guidelines, and differences among demographic param-eters were all carefully minimized. A potential strength of our study was the presenceof a validation cohort, since the external validation is the only discriminatory evidencethat a calculated model can be clinically valuable, regardless of the reported predictiveindices. For external validation, we decided to use a COPD cohort not yet on PR because adifferent group of PR patients could have introduced a bias related to different willingnessto accomplish the cycle.
Second, since the patients involved were recruited through the hospital’s PulmonaryRehabilitation Division, our selection adhered to the PR protocol, which excludes patientswith severe comorbidities. Therefore, our metabolomics analysis awaits validation inpatients with different degrees of comorbidity.
Third, lack of randomization between PR and control groups could also be considered alimitation. However, randomization in PR “violates the principle of clinical equipoise” [37];therefore, it is not ethical because patients are either in or out of the PR program, and whenstarted, each patient has to finish the cycle. We could have established a different PR regimefor selected patients, but, again, this is ethically controversial [37].
Notwithstanding the above limitations, we were able to recognize specific differencesin the metabolomic patterns of COPD along the PR cycle. Furthermore, a clear correlationwas found between the metabolic response of patients and the clinical outcomes, being thereduction of methanol related to the reduction of dyspnea and fatigue, and the increasedwalk distance. As such, EBC methanol concentration could become a molecular toolto measure the PR effectiveness avoiding all possible bias related to personal feeling ofthe patients. A step forward would be the identification of the molecular threshold ofmethanol that typifies the metabotype changes during COPD rehabilitation. However,since the molecular evolution between contiguous pathophysiological states is not “linear”because of the presence of overlapping “molecular zones”, an increased population ofpatients should be studied. In addition, a longer PR period should be considered and,because the beneficial effects of rehabilitation treatment tend to fade over time [38], acontrol on the persistence of the effects would be needed. Unfortunately, the regionaladmittance regulation indicates a maximum of 5-week hospitalization for PR, and amongthe patients continuing physical rehabilitating activity personally, a very low number wasconsidered trustworthy.
All considered, the reported results provide sufficient evidence on the applicationof metabolomics to PR, opening new routes for metabolomics-guided management ofrehabilitation. Furthermore, correlation of molecular data with clinical parameters suggeststhat even a single biofluid from the lung compartment can generate a reasonable under-standing of a complex system, which is totally described by the clinical parameters. Wealso showed that COPD patients undergoing PR present changing phenotype at differenttime of the treatment, and those changes can strongly suggest the “right” protocol and timefor the treatment.
5. Conclusions
This study showed that NMR-based metabolomics of EBC may be used to monitorPR in COPD patients. It is basically noninvasive and provides quite real-time answers,particularly during the rehabilitation time ranges, offering an unbiased personalized ap-
Cells 2022, 11, 344 15 of 17
proach with an optimal use of health care resources. We also showed that this approach isable to define the molecular evolution of COPD phenotype under PR, identifying specificbiomarkers. In particular, methanol, being correlated with clinical parameters, can beused to monitor PR outcomes, therefore suggesting personalized protocols. Most likely,metabolomics can be extended to rehabilitation of other chronic diseases.
Supplementary Materials: The following are available online at https://www.mdpi.com/article/10.3390/cells11030344/s1, Table S1: Statistically significant discriminating metabolites in the T0–T5WOPLS-DA model; Figure S1: Box-and-whisker plots showing the concentration levels of discriminat-ing metabolites for the T0–T2W–T5W and T0–T5W OPLS-DA models; Figure S2: Box-and-whiskerplots showing the concentration levels of discriminating metabolites for the T0–T5W OPLS-DAmodel; Figure S3: Plots of the YVar values for the three clinical parameters obtained from the OPLSmodel correlating NMR parameters and clinical outcomes; Figure S4: Coefficient plots correlatingmetabolites uncovered in the NMR profile of EBC samples and the clinical rehabilitation parameters.
Author Contributions: M.M., A.M. and D.P. conceived the study; M.M., S.F. and P.A. enrolled,instructed, and conducted follow-up of the patients; D.P., P.C., A.T., L.P. and A.M. performed theexperiments; D.P., A.M. and M.M. performed the data analysis and interpretation; A.M., D.P. andM.M. drafted the manuscript. All authors critically reviewed and approved the manuscript prior tosubmission. All authors have read and agreed to the published version of the manuscript.
Funding: This research was supported in part by the “Ricerca Corrente” funding scheme of theMinistry of Health, Italy.
Institutional Review Board Statement: The study was conducted in accordance with the Declara-tion of Helsinki of the World Medical Association. The study was approved by the InstitutionalReview Board of Istituto Nazionale Tumori, Fondazione Pascale, Naples, Italy, with reference numberICS 2/17, and all patients provided written informed consent to use their de-identified data forfuture research.
Informed Consent Statement: Written, informed consent was obtained from all participants prior tostudy enrollment.
Data Availability Statement: The data presented in this study are available in the article and supple-mentary material.
Acknowledgments: We are grateful to patients for their important contribution to the study. We alsothank Anna Ciullo (Istituti Clinici Scientifici Maugeri IRCCS, Telese Terme, Italy) for her ability incollecting and managing the samples, and Silvia Stufano (Istituti Clinici Scientifici Maugeri IRCCS,Telese Terme, Italy) for carefully tabulating some of the data in Table 1.
Conflicts of Interest: The authors declare no conflict of interest.
References1. Li, X.; Cao, X.; Guo, M.; Xie, M.; Liu, X. Trends and risk factors of mortality and disability adjusted life years for chronic respiratory
diseases from 1990 to 2017: Systematic analysis for the Global Burden of Disease Study 2017. BMJ 2020, 368, m234; Erratum inBMJ 2020, 370, m3150. [CrossRef]
2. Franssen, F.M.; Alter, P.; Bar, N.; Benedikter, B.J.; Iurato, S.; Maier, D.; Maxheim, M.; Roessler, F.K.; Spruit, M.A.; Vogelmeier, C.F.;et al. Personalized medicine for patients with COPD: Where are we? Int. J. Chron. Obstruct. Pulmon. Dis. 2019, 14, 1465–1484.[CrossRef]
3. Holland, A.E.; Cox, N.S.; Houchen-Wolloff, L.; Rochester, C.L.; Garvey, C.; ZuWallack, R.; Nici, L.; Limberg, T.; Lareau, S.C.;Yawn, B.P.; et al. Defining Modern Pulmonary Rehabilitation. An Official American Thoracic Society Workshop Report. Ann. Am.Thorac. Soc. 2021, 18, e12–e29. [CrossRef]
4. Spruit, M.A.; Singh, S.J.; Garvey, C.; ZuWallack, R.; Nici, L.; Rochester, C.; Hill, K.; Holland, A.E.; Lareau, S.C.; Man, W.D.;et al. ATS/ERS Task Force on Pulmonary Rehabilitation. An official American Thoracic Society/European Respiratory Societystatement: Key concepts and advances in pulmonary rehabilitation. Am. J. Respir. Crit. Care Med. 2013, 188, e13–e64; Erratum inAm. J. Respir. Crit. Care Med. 2014, 189, 1570. [CrossRef]
5. Agusti, A.; Calverley, P.M.; Celli, B.; Coxson, H.O.; Edwards, L.D.; Lomas, D.A.; MacNee, W.; Miller, B.E.; Rennard, S.; Silverman,E.K.; et al. Characterisation of COPD heterogeneity in the ECLIPSE cohort. Respir. Res. 2010, 11, 122. [CrossRef]
Cells 2022, 11, 344 16 of 17
6. Vogelmeier, C.F.; Criner, G.J.; Martinez, F.J.; Anzueto, A.; Barnes, P.J.; Bourbeau, J.; Celli, B.R.; Chen, R.; Decramer, M.; Fabbri,L.M.; et al. Global Strategy for the Diagnosis, Management, and Prevention of Chronic Obstructive Lung Disease 2017 Report.GOLD Executive Summary. Am. J. Respir. Crit. Care Med. 2017, 195, 557–582. [CrossRef]
7. Maniscalco, M.; Motta, A. Metabolomics of exhaled breath condensate: A means for phenotyping respiratory diseases? Biomark.Med. 2017, 11, 405–407. [CrossRef]
8. Nicholson, J.K.; Lindon, J.C. Systems biology: Metabonomics. Nature 2008, 455, 1054–1056. [CrossRef] [PubMed]9. Paris, D.; Maniscalco, M.; Motta, A. Nuclear magnetic resonance-based metabolomics in respiratory medicine. Eur. Respir. J. 2018,
52, 1801107. [CrossRef] [PubMed]10. Maniscalco, M.; Cutignano, A.; Paris, D.; Melck, D.J.; Molino, A.; Fuschillo, S.; Motta, A. Metabolomics of Exhaled Breath
Condensate by Nuclear Magnetic Resonance Spectroscopy and Mass Spectrometry: A Methodological Approach. Curr. Med.Chem. 2020, 27, 2381–2399. [CrossRef] [PubMed]
11. Maniscalco, M.; Motta, A. Clinical and Inflammatory Phenotyping: Can Electronic Nose and NMR-based Metabolomics Work atthe Bedside? Arch. Med. Res. 2018, 49, 74–76. [CrossRef]
12. Maniscalco, M.; Fuschillo, S.; Paris, D.; Cutignano, A.; Sanduzzi, A.; Motta, A. Clinical metabolomics of exhaled breath condensatein chronic respiratory diseases. Adv. Clin. Chem. 2019, 88, 121–149.
13. Standardization of Spirometry, 1994 Update. American Thoracic Society. Am. J. Respir. Crit. Care Med. 1995, 152, 1107–1136.[CrossRef] [PubMed]
14. Franssen, F.M.; Han, M.K. The ABC of GOLD A-B-C-D. Eur. Respir. J. 2013, 42, 1166–1168. [CrossRef] [PubMed]15. Holland, A.E.; Spruit, M.A.; Troosters, T.; Puhan, M.A.; Pepin, V.; Saey, D.; McCormack, M.C.; Carlin, B.W.; Sciurba, F.C.; Pitta, F.;
et al. An official European Respiratory Society/American Thoracic Society technical standard: Field walking tests in chronicrespiratory disease. Eur. Respir. J. 2014, 44, 1428–1446. [CrossRef] [PubMed]
16. Mahler, D.A.; Horowitz, M.B. Perception of breathlessness during exercise in patients with respiratory disease. Med. Sci. SportsExerc. 1994, 26, 1078–1081. [CrossRef]
17. Rochester, C.L.; Vogiatzis, I.; Holland, A.E.; Lareau, S.C.; Marciniuk, D.D.; Puhan, M.A.; Spruit, M.A.; Masefield, S.; Casaburi, R.;Clini, E.M.; et al. ATS/ERS Task Force on Policy in Pulmonary Rehabilitation, An official American Thoracic Society/EuropeanRespiratory Society policy statement: Enhancing implementation, use, and delivery of pulmonary rehabilitation. Am. J. Respir.Crit. Care Med. 2015, 192, 1373–1386. [CrossRef]
18. Borg, G.A. Psychophysical bases of perceived exertion. Med. Sci. Sports Exerc. 1982, 14, 377–381. [CrossRef]19. Zainuldin, R.; Mackey, M.G.; Alison, J.A. Prescribing cycle exercise intensity using moderate symptom levels in chronic obstructive
pulmonary disease. J. Cardiopulm. Rehabil. Prev. 2016, 36, 195–202. [CrossRef]20. de Laurentiis, G.; Paris, D.; Melck, D.; Maniscalco, M.; Marsico, S.; Corso, G.; Motta, A.; Sofia, M. Metabonomic analysis of
exhaled breath condensate in adults by nuclear magnetic resonance spectroscopy. Eur. Respir. J. 2008, 32, 1175–1183. [CrossRef]21. Nguyen, B.D.; Meng, X.; Donovan, K.J.; Shaka, A.J. SOGGY: Solvent-optimized double gradient spectroscopy for water suppres-
sion. A comparison with some existing techniques. J. Magn. Reson. 2007, 184, 263–274. [CrossRef]22. Maniscalco, M.; Paris, D.; Melck, D.J.; D’Amato, M.; Zedda, A.; Sofia, M.; Stellato, C.; Motta, A. Coexistence of obesity and asthma
determines a distinct respiratory metabolic phenotype. J. Allergy Clin. Immunol. 2017, 139, 1536–1547. [CrossRef]23. Eriksson, L.; Byrne, T.; Johansson, E.; Trygg, J.; Vikström, C. Multi- and Megavariate Data Analysis: Basic Principles and Applications,
3rd ed.; MKS Umetrics AB: Malmö, Sweden, 2013.24. Di Costanzo, A.; Paris, D.; Melck, D.; Angiolillo, A.; Corso, G.; Maniscalco, M.; Motta, A. Blood biomarkers indicate that the
preclinical stages of Alzheimer’s disease present overlapping molecular features. Sci. Rep. 2020, 10, 15612. [CrossRef] [PubMed]25. Dorokhov, Y.L.; Shindyapina, A.V.; Sheshukova, E.V.; Komarova, T.V. Metabolic methanol: Molecular pathways and physiological
roles. Physiol. Rev. 2015, 95, 603–644. [CrossRef] [PubMed]26. Persoz, C.; Achard, S.; Momas, I.; Seta, N. Inflammatory response modulation of airway epithelial cells exposed to formaldehyde.
Toxicol. Lett. 2012, 211, 159–163. [CrossRef]27. Lino-dos-Santos-Franco, A.; Correa-Costa, M.; Durão, A.C.; de Oliveira, A.P.; Breithaupt-Faloppa, A.C.; Bertoni, J.; Oliveira-
Filho, R.M.; Câmara, N.O.; Marcourakis, T.; Tavares-de-Lima, W. Formaldehyde induces lung inflammation by an oxidant andantioxidant enzymes mediated mechanism in the lung tissue. Toxicol. Lett. 2011, 207, 278–285. [CrossRef]
28. Maniscalco, M.; Paris, D.; Melck, D.J.; Molino, A.; Carone, M.; Ruggeri, P.; Caramori, G.; Motta, A. Differential diagnosis betweennewly diagnosed asthma and COPD using exhaled breath condensate metabolomics: A pilot study. Eur. Respir. J. 2018, 51,1701825. [CrossRef]
29. Durham, A.L.; Adcock, I.M. The relationship between COPD and lung cancer. Lung Cancer 2015, 90, 121–127. [CrossRef] [PubMed]30. Bolton, C.E.; Broekhuizen, R.; Ionescu, A.A.; Nixon, L.S.; Wouters, E.F.; Shale, D.J.; Schols, A.M. Cellular protein breakdown and
systemic inflammation are unaffected by pulmonary rehabilitation in COPD. Thorax 2007, 62, 109–114. [CrossRef]31. Ratjen, F.; Saiman, L.; Mayer-Hamblett, N.; Lands, L.C.; Kloster, M.; Thompson, V.; Emmett, P.; Marshall, B.; Accurso, F.; Sagel, S.;
et al. Effect of azithromycin on systemic markers of inflammation in patients with cystic fibrosis uninfected with Pseudomonasaeruginosa. Chest 2012, 142, 1259–1266. [CrossRef]
32. Halper-Stromberg, E.; Gillenwater, L.; Cruickshank-Quinn, C.; O’Neal, W.K.; Reisdorph, N.; Petrache, I.; Zhuang, Y.; Labaki,W.W.; Curtis, J.L.; Wells, J.; et al. Bronchoalveolar lavage fluid from COPD patients reveals more compounds associated withdisease than matched plasma. Metabolites 2019, 9, 157. [CrossRef] [PubMed]

Cells 2022, 11, 344 17 of 17
33. Montuschi, P.; Lucidi, V.; Paris, D.; Montemitro, E.; Shohreh, R.; Mores, N.; Melck, D.; Santini, G.; Majo, F.; Motta, A. Metabolomicanalysis by nuclear magnetic resonance spectroscopy as a new approach to understanding inflammation and monitoring ofpharmacological therapy in children and young adults with cystic fibrosis. Front. Pharmacol. 2018, 9, 595. [CrossRef] [PubMed]
34. Kozu, R.; Senjyu, H.; Jenkins, S.C.; Mukae, H.; Sakamoto, N.; Kohno, S. Differences in response to pulmonary rehabilitation inidiopathic pulmonary fibrosis and chronic obstructive pulmonary disease. Respiration 2011, 81, 196–205. [CrossRef] [PubMed]
35. Rochester, C.L.; Spanevello, A. Heterogeneity of pulmonary rehabilitation: Like apples and oranges—both healthy fruit. Eur.Respir. J. 2014, 43, 1223–1226. [CrossRef] [PubMed]
36. Ambrosino, P.; Papa, A.; Maniscalco, M.; Di Minno, M.N.D. COVID-19 and functional disability: Current insights and rehabilita-tion strategies. Postgrad. Med. J. 2021, 97, 469–470. [CrossRef]
37. Huffman, K.M.; Slentz, C.A.; Kraus, W.E. Control arms in exercise training studies: Transitioning from an era of interventionefficacy to one of comparative clinical effectiveness research. J. Appl. Physiol. 2011, 111, 946–948. [CrossRef]
38. Yohannes, A.M.; Dryden, S.; Casaburi, R.; Hanania, N.A. Long-term benefits of pulmonary rehabilitation in patients with COPD:A 2-year follow-up study. Chest 2021, 159, 967–974. [CrossRef]


![[Acute exacerbation in COPD and asthma]](https://img.pdfslide.net/doc/110x75/63471bb3f88a53192c092893/acute-exacerbation-in-copd-and-asthma.jpg)


