Embed Size (px)
Citation preview
CHAPTER 28 Case Study: Metropolis Health SystemBACKGROUND
• 1. The Hospital System Metropolis Health System (MHS) offers comprehensive healthcare services. It is a midsize taxing district hospital. Although MHS has the power to raise revenues through taxes, it has not done so for the past seven years.
• 2. The Area MHS is located in the town of Metropolis, which has a population of 50,000. The town has a small college and a modest number of environmentally clean industries.
• 3. MHS Services MHS has taken significant steps to reduce hospital stays. It has developed a comprehensive array of services that are accessible, cost-effective, and responsive to the community’s needs. These services are wellness oriented in that they strive for prevention rather than treatment. As a result of these steps, inpatient visits have increased overall by only 1,000 per year since 2008, whereas outpatient/same-day surgery visits have had an increase of over 50,000 per year.A number of programmatic, service, and facility enhancements support this major transition in the community’s institutional health care. They are geared to provide the quality, convenience, affordability, and personal care that best suit the health needs of the people whom MHS serves.
• • Rehabilitation and Wellness Center—for outpatient physical therapy and return-to-work services, plus cardiac and pulmonary rehabilitation, to get people back to a normal way of living.
• • Home Health Services—bringing skilled care, therapy, and medical social services into the home; a comfortable and affordable alternative in longer-term care.
• • Same-Day Surgery (SDS)—eliminating the need for an overnight stay. Since 1998, same-day surgery procedures have doubled at MHS.
• • Skilled Nursing Facility—inpatient service to assist patients in returning more fully to an independent lifestyle.
• • Community Health and Wellness—community health outreach programs that provide educational seminars on a variety of health issues, a diabetes education center, support services for patients with cancer, health awareness events, and a women’s health resource center.
• • Occupational Health Services—helping to reduce workplace injury costs at over 100 area businesses through consultation on injury avoidance and work-specific rehabilitation services.
• • Recovery Services—offering mental health services, including substance abuse programs and support groups, along with individual and family counseling.
•• 4. MHS’s Plant The central building for the hospital is in the
center of a two-square-block area. A physicians’ office building is to the west. Two administrative offices, converted from former residences, are on one corner. The new ambulatory center, completed two years ago, has an L shape and sits on one corner of the western block. A laundry and maintenance building sits on the extreme back of the property. A four-story parking garage is located on the eastern back corner. An employee parking lot sits beside the laundry and maintenance building. Visitor parking lots fill the front eastern portion of the property. A helipad is on the extreme western edge of the property behind the physicians’ office building.
• 5. MHS Board of Trustees Eight local community leaders who bring diverse skills to the board govern MHS. The trustees generously volunteer their time to plan the strategic direction of MHS, thus ensuring the system’s ability to provide quality comprehensive health care to the community.
• 6. MHS Management A chief executive officer manages MHS. Seven senior vice presidents report to the CEO. MHS is organized into 23 major responsibility centers.
• 7. MHS Employees All 500 team members employed by MHS are integral to achieving the high standards for which the system strives. The quality improvement program, reviewed and reestablished in 2010, is aimed at meeting client needs sooner, better, and more cost-effectively. Participants in the program are from all areas of the system.
• 8. MHS Physicians The MHS medical staff is a key part of MHS’s ability to provide excellence in health care. Over 75 physicians cover more than 30 medical specialties. The high quality of their training and their commitment to the practice of medicine are great assets to the health of the community.The physicians are very much a part of MHS’s drive for continual improvement on the quality of healthcare services offered in the community. MHS brings in medical experts from around the country to provide training in new techniques, made possible by MHS’s technologic advancements. MHS also ensures that physicians are offered seminars, symposiums, and continuing education programs that permit them to remain current with changes in the medical field.The medical staff’s quality improvement program has begun a care path initiative to track effective means for diagnosis, treatment, and follow-up. This initiative will help avoid unnecessary or duplicate use of expensive medications or technologies.
• 9. MHS Foundation Metropolis Health Foundation is presently being created to serve as the philanthropic arm of MHS. It will operate in a separate corporation governed by a board of 12 community leaders and supported by a 15-member special events board. The mission of the foundation will be to secure financial and nonfinancial support for realizing the MHS vision of providing comprehensive health care for the community.Funds donated by individuals, businesses, foundations, and organizations will be designated for a variety of purposes at MHS, including the operation of specific departments, community
outreach programs, continuing education for employees, endowment, equipment, and capital improvements.
• 10. MHS Volunteer Auxiliary There are 500 volunteers who provide over 60,000 hours of service to MHS each year. These men and women assist in virtually every part of the system’s operations. They also conduct community programs on behalf of MHS.The auxiliary funds its programs and makes financial contributions to MHS through money it raises on renting televisions and vending gifts and other items at the hospital. In the past, its donations to MHS have generally been designated for medical equipment purchases. The auxiliary has given $250,000 over the last five years.
• 11. Planning the Future for MHS The MHS has identified five areas of desired service and programmatic enhancement in its five-year strategic plan:
• I. Ambulatory Services• II. Physical Medicine and Rehabilitative Services• III. Cardiovascular Services• IV. Oncology Services• V. Community Health Services
• MHS has set out to answer the most critical health needs that are specific to its community. Over the next five years, the MHS strategic plan will continue a tradition of quality, community-oriented health care to meet future demands.
• 12. Financing the Future MHS has established a corporate depreciation fund. The fund’s purpose is to ease the financial burden of replacing fixed assets. Presently, it has almost $2 million for needed equipment and renovations.
MHS CASE STUDYFinancial Statements
• • Balance Sheet (Exhibit 28–1)
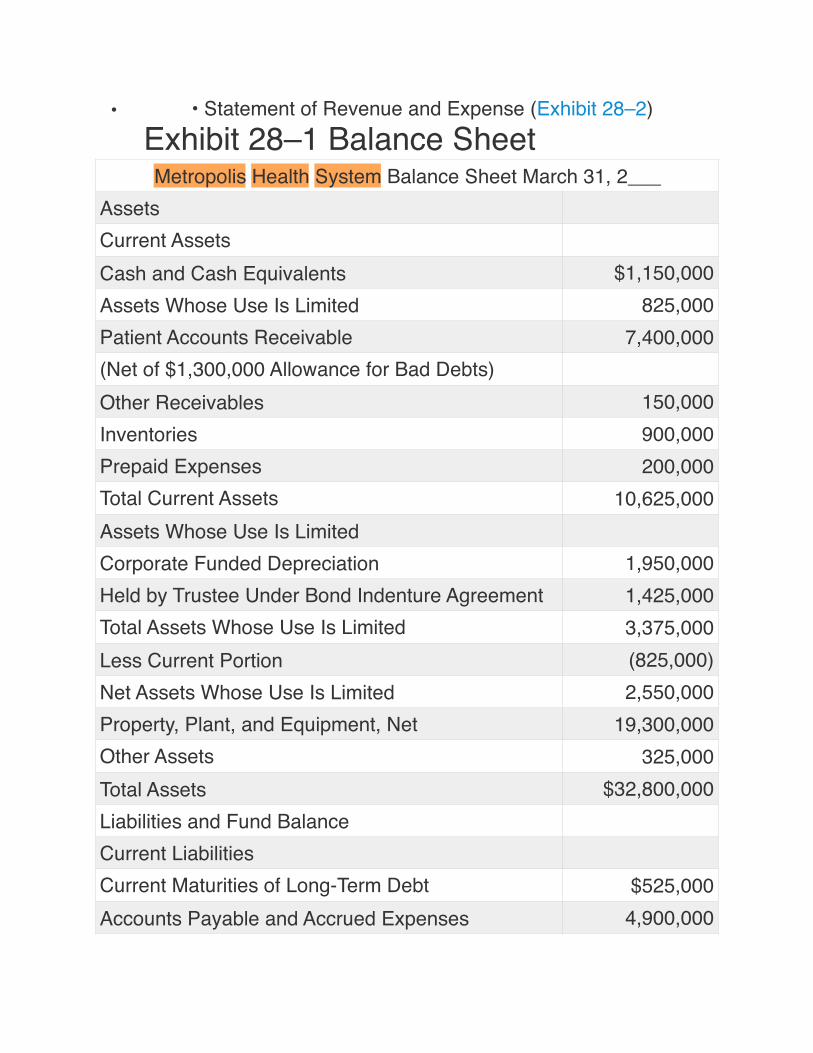
• • Statement of Revenue and Expense (Exhibit 28–2) Exhibit 28–1 Balance SheetMetropolis Health System Balance Sheet March 31, 2___
AssetsCurrent AssetsCash and Cash Equivalents $1,150,000Assets Whose Use Is Limited 825,000Patient Accounts Receivable 7,400,000(Net of $1,300,000 Allowance for Bad Debts)Other Receivables 150,000Inventories 900,000Prepaid Expenses 200,000Total Current Assets 10,625,000Assets Whose Use Is LimitedCorporate Funded Depreciation 1,950,000Held by Trustee Under Bond Indenture Agreement 1,425,000Total Assets Whose Use Is Limited 3,375,000Less Current Portion (825,000)Net Assets Whose Use Is Limited 2,550,000Property, Plant, and Equipment, Net 19,300,000Other Assets 325,000Total Assets $32,800,000Liabilities and Fund BalanceCurrent LiabilitiesCurrent Maturities of Long-Term Debt $525,000Accounts Payable and Accrued Expenses 4,900,000
•
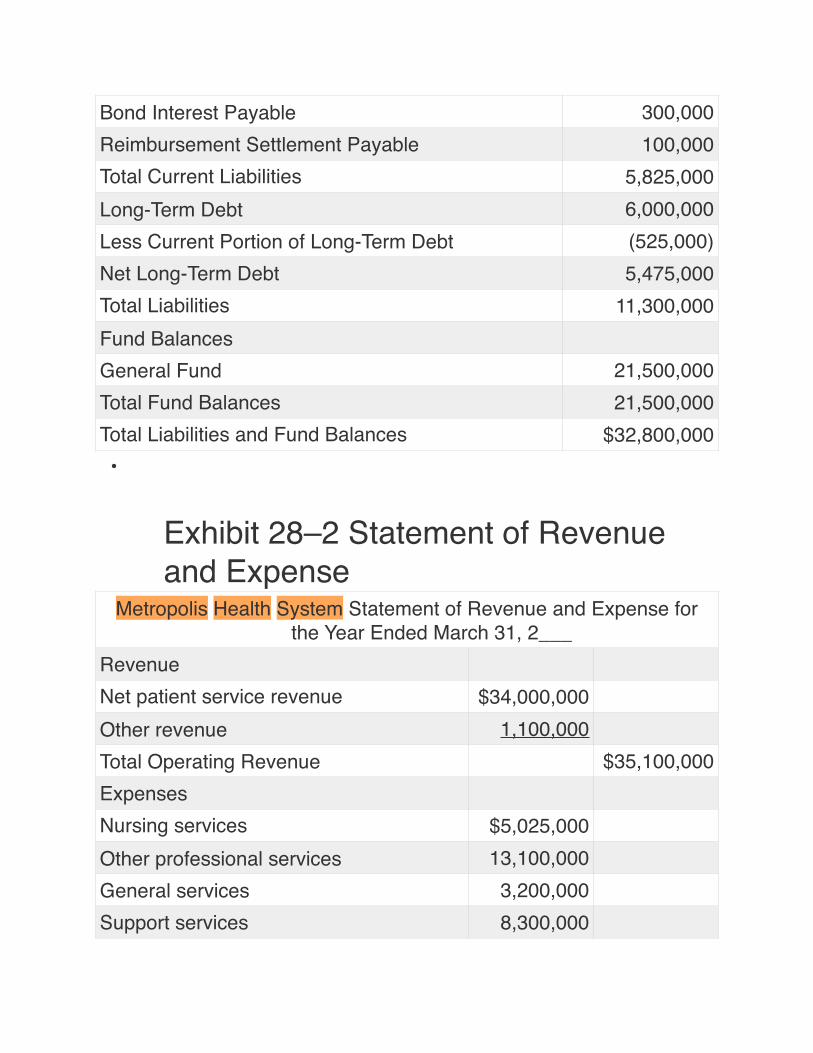
Exhibit 28–2 Statement of Revenue and Expense
Bond Interest Payable 300,000Reimbursement Settlement Payable 100,000Total Current Liabilities 5,825,000Long-Term Debt 6,000,000Less Current Portion of Long-Term Debt (525,000)Net Long-Term Debt 5,475,000Total Liabilities 11,300,000Fund BalancesGeneral Fund 21,500,000Total Fund Balances 21,500,000Total Liabilities and Fund Balances $32,800,000
Metropolis Health System Statement of Revenue and Expense for the Year Ended March 31, 2___
RevenueNet patient service revenue $34,000,000Other revenue 1,100,000Total Operating Revenue $35,100,000ExpensesNursing services $5,025,000Other professional services 13,100,000General services 3,200,000Support services 8,300,000
•• • Statement of Cash Flows (Exhibit 28–3)• • Statement of Changes in Fund Balance (Exhibit 28–4)• • Schedule of Property, Plant, and Equipment (Exhibit 28–
5)• • Schedule of Patient Revenue (Exhibit 28–6)• • Schedule of Operating Expenses (Exhibit 28–7)
Statistics and Organizational Structure• • Hospital Statistical Data (Exhibit 28–8)• • MHS Nursing Practice and Administration Organization
Chart (Figure 28–1)• • MHS Executive-Level Organization Chart (Figure 28–2)
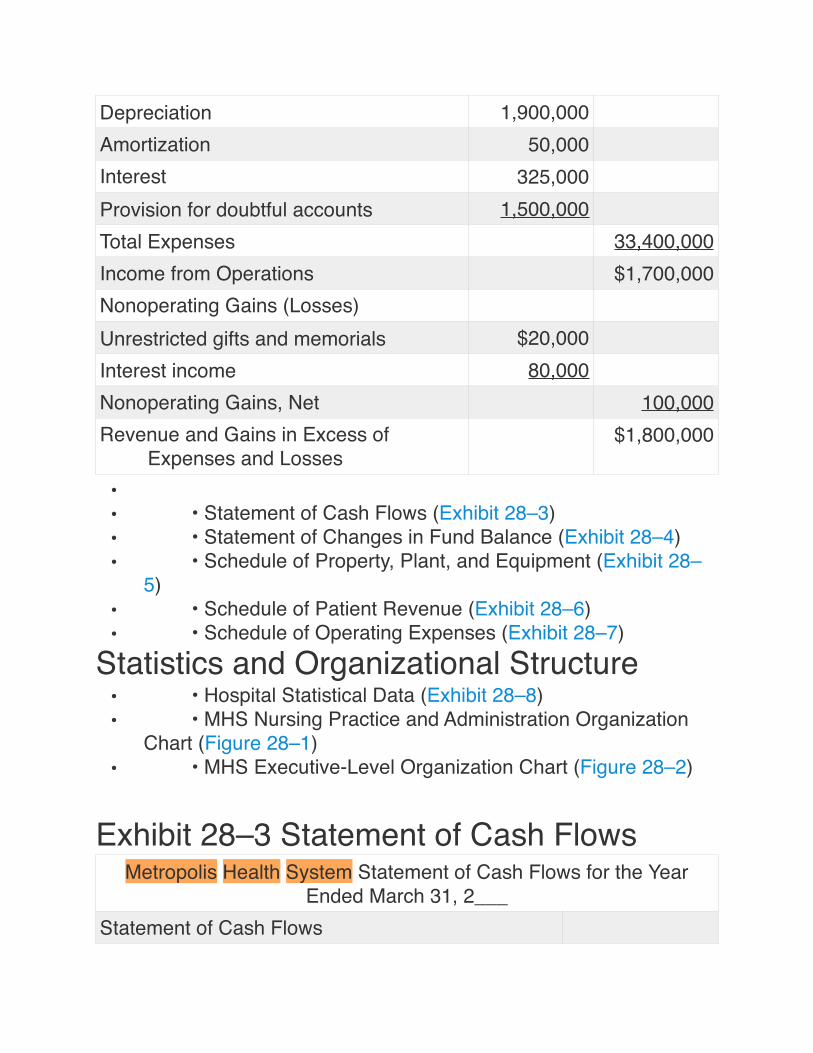
Exhibit 28–3 Statement of Cash Flows
Depreciation 1,900,000Amortization 50,000Interest 325,000Provision for doubtful accounts 1,500,000Total Expenses 33,400,000Income from Operations $1,700,000Nonoperating Gains (Losses)Unrestricted gifts and memorials $20,000Interest income 80,000Nonoperating Gains, Net 100,000Revenue and Gains in Excess of
Expenses and Losses$1,800,000
Metropolis Health System Statement of Cash Flows for the Year Ended March 31, 2___
Statement of Cash Flows
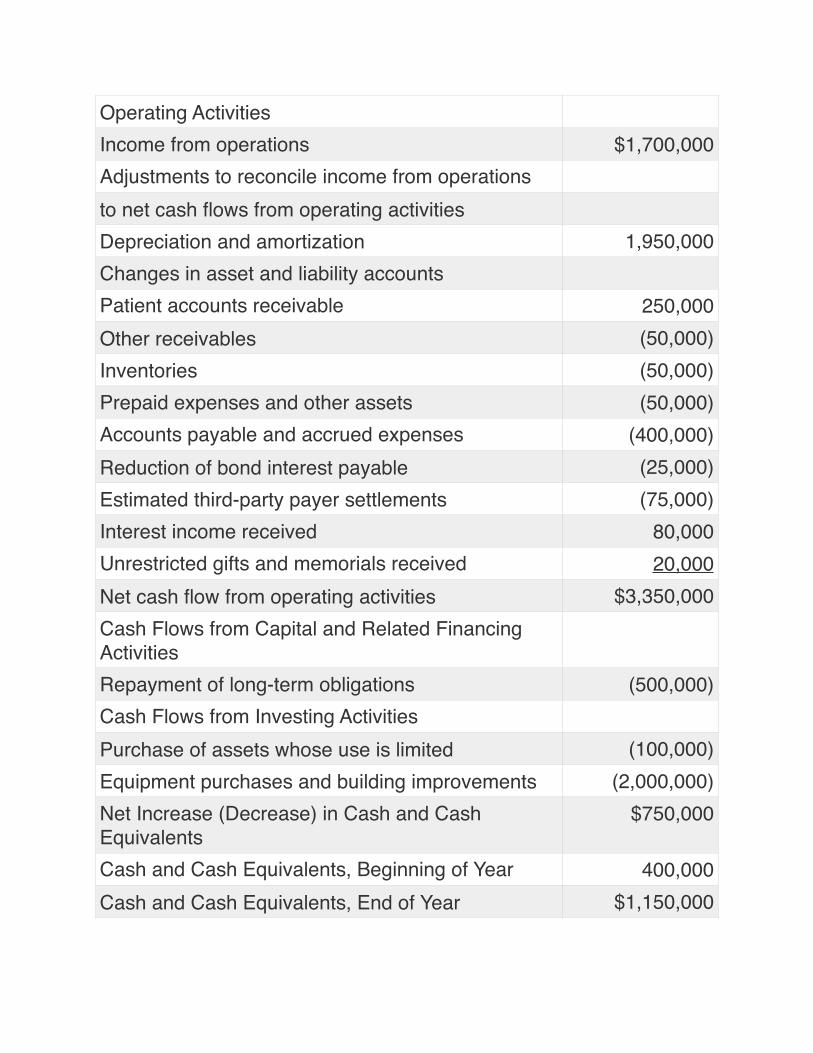
Operating ActivitiesIncome from operations $1,700,000Adjustments to reconcile income from operationsto net cash flows from operating activitiesDepreciation and amortization 1,950,000Changes in asset and liability accountsPatient accounts receivable 250,000Other receivables (50,000)Inventories (50,000)Prepaid expenses and other assets (50,000)Accounts payable and accrued expenses (400,000)Reduction of bond interest payable (25,000)Estimated third-party payer settlements (75,000)Interest income received 80,000Unrestricted gifts and memorials received 20,000Net cash flow from operating activities $3,350,000Cash Flows from Capital and Related Financing ActivitiesRepayment of long-term obligations (500,000)Cash Flows from Investing ActivitiesPurchase of assets whose use is limited (100,000)Equipment purchases and building improvements (2,000,000)Net Increase (Decrease) in Cash and Cash Equivalents
$750,000
Cash and Cash Equivalents, Beginning of Year 400,000Cash and Cash Equivalents, End of Year $1,150,000
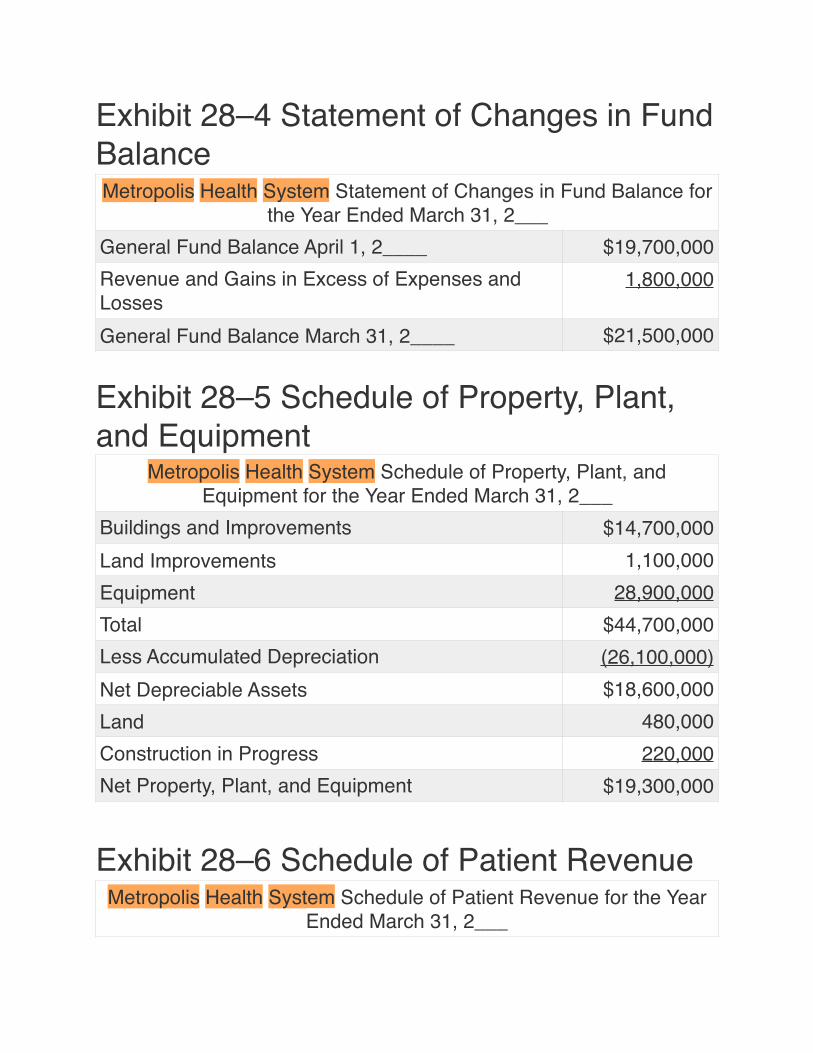
Exhibit 28–4 Statement of Changes in Fund Balance
Exhibit 28–5 Schedule of Property, Plant, and Equipment
Exhibit 28–6 Schedule of Patient Revenue
Metropolis Health System Statement of Changes in Fund Balance for the Year Ended March 31, 2___
General Fund Balance April 1, 2____ $19,700,000Revenue and Gains in Excess of Expenses and Losses
1,800,000
General Fund Balance March 31, 2____ $21,500,000
Metropolis Health System Schedule of Property, Plant, and Equipment for the Year Ended March 31, 2___
Buildings and Improvements $14,700,000Land Improvements 1,100,000Equipment 28,900,000Total $44,700,000Less Accumulated Depreciation (26,100,000)Net Depreciable Assets $18,600,000Land 480,000Construction in Progress 220,000Net Property, Plant, and Equipment $19,300,000
Metropolis Health System Schedule of Patient Revenue for the Year Ended March 31, 2___
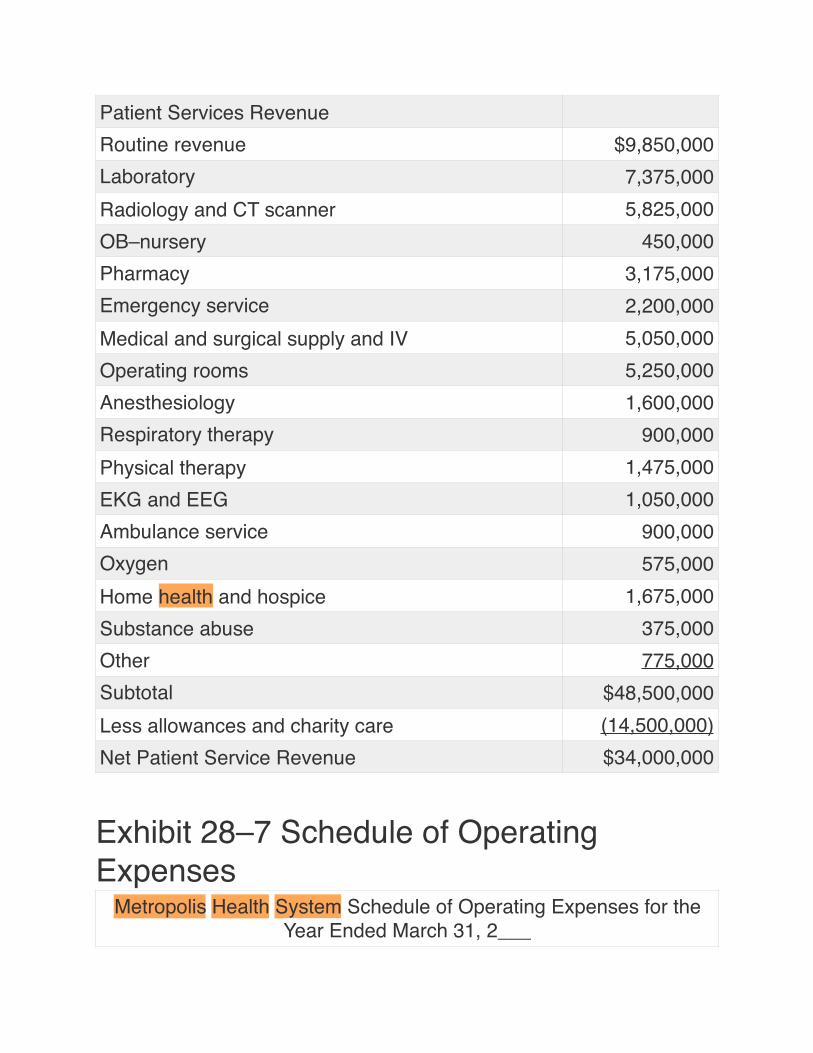
Exhibit 28–7 Schedule of Operating Expenses
Patient Services RevenueRoutine revenue $9,850,000Laboratory 7,375,000Radiology and CT scanner 5,825,000OB–nursery 450,000Pharmacy 3,175,000Emergency service 2,200,000Medical and surgical supply and IV 5,050,000Operating rooms 5,250,000Anesthesiology 1,600,000Respiratory therapy 900,000Physical therapy 1,475,000EKG and EEG 1,050,000Ambulance service 900,000Oxygen 575,000Home health and hospice 1,675,000Substance abuse 375,000Other 775,000Subtotal $48,500,000Less allowances and charity care (14,500,000)Net Patient Service Revenue $34,000,000
Metropolis Health System Schedule of Operating Expenses for the Year Ended March 31, 2___
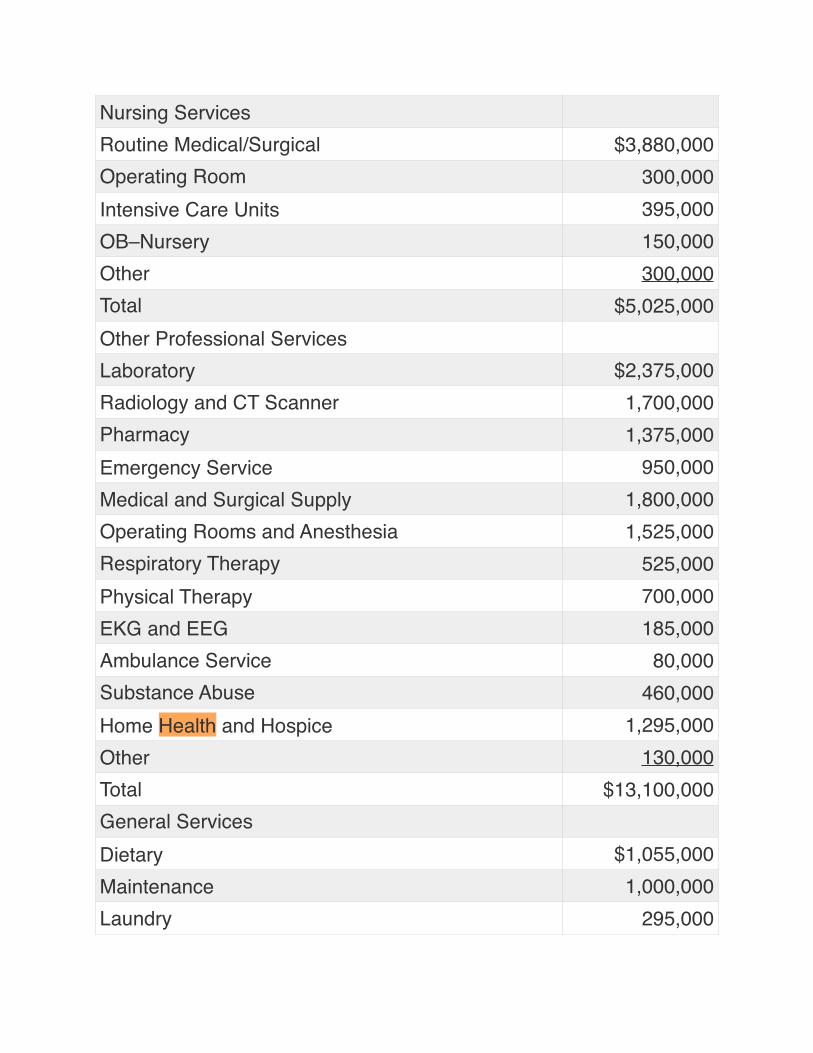
Nursing ServicesRoutine Medical/Surgical $3,880,000Operating Room 300,000Intensive Care Units 395,000OB–Nursery 150,000Other 300,000Total $5,025,000Other Professional ServicesLaboratory $2,375,000Radiology and CT Scanner 1,700,000Pharmacy 1,375,000Emergency Service 950,000Medical and Surgical Supply 1,800,000Operating Rooms and Anesthesia 1,525,000Respiratory Therapy 525,000Physical Therapy 700,000EKG and EEG 185,000Ambulance Service 80,000Substance Abuse 460,000Home Health and Hospice 1,295,000Other 130,000Total $13,100,000General ServicesDietary $1,055,000Maintenance 1,000,000Laundry 295,000
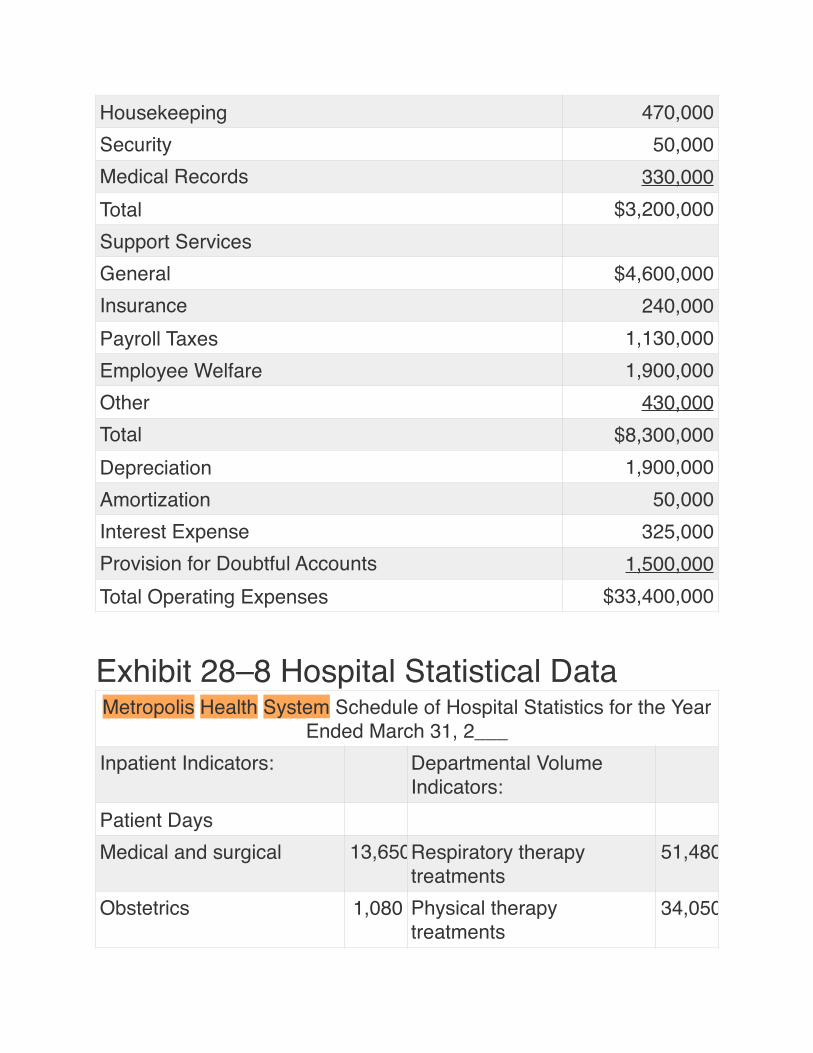
Exhibit 28–8 Hospital Statistical Data
Housekeeping 470,000Security 50,000Medical Records 330,000Total $3,200,000Support ServicesGeneral $4,600,000Insurance 240,000Payroll Taxes 1,130,000Employee Welfare 1,900,000Other 430,000Total $8,300,000Depreciation 1,900,000Amortization 50,000Interest Expense 325,000Provision for Doubtful Accounts 1,500,000Total Operating Expenses $33,400,000
Metropolis Health System Schedule of Hospital Statistics for the Year Ended March 31, 2___
Inpatient Indicators: Departmental Volume Indicators:
Patient DaysMedical and surgical 13,650Respiratory therapy
treatments51,480
Obstetrics 1,080 Physical therapy treatments
34,050
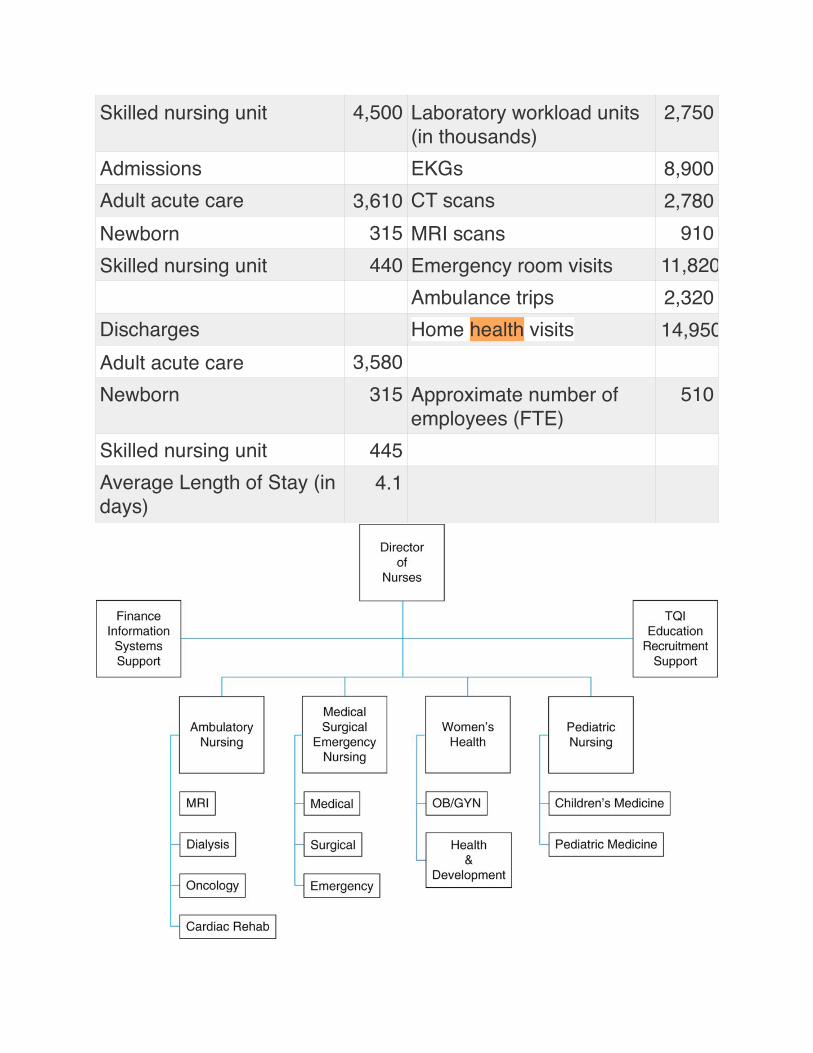
Skilled nursing unit 4,500 Laboratory workload units (in thousands)
2,750
Admissions EKGs 8,900Adult acute care 3,610 CT scans 2,780Newborn 315 MRI scans 910Skilled nursing unit 440 Emergency room visits 11,820
Ambulance trips 2,320Discharges Home health visits 14,950Adult acute care 3,580Newborn 315 Approximate number of
employees (FTE)510
Skilled nursing unit 445Average Length of Stay (in days)
4.1
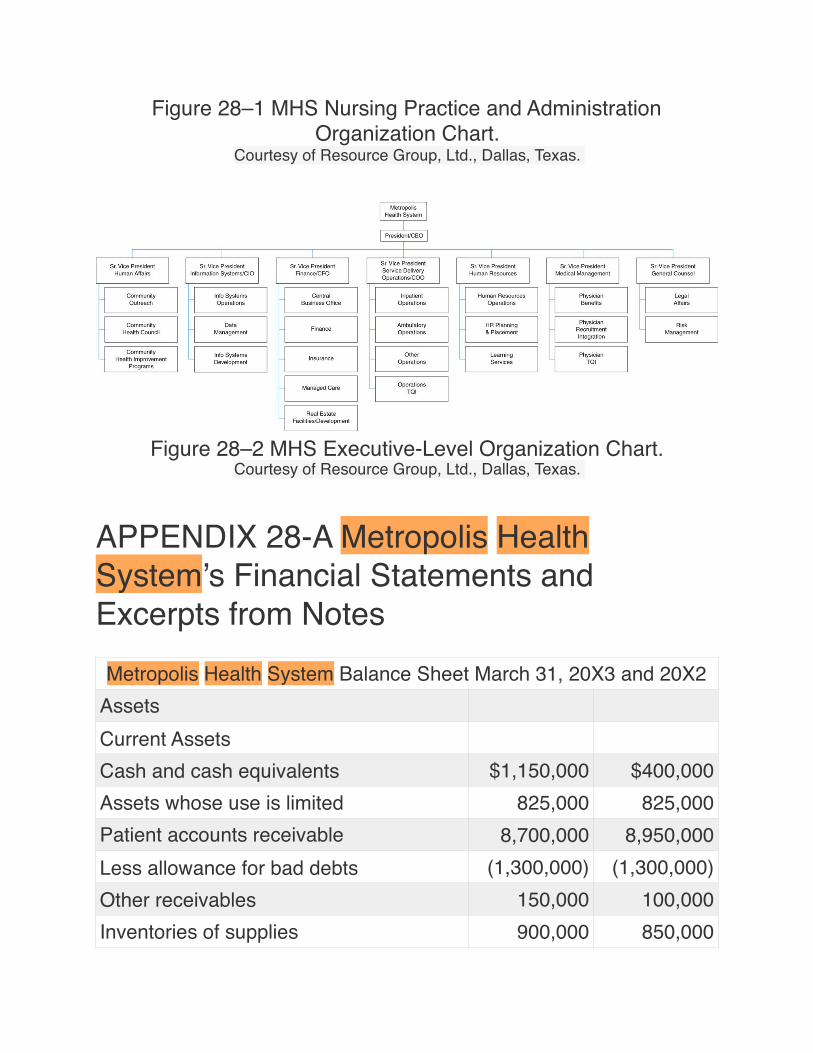
Figure 28–1 MHS Nursing Practice and Administration Organization Chart.
Courtesy of Resource Group, Ltd., Dallas, Texas.
Figure 28–2 MHS Executive-Level Organization Chart.Courtesy of Resource Group, Ltd., Dallas, Texas.
APPENDIX 28-A Metropolis Health System’s Financial Statements and Excerpts from NotesMetropolis Health System Balance Sheet March 31, 20X3 and 20X2
AssetsCurrent AssetsCash and cash equivalents $1,150,000 $400,000Assets whose use is limited 825,000 825,000Patient accounts receivable 8,700,000 8,950,000Less allowance for bad debts (1,300,000) (1,300,000)Other receivables 150,000 100,000Inventories of supplies 900,000 850,000
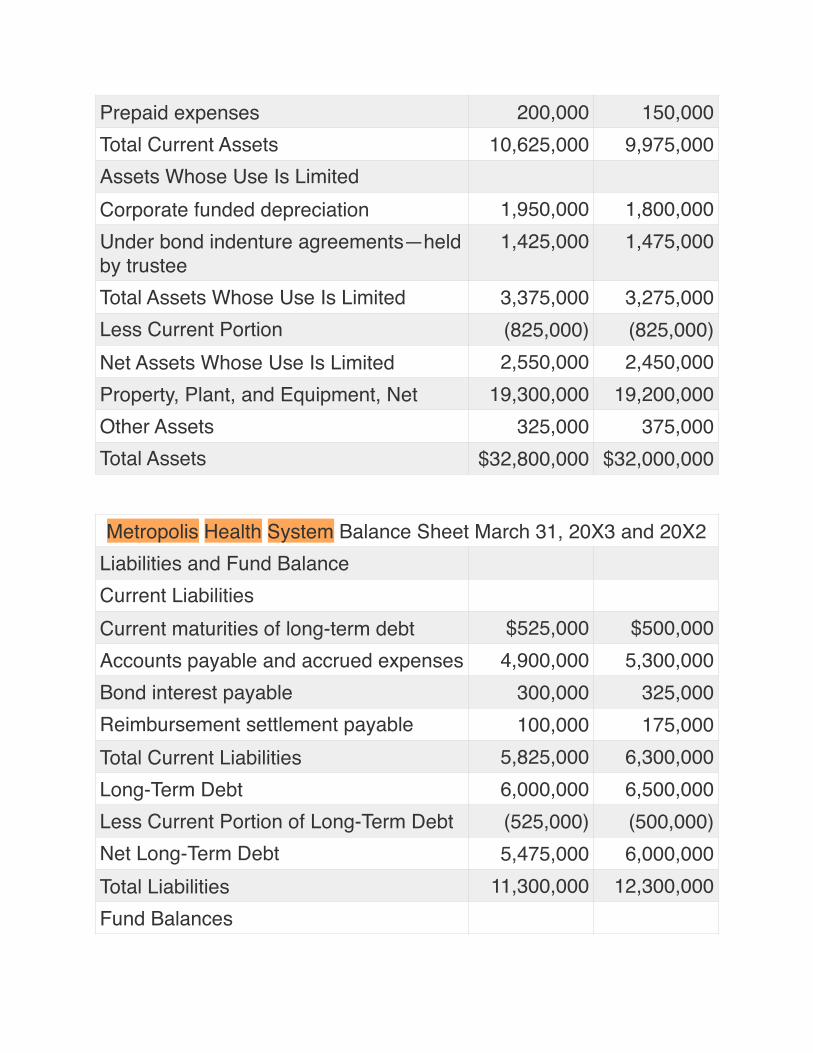
Prepaid expenses 200,000 150,000Total Current Assets 10,625,000 9,975,000Assets Whose Use Is LimitedCorporate funded depreciation 1,950,000 1,800,000Under bond indenture agreements—held by trustee
1,425,000 1,475,000
Total Assets Whose Use Is Limited 3,375,000 3,275,000Less Current Portion (825,000) (825,000)Net Assets Whose Use Is Limited 2,550,000 2,450,000Property, Plant, and Equipment, Net 19,300,000 19,200,000Other Assets 325,000 375,000Total Assets $32,800,000 $32,000,000
Metropolis Health System Balance Sheet March 31, 20X3 and 20X2Liabilities and Fund BalanceCurrent LiabilitiesCurrent maturities of long-term debt $525,000 $500,000Accounts payable and accrued expenses 4,900,000 5,300,000Bond interest payable 300,000 325,000Reimbursement settlement payable 100,000 175,000Total Current Liabilities 5,825,000 6,300,000Long-Term Debt 6,000,000 6,500,000Less Current Portion of Long-Term Debt (525,000) (500,000)Net Long-Term Debt 5,475,000 6,000,000Total Liabilities 11,300,000 12,300,000Fund Balances
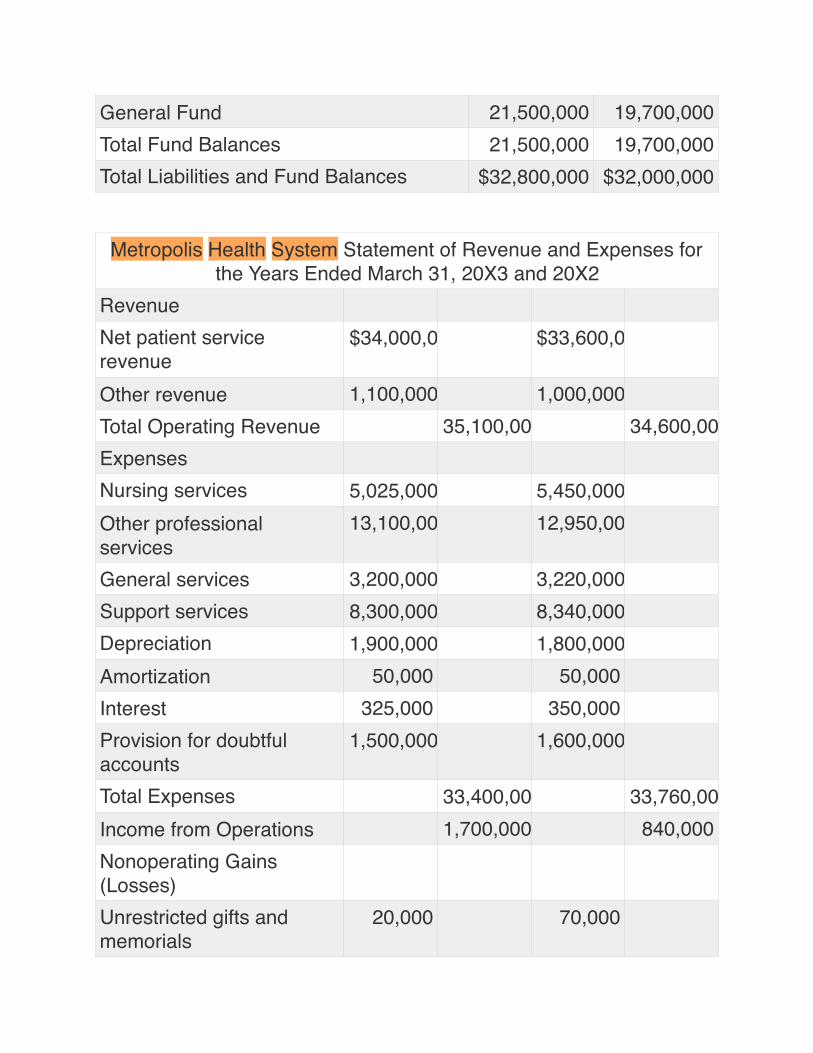
General Fund 21,500,000 19,700,000Total Fund Balances 21,500,000 19,700,000Total Liabilities and Fund Balances $32,800,000 $32,000,000
Metropolis Health System Statement of Revenue and Expenses for the Years Ended March 31, 20X3 and 20X2
RevenueNet patient service revenue
$34,000,000 $33,600,000
Other revenue 1,100,000 1,000,000Total Operating Revenue 35,100,000 34,600,000ExpensesNursing services 5,025,000 5,450,000Other professional services
13,100,000 12,950,000
General services 3,200,000 3,220,000Support services 8,300,000 8,340,000Depreciation 1,900,000 1,800,000Amortization 50,000 50,000Interest 325,000 350,000Provision for doubtful accounts
1,500,000 1,600,000
Total Expenses 33,400,000 33,760,000Income from Operations 1,700,000 840,000Nonoperating Gains (Losses)Unrestricted gifts and memorials
20,000 70,000
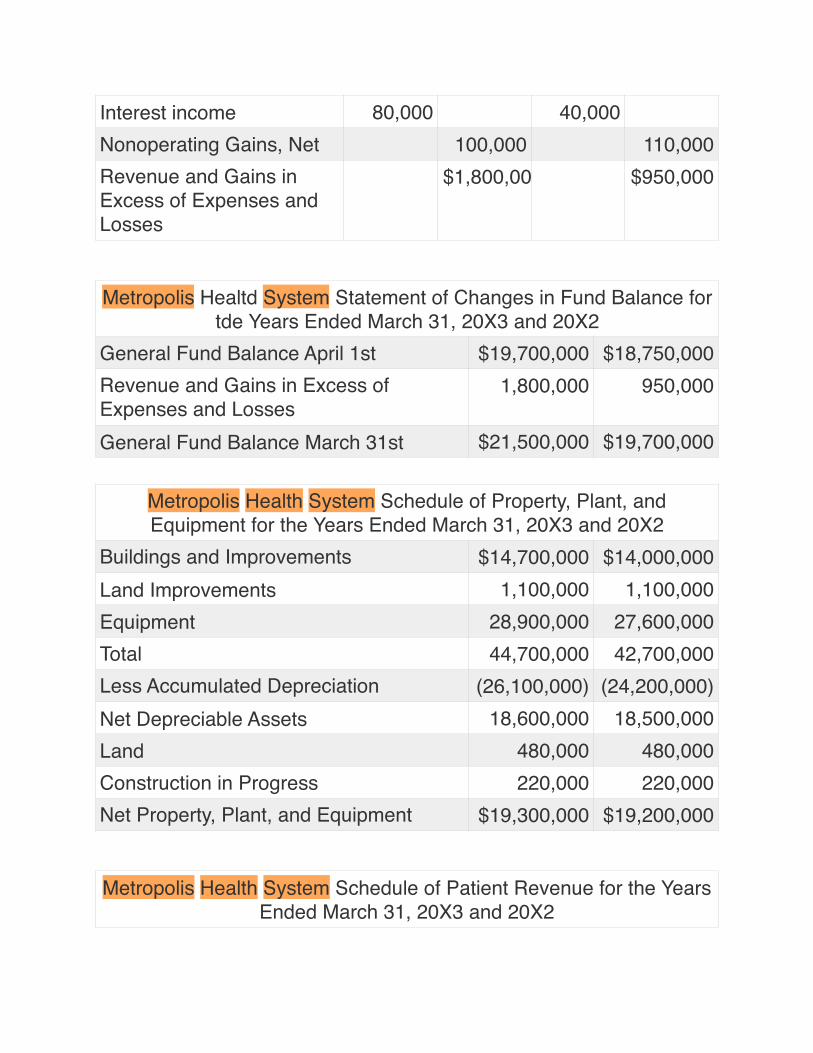
Interest income 80,000 40,000Nonoperating Gains, Net 100,000 110,000Revenue and Gains in Excess of Expenses and Losses
$1,800,000 $950,000
Metropolis Healtd System Statement of Changes in Fund Balance for tde Years Ended March 31, 20X3 and 20X2
General Fund Balance April 1st $19,700,000 $18,750,000Revenue and Gains in Excess of Expenses and Losses
1,800,000 950,000
General Fund Balance March 31st $21,500,000 $19,700,000
Metropolis Health System Schedule of Property, Plant, and Equipment for the Years Ended March 31, 20X3 and 20X2
Buildings and Improvements $14,700,000 $14,000,000Land Improvements 1,100,000 1,100,000Equipment 28,900,000 27,600,000Total 44,700,000 42,700,000Less Accumulated Depreciation (26,100,000) (24,200,000)Net Depreciable Assets 18,600,000 18,500,000Land 480,000 480,000Construction in Progress 220,000 220,000Net Property, Plant, and Equipment $19,300,000 $19,200,000
Metropolis Health System Schedule of Patient Revenue for the Years Ended March 31, 20X3 and 20X2
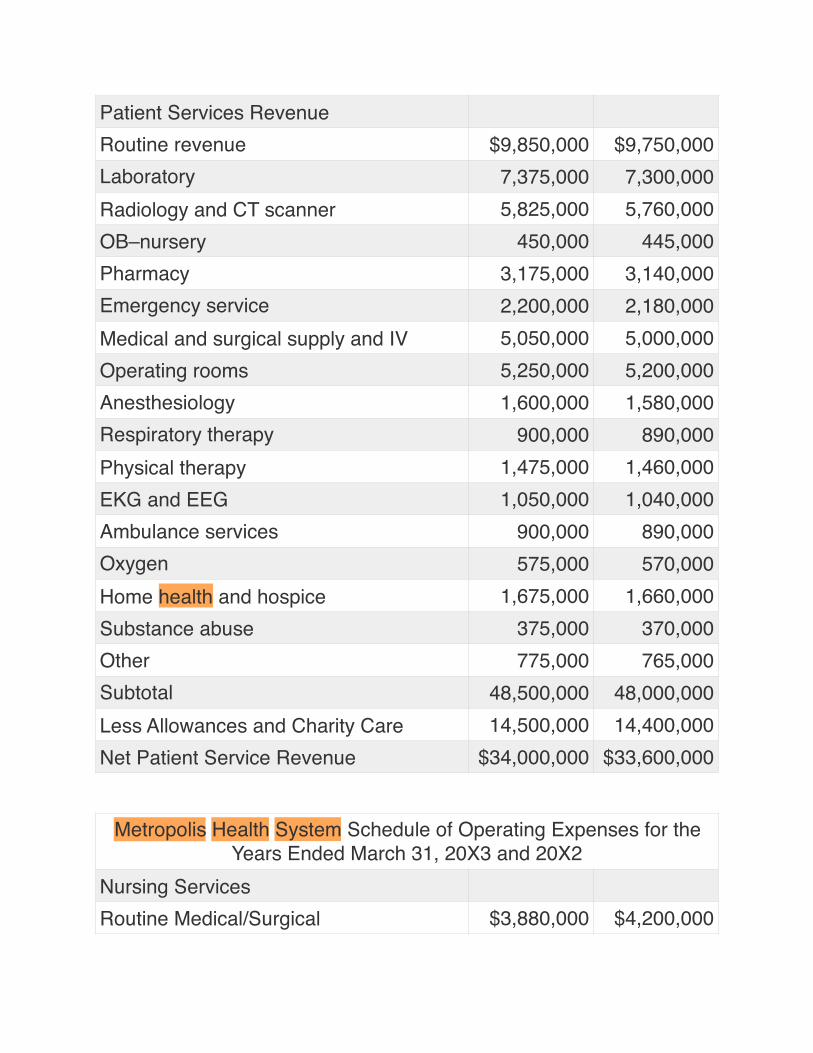
Patient Services RevenueRoutine revenue $9,850,000 $9,750,000Laboratory 7,375,000 7,300,000Radiology and CT scanner 5,825,000 5,760,000OB–nursery 450,000 445,000Pharmacy 3,175,000 3,140,000Emergency service 2,200,000 2,180,000Medical and surgical supply and IV 5,050,000 5,000,000Operating rooms 5,250,000 5,200,000Anesthesiology 1,600,000 1,580,000Respiratory therapy 900,000 890,000Physical therapy 1,475,000 1,460,000EKG and EEG 1,050,000 1,040,000Ambulance services 900,000 890,000Oxygen 575,000 570,000Home health and hospice 1,675,000 1,660,000Substance abuse 375,000 370,000Other 775,000 765,000Subtotal 48,500,000 48,000,000Less Allowances and Charity Care 14,500,000 14,400,000Net Patient Service Revenue $34,000,000 $33,600,000
Metropolis Health System Schedule of Operating Expenses for the Years Ended March 31, 20X3 and 20X2
Nursing ServicesRoutine Medical/Surgical $3,880,000 $4,200,000
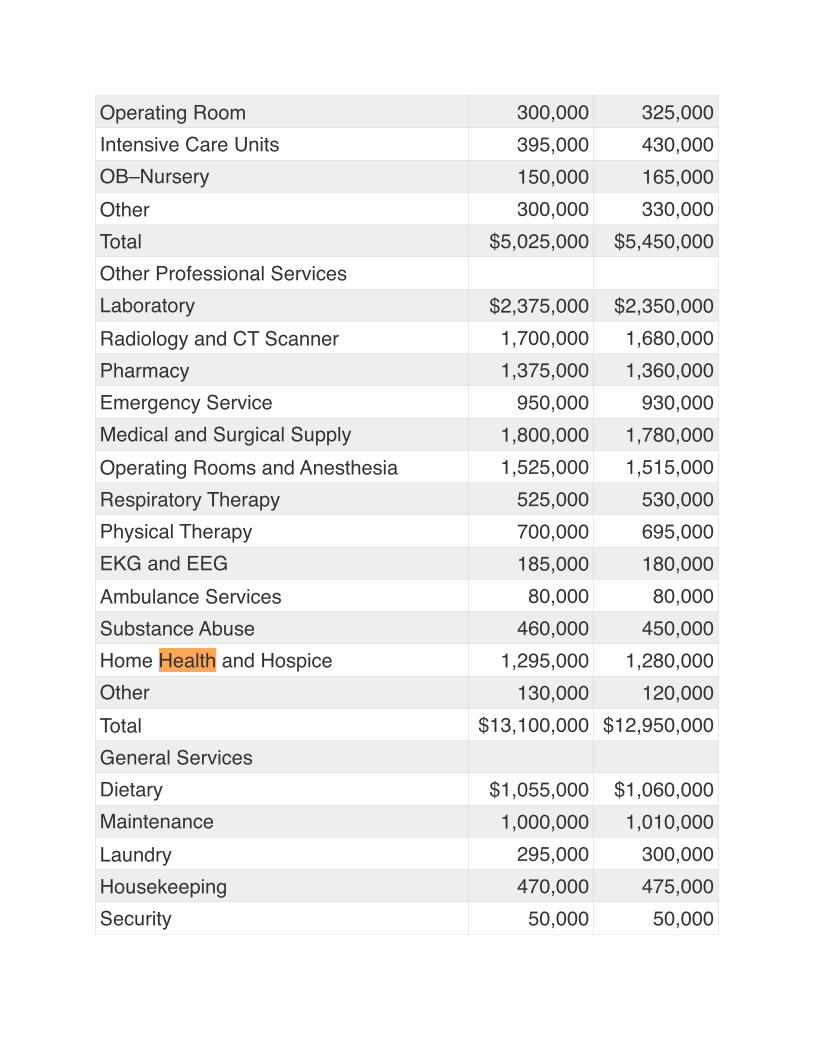
Operating Room 300,000 325,000Intensive Care Units 395,000 430,000OB–Nursery 150,000 165,000Other 300,000 330,000Total $5,025,000 $5,450,000Other Professional ServicesLaboratory $2,375,000 $2,350,000Radiology and CT Scanner 1,700,000 1,680,000Pharmacy 1,375,000 1,360,000Emergency Service 950,000 930,000Medical and Surgical Supply 1,800,000 1,780,000Operating Rooms and Anesthesia 1,525,000 1,515,000Respiratory Therapy 525,000 530,000Physical Therapy 700,000 695,000EKG and EEG 185,000 180,000Ambulance Services 80,000 80,000Substance Abuse 460,000 450,000Home Health and Hospice 1,295,000 1,280,000Other 130,000 120,000Total $13,100,000 $12,950,000General ServicesDietary $1,055,000 $1,060,000Maintenance 1,000,000 1,010,000Laundry 295,000 300,000Housekeeping 470,000 475,000Security 50,000 50,000
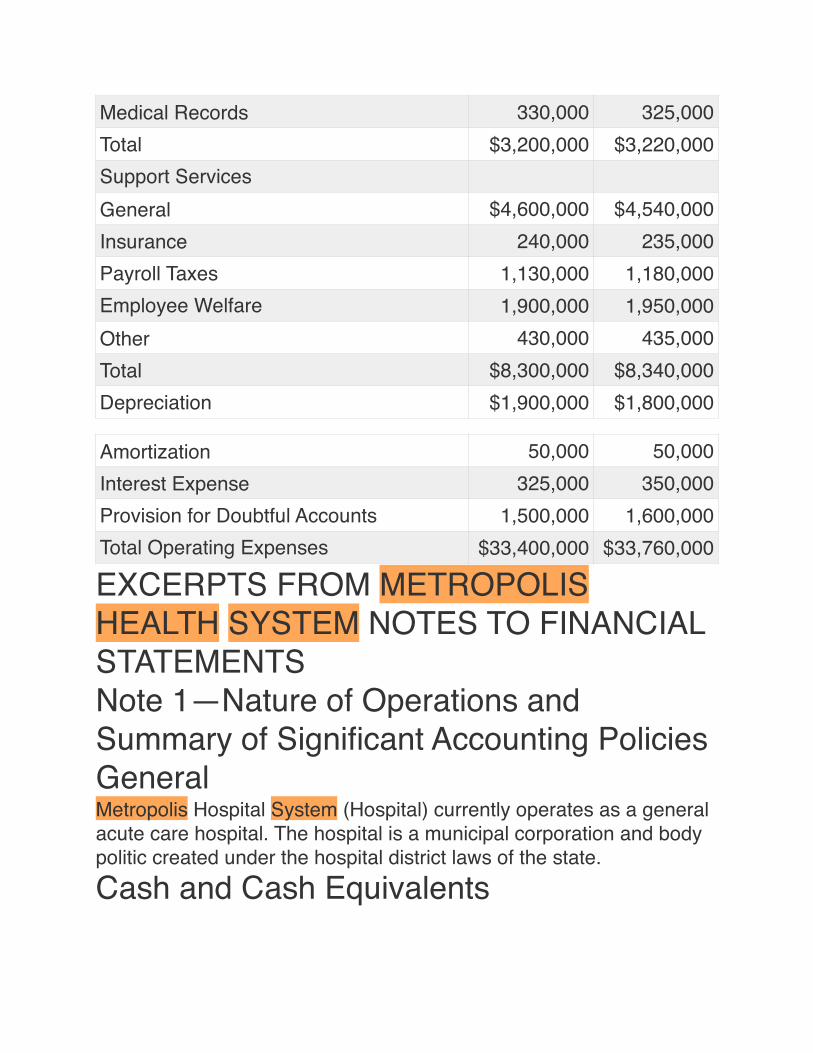
EXCERPTS FROM METROPOLIS HEALTH SYSTEM NOTES TO FINANCIAL STATEMENTSNote 1—Nature of Operations and Summary of Significant Accounting PoliciesGeneralMetropolis Hospital System (Hospital) currently operates as a general acute care hospital. The hospital is a municipal corporation and body politic created under the hospital district laws of the state.Cash and Cash Equivalents
Medical Records 330,000 325,000Total $3,200,000 $3,220,000Support ServicesGeneral $4,600,000 $4,540,000Insurance 240,000 235,000Payroll Taxes 1,130,000 1,180,000Employee Welfare 1,900,000 1,950,000Other 430,000 435,000Total $8,300,000 $8,340,000Depreciation $1,900,000 $1,800,000
Amortization 50,000 50,000Interest Expense 325,000 350,000Provision for Doubtful Accounts 1,500,000 1,600,000Total Operating Expenses $33,400,000 $33,760,000
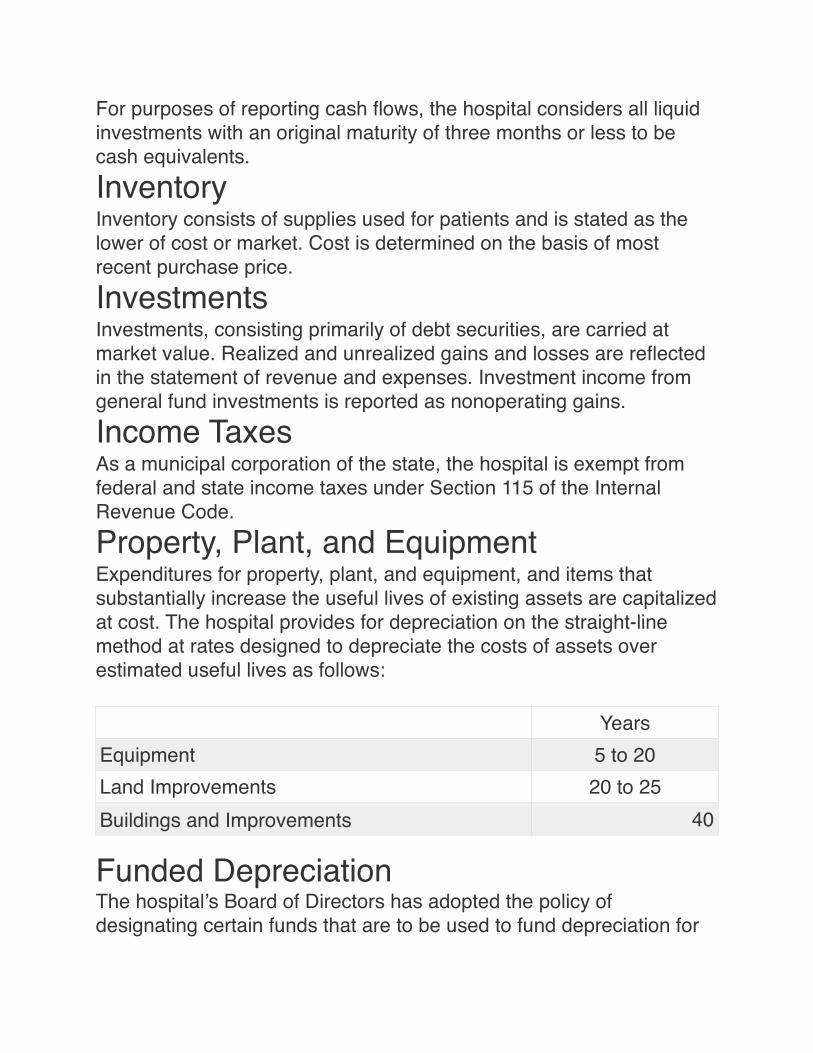
For purposes of reporting cash flows, the hospital considers all liquid investments with an original maturity of three months or less to be cash equivalents.InventoryInventory consists of supplies used for patients and is stated as the lower of cost or market. Cost is determined on the basis of most recent purchase price.InvestmentsInvestments, consisting primarily of debt securities, are carried at market value. Realized and unrealized gains and losses are reflected in the statement of revenue and expenses. Investment income from general fund investments is reported as nonoperating gains.Income TaxesAs a municipal corporation of the state, the hospital is exempt from federal and state income taxes under Section 115 of the Internal Revenue Code.Property, Plant, and EquipmentExpenditures for property, plant, and equipment, and items that substantially increase the useful lives of existing assets are capitalized at cost. The hospital provides for depreciation on the straight-line method at rates designed to depreciate the costs of assets over estimated useful lives as follows:
Funded DepreciationThe hospital’s Board of Directors has adopted the policy of designating certain funds that are to be used to fund depreciation for
YearsEquipment 5 to 20Land Improvements 20 to 25Buildings and Improvements 40
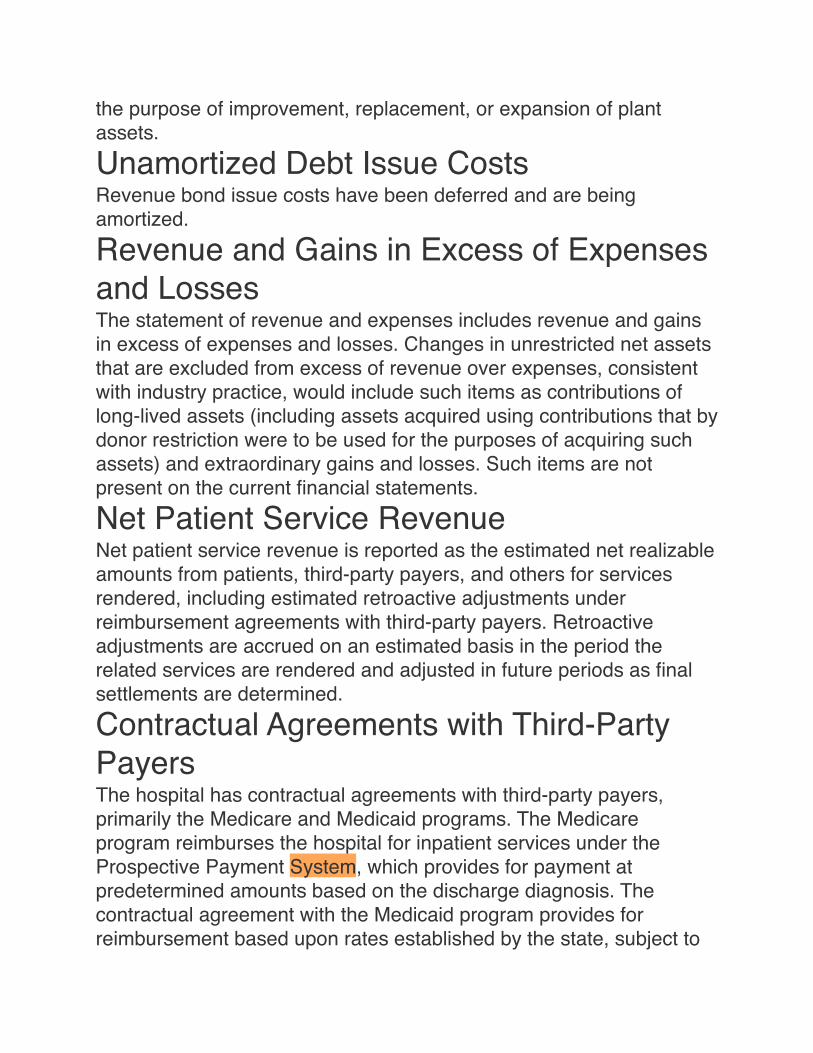
the purpose of improvement, replacement, or expansion of plant assets.Unamortized Debt Issue CostsRevenue bond issue costs have been deferred and are being amortized.Revenue and Gains in Excess of Expenses and LossesThe statement of revenue and expenses includes revenue and gains in excess of expenses and losses. Changes in unrestricted net assets that are excluded from excess of revenue over expenses, consistent with industry practice, would include such items as contributions of long-lived assets (including assets acquired using contributions that by donor restriction were to be used for the purposes of acquiring such assets) and extraordinary gains and losses. Such items are not present on the current financial statements.Net Patient Service RevenueNet patient service revenue is reported as the estimated net realizable amounts from patients, third-party payers, and others for services rendered, including estimated retroactive adjustments under reimbursement agreements with third-party payers. Retroactive adjustments are accrued on an estimated basis in the period the related services are rendered and adjusted in future periods as final settlements are determined.Contractual Agreements with Third-Party PayersThe hospital has contractual agreements with third-party payers, primarily the Medicare and Medicaid programs. The Medicare program reimburses the hospital for inpatient services under the Prospective Payment System, which provides for payment at predetermined amounts based on the discharge diagnosis. The contractual agreement with the Medicaid program provides for reimbursement based upon rates established by the state, subject to
state appropriations. The difference between established customary charge rates and reimbursement is accounted for as a contractual allowance.Gifts and BequestsUnrestricted gifts and bequests are recorded on the accrual basis as nonoperating gains.Donated ServicesNo amounts have been reflected in the financial statements for donated services. The hospital pays for most services requiring specific expertise. However, many individuals volunteer their time and perform a variety of tasks that help the hospital with specific assistance programs and various committee assignments.
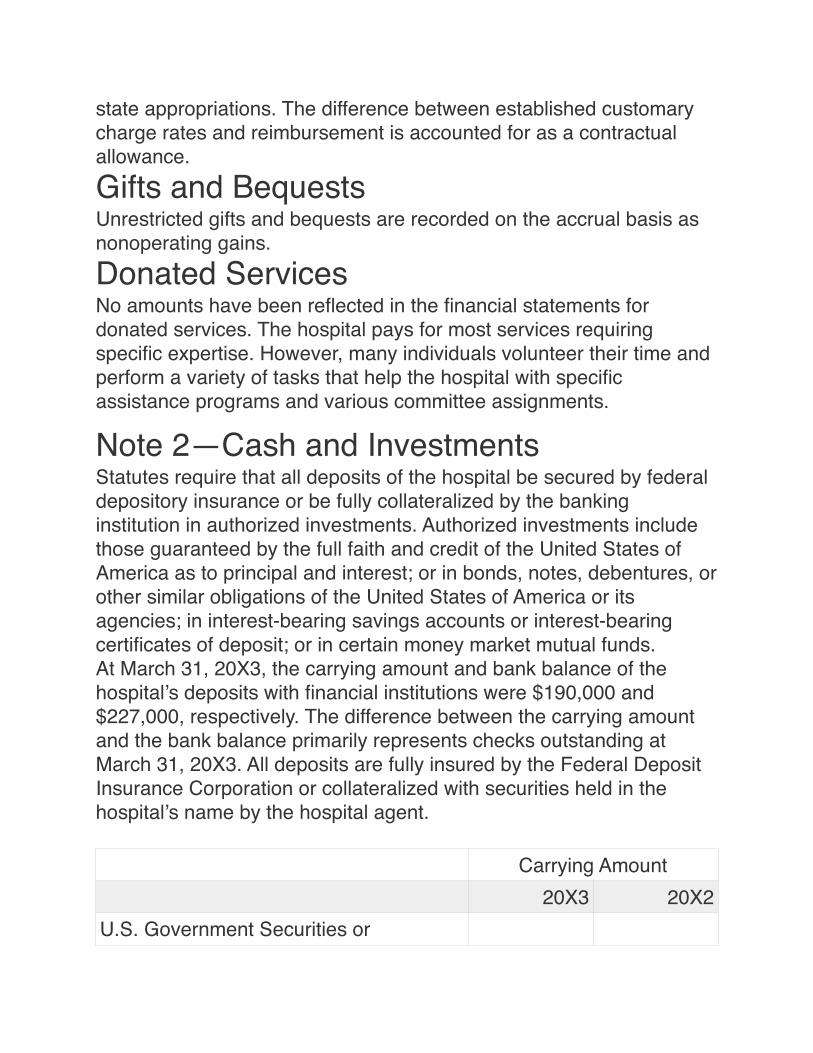
Note 2—Cash and InvestmentsStatutes require that all deposits of the hospital be secured by federal depository insurance or be fully collateralized by the banking institution in authorized investments. Authorized investments include those guaranteed by the full faith and credit of the United States of America as to principal and interest; or in bonds, notes, debentures, or other similar obligations of the United States of America or its agencies; in interest-bearing savings accounts or interest-bearing certificates of deposit; or in certain money market mutual funds.At March 31, 20X3, the carrying amount and bank balance of the hospital’s deposits with financial institutions were $190,000 and $227,000, respectively. The difference between the carrying amount and the bank balance primarily represents checks outstanding at March 31, 20X3. All deposits are fully insured by the Federal Deposit Insurance Corporation or collateralized with securities held in the hospital’s name by the hospital agent.
Carrying Amount20X3 20X2
U.S. Government Securities or
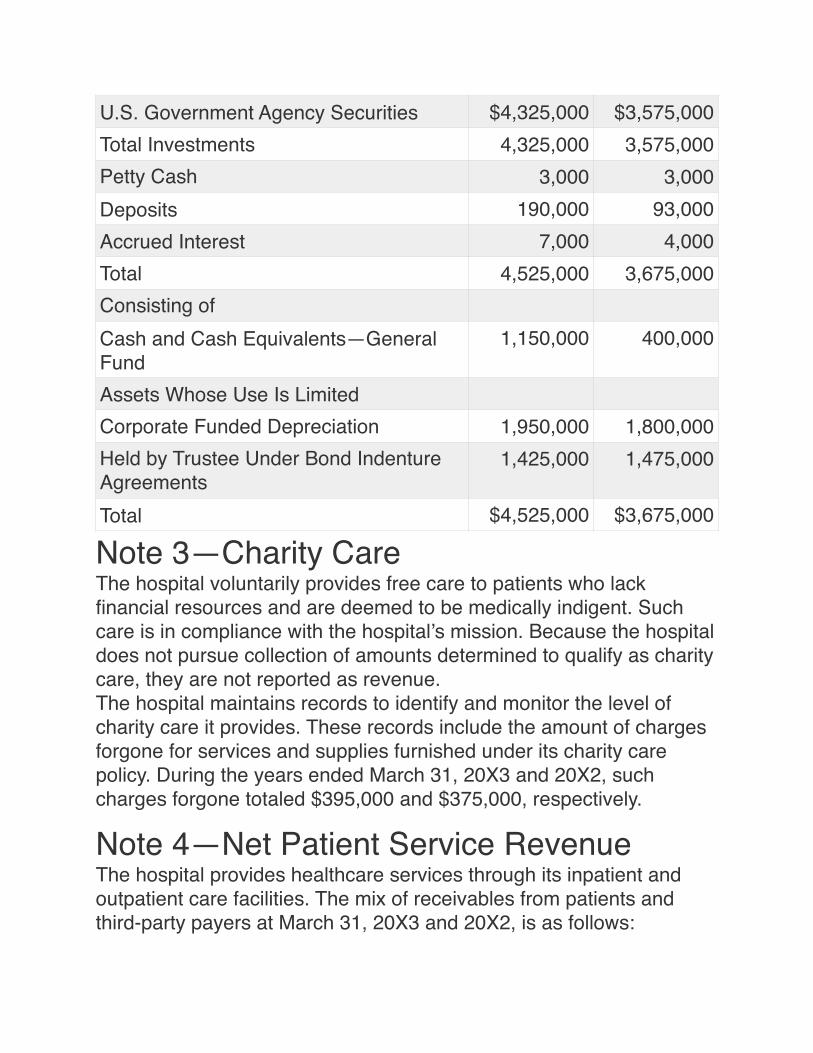
Note 3—Charity CareThe hospital voluntarily provides free care to patients who lack financial resources and are deemed to be medically indigent. Such care is in compliance with the hospital’s mission. Because the hospital does not pursue collection of amounts determined to qualify as charity care, they are not reported as revenue.The hospital maintains records to identify and monitor the level of charity care it provides. These records include the amount of charges forgone for services and supplies furnished under its charity care policy. During the years ended March 31, 20X3 and 20X2, such charges forgone totaled $395,000 and $375,000, respectively.
Note 4—Net Patient Service RevenueThe hospital provides healthcare services through its inpatient and outpatient care facilities. The mix of receivables from patients and third-party payers at March 31, 20X3 and 20X2, is as follows:
U.S. Government Agency Securities $4,325,000 $3,575,000Total Investments 4,325,000 3,575,000Petty Cash 3,000 3,000Deposits 190,000 93,000Accrued Interest 7,000 4,000Total 4,525,000 3,675,000Consisting ofCash and Cash Equivalents—General Fund
1,150,000 400,000
Assets Whose Use Is LimitedCorporate Funded Depreciation 1,950,000 1,800,000Held by Trustee Under Bond Indenture Agreements
1,425,000 1,475,000
Total $4,525,000 $3,675,000
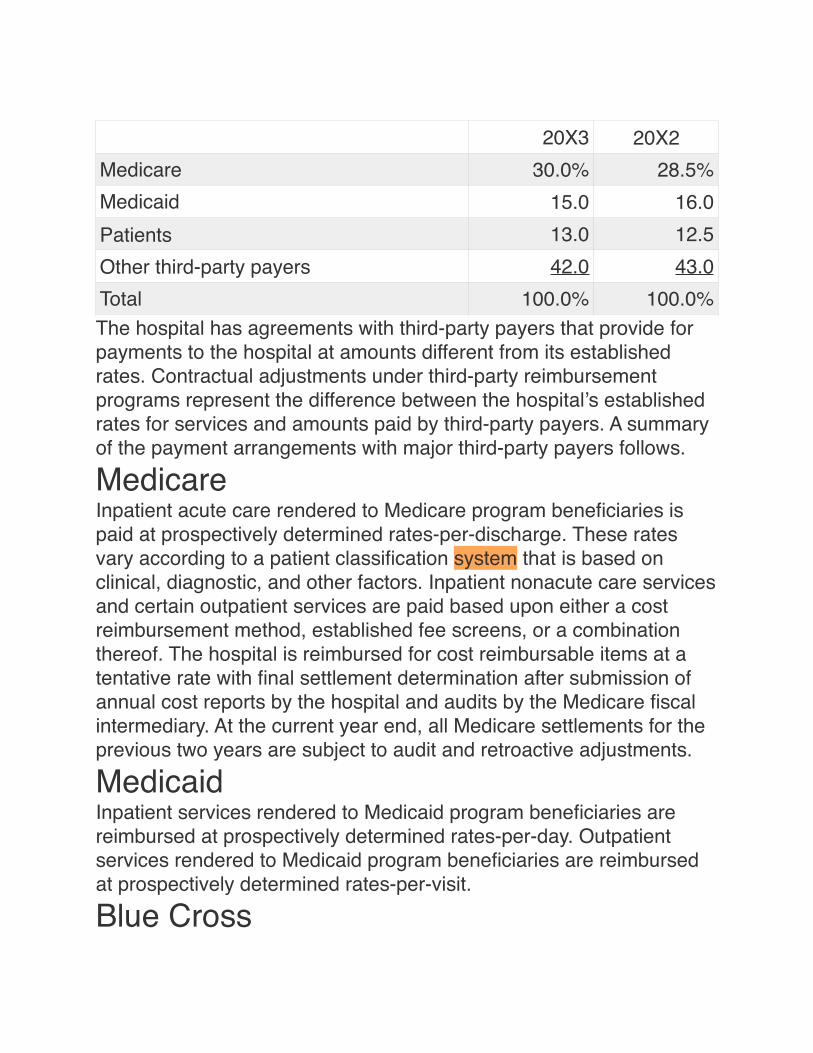
The hospital has agreements with third-party payers that provide for payments to the hospital at amounts different from its established rates. Contractual adjustments under third-party reimbursement programs represent the difference between the hospital’s established rates for services and amounts paid by third-party payers. A summary of the payment arrangements with major third-party payers follows.
MedicareInpatient acute care rendered to Medicare program beneficiaries is paid at prospectively determined rates-per-discharge. These rates vary according to a patient classification system that is based on clinical, diagnostic, and other factors. Inpatient nonacute care services and certain outpatient services are paid based upon either a cost reimbursement method, established fee screens, or a combination thereof. The hospital is reimbursed for cost reimbursable items at a tentative rate with final settlement determination after submission of annual cost reports by the hospital and audits by the Medicare fiscal intermediary. At the current year end, all Medicare settlements for the previous two years are subject to audit and retroactive adjustments.
MedicaidInpatient services rendered to Medicaid program beneficiaries are reimbursed at prospectively determined rates-per-day. Outpatient services rendered to Medicaid program beneficiaries are reimbursed at prospectively determined rates-per-visit.
Blue Cross
20X3 20X2Medicare 30.0% 28.5%Medicaid 15.0 16.0Patients 13.0 12.5Other third-party payers 42.0 43.0Total 100.0% 100.0%
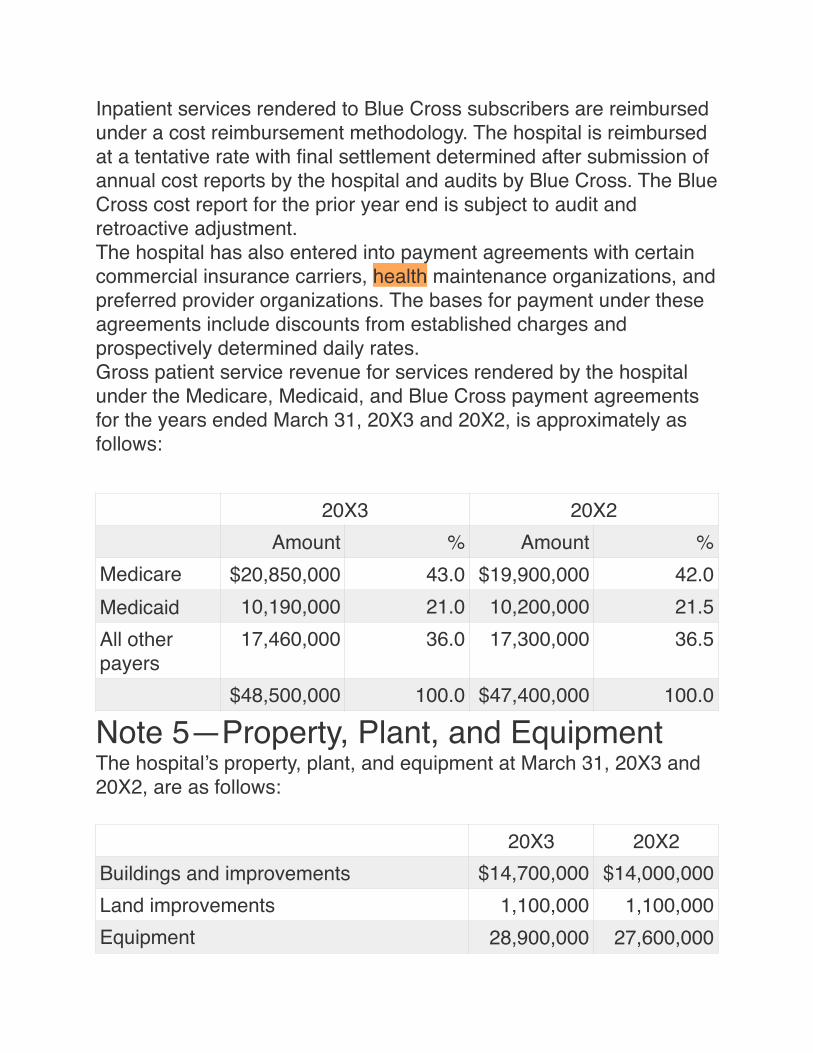
Inpatient services rendered to Blue Cross subscribers are reimbursed under a cost reimbursement methodology. The hospital is reimbursed at a tentative rate with final settlement determined after submission of annual cost reports by the hospital and audits by Blue Cross. The Blue Cross cost report for the prior year end is subject to audit and retroactive adjustment.The hospital has also entered into payment agreements with certain commercial insurance carriers, health maintenance organizations, and preferred provider organizations. The bases for payment under these agreements include discounts from established charges and prospectively determined daily rates.Gross patient service revenue for services rendered by the hospital under the Medicare, Medicaid, and Blue Cross payment agreements for the years ended March 31, 20X3 and 20X2, is approximately as follows:
Note 5—Property, Plant, and EquipmentThe hospital’s property, plant, and equipment at March 31, 20X3 and 20X2, are as follows:
20X3 20X2Amount % Amount %
Medicare $20,850,000 43.0 $19,900,000 42.0Medicaid 10,190,000 21.0 10,200,000 21.5All other payers
17,460,000 36.0 17,300,000 36.5
$48,500,000 100.0 $47,400,000 100.0
20X3 20X2Buildings and improvements $14,700,000 $14,000,000Land improvements 1,100,000 1,100,000Equipment 28,900,000 27,600,000
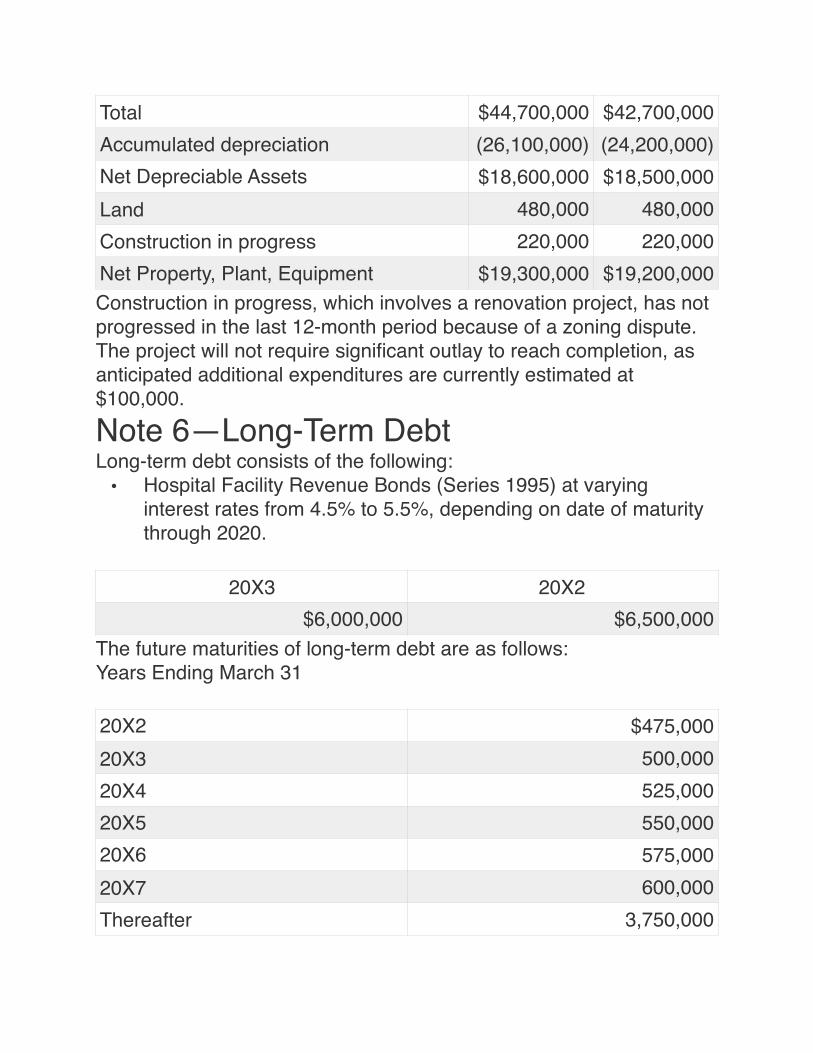
Construction in progress, which involves a renovation project, has not progressed in the last 12-month period because of a zoning dispute. The project will not require significant outlay to reach completion, as anticipated additional expenditures are currently estimated at $100,000.
Note 6—Long-Term DebtLong-term debt consists of the following:
• Hospital Facility Revenue Bonds (Series 1995) at varying interest rates from 4.5% to 5.5%, depending on date of maturity through 2020.
The future maturities of long-term debt are as follows:Years Ending March 31
Total $44,700,000 $42,700,000Accumulated depreciation (26,100,000) (24,200,000)Net Depreciable Assets $18,600,000 $18,500,000Land 480,000 480,000Construction in progress 220,000 220,000Net Property, Plant, Equipment $19,300,000 $19,200,000
20X3 20X2$6,000,000 $6,500,000
20X2 $475,00020X3 500,00020X4 525,00020X5 550,00020X6 575,00020X7 600,000Thereafter 3,750,000
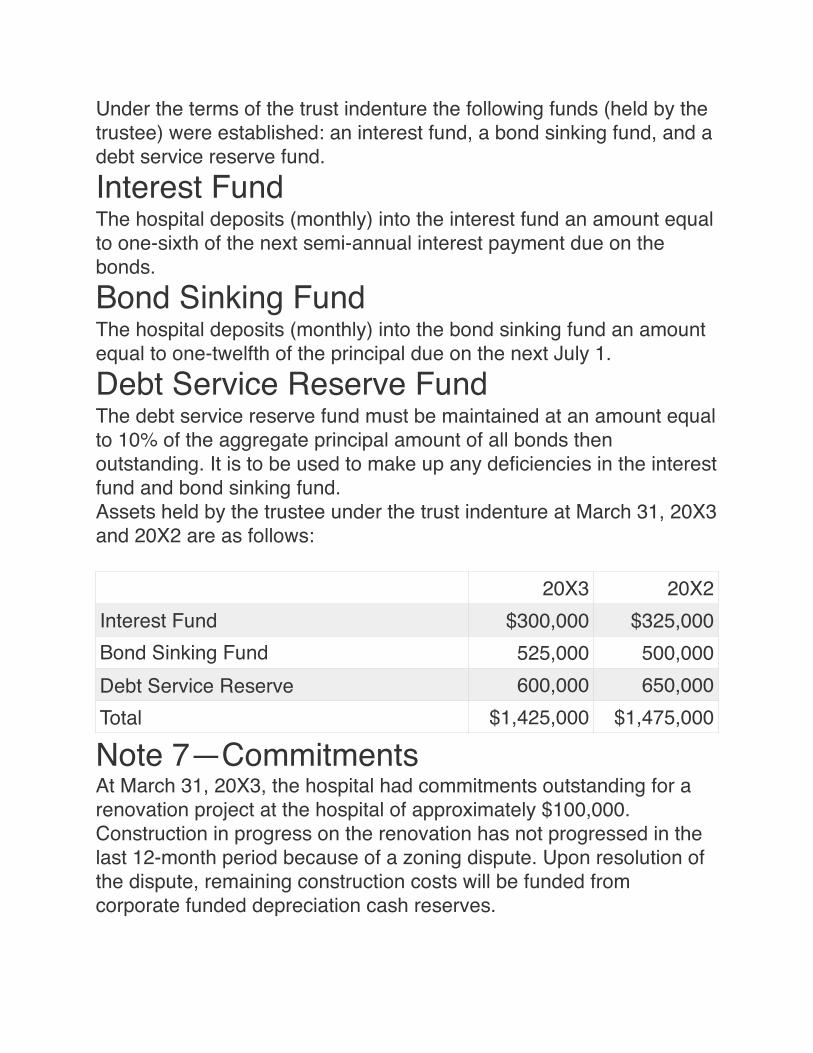
Under the terms of the trust indenture the following funds (held by the trustee) were established: an interest fund, a bond sinking fund, and a debt service reserve fund.Interest FundThe hospital deposits (monthly) into the interest fund an amount equal to one-sixth of the next semi-annual interest payment due on the bonds.Bond Sinking FundThe hospital deposits (monthly) into the bond sinking fund an amount equal to one-twelfth of the principal due on the next July 1.Debt Service Reserve FundThe debt service reserve fund must be maintained at an amount equal to 10% of the aggregate principal amount of all bonds then outstanding. It is to be used to make up any deficiencies in the interest fund and bond sinking fund.Assets held by the trustee under the trust indenture at March 31, 20X3 and 20X2 are as follows:
Note 7—CommitmentsAt March 31, 20X3, the hospital had commitments outstanding for a renovation project at the hospital of approximately $100,000. Construction in progress on the renovation has not progressed in the last 12-month period because of a zoning dispute. Upon resolution of the dispute, remaining construction costs will be funded from corporate funded depreciation cash reserves.
20X3 20X2Interest Fund $300,000 $325,000Bond Sinking Fund 525,000 500,000Debt Service Reserve 600,000 650,000Total $1,425,000 $1,475,000
APPENDIX 28-B Comparative Analysis Using Financial Ratios and Benchmarking Helps Turn Around a Hospital in the Metropolis Health SystemSample General Hospital is another facility within the Metropolis Health System. Sample General Hospital has recently been acquired by Metropolis. It is a 100-bed hospital that has been losing money steadily over the last several years. The new chief financial officer (CFO) has decided to use benchmarking as an aid to turn around Sample’s financial situation. Benchmarking will illustrate where the hospital stands in relationship to its peer group.The CFO orders two benchmarking reports: one for the hospitals that are 100 beds or less and one for all hospitals, no matter the size. The 100-beds-or-less report will allow direct comparability for Sample, while the all-hospital report will give a universal or overall view of Sample’s standing. Both reports appear at the end of this case study. Exhibit 28-B–1 is the benchmark data report for Sample General Hospital compared with hospitals less than 100 beds, whereas Exhibit 28-B–2 is the benchmark data report for Sample General Hospital compared with all hospitals.When the reports arrive, the CFO writes a description of how the data are arranged so that his managers will better understand the information presented. His description includes the following points:
• 1. The percentile rankings are intended to present the hospital’s performance ranked against all other performers in the comparison group. Whether the hospital’s actual performance is good or bad depends on the statistic being evaluated.
• 2. The first column, labeled “Annual Average Year 1,” provides a historical trend of actual performance of the hospital in the previous year. It is provided for reference only so that the reader can see the trend over time.
• 3. The column labeled “Q1 Year 2” represents the first quarter of the current year. These are the most recent data that this service
has been provided for Sample General Hospital and are the data used in the comparison columns that follow.
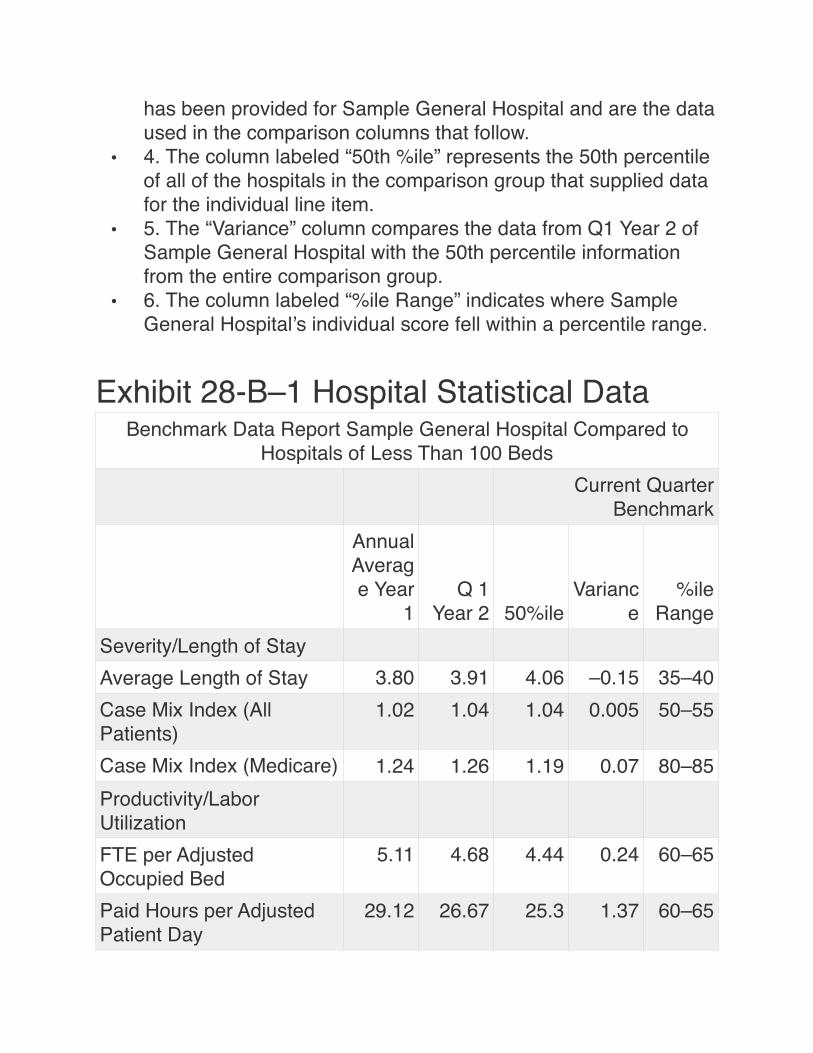
• 4. The column labeled “50th %ile” represents the 50th percentile of all of the hospitals in the comparison group that supplied data for the individual line item.
• 5. The “Variance” column compares the data from Q1 Year 2 of Sample General Hospital with the 50th percentile information from the entire comparison group.
• 6. The column labeled “%ile Range” indicates where Sample General Hospital’s individual score fell within a percentile range.
Exhibit 28-B–1 Hospital Statistical DataBenchmark Data Report Sample General Hospital Compared to
Hospitals of Less Than 100 BedsCurrent Quarter
BenchmarkAnnual Average Year
1Q 1
Year 2 50%ileVarianc
e%ile
RangeSeverity/Length of StayAverage Length of Stay 3.80 3.91 4.06 –0.15 35–40Case Mix Index (All Patients)
1.02 1.04 1.04 0.005 50–55
Case Mix Index (Medicare) 1.24 1.26 1.19 0.07 80–85Productivity/Labor UtilizationFTE per Adjusted Occupied Bed
5.11 4.68 4.44 0.24 60–65
Paid Hours per Adjusted Patient Day
29.12 26.67 25.3 1.37 60–65
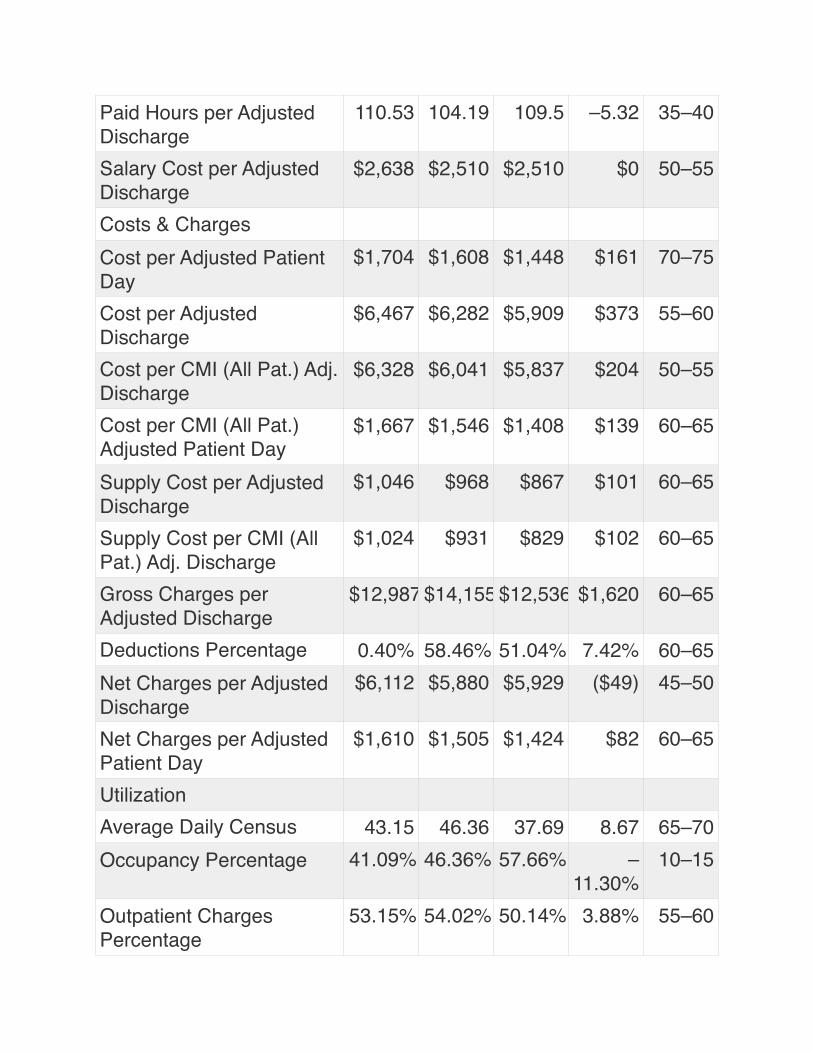
Paid Hours per Adjusted Discharge
110.53 104.19 109.5 –5.32 35–40
Salary Cost per Adjusted Discharge
$2,638 $2,510 $2,510 $0 50–55
Costs & ChargesCost per Adjusted Patient Day
$1,704 $1,608 $1,448 $161 70–75
Cost per Adjusted Discharge
$6,467 $6,282 $5,909 $373 55–60
Cost per CMI (All Pat.) Adj. Discharge
$6,328 $6,041 $5,837 $204 50–55
Cost per CMI (All Pat.) Adjusted Patient Day
$1,667 $1,546 $1,408 $139 60–65
Supply Cost per Adjusted Discharge
$1,046 $968 $867 $101 60–65
Supply Cost per CMI (All Pat.) Adj. Discharge
$1,024 $931 $829 $102 60–65
Gross Charges per Adjusted Discharge
$12,987 $14,155 $12,536 $1,620 60–65
Deductions Percentage 0.40% 58.46% 51.04% 7.42% 60–65Net Charges per Adjusted Discharge
$6,112 $5,880 $5,929 ($49) 45–50
Net Charges per Adjusted Patient Day
$1,610 $1,505 $1,424 $82 60–65
UtilizationAverage Daily Census 43.15 46.36 37.69 8.67 65–70Occupancy Percentage 41.09% 46.36% 57.66% –
11.30%10–15
Outpatient Charges Percentage
53.15% 54.02% 50.14% 3.88% 55–60
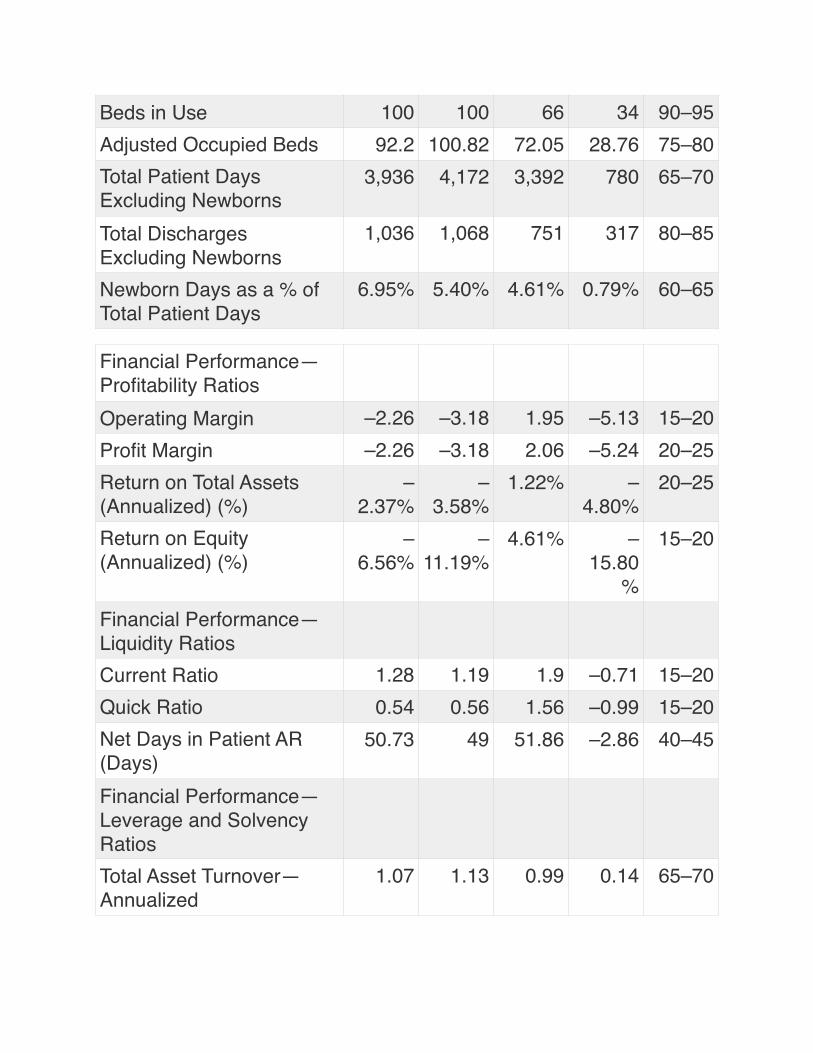
Beds in Use 100 100 66 34 90–95Adjusted Occupied Beds 92.2 100.82 72.05 28.76 75–80Total Patient Days Excluding Newborns
3,936 4,172 3,392 780 65–70
Total Discharges Excluding Newborns
1,036 1,068 751 317 80–85
Newborn Days as a % of Total Patient Days
6.95% 5.40% 4.61% 0.79% 60–65
Financial Performance—Profitability RatiosOperating Margin –2.26 –3.18 1.95 –5.13 15–20Profit Margin –2.26 –3.18 2.06 –5.24 20–25Return on Total Assets (Annualized) (%)
–2.37%
–3.58%
1.22% –4.80%
20–25
Return on Equity (Annualized) (%)
–6.56%
–11.19%
4.61% –15.80
%
15–20
Financial Performance—Liquidity RatiosCurrent Ratio 1.28 1.19 1.9 –0.71 15–20Quick Ratio 0.54 0.56 1.56 –0.99 15–20Net Days in Patient AR (Days)
50.73 49 51.86 –2.86 40–45
Financial Performance—Leverage and Solvency RatiosTotal Asset Turnover—Annualized
1.07 1.13 0.99 0.14 65–70
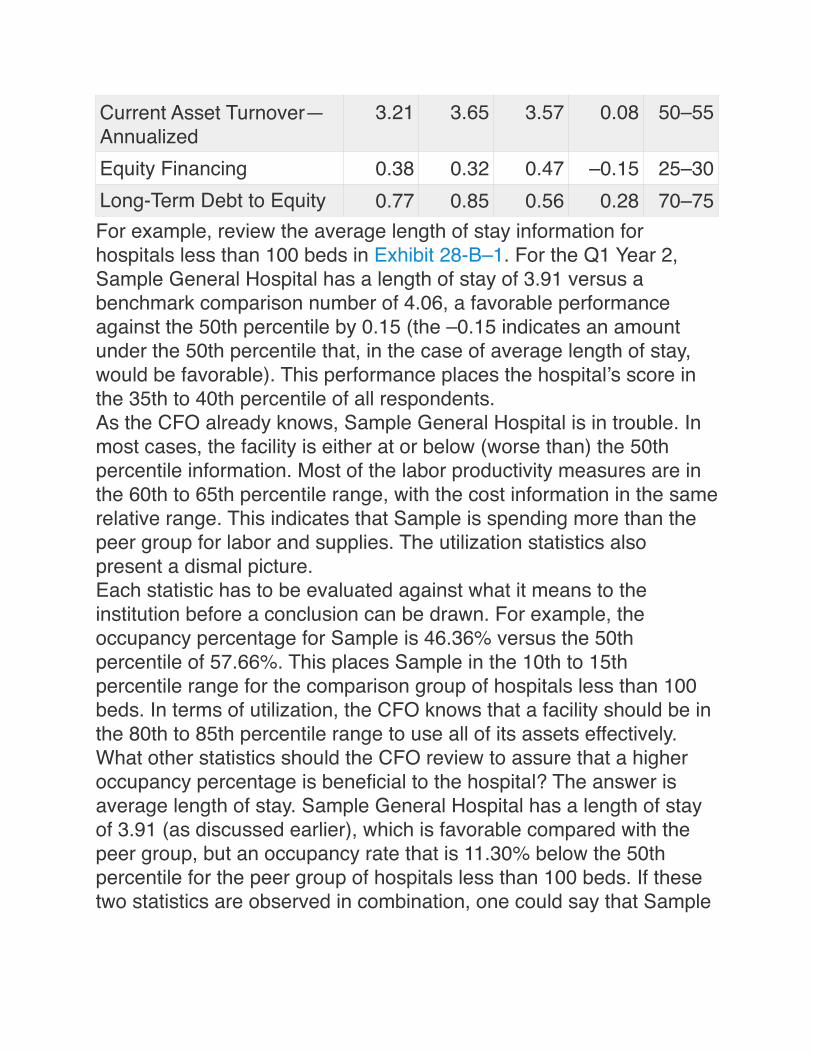
For example, review the average length of stay information for hospitals less than 100 beds in Exhibit 28-B–1. For the Q1 Year 2, Sample General Hospital has a length of stay of 3.91 versus a benchmark comparison number of 4.06, a favorable performance against the 50th percentile by 0.15 (the –0.15 indicates an amount under the 50th percentile that, in the case of average length of stay, would be favorable). This performance places the hospital’s score in the 35th to 40th percentile of all respondents.As the CFO already knows, Sample General Hospital is in trouble. In most cases, the facility is either at or below (worse than) the 50th percentile information. Most of the labor productivity measures are in the 60th to 65th percentile range, with the cost information in the same relative range. This indicates that Sample is spending more than the peer group for labor and supplies. The utilization statistics also present a dismal picture.Each statistic has to be evaluated against what it means to the institution before a conclusion can be drawn. For example, the occupancy percentage for Sample is 46.36% versus the 50th percentile of 57.66%. This places Sample in the 10th to 15th percentile range for the comparison group of hospitals less than 100 beds. In terms of utilization, the CFO knows that a facility should be in the 80th to 85th percentile range to use all of its assets effectively.What other statistics should the CFO review to assure that a higher occupancy percentage is beneficial to the hospital? The answer is average length of stay. Sample General Hospital has a length of stay of 3.91 (as discussed earlier), which is favorable compared with the peer group, but an occupancy rate that is 11.30% below the 50th percentile for the peer group of hospitals less than 100 beds. If these two statistics are observed in combination, one could say that Sample
Current Asset Turnover—Annualized
3.21 3.65 3.57 0.08 50–55
Equity Financing 0.38 0.32 0.47 –0.15 25–30Long-Term Debt to Equity 0.77 0.85 0.56 0.28 70–75
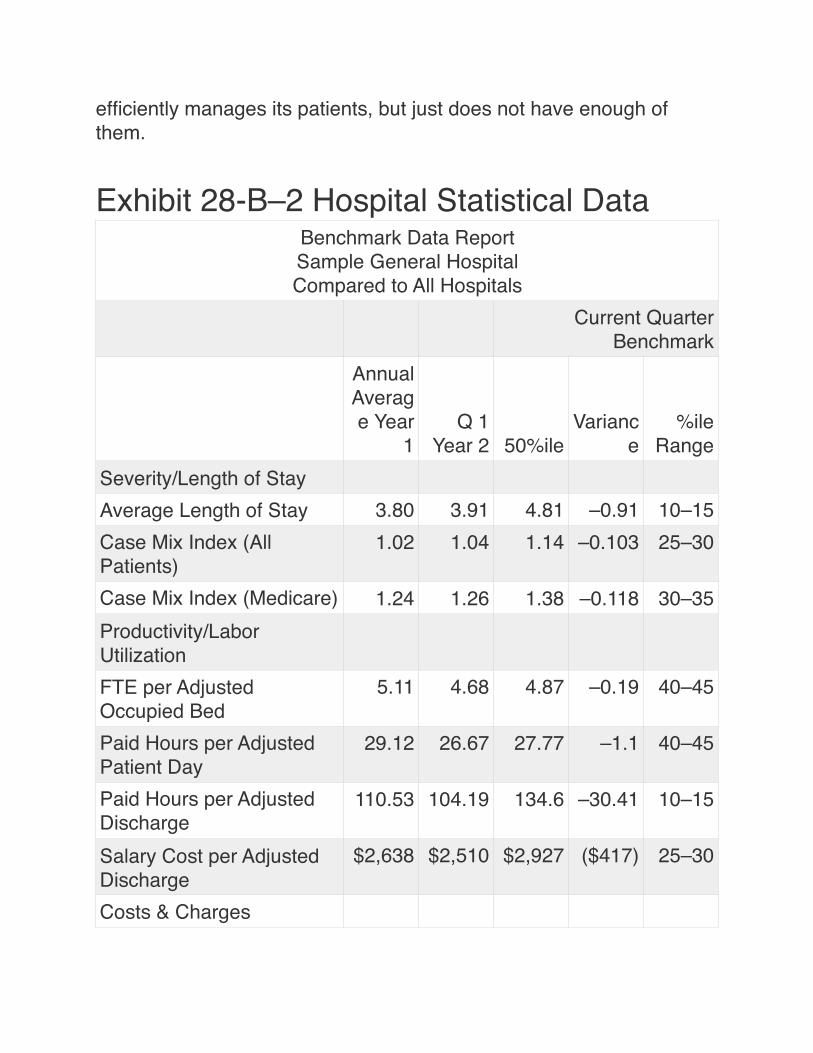
efficiently manages its patients, but just does not have enough of them.
Exhibit 28-B–2 Hospital Statistical DataBenchmark Data ReportSample General HospitalCompared to All Hospitals
Current Quarter Benchmark
Annual Average Year
1Q 1
Year 2 50%ileVarianc
e%ile
RangeSeverity/Length of StayAverage Length of Stay 3.80 3.91 4.81 –0.91 10–15Case Mix Index (All Patients)
1.02 1.04 1.14 –0.103 25–30
Case Mix Index (Medicare) 1.24 1.26 1.38 –0.118 30–35Productivity/Labor UtilizationFTE per Adjusted Occupied Bed
5.11 4.68 4.87 –0.19 40–45
Paid Hours per Adjusted Patient Day
29.12 26.67 27.77 –1.1 40–45
Paid Hours per Adjusted Discharge
110.53 104.19 134.6 –30.41 10–15
Salary Cost per Adjusted Discharge
$2,638 $2,510 $2,927 ($417) 25–30
Costs & Charges
Cost per Adjusted Patient Day
$1,704 $1,608 $1,530 $78 60–65
Cost per Adjusted Discharge
$6,467 $6,282 $7,284 ($1,001) 30–35
Cost per CMI (All Pat.) Adj. Discharge
$6,328 $6,041 $6,115 ($74) 45–50
Cost per CMI (All Pat.) Adjusted Patient Day
$1,667 $1,546 $1,268 $278 80–85
Supply Cost per Adjusted Discharge
$1,046 $968 $1,250 ($282) 25–30
Supply Cost per CMI (All Pat.) Adj. Discharge
$1,024 $931 $1,069 ($138) 30–35
Gross Charges per Adjusted Discharge
$12,987 $14,155 $17,196 ($3,041) 35–40
Deductions Percentage 0.40% 58.46% 56.31% 2.15% 55–60Net Charges per Adjusted Discharge
$6,112 $5,880 $7,419 ($1,539) 20–25
Net Charges per Adjusted Patient Day
$1,610 $1,505 $1,529 ($24) 45–50
UtilizationAverage Daily Census 43.15 46.36 142.98 –96.62 15–20Occupancy Percentage 41.09% 46.36% 69.38% –
23.02%
< 5
Outpatient Charges Percentage
53.15% 54.02% 39.64% 14.38% 85–90
Beds in Use 100 100 206 –106 20–25Adjusted Occupied Beds 92.2 100.82 225.9 –
125.0915–20
Total Patient Days Excluding Newborns
3,936 4,172 12,868 –8,696 15–20
Total Discharges Excluding Newborns
1,036 1,068 2,506 –1,438 20–25
Newborn Days as a % of Total Patient Days
6.95% 5.40% 4.52% 0.87% 60–65
Financial Performance—Profitability RatiosOperating Margin –2.26 –3.18 4.45 –7.63 10–15Profit Margin –2.26 –3.18 4.66 –7.84 10–15Return on Total Assets (Annualized) (%)
–2.37%
–3.58%
4.04% –7.62%
10–15
Return on Equity (Annualized) (%)
–6.56%
–11.19%
8.46% –19.65
%
5–10
Financial Performance—Liquidity RatiosCurrent Ratio 1.28 1.19 2.2 –1 10–15Quick Ratio 0.54 0.56 1.74 –1.18 5–10Net Days in Patient AR (Days)
50.73 49 55.76 –6.77 25–30
Financial Performance—Leverage and Solvency RatiosTotal Asset Turnover—Annualized
1.07 1.13 0.93 0.2 70–75
Current Asset Turnover—Annualized
3.21 3.65 3.48 0.18 50–55
Equity Financing 0.38 0.32 0.5 –0.18 20–25
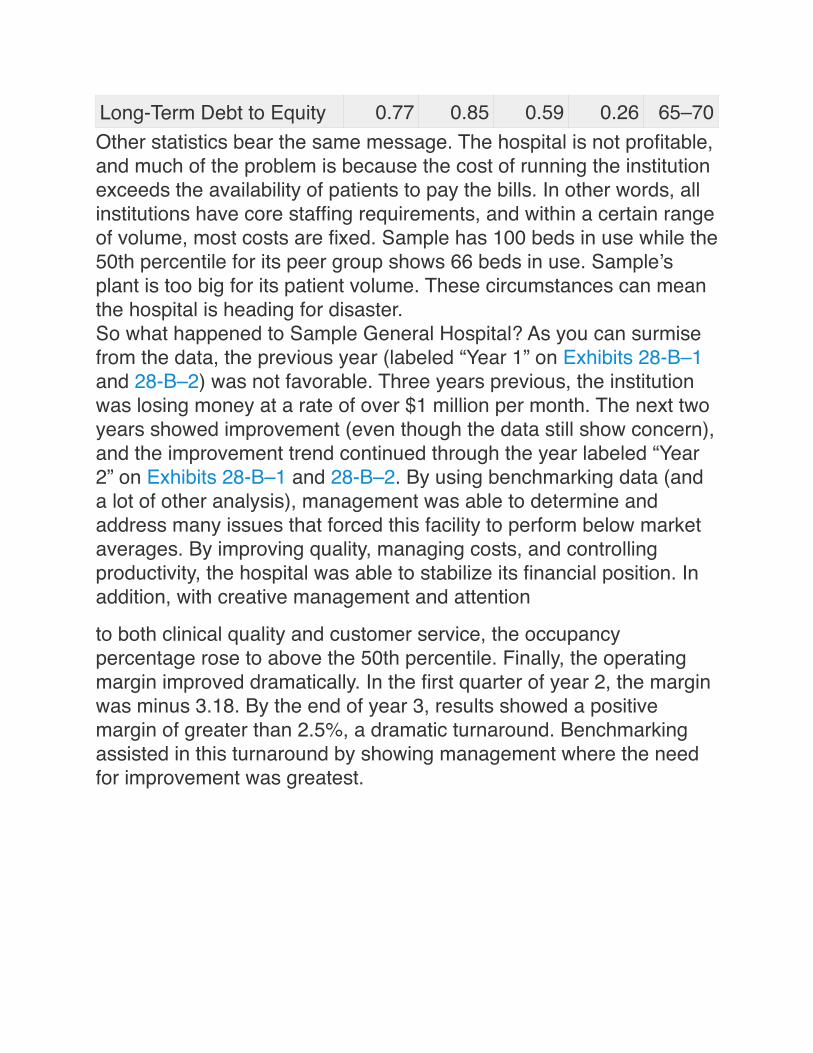
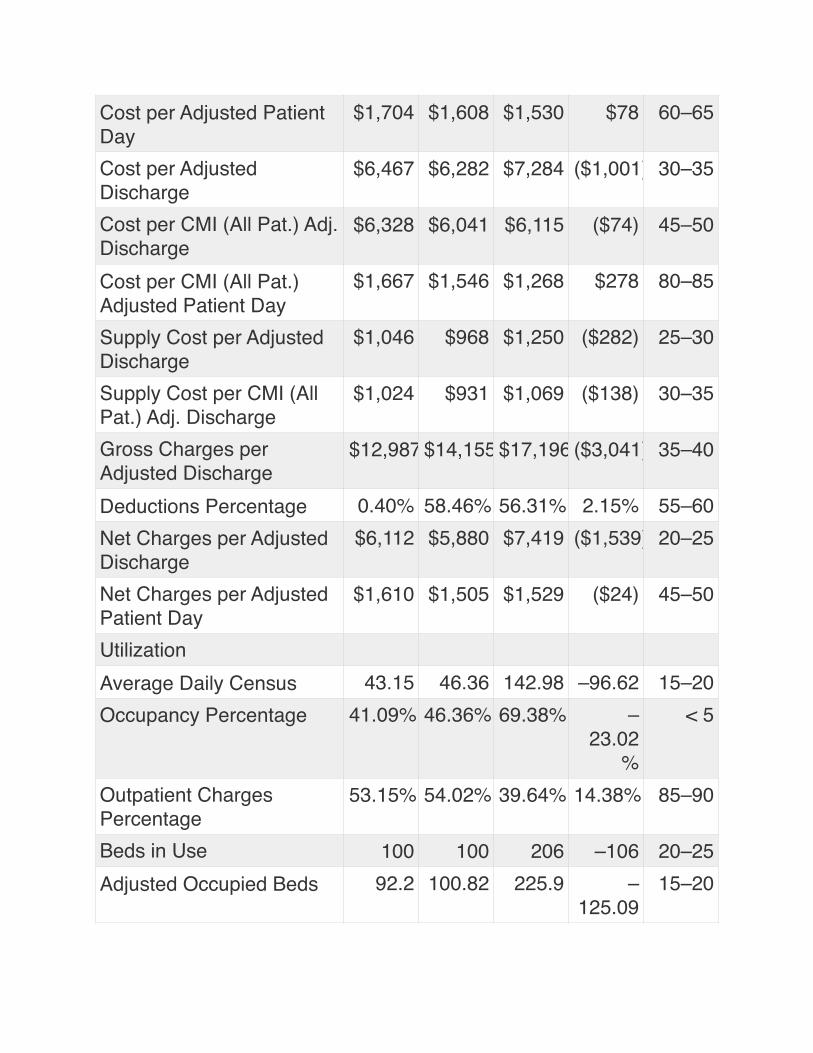
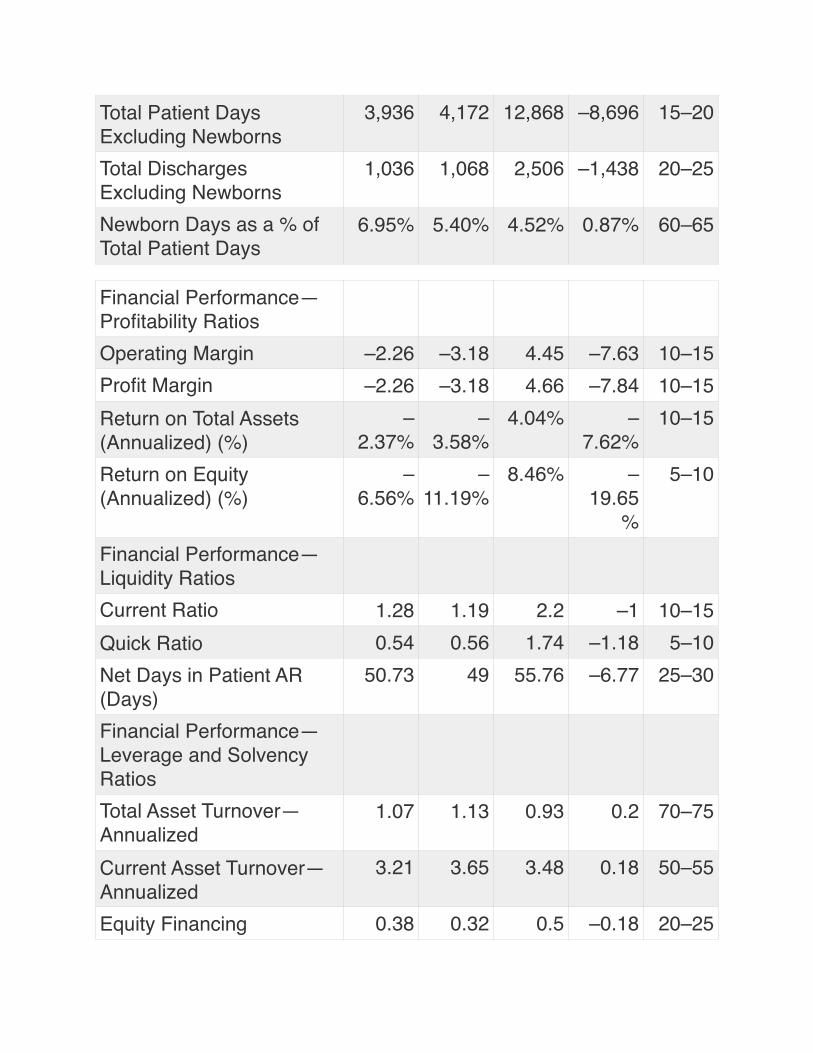
Other statistics bear the same message. The hospital is not profitable, and much of the problem is because the cost of running the institution exceeds the availability of patients to pay the bills. In other words, all institutions have core staffing requirements, and within a certain range of volume, most costs are fixed. Sample has 100 beds in use while the 50th percentile for its peer group shows 66 beds in use. Sample’s plant is too big for its patient volume. These circumstances can mean the hospital is heading for disaster.So what happened to Sample General Hospital? As you can surmise from the data, the previous year (labeled “Year 1” on Exhibits 28-B–1 and 28-B–2) was not favorable. Three years previous, the institution was losing money at a rate of over $1 million per month. The next two years showed improvement (even though the data still show concern), and the improvement trend continued through the year labeled “Year 2” on Exhibits 28-B–1 and 28-B–2. By using benchmarking data (and a lot of other analysis), management was able to determine and address many issues that forced this facility to perform below market averages. By improving quality, managing costs, and controlling productivity, the hospital was able to stabilize its financial position. In addition, with creative management and attention
to both clinical quality and customer service, the occupancy percentage rose to above the 50th percentile. Finally, the operating margin improved dramatically. In the first quarter of year 2, the margin was minus 3.18. By the end of year 3, results showed a positive margin of greater than 2.5%, a dramatic turnaround. Benchmarking assisted in this turnaround by showing management where the need for improvement was greatest.
Long-Term Debt to Equity 0.77 0.85 0.59 0.26 65–70


