Embed Size (px)
Citation preview
Department of Chemistry
PhD Course in Industrial Chemistry, XXVIII Cycle
Microbial Induced Reinforced
Concrete Degradation and
Innovative Protection Techniques
Enrico Volpi
Matr. n. R10086
Tutor: Dr. Stefano TRASATTI
Co-tutor: Dr. Pierangela CRISTIANI
Coordinator: Prof. Maddalena PIZZOTTI
2015


I
Table of contents

II
Table of contents I
Acknowledgements VI
List of Figures VII
List of Tables X
List of Abbreviations XI
Summary 1
1. Introduction 3
1.1 The challenge of a new project 4
1.2 Setup of the concrete laboratory 6
1.2.1 Construction of the accelerated carbonation chamber 8
1.2.2 Construction of the electrochemical probe 9
1.3 Motivation for research 11
1.4 Objective of the thesis 12
1.5 Outline of the thesis 12
2. Literature study 17
2.1 Concrete 18
2.1.1 History of concrete 18
2.1.2 Portland cement 20
2.1.3 Cement hydration 22
2.1.4 Structure of the hydrated cement paste 22
2.2 Durability of concrete structures 24
2.2.1 Acid attack 25
2.2.2 Sulfate attack 26
2.2.3 Alkali-Silica reaction 27
2.2.4 Freezing and thawing 27
2.2.5 Carbonation 27
2.3 Microbial deterioration of RC structures 28
2.3.1 Mechanism 28
2.3.2 Sulfate reducing bacteria 30
2.3.3 Sulfur oxidizing bacteria 31
2.3.4 Chemical, microbiological, and in situ test methods 31
III
2.3.5 Measures for control 35
2.4 Corrosion of steel in concrete 36
2.4.1 The corrosion process 36
2.4.2 Chloride attack 41
2.4.3 Corrosion monitoring techniques 42
Open circuit potential measurements 42
Concrete resistivity 44
Linear polarization resistance 45
Tafel extrapolation 47
Electrochemical impedance spectroscopy 48
2.4.4 Prevention and remediation 49
References 52
3. Steel passivation in alkaline solutions simulating the concrete environment
3.1 Introduction 58
3.2 Experimental 59
3.2.1 Materials and testing environment 59
3.2.2 Steel metallographic characterization 59
3.2.3 Electrochemical setup 60
3.2.4 Cyclic voltammetry 60
3.2.5 Potentiodynamic polarization, linear polarization resistance and impedance
spectroscopy 61
3.3 Results and discussion 61
3.3.1 Steel metallographic characterization 61
3.3.2 Cyclovoltammetric characterization 64
Cyclic voltammetry in 1M NaOH and saturated Ca(OH)2
Effect of the scanned potential window 66
64
Effect of variation of the anodic limit 68
Effect of anodic pre-polarization at -0.14 V vs SCE 69
Effect of cathodic pre-polarization at -1.5 V vs SCE 71
Effect of long term cycling 72
3.3.3 Effect of passivation time 73
Anodic polarizations 73
OCP and LPR monitoring 75

IV
EIS measurements 76
3.4 Conclusions 79
References 81
4. Corrosion susceptibility in solutions simulating bacteria metabolites 85
4.1 Introduction 86
4.2 Experimental 87
4.2.1 Materials and testing environment 87
Metallic coupons 87
Reinforced mortar samples 87
4.2.2 Testing and electrochemical monitoring 88
Steel samples in simulated solutions 88
Reinforced mortar samples 89
4.3 Results and discussion 89
4.3.1 Steel samples in model solution 89
Weight loss measurements 89
Open circuit potential monitoring 93
Anodic potentiodynamic polarizations: sulfuric acid 96
Anodic potentiodynamic polarizations: sulfides 99
4.3.2 Reinforced mortar samples 107
Open circuit potental measurements 109
LPR and EIS monitoring 110
4.4 Conclusions 122
References 123
5. Development of “smart” corrosion inhibitors for steel protection from MICC
5.1 Introduction 128
5.2 Experimental 129
5.2.1 Materials and testing environment 129
5.2.2 Electrochemical measurements 130
5.2.3 Synthesis 130
5.2.4 Characterization 130
5.3 Results and discussion 131
5.3.1 Inhibitor screening 131

V
5.3.2 Characterization of the hybrid inhibitive systems 141
5.3.3 Steel response in model medium in the presence of MBD-HAP 148
Acidic environment 148
Alkaline environment 157
5.4 Conclusions 163
References 164
6. Preliminary tests of the "Smart" inhibitors in the cementitious matrix 167
6.1 Introduction 168
6.2 Experimental 168
6.2.1 Materials and samples 168
6.2.2 Calorimetric measurements 169
6.2.3 Standard compressive strength tests 170
6.2.4 Conditioning and OCP monitoring 170
6.2.5 ESEM observations 171
6.3 Results and discussion 171
6.3.1 Effects on the cementitious matrix properties 171
6.3.2 Effects on steel rebars embedded in mortar 175
6.4 Conclusions 181
References 183
7. General conclusions and perspectives 185
7.1 Conclusions 186
7.2 Perspectives 189
VI
List of Figures: Fig. 1.1: Concrete lab equipment: mixer devices. Fig. 1.2: Concrete lab equipment: compaction devices. Fig. 1.3: Concrete lab equipment: workability testing devices. Fig. 1.4: Construction phases of the accelerated carbonation chamber. Fig. 1.5: Accelerated carbonation chamber: the control panel. Fig.1.6: Scheme and picture of the homemade carbonation chamber. Fig. 1.7: Schematic of the probe for electrochemical measurements on reinforced
mortar samples. Fig. 1.8: Flow chart of the thesis.
Fig. 2.1: Pantheon, Rome. (I cen. d.C.) Fig. 2.2: Caracalla baths, Rome. (III cen. d.C.) Fig. 2.3: Eddystone lighthouse. Fig. 2.4: Lambot's reinforced cement boat. Fig.2.5: Pore size distribution in hydrated cement paste. Fig. 2.6: Relation between the water/cement ratio and the hydration degree at which
the capillary pore are blocked Fig. 2.7: Relationship between permeability and w/c ratio for mature cement pastes. Fig. 2.8: Evolution of bacteria population: pH and weight loss over time. Fig.2.9: Schematic mechanism of MICC in a sewer pipe. Fig. 2.10: Simulating chambers for microbial deterioration testing. Fig.2.11: Pourbaix diagram for Fe - H2
Fig. 2.12: Schematic of the corrosion mechanism for steel in concrete. O systems.
Fig. 2.13: Volumetric expansion of corrosion products formed in concrete. Fig. 2.14: Cracks evolution in corroding reinforced concrete. Fig. 2.15: Fib model for RC structure service life. Fig. 2.16: Schematic of an apparatus for OCP measurement of reinforced concrete. Fig. 2.17: Example of an equipotential contour map. Fig. 2.18: Schematic of a Wenner probe, for concrete resistivity measurements. Fig. 2.19: Schematic of an LPR measurement arrangement. Fig. 2.20: Determination of the corrosion current from a Tafel plot. Fig. 2.21: Nyquist plot of a reinforced concrete sample. Fig. 2.22: Schematic of different concrete surface protection techniques. Fig. 3.1: Picture of the B450C steel sample for electrochemical measurements. Fig. 3.2: Macroscopic picture of the B450C steel surface, after 5% Nital etching. Fig. 3.3: Optical microscopy pictures of the B450C steel surface, after 5% Nital
etching. Fig. 3.4: Principle of Tempcore process. Fig. 3.5: Localized potentiodynamic curves recorded in sat. Ca(OH)2
Fig. 3.6: Cyclic voltammetries of B450C steel in NaOH 1M and sat. Ca(OH) solution.
2.Fig. 3.7: Cyclic voltammetries in sat. Ca(OH)
2: different potential scanned ranges.
VII
Fig. 3.8: Cyclic voltammetries in sat. Ca(OH)2
Fig. 3.9: Cyclic voltammetries in sat. Ca(OH)
: effect of the variation of the anodic limit.
2
Fig. 3.10: Cyclic voltammetries in sat. Ca(OH): effect of anodic polarizations. 2
Fig. 3.11: Cyclic voltammetries in sat. Ca(OH): effect of cathodic polarizations.
2
Fig. 3.12: Anodic polarization curves: effect of the aeration. :effect of long term cycling.
Fig. 3.13: Anodic polarization curves: effect of pre-passivation. Fig. 3.14: Steel passivation: corrosion potential and corrosion current density. Fig. 3.15: Steel passivation: electrochemical impedance spectroscopy. Fig. 3.16: Best fitting parameters for R1 and CPE1. Fig. 4.1: Steel sample for weigh loss measurements. Fig. 4.2: Schematic representation o a reinforced mortar sample. Fig. 4.3: Gravimetric test in alkaline solution + Na2
Fig. 4.4: Surfaces after the in immersion tests in diluted sulfuric acid solutions. S and sulfuric acid.
Fig. 4.5: Surfaces after the in immersion test at pH 10.2 Fig. 4.6: Surfaces after the in immersion test at pH 9.2 Fig. 4.7: OCP monitoring of metallic samples in the simulating solutions Fig. 4.8: OCP fluctuations due to sulfides depletion. Fig. 4.9: Optical microscopy pictures of the steel surfaces after the OCP monitoring. Fig. 4.10: Anodic polarizations in 0.5% H2SO4Fig. 4.11: Anodic polarizations in 0.5% H
: effect of pre-passivation. 2SO4
Fig. 4.12: Anodic polarizations in H: response of different steel.
2SO4
: effect of acid concentration.
Fig. 4.13: Optical microscopy pictures of the steel surfaces after anodic polarizations. Fig. 4.14: Anodic polarizations with sulfides at pH 10.2: effect of sulfides
concentration. Fig. 4.15: Optical microscopy picture after anodic polarization, pH 10.2, Na2
Fig. 4.16: Relationship between the inflection points and sulfides concentration.
S 50 mM.
Fig. 4.17: Anodic polarizations with sulfides at pH 10.2: glassy carbon. Fig. 4.18: Anodic polarizations with sulfides at pH 10.2: effect of pre-passivation. Fig. 4.19: Anodic polarizations with sulfides at pH 10.2: effect of aeration. Fig. 4.20: Anodic polarizations with sulfides at pH 9.2: effect of sulfides concentration Fig. 4.21: Macroscopic picture of the surface after anodic polarization (pH 9.2) Na2
Fig. 4.22: Optical microscopy pictures of the surface after anodic polarization (pH 9.2) Na
S 5mM.
2
Fig. 4.23: Schematic of the iron dissolution process beneath the mackinawite layer. S 5mM
Fig. 4.24: Phenolphtalein test on two freshly cut cross section mortar prism. Fig. 4.25: XRD diffractogram of a powder sample after the carbonation treatment. Fig. 4.26: OCP monitoring of reinforced mortar samples. Fig. 4.27: Corrosion current densities of reinforced mortar samples. Fig. 4.28: Typical EIS response of carbonated reinforced mortar sample. Fig. 4.29: Equivalent electrical circuit used for fitting the experimental EIS data. Fig. 4.30: Best fitting values of the EIS responses.
VIII
Fig. 4.31: Comparison of charge transfer resistance values, from LPR and EIS. Fig. 4.32: Pictures of split reinforced mortar samples after a 200 days conditioning Fig. 4.33: Picture of reinforced mortar samples after a 500 days conditioning. Fig. 4.34: XRD pattern of the cementitious matrix at the end of the conditioning
period. Fig. 4.35: Pictures of split reinforced mortar samples after a 500 days. Fig. 5.1: Anodic polarizations of B450C carbon steel in a 0.5% H2SO4 with MBD. Fig. 5.2: Anodic polarizations of B450C steel in a 0.5% H2SO4 with MBD, BZT, CYS.
Fig. 5.4: Optical microscopy pictures of surface after the anodic polarizations. Fig. 5.3: Anodic and cathodic polarization with different inorganic inhibitors.
Fig. 5.5: OCP evolution for B450C carbon steel in 0.5% H2SO4
Fig. 5.6: Optical microscopy pictures of the steel surface OCP monitoring in 0.5% H
with of different inhibitors.
2SO4
Fig. 5.7: Steel rebars weight loss: effects of different inhibitors concentrations .
Fig. 5.8: X-ray diffractograms of the unloaded compounds. Fig. 5.9: SEM pictures of the unloaded Vaterite. Fig. 5.10: SEM pictures of the as synthesized hydroxylapatite. Fig. 5.11: Pore size distribution of the HAP powder. Fig. 5.12: pH dependent MBD release from the VAT hybrid. Fig. 5.13: pH dependent MBD release from the HAP hybrid. Fig. 5.14: Mass titration data of HAP in a 0.5 M KNO3 solution.
Fig. 5.16: LPR of mild steel in 0.5% HFig. 5.15: Anodic and cathodic polarizations with the hybrid inhibitors.
2SO4
Fig.5.17: Nyquist and Bode plots of mild steel in 0.5% H solution: effects of the inhibitors.
2SO4
Fig. 5.18: EIS of mild steel in 0.5% H solution.
2SO4
Fig. 5.19: EIS of mild steel in 0.5% H solution: HAP and MBD.
2SO4
Fig. 5.20: Equivalent electric circuits used for the fitting of the experimental EIS data. solution: MBD-HAB.
Fig. 5.21: Fitting of EIS spectra. Fig. 5.22: SEM pictures of the surfaces after a four days conditioning in in 0.5%
H2SO4
Fig. 5.23: LPR monitoring of mild steel in saturated Ca(OH).
2
Fig.5.24: Nyquist and Bode plots of mild steel in saturated Ca(OH) solution.
2
Fig. 5.25: Fitting of EIS spectra. solution
Fig. 5.26: Voltammetries performed in sat. Ca(OH)2
Fig. 5.27: Anodic charges calculated from integration of the voltammetric curves. with MBD
Fig. 6.1: Schematic and pictures of reinforced mortar cylinders. Fig. 6.2: Pictures of the mortar cubes, before and after the standard compressive
tests. Fig. 6.3: Pictures of polished cross-section for ESEM examination. Fig. 6.4: Schematic of the heat evolution during the hydration process of Portland
cement.
IX
Fig. 6.5: Heat release and heat evolution plots for OPC cement with HAP and MBD-HAP.
Fig. 6.6: Heat release and heat evolution plots for OPC cement paste with MBD. Fig. 6.7: Compressive strength of mortar cubes with HAP and MBD-HAP. Fig. 6.8: OCP evolution steel rebars embedded in mortar along the curing period. Fig. 6.9: OCP evolution steel rebars embedded in mortar along the conditioning
period Fig. 6.10: Phenolphtalein test performed on the cross-section of two reinforced
cylinders. Fig. 6.11: ESEM pictures of the edge area of a cross-section (H2SO4
Fig. 6.12: ESEM pictures of a cross-section: bulk area and edge (H).
2SO4
Fig. 6.13: EDX spectra captured on edge and on bulk. ).
Fig. 6.14: ESEM pictures of a cross-section: steel/mortar interface (H2SO4
Fig. 6.15: ESEM pictures of a cross-section: edge region (water). ).
Fig. 6.16: ESEM pictures of a cross-section: bulk and steel/mortar interface (water).
List of Tables: Table 2.1: Main components of Portland cement. Table 2.2: Composition limits of Portland cement. Table 2.3: Classification of cement types according to EN 197-1. Table 2.4: Sulfate exposure classes of ACI 318-08. Table 2.5: Thiobacillus strains and their characteristics. Table 2.6: Relationship between OCP and Corrosion risk according to ASTM C876. Table 2.7: Relationship between concrete resistivity and corrosion risk. Table 2.8: Relationship between corrosion current and corrosion of the reba.r Table 3.1: Vickers micro hardness of B450C steel. Table 3.2: Best fitting parameters for the EIS data: steel passivation. Table 4.1: Chemical composition (w%) of B450C mild steel Table 4.1: Relationship between corrosion current density and corrosion risk. Table 5.1: Different organic and inorganic inhibitors used in the preliminary
screening. Table 5.2: Vaterite (VAT) and hydroxylapatite (HAP) BET suface area. Table 5.3: Loading capacity of the hybrid systems
X
List of Abbreviations:
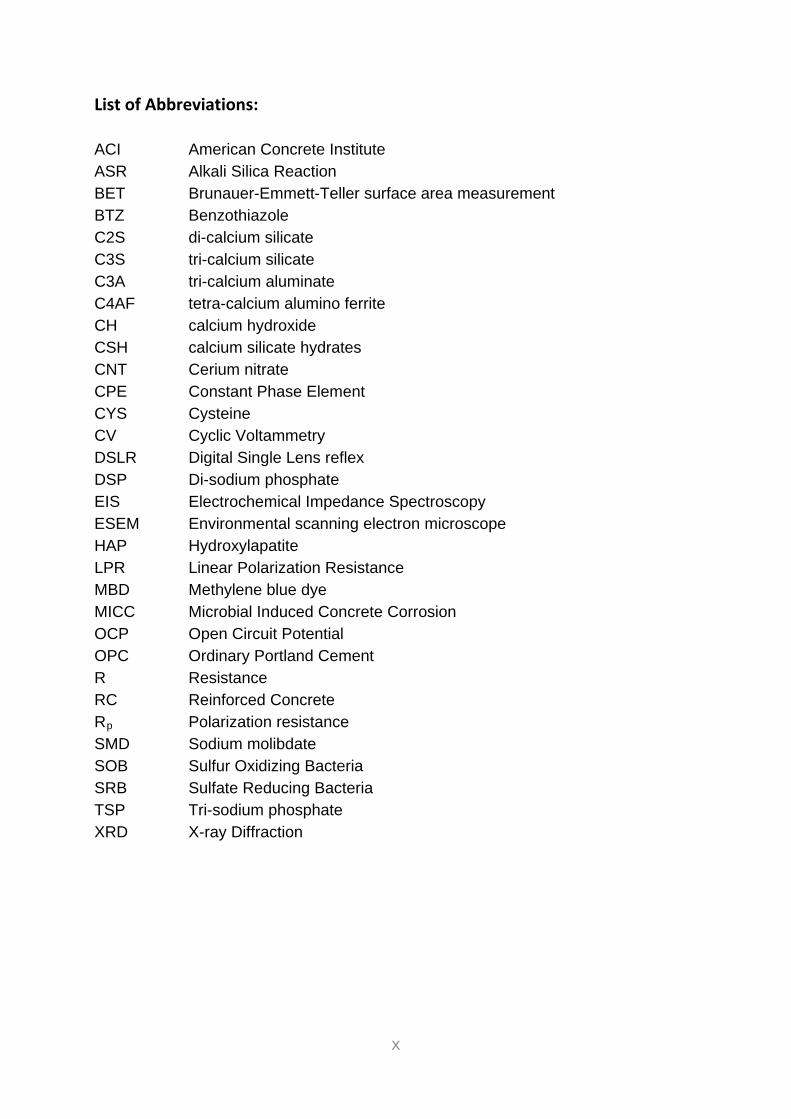
ACI American Concrete Institute ASR Alkali Silica Reaction BET Brunauer-Emmett-Teller surface area measurement BTZ Benzothiazole C2S di-calcium silicate C3S tri-calcium silicate C3A tri-calcium aluminate C4AF tetra-calcium alumino ferrite CH calcium hydroxide CSH calcium silicate hydrates CNT Cerium nitrate CPE Constant Phase Element CYS Cysteine CV Cyclic Voltammetry DSLR Digital Single Lens reflex DSP Di-sodium phosphate EIS Electrochemical Impedance Spectroscopy ESEM Environmental scanning electron microscope HAP Hydroxylapatite LPR Linear Polarization Resistance MBD Methylene blue dye MICC Microbial Induced Concrete Corrosion OCP Open Circuit Potential OPC Ordinary Portland Cement R Resistance RC Reinforced Concrete Rp
SMD Sodium molibdate Polarization resistance
SOB Sulfur Oxidizing Bacteria SRB Sulfate Reducing Bacteria TSP Tri-sodium phosphate XRD X-ray Diffraction

XI
Acknowledgements
Looking back to the last three years of my PhD research activity I really feel grateful to Dr. Stefano Trasatti and Dr. Pierangela Cristiani, respectively the supervisor and the co-supervisor of the present research project, that allowed me to undertake such an interesting and formative experience.
In particular, I would like to express my deepest appreciation to Dr. Stefano Trasatti for his open-minded view and attitude in the management of the laboratory and the research group. Thanks for having understood and supported my needs and desires of a fully autonomous way of conducting my scientific research.
Also I would like to give my sincerest acknowledgments to Dr. Dessi Koleva, from TU Delft, who gave me the kind opportunity to work in her group for six months, during which I experienced a substantially different approach to the research with respect to the one I was used to live. I learned a lot of things during my very formative stay in the Netherlands.
Undoubtedly a huge thanks goes to Matteo Stefanoni, Andrea Olietti and Cristian Foiadelli that undertook parts of the present work for their thesis researches. It was really a pleasure to share with you ideas, doubts, results, achievements and frustrations...thanks again guys!
I also would like to thanks all the members of the "Corrosion Engineering and Applied Electrochemistry" Laboratory: Edo, Ale, Teo, Monica and Giorgio for being good friends, and all the students that for longer or shorter periods worked in the lab, contributing with their friendliness to the creation of a really nice place where to stay.
Finally, a special thanks to Stefi, whose technical contribution to the present thesis is "limited" to the execution of some BET analysis, but her main provision was that of making these past three years so so pleasant...Thank you!

XII
Summary
1
Summary
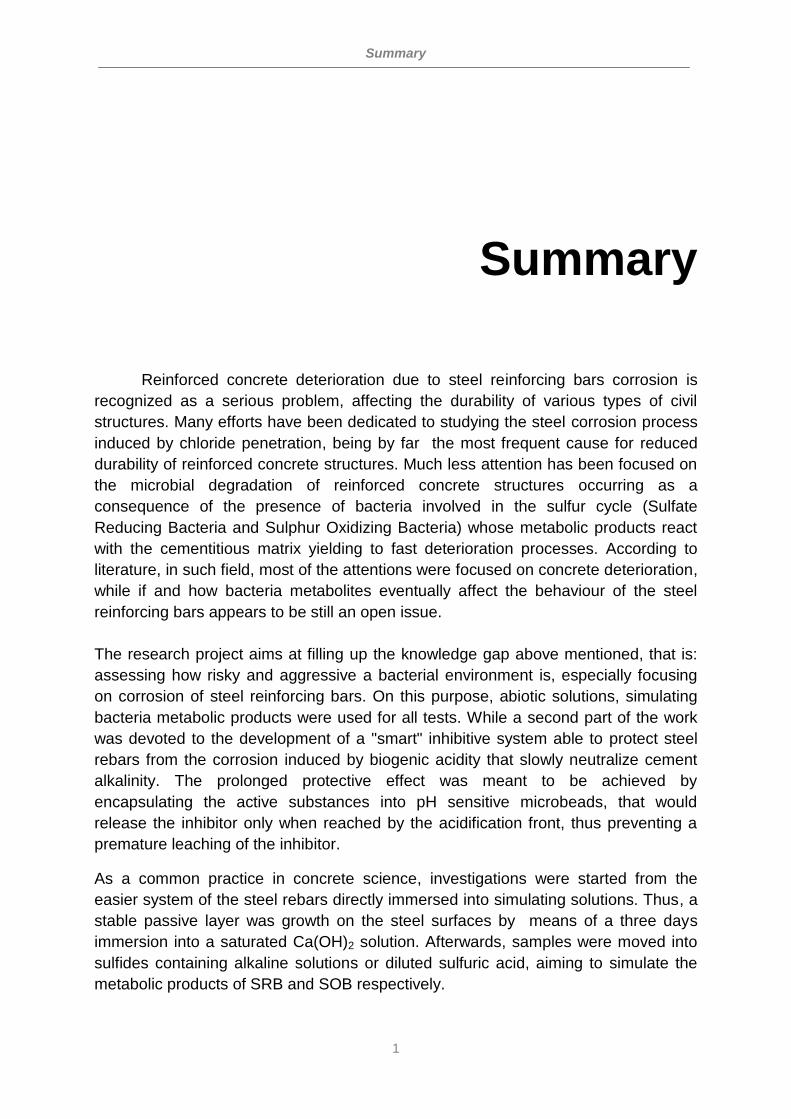
Reinforced concrete deterioration due to steel reinforcing bars corrosion is
recognized as a serious problem, affecting the durability of various types of civil
structures. Many efforts have been dedicated to studying the steel corrosion process
induced by chloride penetration, being by far the most frequent cause for reduced
durability of reinforced concrete structures. Much less attention has been focused on
the microbial degradation of reinforced concrete structures occurring as a
consequence of the presence of bacteria involved in the sulfur cycle (Sulfate
Reducing Bacteria and Sulphur Oxidizing Bacteria) whose metabolic products react
with the cementitious matrix yielding to fast deterioration processes. According to
literature, in such field, most of the attentions were focused on concrete deterioration,
while if and how bacteria metabolites eventually affect the behaviour of the steel
reinforcing bars appears to be still an open issue.
The research project aims at filling up the knowledge gap above mentioned, that is:
assessing how risky and aggressive a bacterial environment is, especially focusing
on corrosion of steel reinforcing bars. On this purpose, abiotic solutions, simulating
bacteria metabolic products were used for all tests. While a second part of the work
was devoted to the development of a "smart" inhibitive system able to protect steel
rebars from the corrosion induced by biogenic acidity that slowly neutralize cement
alkalinity. The prolonged protective effect was meant to be achieved by
encapsulating the active substances into pH sensitive microbeads, that would
release the inhibitor only when reached by the acidification front, thus preventing a
premature leaching of the inhibitor.
As a common practice in concrete science, investigations were started from the
easier system of the steel rebars directly immersed into simulating solutions. Thus, a
stable passive layer was growth on the steel surfaces by means of a three days
immersion into a saturated Ca(OH)2 solution. Afterwards, samples were moved into
sulfides containing alkaline solutions or diluted sulfuric acid, aiming to simulate the
metabolic products of SRB and SOB respectively.
Summary
2
The acidic conditioning, into diluted sulfuric acid solutions, easily dissolved the
passive layer and caused a fast onset of generalized corrosion, whose extension was
found to be dependent on the acid concentration as indicated by both gravimetric
and electrochemical tests. Conversely, sulfides were proven to induced localized
corrosion, their interactions with the steel surface resulted to be significantly affected
by the pH of the environment. Actually, for a prevailing of hydroxyl ions over the
sulfides ones the steel surface remained protected by the oxide layer, while at lower
pH steel-sulfides interaction were promoted, yielding to a porous, conductive, and
thus non protective layer of iron sulfides.
Once clarified the corrosion mechanisms for steel directly immersed in simulating
solutions, reinforced mortar samples were cast, cured, carbonated and then
conditioned into two different model media: a sulfides containing solution and diluted
sulfuric acid solution. The combination of several electrochemical techniques such as
OCP, LPR and EIS pointed out the active behavior of the embedded steel rebars.
Visual inspection performed at the end of a 500 days conditioning period confirmed
that the acidic conditioning yielded to more severe damages.
On the basis of such findings, a "smart" corrosion inhibitor was developed by
combining together calcium phosphate and methylene blue dye, being both active
compounds in terms of protection of carbon steel from sulfuric acid corrosion. The
resulting product was an organic/inorganic hybrid where the organic molecules were
entrapped into a porous inorganic matrix, granting their release as a function of a pH
drop leading to the dissolution of the latter. Anodic and cathodic potentiodynamic
polarizations performed in sulfuric acid solution and in presence of the hybrid inhibitor
confirmed that both the anodic and the cathodic processes were hindered as a
consequence of the combined effect of methylene blue dye and phosphate ions. The
effectiveness of the slow release mechanism was evaluated by means of LPR and
EIS monitoring by comparing the responses of the hybrid, its two components
singularly used and the free corroding system as a control case. The effect of the
organic inhibitor was that of significantly increasing the polarization resistance. Such
effect was rapidly lost in the case of methylene blue dye alone, while its slow release,
together with the synergic effect of phosphate ions contributed to the prolongation of
the protective effect.
Finally the interactions of the hybrid and its components with the cementitious matrix
were investigated by means of isothermal calorimetry and standard compressive
strength tests. The response of both the hydration rate and the strength evolution
were found to be independent from the chemical admixtures.
Once excluded the onset of negative side effects, reinforced mortar samples
containing different amount of the unloaded HAP and the hybrid MBD-HAP were cast
and exposed to a sulfuric acid environment for about four months. However such a
conditioning period proved not to be long enough to induce the corrosion of the steel
reinforcing bars.

Chapter 1. Introduction
3
Chapter 1.
Introduction

Chapter 1. Introduction
4
1.1 The challenge of a new project
Some time ago, I found a picture on the web, the power of effective visual
communication is that, just a quick glance, few seconds, are more than enough to
send to the target the desired message, and this was the case of that picture. It
showed a steep mountain face covered in ice and snow, just a few black rocks
contrasted with the white tone of the picture, such white was also strengthen by a
snow storm that was hitting the wall. The feeling was that of freezing and discomfort,
no wise man would have desired to be there; but more carefully looking, a colored
human shape could be barely noticed in the whiteness of the storm, it was a climber
fighting his way up to the summit. Yet the image was strong and impressive, but its
sense was underlined by an anonymous quote written overlay. "Life begins at the
end of your comfort zone" was the text. Certainly as a climber and mountaineer, I
was the right target for such a message, and it worked, because it impressed me.
Our present society, but in general all those of the western economies, moved
towards a welfare model, where the life quality is mainly based on low fatigue, low
suffering, low uncertainties and low doubts. The spread in technological advances
led to the idea that the right and the only way to get any desired achievement should
always keep us within our comfort zone. Is that true or is just an illusion of the
consumerist age we are living?
Coming back to the sentence of the picture, I totally agree with its statement,
especially considering that life strictly corresponds with the individual growing
process. There is almost nothing to learn or to grow to, while remaining within our
"safe" comfort zone. The learning process itself involves the action to make a step
from the known ground to the unknown, there is risk in it, of course, and the more
you venture out, the greater will be the exposure to failure. We have been taught that
failure is a shame, but the only certain failure is standing still and do not trying
anything, while the more we risk, and actually fail, the greater our chances of
success will be.
In my alpinistic career, I have often had to balance the risk-benefit equation, making
my choices outside the comfort zone, and I'm sure that battling the Russian cold and
wild winds blowing on Elbrus, or struggling in search of oxygen in the rarefied air of
the high altitude of Himalaya and Pamir gave me invaluable chances of growing as
person [1].
Up to this point, such words would probably seem a rather unusual introduction to a
PhD thesis, what is the sense of all of this? What is worth for life in general, or for
sport activities, may also be applicable to other different fields. Why not thinking to
science and research as for a learning process? one of the infinite way we have to
generate knowledge and to grow? Accordingly, why remaining confined in a
restricted comfort zone?

Chapter 1. Introduction
5
After the master graduation, and in the two subsequent years during which I worked
with a research grant, I got a considerable knowledge in the field of the
electrochemical deposition and characterization of conducting polymer used for
corrosion protection of light alloys. I had defined a personal comfort zone made with
skills, literature studies and experimental practice, where I felt comfortable in. The
choice of starting the PhD led to the question of the topic to be investigated in the
following three years, the initial natural idea was that of continuing in the same
direction going further with different materials and testing techniques.
Until a point, when Dr. Stefano Trasatti, my doctoral supervisor, asked me what was
my idea on moving to a completely different field such as the microbial deterioration
of reinforced concrete structures. At that moment, I only had a vague idea of what the
reinforced concrete was, and nobody else in our research group had any knowledge
in that field, so that his proposal seemed unwisely far, big and difficult. Wasn't that a
good occasion for leaving my scientific comfort zone? Probably yes, it was...that is
how I accepted the new challenge. In life, as in sports, as in business, and probably
also in science, big challenges generally offer bigger chances to fail, but also bigger
chances to learn, and it up to us, as men, as researchers to define what is the
acceptable risk level, and how many physical and intellectual resources are we ready
to dissipate in the overcoming difficulties.
Any academic research, necessarily starts from a solid foundation of ground
knowledge, over which the complexity of a detailed scientific investigation can be
built on. In my case such knowledge was not available, so that my first task was to
built it. The biggest part of the first year of my PhD was actually spent in literature
study, whose results are detailed in the following chapter. Such study resulted to be a
multidisciplinary effort due to the variety of the gaps to be filled, ranging from the
engineering field of the basics of concrete science, to the biological one in terms of
microbially induced corrosion, or the purely electrochemical fields such as learning
the principles and the uses of sophisticated measuring techniques such as the
electrochemical impedance spectroscopy. The main difficulty of this initial step, and
that also persisted in the subsequent years has been the lack of technical mentor.
What it is collected in present text, is the result of almost completely autonomous
choices, some of them proved to be correct, several others were mistaken, and some
of them were certainly due to inexperience. All of them were integral part of the
exceptional learning process of the last three years.
Chapter 1. Introduction
6
1.2 The Concrete Laboratory set-up
Concrete, being a composite material, it is known to have a very complex
behaviour as many internal factors such as water/binder ratio, type of cement, type
and size of the aggregates, together with many external factors such as temperature,
humidity, presence of aggressive species can strongly affect its performance. For this
reason a study on the rebar corrosion in concrete can start from the electrochemical
testing of mild steel in artificially simulated concrete pore solutions, but then, in order
to simulate closer the reality, it is necessary to make tests with steel samples
embedded in mortar and concrete. Thanks to the useful indications of my co-tutor,
Dr.ssa Pierangela Cristiani from RSE, a private research company, we were able to
get all the necessary equipment for mortar and concrete preparation from a
decommissioned concrete laboratory. As being unused for several years, equipments
were subjected to a complete control of electrical and mechanical parts in order to
fully restore their functionality once transferred to our labs. Actually our new concrete
laboratory has all the necessary equipment i.e. mixers, vibrating tables, moulds of
different sizes, specific for both the production of mortar and concrete samples (fig
1.1-2). Furthermore we dispose of a curing room and a concrete cutting machine.
Regarding to the characterization of the mechanical and rheological properties we
are actually able to determine the workability of fresh mortar and concrete with two
specific equipments, i.e the flow table for mortar, and a Vebe apparatus for concrete,
respectively conforming to the standards EN 459-2 and EN12350-3 (Fig. 1.3).
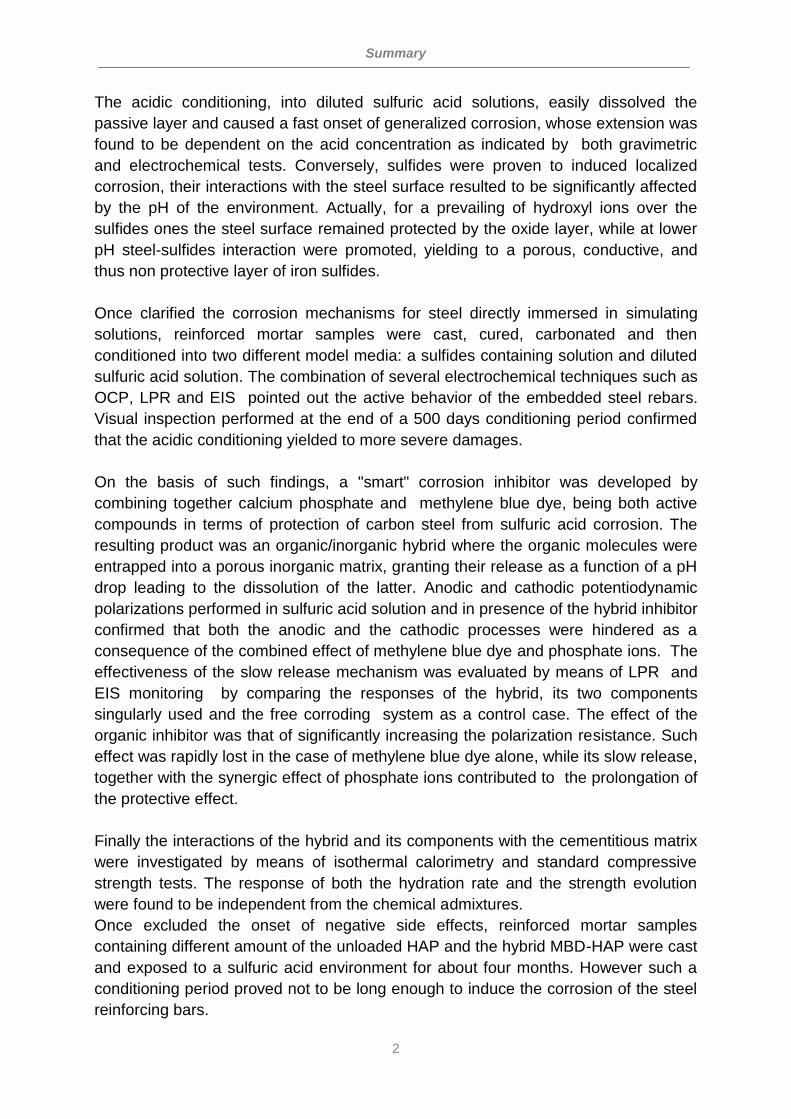
Fig. 1.1: Mixer devices. Left side: 5 Lt capability for mortar. Right side: 10 Lt capability for
concrete.
Chapter 1. Introduction
7
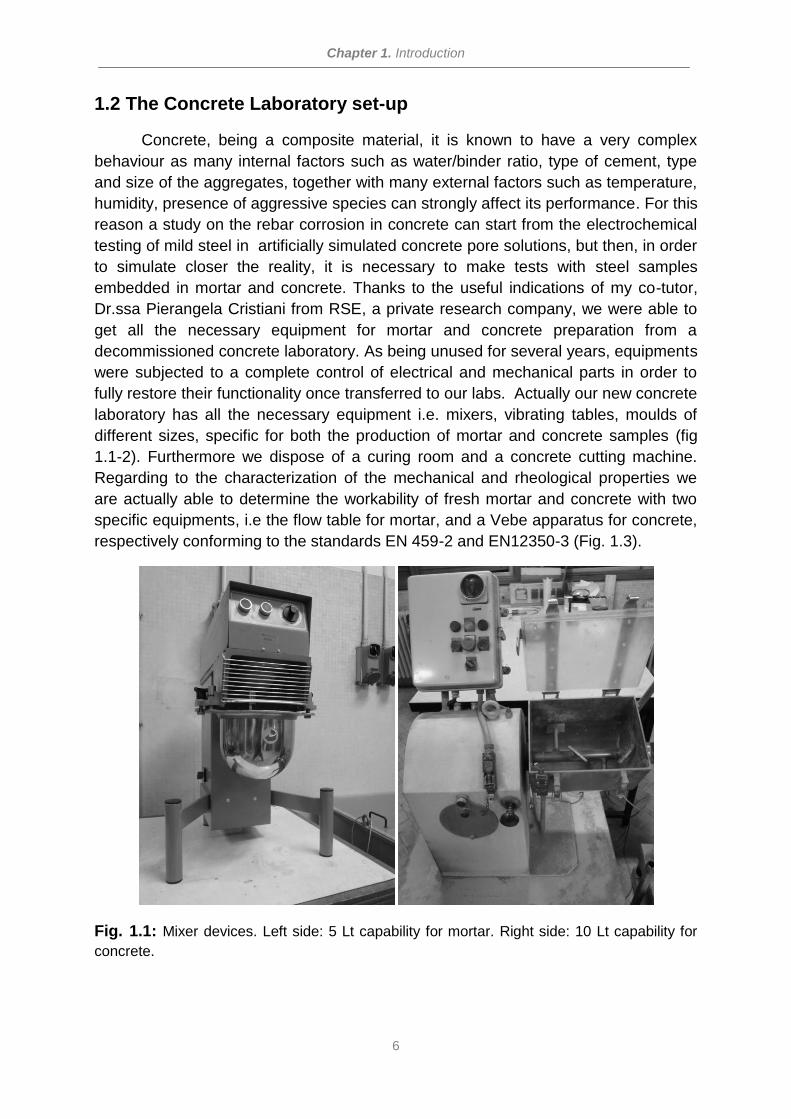
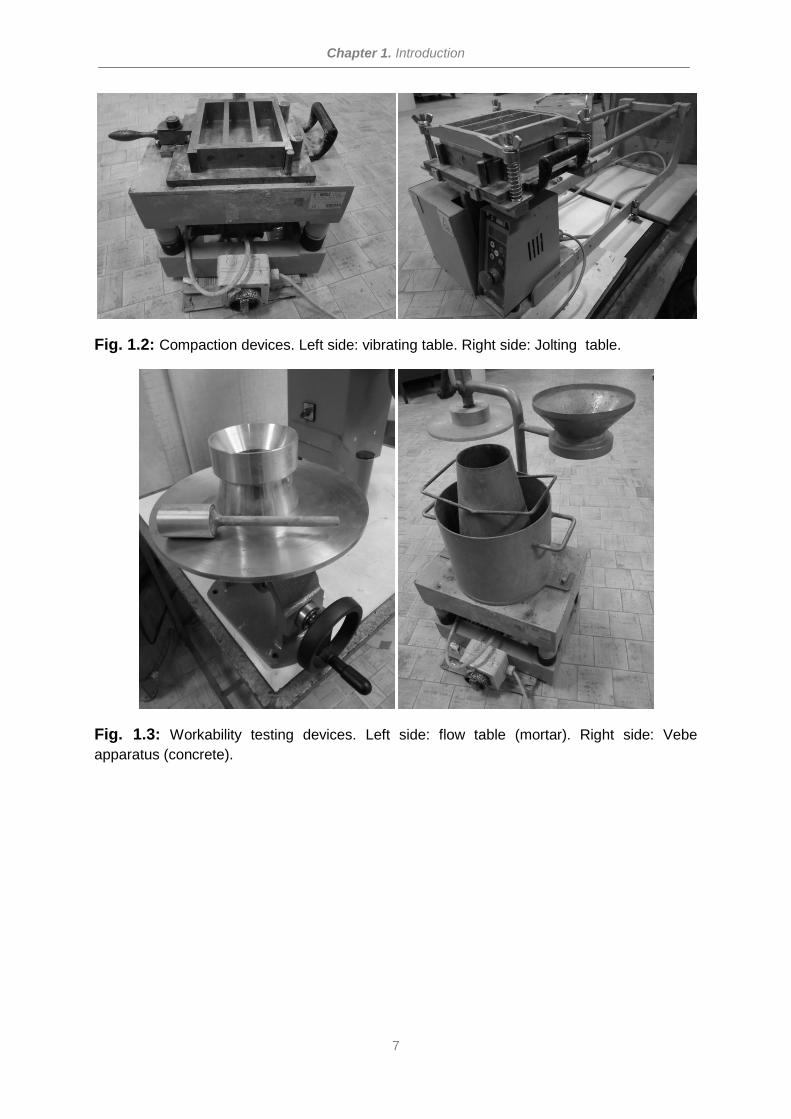
Fig. 1.2: Compaction devices. Left side: vibrating table. Right side: Jolting table.
Fig. 1.3: Workability testing devices. Left side: flow table (mortar). Right side: Vebe
apparatus (concrete).
Chapter 1. Introduction
8
1.2.1 Construction of the accelerated carbonation chamber
Notwithstanding the conspicuous facilities obtained from the dismissed
concrete laboratory, still, according to the project plan, there was a lack of a crucial
tool. Actually the literature study pointed out that the first step of the microbial
deterioration of RC structures was an abiotic neutralization of the concrete natural
alkalinity leading from a pH of about 13 to values around 9, thus allowing the growth
and the thriving of bacterial colonies. In order to simulate a realistic case, such
abiotic pH decrease needed to be re-produced in the lab on the concrete specimens.
Atmospheric CO2 can diffuse through the cement matrix and lowers the concrete pH
by reacting with the calcium hydroxide in a process known as carbonation. Such
process naturally takes several years to occur and to produce significant changes in
the concrete properties because of the very low concentration of CO2 in the
atmosphere (0.04% V/V). The carbonation processes has been thoroughly studied by
different groups [2-5] each one having developed an accelerated carbonation
chamber with different design, properties and control parameters. From the above
cited studies emerged that the carbonation depth was significantly dependent on w/c
ratio, temperature, relative humidity, and CO2 partial pressure. An increased w/c ratio
is related to a more porous concrete in which the CO2 can more easily diffuse and
react; its diffusion is hindered in a completely water saturated concrete, while, on the
other side, the reaction needs some water molecules to occur, so that the maximum
carbonation rate was achieved with a relative humidity value around 60%,
furthermore by increasing the temperature and the CO2 concentration the
carbonation rate resulted to be increased. Accelerated carbonation chambers are
available on the market, but being their price over 1000 €, such an investment was
not justifiable in the framework of my PhD research activity.
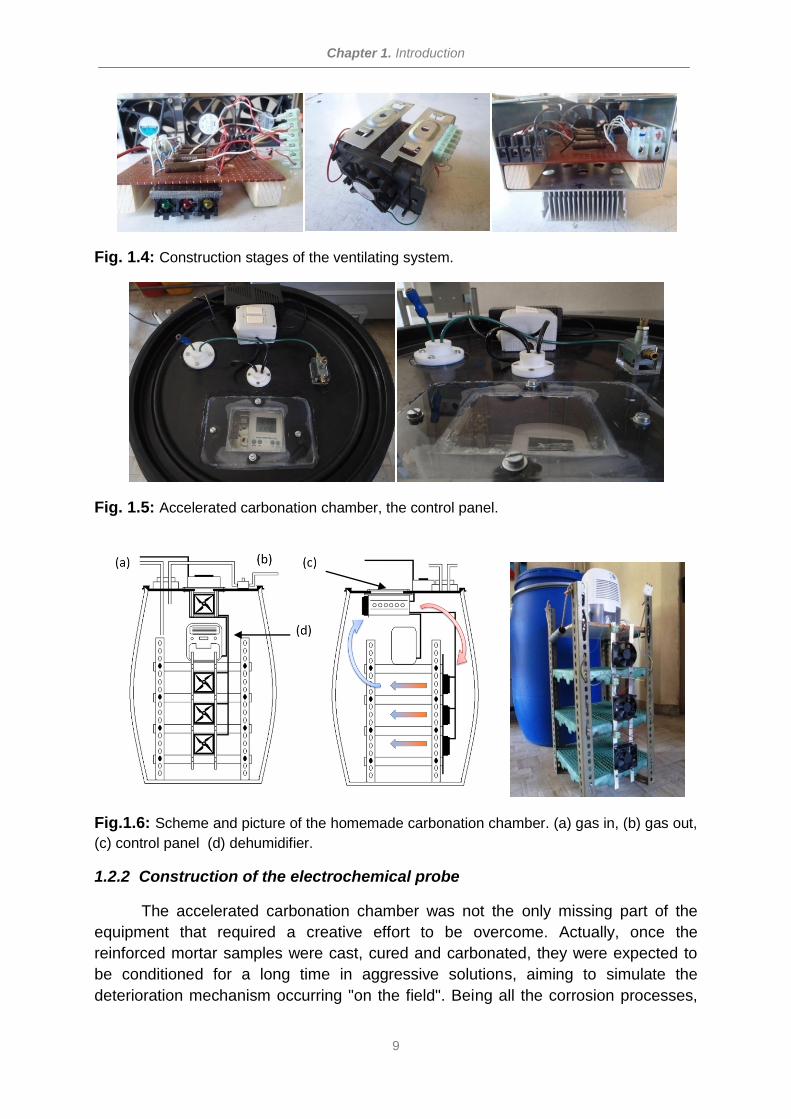
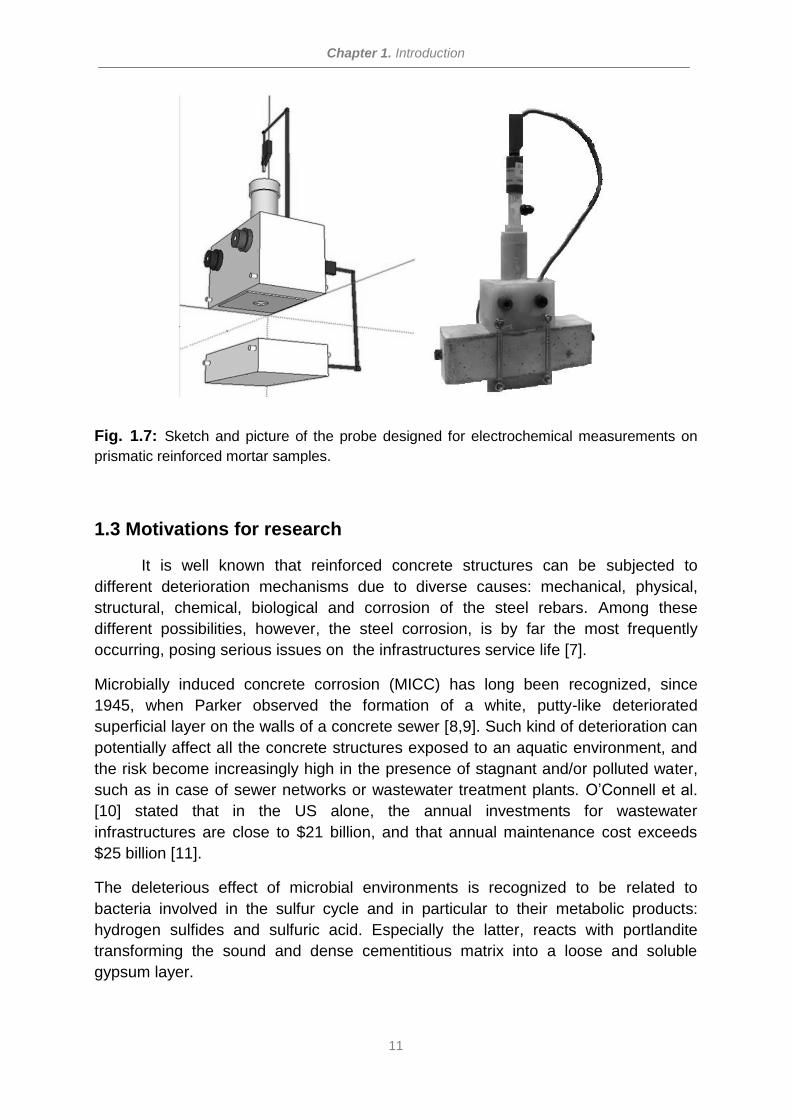
An homemade carbonation chamber was built using a HDPE airtight drum, in which a
removable structure made of four steel supports and a series of HDPE grids was
placed. A mini dehumidifier based on the principle of thermo electric Peltier module
was purchased from Cornwall Electronics, together with a thermo-hygrometer that
was placed in the inner side of the cap, under a Plexiglass window. A forced air
circulation system was studied and realized using four recycled computer fans, thus
granting the humidity extraction from the mortar samples as efficient as possible
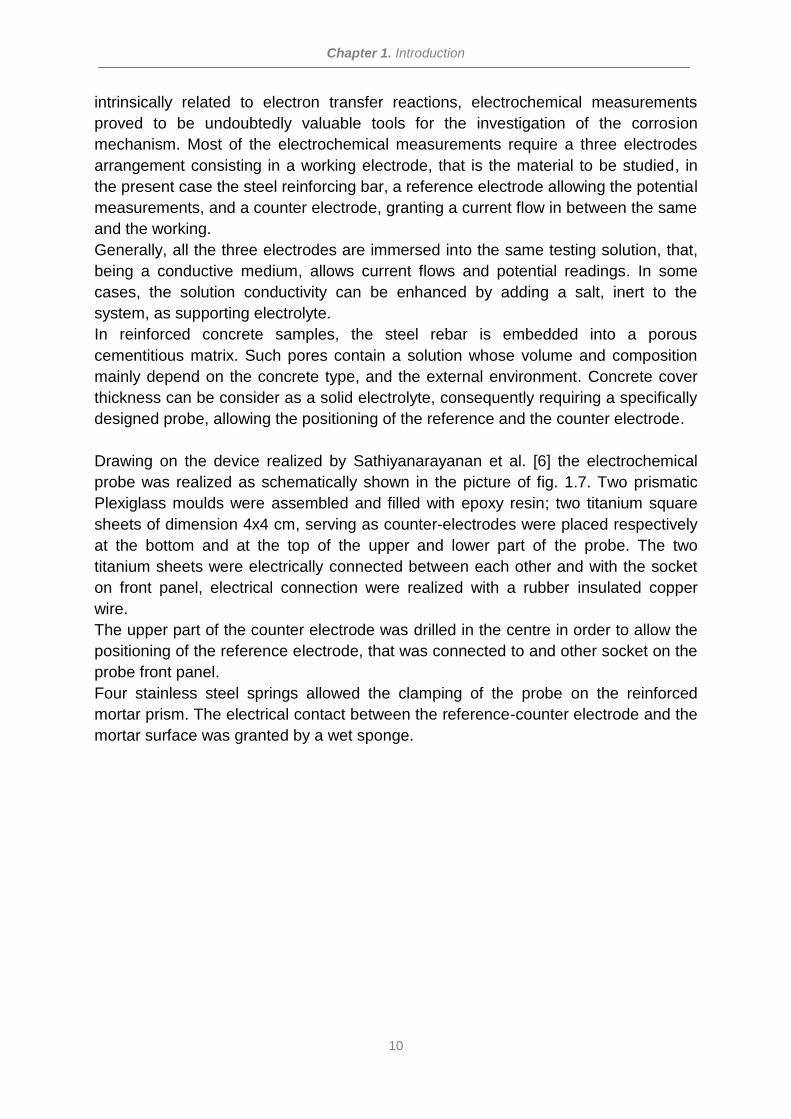
(fig1.4). Both the dehumidifier and the air circulation system could be tuned by a
control panel placed on the top of the cap (fig. 1.5). A Teflon flange was specifically
designed and produced for airtight CO2 entrance and exit fluxes. A front and side
scheme together with a picture of the completed carbonation chamber are reported in
figure 1.6.
Chapter 1. Introduction
9
Fig. 1.4: Construction stages of the ventilating system.
Fig. 1.5: Accelerated carbonation chamber, the control panel.
Fig.1.6: Scheme and picture of the homemade carbonation chamber. (a) gas in, (b) gas out,
(c) control panel (d) dehumidifier.
1.2.2 Construction of the electrochemical probe
The accelerated carbonation chamber was not the only missing part of the
equipment that required a creative effort to be overcome. Actually, once the
reinforced mortar samples were cast, cured and carbonated, they were expected to
be conditioned for a long time in aggressive solutions, aiming to simulate the
deterioration mechanism occurring "on the field". Being all the corrosion processes,
Chapter 1. Introduction
10
intrinsically related to electron transfer reactions, electrochemical measurements
proved to be undoubtedly valuable tools for the investigation of the corrosion
mechanism. Most of the electrochemical measurements require a three electrodes
arrangement consisting in a working electrode, that is the material to be studied, in
the present case the steel reinforcing bar, a reference electrode allowing the potential
measurements, and a counter electrode, granting a current flow in between the same
and the working.
Generally, all the three electrodes are immersed into the same testing solution, that,
being a conductive medium, allows current flows and potential readings. In some
cases, the solution conductivity can be enhanced by adding a salt, inert to the
system, as supporting electrolyte.
In reinforced concrete samples, the steel rebar is embedded into a porous
cementitious matrix. Such pores contain a solution whose volume and composition
mainly depend on the concrete type, and the external environment. Concrete cover
thickness can be consider as a solid electrolyte, consequently requiring a specifically
designed probe, allowing the positioning of the reference and the counter electrode.
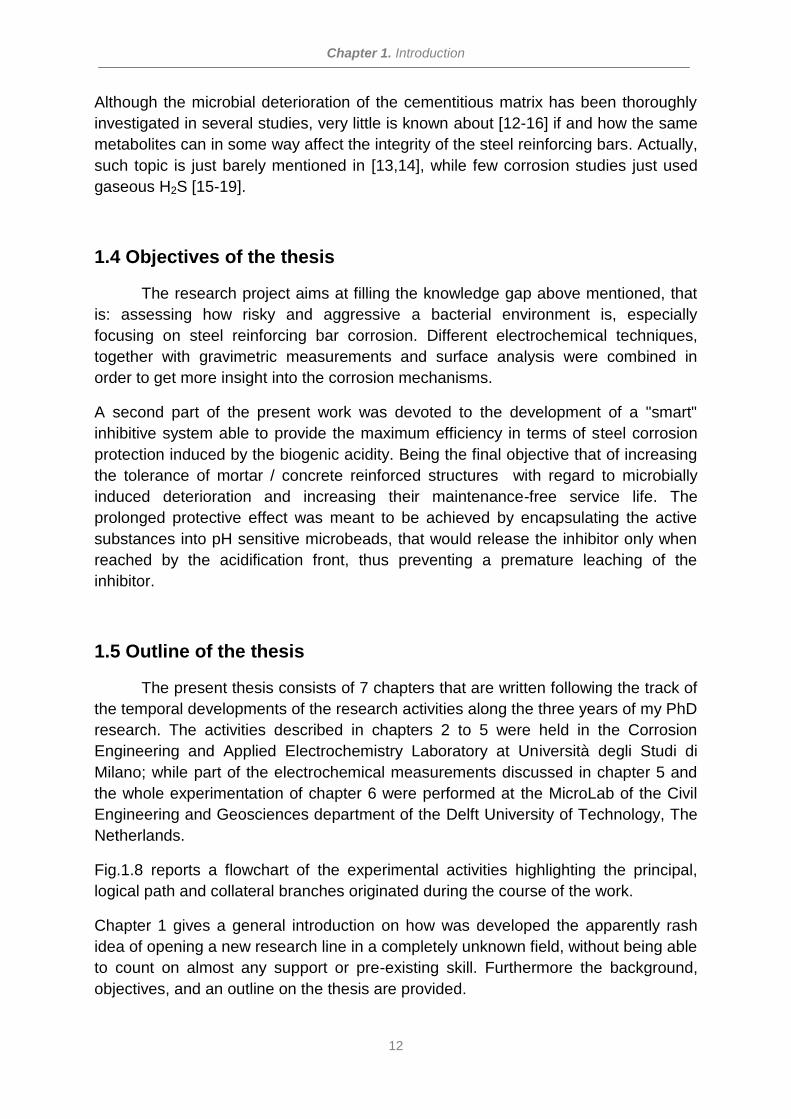
Drawing on the device realized by Sathiyanarayanan et al. [6] the electrochemical
probe was realized as schematically shown in the picture of fig. 1.7. Two prismatic
Plexiglass moulds were assembled and filled with epoxy resin; two titanium square
sheets of dimension 4x4 cm, serving as counter-electrodes were placed respectively
at the bottom and at the top of the upper and lower part of the probe. The two
titanium sheets were electrically connected between each other and with the socket
on front panel, electrical connection were realized with a rubber insulated copper
wire.
The upper part of the counter electrode was drilled in the centre in order to allow the
positioning of the reference electrode, that was connected to and other socket on the
probe front panel.
Four stainless steel springs allowed the clamping of the probe on the reinforced
mortar prism. The electrical contact between the reference-counter electrode and the
mortar surface was granted by a wet sponge.
Chapter 1. Introduction
11
Fig. 1.7: Sketch and picture of the probe designed for electrochemical measurements on
prismatic reinforced mortar samples.
1.3 Motivations for research
It is well known that reinforced concrete structures can be subjected to
different deterioration mechanisms due to diverse causes: mechanical, physical,
structural, chemical, biological and corrosion of the steel rebars. Among these
different possibilities, however, the steel corrosion, is by far the most frequently
occurring, posing serious issues on the infrastructures service life [7].
Microbially induced concrete corrosion (MICC) has long been recognized, since
1945, when Parker observed the formation of a white, putty-like deteriorated
superficial layer on the walls of a concrete sewer [8,9]. Such kind of deterioration can
potentially affect all the concrete structures exposed to an aquatic environment, and
the risk become increasingly high in the presence of stagnant and/or polluted water,
such as in case of sewer networks or wastewater treatment plants. O’Connell et al.
[10] stated that in the US alone, the annual investments for wastewater
infrastructures are close to $21 billion, and that annual maintenance cost exceeds
$25 billion [11].
The deleterious effect of microbial environments is recognized to be related to
bacteria involved in the sulfur cycle and in particular to their metabolic products:
hydrogen sulfides and sulfuric acid. Especially the latter, reacts with portlandite
transforming the sound and dense cementitious matrix into a loose and soluble
gypsum layer.
Chapter 1. Introduction
12
Although the microbial deterioration of the cementitious matrix has been thoroughly
investigated in several studies, very little is known about [12-16] if and how the same
metabolites can in some way affect the integrity of the steel reinforcing bars. Actually,
such topic is just barely mentioned in [13,14], while few corrosion studies just used
gaseous H2S [15-19].
1.4 Objectives of the thesis
The research project aims at filling the knowledge gap above mentioned, that
is: assessing how risky and aggressive a bacterial environment is, especially
focusing on steel reinforcing bar corrosion. Different electrochemical techniques,
together with gravimetric measurements and surface analysis were combined in
order to get more insight into the corrosion mechanisms.
A second part of the present work was devoted to the development of a "smart"
inhibitive system able to provide the maximum efficiency in terms of steel corrosion
protection induced by the biogenic acidity. Being the final objective that of increasing
the tolerance of mortar / concrete reinforced structures with regard to microbially
induced deterioration and increasing their maintenance-free service life. The
prolonged protective effect was meant to be achieved by encapsulating the active
substances into pH sensitive microbeads, that would release the inhibitor only when
reached by the acidification front, thus preventing a premature leaching of the
inhibitor.
1.5 Outline of the thesis
The present thesis consists of 7 chapters that are written following the track of
the temporal developments of the research activities along the three years of my PhD
research. The activities described in chapters 2 to 5 were held in the Corrosion
Engineering and Applied Electrochemistry Laboratory at Università degli Studi di
Milano; while part of the electrochemical measurements discussed in chapter 5 and
the whole experimentation of chapter 6 were performed at the MicroLab of the Civil
Engineering and Geosciences department of the Delft University of Technology, The
Netherlands.
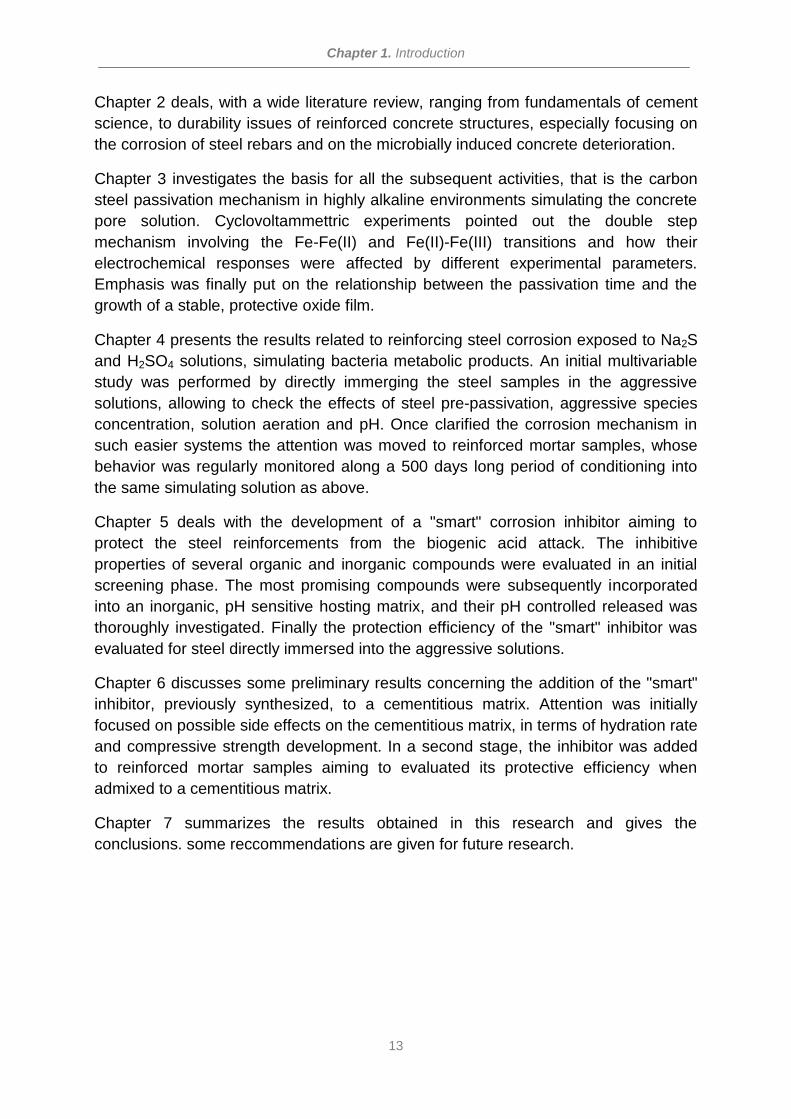
Fig.1.8 reports a flowchart of the experimental activities highlighting the principal,
logical path and collateral branches originated during the course of the work.
Chapter 1 gives a general introduction on how was developed the apparently rash
idea of opening a new research line in a completely unknown field, without being able
to count on almost any support or pre-existing skill. Furthermore the background,
objectives, and an outline on the thesis are provided.
Chapter 1. Introduction
13
Chapter 2 deals, with a wide literature review, ranging from fundamentals of cement
science, to durability issues of reinforced concrete structures, especially focusing on
the corrosion of steel rebars and on the microbially induced concrete deterioration.
Chapter 3 investigates the basis for all the subsequent activities, that is the carbon
steel passivation mechanism in highly alkaline environments simulating the concrete
pore solution. Cyclovoltammettric experiments pointed out the double step
mechanism involving the Fe-Fe(II) and Fe(II)-Fe(III) transitions and how their
electrochemical responses were affected by different experimental parameters.
Emphasis was finally put on the relationship between the passivation time and the
growth of a stable, protective oxide film.
Chapter 4 presents the results related to reinforcing steel corrosion exposed to Na2S
and H2SO4 solutions, simulating bacteria metabolic products. An initial multivariable
study was performed by directly immerging the steel samples in the aggressive
solutions, allowing to check the effects of steel pre-passivation, aggressive species
concentration, solution aeration and pH. Once clarified the corrosion mechanism in
such easier systems the attention was moved to reinforced mortar samples, whose
behavior was regularly monitored along a 500 days long period of conditioning into
the same simulating solution as above.
Chapter 5 deals with the development of a "smart" corrosion inhibitor aiming to
protect the steel reinforcements from the biogenic acid attack. The inhibitive
properties of several organic and inorganic compounds were evaluated in an initial
screening phase. The most promising compounds were subsequently incorporated
into an inorganic, pH sensitive hosting matrix, and their pH controlled released was
thoroughly investigated. Finally the protection efficiency of the "smart" inhibitor was
evaluated for steel directly immersed into the aggressive solutions.
Chapter 6 discusses some preliminary results concerning the addition of the "smart"
inhibitor, previously synthesized, to a cementitious matrix. Attention was initially
focused on possible side effects on the cementitious matrix, in terms of hydration rate
and compressive strength development. In a second stage, the inhibitor was added
to reinforced mortar samples aiming to evaluated its protective efficiency when
admixed to a cementitious matrix.
Chapter 7 summarizes the results obtained in this research and gives the
conclusions. some reccommendations are given for future research.
Chapter 1. Introduction
14
Fig. 1.8: Flow chart of the thesis, showing the distribution of the experimental activities
during the three years.
Chapter 1. Introduction
15
References
[1] E. Volpi, M. Pietripaoli, Korzhenevskaya, Stile Alpino, No.28 (2015) 56-65.
[2] G.K. Glass, C.L. Page, N.R. Short, Factors affecting the corrosion rate of steel
in carbonated mortars, Vol. 32, No 12 (1991) 1283-1294.
[3] J. Chi, C. Yang, Effects of carbonation on mechanical properties and durability
of concrete using accelerated testing method, J. Marine Sci. and Techn. 10
(2002) 14-20.
[4] S.K. Roy, K.B. Poh, D. Northwood, Durability of concrete-accelerated
carbonation and weathering studies, Building and Environment, Vol. 34, No. 5
(1999) 597-606.
[5] C. Chang, J. Chen, The experimental investigation of concrete carbonation
depth, Cement and Concrete Research 36 (2006) 1760-176.
[6] S. Sathiyanarayanan, P. Natarajan, K. Saravanan, S. Srinivasan, G.
Venkatachari, Corrosion monitoring of steel in concrete by galvanostatic pulse
technique, Cement & concrete Composites, 28 (2006) 630-637.
[7] L. Bertolini, B. Elsener, P. Pedeferri, E. Redaelli, R. Polder, Corrosion of steel in
concrete: prevention, diagnosis, repair, John Wiley & Sons, 2013.
[8] C.D. Parker, The isolation of a species of bacterium associated with the
corrosion of concrete exposed to atmospheres containing hydrogen sulfide,
Aust. J. Exp. Bio.l Med. Sci., 23 (1945) 81-90.
[9] C.D. Parker, The function of Thiobacillus concretivorus (nov. spec.) in
thecorrosion of concrete exposed to atmospheres containing hydrogen sulfide,
Aust. J. Exp. Biol. Med. Sci. 23 (1945) 91-8.
[10] M. O’Connell, C. McNally, M.G. Richardson, Biochemical attack on concrete in
wastewater applications: A state of the art review, Cement & Concrete
Composites 32 (2010) 479-485.
[11] Congressional budget office. future investment in drinking and wastewater
infrastructure. ISBN 0160512433, Congressional Budget Office; 2002.
[12] D. Roberts, D. Nica, G. Zuo, J. Davis, Quantyfying microbially induced
deterioration of concrete, Int. Biodet. Biodeg. 49 (2002) 227-234.
[13] N. De Belie, J.J. Lenehan, C.R. Braam, B. Svennerstedt, M. Richardson, B.
Sonck, Durability of Building Materials and Components in the Agricultural
Environment, Part III: Concrete Structures Journal of Agricultural Engineering
Research, Vol. 76, Issue 1(2000) 3-16.
Chapter 1. Introduction
16
[14] M.A. El-Reedy, Steel reinforced concrete structures: assessment and repair of
corrosion, CRC press, 2008.
[15] J. Monteny, E. Vincke, A. Beeldens, N. De Belie, L. Taerwe, D. Van Gemert, W.
Verstraete, Chemical, microbiological, and in situ test methods for biogenic
sulfuric acid corrosion of concrete, Cement and Concrete Research, Vol. 30,
Issue 4 (2000) 623-634.
[16] N. De Belie, J. Monteny, A. Beeldens, E. Vincke, D. Van Gemert, W. Verstraete,
Experimental research and prediction of the effect of chemical and biogenic
sulfuric acid on different types of commercially produced concrete sewer pipes,
Cement and Concrete Research, Vol. 34, Issue 12 (2004) 2223-2236.
[17] A.F. Idriss, S.C. Negi, J.C. Jofriet, G.L. Hayward, Corrosion of steel
reinforcement in mortar specimens exposed to hydrogen sulphide, part 1:
impressed voltage and electrochemical potential tests, J. agric. Engng Res., Vol
79, No.2 (2001) 223-230.
[18] A.F. Idriss, S.C. Negi, J.C. Jofriet, G.L. Hayward, Corrosion of steel
reinforcement in mortar specimens exposed to hydrogen sulphide, part 2:
diffusion tests, J. agric. Engng Res., Vol 79, No.3 (2001) 341-348.
[19] V. Assaad Abdelmseeh, J. Jofriet, G. Hayward, Sulphate and sulphide corrosion
in livestock buildings, Part II: Reinforcing steel corrosion, Biosystem
engeenering, 99 ( 2008) 382-389.

Chapter 2. Literature study
17
Chapter 2.
Literature study
Chapter 2. Literature study
18
2.1 Concrete
2.1.1 History of concrete
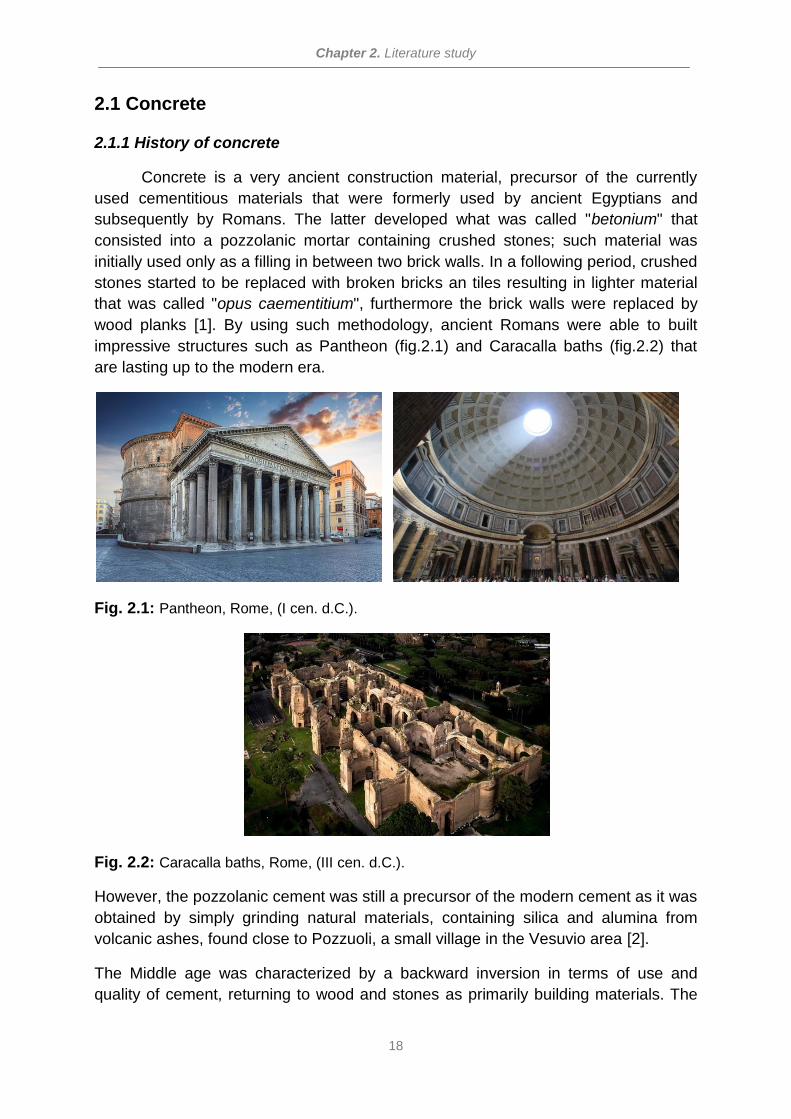
Concrete is a very ancient construction material, precursor of the currently
used cementitious materials that were formerly used by ancient Egyptians and
subsequently by Romans. The latter developed what was called "betonium" that
consisted into a pozzolanic mortar containing crushed stones; such material was
initially used only as a filling in between two brick walls. In a following period, crushed
stones started to be replaced with broken bricks an tiles resulting in lighter material
that was called "opus caementitium", furthermore the brick walls were replaced by
wood planks [1]. By using such methodology, ancient Romans were able to built
impressive structures such as Pantheon (fig.2.1) and Caracalla baths (fig.2.2) that
are lasting up to the modern era.
Fig. 2.1: Pantheon, Rome, (I cen. d.C.).
Fig. 2.2: Caracalla baths, Rome, (III cen. d.C.).
However, the pozzolanic cement was still a precursor of the modern cement as it was
obtained by simply grinding natural materials, containing silica and alumina from
volcanic ashes, found close to Pozzuoli, a small village in the Vesuvio area [2].
The Middle age was characterized by a backward inversion in terms of use and
quality of cement, returning to wood and stones as primarily building materials. The
Chapter 2. Literature study
19
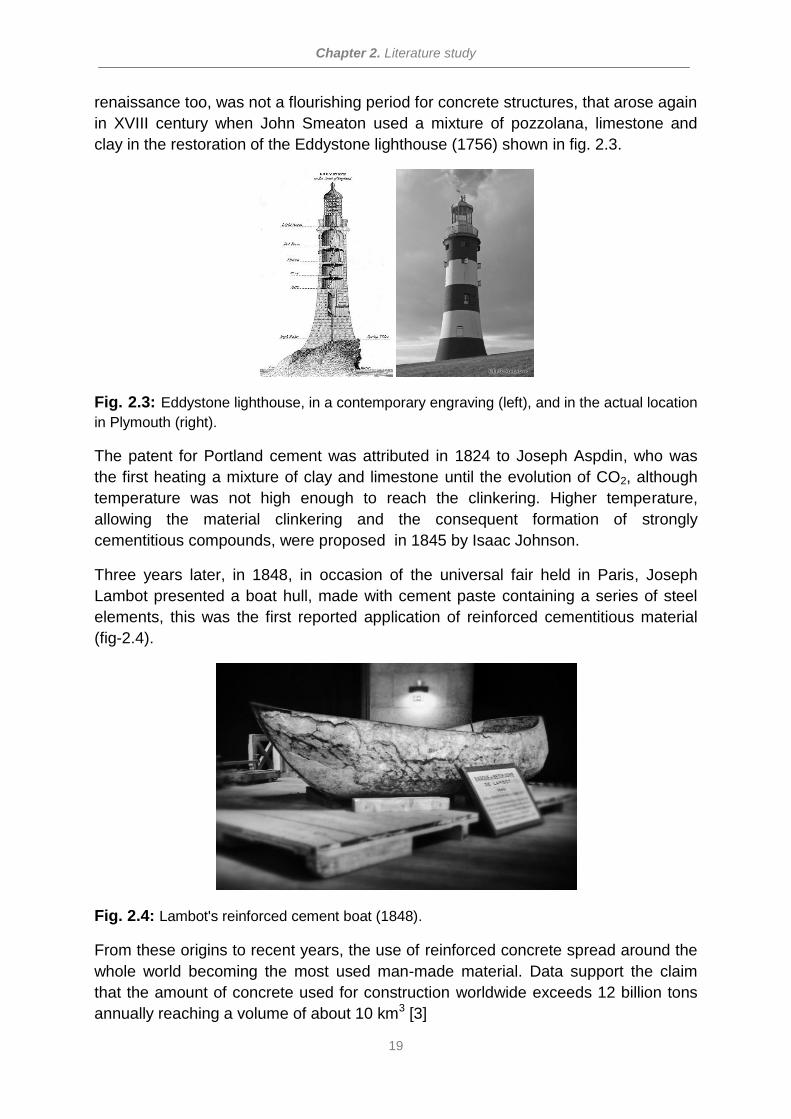
renaissance too, was not a flourishing period for concrete structures, that arose again
in XVIII century when John Smeaton used a mixture of pozzolana, limestone and
clay in the restoration of the Eddystone lighthouse (1756) shown in fig. 2.3.
Fig. 2.3: Eddystone lighthouse, in a contemporary engraving (left), and in the actual location
in Plymouth (right).
The patent for Portland cement was attributed in 1824 to Joseph Aspdin, who was
the first heating a mixture of clay and limestone until the evolution of CO2, although
temperature was not high enough to reach the clinkering. Higher temperature,
allowing the material clinkering and the consequent formation of strongly
cementitious compounds, were proposed in 1845 by Isaac Johnson.
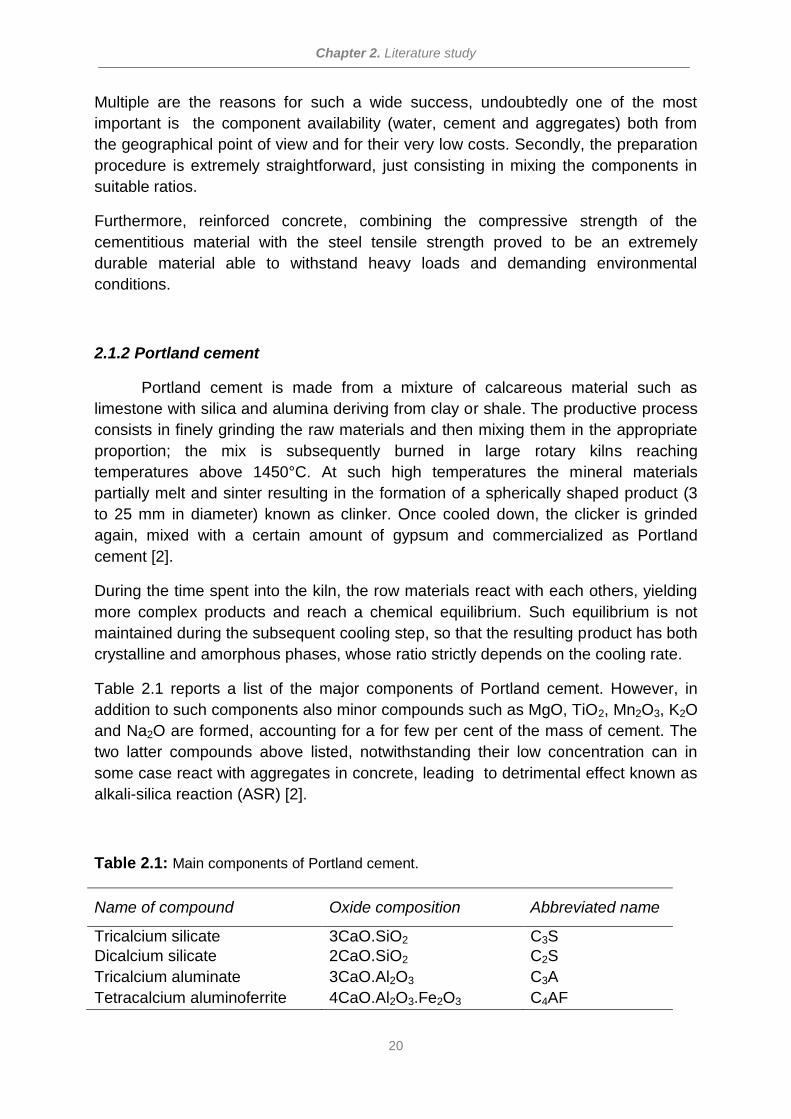
Three years later, in 1848, in occasion of the universal fair held in Paris, Joseph
Lambot presented a boat hull, made with cement paste containing a series of steel
elements, this was the first reported application of reinforced cementitious material
(fig-2.4).
Fig. 2.4: Lambot's reinforced cement boat (1848).
From these origins to recent years, the use of reinforced concrete spread around the
whole world becoming the most used man-made material. Data support the claim
that the amount of concrete used for construction worldwide exceeds 12 billion tons
annually reaching a volume of about 10 km3 [3]
Chapter 2. Literature study
20
Multiple are the reasons for such a wide success, undoubtedly one of the most
important is the component availability (water, cement and aggregates) both from
the geographical point of view and for their very low costs. Secondly, the preparation
procedure is extremely straightforward, just consisting in mixing the components in
suitable ratios.
Furthermore, reinforced concrete, combining the compressive strength of the
cementitious material with the steel tensile strength proved to be an extremely
durable material able to withstand heavy loads and demanding environmental
conditions.
2.1.2 Portland cement
Portland cement is made from a mixture of calcareous material such as
limestone with silica and alumina deriving from clay or shale. The productive process
consists in finely grinding the raw materials and then mixing them in the appropriate
proportion; the mix is subsequently burned in large rotary kilns reaching
temperatures above 1450°C. At such high temperatures the mineral materials
partially melt and sinter resulting in the formation of a spherically shaped product (3
to 25 mm in diameter) known as clinker. Once cooled down, the clicker is grinded
again, mixed with a certain amount of gypsum and commercialized as Portland
cement [2].
During the time spent into the kiln, the row materials react with each others, yielding
more complex products and reach a chemical equilibrium. Such equilibrium is not
maintained during the subsequent cooling step, so that the resulting product has both
crystalline and amorphous phases, whose ratio strictly depends on the cooling rate.
Table 2.1 reports a list of the major components of Portland cement. However, in
addition to such components also minor compounds such as MgO, TiO2, Mn2O3, K2O
and Na2O are formed, accounting for a for few per cent of the mass of cement. The
two latter compounds above listed, notwithstanding their low concentration can in
some case react with aggregates in concrete, leading to detrimental effect known as
alkali-silica reaction (ASR) [2].
Table 2.1: Main components of Portland cement.
Name of compound Oxide composition Abbreviated name
Tricalcium silicate 3CaO.SiO2 C3S
Dicalcium silicate 2CaO.SiO2 C2S
Tricalcium aluminate 3CaO.Al2O3 C3A
Tetracalcium aluminoferrite 4CaO.Al2O3.Fe2O3 C4AF
Chapter 2. Literature study
21
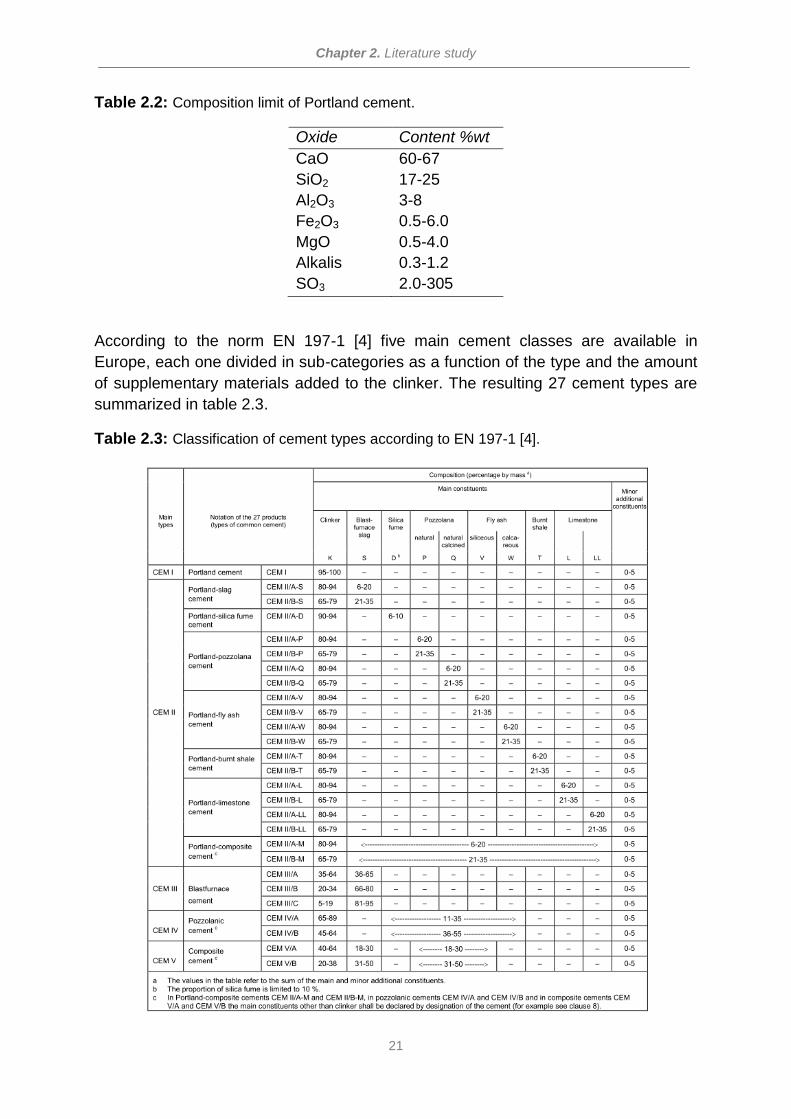
Table 2.2: Composition limit of Portland cement.
Oxide Content %wt
CaO 60-67
SiO2 17-25
Al2O3 3-8
Fe2O3 0.5-6.0
MgO 0.5-4.0
Alkalis 0.3-1.2
SO3 2.0-305
According to the norm EN 197-1 [4] five main cement classes are available in
Europe, each one divided in sub-categories as a function of the type and the amount
of supplementary materials added to the clinker. The resulting 27 cement types are
summarized in table 2.3.
Table 2.3: Classification of cement types according to EN 197-1 [4].
Chapter 2. Literature study
22
2.1.3 Cement Hydration
By simply mixing the cement powder with water a fluid paste is initially
obtained, that undergoes to a slow stiffening process yielding to a solid mass, the
hydrated cement paste. It has to be mentioned that the hydration process is a
general term which includes the different interactions occurring between cement
grains and water molecules, involving either the water molecule addition and
hydrolysis reactions.
It can be easily imagined that the hydration process does not proceed at a constant
rate, but significantly slow over time due to diffusion limitations occurring as a
consequence of the stiffening paste, so that even after a long period, still remain an
appreciable amount of unreacted cement.
It is well known that products of cement hydration are chemically equivalent to
hydration products of the single components under similar condition, thus in order to
get more insight into the cement hydration, tricalcium silicate hydrate (C3SH),
dicalcium silicate hydrate (C2SH) and tricalcium alluminate hydrate (C3AH) can be
individually discussed. Tetracalcium aluminoferrite is believed to be hydrated as
tricalcium alluminate hydrate and an amorphous phase such as CaO.Fe2O3(aq).
The hydration of the two calcium silicates occurs at different rate being faster for C3S
and slower for C2S but leads to the same products indicated as calcium silicate
hydrates (CSH). Calcium silicates are the responsible for cement paste alkalinity as
their hydration reaction produces portlandite (Ca(OH)2) as shown in reaction 1,2
where H stands for H2O.
2C3S + 6H → C3S2H3 + 3Ca(OH)2 (1)
2C2S + 4H → C3S2H3 + Ca(OH)2 (2)
The reaction of pure C3A is extremely fast an leads to an immediate stiffening of the
paste known as flash-set; the gypsum addition to the clinker limits such reaction as
the two components react together yielding insoluble calcium sulfoaluminate
(3CaO.Al2O3.3CaSO4.32H2O) [2].The C3A hydration reaction can be expressed as in
(3):
C3A + 6H → C3AH6 (3)
C3A do not contribute to the strength of cement paste, and in addition it can cause
some issue because of its immediate stiffening, the main motivation for its presence
in the clinker is that it reduces the clinkering temperature facilitating the lime and
silica combination. A further positive aspect of C3A is its ability of binding chlorides.
2.1.4 Structure of the hydrated cement paste
Contrarily to what could be expected, most of the mechanical properties of
hardened cement paste, depend more on the physical structure of the hydrated
Chapter 2. Literature study
23
cement paste rather than on its chemical composition; thus, understanding the
development of cement microstructure during the hydration process plays a key role
in the study of the transport properties of the hardened paste.
At any stage of hydration, the hardened paste consist of poorly crystalline hydrates of
the various cement components, Ca(OH)2 crystals, unreacted cement grains and the
residue of the water filled spaces in the fresh paste [2]. These latter are known as
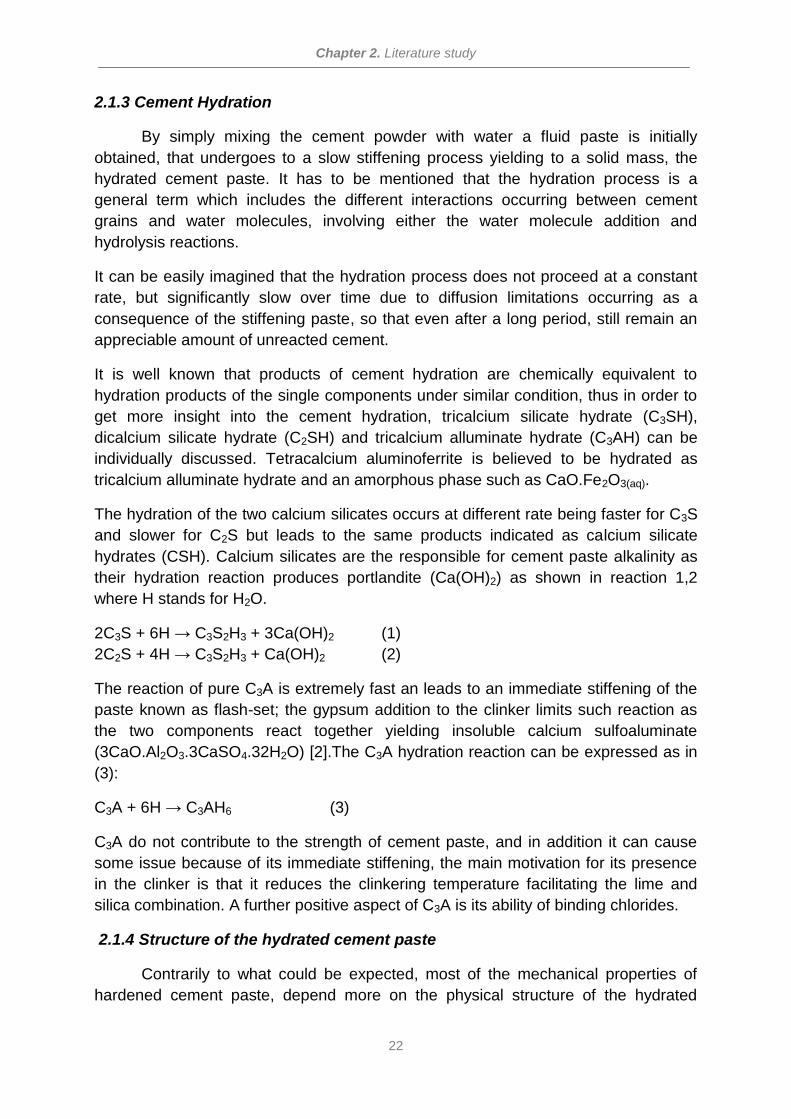
capillary pores and are characterized by dimensions in the micron range (fig.2.5).
Capillary pores are not the only porosity form in hardened cement past, actually most
of the hydrated product are colloidal, thus characterized by a high surface area due
to interstitial voids, such pores are known as gel pores and have a nominal diameter
around 3 nm. Furthermore, an erroneous compaction of the fresh mixture, or the
addition of air entrapping agents can induce the presence of bigger air voids as
indicated in fig. 2.5.
Gel pores and capillary pores are generally filled with an interstitial solution, whose
composition is mainly dependent on the cement type. Such pore solution results to
be extremely alkaline, having a pH values of 13 of higher, because of the dissolved
Ca(OH)2, furthermore it generally contains also Na+, K+ and Ca+
Taking into consideration that the pores relevant to permeability are those with a
diameter of at least 120-160 nm, capillary pores constitute the preferential pathways
for ion diffusion so that they are considered as the main factor affecting the cement
paste permeability and its susceptibility to freeze-thaw damaging. Such kind of
porosity evolves with the cement hydration being initially higher and decreasing as
water reacts with unhydrated cement grains. However it has been demonstrated that
for a water/cement ratio higher than 0.38 there will be some volume of capillary pores
left, even after the hydration process has been completed [2].
Fig.2.5: Pore size distribution in hydrated cement paste [5].
Chapter 2. Literature study
24
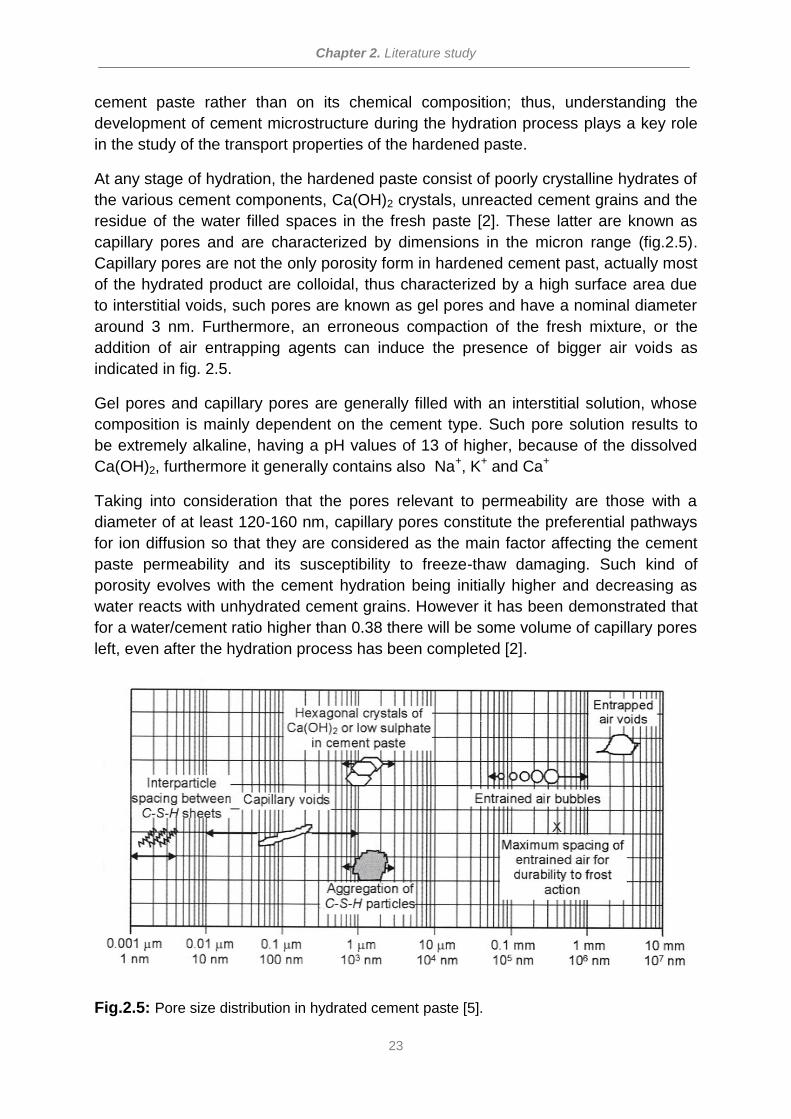
Capillary pores, allow ions migration, unless they constitute an interconnected
network; as the hydration process advance, the solid content of the paste increase
and part of the original pores are blocked. Figure 2.6 shows the relation between the
water/cement ratio and the hydration degree at which the capillary pore are blocked,
it clearly points out that for w/c ratio above 0.7 even the complete hydration would not
produce enough gel to block all the pores [2].
Fig. 2.6: Relation between the water/cement ratio and the hydration degree at which the
capillary pore are blocked [6].
2.2 Durability of concrete structures
Durability of concrete may be defined as the ability of concrete to resist
weathering action, chemical attack, and abrasion while maintaining its desired
engineering properties. Different concrete structures require different degrees of
durability, depending on the exposure environment and desired properties. For
example, concrete exposed to tidal seawater will have different requirements than an
indoor concrete floor.
There are several factors that can affect the concrete durability, the main important
are:
Cement content: Mix must be designed to ensure cohesion and prevent segregation
and bleeding. An appropriate balance between the water/cement ratio has to be
found. Lowering the water content, leads to a reduced workability and could induce
an inadequate compaction. Conversely, if water is added to improve workability,
water/cement ratio increases, resulting in highly permeable material.
Chapter 2. Literature study
25
Compaction: An inadequate compaction generally leads to heterogeneous
distribution of concrete elements, thus introducing defects in the structure.
Curing: It is very important to permit proper strength development by keeping the
freshly cast concrete within certain ranges of temperature and humidity.
Cover: In order to protect steel rebars from corrosion the concrete cover thickness
should respect the limits set in codes
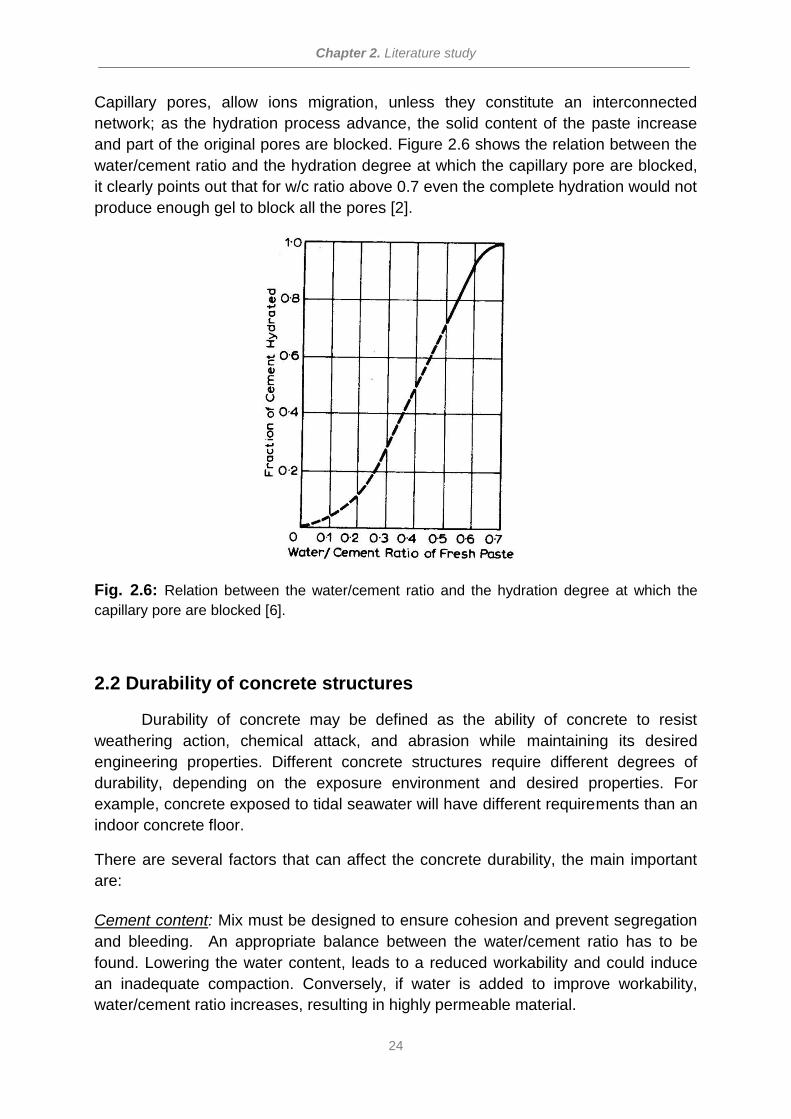
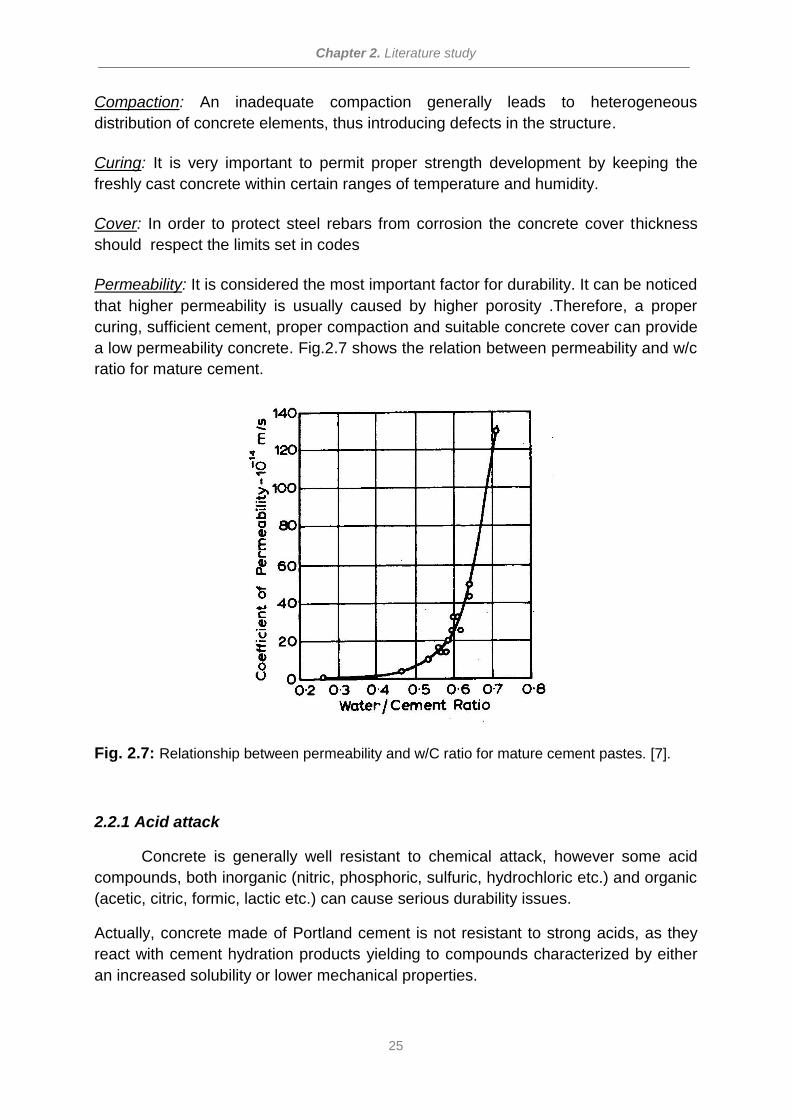
Permeability: It is considered the most important factor for durability. It can be noticed
that higher permeability is usually caused by higher porosity .Therefore, a proper
curing, sufficient cement, proper compaction and suitable concrete cover can provide
a low permeability concrete. Fig.2.7 shows the relation between permeability and w/c
ratio for mature cement.
Fig. 2.7: Relationship between permeability and w/C ratio for mature cement pastes. [7].
2.2.1 Acid attack
Concrete is generally well resistant to chemical attack, however some acid
compounds, both inorganic (nitric, phosphoric, sulfuric, hydrochloric etc.) and organic
(acetic, citric, formic, lactic etc.) can cause serious durability issues.
Actually, concrete made of Portland cement is not resistant to strong acids, as they
react with cement hydration products yielding to compounds characterized by either
an increased solubility or lower mechanical properties.
Chapter 2. Literature study
26
Among the cement hydration products, portlandite is certainly the most vulnerable to
an acid attack, however calcium silicates hydrate can also be attacked. According to
the literature [8], the limit safe pH should be around 6.5, and the attack becomes
extremely severe for pH values lower than 4.5.
In case of acid attack the deterioration rate does not proceed linearly with time, but it
is roughly proportional to its square root, being initially higher and slowing over time.
The main motivation of such behavior is that the Ca(OH)2 dissolution leaves a
gradually thickening surface layer of insoluble products that hinder the further
penetration of the aggressive solution. Furthermore, the rate of attack decrease
when, because of the fully deteriorated superficial cementitious layer, the aggregates
become exposed thus decreasing the vulnerable surface [2]
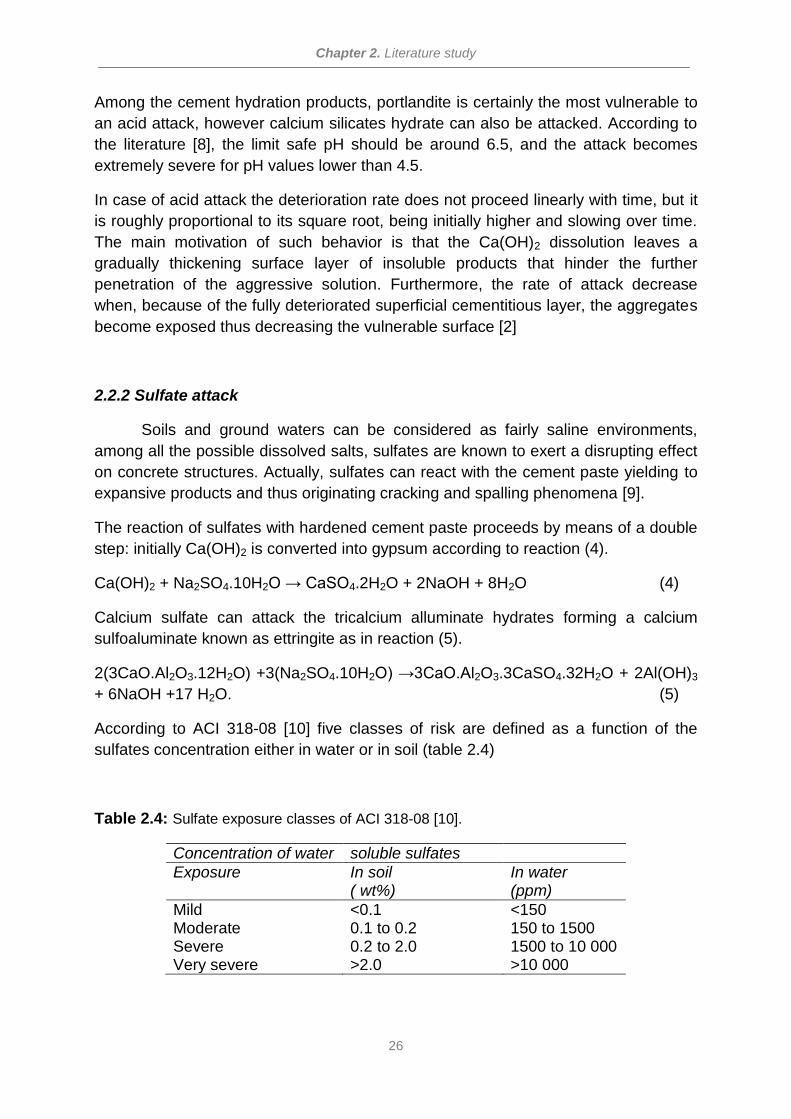
2.2.2 Sulfate attack
Soils and ground waters can be considered as fairly saline environments,
among all the possible dissolved salts, sulfates are known to exert a disrupting effect
on concrete structures. Actually, sulfates can react with the cement paste yielding to
expansive products and thus originating cracking and spalling phenomena [9].
The reaction of sulfates with hardened cement paste proceeds by means of a double
step: initially Ca(OH)2 is converted into gypsum according to reaction (4).
Ca(OH)2 + Na2SO4.10H2O → CaSO4.2H2O + 2NaOH + 8H2O (4)
Calcium sulfate can attack the tricalcium alluminate hydrates forming a calcium
sulfoaluminate known as ettringite as in reaction (5).
2(3CaO.Al2O3.12H2O) +3(Na2SO4.10H2O) →3CaO.Al2O3.3CaSO4.32H2O + 2Al(OH)3
+ 6NaOH +17 H2O. (5)
According to ACI 318-08 [10] five classes of risk are defined as a function of the
sulfates concentration either in water or in soil (table 2.4)
Table 2.4: Sulfate exposure classes of ACI 318-08 [10].
Concentration of water soluble sulfates
Exposure In soil ( wt%)
In water (ppm)
Mild <0.1 <150 Moderate 0.1 to 0.2 150 to 1500 Severe 0.2 to 2.0 1500 to 10 000 Very severe >2.0 >10 000
Chapter 2. Literature study
27
2.2.3 Alkali-Silica reaction
As above mentioned in section 2.1.2 in the present chapter, Portland cement
contains small amounts of alkalis, i.e. Na2O an K2O that once hydrated become
NaOH and KOH contributing to the high alkalinity of the concrete pore solution. Such
compounds can react with certain type of siliceous aggregates resulting in a
hygroscopic gel made of alkali and calcium silicates. Upon water absorption, such gel
expands leading to extended concrete cracking [11].
The more disordered and amorphous is the structure of the siliceous aggregates, the
higher will be their reactivity with cement alkalis. So that highly crystalline quartz is
scarcely reactive, conversely, the amorphous opal results to be highly reactive.
2.2.4 Freezing and thawing
When the external temperature drops below 0°C, the concrete pore solution
can freeze, consequently increasing its volume up to 9%; obviously the resulting
pressures, and in particular their repetitiveness due to daily temperature fluctuations,
can produce damages in concrete structures, generally in the form of extensive
cracking.
Freezing is a gradual process, because of three main reasons: (i) the rate of heat
transfer through concrete is quite low, (ii) salts of the concrete pore solution migrate,
and concentrate into the unfrozen solution thus lowering the freezing temperature,
(iii) the freezing point depends on the size of the pore, decreasing with their size.
According to these statements, the freezing starts from largest pores and gradually
extends to the smaller ones. However it is important to notice that only capillary
pores are involved in such a deterioration mechanism, as gel pore are so small that
their water freeze only if temperature drop below -78°C [12]. On the other side,
bigger pores such as those due to air entrapping agents, are generally filled with air,
and consequently do not contribute to the deterioration mechanism.
2.2.5 Carbonation
CO2 is naturally part of the atmosphere, in concentrations ranging from 0.04%
to 0.2% in rural and highly anthropic area respectively. Being an acidic gas, tends to
react with hydrated cement paste neutralizing its alkalinity in a process that is known
as carbonation, (reaction 6).
CO2 + Ca(OH)2 → CaCO3 + H2O (6)
With respect to durability, the effect of carbonation is that of significantly decrease
the pH of the pore solution up to values around 8. Carbonation itself, does not
damage concrete, conversely the CaCO3 precipitation contributes in reducing the
Chapter 2. Literature study
28
porosity. Durability issues arise when the carbonation front reaches the steel
interface, as at such pH the protective oxide layer is dissolved the steel starts
corroding.
Carbonation occurs progressively from the outside, the propagation rate slows over
time because CO2 diffusion is hindered by the outer carbonated layer [13]; the rate
determining factors are:
Relative humidity: gaseous CO2 cannot react with solid hydrated products, so that for
RH lower than 40% carbonation is negligible; on the other hand, the CO2 diffusion in
water filled pores is four order of magnitude lower that the in empty ones. Both these
features concurs in determining a RH range of 50 - 70% where carbonation rate are
the highest.
CO2 concentration: higher CO2 concentrations result in increased carbonation rate.
Temperature: increasing temperatures lead to higher carbonation rates.
Concrete alkalinity: Different cement types, especially in terms of clinker /
supplementary materials ratio, result in a different portlandite content of the hydrated
paste, so that blended cement producing a lower amount of Ca(OH)2 are more prone
to carbonation.
Water / cement ratio: being the carbonation process related to a diffusion
mechanism, the lower concrete porosity due to a lower w/c ratio contributes in
slowing the process.
2.3 Microbial deterioration of RC structures
2.3.1 Mechanism
Although attracting less attention than the deterioration mechanisms above
discussed, the microbially induced concrete corrosion (MICC) can significantly
decrease the service life of several reinforced concrete structures. Most of the
studies dealing with such topic are focused on concrete pipes in sewer network, this
is because several conditions such as the high organic carbon content of sewer
water, generally slow flows, and the coexisting of aerobic/anaerobic regions result in
a favorable environment for the growth of bacteria colonies [14,15]. According to a
recent (2005) U.S. survey, performed by the Environmental Protection Agency (EPA)
the US would need an investment of $ 390 billion along 20 years, to repair, replace
and build wastewater infrastructures.
However, concrete deterioration attributed to microbial activities has been observed
in several other concrete structures provided that they are partially immersed in
Chapter 2. Literature study
29
steady water, examples are: wastewater treatment plants [16], swimming pools [17],
cooling towers [18], bridge piers[19] animal housing facilities [20-22].
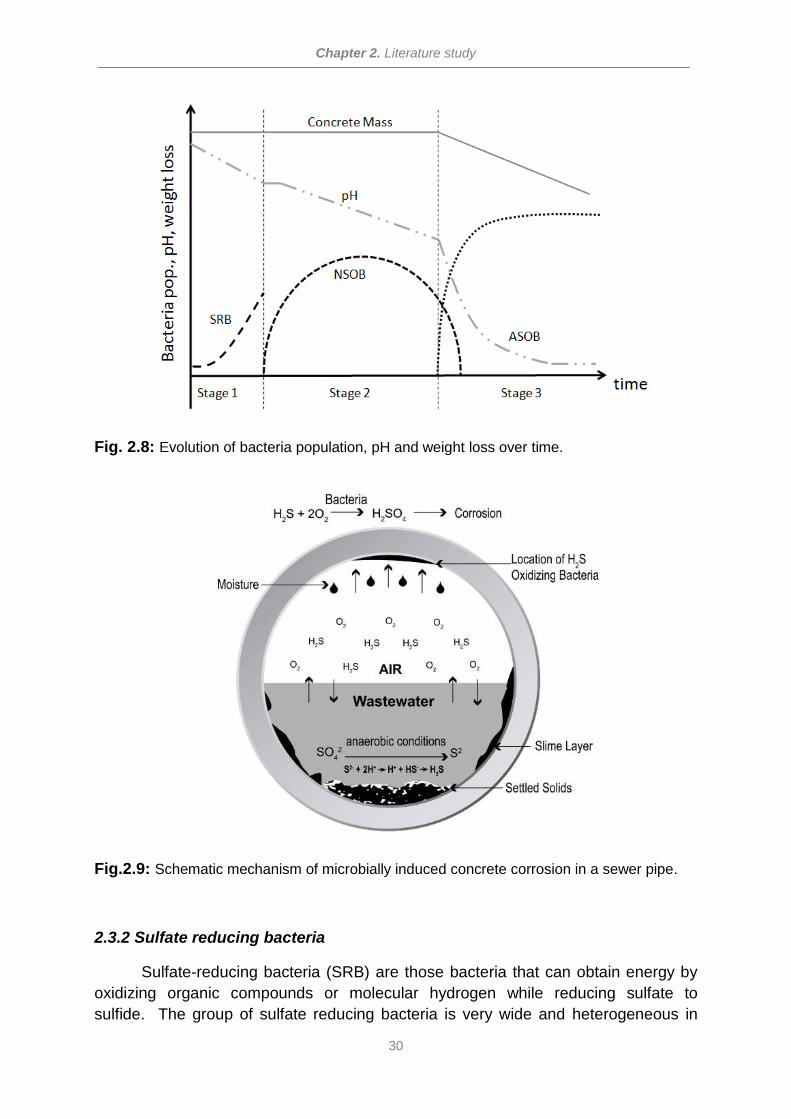
According to [23] the microbial deterioration of concrete sewer pipes occurs in three
well temporally defined stages whose schematic is shown in figure 2.8.
Initially, sound concrete is characterized by an extremely alkaline pH, and
microorganism capable of converting hydrogen sulfide to sulfuric acid cannot grow at
such elevated pH. However, as detailed in section 2.2.5, the concrete surface does
not remain basic through its whole life, as the joint effect of atmospheric CO2 together
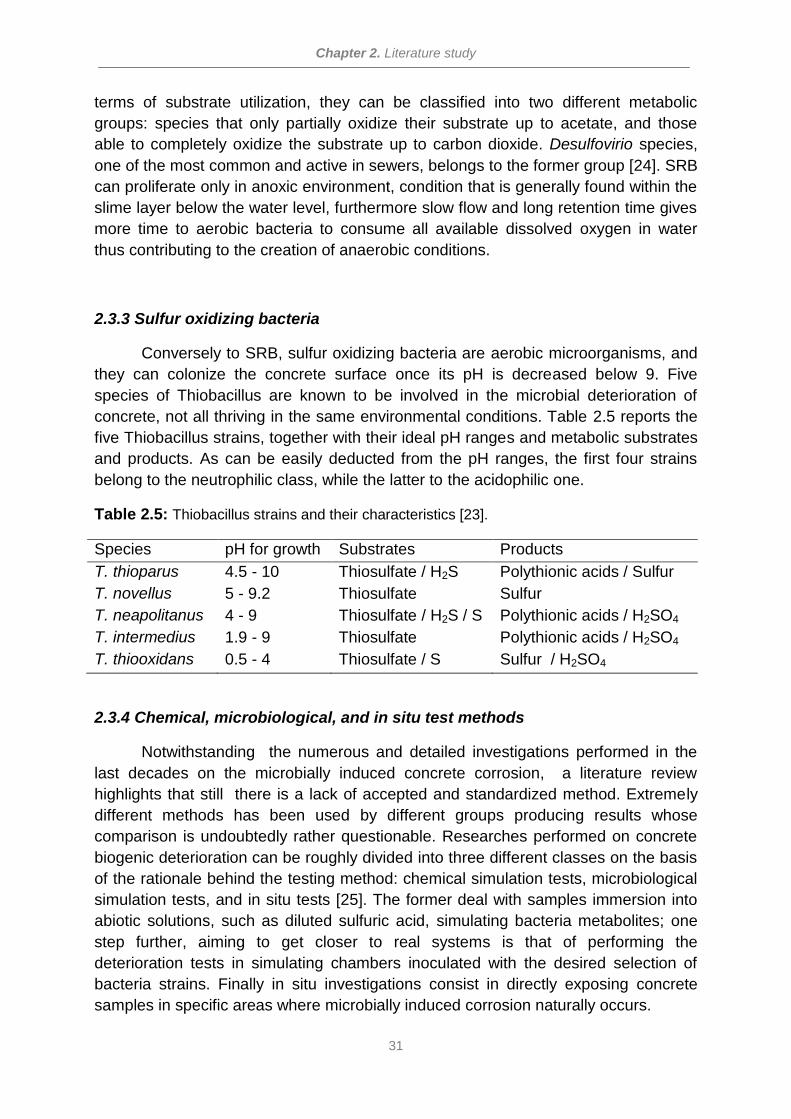
with the biogenic H2S can induce an pH decrease up to values around 8. Biogenic
H2S arises from sulfate reducing bacteria (SRB) metabolism that anaerobically
converts sulfates into sulfides, whose chemical equilibrium transform into the poorly
soluble H2S that consequently leaves the solution and accumulates into the pipe
headspace. Poor ventilation of these areas leads to an H2S enrichment and
consequently to its dissolution into the thin moisture film present on the concrete
walls above the water level where it is oxidized to elemental sulfur by the
atmospheric oxygen. Once the pH on the concrete surface is reduced to about 9, and
provided that enough nutrients, moisture, and oxygen are available, some sulfur
oxidizing bacteria can proliferate. Such kind of bacteria can be classified as
neutrophilic (NSOB) or acidophilic (ASOB) according their pH range for growth.
Neutrophilic bacteria produce some acidic products and convert sulfides into
elemental sulfur and polythionic acid, thus initiating a microbial succession. Around
pH 4 or 5, acidophilic bacteria begin to colonize the concrete surface, and oxidizing
sulfur to sulfuric acid, their growth is accompanied by a drastic pH decrease that can
reach values as low as 0.5. During this last stage the biogenic sulfuric acid reacts
with the cementitious material according to mechanisms of acid and sulfate attacks
described in sections 2.2.1 and 2.2.2 leading to expansive products such as gypsum
and ettringite.
Chapter 2. Literature study
30
Fig. 2.8: Evolution of bacteria population, pH and weight loss over time.
Fig.2.9: Schematic mechanism of microbially induced concrete corrosion in a sewer pipe.
2.3.2 Sulfate reducing bacteria
Sulfate-reducing bacteria (SRB) are those bacteria that can obtain energy by
oxidizing organic compounds or molecular hydrogen while reducing sulfate to
sulfide. The group of sulfate reducing bacteria is very wide and heterogeneous in
Chapter 2. Literature study
31
terms of substrate utilization, they can be classified into two different metabolic
groups: species that only partially oxidize their substrate up to acetate, and those
able to completely oxidize the substrate up to carbon dioxide. Desulfovirio species,
one of the most common and active in sewers, belongs to the former group [24]. SRB
can proliferate only in anoxic environment, condition that is generally found within the
slime layer below the water level, furthermore slow flow and long retention time gives
more time to aerobic bacteria to consume all available dissolved oxygen in water
thus contributing to the creation of anaerobic conditions.
2.3.3 Sulfur oxidizing bacteria
Conversely to SRB, sulfur oxidizing bacteria are aerobic microorganisms, and
they can colonize the concrete surface once its pH is decreased below 9. Five
species of Thiobacillus are known to be involved in the microbial deterioration of
concrete, not all thriving in the same environmental conditions. Table 2.5 reports the
five Thiobacillus strains, together with their ideal pH ranges and metabolic substrates
and products. As can be easily deducted from the pH ranges, the first four strains
belong to the neutrophilic class, while the latter to the acidophilic one.
Table 2.5: Thiobacillus strains and their characteristics [23].
Species pH for growth Substrates Products
T. thioparus 4.5 - 10 Thiosulfate / H2S Polythionic acids / Sulfur
T. novellus 5 - 9.2 Thiosulfate Sulfur
T. neapolitanus 4 - 9 Thiosulfate / H2S / S Polythionic acids / H2SO4
T. intermedius 1.9 - 9 Thiosulfate Polythionic acids / H2SO4
T. thiooxidans 0.5 - 4 Thiosulfate / S Sulfur / H2SO4
2.3.4 Chemical, microbiological, and in situ test methods
Notwithstanding the numerous and detailed investigations performed in the
last decades on the microbially induced concrete corrosion, a literature review
highlights that still there is a lack of accepted and standardized method. Extremely
different methods has been used by different groups producing results whose
comparison is undoubtedly rather questionable. Researches performed on concrete
biogenic deterioration can be roughly divided into three different classes on the basis
of the rationale behind the testing method: chemical simulation tests, microbiological
simulation tests, and in situ tests [25]. The former deal with samples immersion into
abiotic solutions, such as diluted sulfuric acid, simulating bacteria metabolites; one
step further, aiming to get closer to real systems is that of performing the
deterioration tests in simulating chambers inoculated with the desired selection of
bacteria strains. Finally in situ investigations consist in directly exposing concrete
samples in specific areas where microbially induced corrosion naturally occurs.
Chapter 2. Literature study
32
Chemical tests
Because of their ease of setting, and getting reproducible experimental
conditions, most of the studies dealing with microbial concrete deterioration are just
abiotic, chemical tests. Within such category, two more classes can be individuated:
(i) realistic concentration experiments that are generally based on long term
monitoring or (ii) accelerated tests where the degradation rate can be increased by
means of higher concentration of the aggressive medium, higher temperature or
larger contact surfaces [25].
Both the approaches have advantages and drawbacks, so that the choice of one
over the other should be carefully evaluated on the basis of the research objectives.
Present service life expectations for modern reinforced concrete structures generally
lie in the range between 50 - 100 years, this immediately points out the main
drawback of close-to-reality investigations. No measurements can be reasonably
carried out for such a long period, thus only the very first stages of the deterioration
can be investigated, while long terms considerations can only arise from
extrapolation of the initial data. This implicate the risk of not considering certain
deterioration mechanisms not noticeable during the monitoring period and gaining
importance in a later period [25]. As an example, Romben [26] stated that in the case
of sulfuric acid attack of concrete, as it involves a complex series of different
processes, extrapolation procedures do not allow to obtain reliable results.
The above discussed limitation, can be overcome, by accelerated degradation tests,
in which the entire life of a specific sample can be simulated until its failure, by
increasing the aggressive species concentrations or the area/volume ratio, raising
temperature, or using wetting and drying cycles [25]. On the other hand, such
approach could modify the mechanisms of the attack, thus giving misleading results if
the aim is that of precisely predicting the behavior in the field. On this purpose,
Cohen et al. [27] found that in the case of sulfate attack the mechanism significantly
change as a function of sulfates concentration.
Furthermore it seems important to mention that cementitious samples for laboratory
studies can be produced as cement paste (cement/water), mortar
(cement/water/sand) or concrete (cement/water/sand/concrete), but results obtained
on one of these types cannot be easily extrapolated to the remaining ones because
of the substantial microstructural differences arising from the presence of interfacial
transition zones between aggregates and cement paste.
Chapter 2. Literature study
33
Microbiological tests
As can be easily deducted from what above discussed, the microbiologically
induced concrete deterioration is an extremely complex process, where fine cement
chemistry merges with microbial activities, both of them being significantly affected
by external, environmental conditions such as temperature, nutrients availability,
water flow rate etc. From this point of view, purely chemical simulation of bacteria
metabolites, is an extremely simplified system where most of such important
variables are not taken into account.
For this purpose researchers tried to simulate the microbial degradation mechanism
as it happens in situ, by means of on purpose designed simulation chambers like
those depicted in fig.2.10.
Fig.2.10(a) shows the simulation chamber developed by Sand et al. [28]. According
to the authors such system was able to accelerate about eight times the rate of the
processes occurring in situ. Concrete blocks were partially immersed in water lying
on the bottom of the chamber and maintained at controlled temperature (30°C) and
humidity (100%). Thiobacilli were separately growth in an external fermentor feed
with sulfur and thiosulfate. The obtained microbial culture was periodically sprayed
over the concrete samples. Such chamber was successfully used for investigating
how different Thiobacillus strains and sulfur sources affect the concrete deterioration.
Hormann et al. [29] developed a similar chamber (fig. 2.10(b)) in which mortar cubes
were periodically flooded for 5 min followed by 1 hour interruption with a Thiobacilli
culture. Weight loss measurements detected different values for the different cement
types after just one month of accelerated test.
Mori et al. [30] aiming to investigate the effect of nutrients on concrete corrosion,
used a chamber with a very high H2S concentration in which their mortar samples
were partially immersed into three different solutions: water, a special culture medium
and sewage. Test specimens were inoculated with T. Thiooxidans every two weeks
and the corrosion rate was estimated by measuring the cross section reduction of the
mortar prisms (fig. 2.10(c)).
Finally Vinkle et al. [31-33] developed an accelerated test method for the evaluation
of biogenic sulfuric acid corrosion of concrete, aiming to investigate the responses of
different concrete mixtures. The above cited method consists in a four step
procedure according to which the mortar sample are initially exposed to H2S (step 1)
followed by an incubation period in a biological sulfur suspension containing bacteria
(step 2); then, corrosion products removal because of sewage flow is simulated by
rinsing the samples with water (step 3) and a final drying concludes a deteriorating
cycle (step 4). The duration of single cycle is 17 days (3 + 10 + 2 + 2) and they can
be repetitively performed one after each other.
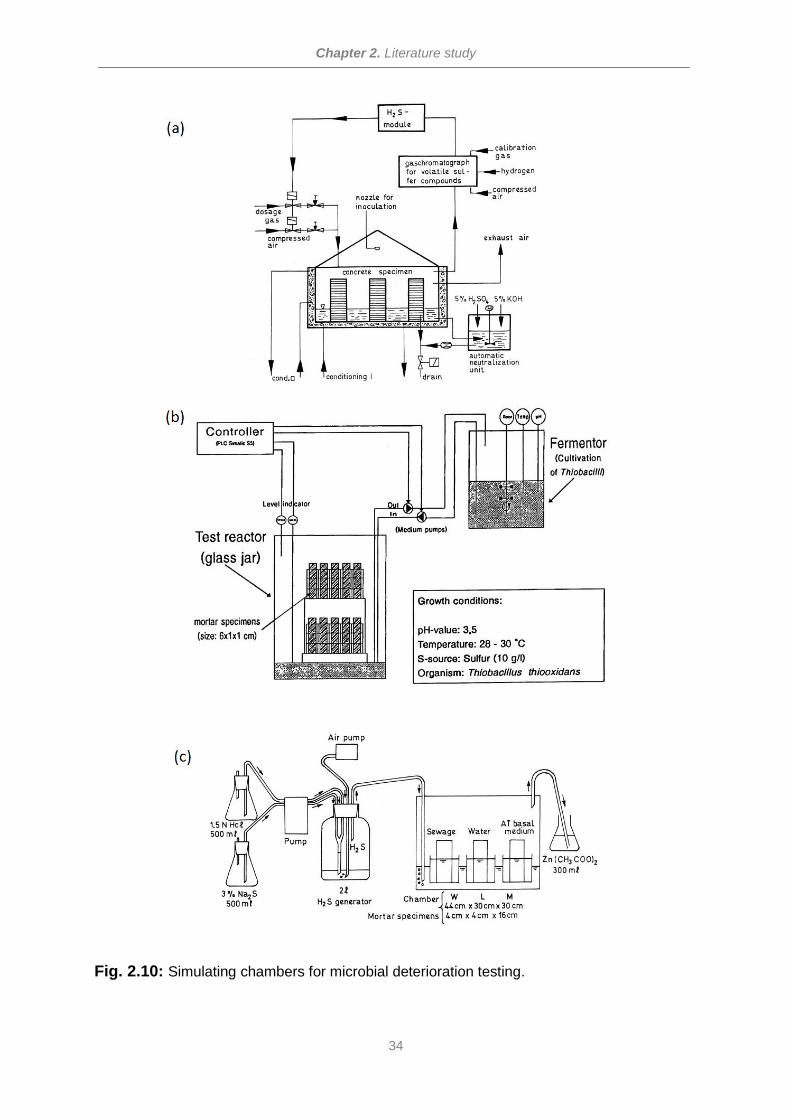
Chapter 2. Literature study
34
Fig. 2.10: Simulating chambers for microbial deterioration testing.
Chapter 2. Literature study
35
In situ tests
Notwithstanding the above described efforts of realistically simulating the
sewer environment, reproducing all the natural conditions is still an hard task, so that
the only way to study the real processes taking into account all factors and
interaction is the in situ exposure test [25]. According to this method, series of
samples are placed in sewer pipes where the microbial deterioration was found to
occur and monitored over long period of time. As an example, a series of in situ
measurement were performed in the Netherlands [34,35] where concrete samples
made with different mixes were exposed for 35 months in 10 different locations and
mass loss, neutralization depth, porosity and flexural strength were regularly
monitored.
2.3.5 Measures for control
As thoroughly discussed in the previous paragraphs, microbially induced
concrete corrosion is due to a double step process in which SRB and SOB are
involved. Accordingly the measures of control, acting either on the first or on the
second step can be potentially effective in the overall inhibition of the deterioration
process.
Focusing on the H2S production step, the conventional treatment method involves the
addition of some chemicals in the flowing waste water to control the sulfide
concentration. Chemicals used for such purpose are ferric or ferrous chloride, ferric
nitrate and hydrogen peroxide [36]. The mechanism by which such chemicals control
the sulfide emission is chemical oxidation or precipitation. Sulfides can also be
successfully oxidized by treatment with ozone. Alternatively, as SRB proliferate in
anoxic environment, air injection is an effective method to control the H2S
concentration [37].
Prevention strategies, aiming to protect concrete from the biogenic sulfuric acid
attack can be divided into two main approaches the first one based on modifying the
cement mixture while the second one on using acid resistant coating and lining.
As it has been clearly demonstrated that conventional cement type does not offer a
suitable resistance to acidic conditions that can be found in sewer networks, several
attempts have been performed to modify the cementious matrix aiming to guarantee
a longer durability. Schmidt et al. [38] found significantly better performance of high
alumina cement. Alternatively, blending some polymers was found to led to a denser
cementitious matrix characterized by small discontinuous pores, both these features
hindering the sulfuric acid diffusion [39].
Concerning the coating approach, several alternatives have been tested such as
those based on bituminous material, polyurethane and epoxy resins, polymer
Chapter 2. Literature study
36
modified mortar lining have also been successfully used for corrosion protection
against biogenic sulfuric acid attack.
Biocides substances, such as quaternary ammonium compounds, were found to
have biocidal properties against sulfur oxidizing bacteria, however their use, and of
any other biocidal agent, should be considered with exceptional care, as they could
also have important and undesired effect on the downstream biological processes
[36].
2.4 Corrosion of steel in concrete
Up to this point, several deterioration mechanisms have been presented,
affecting the durability of reinforced concrete structures, all of them dealing with
chemical reactions occurring between the hydrated cement products and external
aggressive agents such as acids, sulfates, CO2 etc. However, reinforced concrete is
a composite material, whose performance, arises from the combination of the
cementitious matrix with steel reinforcing bars, and in certain conditions, that will be
thoroughly discussed in the following paragraphs, the reinforcements itself can suffer
from severe deterioration thus undermining the structural integrity, and leading, in
extreme cases, to its collapse.
According to literature [40],corrosion of reinforcements is the predominant factor
causing widespread premature deterioration of concrete constructions worldwide,
especially for structures located in the coastal marine environment. This results in an
enormous economic loss due to maintenance and repair costs. A report by the
United States Secretary Transportation stated that rebars corrosion is a multibillion
dollar problem and that the annual expenditure for repair and rehabilitation exceeds
fifty per cent of the total construction costs [41]
2.4.1 The corrosion process
The success of reinforced concrete as a building material probably comes
from the mutual advantages resulting from the combination of steel and concrete, the
former providing tensile strength to the structure, while sound concrete is
characterized by several features such as high alkalinity, high electrical resistivity,
and mass transport limitations that protect steel from corrosion.
As already discussed in the previous paragraphs, the cement hydration leads to the
formation of a porous cementitious matrix whose pores are filled with an extremely
alkaline solution due to the presence of Ca(OH)2, NaOH and KOH resulting from the
hydration of C3S, Na2O and K2O respectively. Such an alkaline environment,
characterized by pH values around 13 is the main responsible for the formation of an
ultrathin oxide layer on the steel rebar surface. The Pourbaix diagram reported in fig.
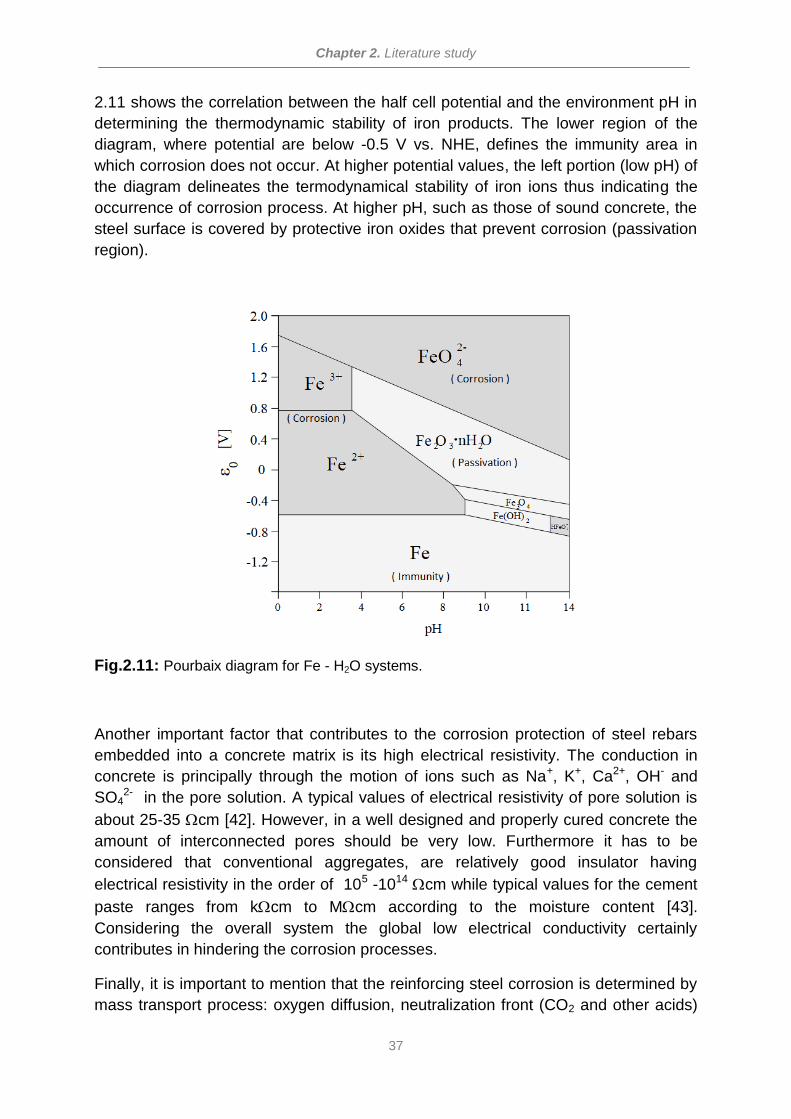
Chapter 2. Literature study
37
2.11 shows the correlation between the half cell potential and the environment pH in
determining the thermodynamic stability of iron products. The lower region of the
diagram, where potential are below -0.5 V vs. NHE, defines the immunity area in
which corrosion does not occur. At higher potential values, the left portion (low pH) of
the diagram delineates the termodynamical stability of iron ions thus indicating the
occurrence of corrosion process. At higher pH, such as those of sound concrete, the
steel surface is covered by protective iron oxides that prevent corrosion (passivation
region).
Fig.2.11: Pourbaix diagram for Fe - H2O systems.
Another important factor that contributes to the corrosion protection of steel rebars
embedded into a concrete matrix is its high electrical resistivity. The conduction in
concrete is principally through the motion of ions such as Na+, K+, Ca2+, OH- and
SO42- in the pore solution. A typical values of electrical resistivity of pore solution is
about 25-35 cm [42]. However, in a well designed and properly cured concrete the
amount of interconnected pores should be very low. Furthermore it has to be
considered that conventional aggregates, are relatively good insulator having
electrical resistivity in the order of 105 -1014 cm while typical values for the cement
paste ranges from kcm to Mcm according to the moisture content [43].
Considering the overall system the global low electrical conductivity certainly
contributes in hindering the corrosion processes.
Finally, it is important to mention that the reinforcing steel corrosion is determined by
mass transport process: oxygen diffusion, neutralization front (CO2 and other acids)
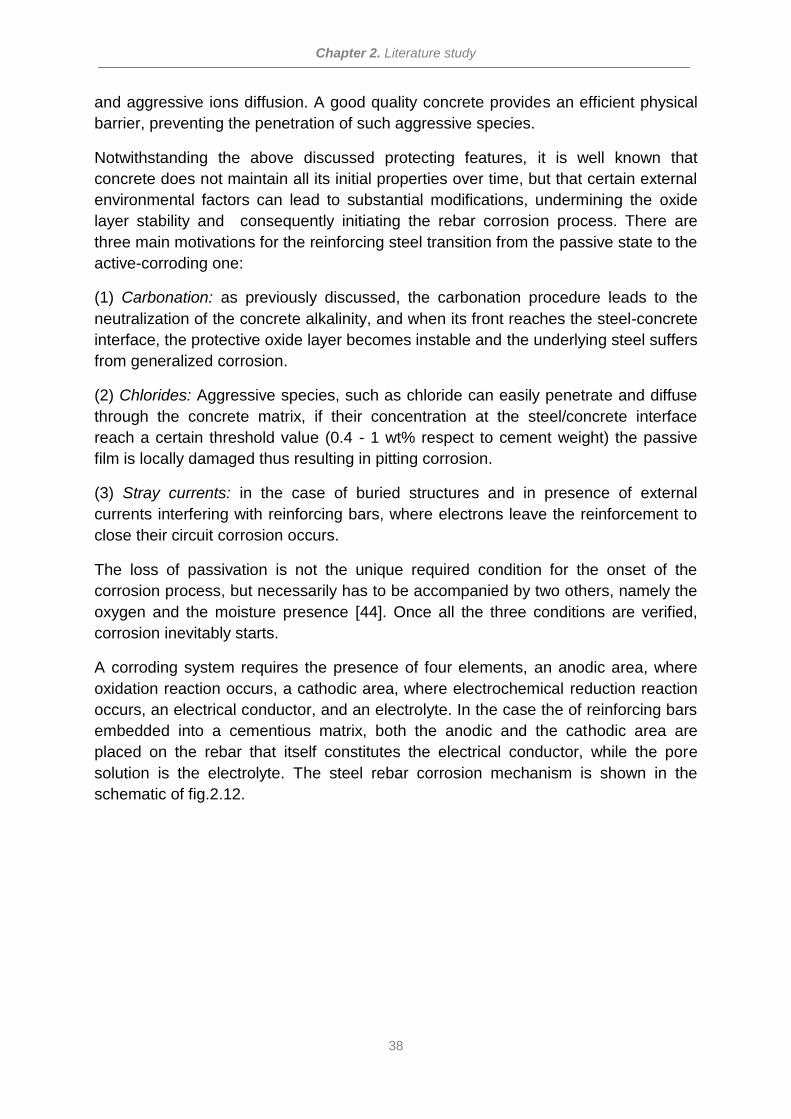
Chapter 2. Literature study
38
and aggressive ions diffusion. A good quality concrete provides an efficient physical
barrier, preventing the penetration of such aggressive species.
Notwithstanding the above discussed protecting features, it is well known that
concrete does not maintain all its initial properties over time, but that certain external
environmental factors can lead to substantial modifications, undermining the oxide
layer stability and consequently initiating the rebar corrosion process. There are
three main motivations for the reinforcing steel transition from the passive state to the
active-corroding one:
(1) Carbonation: as previously discussed, the carbonation procedure leads to the
neutralization of the concrete alkalinity, and when its front reaches the steel-concrete
interface, the protective oxide layer becomes instable and the underlying steel suffers
from generalized corrosion.
(2) Chlorides: Aggressive species, such as chloride can easily penetrate and diffuse
through the concrete matrix, if their concentration at the steel/concrete interface
reach a certain threshold value (0.4 - 1 wt% respect to cement weight) the passive
film is locally damaged thus resulting in pitting corrosion.
(3) Stray currents: in the case of buried structures and in presence of external
currents interfering with reinforcing bars, where electrons leave the reinforcement to
close their circuit corrosion occurs.
The loss of passivation is not the unique required condition for the onset of the
corrosion process, but necessarily has to be accompanied by two others, namely the
oxygen and the moisture presence [44]. Once all the three conditions are verified,
corrosion inevitably starts.
A corroding system requires the presence of four elements, an anodic area, where
oxidation reaction occurs, a cathodic area, where electrochemical reduction reaction
occurs, an electrical conductor, and an electrolyte. In the case the of reinforcing bars
embedded into a cementious matrix, both the anodic and the cathodic area are
placed on the rebar that itself constitutes the electrical conductor, while the pore
solution is the electrolyte. The steel rebar corrosion mechanism is shown in the
schematic of fig.2.12.
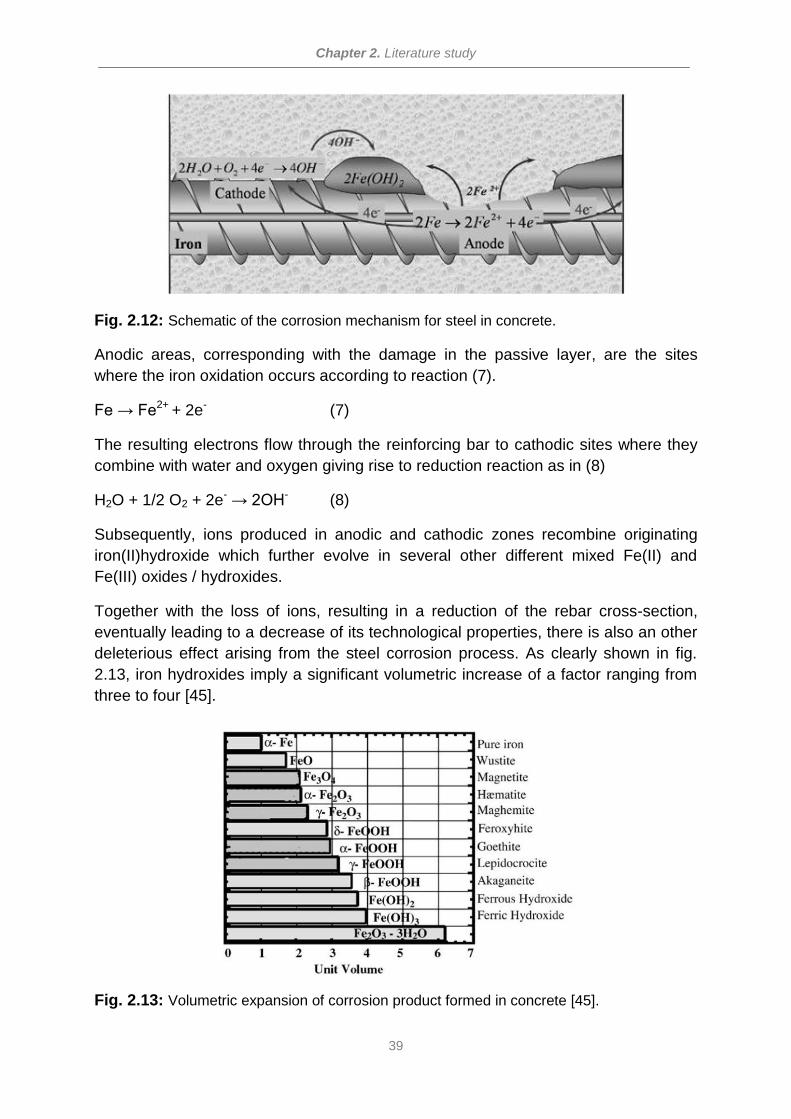
Chapter 2. Literature study
39
Fig. 2.12: Schematic of the corrosion mechanism for steel in concrete.
Anodic areas, corresponding with the damage in the passive layer, are the sites
where the iron oxidation occurs according to reaction (7).
Fe → Fe2+ + 2e- (7)
The resulting electrons flow through the reinforcing bar to cathodic sites where they
combine with water and oxygen giving rise to reduction reaction as in (8)
H2O + 1/2 O2 + 2e- → 2OH- (8)
Subsequently, ions produced in anodic and cathodic zones recombine originating
iron(II)hydroxide which further evolve in several other different mixed Fe(II) and
Fe(III) oxides / hydroxides.
Together with the loss of ions, resulting in a reduction of the rebar cross-section,
eventually leading to a decrease of its technological properties, there is also an other
deleterious effect arising from the steel corrosion process. As clearly shown in fig.
2.13, iron hydroxides imply a significant volumetric increase of a factor ranging from
three to four [45].
Fig. 2.13: Volumetric expansion of corrosion product formed in concrete [45].
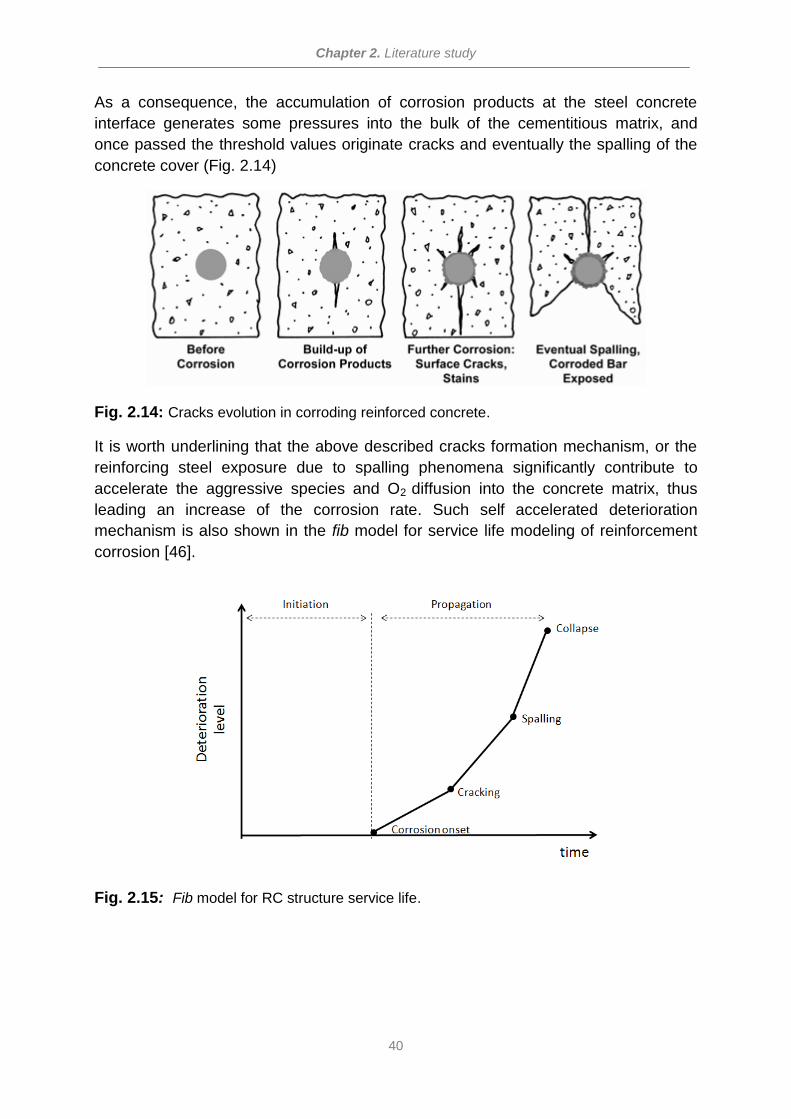
Chapter 2. Literature study
40
As a consequence, the accumulation of corrosion products at the steel concrete
interface generates some pressures into the bulk of the cementitious matrix, and
once passed the threshold values originate cracks and eventually the spalling of the
concrete cover (Fig. 2.14)
Fig. 2.14: Cracks evolution in corroding reinforced concrete.
It is worth underlining that the above described cracks formation mechanism, or the
reinforcing steel exposure due to spalling phenomena significantly contribute to
accelerate the aggressive species and O2 diffusion into the concrete matrix, thus
leading an increase of the corrosion rate. Such self accelerated deterioration
mechanism is also shown in the fib model for service life modeling of reinforcement
corrosion [46].
Fig. 2.15: Fib model for RC structure service life.
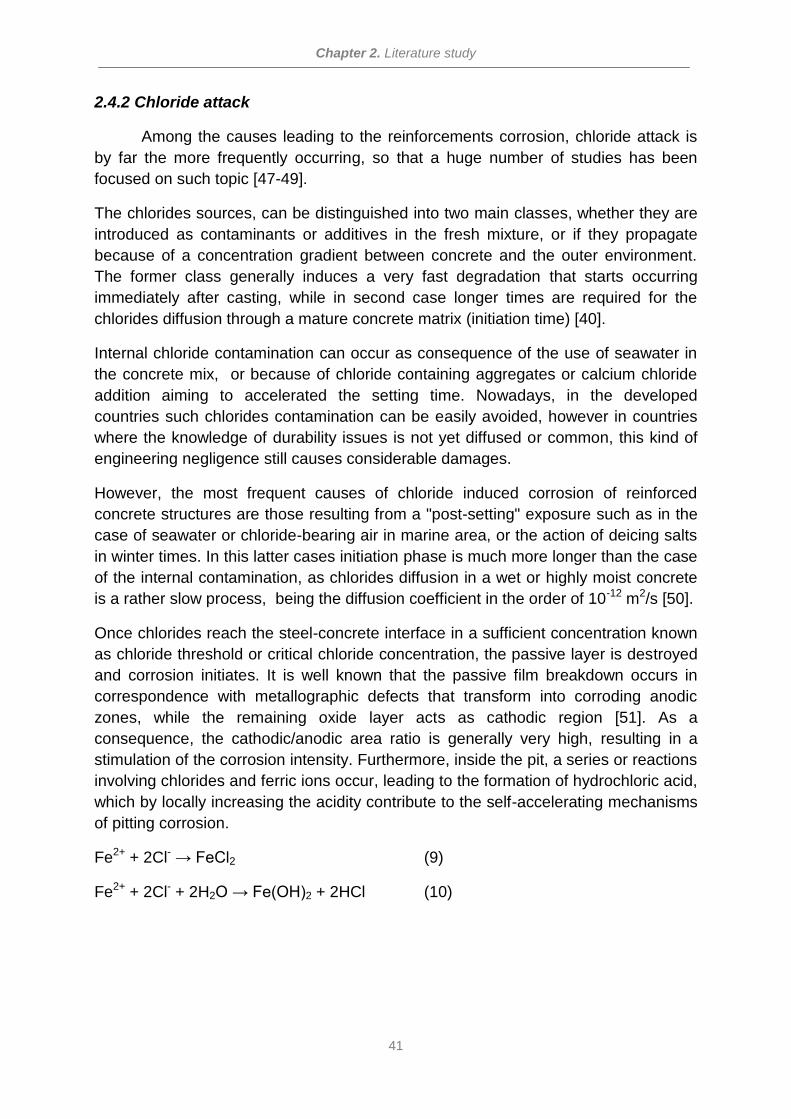
Chapter 2. Literature study
41
2.4.2 Chloride attack
Among the causes leading to the reinforcements corrosion, chloride attack is
by far the more frequently occurring, so that a huge number of studies has been
focused on such topic [47-49].
The chlorides sources, can be distinguished into two main classes, whether they are
introduced as contaminants or additives in the fresh mixture, or if they propagate
because of a concentration gradient between concrete and the outer environment.
The former class generally induces a very fast degradation that starts occurring
immediately after casting, while in second case longer times are required for the
chlorides diffusion through a mature concrete matrix (initiation time) [40].
Internal chloride contamination can occur as consequence of the use of seawater in
the concrete mix, or because of chloride containing aggregates or calcium chloride
addition aiming to accelerated the setting time. Nowadays, in the developed
countries such chlorides contamination can be easily avoided, however in countries
where the knowledge of durability issues is not yet diffused or common, this kind of
engineering negligence still causes considerable damages.
However, the most frequent causes of chloride induced corrosion of reinforced
concrete structures are those resulting from a "post-setting" exposure such as in the
case of seawater or chloride-bearing air in marine area, or the action of deicing salts
in winter times. In this latter cases initiation phase is much more longer than the case
of the internal contamination, as chlorides diffusion in a wet or highly moist concrete
is a rather slow process, being the diffusion coefficient in the order of 10-12 m2/s [50].
Once chlorides reach the steel-concrete interface in a sufficient concentration known
as chloride threshold or critical chloride concentration, the passive layer is destroyed
and corrosion initiates. It is well known that the passive film breakdown occurs in
correspondence with metallographic defects that transform into corroding anodic
zones, while the remaining oxide layer acts as cathodic region [51]. As a
consequence, the cathodic/anodic area ratio is generally very high, resulting in a
stimulation of the corrosion intensity. Furthermore, inside the pit, a series or reactions
involving chlorides and ferric ions occur, leading to the formation of hydrochloric acid,
which by locally increasing the acidity contribute to the self-accelerating mechanisms
of pitting corrosion.
Fe2+ + 2Cl- → FeCl2 (9)
Fe2+ + 2Cl- + 2H2O → Fe(OH)2 + 2HCl (10)
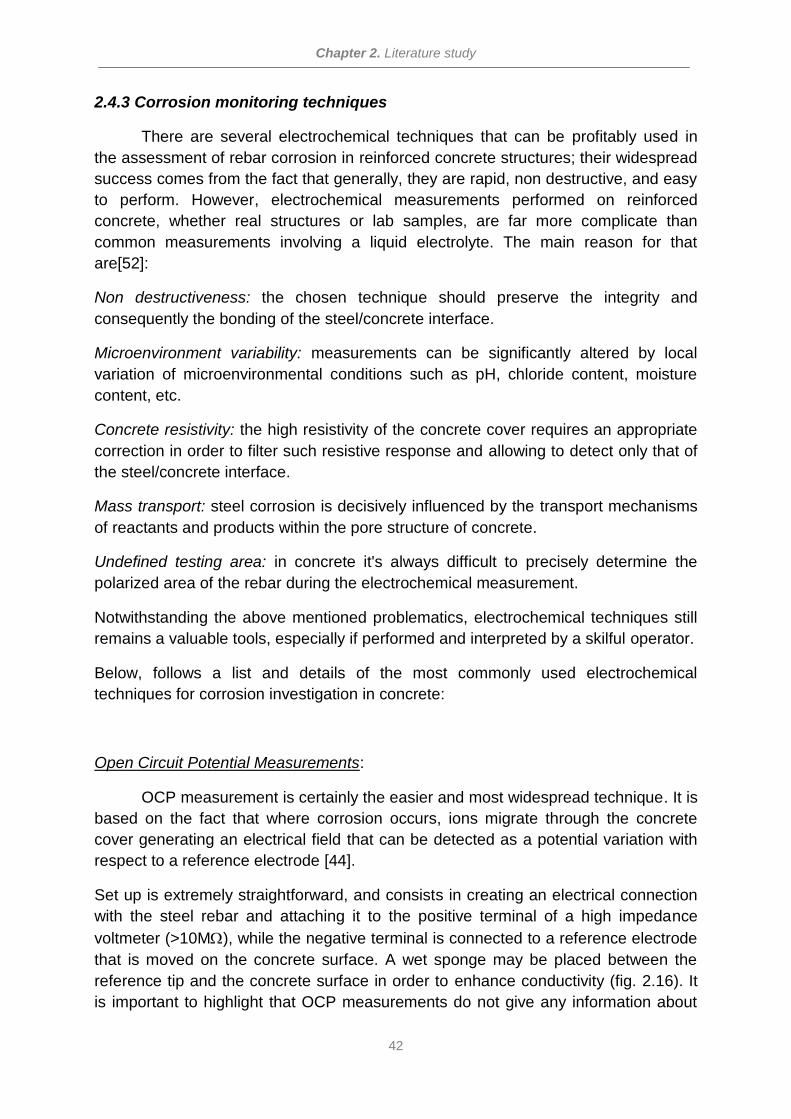
Chapter 2. Literature study
42
2.4.3 Corrosion monitoring techniques
There are several electrochemical techniques that can be profitably used in
the assessment of rebar corrosion in reinforced concrete structures; their widespread
success comes from the fact that generally, they are rapid, non destructive, and easy
to perform. However, electrochemical measurements performed on reinforced
concrete, whether real structures or lab samples, are far more complicate than
common measurements involving a liquid electrolyte. The main reason for that
are[52]:
Non destructiveness: the chosen technique should preserve the integrity and
consequently the bonding of the steel/concrete interface.
Microenvironment variability: measurements can be significantly altered by local
variation of microenvironmental conditions such as pH, chloride content, moisture
content, etc.
Concrete resistivity: the high resistivity of the concrete cover requires an appropriate
correction in order to filter such resistive response and allowing to detect only that of
the steel/concrete interface.
Mass transport: steel corrosion is decisively influenced by the transport mechanisms
of reactants and products within the pore structure of concrete.
Undefined testing area: in concrete it's always difficult to precisely determine the
polarized area of the rebar during the electrochemical measurement.
Notwithstanding the above mentioned problematics, electrochemical techniques still
remains a valuable tools, especially if performed and interpreted by a skilful operator.
Below, follows a list and details of the most commonly used electrochemical
techniques for corrosion investigation in concrete:
Open Circuit Potential Measurements:
OCP measurement is certainly the easier and most widespread technique. It is
based on the fact that where corrosion occurs, ions migrate through the concrete
cover generating an electrical field that can be detected as a potential variation with
respect to a reference electrode [44].
Set up is extremely straightforward, and consists in creating an electrical connection
with the steel rebar and attaching it to the positive terminal of a high impedance
voltmeter (>10M), while the negative terminal is connected to a reference electrode
that is moved on the concrete surface. A wet sponge may be placed between the
reference tip and the concrete surface in order to enhance conductivity (fig. 2.16). It
is important to highlight that OCP measurements do not give any information about
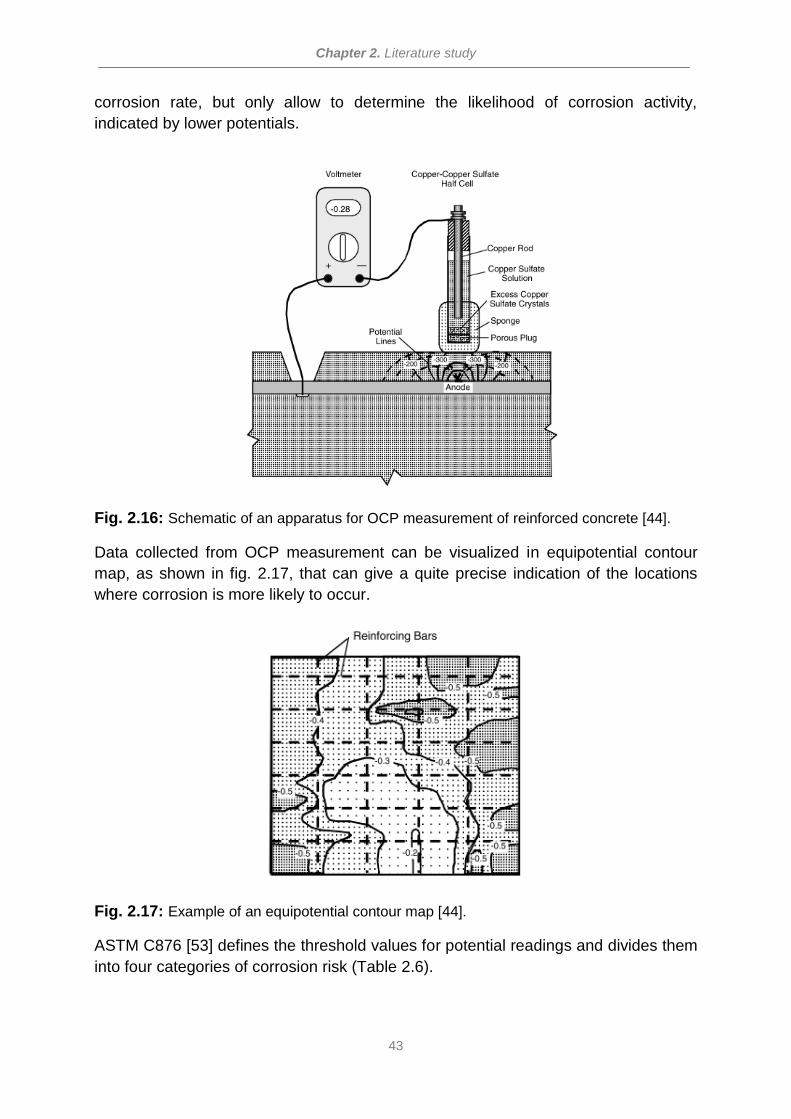
Chapter 2. Literature study
43
corrosion rate, but only allow to determine the likelihood of corrosion activity,
indicated by lower potentials.
Fig. 2.16: Schematic of an apparatus for OCP measurement of reinforced concrete [44].
Data collected from OCP measurement can be visualized in equipotential contour
map, as shown in fig. 2.17, that can give a quite precise indication of the locations
where corrosion is more likely to occur.
Fig. 2.17: Example of an equipotential contour map [44].
ASTM C876 [53] defines the threshold values for potential readings and divides them
into four categories of corrosion risk (Table 2.6).
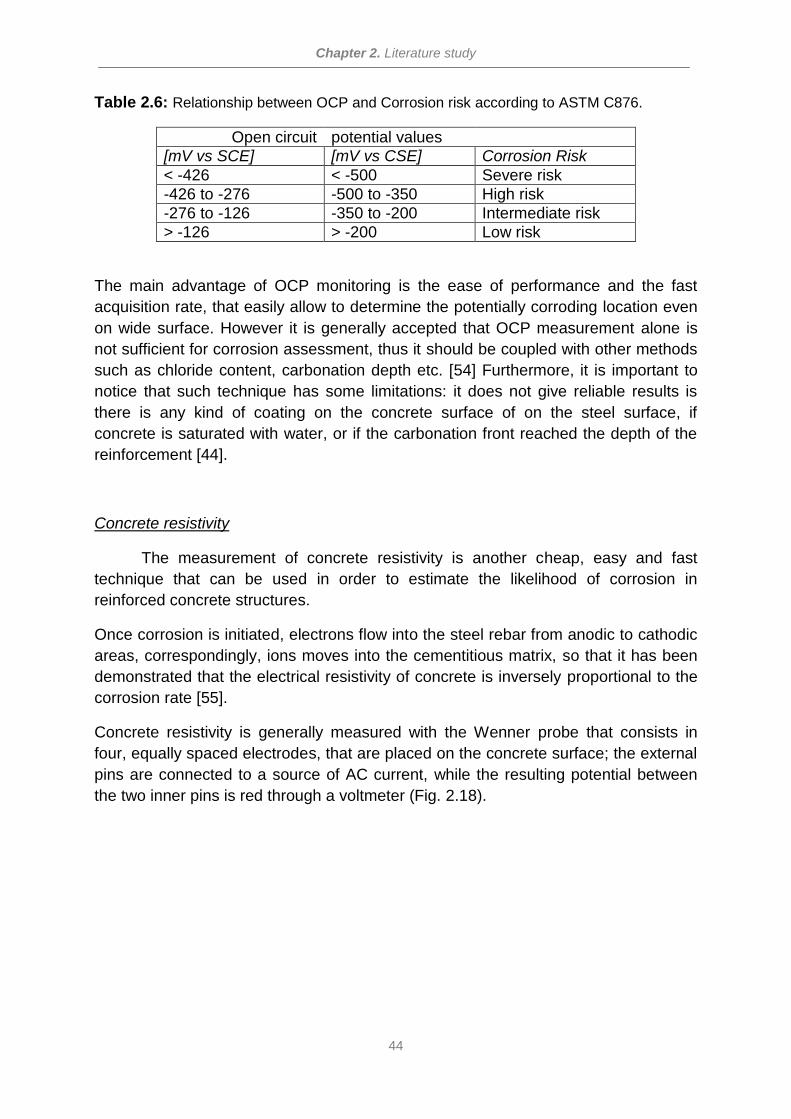
Chapter 2. Literature study
44
Table 2.6: Relationship between OCP and Corrosion risk according to ASTM C876.
Open circuit potential values
[mV vs SCE] [mV vs CSE] Corrosion Risk
< -426 < -500 Severe risk
-426 to -276 -500 to -350 High risk
-276 to -126 -350 to -200 Intermediate risk
> -126 > -200 Low risk
The main advantage of OCP monitoring is the ease of performance and the fast
acquisition rate, that easily allow to determine the potentially corroding location even
on wide surface. However it is generally accepted that OCP measurement alone is
not sufficient for corrosion assessment, thus it should be coupled with other methods
such as chloride content, carbonation depth etc. [54] Furthermore, it is important to
notice that such technique has some limitations: it does not give reliable results is
there is any kind of coating on the concrete surface of on the steel surface, if
concrete is saturated with water, or if the carbonation front reached the depth of the
reinforcement [44].
Concrete resistivity
The measurement of concrete resistivity is another cheap, easy and fast
technique that can be used in order to estimate the likelihood of corrosion in
reinforced concrete structures.
Once corrosion is initiated, electrons flow into the steel rebar from anodic to cathodic
areas, correspondingly, ions moves into the cementitious matrix, so that it has been
demonstrated that the electrical resistivity of concrete is inversely proportional to the
corrosion rate [55].
Concrete resistivity is generally measured with the Wenner probe that consists in
four, equally spaced electrodes, that are placed on the concrete surface; the external
pins are connected to a source of AC current, while the resulting potential between
the two inner pins is red through a voltmeter (Fig. 2.18).
Chapter 2. Literature study
45
Fig. 2.18: Schematic of a Wenner probe, for concrete resistivity measurements [44].
The resistivity can be calculated through the equation 11:
𝜌 = 2 𝜋 𝑠 𝑉
𝐼 (11)
Where s stands for the distance between the pins, I is the applied currend and V the
measured potential.
Differently from OCP measurements, there is no ASTM method for concrete
resistivity, however there exist commonly accepted values correlating the
experimental values with the corrosion risk (Table 2.7)
Table 2.7: Relationship between concrete resistivity and corrosion risk [56].
Resistivity
(k cm) Corrosion risk
> 20 Low
10 to 20 Moderate
5 to 10 High
< 5 Very high
Linear Polarization Resistance (LPR)
Both the above presented techniques, although having important advantages
in terms of ease of application and acquisition rate, suffer from a main drawback, as
they do not give any information on the actual corrosion rate. Such value, can be
instead determined through the linear polarization resistance method.
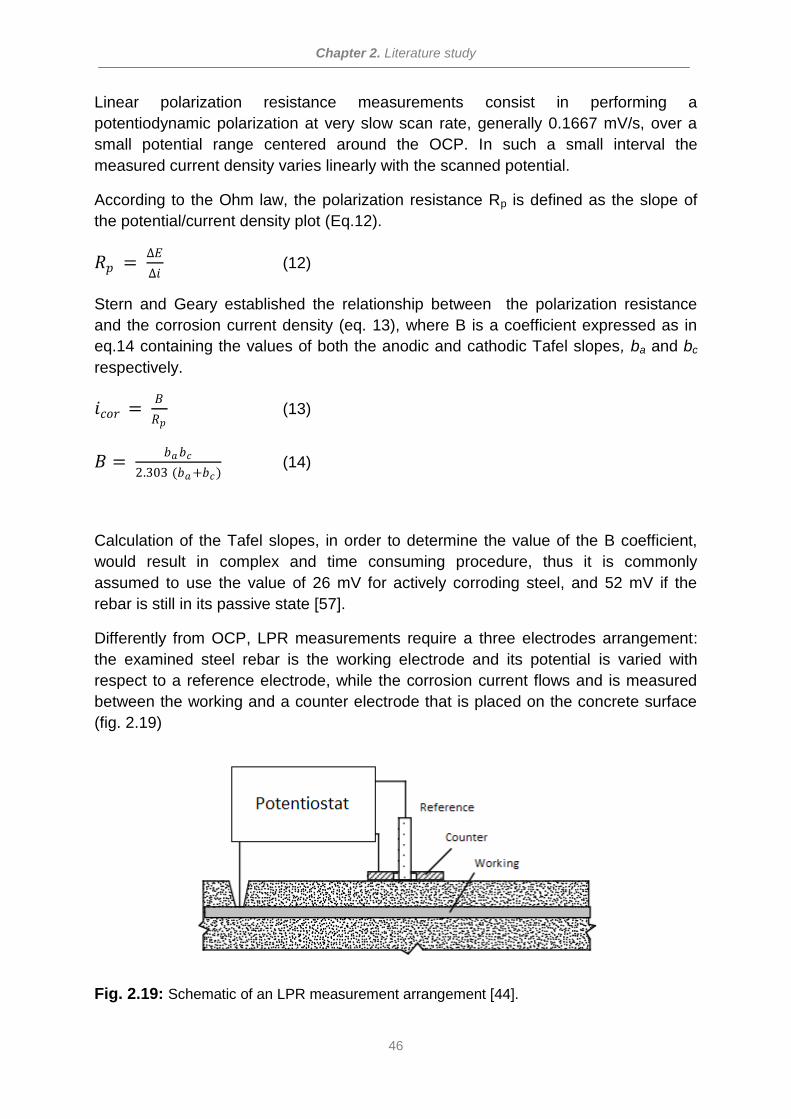
Chapter 2. Literature study
46
Linear polarization resistance measurements consist in performing a
potentiodynamic polarization at very slow scan rate, generally 0.1667 mV/s, over a
small potential range centered around the OCP. In such a small interval the
measured current density varies linearly with the scanned potential.
According to the Ohm law, the polarization resistance Rp is defined as the slope of
the potential/current density plot (Eq.12).
𝑅𝑝 = ∆𝐸
∆𝑖 (12)
Stern and Geary established the relationship between the polarization resistance
and the corrosion current density (eq. 13), where B is a coefficient expressed as in
eq.14 containing the values of both the anodic and cathodic Tafel slopes, ba and bc
respectively.
𝑖𝑐𝑜𝑟 = 𝐵
𝑅𝑝 (13)
𝐵 = 𝑏𝑎𝑏𝑐
2.303 (𝑏𝑎+𝑏𝑐) (14)
Calculation of the Tafel slopes, in order to determine the value of the B coefficient,
would result in complex and time consuming procedure, thus it is commonly
assumed to use the value of 26 mV for actively corroding steel, and 52 mV if the
rebar is still in its passive state [57].
Differently from OCP, LPR measurements require a three electrodes arrangement:
the examined steel rebar is the working electrode and its potential is varied with
respect to a reference electrode, while the corrosion current flows and is measured
between the working and a counter electrode that is placed on the concrete surface
(fig. 2.19)
Fig. 2.19: Schematic of an LPR measurement arrangement [44].
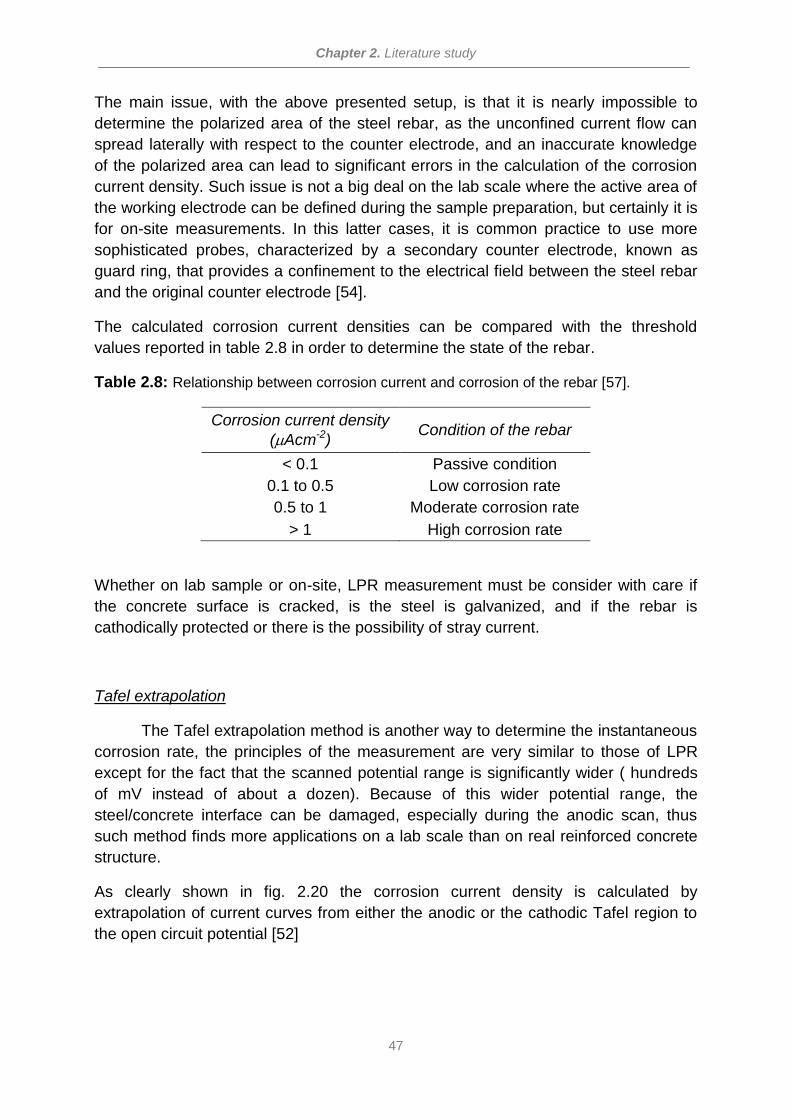
Chapter 2. Literature study
47
The main issue, with the above presented setup, is that it is nearly impossible to
determine the polarized area of the steel rebar, as the unconfined current flow can
spread laterally with respect to the counter electrode, and an inaccurate knowledge
of the polarized area can lead to significant errors in the calculation of the corrosion
current density. Such issue is not a big deal on the lab scale where the active area of
the working electrode can be defined during the sample preparation, but certainly it is
for on-site measurements. In this latter cases, it is common practice to use more
sophisticated probes, characterized by a secondary counter electrode, known as
guard ring, that provides a confinement to the electrical field between the steel rebar
and the original counter electrode [54].
The calculated corrosion current densities can be compared with the threshold
values reported in table 2.8 in order to determine the state of the rebar.
Table 2.8: Relationship between corrosion current and corrosion of the rebar [57].
Corrosion current density
(Acm-2) Condition of the rebar
< 0.1 Passive condition
0.1 to 0.5 Low corrosion rate
0.5 to 1 Moderate corrosion rate
> 1 High corrosion rate
Whether on lab sample or on-site, LPR measurement must be consider with care if
the concrete surface is cracked, is the steel is galvanized, and if the rebar is
cathodically protected or there is the possibility of stray current.
Tafel extrapolation
The Tafel extrapolation method is another way to determine the instantaneous
corrosion rate, the principles of the measurement are very similar to those of LPR
except for the fact that the scanned potential range is significantly wider ( hundreds
of mV instead of about a dozen). Because of this wider potential range, the
steel/concrete interface can be damaged, especially during the anodic scan, thus
such method finds more applications on a lab scale than on real reinforced concrete
structure.
As clearly shown in fig. 2.20 the corrosion current density is calculated by
extrapolation of current curves from either the anodic or the cathodic Tafel region to
the open circuit potential [52]
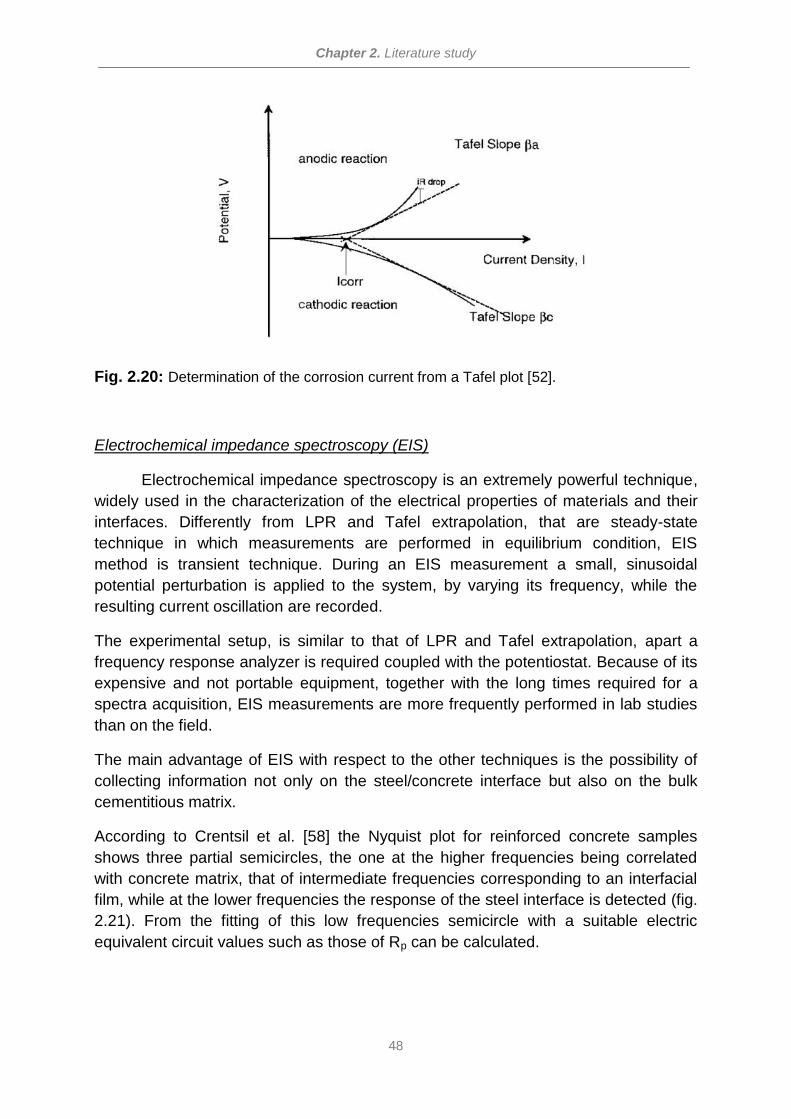
Chapter 2. Literature study
48
Fig. 2.20: Determination of the corrosion current from a Tafel plot [52].
Electrochemical impedance spectroscopy (EIS)
Electrochemical impedance spectroscopy is an extremely powerful technique,
widely used in the characterization of the electrical properties of materials and their
interfaces. Differently from LPR and Tafel extrapolation, that are steady-state
technique in which measurements are performed in equilibrium condition, EIS
method is transient technique. During an EIS measurement a small, sinusoidal
potential perturbation is applied to the system, by varying its frequency, while the
resulting current oscillation are recorded.
The experimental setup, is similar to that of LPR and Tafel extrapolation, apart a
frequency response analyzer is required coupled with the potentiostat. Because of its
expensive and not portable equipment, together with the long times required for a
spectra acquisition, EIS measurements are more frequently performed in lab studies
than on the field.
The main advantage of EIS with respect to the other techniques is the possibility of
collecting information not only on the steel/concrete interface but also on the bulk
cementitious matrix.
According to Crentsil et al. [58] the Nyquist plot for reinforced concrete samples
shows three partial semicircles, the one at the higher frequencies being correlated
with concrete matrix, that of intermediate frequencies corresponding to an interfacial
film, while at the lower frequencies the response of the steel interface is detected (fig.
2.21). From the fitting of this low frequencies semicircle with a suitable electric
equivalent circuit values such as those of Rp can be calculated.
Chapter 2. Literature study
49
Fig. 2.21: Nyquist plot of a reinforced concrete sample [58].
2.4.4 Prevention and remediation
In reinforced concrete structures, the steel rebars are deeply embedded into
the cementitious matrix that provides a physical barrier against the penetration of
aggressive species, moreover it guarantees the growth and the stability of a
protective passive layer at the steel concrete interface. Both these features points out
that a good quality concrete can be considered the primary protection method; for
certain specific cases, where particularly aggressive conditions can be expected
some supplementary protection methods can be planned.
Taking into consideration that preventing corrosion in a reinforced concrete structure
is certainly easier and less expensive than repairing it, a good quality control in
design and construction is certainly the most important prerogative for an extended
service life, additional protecting methods can be divided into four different classes
[40]:
- Acting on the steel corrosion resistance
- Applying external membranes to the concrete surface
- Using cathodic protection
- Modifying the mix design, by adding corrosion inhibitors
Focusing on the steel rebars, their corrosion resistance properties can be enhanced
by the application of coating that can be either organic such as epoxy resins or
metallic as in the case of the galvanizing procedure. Alternatively, for application in
extremely aggressive environment, higher quality steel such as stainless steels can
be used instead of the ordinary carbon steel.
Epoxy coated steel proved to give positive results especially in the case of seawater
exposure [40], however, their use has two important drawbacks, as it makes
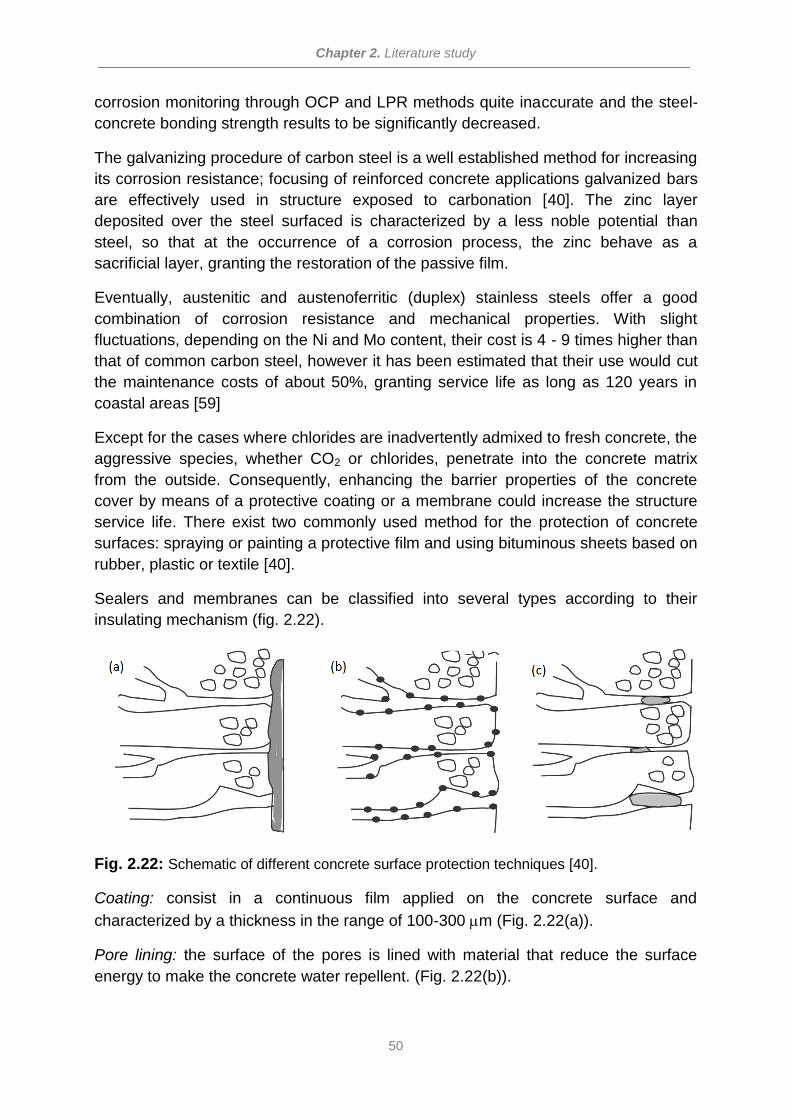
Chapter 2. Literature study
50
corrosion monitoring through OCP and LPR methods quite inaccurate and the steel-
concrete bonding strength results to be significantly decreased.
The galvanizing procedure of carbon steel is a well established method for increasing
its corrosion resistance; focusing of reinforced concrete applications galvanized bars
are effectively used in structure exposed to carbonation [40]. The zinc layer
deposited over the steel surfaced is characterized by a less noble potential than
steel, so that at the occurrence of a corrosion process, the zinc behave as a
sacrificial layer, granting the restoration of the passive film.
Eventually, austenitic and austenoferritic (duplex) stainless steels offer a good
combination of corrosion resistance and mechanical properties. With slight
fluctuations, depending on the Ni and Mo content, their cost is 4 - 9 times higher than
that of common carbon steel, however it has been estimated that their use would cut
the maintenance costs of about 50%, granting service life as long as 120 years in
coastal areas [59]
Except for the cases where chlorides are inadvertently admixed to fresh concrete, the
aggressive species, whether CO2 or chlorides, penetrate into the concrete matrix
from the outside. Consequently, enhancing the barrier properties of the concrete
cover by means of a protective coating or a membrane could increase the structure
service life. There exist two commonly used method for the protection of concrete
surfaces: spraying or painting a protective film and using bituminous sheets based on
rubber, plastic or textile [40].
Sealers and membranes can be classified into several types according to their
insulating mechanism (fig. 2.22).
Fig. 2.22: Schematic of different concrete surface protection techniques [40].
Coating: consist in a continuous film applied on the concrete surface and
characterized by a thickness in the range of 100-300 m (Fig. 2.22(a)).
Pore lining: the surface of the pores is lined with material that reduce the surface
energy to make the concrete water repellent. (Fig. 2.22(b)).

Chapter 2. Literature study
51
Pore blocking: the treatment penetrate into the pore and reacts with the cement
comounds resulting in insoluble products that occlude the pores (Fig. 2.22(c)).
Cathodic protection is a very effective method for corrosion protection, but its
complexity and costs limits the applications to special structures. The principle of
cathodic protection is that of modifying the electrochemical system so that the steel
reinforcing bars behave as cathodes, thus avoiding corrosion risk. Such objective can
be accomplished in two different ways: by connecting the steel rebar to a less noble
sacrificial electrode serving as anode, or by supplying the electrons to the rebar from
an external electrical power source.
Finally over years, a huge number of compounds have been added to the concrete
mix aiming to inhibit the corrosion of the steel reinforcing bars, a detailed literature
review of most commonly used corrosion inhibitors for reinforced concrete application
can be found in the introduction of chapter 5 in the present thesis.
Chapter 2. Literature study
52
References
[1] M. Hassoun, A. Al-Manasser, Structural Concrete, 4th edition, John Wiley &
Sons, 2008.
[2] A.M Neville, Properties of Concrete, 5th edition, Pearson, 2013.
[3] P. Jahren, T. Sui, Concrete and Sustainability, CRC press, Taylor & Francis,
2013.
[4] EN 197-1, Cement, part 1: composition, specifications and conformity criteria for
common cements, 2000.
[5] P.K. Metha, P.J. Monteiro, Concrete microstructure, properties and materials,
McGraw-Hill, 2006.
[6] T.C.Powers, L.E Copeland, H.M. Mann, Capillary continuity or discontinuity in
cement pastes, J. Port. Cem. Assoc. Research and Development Laboratories,
Vol.1, No.2 (1959) 38-48.
[7] T.C.Powers, L.E Copeland, J.C. Hayes, H.M. Mann, Permeability of Portland
cement paste, J. Amer. Concr. inst., 51 (1954) 285-298.
[8] L. Romben, Aspect of testing methods for acid attack on concrete, CBI
Research (1978).
[9] P.K. Mehta, Mechanism of sulfate attack on portland cement concrete-Another
look, Cement and Concrete Research, Vol. 13, No. 3 (1983) 401–406.
[10] ACI318-08, Building Code Requirements for Structural Concrete and
Commentary, American Concrete Institute (2008).
[11] R.N. Swamy, The alkali silica reaction in concrete, Taylor & Francis (2003).
[12] T.C. Powers, Resistance to weathering - freezing and thawing, ASTM Sp. Tech.
Publ. No.169 (1956) 182-187.
[13] V.G. Papadakis, C.G. Vayenas, M. Fardis, Fundamental Modeling and
Experimental Investigation of Concrete Carbonation, Materials Journal, Vol. 88,
No. 4 (1991) 363-373.
[14] M. Guadalupe, D. Gutierrez-Padilla, A. Bilefeldt, S. Ovtchinnikov, M.
Hernandez, J. Silverstein, Biogenic sulfuric acid attack on different types of
commercialy produced concrete sewer pipes, Cement and Concrete Research,
40 (2010) 293-301.
[15] H. Satoh, M. Odagiri, T. Ito, S. Okabe, Microbial community structures and in
situ sulfate reducing and sulfur oxidizing avtivities in biofilms developed on
Chapter 2. Literature study
53
mortar specimens in a corroded sewer system, Water Research 43 (2009)
4729-4739.
[16] J.A Redner, E.J. Esfandi, R.P. Hsi, Evaluation of protective coatings for
concrete exposed to sulfide generation in wastewater treatment facilities,
Journal of Protective Coatings and Linings, 8 (1991) 48–58.
[17] S. Chandra, L. Berntsson, Deterioration of concrete in swimming pools in the
south of Sweden, ACI Materials Journal (1988) 485-489.
[18] T.V. Zherebyateva, E.V. Lebedeva, G.I. Karavaiko, Microbiological corrosion of
concrete structures of hydraulic facilities, Geomicrobiology Journal, 9 (1991)
119–127.
[19] S. Wei, M. Sanchez, D. Trejo, C. Gillis, Microbial mediated deterioration of reinforced
concrete structures, International Biodeterioration & Biodegradation 64 (2010)
748-754.
[20] V. Abdelmseeh, J. Jofriet, G. Hayward, Sulphate and sulphide corrosion in
livestock buildings, Part I: concrete deterioration, Biosystem Engineering, 99
(2008) 372-381.
[21] V. Abdelmseeh, J. Jofriet, G. Hayward, Sulphate and sulphide corrosion in
livestock buildings, Part II: reinforcing steel corrosion, Biosystem Engineering,
99 (2008) 382-389.
[22] N. De Belie, J.J. Lenehan, C.R. Braam, B. Svennerstedt, M. Richardson, B.
Sonck, Durability of Building Materials and Components in the Agricultural
Environment, Part III: Concrete Structures Journal of Agricultural Engineering
Research, 76 (2000) 3-16.
[23] D.J. Roberts, D. Nica, G.Zuo, J.L. Davis, Quantifying microbially induced
deterioration of concrete: initial studies, International Biodeterioration &
Biodegradation 49 (2002) 227-234.
[24] M. O'Connel, C. McNally, M.G. Richardson, Biochemical attack on concrete in
waste water application, Cement and Concrete Composites, 32 (2010) 479-485.
[25] J. Monteney, E. Vinkle, A. Beeldens, N. De Belie, L. Taerwe, D. van Gemert, W.
Verstraete, Chemical, microbiological, and is situ test methods for biogenic
sulfuric acid corrosion of concrete, Cement and Concrete Research, 30 (2000)
623-634.
[26] L. Romben, Aspects on testing methods for acid attack on concrete, CBI Forsk
78 (1) (1978) 1-61.
[27] M.D. Cohen, B. Mather, Sulfate attack on concrete-research needs, ACI Mater
J. 88 (1) (1991) 62-69.
Chapter 2. Literature study
54
[28] W. Sand, E. Bock, D.C. White, Biotest system for rapid evaluation ofconcrete
resistance to sulfur-oxidizing bacteria, Mater Perform 26 (3)(1987) 14-17.
[29] K. Hormann, F. Hofmann, M. Schmidt, Stability of concrete against biogenic
sulfuric acid corrosion, a new method for determination, Proceedings of the 10th
International Congress on the Chemistry of Cement, Gothenburg, June 2-6,
1997.
[30] T. Mori, T. Nonaka, K. Tazaki, M. Koga, Y. Hikosaka, S. Noda, Interactions of
nutrients, moisture and pH on microbial corrosion of concrete sewer pipes,
Water. Res. 26 (1) (1992) 29-37.
[31] E. Vinkle, S. Verstichel, J. Monteney, W. Verstraete, A new test procedure for
biogenic sulfuric acid corrosion of concrete, Biodegradation 10 (1999) 421-428.
[32] J. Monteney, N. De Belie, E. Vinkle, W. Verstraete, L. Taerwe, Chemical,
microbiological tests to simulate sulfuric acid corrosion of polymer modified
concrete, Cement and Concrete Research, 31 (2001) 1359-1365.
[33] E. Vinkle, E. Van Wanseele, J. Monteney, A. Beeldens, N. De Belie, L. Taerwe,
D. van Gemert, W. Verstraete, Influence of polymer addition on biogenic sulfuric
acid attack of concrete, International Biodeterioration & Biodegradation 49
(2002) 283-292.
[34] J.M. Pluym-Berkhout, J. Mijnsbergen, R.B. Polder, Rioleringen (II), biogene
zwavelzuuraantasting, Cement 9 (1989) 16-20.
[35] A.C.A. van Mechelen, R.B. Polder, Rioleringen (XI), biogene
zwavelzuuraantasting, verslag van een vervolgonderzoek in Rotterdam,Cement
2 (1991) 26-30.
[36] R. Sydney, E. Esfandi, S. Surapaneni, Control concrete sewer corrosion via the
crown spray process, Water Environ. Res. Vol 68, No.3 (1996) 338-347.
[37] T. Ochi, M. Kitagawa, S. Tanaka, Controlling sulfide generation in force mains
by air inijection, Wat.Sci.Technol. 37 (1998) 87-95.
[38] M. Schmidt, K Hormann, F. Hofmann, E. Wagner, Beton mit erhohtem
widerstand gegen saure und biogene schwefelsaurekorrosion, Concrete
Precasting Plany Technol., 4 (1997) 64-70.
[39] F. Shaker, A. El-Dieb, M. Reda, Durability of styrene-butadiene latex modified
concrete, Cem. Concrete Res. Vol. 27, No.5 (1997) 711-720.
[40] M. El-Reedy, Steel reinforced concrete structures, assessment and repair of
corrosion, CRC press, 2008.
Chapter 2. Literature study
55
[41] J. Flis, A, Sehgal, D. Li, Y. Kho, S. Sabotl, H. Pickering, P. Cady, Condition
evaluation of concrete bridges relative to reinforcement corrosion, National
Research Council, Washington DC., 1992
[42] N. Buenfeld, J. Newman, The permeability of concrete in a marine environment,
Magazine of Concrete Research 36 (1984) 67-80.
[43] H. Whittington, J. McCarter, M. Forde, the conduction of electricity through
concrete, Magazine of Concrete Research 33 (1984) 48-60.
[44] V.M. Malhotra, N. J. Carino, Handbook on Nondestructive Testing of Concrete, Second Edition CRC Press 2003.
[45] J.Shahzma, C. M. Hansson, Chloride-induced corrosion products of steel in
cracked-concrete subjected to different loading conditions, Cement and
Concrete Research, Vol. 39, No. 2 ( 2009) 116-125.
[46] fib. Model code for service life design. Technical Report 34, FIB, April 2006.
[47] X. Shi, N. Xie, K. Fortune, J. Gong, Durability of steel reinforced concrete in
chloride environments: An overview, Construction and Building Materials, 30
(2012) 125-138.
[48] U. Angst, B. Elsener, C. Larsen, Ø. Vennesland, Critical chloride content in
reinforced concrete: A review, Cement and Concrete Research, Vol.39, Issue
12 (2009) 1122-1138.
[49] A. Suryavanshi, J. Scantlebury, S. Lyon, Corrosion of reinforcement steel
embedded in high water-cement ratio concrete contaminated with chloride,
Cement and Concrete Composites, 20 (1998) 263-381.
[50] C. Page, N. Page, A. El-Tarras, Diffusion of chloride ions in hardened cement
paste, Cement and Concrete Research, 11 (1981) 395-406.
[51] B. Lin, Ronggang Hu, Chenqing Ye, Yan Li, Changjian Lin, A study on the
initiation of pitting corrosion in carbon steel in chloride-containing media using
scanning electrochemical probes, Electrochimica Acta, Vol. 55, No. 22, (2010)
6542-6545.
[52] V.S. Ramachandran, J.J. Beaudoin, Handbook of analytical techniques in
concrete science and technology, William Andrew Publishing.
[53] ASTM C876 (1999) Standard test method for half cell potentials of uncoated
reinforcing steel in concrete.
[54] H. Song, V. Saraswathy, Corrosion monitoring of reinforced concrete structures:
A review, internation Journal of Electrochemical Science, 2 (2007) 1-28.
Chapter 2. Literature study
56
[55] S. Feliu, J.A. Gonzalez, S. Feliu, Jr., C. Andrade, Relationship between
conductivity of concrete and corrosion of reinforcing bars, Brit. Corr. J. 24
(1989) 195-198.
[56] Bungey, J.H., Testing of Concrete in Structures, 2nd ed., Chapman & Hall, New
York, 1989.
[57] C. Andrade, C. Alonso, Test method for on-site corrosion rate measurement of
steel reinforcement in concrete by means of the polarization resistance method,
RILEM Recommendation, Materials and Structures, 37 (2004) 623 - 643.
[58] K. Sagoe-Crentsil; F. P. Glasser; J. T. S. Irvine, Electrochemical characteristics
of reinforced concrete corrosion as determined by impedance spectroscopy,
British Corrosion Journal Vol 27, No 2 (1992) 113-118.
[59] S. Cramer, B. Covino, S. Bullard, G. Holcomb, J. russel, F. Nelson, H. laylor, S.
Soltesz, Corrosion prevention and remediation strategies for reinforced
concrete coastal bridges, Cement and concrete composites, 24 (2002) 101-117.
Chapter 3. Steel passivation in alkaline solutions simulating the concrete environment
57
Chapter 3:
Steel passivation in alkaline solutions
simulating the concrete environment
The majority of the studies on corrosion mechanism and protection of
reinforcing steel bars are performed in alkaline solutions simulating the concrete
environment, thus avoiding the complications related to the preparation of
representative reinforced concrete samples. In this work the electrochemical
behavior of B450C mild steel was studied in saturated Ca(OH)2 solution by
cyclicvoltammetry. Comparison with the electrochemical response in 1 M NaOH was
also carried out, being such electrolyte the most commonly used for iron passivation
studies. Results confirm the coexistence of two main processes, one leading to
Fe(OH)2 and the following (reversible) to Fe(III) oxo–hydroxides. The latter appears
more relevant to the growth of a protective layer and in turn strictly connected to the
operative condition of the cyclic voltammetry. The influence that time has on the
passive film growth was then investigated by means of anodic polarization and
electrochemical impedance spectroscopy. All the results indicated that at least three
days of immersion in Ca(OH)2 are required to guarantee the stabilization of the
electrochemical response, thus leading to a protection similar to that observed with
reinforced concrete.
Reprinted from Journal of Electroanalytical Chemistry, 736, E. Volpi, A. Olietti, M. Stefanoni, S. P. Trasatti, Electrochemical
characterization of mild steel in alkaline solutions simulating concrete environment, 38–46, 2015, with permission from Elsevier
Chapter 3. Steel passivation in alkaline solutions simulating the concrete environment
58
3.1 Introduction
Since the 80's, when the engineers community became conscious that
reinforced concrete structures could suffer from severe forms of degradation, leading
to extremely high maintenance and repair costs [1-3], lot of attentions were focused
on detailed studies aiming to get more insight into the deterioration mechanisms.
The long time necessary for chloride penetration, or for complete carbonation of the
concrete cover, together with complications related to the production of
representative reinforced mortar samples, can be avoided by using alkaline solutions
simulating the concrete environment. Sound concrete is generally simulated with
alkaline solutions such as aqueous NaOH, KOH or Ca(OH)2 [4-6]. Among the various
possibilities, saturated Ca(OH)2 seems to be the most used solution for such a
purpose [4-10]. Different quantities of chlorides can be added to such solutions to
study the onset of a localized attack, while a carbonated environment is usually
simulated using a sodium carbonate/bicarbonate buffer of pH around 10 [4,5].
The most studied passive Fe/electrolyte systems are Fe in borate buffer (pH 8.4) [11-
13], and in 1 M NaOH or KOH [14-19]. In the open literature referring to concrete
simulation, there appears to be lack of in-depth electrochemical characterization of
steel in saturated Ca(OH)2 solution, which prompted us to systematically investigate
the electrochemical behavior of mild steel in such solution.
With respect to the passive behavior of iron in alkaline solutions, results are
sometimes controversial, and the nature of the passivating layer is not
unambiguously established. However, it is well accepted that anodic oxidation of iron
in alkaline solution implies at least two steps. First, iron is converted to Fe(OH)2 and
then, different oxy-hydroxy Fe(III) species are formed. More recent works have
investigated the structure of the oxide film, pointing out the presence of a denser
inner layer formed by mixed iron oxides like magnetite (Fe3O4), overlapped by an
outer hydrous (FeOOH) gelatinous layer, which confers passivity to the metallic
substrate [20,21].
According to [22], electrochemical steady state measurements on iron in alkaline
media are relatively difficult and scarcely reproducible. In the present work, a non-
steady-state technique such as cyclic voltammetry was used to characterize the
behavior of B450C mild steel immersed into a saturated Ca(OH)2 solution.
As steel bars are embedded in concrete to produce reinforced samples, a curing time
(generally 28 days) is needed for complete hydration of the cement. This implies that
the steel surface remains in contact with an alkaline environment for a long time,
which allows the growth of a protective layer. Accordingly, in the present work we
decided to investigate the influence of the passivation time on the electrochemical
response of metallic samples immersed in the alkaline solution. In the open literature
there is no consensus on the time necessary to obtain the growth of a representative
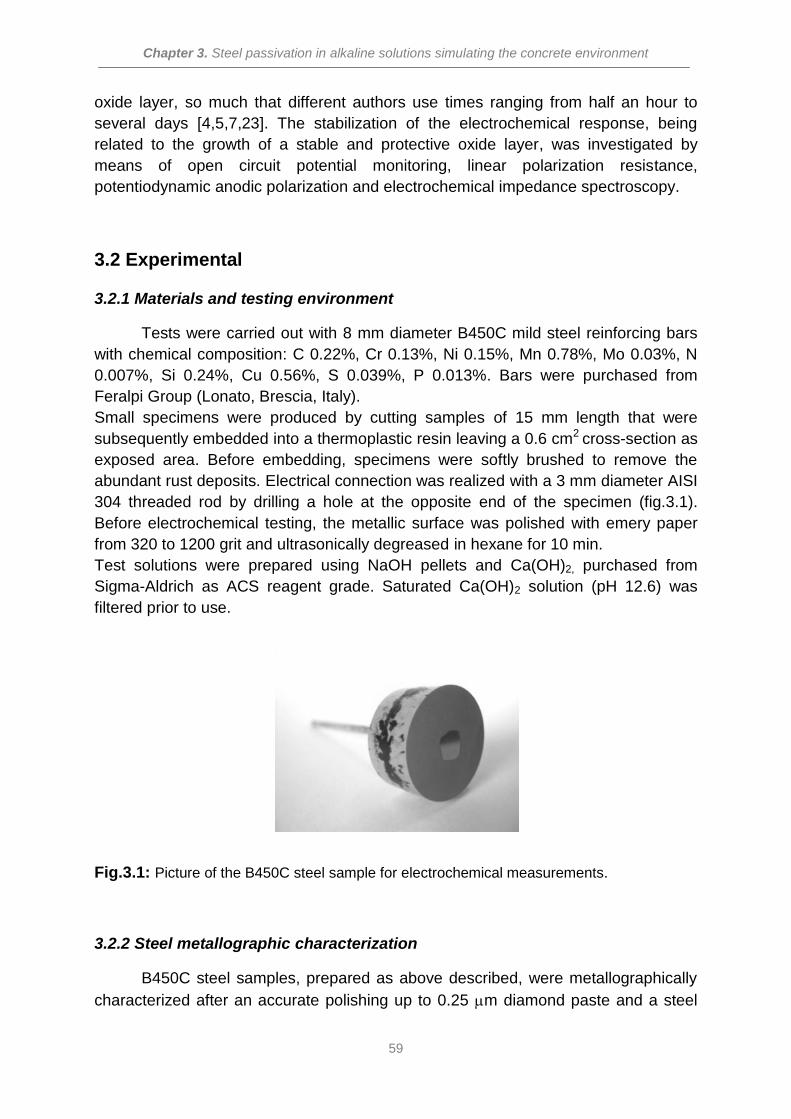
Chapter 3. Steel passivation in alkaline solutions simulating the concrete environment
59
oxide layer, so much that different authors use times ranging from half an hour to
several days [4,5,7,23]. The stabilization of the electrochemical response, being
related to the growth of a stable and protective oxide layer, was investigated by
means of open circuit potential monitoring, linear polarization resistance,
potentiodynamic anodic polarization and electrochemical impedance spectroscopy.
3.2 Experimental
3.2.1 Materials and testing environment
Tests were carried out with 8 mm diameter B450C mild steel reinforcing bars
with chemical composition: C 0.22%, Cr 0.13%, Ni 0.15%, Mn 0.78%, Mo 0.03%, N
0.007%, Si 0.24%, Cu 0.56%, S 0.039%, P 0.013%. Bars were purchased from
Feralpi Group (Lonato, Brescia, Italy).
Small specimens were produced by cutting samples of 15 mm length that were
subsequently embedded into a thermoplastic resin leaving a 0.6 cm2 cross-section as
exposed area. Before embedding, specimens were softly brushed to remove the
abundant rust deposits. Electrical connection was realized with a 3 mm diameter AISI
304 threaded rod by drilling a hole at the opposite end of the specimen (fig.3.1).
Before electrochemical testing, the metallic surface was polished with emery paper
from 320 to 1200 grit and ultrasonically degreased in hexane for 10 min.
Test solutions were prepared using NaOH pellets and Ca(OH)2, purchased from
Sigma-Aldrich as ACS reagent grade. Saturated Ca(OH)2 solution (pH 12.6) was
filtered prior to use.
Fig.3.1: Picture of the B450C steel sample for electrochemical measurements.
3.2.2 Steel metallographic characterization
B450C steel samples, prepared as above described, were metallographically
characterized after an accurate polishing up to 0.25 m diamond paste and a steel
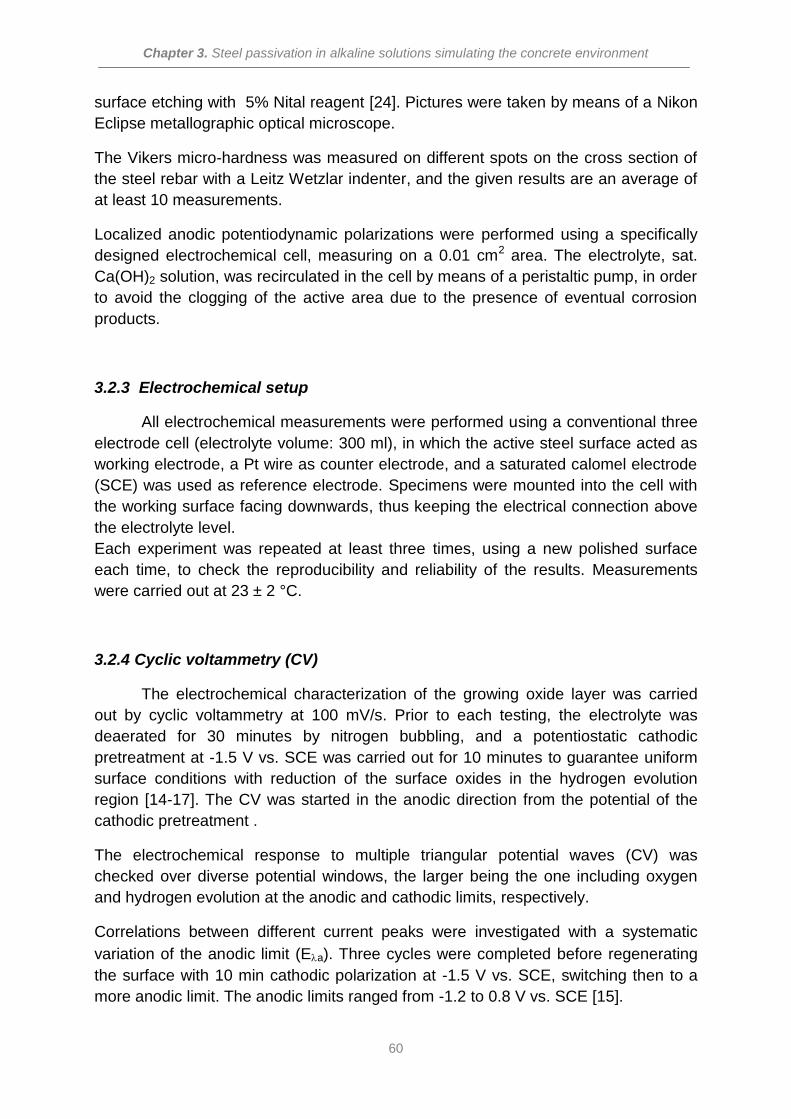
Chapter 3. Steel passivation in alkaline solutions simulating the concrete environment
60
surface etching with 5% Nital reagent [24]. Pictures were taken by means of a Nikon
Eclipse metallographic optical microscope.
The Vikers micro-hardness was measured on different spots on the cross section of
the steel rebar with a Leitz Wetzlar indenter, and the given results are an average of
at least 10 measurements.
Localized anodic potentiodynamic polarizations were performed using a specifically
designed electrochemical cell, measuring on a 0.01 cm2 area. The electrolyte, sat.
Ca(OH)2 solution, was recirculated in the cell by means of a peristaltic pump, in order
to avoid the clogging of the active area due to the presence of eventual corrosion
products.
3.2.3 Electrochemical setup
All electrochemical measurements were performed using a conventional three
electrode cell (electrolyte volume: 300 ml), in which the active steel surface acted as
working electrode, a Pt wire as counter electrode, and a saturated calomel electrode
(SCE) was used as reference electrode. Specimens were mounted into the cell with
the working surface facing downwards, thus keeping the electrical connection above
the electrolyte level.
Each experiment was repeated at least three times, using a new polished surface
each time, to check the reproducibility and reliability of the results. Measurements
were carried out at 23 ± 2 °C.
3.2.4 Cyclic voltammetry (CV)
The electrochemical characterization of the growing oxide layer was carried
out by cyclic voltammetry at 100 mV/s. Prior to each testing, the electrolyte was
deaerated for 30 minutes by nitrogen bubbling, and a potentiostatic cathodic
pretreatment at -1.5 V vs. SCE was carried out for 10 minutes to guarantee uniform
surface conditions with reduction of the surface oxides in the hydrogen evolution
region [14-17]. The CV was started in the anodic direction from the potential of the
cathodic pretreatment .
The electrochemical response to multiple triangular potential waves (CV) was
checked over diverse potential windows, the larger being the one including oxygen
and hydrogen evolution at the anodic and cathodic limits, respectively.
Correlations between different current peaks were investigated with a systematic
variation of the anodic limit (Ea). Three cycles were completed before regenerating
the surface with 10 min cathodic polarization at -1.5 V vs. SCE, switching then to a
more anodic limit. The anodic limits ranged from -1.2 to 0.8 V vs. SCE [15].
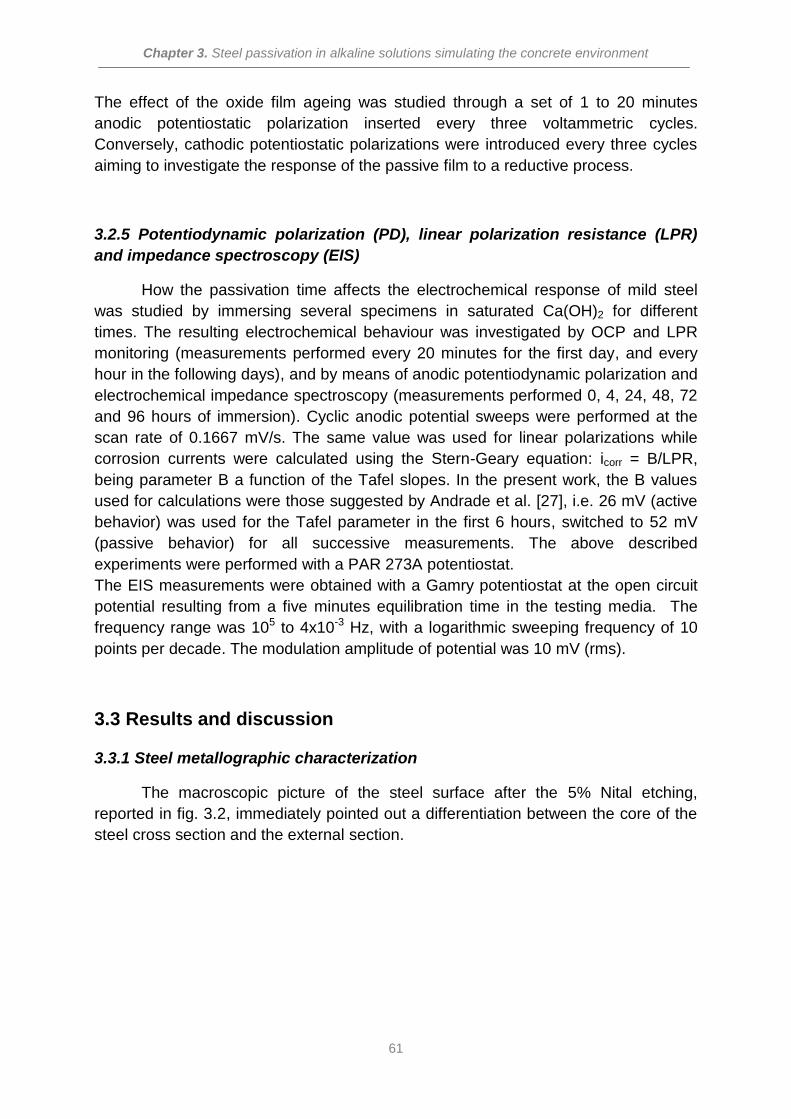
Chapter 3. Steel passivation in alkaline solutions simulating the concrete environment
61
The effect of the oxide film ageing was studied through a set of 1 to 20 minutes
anodic potentiostatic polarization inserted every three voltammetric cycles.
Conversely, cathodic potentiostatic polarizations were introduced every three cycles
aiming to investigate the response of the passive film to a reductive process.
3.2.5 Potentiodynamic polarization (PD), linear polarization resistance (LPR)
and impedance spectroscopy (EIS)
How the passivation time affects the electrochemical response of mild steel
was studied by immersing several specimens in saturated Ca(OH)2 for different
times. The resulting electrochemical behaviour was investigated by OCP and LPR
monitoring (measurements performed every 20 minutes for the first day, and every
hour in the following days), and by means of anodic potentiodynamic polarization and
electrochemical impedance spectroscopy (measurements performed 0, 4, 24, 48, 72
and 96 hours of immersion). Cyclic anodic potential sweeps were performed at the
scan rate of 0.1667 mV/s. The same value was used for linear polarizations while
corrosion currents were calculated using the Stern-Geary equation: icorr = B/LPR,
being parameter B a function of the Tafel slopes. In the present work, the B values
used for calculations were those suggested by Andrade et al. [27], i.e. 26 mV (active
behavior) was used for the Tafel parameter in the first 6 hours, switched to 52 mV
(passive behavior) for all successive measurements. The above described
experiments were performed with a PAR 273A potentiostat.
The EIS measurements were obtained with a Gamry potentiostat at the open circuit
potential resulting from a five minutes equilibration time in the testing media. The
frequency range was 105 to 4x10⁻³ Hz, with a logarithmic sweeping frequency of 10
points per decade. The modulation amplitude of potential was 10 mV (rms).
3.3 Results and discussion
3.3.1 Steel metallographic characterization
The macroscopic picture of the steel surface after the 5% Nital etching,
reported in fig. 3.2, immediately pointed out a differentiation between the core of the
steel cross section and the external section.
Chapter 3. Steel passivation in alkaline solutions simulating the concrete environment
62
Fig. 3.2: Macroscopic picture of the B450C steel surface, after 5% Nital etching.
Further observations, performed with the optical microscopy, showed the presence of
two significantly different microstructures (fig. 3.3). The core region (fig.3.3(a))
exhibited a crystalline structure where the grain boundaries were clearly detectable.
From the morphological point of view, the coexistence of dark and bright areas was
attributed to ferrite/perlite phases. On the superficial section a less clear structure
was observed, where however it was still possible to detect the grain boundaries.
Fig. 3.3: Optical microscopy pictures of the B450C steel surface, after 5% Nital etching
(magnification: 500X). (a) core, (b) surface.
The different morphology was reflected in a different penetration of the pyramidal
indenter, values for the Vickers microhardness are shown in table 1
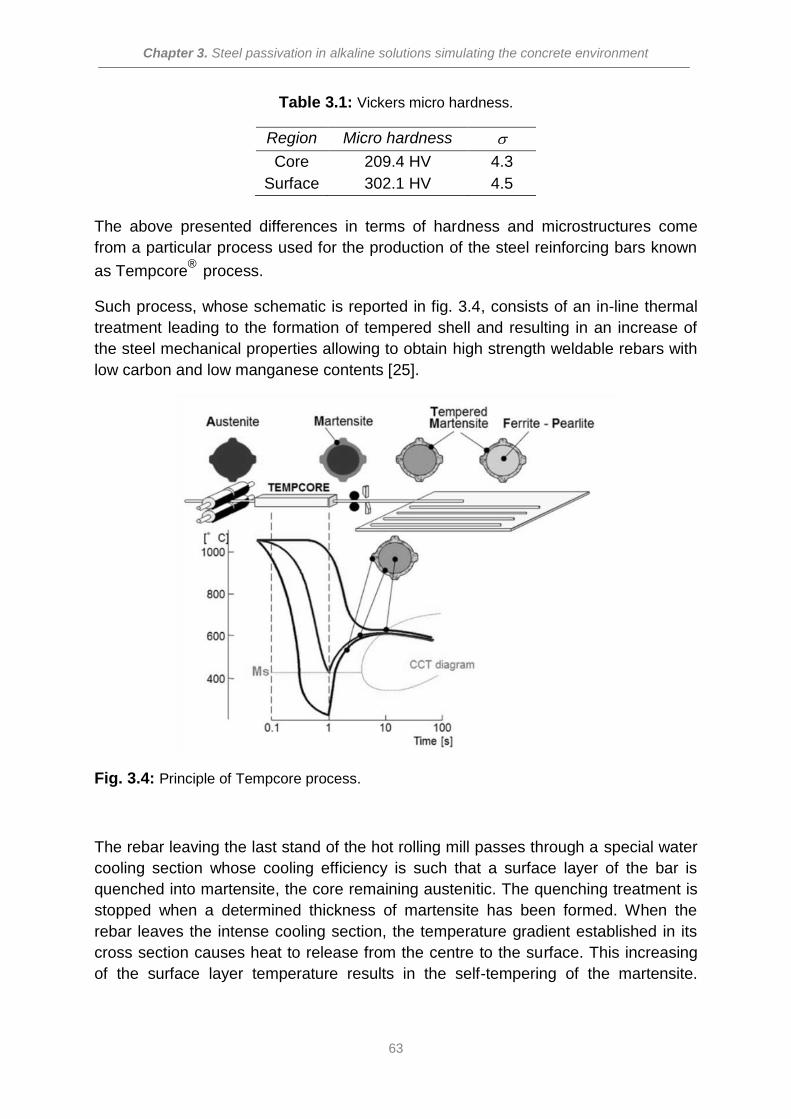
Chapter 3. Steel passivation in alkaline solutions simulating the concrete environment
63
Table 3.1: Vickers micro hardness.
Region Micro hardness
Core 209.4 HV 4.3
Surface 302.1 HV 4.5
The above presented differences in terms of hardness and microstructures come
from a particular process used for the production of the steel reinforcing bars known
as Tempcore®
process.
Such process, whose schematic is reported in fig. 3.4, consists of an in-line thermal
treatment leading to the formation of tempered shell and resulting in an increase of
the steel mechanical properties allowing to obtain high strength weldable rebars with
low carbon and low manganese contents [25].
Fig. 3.4: Principle of Tempcore process.
The rebar leaving the last stand of the hot rolling mill passes through a special water
cooling section whose cooling efficiency is such that a surface layer of the bar is
quenched into martensite, the core remaining austenitic. The quenching treatment is
stopped when a determined thickness of martensite has been formed. When the
rebar leaves the intense cooling section, the temperature gradient established in its
cross section causes heat to release from the centre to the surface. This increasing
of the surface layer temperature results in the self-tempering of the martensite.
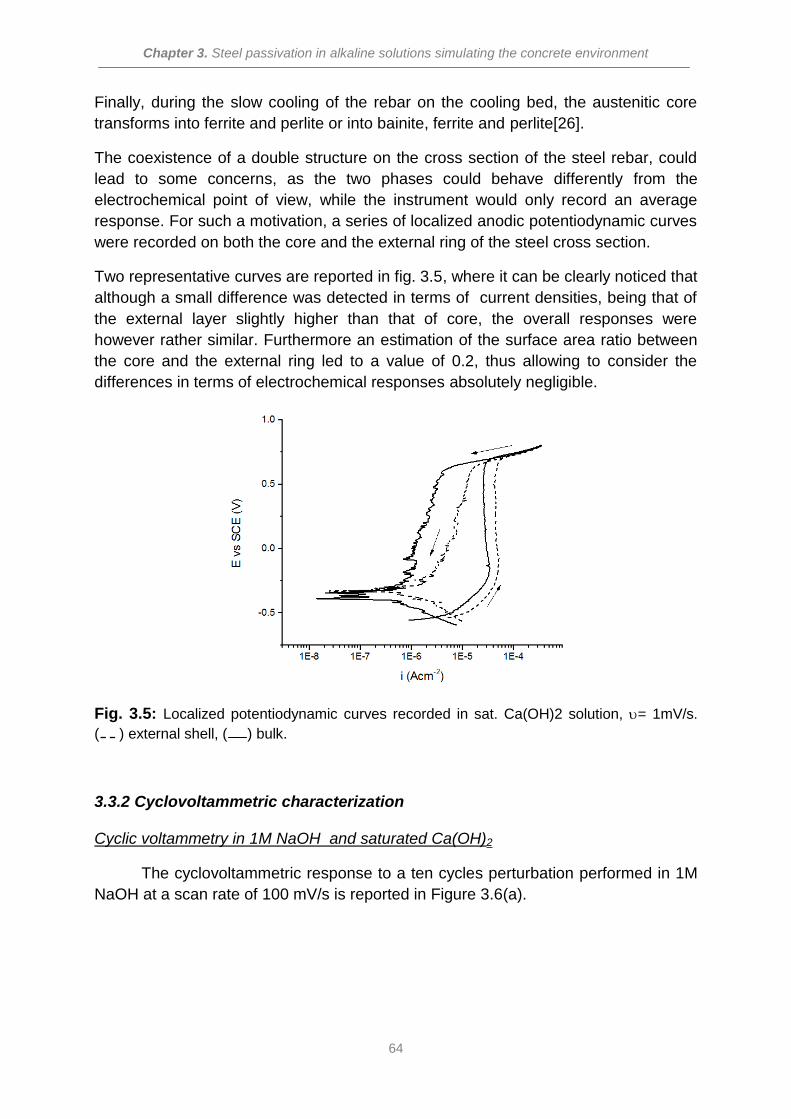
Chapter 3. Steel passivation in alkaline solutions simulating the concrete environment
64
Finally, during the slow cooling of the rebar on the cooling bed, the austenitic core
transforms into ferrite and perlite or into bainite, ferrite and perlite[26].
The coexistence of a double structure on the cross section of the steel rebar, could
lead to some concerns, as the two phases could behave differently from the
electrochemical point of view, while the instrument would only record an average
response. For such a motivation, a series of localized anodic potentiodynamic curves
were recorded on both the core and the external ring of the steel cross section.
Two representative curves are reported in fig. 3.5, where it can be clearly noticed that
although a small difference was detected in terms of current densities, being that of
the external layer slightly higher than that of core, the overall responses were
however rather similar. Furthermore an estimation of the surface area ratio between
the core and the external ring led to a value of 0.2, thus allowing to consider the
differences in terms of electrochemical responses absolutely negligible.
Fig. 3.5: Localized potentiodynamic curves recorded in sat. Ca(OH)2 solution, = 1mV/s.
( ) external shell, ( ) bulk.
3.3.2 Cyclovoltammetric characterization
Cyclic voltammetry in 1M NaOH and saturated Ca(OH)2
The cyclovoltammetric response to a ten cycles perturbation performed in 1M
NaOH at a scan rate of 100 mV/s is reported in Figure 3.6(a).
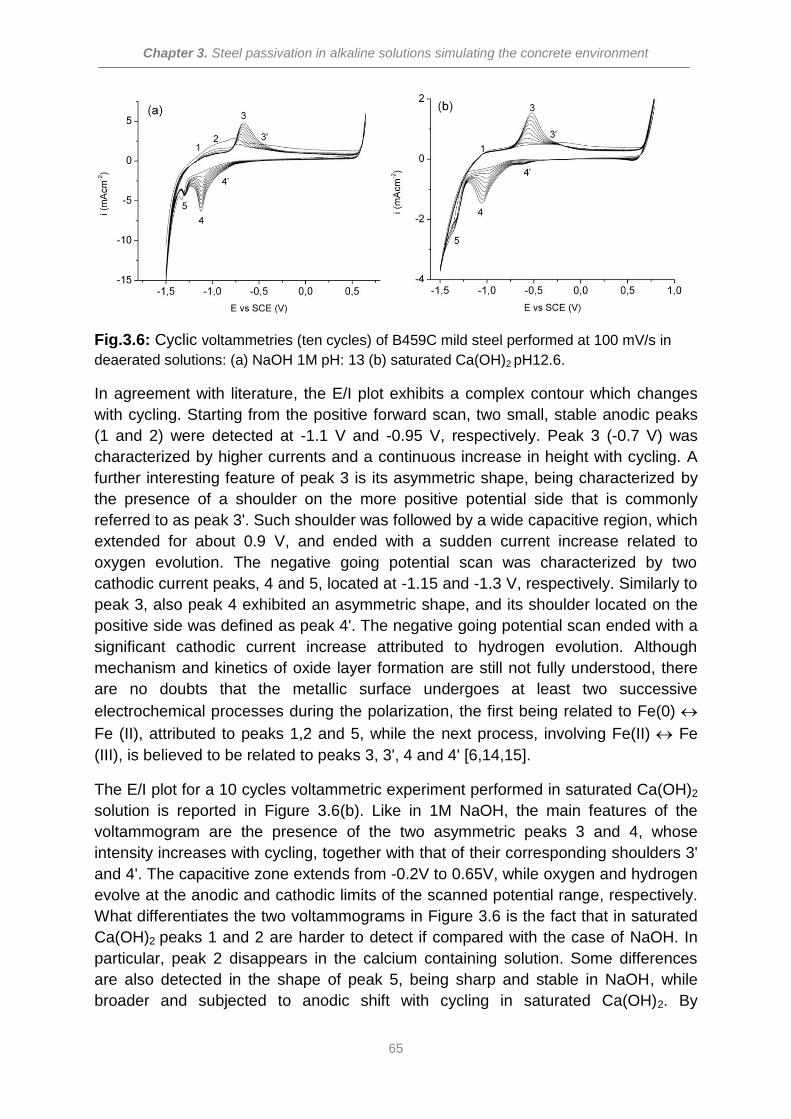
Chapter 3. Steel passivation in alkaline solutions simulating the concrete environment
65
Fig.3.6: Cyclic voltammetries (ten cycles) of B459C mild steel performed at 100 mV/s in
deaerated solutions: (a) NaOH 1M pH: 13 (b) saturated Ca(OH)2 pH12.6.
In agreement with literature, the E/I plot exhibits a complex contour which changes
with cycling. Starting from the positive forward scan, two small, stable anodic peaks
(1 and 2) were detected at -1.1 V and -0.95 V, respectively. Peak 3 (-0.7 V) was
characterized by higher currents and a continuous increase in height with cycling. A
further interesting feature of peak 3 is its asymmetric shape, being characterized by
the presence of a shoulder on the more positive potential side that is commonly
referred to as peak 3'. Such shoulder was followed by a wide capacitive region, which
extended for about 0.9 V, and ended with a sudden current increase related to
oxygen evolution. The negative going potential scan was characterized by two
cathodic current peaks, 4 and 5, located at -1.15 and -1.3 V, respectively. Similarly to
peak 3, also peak 4 exhibited an asymmetric shape, and its shoulder located on the
positive side was defined as peak 4'. The negative going potential scan ended with a
significant cathodic current increase attributed to hydrogen evolution. Although
mechanism and kinetics of oxide layer formation are still not fully understood, there
are no doubts that the metallic surface undergoes at least two successive
electrochemical processes during the polarization, the first being related to Fe(0)
Fe (II), attributed to peaks 1,2 and 5, while the next process, involving Fe(II) Fe
(III), is believed to be related to peaks 3, 3', 4 and 4' [6,14,15].
The E/I plot for a 10 cycles voltammetric experiment performed in saturated Ca(OH)2
solution is reported in Figure 3.6(b). Like in 1M NaOH, the main features of the
voltammogram are the presence of the two asymmetric peaks 3 and 4, whose
intensity increases with cycling, together with that of their corresponding shoulders 3'
and 4'. The capacitive zone extends from -0.2V to 0.65V, while oxygen and hydrogen
evolve at the anodic and cathodic limits of the scanned potential range, respectively.
What differentiates the two voltammograms in Figure 3.6 is the fact that in saturated
Ca(OH)2 peaks 1 and 2 are harder to detect if compared with the case of NaOH. In
particular, peak 2 disappears in the calcium containing solution. Some differences
are also detected in the shape of peak 5, being sharp and stable in NaOH, while
broader and subjected to anodic shift with cycling in saturated Ca(OH)2. By
Chapter 3. Steel passivation in alkaline solutions simulating the concrete environment
66
comparing the current densities of peak 3 and 4 in the two different solutions, it can
be noticed that current peaks recorded in NaOH are significantly higher, by a factor
of 3, than those in Ca(OH)2. Such difference may be explained considering the
inhibitive properties of Ca(OH)2 solution [16], according to which preferential
adsorption of Ca2+ ions at the outer plane of the inner oxide film should decrease the
strength of the electric field assisting the displacement of iron ions from the substrate
to the outer layer region, thus enhancing passivation during potential cycling. Another
study [28] confirms that adsorbed cations such as Ca2+, Mg2+ and Ba2+ can
accelerate accumulation of passivating oxides.
Effect of the scanned potential window
Repetitive cycling was performed over different potential windows to better
understand the electrochemical behavior of mild steel in saturated Ca(OH)2 solution,
and aiming to investigate how the different peaks are intercorrelated; results are
shown in Figure 3.7. By setting the limiting anodic value (Ea) at -0.14 V, thus
excluding capacitive and oxygen evolution regions, the voltammogram presents the
same features as the one performed in the extended potential range: two anodic
peaks 1 and 3, and two cathodic peaks 4 and 5 (Figure 3.7(a)). The only remarkable
difference is that the growth of peaks 3 and 4 is clearly inhibited, and the resulting
currents are significantly lower (for example 0.6 mA/cm2 against 1.5 mA/cm2 for peak
3 at the 10th cycle). The drastic decrease registered in the current densities by
changing the anodic limit from 0.8 V to -0.14 V may be attributed to exclusion of the
oxygen evolution region, such phenomenon playing a major role in the formation of a
porous outer layer. By excluding oxygen evolution, a more compact oxide layer is
expected, characterized by increased barrier effect hindering the reduction/oxidation
mechanism and giving rise to the signals of Figure 3.7(a). By further decreasing the
width of the scanned potential window to -0.8 V, thus also excluding the region of
peaks 3 and 3', the resulting cyclovoltammogram changes dramatically with respect
to the previous cases. As clearly shown in figure 3.7(b), the exclusion of peak 3
results in the absence of peak 4, which indicates interconnection between the two
signals. According to the literature [6,14,15], the peaks are related to oxidation and
reduction of the redox couple Fe(II) - Fe(III), respectively. Differently from
expectations based on the literature for NaOH solutions [15], also peak 5 disappears
in the cyclovoltammograms of Figure 3.7(b), which points out that a necessary
condition for its occurrence is the preceding oxidation-reduction process related to
peak 3 and 4. Motivation for such behavior may be attributed to the different nature
and structure of the oxide film, more compact and insulating in the inner layer, more
porous and less dense in the outer layer .
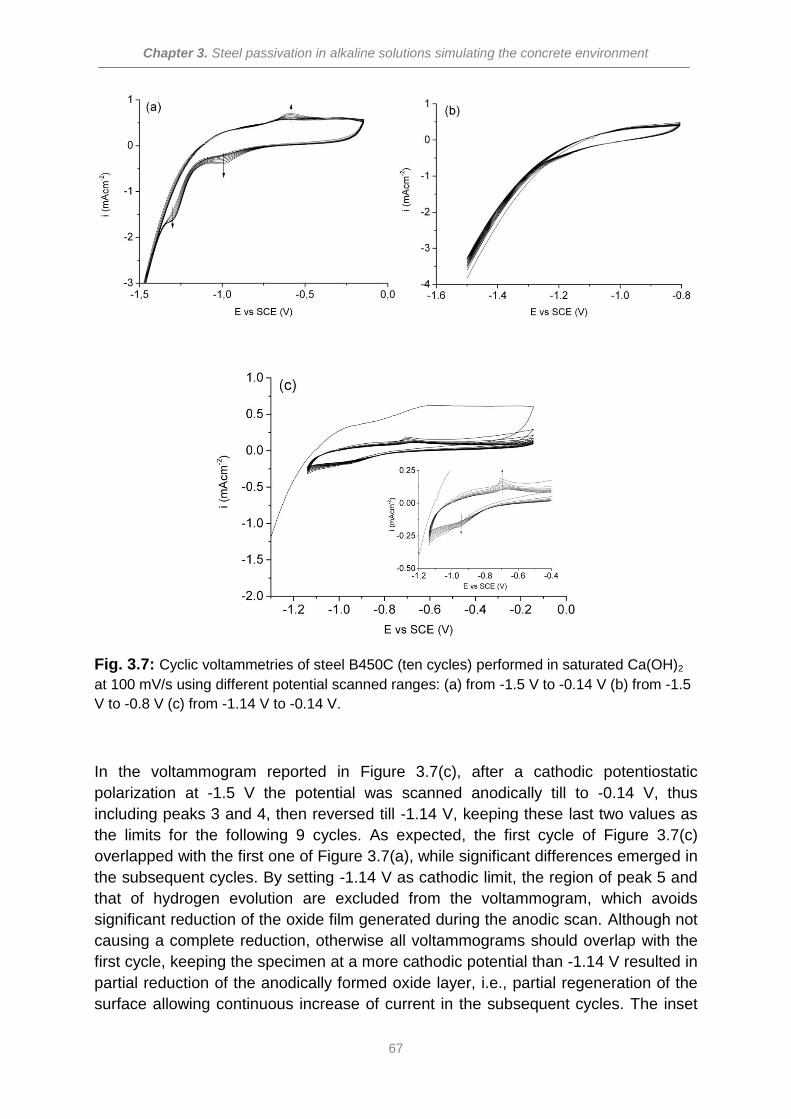
Chapter 3. Steel passivation in alkaline solutions simulating the concrete environment
67
Fig. 3.7: Cyclic voltammetries of steel B450C (ten cycles) performed in saturated Ca(OH)2
at 100 mV/s using different potential scanned ranges: (a) from -1.5 V to -0.14 V (b) from -1.5
V to -0.8 V (c) from -1.14 V to -0.14 V.
In the voltammogram reported in Figure 3.7(c), after a cathodic potentiostatic
polarization at -1.5 V the potential was scanned anodically till to -0.14 V, thus
including peaks 3 and 4, then reversed till -1.14 V, keeping these last two values as
the limits for the following 9 cycles. As expected, the first cycle of Figure 3.7(c)
overlapped with the first one of Figure 3.7(a), while significant differences emerged in
the subsequent cycles. By setting -1.14 V as cathodic limit, the region of peak 5 and
that of hydrogen evolution are excluded from the voltammogram, which avoids
significant reduction of the oxide film generated during the anodic scan. Although not
causing a complete reduction, otherwise all voltammograms should overlap with the
first cycle, keeping the specimen at a more cathodic potential than -1.14 V resulted in
partial reduction of the anodically formed oxide layer, i.e., partial regeneration of the
surface allowing continuous increase of current in the subsequent cycles. The inset
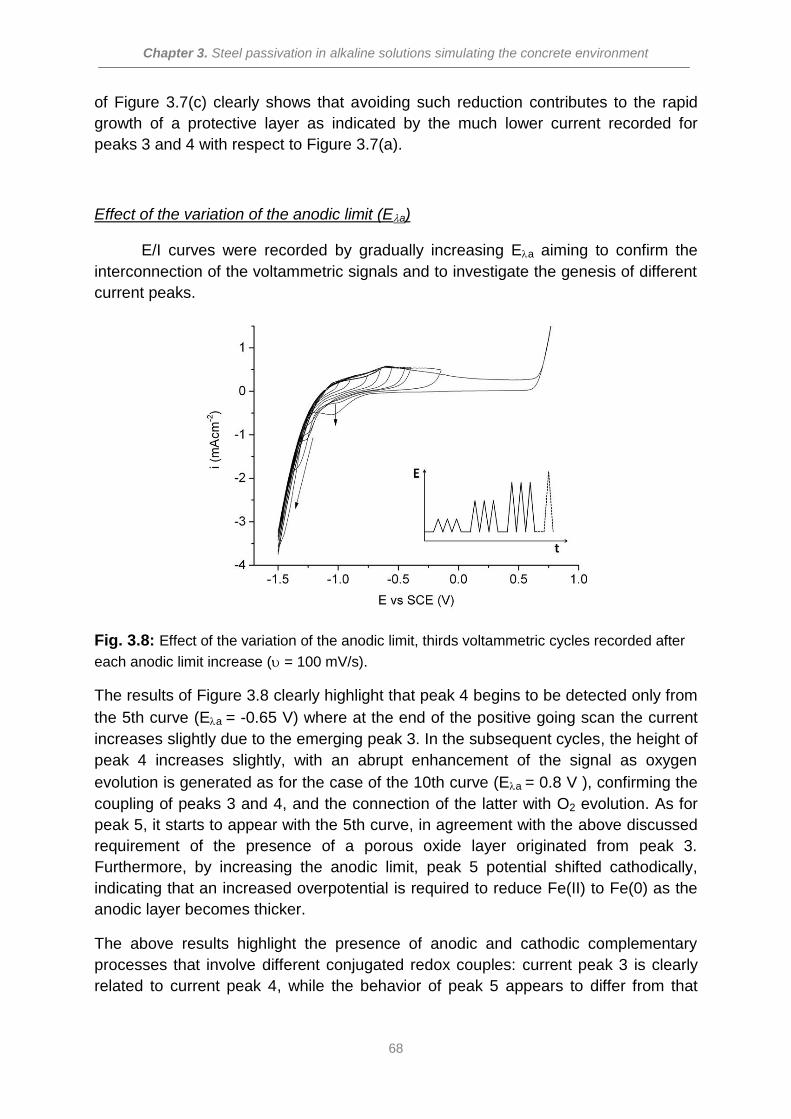
Chapter 3. Steel passivation in alkaline solutions simulating the concrete environment
68
of Figure 3.7(c) clearly shows that avoiding such reduction contributes to the rapid
growth of a protective layer as indicated by the much lower current recorded for
peaks 3 and 4 with respect to Figure 3.7(a).
Effect of the variation of the anodic limit (Ea)
E/I curves were recorded by gradually increasing Ea aiming to confirm the
interconnection of the voltammetric signals and to investigate the genesis of different
current peaks.
Fig. 3.8: Effect of the variation of the anodic limit, thirds voltammetric cycles recorded after
each anodic limit increase ( = 100 mV/s).
The results of Figure 3.8 clearly highlight that peak 4 begins to be detected only from
the 5th curve (Ea = -0.65 V) where at the end of the positive going scan the current
increases slightly due to the emerging peak 3. In the subsequent cycles, the height of
peak 4 increases slightly, with an abrupt enhancement of the signal as oxygen
evolution is generated as for the case of the 10th curve (Ea = 0.8 V ), confirming the
coupling of peaks 3 and 4, and the connection of the latter with O2 evolution. As for
peak 5, it starts to appear with the 5th curve, in agreement with the above discussed
requirement of the presence of a porous oxide layer originated from peak 3.
Furthermore, by increasing the anodic limit, peak 5 potential shifted cathodically,
indicating that an increased overpotential is required to reduce Fe(II) to Fe(0) as the
anodic layer becomes thicker.
The above results highlight the presence of anodic and cathodic complementary
processes that involve different conjugated redox couples: current peak 3 is clearly
related to current peak 4, while the behavior of peak 5 appears to differ from that
Chapter 3. Steel passivation in alkaline solutions simulating the concrete environment
69
reported by other authors [15], being related to some extent to the presence of peaks
3 and 4
According to the literature [6,15,16,21,29] in alkaline solution the stable product that
firstly forms in the potential range of peak 1 is Fe(OH)2, via reactions 1 to 3 reported
below. Such compound is electro-oxidized to magnetite (Fe3O4) in the potential range
of peak 3 (reaction 4). Products formed in this ways are subsequently subjected to
chemical reactions or structural rearrangements related to ageing processes that
lead to further modifications of the oxide layer (reactions 5, 6). The final structure of
the oxide layer is commonly considered as to be constituted by a compact inner layer
of magnetite and a less dense, gelatinous layer composed of hydrated products such
as goethite ( - FeOOH), lepidocrocite ( - FeOOH) and akagonite ( - FeOOH). The
double layer nature of the oxide film was confirmed by the presence of the shoulders
3' and 4' that according to [6] are related to redox phenomena occurring in the inner
layer, while the most prominent peaks 3 and 4 are related to those occurring in the
porous outer layer.
Fe + OH- = [Fe(OH)]ads +e- (1)
[Fe(OH)]ads = [Fe(OH)]+ads +e- (2)
[Fe(OH)]+ads + OH- = Fe(OH)2 (3)
3Fe(OH)2 + 2OH- = Fe3O4 + 4H2O +2 e- (4)
Fe3O4 + OH- + H2O = 3FeOOH + e- (5)
2Fe3O4 +2 OH- = 3Fe2O3 + H2O +2 e- (6)
Effect of anodic prepolarizations at -0.14V vs SCE
As a further step to the investigation of how the electrochemical response of
the passivating system changes as a function of time, a series of anodic
potentiostatic polarizations at Ea: -0.14 V were introduced in the voltammetric
experiments (inset Fig. 3.9(c)). Presumably, the effect of the anodic polarization at
Ea should be equivalent to the ageing of the electrochemically formed oxide layer
[30,31].
The first and the third voltammograms recorded after 1 and 20 minutes of anodic
potentiostatic polarization at -0.14 V vs SCE are reported in Figure 3.9(a) and 3.9(b),
respectively, while the full series of the first voltammogramms preceded by
polarizations ranging from 1 to 20 min are shown in Figure 3.9(c).
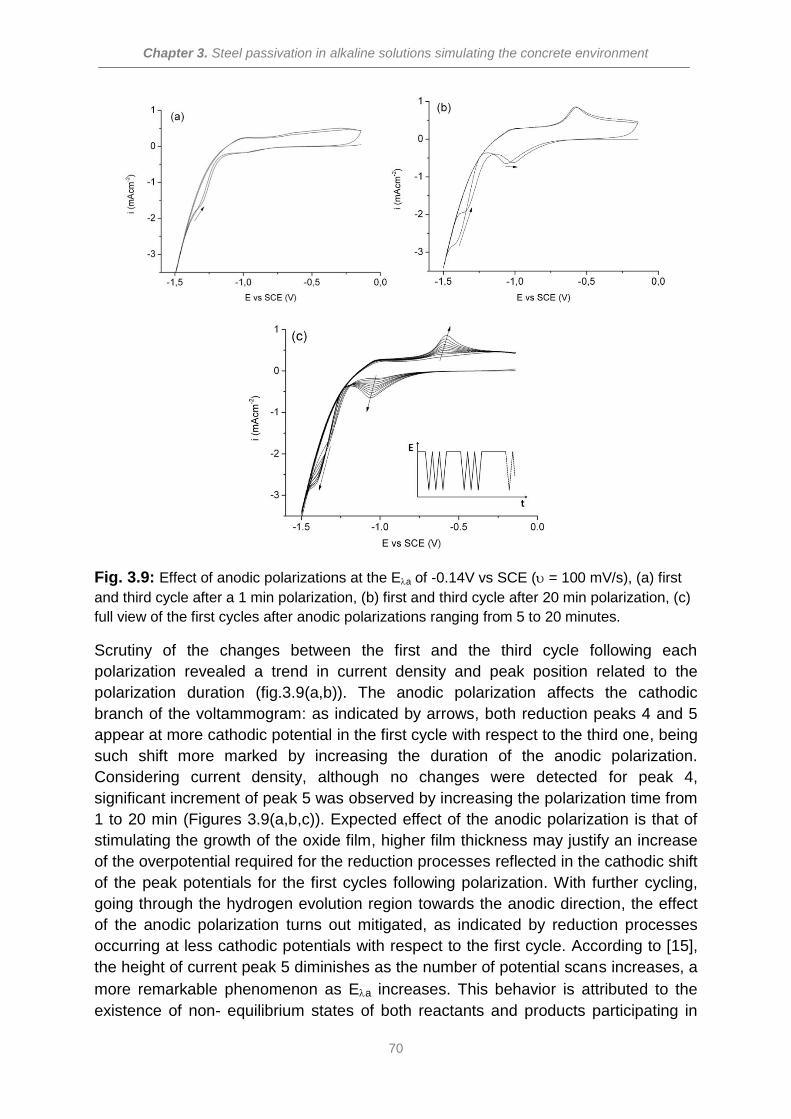
Chapter 3. Steel passivation in alkaline solutions simulating the concrete environment
70
Fig. 3.9: Effect of anodic polarizations at the Ea of -0.14V vs SCE ( = 100 mV/s), (a) first
and third cycle after a 1 min polarization, (b) first and third cycle after 20 min polarization, (c)
full view of the first cycles after anodic polarizations ranging from 5 to 20 minutes.
Scrutiny of the changes between the first and the third cycle following each
polarization revealed a trend in current density and peak position related to the
polarization duration (fig.3.9(a,b)). The anodic polarization affects the cathodic
branch of the voltammogram: as indicated by arrows, both reduction peaks 4 and 5
appear at more cathodic potential in the first cycle with respect to the third one, being
such shift more marked by increasing the duration of the anodic polarization.
Considering current density, although no changes were detected for peak 4,
significant increment of peak 5 was observed by increasing the polarization time from
1 to 20 min (Figures 3.9(a,b,c)). Expected effect of the anodic polarization is that of
stimulating the growth of the oxide film, higher film thickness may justify an increase
of the overpotential required for the reduction processes reflected in the cathodic shift
of the peak potentials for the first cycles following polarization. With further cycling,
going through the hydrogen evolution region towards the anodic direction, the effect
of the anodic polarization turns out mitigated, as indicated by reduction processes
occurring at less cathodic potentials with respect to the first cycle. According to [15],
the height of current peak 5 diminishes as the number of potential scans increases, a
more remarkable phenomenon as Ea increases. This behavior is attributed to the
existence of non- equilibrium states of both reactants and products participating in
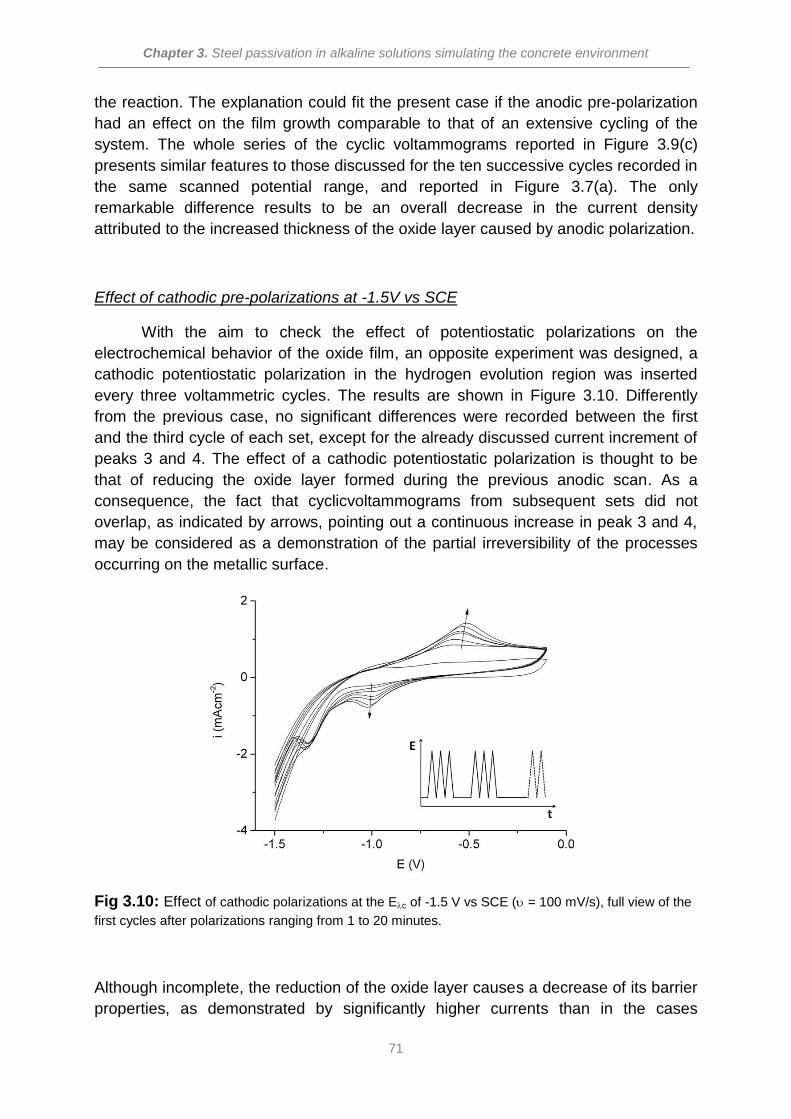
Chapter 3. Steel passivation in alkaline solutions simulating the concrete environment
71
the reaction. The explanation could fit the present case if the anodic pre-polarization
had an effect on the film growth comparable to that of an extensive cycling of the
system. The whole series of the cyclic voltammograms reported in Figure 3.9(c)
presents similar features to those discussed for the ten successive cycles recorded in
the same scanned potential range, and reported in Figure 3.7(a). The only
remarkable difference results to be an overall decrease in the current density
attributed to the increased thickness of the oxide layer caused by anodic polarization.
Effect of cathodic pre-polarizations at -1.5V vs SCE
With the aim to check the effect of potentiostatic polarizations on the
electrochemical behavior of the oxide film, an opposite experiment was designed, a
cathodic potentiostatic polarization in the hydrogen evolution region was inserted
every three voltammetric cycles. The results are shown in Figure 3.10. Differently
from the previous case, no significant differences were recorded between the first
and the third cycle of each set, except for the already discussed current increment of
peaks 3 and 4. The effect of a cathodic potentiostatic polarization is thought to be
that of reducing the oxide layer formed during the previous anodic scan. As a
consequence, the fact that cyclicvoltammograms from subsequent sets did not
overlap, as indicated by arrows, pointing out a continuous increase in peak 3 and 4,
may be considered as a demonstration of the partial irreversibility of the processes
occurring on the metallic surface.
Fig 3.10: Effect of cathodic polarizations at the Ec of -1.5 V vs SCE ( = 100 mV/s), full view of the
first cycles after polarizations ranging from 1 to 20 minutes.
Although incomplete, the reduction of the oxide layer causes a decrease of its barrier
properties, as demonstrated by significantly higher currents than in the cases
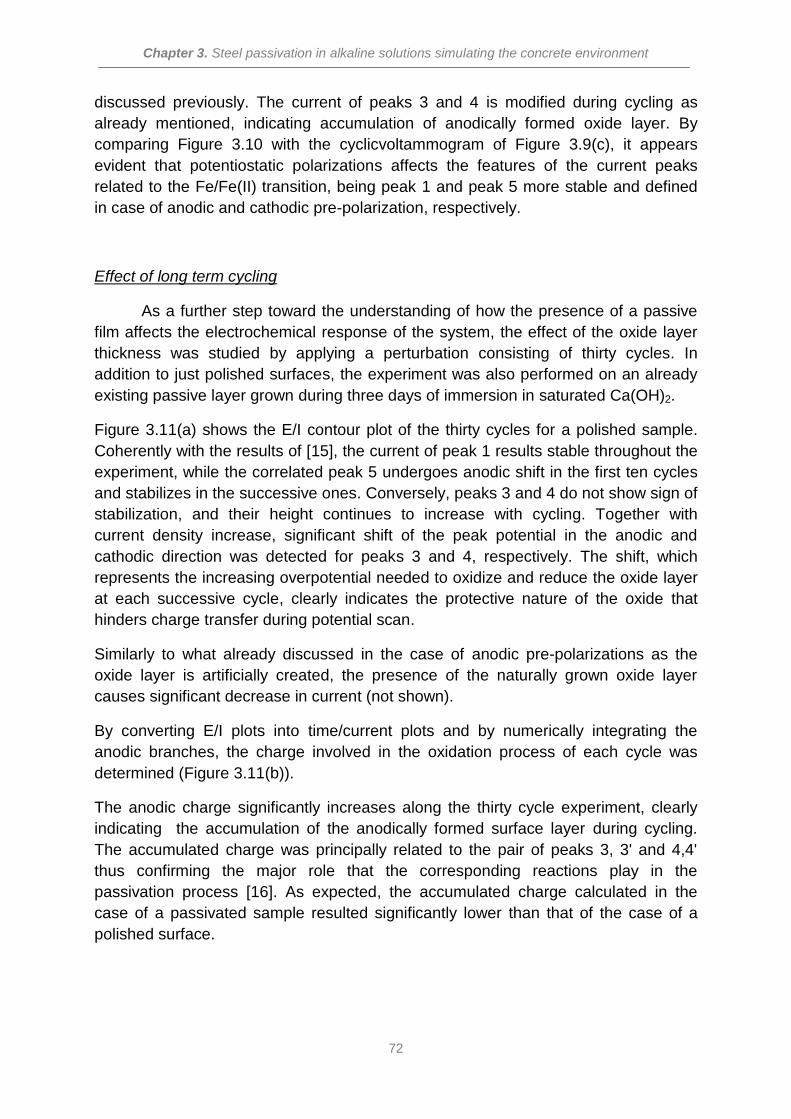
Chapter 3. Steel passivation in alkaline solutions simulating the concrete environment
72
discussed previously. The current of peaks 3 and 4 is modified during cycling as
already mentioned, indicating accumulation of anodically formed oxide layer. By
comparing Figure 3.10 with the cyclicvoltammogram of Figure 3.9(c), it appears
evident that potentiostatic polarizations affects the features of the current peaks
related to the Fe/Fe(II) transition, being peak 1 and peak 5 more stable and defined
in case of anodic and cathodic pre-polarization, respectively.
Effect of long term cycling
As a further step toward the understanding of how the presence of a passive
film affects the electrochemical response of the system, the effect of the oxide layer
thickness was studied by applying a perturbation consisting of thirty cycles. In
addition to just polished surfaces, the experiment was also performed on an already
existing passive layer grown during three days of immersion in saturated Ca(OH)2.
Figure 3.11(a) shows the E/I contour plot of the thirty cycles for a polished sample.
Coherently with the results of [15], the current of peak 1 results stable throughout the
experiment, while the correlated peak 5 undergoes anodic shift in the first ten cycles
and stabilizes in the successive ones. Conversely, peaks 3 and 4 do not show sign of
stabilization, and their height continues to increase with cycling. Together with
current density increase, significant shift of the peak potential in the anodic and
cathodic direction was detected for peaks 3 and 4, respectively. The shift, which
represents the increasing overpotential needed to oxidize and reduce the oxide layer
at each successive cycle, clearly indicates the protective nature of the oxide that
hinders charge transfer during potential scan.
Similarly to what already discussed in the case of anodic pre-polarizations as the
oxide layer is artificially created, the presence of the naturally grown oxide layer
causes significant decrease in current (not shown).
By converting E/I plots into time/current plots and by numerically integrating the
anodic branches, the charge involved in the oxidation process of each cycle was
determined (Figure 3.11(b)).
The anodic charge significantly increases along the thirty cycle experiment, clearly
indicating the accumulation of the anodically formed surface layer during cycling.
The accumulated charge was principally related to the pair of peaks 3, 3' and 4,4'
thus confirming the major role that the corresponding reactions play in the
passivation process [16]. As expected, the accumulated charge calculated in the
case of a passivated sample resulted significantly lower than that of the case of a
polished surface.
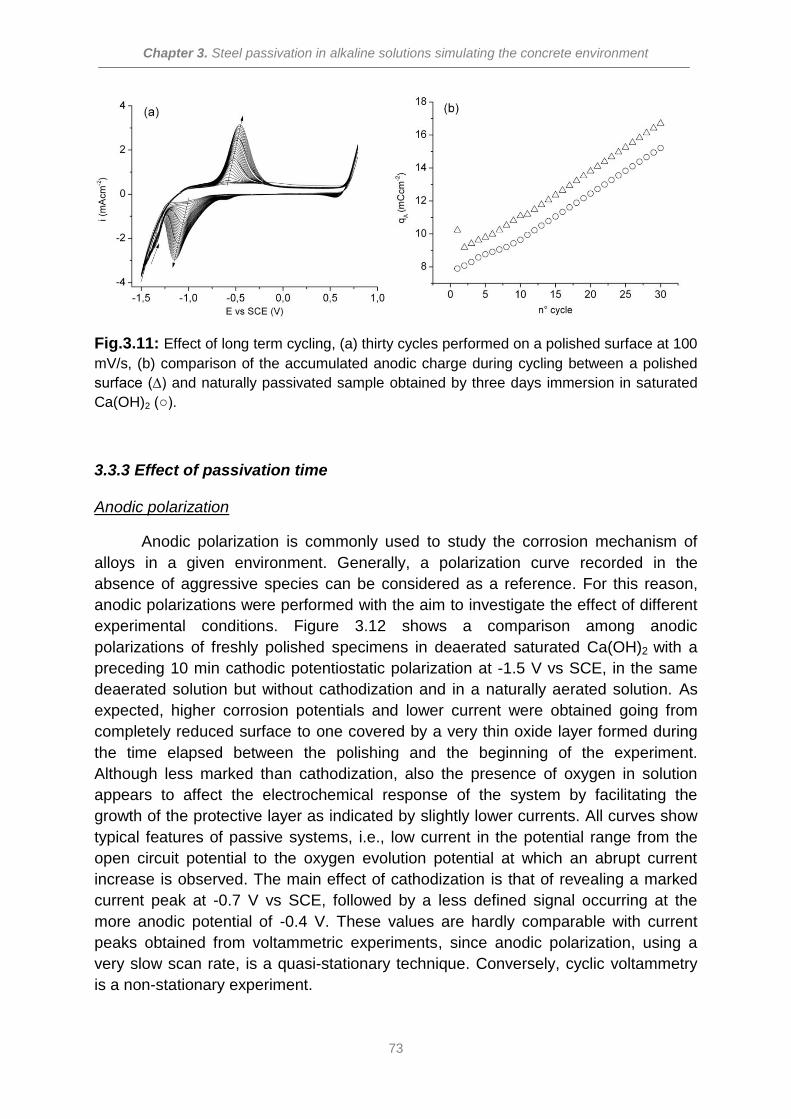
Chapter 3. Steel passivation in alkaline solutions simulating the concrete environment
73
Fig.3.11: Effect of long term cycling, (a) thirty cycles performed on a polished surface at 100
mV/s, (b) comparison of the accumulated anodic charge during cycling between a polished
surface (∆) and naturally passivated sample obtained by three days immersion in saturated
Ca(OH)2 ().
3.3.3 Effect of passivation time
Anodic polarization
Anodic polarization is commonly used to study the corrosion mechanism of
alloys in a given environment. Generally, a polarization curve recorded in the
absence of aggressive species can be considered as a reference. For this reason,
anodic polarizations were performed with the aim to investigate the effect of different
experimental conditions. Figure 3.12 shows a comparison among anodic
polarizations of freshly polished specimens in deaerated saturated Ca(OH)2 with a
preceding 10 min cathodic potentiostatic polarization at -1.5 V vs SCE, in the same
deaerated solution but without cathodization and in a naturally aerated solution. As
expected, higher corrosion potentials and lower current were obtained going from
completely reduced surface to one covered by a very thin oxide layer formed during
the time elapsed between the polishing and the beginning of the experiment.
Although less marked than cathodization, also the presence of oxygen in solution
appears to affect the electrochemical response of the system by facilitating the
growth of the protective layer as indicated by slightly lower currents. All curves show
typical features of passive systems, i.e., low current in the potential range from the
open circuit potential to the oxygen evolution potential at which an abrupt current
increase is observed. The main effect of cathodization is that of revealing a marked
current peak at -0.7 V vs SCE, followed by a less defined signal occurring at the
more anodic potential of -0.4 V. These values are hardly comparable with current
peaks obtained from voltammetric experiments, since anodic polarization, using a
very slow scan rate, is a quasi-stationary technique. Conversely, cyclic voltammetry
is a non-stationary experiment.
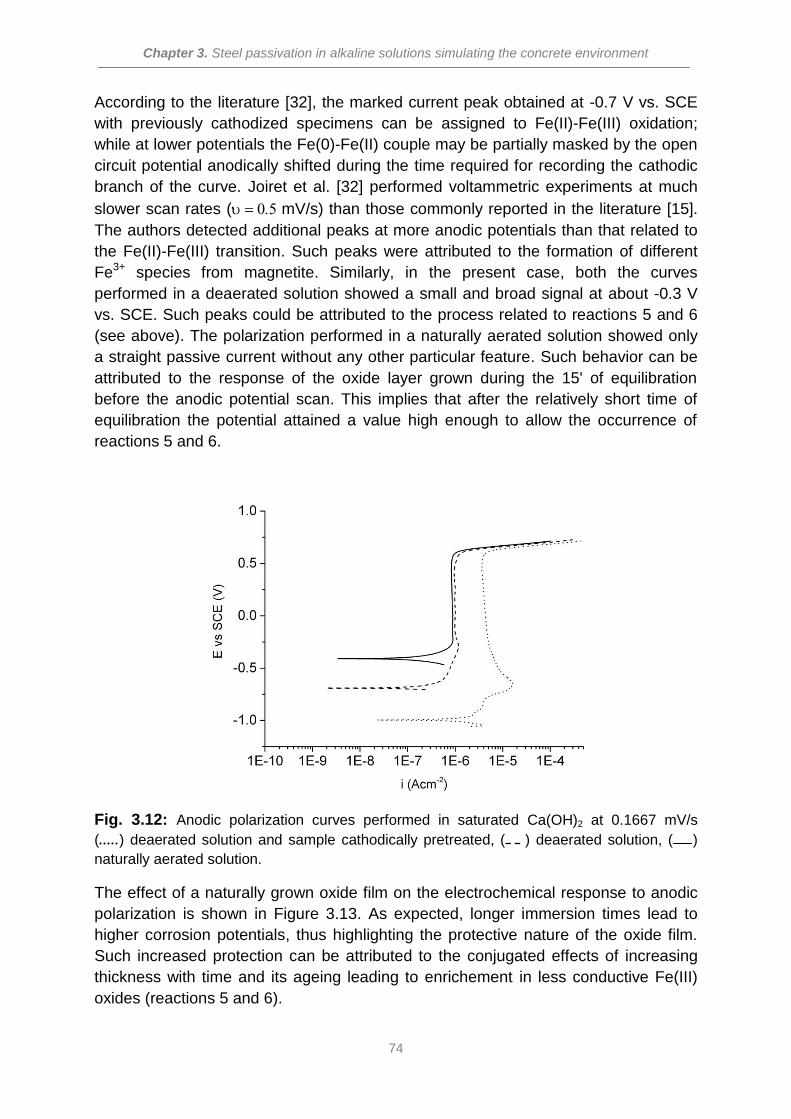
Chapter 3. Steel passivation in alkaline solutions simulating the concrete environment
74
According to the literature [32], the marked current peak obtained at -0.7 V vs. SCE
with previously cathodized specimens can be assigned to Fe(II)-Fe(III) oxidation;
while at lower potentials the Fe(0)-Fe(II) couple may be partially masked by the open
circuit potential anodically shifted during the time required for recording the cathodic
branch of the curve. Joiret et al. [32] performed voltammetric experiments at much
slower scan rates (mV/s) than those commonly reported in the literature [15].
The authors detected additional peaks at more anodic potentials than that related to
the Fe(II)-Fe(III) transition. Such peaks were attributed to the formation of different
Fe3+ species from magnetite. Similarly, in the present case, both the curves
performed in a deaerated solution showed a small and broad signal at about -0.3 V
vs. SCE. Such peaks could be attributed to the process related to reactions 5 and 6
(see above). The polarization performed in a naturally aerated solution showed only
a straight passive current without any other particular feature. Such behavior can be
attributed to the response of the oxide layer grown during the 15' of equilibration
before the anodic potential scan. This implies that after the relatively short time of
equilibration the potential attained a value high enough to allow the occurrence of
reactions 5 and 6.
Fig. 3.12: Anodic polarization curves performed in saturated Ca(OH)2 at 0.1667 mV/s
( ) deaerated solution and sample cathodically pretreated, ( ) deaerated solution, ( )
naturally aerated solution.
The effect of a naturally grown oxide film on the electrochemical response to anodic
polarization is shown in Figure 3.13. As expected, longer immersion times lead to
higher corrosion potentials, thus highlighting the protective nature of the oxide film.
Such increased protection can be attributed to the conjugated effects of increasing
thickness with time and its ageing leading to enrichement in less conductive Fe(III)
oxides (reactions 5 and 6).
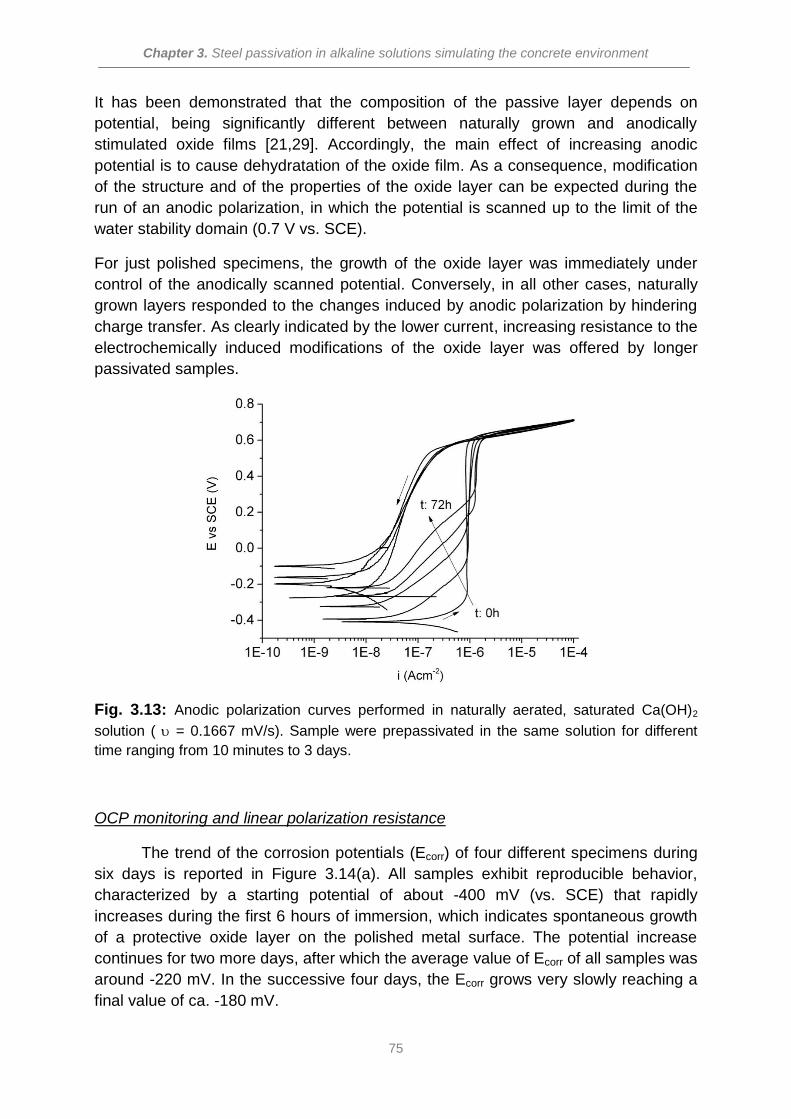
Chapter 3. Steel passivation in alkaline solutions simulating the concrete environment
75
It has been demonstrated that the composition of the passive layer depends on
potential, being significantly different between naturally grown and anodically
stimulated oxide films [21,29]. Accordingly, the main effect of increasing anodic
potential is to cause dehydratation of the oxide film. As a consequence, modification
of the structure and of the properties of the oxide layer can be expected during the
run of an anodic polarization, in which the potential is scanned up to the limit of the
water stability domain (0.7 V vs. SCE).
For just polished specimens, the growth of the oxide layer was immediately under
control of the anodically scanned potential. Conversely, in all other cases, naturally
grown layers responded to the changes induced by anodic polarization by hindering
charge transfer. As clearly indicated by the lower current, increasing resistance to the
electrochemically induced modifications of the oxide layer was offered by longer
passivated samples.
Fig. 3.13: Anodic polarization curves performed in naturally aerated, saturated Ca(OH)2
solution ( = 0.1667 mV/s). Sample were prepassivated in the same solution for different
time ranging from 10 minutes to 3 days.
OCP monitoring and linear polarization resistance
The trend of the corrosion potentials (Ecorr) of four different specimens during
six days is reported in Figure 3.14(a). All samples exhibit reproducible behavior,
characterized by a starting potential of about -400 mV (vs. SCE) that rapidly
increases during the first 6 hours of immersion, which indicates spontaneous growth
of a protective oxide layer on the polished metal surface. The potential increase
continues for two more days, after which the average value of Ecorr of all samples was
around -220 mV. In the successive four days, the Ecorr grows very slowly reaching a
final value of ca. -180 mV.
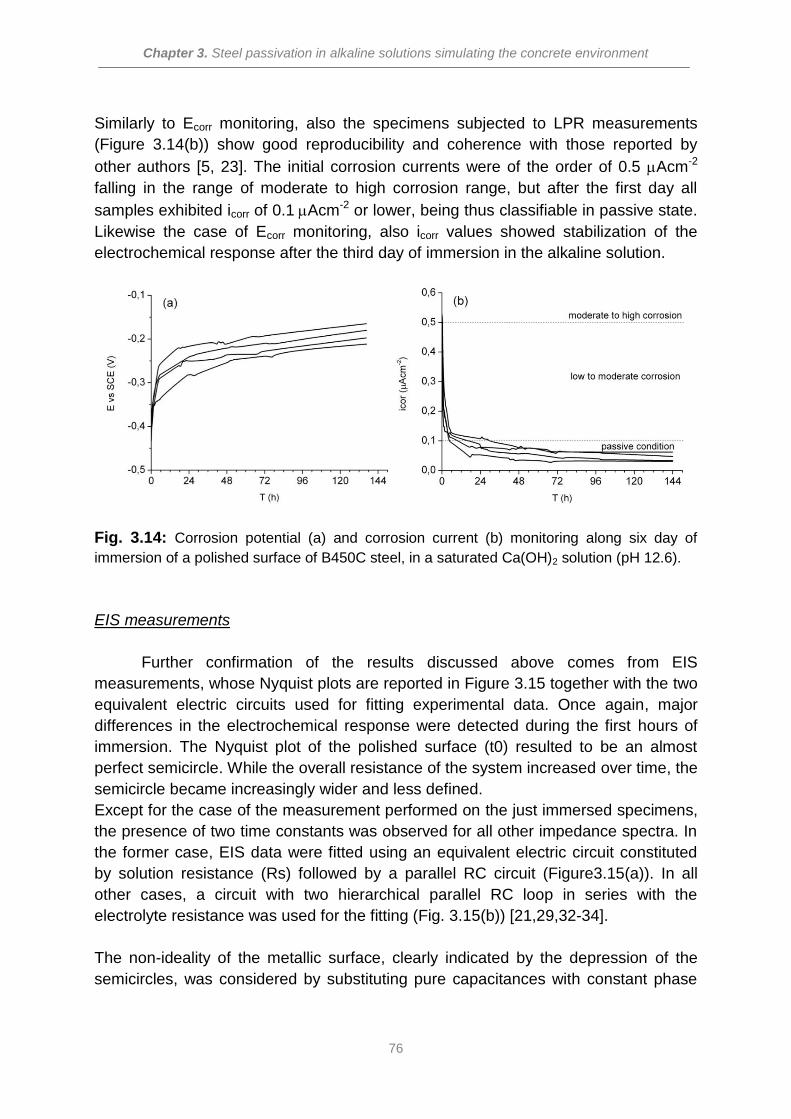
Chapter 3. Steel passivation in alkaline solutions simulating the concrete environment
76
Similarly to Ecorr monitoring, also the specimens subjected to LPR measurements
(Figure 3.14(b)) show good reproducibility and coherence with those reported by
other authors [5, 23]. The initial corrosion currents were of the order of 0.5 Acm-2
falling in the range of moderate to high corrosion range, but after the first day all
samples exhibited icorr of 0.1Acm-2 or lower, being thus classifiable in passive state.
Likewise the case of Ecorr monitoring, also icorr values showed stabilization of the
electrochemical response after the third day of immersion in the alkaline solution.
Fig. 3.14: Corrosion potential (a) and corrosion current (b) monitoring along six day of
immersion of a polished surface of B450C steel, in a saturated Ca(OH)2 solution (pH 12.6).
EIS measurements
Further confirmation of the results discussed above comes from EIS
measurements, whose Nyquist plots are reported in Figure 3.15 together with the two
equivalent electric circuits used for fitting experimental data. Once again, major
differences in the electrochemical response were detected during the first hours of
immersion. The Nyquist plot of the polished surface (t0) resulted to be an almost
perfect semicircle. While the overall resistance of the system increased over time, the
semicircle became increasingly wider and less defined.
Except for the case of the measurement performed on the just immersed specimens,
the presence of two time constants was observed for all other impedance spectra. In
the former case, EIS data were fitted using an equivalent electric circuit constituted
by solution resistance (Rs) followed by a parallel RC circuit (Figure3.15(a)). In all
other cases, a circuit with two hierarchical parallel RC loop in series with the
electrolyte resistance was used for the fitting (Fig. 3.15(b)) [21,29,32-34].
The non-ideality of the metallic surface, clearly indicated by the depression of the
semicircles, was considered by substituting pure capacitances with constant phase
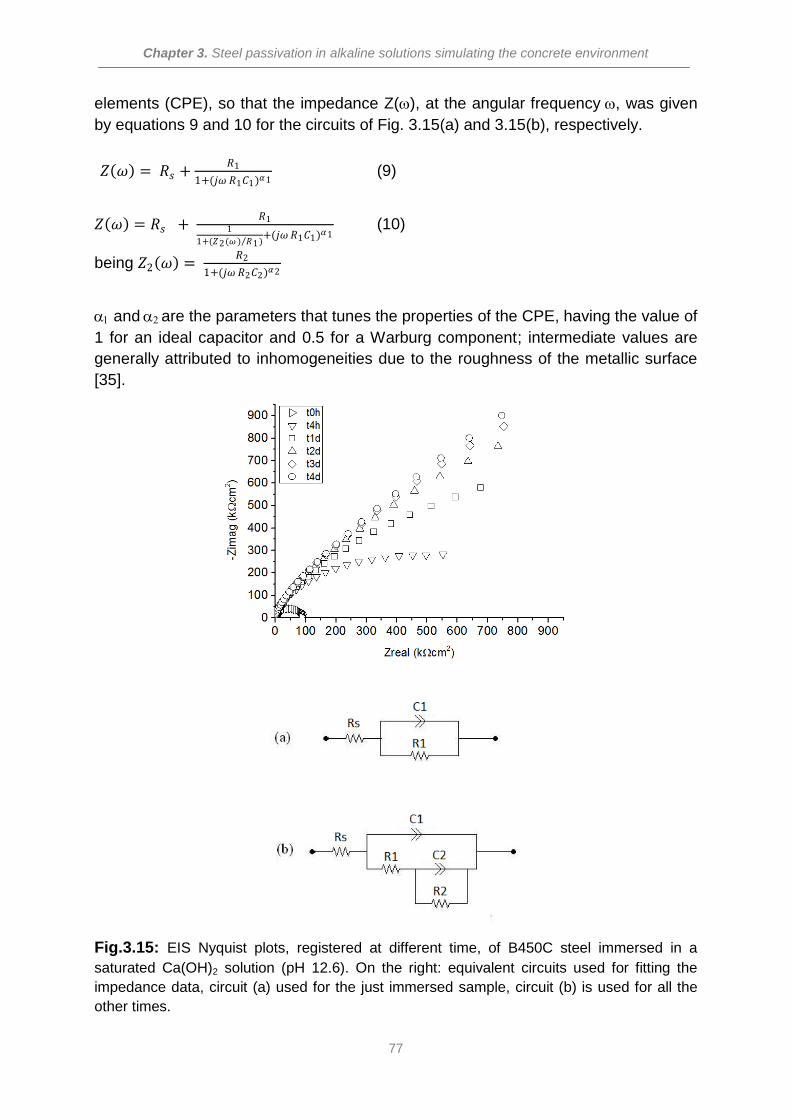
Chapter 3. Steel passivation in alkaline solutions simulating the concrete environment
77
elements (CPE), so that the impedance Z(), at the angular frequency, was given
by equations 9 and 10 for the circuits of Fig. 3.15(a) and 3.15(b), respectively.
𝑍 𝜔 = 𝑅𝑠 +𝑅1
1+(𝑗𝜔 𝑅1𝐶1)𝛼1 (9)
𝑍 𝜔 = 𝑅𝑠 + 𝑅1
1
1+(𝑍2(𝜔 ) 𝑅1) +(𝑗𝜔 𝑅1𝐶1)𝛼1
(10)
being 𝑍2 𝜔 = 𝑅2
1+(𝑗𝜔 𝑅2𝐶2)𝛼2
and are the parameters that tunes the properties of the CPE, having the value of
1 for an ideal capacitor and 0.5 for a Warburg component; intermediate values are
generally attributed to inhomogeneities due to the roughness of the metallic surface
[35].
Fig.3.15: EIS Nyquist plots, registered at different time, of B450C steel immersed in a
saturated Ca(OH)2 solution (pH 12.6). On the right: equivalent circuits used for fitting the
impedance data, circuit (a) used for the just immersed sample, circuit (b) is used for all the
other times.
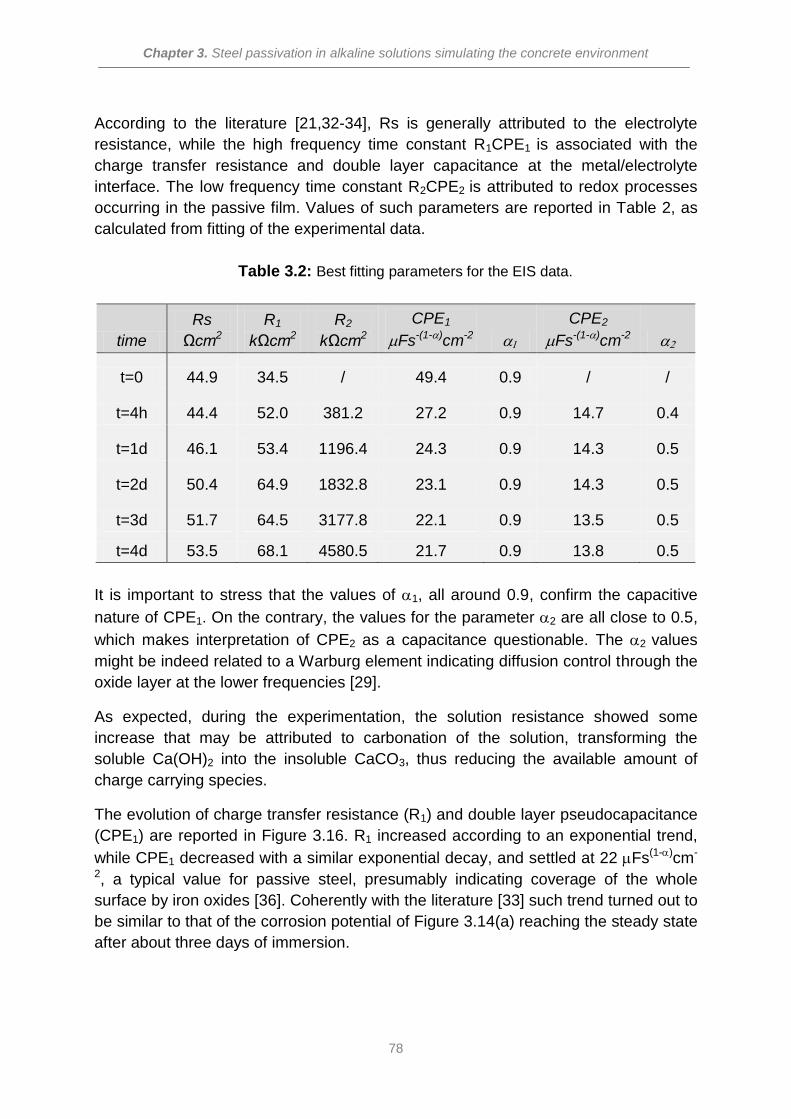
Chapter 3. Steel passivation in alkaline solutions simulating the concrete environment
78
According to the literature [21,32-34], Rs is generally attributed to the electrolyte
resistance, while the high frequency time constant R1CPE1 is associated with the
charge transfer resistance and double layer capacitance at the metal/electrolyte
interface. The low frequency time constant R2CPE2 is attributed to redox processes
occurring in the passive film. Values of such parameters are reported in Table 2, as
calculated from fitting of the experimental data.
Table 3.2: Best fitting parameters for the EIS data.
time
Rs
Ωcm2
R1
kΩcm2
R2
kΩcm2
CPE1
Fs-(1-)cm-2
CPE2
Fs-(1-)cm-2
t=0 44.9 34.5 / 49.4 0.9 / /
t=4h 44.4 52.0 381.2 27.2 0.9 14.7 0.4
t=1d 46.1 53.4 1196.4 24.3 0.9 14.3 0.5
t=2d 50.4 64.9 1832.8 23.1 0.9 14.3 0.5
t=3d 51.7 64.5 3177.8 22.1 0.9 13.5 0.5
t=4d 53.5 68.1 4580.5 21.7 0.9 13.8 0.5
It is important to stress that the values of 1, all around 0.9, confirm the capacitive
nature of CPE1. On the contrary, the values for the parameter 2 are all close to 0.5,
which makes interpretation of CPE2 as a capacitance questionable. The 2 values
might be indeed related to a Warburg element indicating diffusion control through the
oxide layer at the lower frequencies [29].
As expected, during the experimentation, the solution resistance showed some
increase that may be attributed to carbonation of the solution, transforming the
soluble Ca(OH)2 into the insoluble CaCO3, thus reducing the available amount of
charge carrying species.
The evolution of charge transfer resistance (R1) and double layer pseudocapacitance
(CPE1) are reported in Figure 3.16. R1 increased according to an exponential trend,
while CPE1 decreased with a similar exponential decay, and settled at 22 Fs(1-)cm-
2, a typical value for passive steel, presumably indicating coverage of the whole
surface by iron oxides [36]. Coherently with the literature [33] such trend turned out to
be similar to that of the corrosion potential of Figure 3.14(a) reaching the steady state
after about three days of immersion.
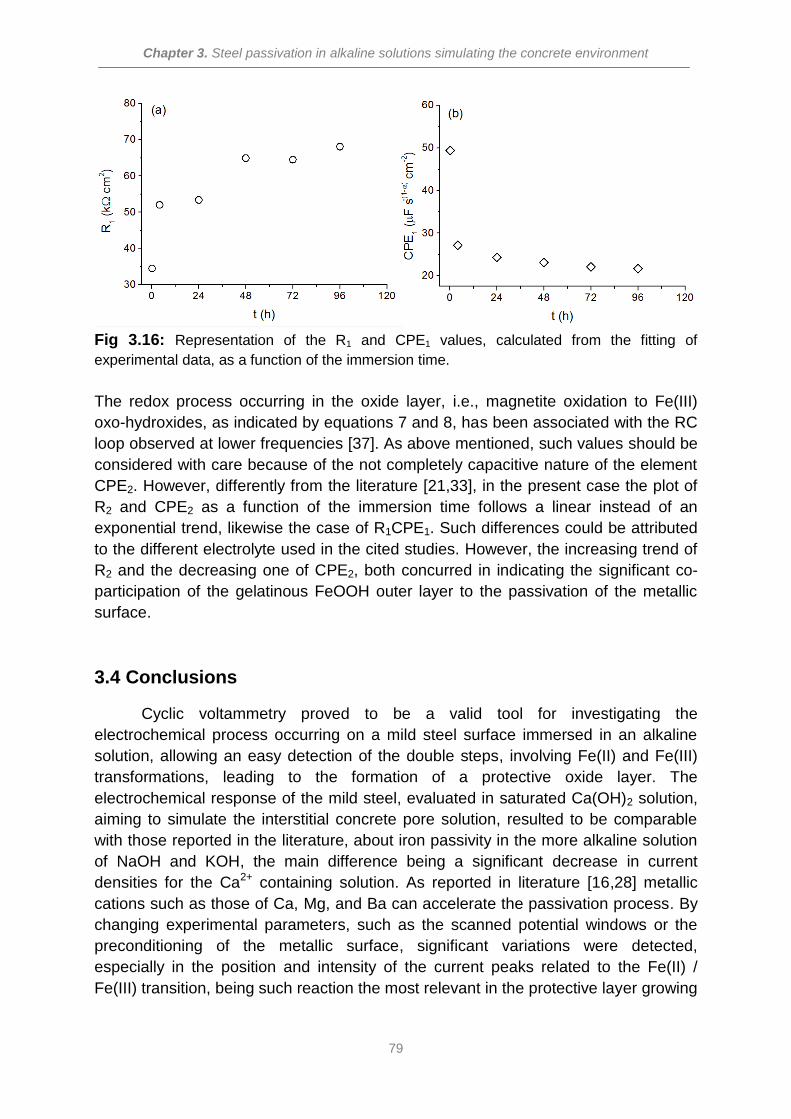
Chapter 3. Steel passivation in alkaline solutions simulating the concrete environment
79
Fig 3.16: Representation of the R1 and CPE1 values, calculated from the fitting of
experimental data, as a function of the immersion time.
The redox process occurring in the oxide layer, i.e., magnetite oxidation to Fe(III)
oxo-hydroxides, as indicated by equations 7 and 8, has been associated with the RC
loop observed at lower frequencies [37]. As above mentioned, such values should be
considered with care because of the not completely capacitive nature of the element
CPE2. However, differently from the literature [21,33], in the present case the plot of
R2 and CPE2 as a function of the immersion time follows a linear instead of an
exponential trend, likewise the case of R1CPE1. Such differences could be attributed
to the different electrolyte used in the cited studies. However, the increasing trend of
R2 and the decreasing one of CPE2, both concurred in indicating the significant co-
participation of the gelatinous FeOOH outer layer to the passivation of the metallic
surface.
3.4 Conclusions
Cyclic voltammetry proved to be a valid tool for investigating the
electrochemical process occurring on a mild steel surface immersed in an alkaline
solution, allowing an easy detection of the double steps, involving Fe(II) and Fe(III)
transformations, leading to the formation of a protective oxide layer. The
electrochemical response of the mild steel, evaluated in saturated Ca(OH)2 solution,
aiming to simulate the interstitial concrete pore solution, resulted to be comparable
with those reported in the literature, about iron passivity in the more alkaline solution
of NaOH and KOH, the main difference being a significant decrease in current
densities for the Ca2+ containing solution. As reported in literature [16,28] metallic
cations such as those of Ca, Mg, and Ba can accelerate the passivation process. By
changing experimental parameters, such as the scanned potential windows or the
preconditioning of the metallic surface, significant variations were detected,
especially in the position and intensity of the current peaks related to the Fe(II) /
Fe(III) transition, being such reaction the most relevant in the protective layer growing

Chapter 3. Steel passivation in alkaline solutions simulating the concrete environment
80
process as indicated by the continuous increase of the current of the correlated
peaks with cycling.
Anodic polarization performed at different passivation times indicated that a naturally
grown oxide layer significantly affects the electrochemical response of the metal
surface by hindering the charge transfer mechanism, which results in lower current
as the thickness of the oxide layer increases.
The stabilization of the electrochemical response of the oxide film, being attributed to
the growth of a passive layer that, in term of thickness, structure and protective
performance, may be comparable to that forming naturally as steel is embedded in
concrete, was monitored with time. Three days of immersion in a saturated Ca(OH)2
solution turned out to be the minimum time required for a realistic simulation of a
stable passive film.
Chapter 3. Steel passivation in alkaline solutions simulating the concrete environment
81
References
[1] American concrete institute. Committee 222, Corrosion of metal in concrete 81
(1985) 3-32.
[2] J.P. Broomfield, Corrosion of steel in concrete: understanding, investigation and
repair, Architecture price book, London 2007.
[3] M. El-Reedy, Steel reinforced concrete structure, assessment and repair of
corrosion, CRC press 2008.
[4] B. Huet, V. L’Hostis, F. Miserque, H. Idrissi, Electrochemical behavior of mild
steel in concrete: influence of pH and carbonate content of concrete pore
solution, Electrochim. Acta 51 (2005) 172-180.
[5] M. Moreno, W. Morris, M.G. Alvarez, G.S. Duffo, Corrosion of reinforcing steel
in simulated concrete pore solutions, effect of carbonation and chloride content,
Corrosion Science 46 (2004) 2681-2699.
[6] J.T. Hinatsu, W.F Graydon, F.R Foulkes, Voltammetric behavior of iron in
cement. Development of a standard procedure for measuring voltammograms,
J.App. Electrochem. 19 (1988) 868-876.
[7] M. Saremi, E. Mahallati, A study of chloride-induced depassivation of mild steel
in simulated concrete pore solution, Cement and Concrete research 32 (2002)
1915-1921.
[8] S. Alvarez, A. Bautista, F. Velasco, Corrosion behavior of corrugated lean
duplex stainless steels in simulated concrete pore solutions, Corrosion Science
53 (2011) 1784-1755.
[9] H. Yu, K. Chiang, L. Yang, Threshold chloride level and characteristics of
reinforcement corrosion initiation in simulated concrete pore solutions, Constr.
Build. Mat. 26 (2012) 723-729.
[10] L. Veleva, M. Aviles, D. Wipf, Voltammetry and surface analysis of AISI 316
stainless steel in chloride containing simulated concrete pore environment, J.
Electroanal. Chem. 578 (2005) 45-53.
[11] I.V. Sieber, H. Hildebrand, S. Virtanen, P. Schmuki, Investigations on the
passivity of iron in borate and phosphate buffers, pH 8.4, Corrosion Science 48
(2006) 3472-3488.
[12] I. Diez-Perez, F. Sanz, P. Gorostiza, Electronic barriers in the iron oxide film
govern its passivity and redox behavior: Effect of electrode potential and
solution pH, Corrosion Science 8 (2006) 1595-1602.
Chapter 3. Steel passivation in alkaline solutions simulating the concrete environment
82
[13] P. Meisterjahn, J.W. Schultze, B. Siemensmeyer, U. Stimming, M.H. Dean,
Electron transfer reactions on passive iron electrodes, Chemical Physics, 141,
Issue 1 (1990) 131-141.
[14] D. Geana, A. El Miligy, W. Lorenz, Electrochemical behavior of iron in alkaline
sulphate solutions, J. Appl. Electrochem. 4 (1974) 337-345.
[15] R. Schrebler Guzman, J. Vilche, A. Arvia, The potentiodynamic behavior of iron
in alkaline solutions, Electrochim. Acta 24 (1978) 395-403.
[16] O. Albani, J. Zerbino, J. Vilche, J. Arvia, A comparative electrochemical and
ellipsometric study of iron electrodes in different alkaline electrolytes,
Electrochim. Acta 31 n°11 (1986) 1403-1411.
[17] R. Schrebler Guzman, J. Vilche, A. Arvia, The voltammetric detection of
intermediate electrochemical processes related to iron in alkaline aqueous
solutions, J. Appl. Electrochem. 11 (1981) 551-562.
[18] L. Ojefors, SEM studies of discharge products from alkaline iron electrodes, J.
Electrochem. Soc. 123 N° 11 (1976) 1691-1695.
[19] G. Kalaignan, V. Muralidharan, K. Vasu, Triangular potential sweep
voltammetric study of porous iron electrodes in alkali solutions, J. Appl.
Electrochem. 17 (1987) 1083-1092.
[20] M. Sanchez - Moreno, H. Takenouti, J.J. Garcia-Jareno, F. Vicente, C. Alonso,
A theoretical approach of impedance spectroscopy during the passivation of
steel in alkaline media, Electrochim. Acta 54 (2009) 7222-7226.
[21] L. Freire, X.R. Novoa, M.F. Montemor, M. Carmezim, Study of passive film
formed on mild steel in alkaline media by the application of anodic potentials,
Mat.Chem.Phys. 114 (2009) 962-972.
[22] C.M. Shepherd, S. Schuldiner, Potentiostatic Current‐Potential Measurements
on Iron and Platinum Electrodes in High‐Purity Closed Alkaline Systems J.
Electrochem. Soc. 1968 115(11): 1124-1130.
[23] A. Poursaee, C.Hansson, Reinforcing steel passivation in mortar and pore
solution, Cement and Concrete Research 37 (2007) 1127-1133.
[24] G.F. Vander Voort, Metallography, Principles and Practice, ASM International,
1984.
[25] P. Simon, M. Economopoulos, P. Nilles, Tempcore, an economical process for
the production of high quality rebars; MPT, No. 3 (1984) 80-93.
[26] J.F. NovilleTEMPCORE®, the most convenient process to produce low cost high strength rebars from 8 to 75 mm, ESTAD 2015, Dusseldorf.
Chapter 3. Steel passivation in alkaline solutions simulating the concrete environment
83
[27] C. Andrade, C. Alonso, Corrosion rate monitoring in the laboratory and on site,
Const. Build. Mat. 10 No5 (1996) 315-328.
[28] S. Volosova, Z. Iofa, T. Stepina, Russ, Effect of direction of grain on magnetic
properties of silicon sheet steel, J. Electrochem. 13 (1977) 393-396.
[29] M. Sanchez, J. Gregori, M. Alonso, J. Garcia-Jareno, F. Vicente, Anodic growth
of passive layer on steel rebars in alkaline medium simulating the concrete
pores, Electrochim. Acta, 52 (2006) 47-53.
[30] A.J Calandra, N.R. De Tacconi, A.J. Arvia, Ageing and dissolution processes
affecting the electroreduction of monomolecular oxide films formed on platinum
electrodes in molten sodium bisulphate-potassium bisulphate melts, J.
Electroanal. Chem. 49 (1974) 145-148.
[31] C.M. Ferro, A.J Calandra, A.J. Arvia, The formation and dissolution of an
electrochemical oxide film of up to a monolayer thickness on gold, J.
Electroanal. Chem. 50 (1974) 403-407.
[32] S. Joiret, M. Keddam, X.R. Novoa, M.C. Perez, C.M. Rangel, H. Takenouti, Use
of EIS, ring disk electrode, EQCM and Raman spectroscopy to study the film of
oxides formed on iron in 1M NaOH, Cem. Concr. Comp. 24 (2002) 7-15.
[33] M. Sanchez, J. Gregori, M. Alonso, J. Garcia-Jareno, H. Takenouti, F. Vicente,
Electrochemical impedance spectroscopy for studying passive layer on steel
rebars immersed in alkaline solution simulating concrete pores, Electrochim.
Acta, 52 (2007) 7634-7641.
[34] C. Andrade, M. Keddam, X.R. Novoa, M.C. Perez, C.M. Rangel, H. Takenouti,
Electrochemical behavior of steel rebars in concrete: influence of environmental
factors and cement chemistry, Electrochim. Acta, 46 (2001) 3905-3912.
[35] U. Retter, A. Widman, K. Siegler, H. Kahlert, On the impedance of potassium
nickel(II) hexacyanoferrate(II) composite electrodes - the generalization of the
Randles model referring to inhomogeneous electrode materials, J. Electroanal.
Chem. 546 (2003) 87-96.
[36] G. Glass, C. Page, N. Short, J. Zhang, The analysis of potentiostatic transients
applied to the corrosion of steel in concrete, Corr. Sci. N°9 39 (1997) 1657-663.
[37] C. Andrade, P. Merino, X. Novoa, M. Perez, L. Soler, Passivation of reinforcing
steel in concrete, Mater.Sci. Forum 891 (1995) 192-194.

Chapter 3. Steel passivation in alkaline solutions simulating the concrete environment
84
Chapter 4. Reinforcing bars corrosion in solutions simulating bacteria metabolites
85
Chapter 4:
Reinforcing bars corrosion in solutions
simulating bacteria metabolites
Microbial induced deterioration of reinforced concrete structures is generally
attributed to bacteria involved into the sulfur cycle, that is Sulfate Reducing Bacteria
and Sulfur Oxidizing Bacteria. The aim of the present work is to investigate the
effects of solutions simulating their metabolic products on the corrosion of steel
reinforcing bars. A simplified system was initially studied, consisting in metallic
samples passivated in an alkaline medium and subsequently immersed in solutions
containing Na2S and H2SO4 aiming to simulate the bacteria metabolites. Afterwards,
carbonated reinforced mortar samples were produced and tested in similar solutions
aiming to mimic a system more closer to the reality. Corrosion monitoring was
performed through several electrochemical measurements such as corrosion
potential monitoring, linear polarization resistance, electrochemical impedance
spectroscopy and anodic polarizations.
Part of this chapter has been published in: E. Volpi, M. Stefanoni, A. Olietti, S.P. Trasatti, Mild steel passivation and
depassivation in simulated concrete pore solution containing bacteria metabolites, Solid State Phenomena Vol. 227 (2015) 203.
Chapter 4. Reinforcing bars corrosion in solutions simulating bacteria metabolites
86
4.1 Introduction
Reinforced concrete deterioration due to corrosion of steel bars is recognized
as a serious problem, affecting the durability of several type of civil structures. Many
efforts have been dedicated to study the depassivation induced by chloride
penetration[1-3], being by far the most frequent cause of the steel corrosion in
reinforced concrete structures exposed to marine environment or in contact with
deicing salts. Much less attentions have been focused on the microbial degradation
of reinforced concrete structures although being a serious issue strongly affecting the
service life of sewer pipes, waste water treatment plants, animal housing and manure
storage structures. As already detailed in Chapter 2, section 2.3, the microbial
deterioration of reinforced concrete structures is commonly attributed to bacteria
involved in the sulfur cycle, in particular Sulfate Reducing Bacteria (SRB) and Sulfur
Oxidizing Bacteria (SOB), being respectively H2S and H2SO4 their metabolic
products [4,5].
Clear evidences of the detrimental effects of the SOB activity on the cementitious
matrix were thoroughly demonstrated by De Belie et al. [6 - 9], while how the bacteria
metabolites affect the behaviour of the steel reinforcing bars (rebars) seems to be a
neglected issue; just a few papers mentioned it [10,11], and to the author knowledge
no detailed studies were performed on such topic.
For this reason, the aim of the present study is to simulate the metabolic products of
SRB and SOB using respectively solutions of Na2S and H2SO4 and to investigate
how they interact with mild steel used for reinforced concrete structures.
The preparation of representative reinforced mortar samples is very complex and
time consuming, which does not allow multivariable study. For this reason, the initial
use of simulated concrete pore solution turns out to be the most convenient option.
Once understood the deterioration mechanism in such simplified systems, the
investigation was extended to steel bars embedded in carbonated mortar.
H2S induced steel corrosion, has been thoroughly investigated [12-16] as an
extremely dangerous deterioration source in steel pipes for the oil and gas industry.
In such case, it is very often associated with CO2 or in acidic environments. Much
less literature seems to be available on sulfide induced corrosion of mild steel
occurring at alkaline pH; early in the 80's Shoesmith et al. [17,18] and Salvarezza et
al.[19,20] published some researches on the growth/precipitation mechanisms of iron
sulphides and the resulting onset of localized corrosion. However the above cited
literature was only performed at extremely alkaline pH such as 12-14, while no
information were found about lower pH such as those of carbonated concrete.
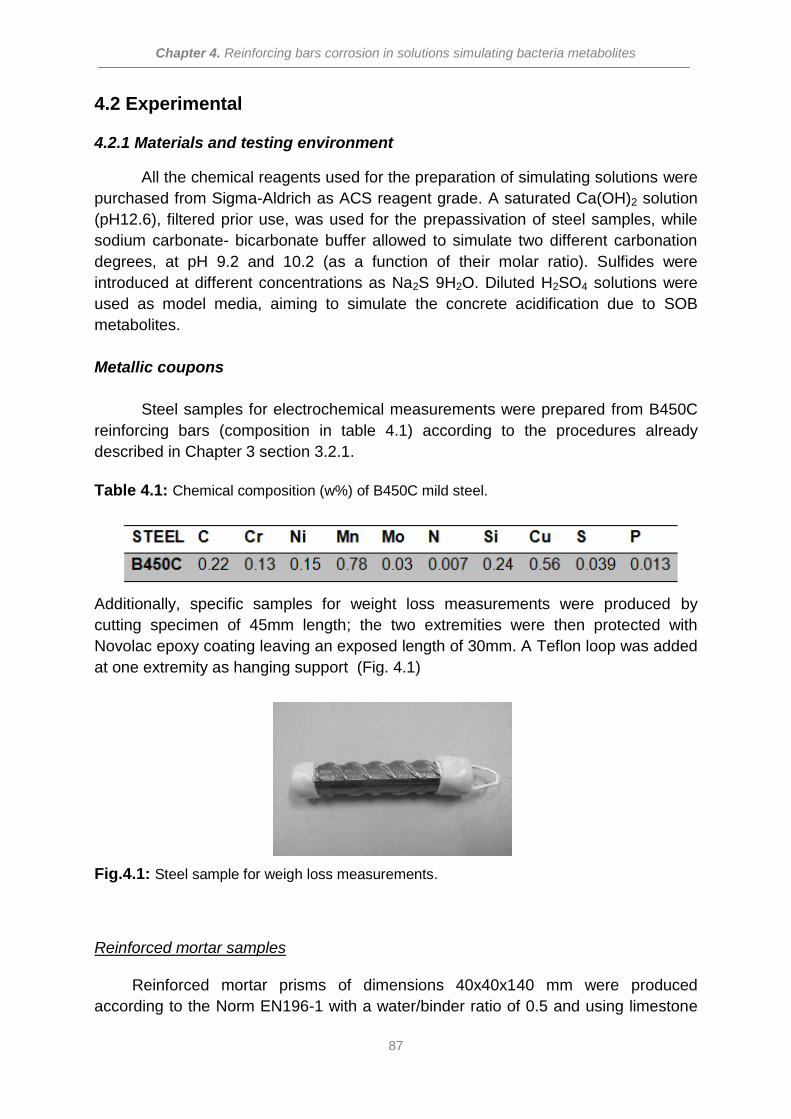
Chapter 4. Reinforcing bars corrosion in solutions simulating bacteria metabolites
87
4.2 Experimental
4.2.1 Materials and testing environment
All the chemical reagents used for the preparation of simulating solutions were
purchased from Sigma-Aldrich as ACS reagent grade. A saturated Ca(OH)2 solution
(pH12.6), filtered prior use, was used for the prepassivation of steel samples, while
sodium carbonate- bicarbonate buffer allowed to simulate two different carbonation
degrees, at pH 9.2 and 10.2 (as a function of their molar ratio). Sulfides were
introduced at different concentrations as Na2S 9H2O. Diluted H2SO4 solutions were
used as model media, aiming to simulate the concrete acidification due to SOB
metabolites.
Metallic coupons
Steel samples for electrochemical measurements were prepared from B450C
reinforcing bars (composition in table 4.1) according to the procedures already
described in Chapter 3 section 3.2.1.
Table 4.1: Chemical composition (w%) of B450C mild steel.
Additionally, specific samples for weight loss measurements were produced by
cutting specimen of 45mm length; the two extremities were then protected with
Novolac epoxy coating leaving an exposed length of 30mm. A Teflon loop was added
at one extremity as hanging support (Fig. 4.1)
Fig.4.1: Steel sample for weigh loss measurements.
Reinforced mortar samples
Reinforced mortar prisms of dimensions 40x40x140 mm were produced
according to the Norm EN196-1 with a water/binder ratio of 0.5 and using limestone
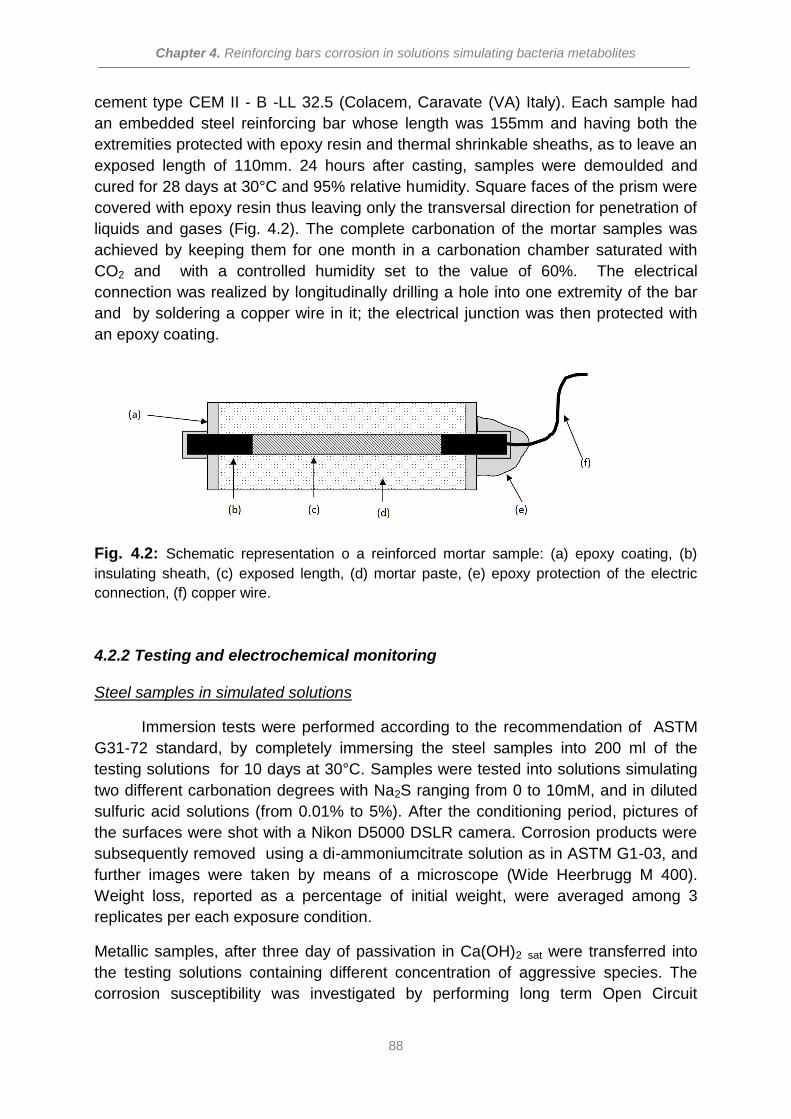
Chapter 4. Reinforcing bars corrosion in solutions simulating bacteria metabolites
88
cement type CEM II - B -LL 32.5 (Colacem, Caravate (VA) Italy). Each sample had
an embedded steel reinforcing bar whose length was 155mm and having both the
extremities protected with epoxy resin and thermal shrinkable sheaths, as to leave an
exposed length of 110mm. 24 hours after casting, samples were demoulded and
cured for 28 days at 30°C and 95% relative humidity. Square faces of the prism were
covered with epoxy resin thus leaving only the transversal direction for penetration of
liquids and gases (Fig. 4.2). The complete carbonation of the mortar samples was
achieved by keeping them for one month in a carbonation chamber saturated with
CO2 and with a controlled humidity set to the value of 60%. The electrical
connection was realized by longitudinally drilling a hole into one extremity of the bar
and by soldering a copper wire in it; the electrical junction was then protected with
an epoxy coating.
Fig. 4.2: Schematic representation o a reinforced mortar sample: (a) epoxy coating, (b)
insulating sheath, (c) exposed length, (d) mortar paste, (e) epoxy protection of the electric
connection, (f) copper wire.
4.2.2 Testing and electrochemical monitoring
Steel samples in simulated solutions
Immersion tests were performed according to the recommendation of ASTM
G31-72 standard, by completely immersing the steel samples into 200 ml of the
testing solutions for 10 days at 30°C. Samples were tested into solutions simulating
two different carbonation degrees with Na2S ranging from 0 to 10mM, and in diluted
sulfuric acid solutions (from 0.01% to 5%). After the conditioning period, pictures of
the surfaces were shot with a Nikon D5000 DSLR camera. Corrosion products were
subsequently removed using a di-ammoniumcitrate solution as in ASTM G1-03, and
further images were taken by means of a microscope (Wide Heerbrugg M 400).
Weight loss, reported as a percentage of initial weight, were averaged among 3
replicates per each exposure condition.
Metallic samples, after three day of passivation in Ca(OH)2 sat were transferred into
the testing solutions containing different concentration of aggressive species. The
corrosion susceptibility was investigated by performing long term Open Circuit
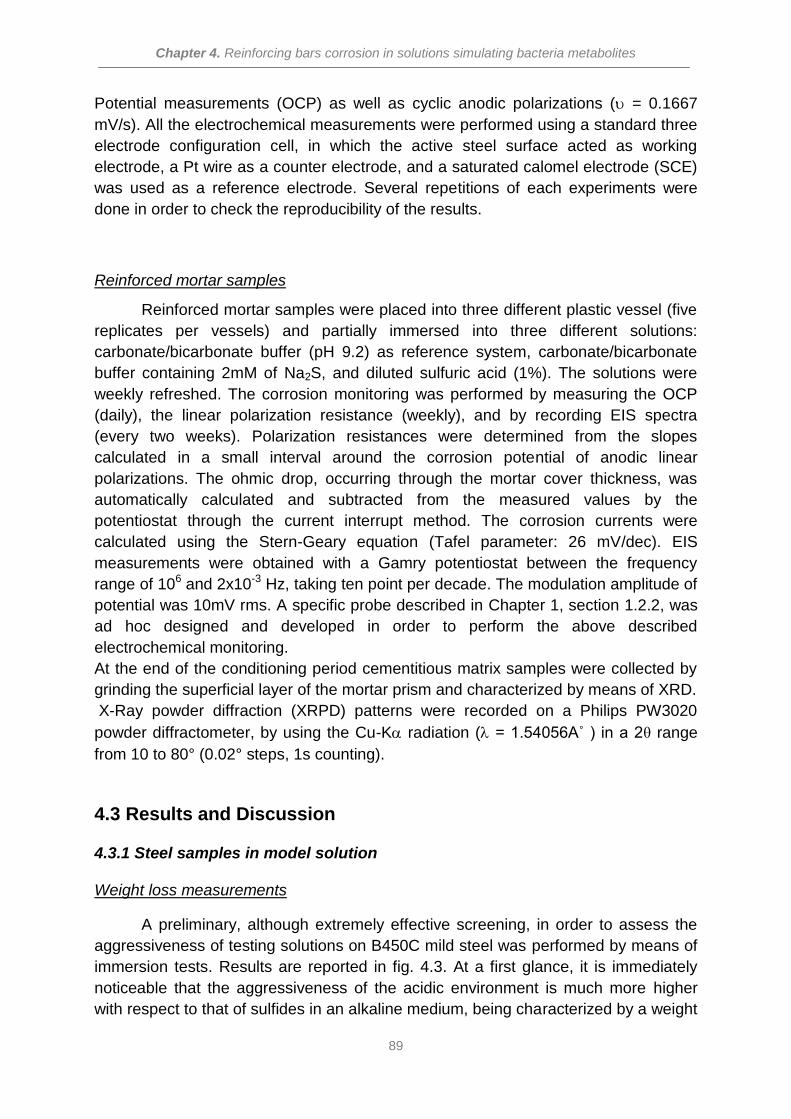
Chapter 4. Reinforcing bars corrosion in solutions simulating bacteria metabolites
89
Potential measurements (OCP) as well as cyclic anodic polarizations ( = 0.1667
mV/s). All the electrochemical measurements were performed using a standard three
electrode configuration cell, in which the active steel surface acted as working
electrode, a Pt wire as a counter electrode, and a saturated calomel electrode (SCE)
was used as a reference electrode. Several repetitions of each experiments were
done in order to check the reproducibility of the results.
Reinforced mortar samples
Reinforced mortar samples were placed into three different plastic vessel (five
replicates per vessels) and partially immersed into three different solutions:
carbonate/bicarbonate buffer (pH 9.2) as reference system, carbonate/bicarbonate
buffer containing 2mM of Na2S, and diluted sulfuric acid (1%). The solutions were
weekly refreshed. The corrosion monitoring was performed by measuring the OCP
(daily), the linear polarization resistance (weekly), and by recording EIS spectra
(every two weeks). Polarization resistances were determined from the slopes
calculated in a small interval around the corrosion potential of anodic linear
polarizations. The ohmic drop, occurring through the mortar cover thickness, was
automatically calculated and subtracted from the measured values by the
potentiostat through the current interrupt method. The corrosion currents were
calculated using the Stern-Geary equation (Tafel parameter: 26 mV/dec). EIS
measurements were obtained with a Gamry potentiostat between the frequency
range of 106 and 2x10⁻³ Hz, taking ten point per decade. The modulation amplitude of
potential was 10mV rms. A specific probe described in Chapter 1, section 1.2.2, was
ad hoc designed and developed in order to perform the above described
electrochemical monitoring.
At the end of the conditioning period cementitious matrix samples were collected by
grinding the superficial layer of the mortar prism and characterized by means of XRD.
X-Ray powder diffraction (XRPD) patterns were recorded on a Philips PW3020
powder diffractometer, by using the Cu-K radiation ( = 1.54056A˚ ) in a 2θ range
from 10 to 80° (0.02° steps, 1s counting).
4.3 Results and Discussion
4.3.1 Steel samples in model solution
Weight loss measurements
A preliminary, although extremely effective screening, in order to assess the
aggressiveness of testing solutions on B450C mild steel was performed by means of
immersion tests. Results are reported in fig. 4.3. At a first glance, it is immediately
noticeable that the aggressiveness of the acidic environment is much more higher
with respect to that of sulfides in an alkaline medium, being characterized by a weight
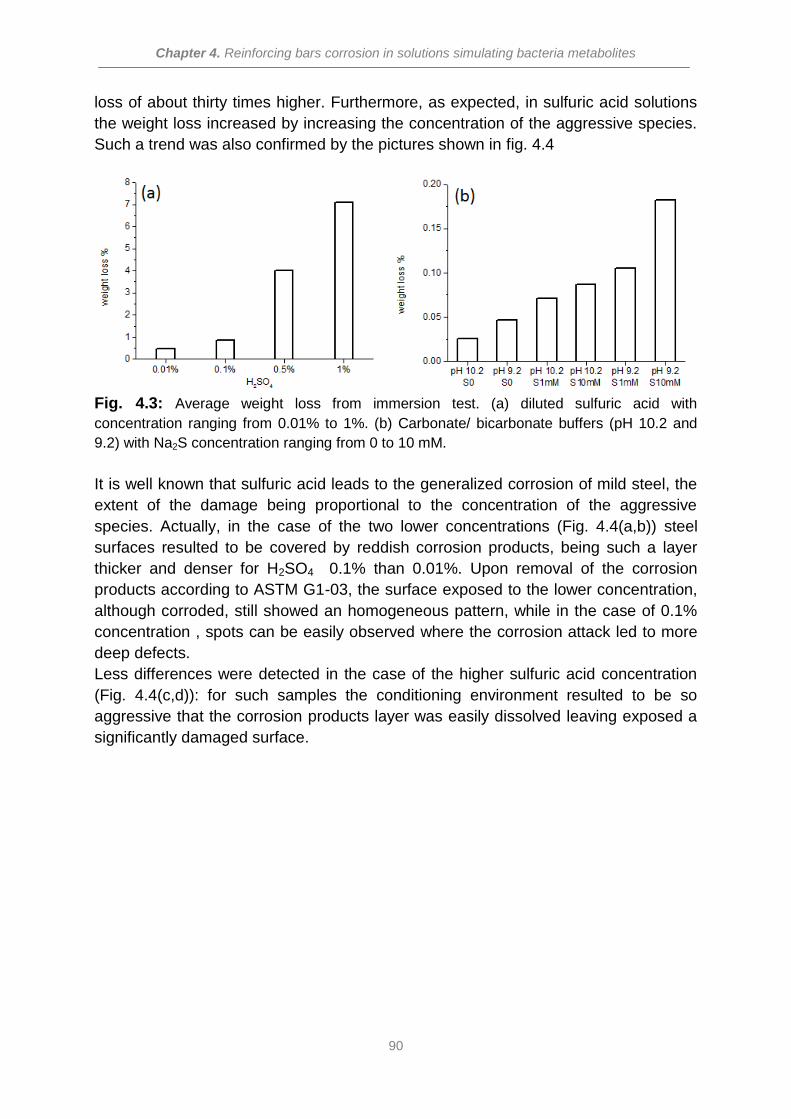
Chapter 4. Reinforcing bars corrosion in solutions simulating bacteria metabolites
90
loss of about thirty times higher. Furthermore, as expected, in sulfuric acid solutions
the weight loss increased by increasing the concentration of the aggressive species.
Such a trend was also confirmed by the pictures shown in fig. 4.4
Fig. 4.3: Average weight loss from immersion test. (a) diluted sulfuric acid with
concentration ranging from 0.01% to 1%. (b) Carbonate/ bicarbonate buffers (pH 10.2 and
9.2) with Na2S concentration ranging from 0 to 10 mM.
It is well known that sulfuric acid leads to the generalized corrosion of mild steel, the
extent of the damage being proportional to the concentration of the aggressive
species. Actually, in the case of the two lower concentrations (Fig. 4.4(a,b)) steel
surfaces resulted to be covered by reddish corrosion products, being such a layer
thicker and denser for H2SO4 0.1% than 0.01%. Upon removal of the corrosion
products according to ASTM G1-03, the surface exposed to the lower concentration,
although corroded, still showed an homogeneous pattern, while in the case of 0.1%
concentration , spots can be easily observed where the corrosion attack led to more
deep defects.
Less differences were detected in the case of the higher sulfuric acid concentration
(Fig. 4.4(c,d)): for such samples the conditioning environment resulted to be so
aggressive that the corrosion products layer was easily dissolved leaving exposed a
significantly damaged surface.
(a)
(b)
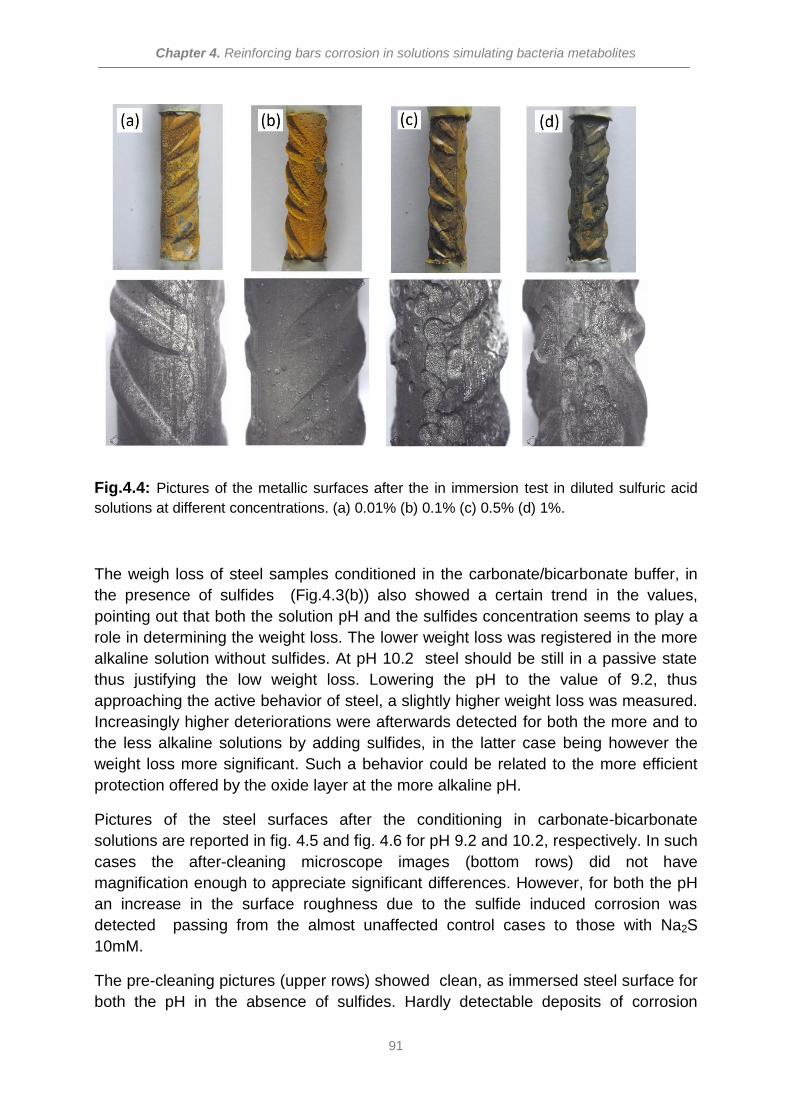
Chapter 4. Reinforcing bars corrosion in solutions simulating bacteria metabolites
91
Fig.4.4: Pictures of the metallic surfaces after the in immersion test in diluted sulfuric acid
solutions at different concentrations. (a) 0.01% (b) 0.1% (c) 0.5% (d) 1%.
The weigh loss of steel samples conditioned in the carbonate/bicarbonate buffer, in
the presence of sulfides (Fig.4.3(b)) also showed a certain trend in the values,
pointing out that both the solution pH and the sulfides concentration seems to play a
role in determining the weight loss. The lower weight loss was registered in the more
alkaline solution without sulfides. At pH 10.2 steel should be still in a passive state
thus justifying the low weight loss. Lowering the pH to the value of 9.2, thus
approaching the active behavior of steel, a slightly higher weight loss was measured.
Increasingly higher deteriorations were afterwards detected for both the more and to
the less alkaline solutions by adding sulfides, in the latter case being however the
weight loss more significant. Such a behavior could be related to the more efficient
protection offered by the oxide layer at the more alkaline pH.
Pictures of the steel surfaces after the conditioning in carbonate-bicarbonate
solutions are reported in fig. 4.5 and fig. 4.6 for pH 9.2 and 10.2, respectively. In such
cases the after-cleaning microscope images (bottom rows) did not have
magnification enough to appreciate significant differences. However, for both the pH
an increase in the surface roughness due to the sulfide induced corrosion was
detected passing from the almost unaffected control cases to those with Na2S
10mM.
The pre-cleaning pictures (upper rows) showed clean, as immersed steel surface for
both the pH in the absence of sulfides. Hardly detectable deposits of corrosion
Chapter 4. Reinforcing bars corrosion in solutions simulating bacteria metabolites
92
products were obtained with 1mM sulfide solution at pH 10.2, while the same
concentration in the less alkaline pH led to a clearly visible thin layer of yellowish
corrosion products. Finally, by increasing ten times the sulfides concentrations a
black deposits was observed on the steel surfaces for both the pH.
In the case of the more alkaline pH (fig.4.5(c)) the black deposit was thin and blister-
like, while a thicker, with powdery consistency layer, was obtained in the case of the
less alkaline pH.
Fig. 4.5: Pictures of the metallic surfaces after the in immersion test in the carbonate
bicarbonate buffer solution (pH 10.2) with different sulfides concentrations. (a) no sulfides
(b) 1mM (c) 10mM.
The above presented results pointed out that sulfides are potentially aggressive
species for mild steel, even in an alkaline environment, being the damage extent
directly correlated with the solution pH, that is: a more alkaline environment, leading
to a more stable a superficial oxide layer, results in reduced interactions between
steel and sulfides. On the contrary, a less alkaline pH of the environment leads to an
increased damage, clearly indicated by higher weight loss and visual observations.
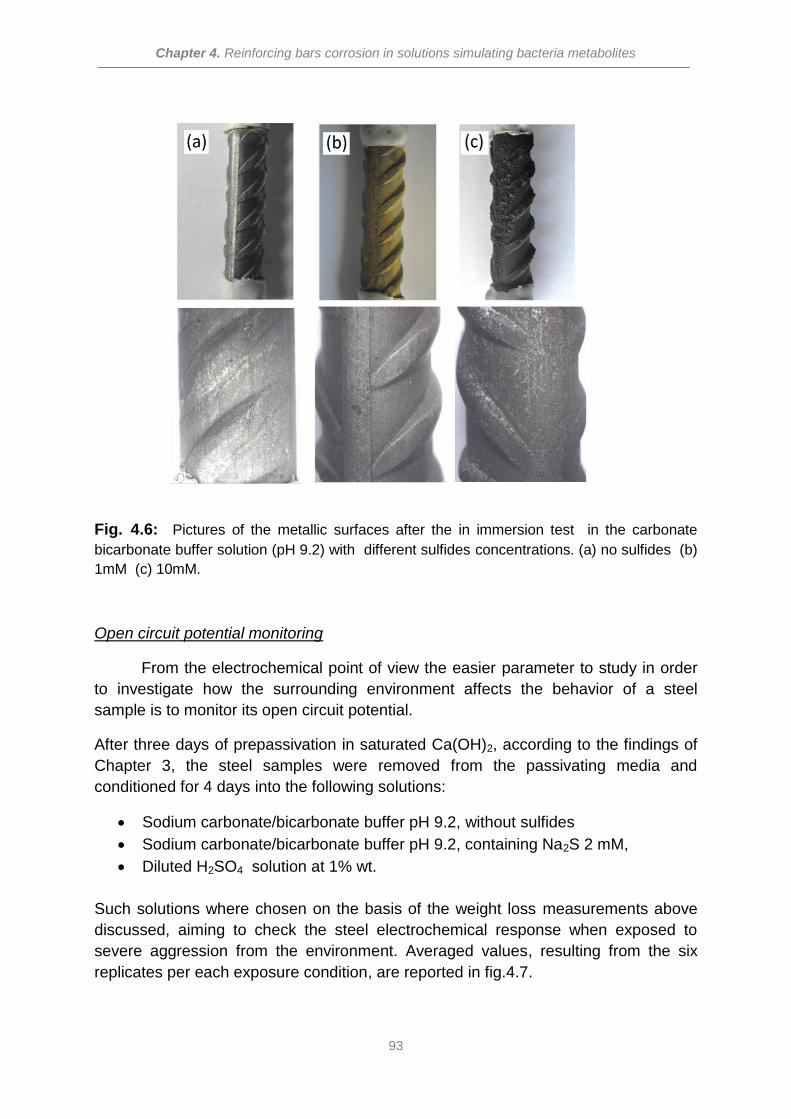
Chapter 4. Reinforcing bars corrosion in solutions simulating bacteria metabolites
93
Fig. 4.6: Pictures of the metallic surfaces after the in immersion test in the carbonate
bicarbonate buffer solution (pH 9.2) with different sulfides concentrations. (a) no sulfides (b)
1mM (c) 10mM.
Open circuit potential monitoring
From the electrochemical point of view the easier parameter to study in order
to investigate how the surrounding environment affects the behavior of a steel
sample is to monitor its open circuit potential.
After three days of prepassivation in saturated Ca(OH)2, according to the findings of
Chapter 3, the steel samples were removed from the passivating media and
conditioned for 4 days into the following solutions:
Sodium carbonate/bicarbonate buffer pH 9.2, without sulfides
Sodium carbonate/bicarbonate buffer pH 9.2, containing Na2S 2 mM,
Diluted H2SO4 solution at 1% wt.
Such solutions where chosen on the basis of the weight loss measurements above
discussed, aiming to check the steel electrochemical response when exposed to
severe aggression from the environment. Averaged values, resulting from the six
replicates per each exposure condition, are reported in fig.4.7.
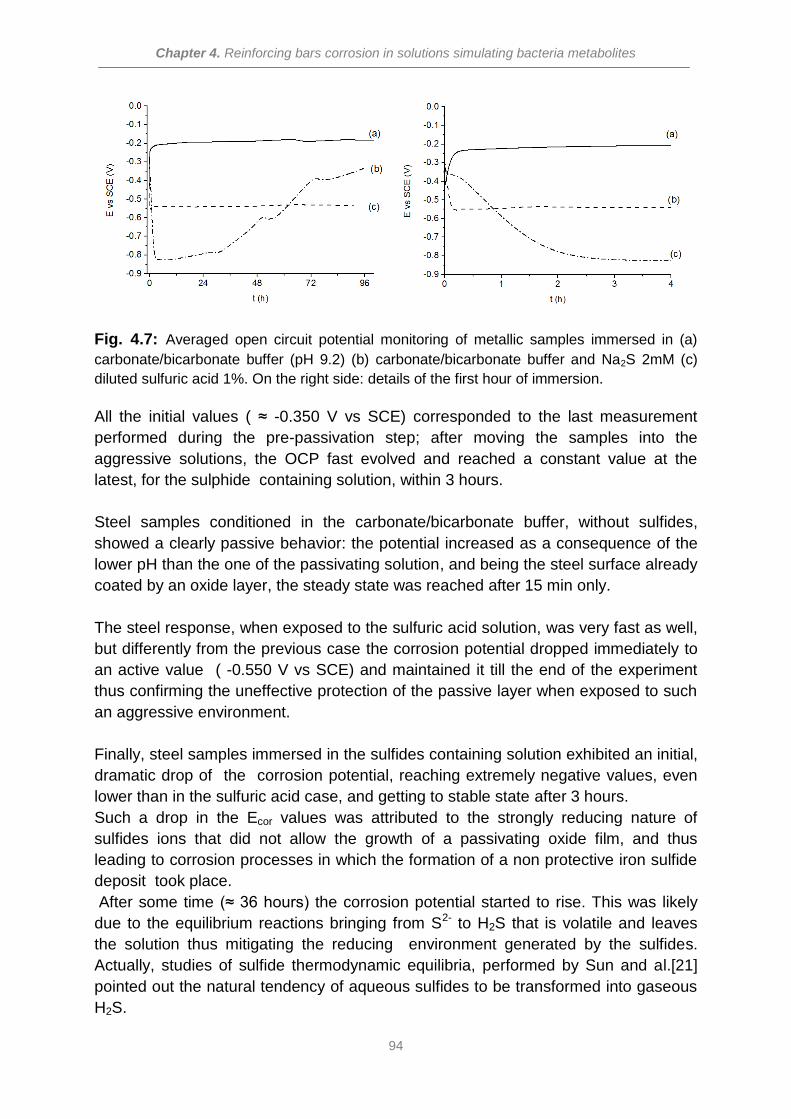
Chapter 4. Reinforcing bars corrosion in solutions simulating bacteria metabolites
94
Fig. 4.7: Averaged open circuit potential monitoring of metallic samples immersed in (a)
carbonate/bicarbonate buffer (pH 9.2) (b) carbonate/bicarbonate buffer and Na2S 2mM (c)
diluted sulfuric acid 1%. On the right side: details of the first hour of immersion.
All the initial values ( ≈ -0.350 V vs SCE) corresponded to the last measurement
performed during the pre-passivation step; after moving the samples into the
aggressive solutions, the OCP fast evolved and reached a constant value at the
latest, for the sulphide containing solution, within 3 hours.
Steel samples conditioned in the carbonate/bicarbonate buffer, without sulfides,
showed a clearly passive behavior: the potential increased as a consequence of the
lower pH than the one of the passivating solution, and being the steel surface already
coated by an oxide layer, the steady state was reached after 15 min only.
The steel response, when exposed to the sulfuric acid solution, was very fast as well,
but differently from the previous case the corrosion potential dropped immediately to
an active value ( -0.550 V vs SCE) and maintained it till the end of the experiment
thus confirming the uneffective protection of the passive layer when exposed to such
an aggressive environment.
Finally, steel samples immersed in the sulfides containing solution exhibited an initial,
dramatic drop of the corrosion potential, reaching extremely negative values, even
lower than in the sulfuric acid case, and getting to stable state after 3 hours.
Such a drop in the Ecor values was attributed to the strongly reducing nature of
sulfides ions that did not allow the growth of a passivating oxide film, and thus
leading to corrosion processes in which the formation of a non protective iron sulfide
deposit took place.
After some time (≈ 36 hours) the corrosion potential started to rise. This was likely
due to the equilibrium reactions bringing from S2- to H2S that is volatile and leaves
the solution thus mitigating the reducing environment generated by the sulfides.
Actually, studies of sulfide thermodynamic equilibria, performed by Sun and al.[21]
pointed out the natural tendency of aqueous sulfides to be transformed into gaseous
H2S.
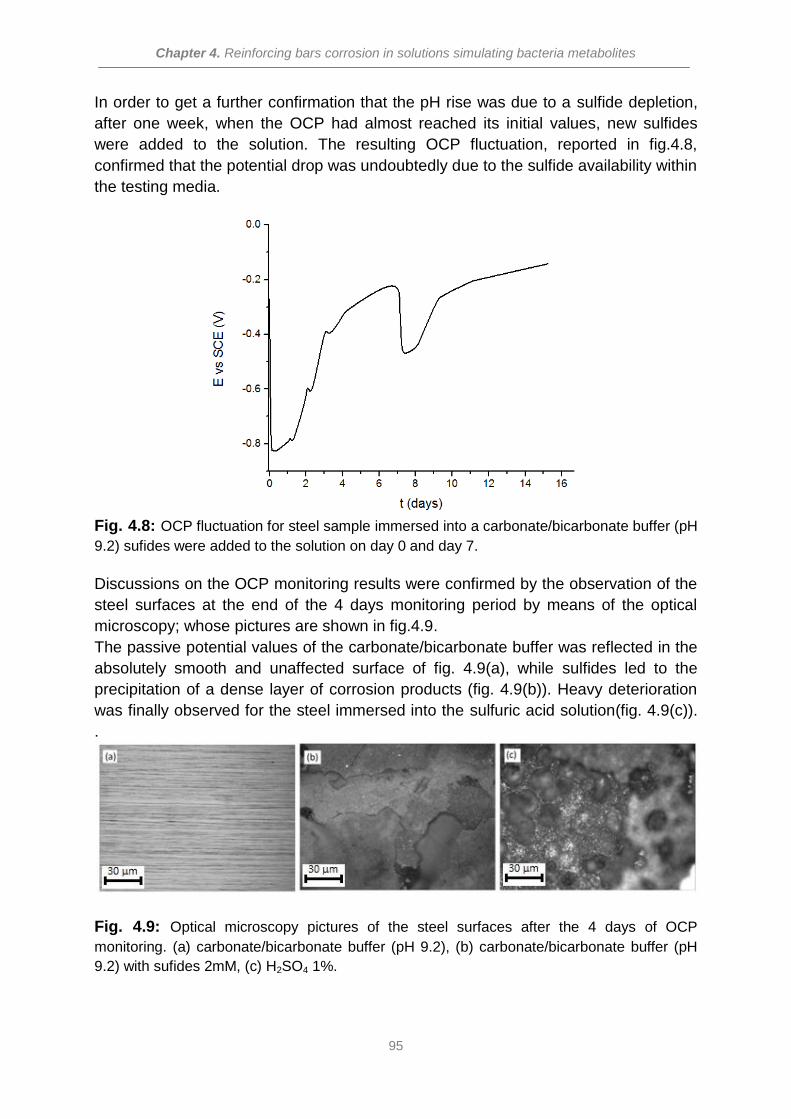
Chapter 4. Reinforcing bars corrosion in solutions simulating bacteria metabolites
95
In order to get a further confirmation that the pH rise was due to a sulfide depletion,
after one week, when the OCP had almost reached its initial values, new sulfides
were added to the solution. The resulting OCP fluctuation, reported in fig.4.8,
confirmed that the potential drop was undoubtedly due to the sulfide availability within
the testing media.
Fig. 4.8: OCP fluctuation for steel sample immersed into a carbonate/bicarbonate buffer (pH
9.2) sufides were added to the solution on day 0 and day 7.
Discussions on the OCP monitoring results were confirmed by the observation of the
steel surfaces at the end of the 4 days monitoring period by means of the optical
microscopy; whose pictures are shown in fig.4.9.
The passive potential values of the carbonate/bicarbonate buffer was reflected in the
absolutely smooth and unaffected surface of fig. 4.9(a), while sulfides led to the
precipitation of a dense layer of corrosion products (fig. 4.9(b)). Heavy deterioration
was finally observed for the steel immersed into the sulfuric acid solution(fig. 4.9(c)).
.
Fig. 4.9: Optical microscopy pictures of the steel surfaces after the 4 days of OCP
monitoring. (a) carbonate/bicarbonate buffer (pH 9.2), (b) carbonate/bicarbonate buffer (pH
9.2) with sufides 2mM, (c) H2SO4 1%.
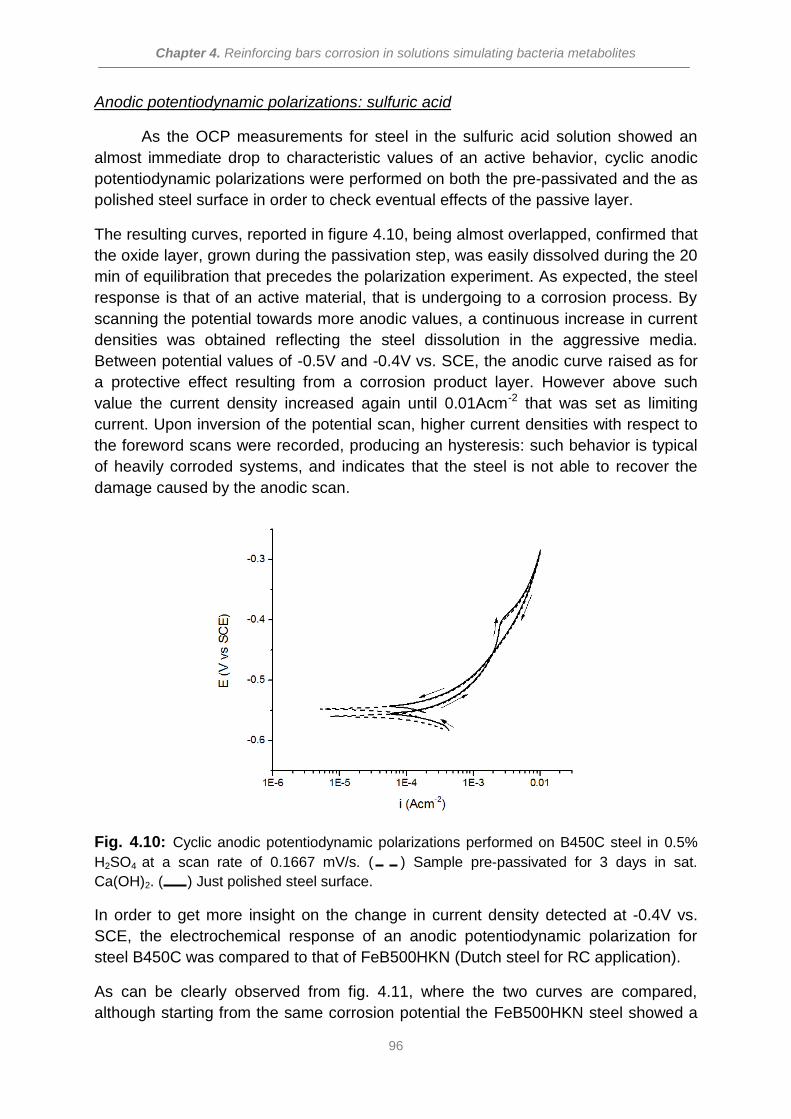
Chapter 4. Reinforcing bars corrosion in solutions simulating bacteria metabolites
96
Anodic potentiodynamic polarizations: sulfuric acid
As the OCP measurements for steel in the sulfuric acid solution showed an
almost immediate drop to characteristic values of an active behavior, cyclic anodic
potentiodynamic polarizations were performed on both the pre-passivated and the as
polished steel surface in order to check eventual effects of the passive layer.
The resulting curves, reported in figure 4.10, being almost overlapped, confirmed that
the oxide layer, grown during the passivation step, was easily dissolved during the 20
min of equilibration that precedes the polarization experiment. As expected, the steel
response is that of an active material, that is undergoing to a corrosion process. By
scanning the potential towards more anodic values, a continuous increase in current
densities was obtained reflecting the steel dissolution in the aggressive media.
Between potential values of -0.5V and -0.4V vs. SCE, the anodic curve raised as for
a protective effect resulting from a corrosion product layer. However above such
value the current density increased again until 0.01Acm-2 that was set as limiting
current. Upon inversion of the potential scan, higher current densities with respect to
the foreword scans were recorded, producing an hysteresis: such behavior is typical
of heavily corroded systems, and indicates that the steel is not able to recover the
damage caused by the anodic scan.
Fig. 4.10: Cyclic anodic potentiodynamic polarizations performed on B450C steel in 0.5%
H2SO4 at a scan rate of 0.1667 mV/s. ( ) Sample pre-passivated for 3 days in sat.
Ca(OH)2. ( ) Just polished steel surface.
In order to get more insight on the change in current density detected at -0.4V vs.
SCE, the electrochemical response of an anodic potentiodynamic polarization for
steel B450C was compared to that of FeB500HKN (Dutch steel for RC application).
As can be clearly observed from fig. 4.11, where the two curves are compared,
although starting from the same corrosion potential the FeB500HKN steel showed a
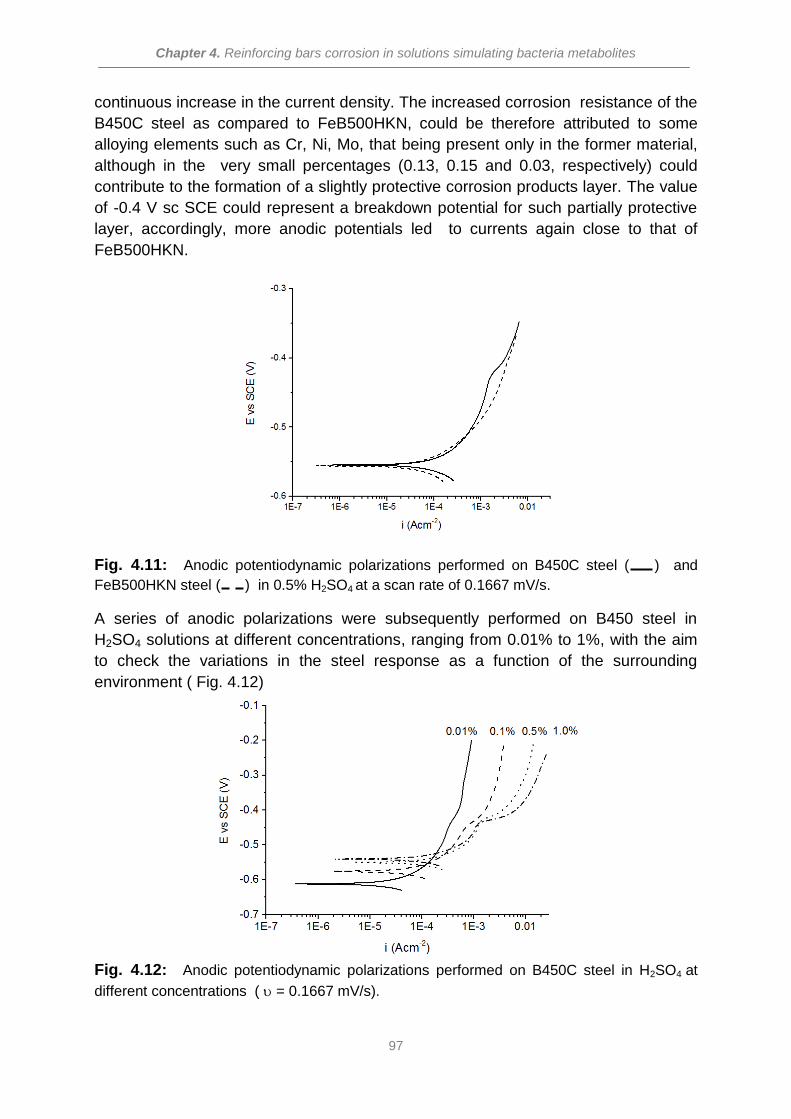
Chapter 4. Reinforcing bars corrosion in solutions simulating bacteria metabolites
97
continuous increase in the current density. The increased corrosion resistance of the
B450C steel as compared to FeB500HKN, could be therefore attributed to some
alloying elements such as Cr, Ni, Mo, that being present only in the former material,
although in the very small percentages (0.13, 0.15 and 0.03, respectively) could
contribute to the formation of a slightly protective corrosion products layer. The value
of -0.4 V sc SCE could represent a breakdown potential for such partially protective
layer, accordingly, more anodic potentials led to currents again close to that of
FeB500HKN.
Fig. 4.11: Anodic potentiodynamic polarizations performed on B450C steel ( ) and
FeB500HKN steel ( ) in 0.5% H2SO4 at a scan rate of 0.1667 mV/s.
A series of anodic polarizations were subsequently performed on B450 steel in
H2SO4 solutions at different concentrations, ranging from 0.01% to 1%, with the aim
to check the variations in the steel response as a function of the surrounding
environment ( Fig. 4.12)
Fig. 4.12: Anodic potentiodynamic polarizations performed on B450C steel in H2SO4 at
different concentrations ( = 0.1667 mV/s).
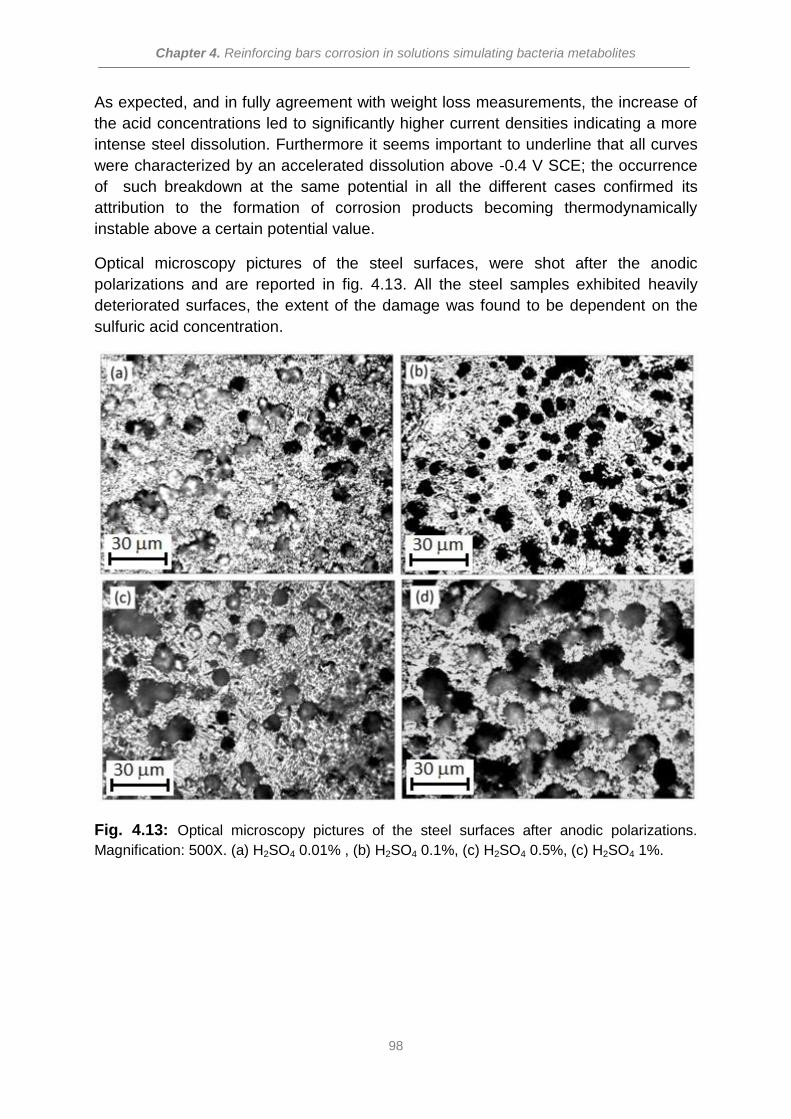
Chapter 4. Reinforcing bars corrosion in solutions simulating bacteria metabolites
98
As expected, and in fully agreement with weight loss measurements, the increase of
the acid concentrations led to significantly higher current densities indicating a more
intense steel dissolution. Furthermore it seems important to underline that all curves
were characterized by an accelerated dissolution above -0.4 V SCE; the occurrence
of such breakdown at the same potential in all the different cases confirmed its
attribution to the formation of corrosion products becoming thermodynamically
instable above a certain potential value.
Optical microscopy pictures of the steel surfaces, were shot after the anodic
polarizations and are reported in fig. 4.13. All the steel samples exhibited heavily
deteriorated surfaces, the extent of the damage was found to be dependent on the
sulfuric acid concentration.
Fig. 4.13: Optical microscopy pictures of the steel surfaces after anodic polarizations.
Magnification: 500X. (a) H2SO4 0.01% , (b) H2SO4 0.1%, (c) H2SO4 0.5%, (c) H2SO4 1%.
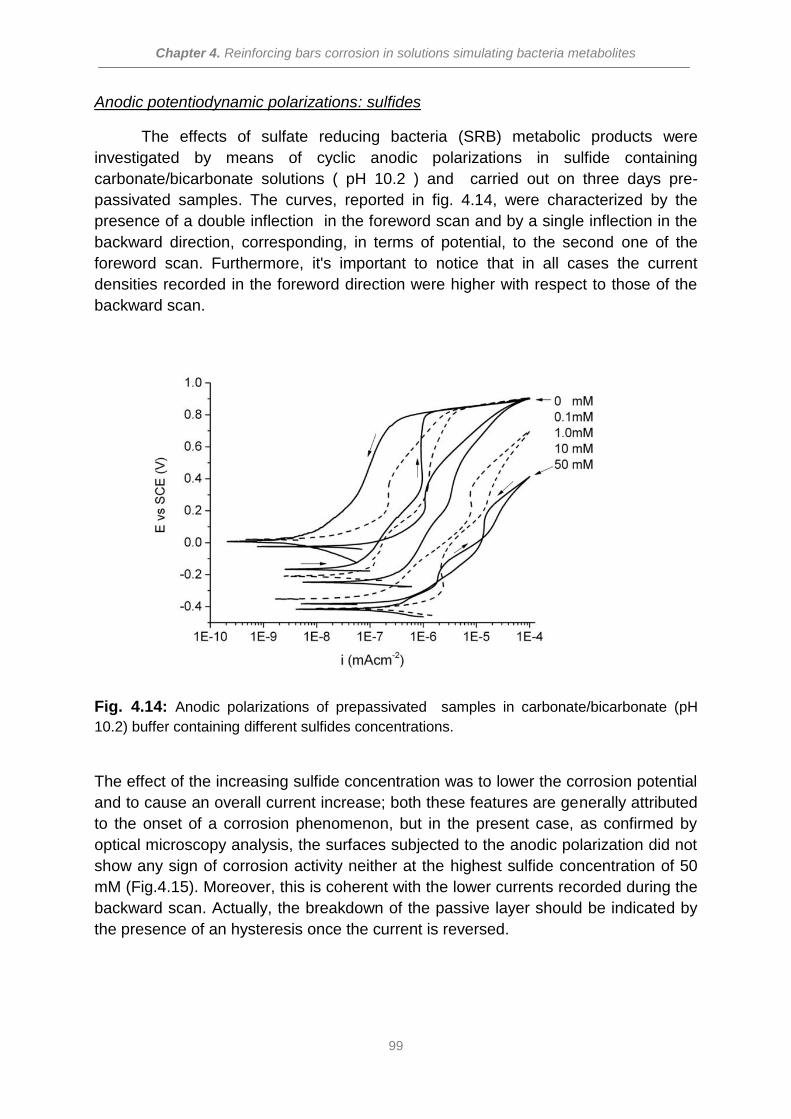
Chapter 4. Reinforcing bars corrosion in solutions simulating bacteria metabolites
99
Anodic potentiodynamic polarizations: sulfides
The effects of sulfate reducing bacteria (SRB) metabolic products were
investigated by means of cyclic anodic polarizations in sulfide containing
carbonate/bicarbonate solutions ( pH 10.2 ) and carried out on three days pre-
passivated samples. The curves, reported in fig. 4.14, were characterized by the
presence of a double inflection in the foreword scan and by a single inflection in the
backward direction, corresponding, in terms of potential, to the second one of the
foreword scan. Furthermore, it's important to notice that in all cases the current
densities recorded in the foreword direction were higher with respect to those of the
backward scan.
Fig. 4.14: Anodic polarizations of prepassivated samples in carbonate/bicarbonate (pH
10.2) buffer containing different sulfides concentrations.
The effect of the increasing sulfide concentration was to lower the corrosion potential
and to cause an overall current increase; both these features are generally attributed
to the onset of a corrosion phenomenon, but in the present case, as confirmed by
optical microscopy analysis, the surfaces subjected to the anodic polarization did not
show any sign of corrosion activity neither at the highest sulfide concentration of 50
mM (Fig.4.15). Moreover, this is coherent with the lower currents recorded during the
backward scan. Actually, the breakdown of the passive layer should be indicated by
the presence of an hysteresis once the current is reversed.
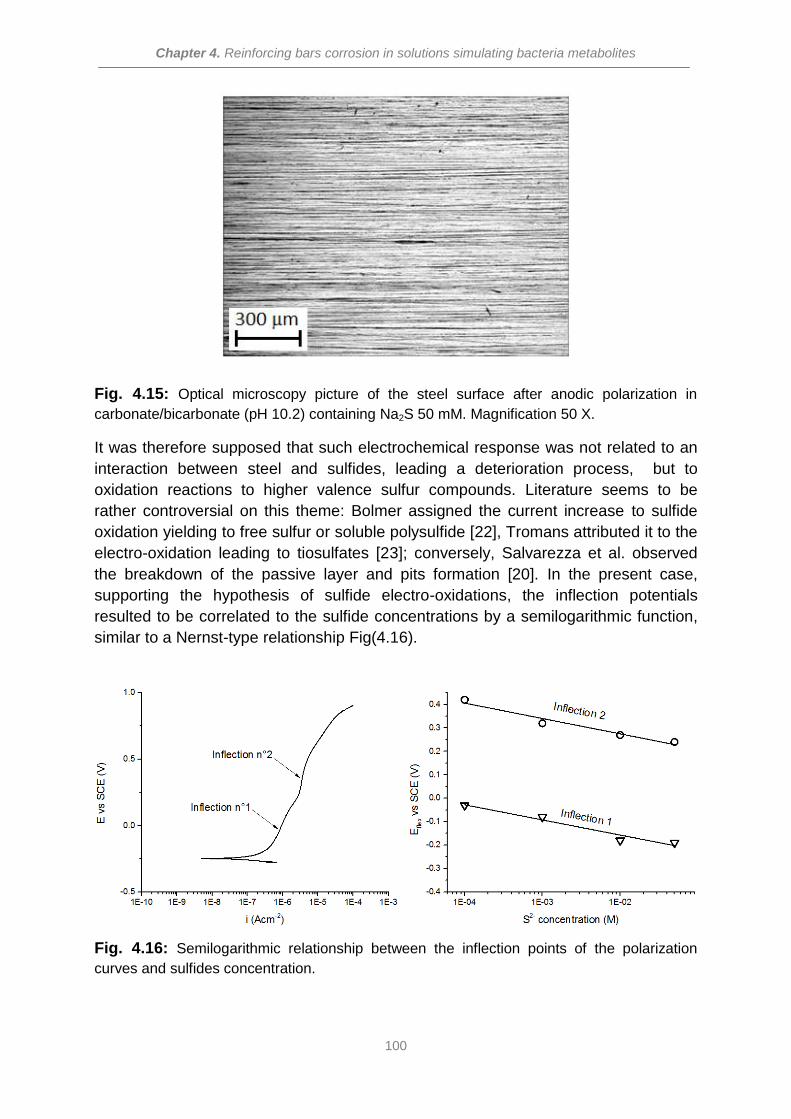
Chapter 4. Reinforcing bars corrosion in solutions simulating bacteria metabolites
100
Fig. 4.15: Optical microscopy picture of the steel surface after anodic polarization in
carbonate/bicarbonate (pH 10.2) containing Na2S 50 mM. Magnification 50 X.
It was therefore supposed that such electrochemical response was not related to an
interaction between steel and sulfides, leading a deterioration process, but to
oxidation reactions to higher valence sulfur compounds. Literature seems to be
rather controversial on this theme: Bolmer assigned the current increase to sulfide
oxidation yielding to free sulfur or soluble polysulfide [22], Tromans attributed it to the
electro-oxidation leading to tiosulfates [23]; conversely, Salvarezza et al. observed
the breakdown of the passive layer and pits formation [20]. In the present case,
supporting the hypothesis of sulfide electro-oxidations, the inflection potentials
resulted to be correlated to the sulfide concentrations by a semilogarithmic function,
similar to a Nernst-type relationship Fig(4.16).
Fig. 4.16: Semilogarithmic relationship between the inflection points of the polarization
curves and sulfides concentration.
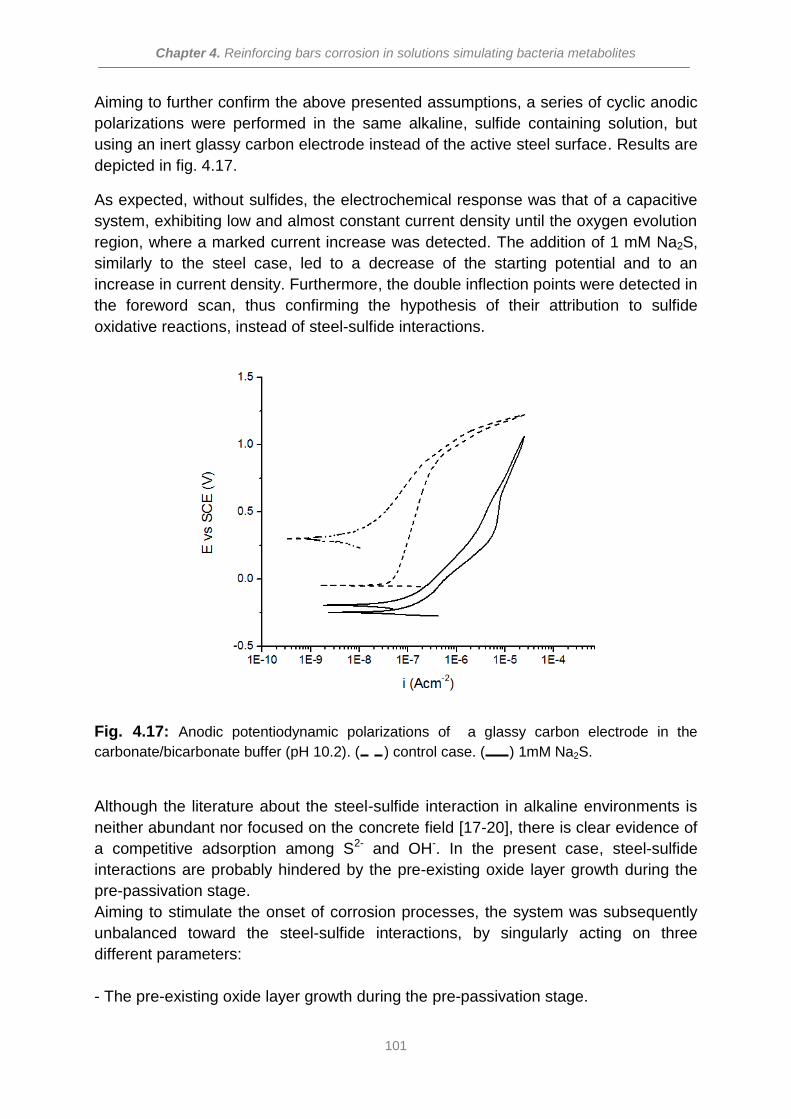
Chapter 4. Reinforcing bars corrosion in solutions simulating bacteria metabolites
101
Aiming to further confirm the above presented assumptions, a series of cyclic anodic
polarizations were performed in the same alkaline, sulfide containing solution, but
using an inert glassy carbon electrode instead of the active steel surface. Results are
depicted in fig. 4.17.
As expected, without sulfides, the electrochemical response was that of a capacitive
system, exhibiting low and almost constant current density until the oxygen evolution
region, where a marked current increase was detected. The addition of 1 mM Na2S,
similarly to the steel case, led to a decrease of the starting potential and to an
increase in current density. Furthermore, the double inflection points were detected in
the foreword scan, thus confirming the hypothesis of their attribution to sulfide
oxidative reactions, instead of steel-sulfide interactions.
Fig. 4.17: Anodic potentiodynamic polarizations of a glassy carbon electrode in the
carbonate/bicarbonate buffer (pH 10.2). ( ) control case. ( ) 1mM Na2S.
Although the literature about the steel-sulfide interaction in alkaline environments is
neither abundant nor focused on the concrete field [17-20], there is clear evidence of
a competitive adsorption among S2- and OH-. In the present case, steel-sulfide
interactions are probably hindered by the pre-existing oxide layer growth during the
pre-passivation stage.
Aiming to stimulate the onset of corrosion processes, the system was subsequently
unbalanced toward the steel-sulfide interactions, by singularly acting on three
different parameters:
- The pre-existing oxide layer growth during the pre-passivation stage.
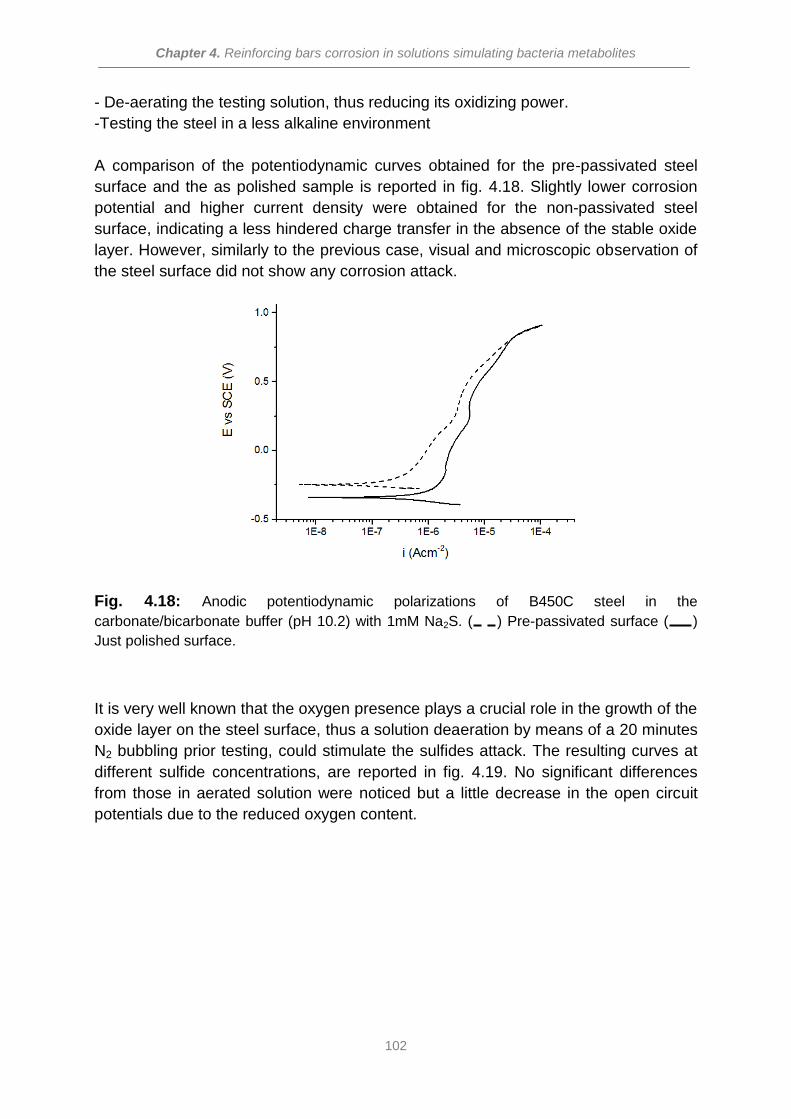
Chapter 4. Reinforcing bars corrosion in solutions simulating bacteria metabolites
102
- De-aerating the testing solution, thus reducing its oxidizing power.
-Testing the steel in a less alkaline environment
A comparison of the potentiodynamic curves obtained for the pre-passivated steel
surface and the as polished sample is reported in fig. 4.18. Slightly lower corrosion
potential and higher current density were obtained for the non-passivated steel
surface, indicating a less hindered charge transfer in the absence of the stable oxide
layer. However, similarly to the previous case, visual and microscopic observation of
the steel surface did not show any corrosion attack.
Fig. 4.18: Anodic potentiodynamic polarizations of B450C steel in the
carbonate/bicarbonate buffer (pH 10.2) with 1mM Na2S. ( ) Pre-passivated surface ( )
Just polished surface.
It is very well known that the oxygen presence plays a crucial role in the growth of the
oxide layer on the steel surface, thus a solution deaeration by means of a 20 minutes
N2 bubbling prior testing, could stimulate the sulfides attack. The resulting curves at
different sulfide concentrations, are reported in fig. 4.19. No significant differences
from those in aerated solution were noticed but a little decrease in the open circuit
potentials due to the reduced oxygen content.
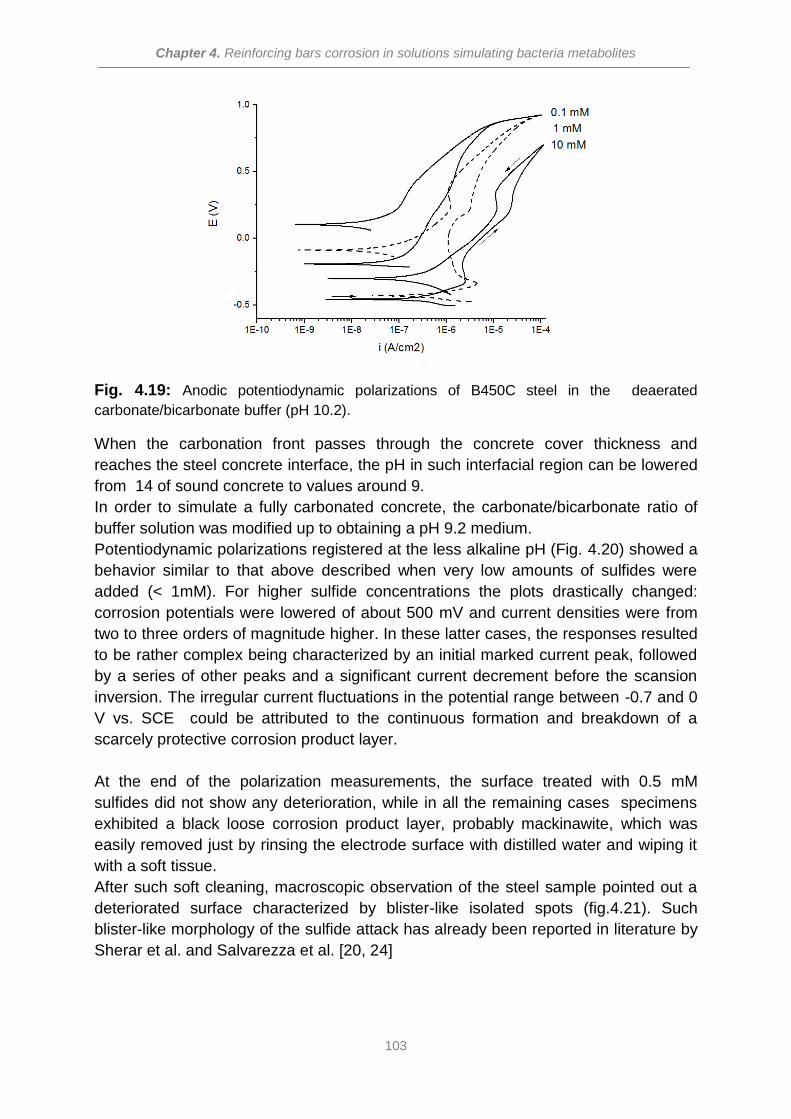
Chapter 4. Reinforcing bars corrosion in solutions simulating bacteria metabolites
103
Fig. 4.19: Anodic potentiodynamic polarizations of B450C steel in the deaerated
carbonate/bicarbonate buffer (pH 10.2).
When the carbonation front passes through the concrete cover thickness and
reaches the steel concrete interface, the pH in such interfacial region can be lowered
from 14 of sound concrete to values around 9.
In order to simulate a fully carbonated concrete, the carbonate/bicarbonate ratio of
buffer solution was modified up to obtaining a pH 9.2 medium.
Potentiodynamic polarizations registered at the less alkaline pH (Fig. 4.20) showed a
behavior similar to that above described when very low amounts of sulfides were
added (< 1mM). For higher sulfide concentrations the plots drastically changed:
corrosion potentials were lowered of about 500 mV and current densities were from
two to three orders of magnitude higher. In these latter cases, the responses resulted
to be rather complex being characterized by an initial marked current peak, followed
by a series of other peaks and a significant current decrement before the scansion
inversion. The irregular current fluctuations in the potential range between -0.7 and 0
V vs. SCE could be attributed to the continuous formation and breakdown of a
scarcely protective corrosion product layer.
At the end of the polarization measurements, the surface treated with 0.5 mM
sulfides did not show any deterioration, while in all the remaining cases specimens
exhibited a black loose corrosion product layer, probably mackinawite, which was
easily removed just by rinsing the electrode surface with distilled water and wiping it
with a soft tissue.
After such soft cleaning, macroscopic observation of the steel sample pointed out a
deteriorated surface characterized by blister-like isolated spots (fig.4.21). Such
blister-like morphology of the sulfide attack has already been reported in literature by
Sherar et al. and Salvarezza et al. [20, 24]
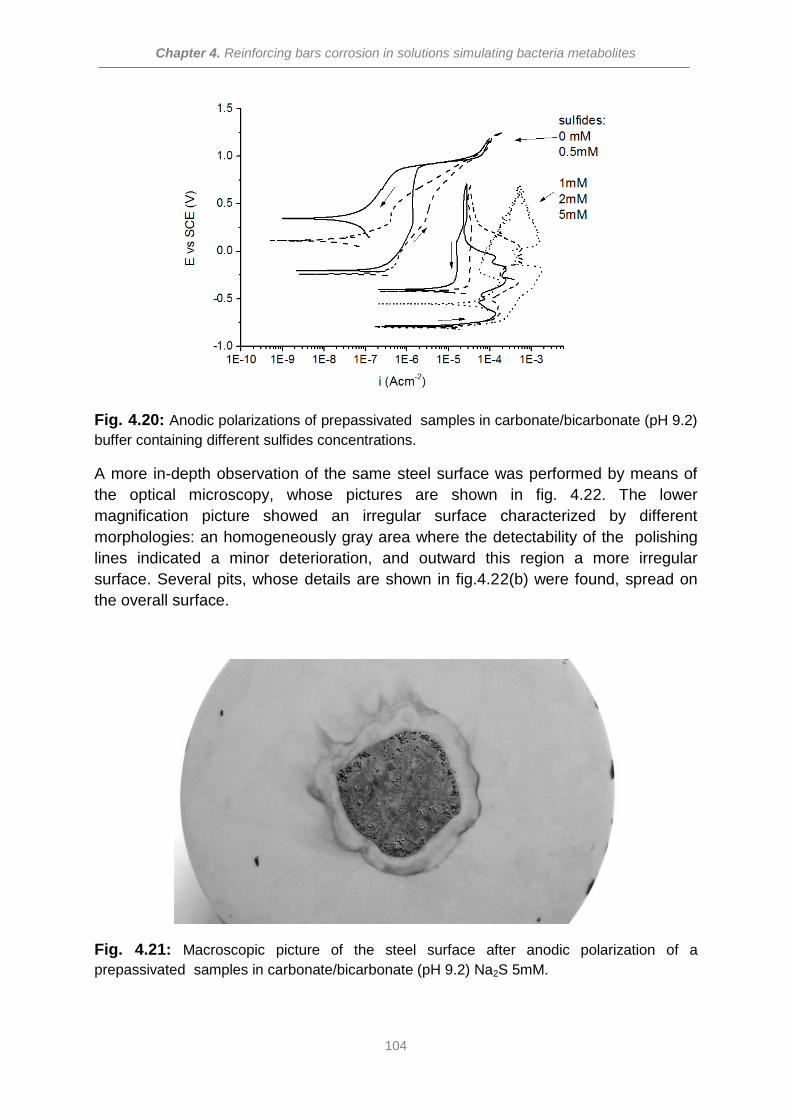
Chapter 4. Reinforcing bars corrosion in solutions simulating bacteria metabolites
104
Fig. 4.20: Anodic polarizations of prepassivated samples in carbonate/bicarbonate (pH 9.2)
buffer containing different sulfides concentrations.
A more in-depth observation of the same steel surface was performed by means of
the optical microscopy, whose pictures are shown in fig. 4.22. The lower
magnification picture showed an irregular surface characterized by different
morphologies: an homogeneously gray area where the detectability of the polishing
lines indicated a minor deterioration, and outward this region a more irregular
surface. Several pits, whose details are shown in fig.4.22(b) were found, spread on
the overall surface.
Fig. 4.21: Macroscopic picture of the steel surface after anodic polarization of a
prepassivated samples in carbonate/bicarbonate (pH 9.2) Na2S 5mM.
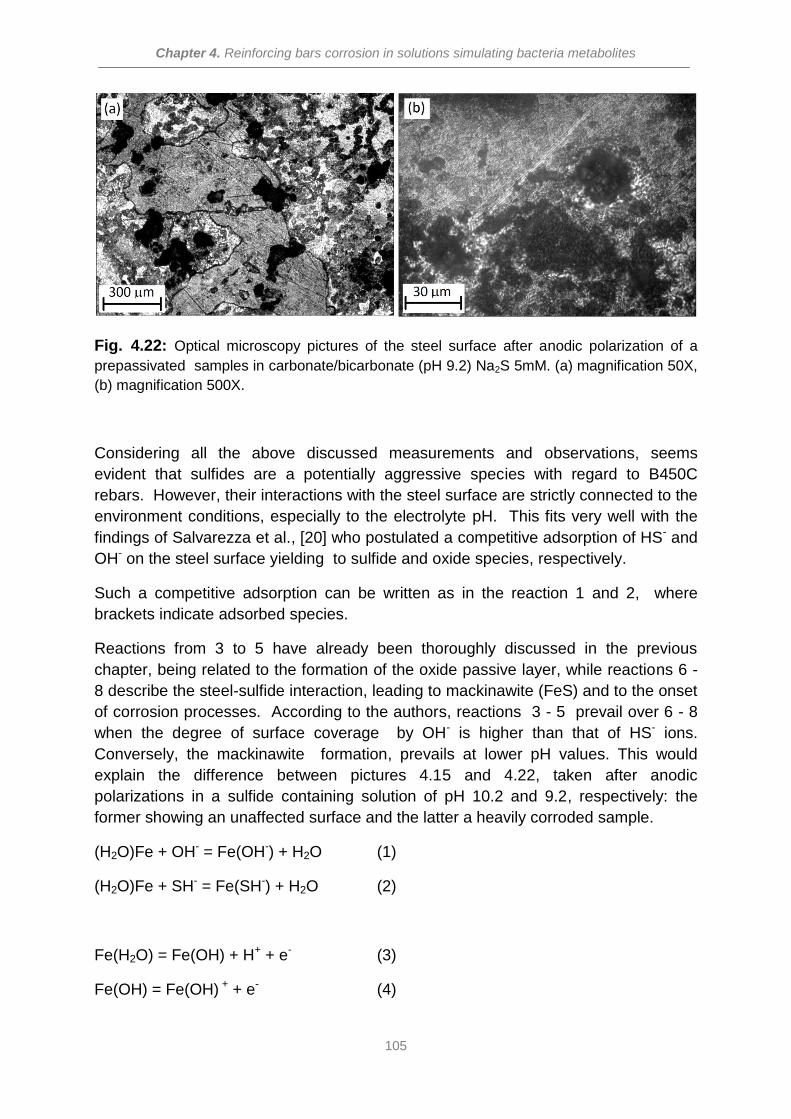
Chapter 4. Reinforcing bars corrosion in solutions simulating bacteria metabolites
105
Fig. 4.22: Optical microscopy pictures of the steel surface after anodic polarization of a
prepassivated samples in carbonate/bicarbonate (pH 9.2) Na2S 5mM. (a) magnification 50X,
(b) magnification 500X.
Considering all the above discussed measurements and observations, seems
evident that sulfides are a potentially aggressive species with regard to B450C
rebars. However, their interactions with the steel surface are strictly connected to the
environment conditions, especially to the electrolyte pH. This fits very well with the
findings of Salvarezza et al., [20] who postulated a competitive adsorption of HS- and
OH- on the steel surface yielding to sulfide and oxide species, respectively.
Such a competitive adsorption can be written as in the reaction 1 and 2, where
brackets indicate adsorbed species.
Reactions from 3 to 5 have already been thoroughly discussed in the previous
chapter, being related to the formation of the oxide passive layer, while reactions 6 -
8 describe the steel-sulfide interaction, leading to mackinawite (FeS) and to the onset
of corrosion processes. According to the authors, reactions 3 - 5 prevail over 6 - 8
when the degree of surface coverage by OH- is higher than that of HS- ions.
Conversely, the mackinawite formation, prevails at lower pH values. This would
explain the difference between pictures 4.15 and 4.22, taken after anodic
polarizations in a sulfide containing solution of pH 10.2 and 9.2, respectively: the
former showing an unaffected surface and the latter a heavily corroded sample.
(H2O)Fe + OH- = Fe(OH-) + H2O (1)
(H2O)Fe + SH- = Fe(SH-) + H2O (2)
Fe(H2O) = Fe(OH) + H+ + e- (3)
Fe(OH) = Fe(OH) + + e- (4)
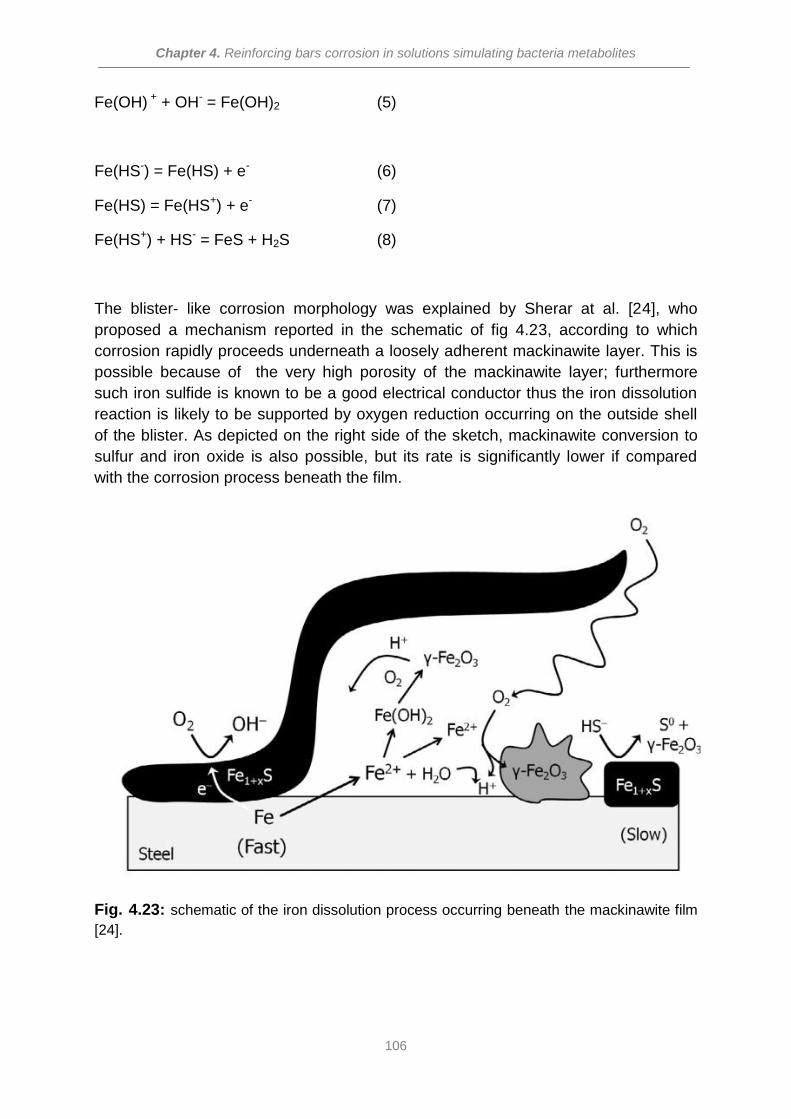
Chapter 4. Reinforcing bars corrosion in solutions simulating bacteria metabolites
106
Fe(OH) + + OH- = Fe(OH)2 (5)
Fe(HS-) = Fe(HS) + e- (6)
Fe(HS) = Fe(HS+) + e- (7)
Fe(HS+) + HS- = FeS + H2S (8)
The blister- like corrosion morphology was explained by Sherar at al. [24], who
proposed a mechanism reported in the schematic of fig 4.23, according to which
corrosion rapidly proceeds underneath a loosely adherent mackinawite layer. This is
possible because of the very high porosity of the mackinawite layer; furthermore
such iron sulfide is known to be a good electrical conductor thus the iron dissolution
reaction is likely to be supported by oxygen reduction occurring on the outside shell
of the blister. As depicted on the right side of the sketch, mackinawite conversion to
sulfur and iron oxide is also possible, but its rate is significantly lower if compared
with the corrosion process beneath the film.
Fig. 4.23: schematic of the iron dissolution process occurring beneath the mackinawite film
[24].
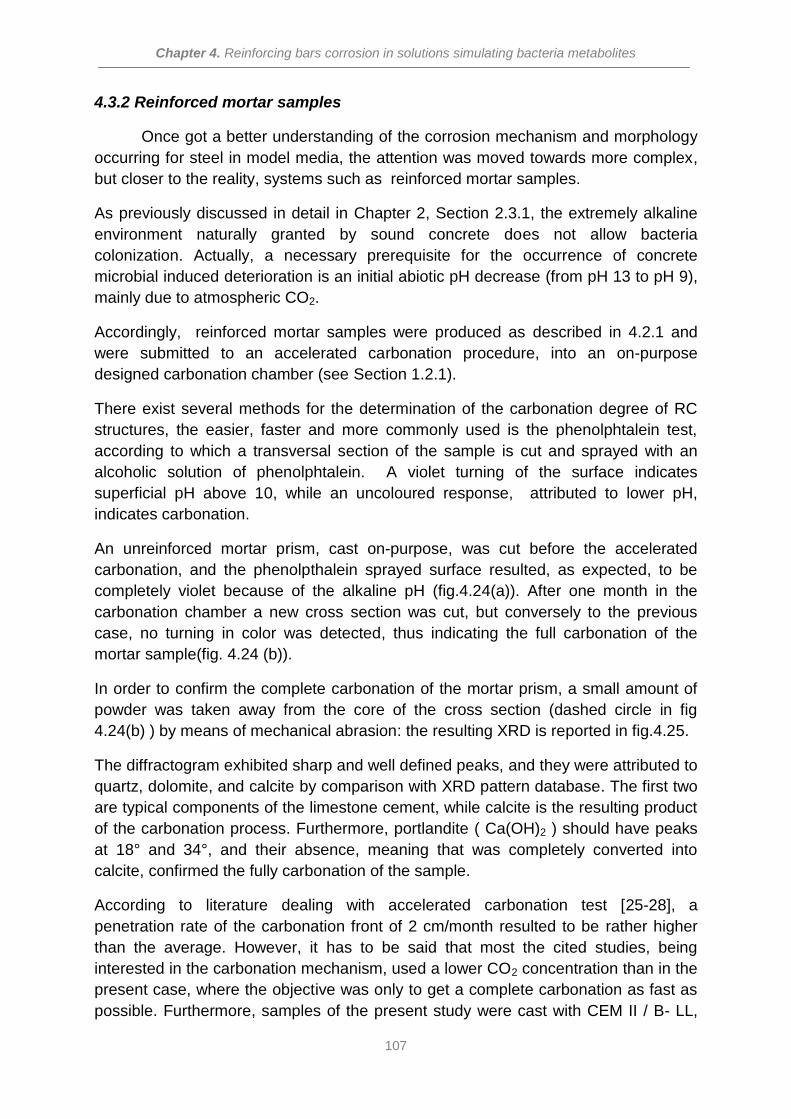
Chapter 4. Reinforcing bars corrosion in solutions simulating bacteria metabolites
107
4.3.2 Reinforced mortar samples
Once got a better understanding of the corrosion mechanism and morphology
occurring for steel in model media, the attention was moved towards more complex,
but closer to the reality, systems such as reinforced mortar samples.
As previously discussed in detail in Chapter 2, Section 2.3.1, the extremely alkaline
environment naturally granted by sound concrete does not allow bacteria
colonization. Actually, a necessary prerequisite for the occurrence of concrete
microbial induced deterioration is an initial abiotic pH decrease (from pH 13 to pH 9),
mainly due to atmospheric CO2.
Accordingly, reinforced mortar samples were produced as described in 4.2.1 and
were submitted to an accelerated carbonation procedure, into an on-purpose
designed carbonation chamber (see Section 1.2.1).
There exist several methods for the determination of the carbonation degree of RC
structures, the easier, faster and more commonly used is the phenolphtalein test,
according to which a transversal section of the sample is cut and sprayed with an
alcoholic solution of phenolphtalein. A violet turning of the surface indicates
superficial pH above 10, while an uncoloured response, attributed to lower pH,
indicates carbonation.
An unreinforced mortar prism, cast on-purpose, was cut before the accelerated
carbonation, and the phenolpthalein sprayed surface resulted, as expected, to be
completely violet because of the alkaline pH (fig.4.24(a)). After one month in the
carbonation chamber a new cross section was cut, but conversely to the previous
case, no turning in color was detected, thus indicating the full carbonation of the
mortar sample(fig. 4.24 (b)).
In order to confirm the complete carbonation of the mortar prism, a small amount of
powder was taken away from the core of the cross section (dashed circle in fig
4.24(b) ) by means of mechanical abrasion: the resulting XRD is reported in fig.4.25.
The diffractogram exhibited sharp and well defined peaks, and they were attributed to
quartz, dolomite, and calcite by comparison with XRD pattern database. The first two
are typical components of the limestone cement, while calcite is the resulting product
of the carbonation process. Furthermore, portlandite ( Ca(OH)2 ) should have peaks
at 18° and 34°, and their absence, meaning that was completely converted into
calcite, confirmed the fully carbonation of the sample.
According to literature dealing with accelerated carbonation test [25-28], a
penetration rate of the carbonation front of 2 cm/month resulted to be rather higher
than the average. However, it has to be said that most the cited studies, being
interested in the carbonation mechanism, used a lower CO2 concentration than in the
present case, where the objective was only to get a complete carbonation as fast as
possible. Furthermore, samples of the present study were cast with CEM II / B- LL,
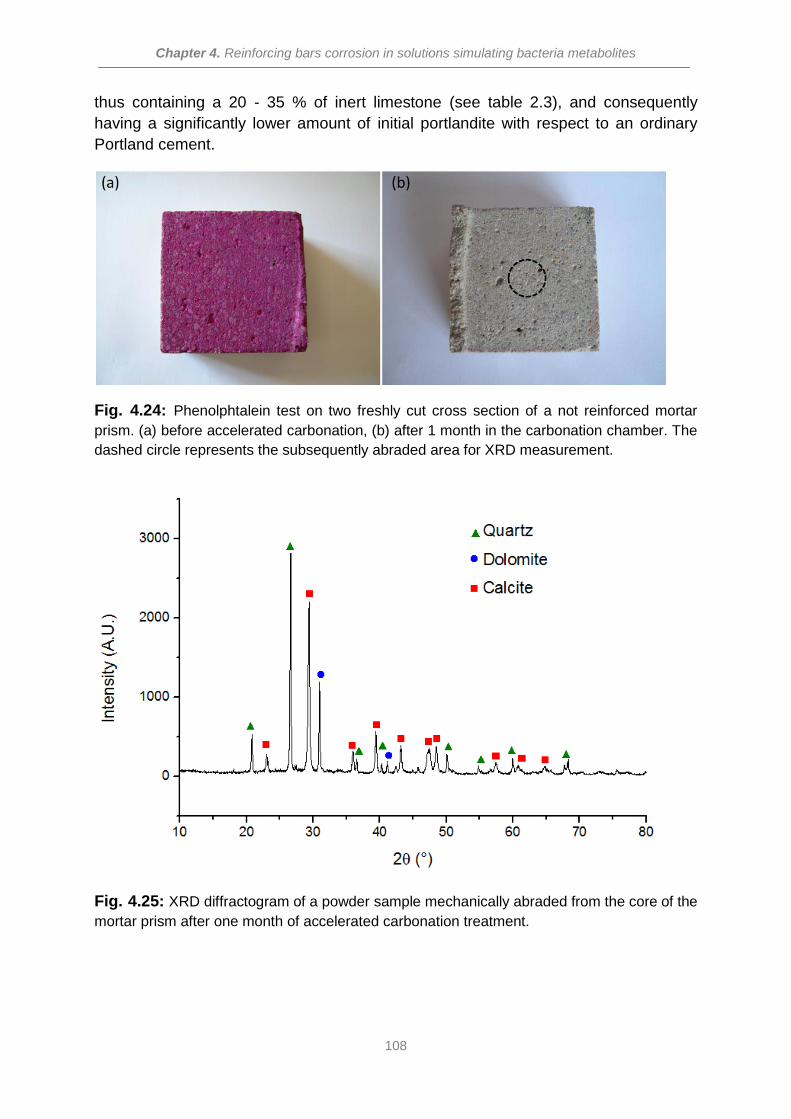
Chapter 4. Reinforcing bars corrosion in solutions simulating bacteria metabolites
108
thus containing a 20 - 35 % of inert limestone (see table 2.3), and consequently
having a significantly lower amount of initial portlandite with respect to an ordinary
Portland cement.
Fig. 4.24: Phenolphtalein test on two freshly cut cross section of a not reinforced mortar
prism. (a) before accelerated carbonation, (b) after 1 month in the carbonation chamber. The
dashed circle represents the subsequently abraded area for XRD measurement.
Fig. 4.25: XRD diffractogram of a powder sample mechanically abraded from the core of the
mortar prism after one month of accelerated carbonation treatment.
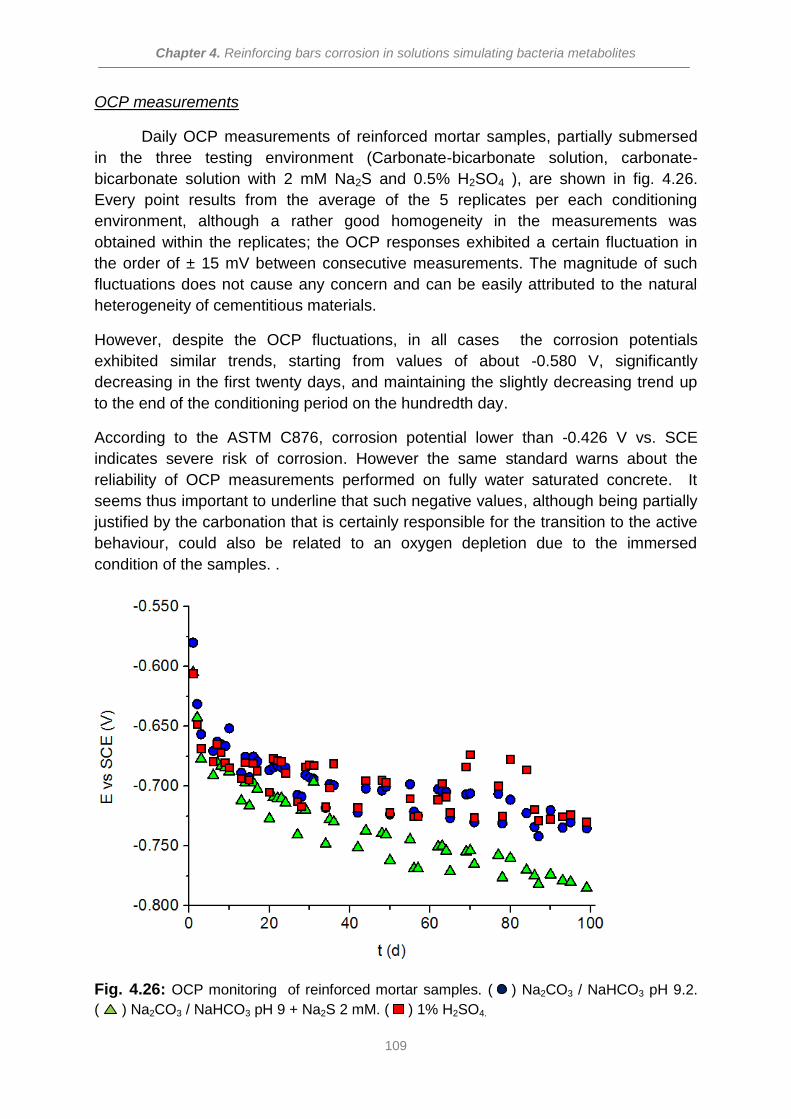
Chapter 4. Reinforcing bars corrosion in solutions simulating bacteria metabolites
109
OCP measurements
Daily OCP measurements of reinforced mortar samples, partially submersed
in the three testing environment (Carbonate-bicarbonate solution, carbonate-
bicarbonate solution with 2 mM Na2S and 0.5% H2SO4 ), are shown in fig. 4.26.
Every point results from the average of the 5 replicates per each conditioning
environment, although a rather good homogeneity in the measurements was
obtained within the replicates; the OCP responses exhibited a certain fluctuation in
the order of ± 15 mV between consecutive measurements. The magnitude of such
fluctuations does not cause any concern and can be easily attributed to the natural
heterogeneity of cementitious materials.
However, despite the OCP fluctuations, in all cases the corrosion potentials
exhibited similar trends, starting from values of about -0.580 V, significantly
decreasing in the first twenty days, and maintaining the slightly decreasing trend up
to the end of the conditioning period on the hundredth day.
According to the ASTM C876, corrosion potential lower than -0.426 V vs. SCE
indicates severe risk of corrosion. However the same standard warns about the
reliability of OCP measurements performed on fully water saturated concrete. It
seems thus important to underline that such negative values, although being partially
justified by the carbonation that is certainly responsible for the transition to the active
behaviour, could also be related to an oxygen depletion due to the immersed
condition of the samples. .
Fig. 4.26: OCP monitoring of reinforced mortar samples. ( ) Na2CO3 / NaHCO3 pH 9.2.
( ) Na2CO3 / NaHCO3 pH 9 + Na2S 2 mM. ( ) 1% H2SO4.
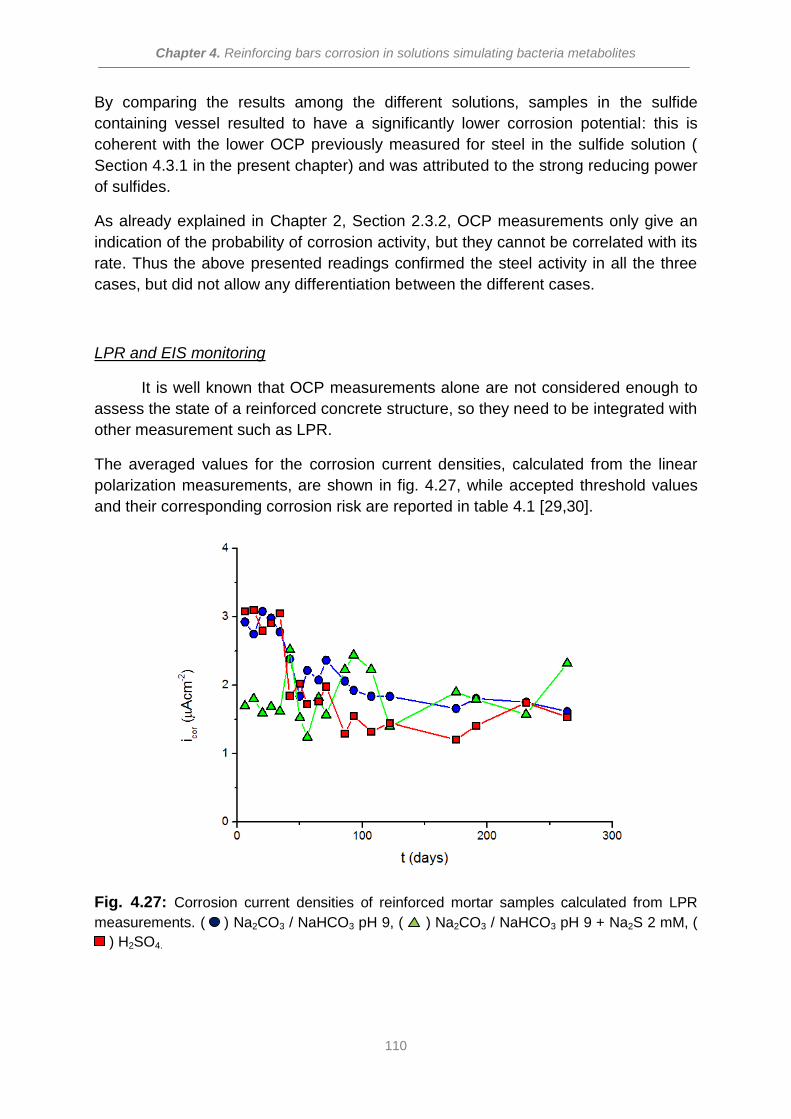
Chapter 4. Reinforcing bars corrosion in solutions simulating bacteria metabolites
110
By comparing the results among the different solutions, samples in the sulfide
containing vessel resulted to have a significantly lower corrosion potential: this is
coherent with the lower OCP previously measured for steel in the sulfide solution (
Section 4.3.1 in the present chapter) and was attributed to the strong reducing power
of sulfides.
As already explained in Chapter 2, Section 2.3.2, OCP measurements only give an
indication of the probability of corrosion activity, but they cannot be correlated with its
rate. Thus the above presented readings confirmed the steel activity in all the three
cases, but did not allow any differentiation between the different cases.
LPR and EIS monitoring
It is well known that OCP measurements alone are not considered enough to
assess the state of a reinforced concrete structure, so they need to be integrated with
other measurement such as LPR.
The averaged values for the corrosion current densities, calculated from the linear
polarization measurements, are shown in fig. 4.27, while accepted threshold values
and their corresponding corrosion risk are reported in table 4.1 [29,30].
Fig. 4.27: Corrosion current densities of reinforced mortar samples calculated from LPR
measurements. ( ) Na2CO3 / NaHCO3 pH 9, ( ) Na2CO3 / NaHCO3 pH 9 + Na2S 2 mM, (
) H2SO4.
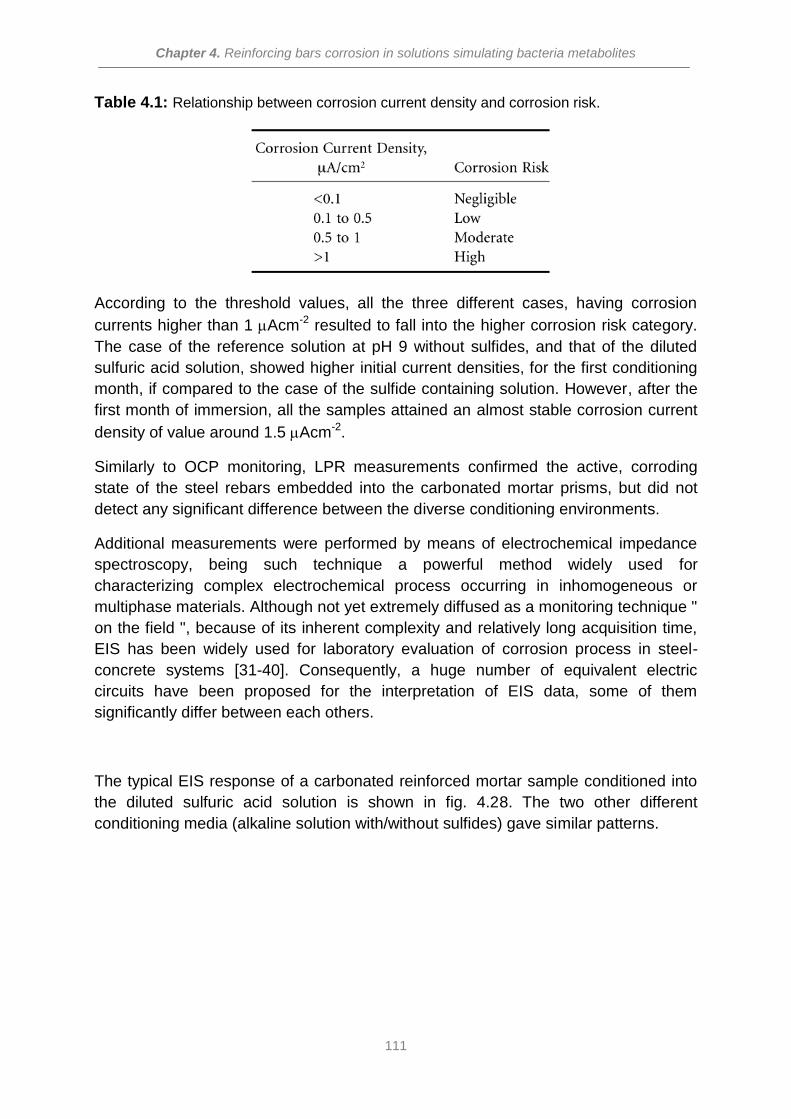
Chapter 4. Reinforcing bars corrosion in solutions simulating bacteria metabolites
111
Table 4.1: Relationship between corrosion current density and corrosion risk.
According to the threshold values, all the three different cases, having corrosion
currents higher than 1 Acm-2 resulted to fall into the higher corrosion risk category.
The case of the reference solution at pH 9 without sulfides, and that of the diluted
sulfuric acid solution, showed higher initial current densities, for the first conditioning
month, if compared to the case of the sulfide containing solution. However, after the
first month of immersion, all the samples attained an almost stable corrosion current
density of value around 1.5 Acm-2.
Similarly to OCP monitoring, LPR measurements confirmed the active, corroding
state of the steel rebars embedded into the carbonated mortar prisms, but did not
detect any significant difference between the diverse conditioning environments.
Additional measurements were performed by means of electrochemical impedance
spectroscopy, being such technique a powerful method widely used for
characterizing complex electrochemical process occurring in inhomogeneous or
multiphase materials. Although not yet extremely diffused as a monitoring technique "
on the field ", because of its inherent complexity and relatively long acquisition time,
EIS has been widely used for laboratory evaluation of corrosion process in steel-
concrete systems [31-40]. Consequently, a huge number of equivalent electric
circuits have been proposed for the interpretation of EIS data, some of them
significantly differ between each others.
The typical EIS response of a carbonated reinforced mortar sample conditioned into
the diluted sulfuric acid solution is shown in fig. 4.28. The two other different
conditioning media (alkaline solution with/without sulfides) gave similar patterns.
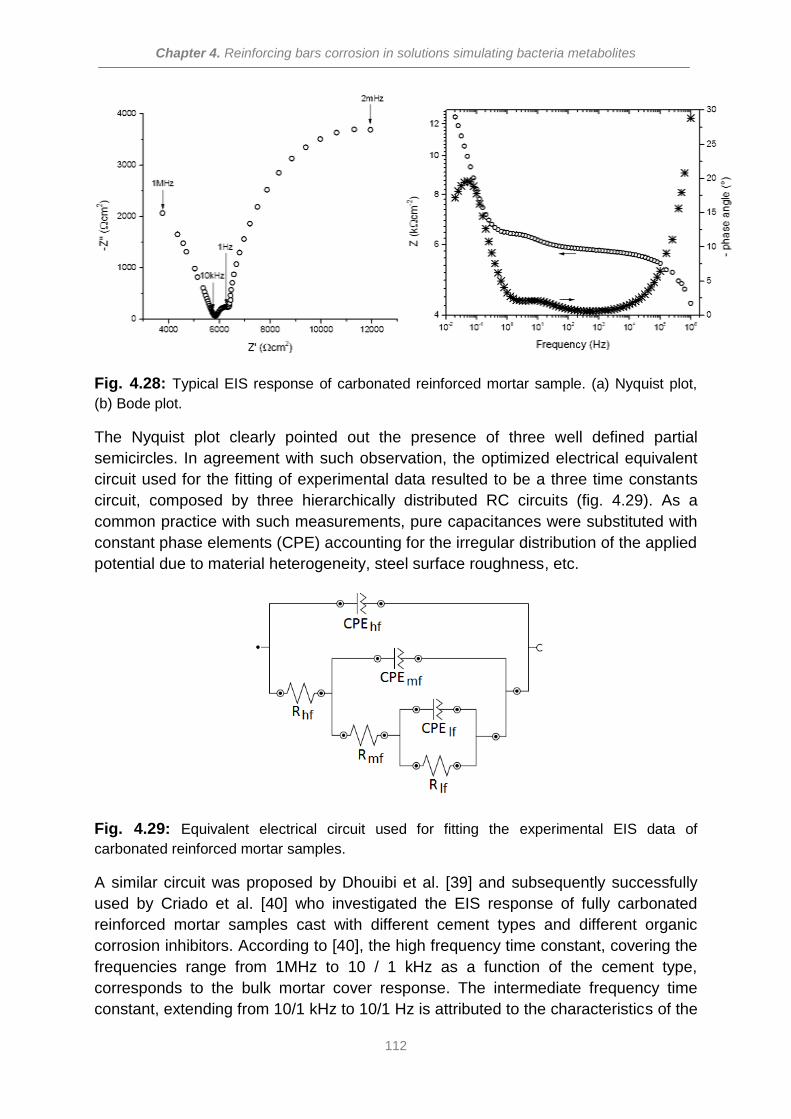
Chapter 4. Reinforcing bars corrosion in solutions simulating bacteria metabolites
112
Fig. 4.28: Typical EIS response of carbonated reinforced mortar sample. (a) Nyquist plot,
(b) Bode plot.
The Nyquist plot clearly pointed out the presence of three well defined partial
semicircles. In agreement with such observation, the optimized electrical equivalent
circuit used for the fitting of experimental data resulted to be a three time constants
circuit, composed by three hierarchically distributed RC circuits (fig. 4.29). As a
common practice with such measurements, pure capacitances were substituted with
constant phase elements (CPE) accounting for the irregular distribution of the applied
potential due to material heterogeneity, steel surface roughness, etc.
Fig. 4.29: Equivalent electrical circuit used for fitting the experimental EIS data of
carbonated reinforced mortar samples.
A similar circuit was proposed by Dhouibi et al. [39] and subsequently successfully
used by Criado et al. [40] who investigated the EIS response of fully carbonated
reinforced mortar samples cast with different cement types and different organic
corrosion inhibitors. According to [40], the high frequency time constant, covering the
frequencies range from 1MHz to 10 / 1 kHz as a function of the cement type,
corresponds to the bulk mortar cover response. The intermediate frequency time
constant, extending from 10/1 kHz to 10/1 Hz is attributed to the characteristics of the
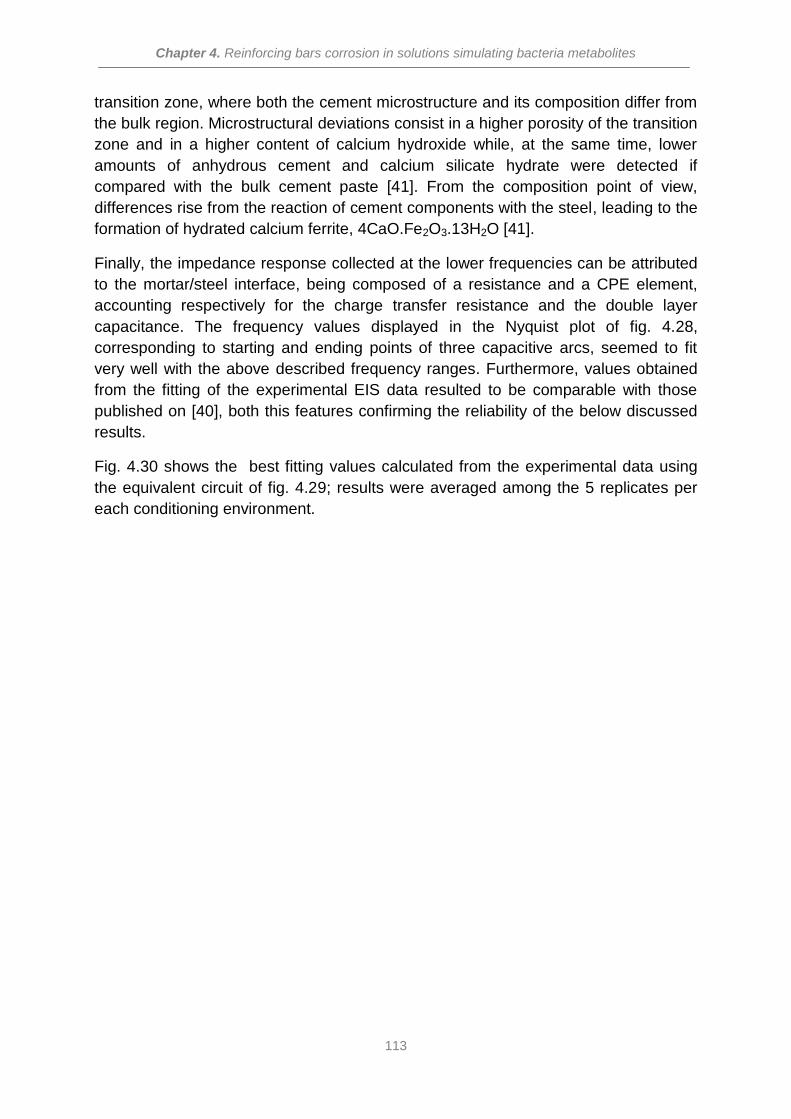
Chapter 4. Reinforcing bars corrosion in solutions simulating bacteria metabolites
113
transition zone, where both the cement microstructure and its composition differ from
the bulk region. Microstructural deviations consist in a higher porosity of the transition
zone and in a higher content of calcium hydroxide while, at the same time, lower
amounts of anhydrous cement and calcium silicate hydrate were detected if
compared with the bulk cement paste [41]. From the composition point of view,
differences rise from the reaction of cement components with the steel, leading to the
formation of hydrated calcium ferrite, 4CaO.Fe2O3.13H2O [41].
Finally, the impedance response collected at the lower frequencies can be attributed
to the mortar/steel interface, being composed of a resistance and a CPE element,
accounting respectively for the charge transfer resistance and the double layer
capacitance. The frequency values displayed in the Nyquist plot of fig. 4.28,
corresponding to starting and ending points of three capacitive arcs, seemed to fit
very well with the above described frequency ranges. Furthermore, values obtained
from the fitting of the experimental EIS data resulted to be comparable with those
published on [40], both this features confirming the reliability of the below discussed
results.
Fig. 4.30 shows the best fitting values calculated from the experimental data using
the equivalent circuit of fig. 4.29; results were averaged among the 5 replicates per
each conditioning environment.
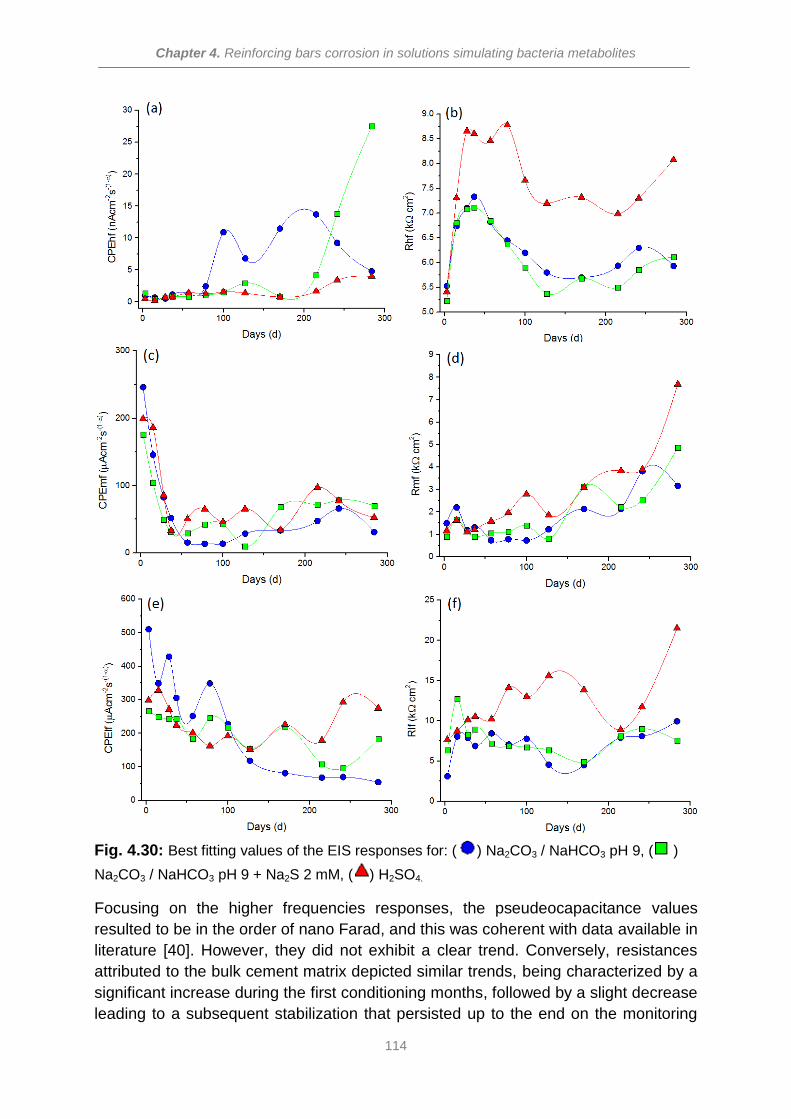
Chapter 4. Reinforcing bars corrosion in solutions simulating bacteria metabolites
114
Fig. 4.30: Best fitting values of the EIS responses for: ( ) Na2CO3 / NaHCO3 pH 9, ( )
Na2CO3 / NaHCO3 pH 9 + Na2S 2 mM, ( ) H2SO4.
Focusing on the higher frequencies responses, the pseudeocapacitance values
resulted to be in the order of nano Farad, and this was coherent with data available in
literature [40]. However, they did not exhibit a clear trend. Conversely, resistances
attributed to the bulk cement matrix depicted similar trends, being characterized by a
significant increase during the first conditioning months, followed by a slight decrease
leading to a subsequent stabilization that persisted up to the end on the monitoring
Chapter 4. Reinforcing bars corrosion in solutions simulating bacteria metabolites
115
period. The initial increase in the bulk matrix resistance could be attributed to a
residue of the mortar curing process stimulated by the saturated condition, thus
leading to a decrease of concrete porosity and a consequent increase in its resistivity
[40]. According to [42], a concrete resistivity decrease was reported to occur after
100 days of ageing in corroding samples as a consequence of volume expanding
corrosion products at the steel/mortar interface, leading to cracks that can propagate
up to 2000 m into the bulk mortar, thus resulting in a sharp drop of the resistance. It
is worth to remind that in the present case, as confirmed by OCP and LPR
measurements, all the samples were in an active, corroding state because of the
accelerated carbonation treatment, thus, according to the above cited study, this
could justify the decreasing values of the mortar bulk resistance. Finally, in fig.
4.30(b) it can be clearly seen that conditioning in the diluted sulfuric acid solution led
to consistently higher resistances. Such response could be justified referring to the
concrete-sulfuric acid reactions, elsewhere described (Chapter 2, Section 2.2.1),
according to which gypsum and secondary ettringite are formed. Both these products
are known to have significantly bigger volumes than the initial reagents, thus leading
to an obstruction of the mortar pores, and a consequent higher resistance.
The intermediate frequenciy responses exhibited similar trends and values among
the different conditioning environments for both the pseudocapacitances and the
resistances (fig. 4.30(c,d)). Values of the former were characterized by a significant
decrease occurring in the first conditioning month followed by a stabilization lasting
until the end of the monitoring period. The resistances, attributed to the corrosion
products layers displayed a continuous slight increase over time, being that of the
sulfuric acid case always slightly higher than the remaining cases. Generally
speaking, a capacitance decrease, together with a resistance increase are attributed
to a dense layer formation. In the present case, such a behaviour could be attributed
to the growth of corrosion product layer as a consequence of the steel activity due to
carbonation, the acidic environment may also lead to a thicker layer.
Finally, also in the low frequency time constant (fig.4.30(e,f)), pseudacapacitance
and resistance values resulted to be rather equivalent among the different
conditioning environments, being characterized by a slight decrease over time of the
former, and an almost stable response of the latter. Such parameters, corresponding
to the double layer capacitance and the charge transfer resistance, should be precise
indicators of the corrosion processes, and once again, similarly to the LPR
measurements, no significant differences were detected as a consequence of the
conditioning media.
Taking into consideration that LPR measurements give the overall resistance of the
system, but once detracted the cementitious bulk matrix resistance, the remaining
value should be that of the charge transfer resistance. Consequently, as an internal
check, aiming to confirm the reliability of the above discussed results, fig. 4.31 shows
a comparison of the charge transfer resistances as calculated from LPR and EIS
measurements.
Chapter 4. Reinforcing bars corrosion in solutions simulating bacteria metabolites
116
Fig. 4.31: Comparison of charge transfer resistance values, as calculate from LPR () and
EIS () for the different conditioning media: (a) Na2CO3 / NaHCO3 pH 9, (b) Na2CO3 /
NaHCO3 pH 9 + Na2S 2 mM, (c) 0.5% H2SO4.
In all the three cases, Rct values from LPR measurements resulted to be slightly
higher than those calculated from impedance spectra. Such discrepancy could be
attributed to a non complete ohmic drop compensation, resulting from the an
instrumental limitation. However, although not overlapping, results from the two
different techniques resulted to have extremely similar trends, thus confirming their
reliability. Such confirmation, together with the relatively stable responses as
depicted in fig.4.31, finally allowed to state that the above discussed monitoring did
not detect significant differences in the electrochemical responses of steel rebars
embedded into carbonated mortar and conditioned into different solutions. All the
techniques (OCP, LPR, EIS) pointed out an active corroding/behaviour due to the
mortar carbonation, while apparently, the aggressive species simulating the bacteria
metabolites did not significantly affect the corrosion rate.
After 200 days of conditioning, one sample per each of the three media was chosen
to be split allowing a visual observation of the embedded steel rebar. Pictures are
reported in figure 4.32.
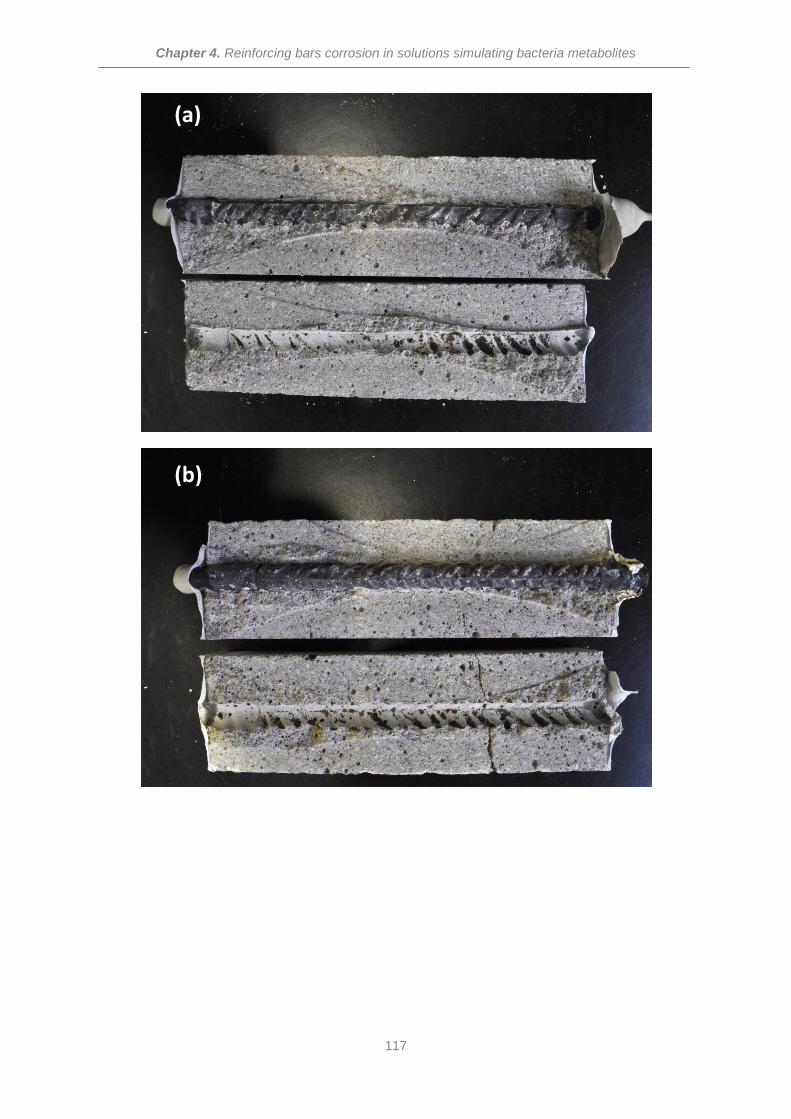
Chapter 4. Reinforcing bars corrosion in solutions simulating bacteria metabolites
117
(a)
(b)
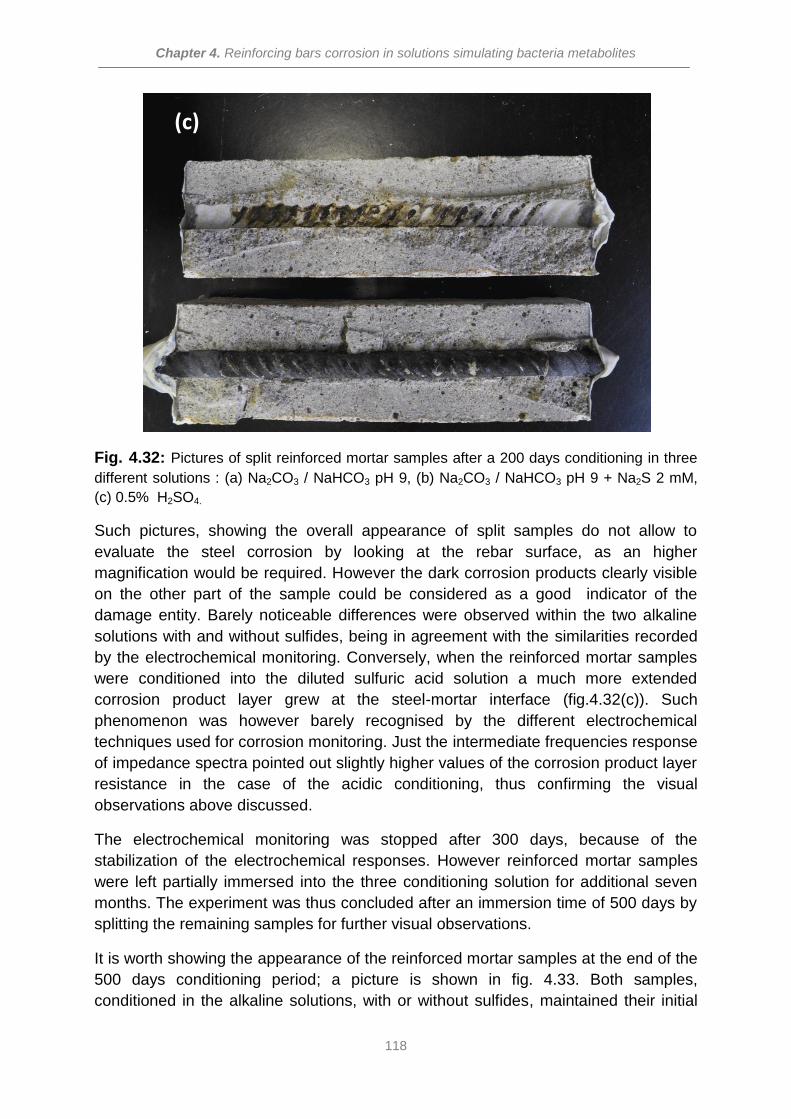
Chapter 4. Reinforcing bars corrosion in solutions simulating bacteria metabolites
118
Fig. 4.32: Pictures of split reinforced mortar samples after a 200 days conditioning in three
different solutions : (a) Na2CO3 / NaHCO3 pH 9, (b) Na2CO3 / NaHCO3 pH 9 + Na2S 2 mM,
(c) 0.5% H2SO4.
Such pictures, showing the overall appearance of split samples do not allow to
evaluate the steel corrosion by looking at the rebar surface, as an higher
magnification would be required. However the dark corrosion products clearly visible
on the other part of the sample could be considered as a good indicator of the
damage entity. Barely noticeable differences were observed within the two alkaline
solutions with and without sulfides, being in agreement with the similarities recorded
by the electrochemical monitoring. Conversely, when the reinforced mortar samples
were conditioned into the diluted sulfuric acid solution a much more extended
corrosion product layer grew at the steel-mortar interface (fig.4.32(c)). Such
phenomenon was however barely recognised by the different electrochemical
techniques used for corrosion monitoring. Just the intermediate frequencies response
of impedance spectra pointed out slightly higher values of the corrosion product layer
resistance in the case of the acidic conditioning, thus confirming the visual
observations above discussed.
The electrochemical monitoring was stopped after 300 days, because of the
stabilization of the electrochemical responses. However reinforced mortar samples
were left partially immersed into the three conditioning solution for additional seven
months. The experiment was thus concluded after an immersion time of 500 days by
splitting the remaining samples for further visual observations.
It is worth showing the appearance of the reinforced mortar samples at the end of the
500 days conditioning period; a picture is shown in fig. 4.33. Both samples,
conditioned in the alkaline solutions, with or without sulfides, maintained their initial
(c)
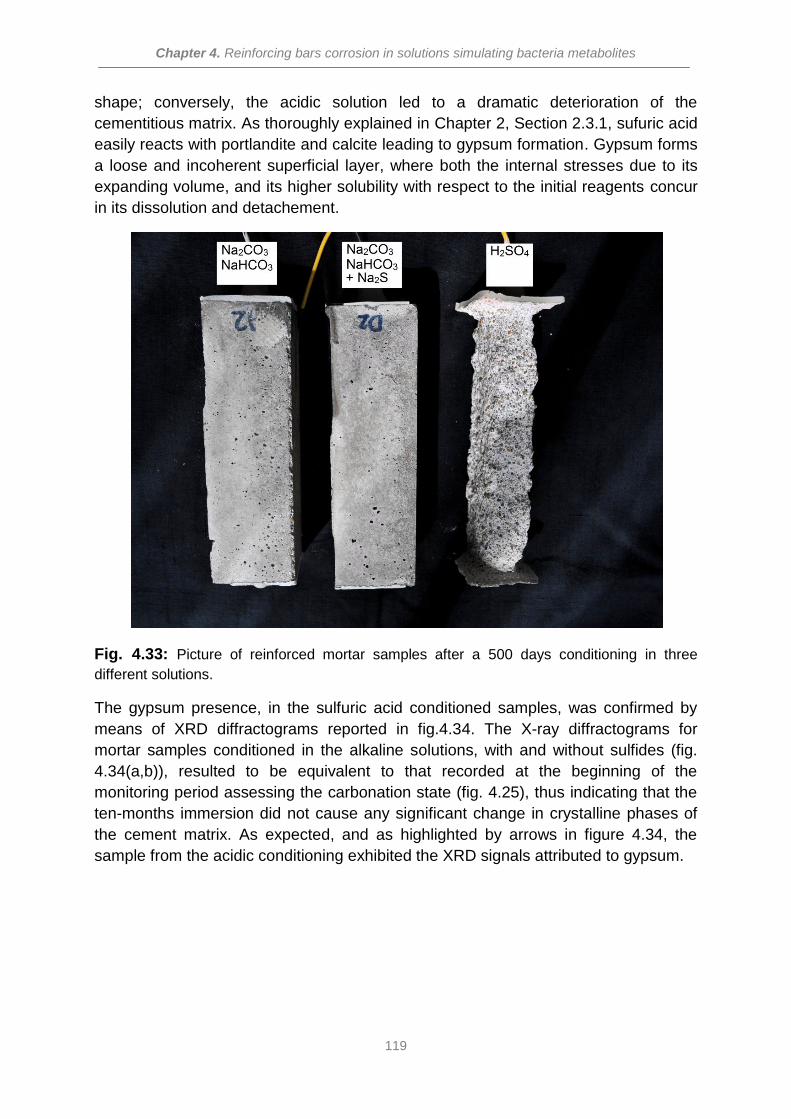
Chapter 4. Reinforcing bars corrosion in solutions simulating bacteria metabolites
119
shape; conversely, the acidic solution led to a dramatic deterioration of the
cementitious matrix. As thoroughly explained in Chapter 2, Section 2.3.1, sufuric acid
easily reacts with portlandite and calcite leading to gypsum formation. Gypsum forms
a loose and incoherent superficial layer, where both the internal stresses due to its
expanding volume, and its higher solubility with respect to the initial reagents concur
in its dissolution and detachement.
Fig. 4.33: Picture of reinforced mortar samples after a 500 days conditioning in three
different solutions.
The gypsum presence, in the sulfuric acid conditioned samples, was confirmed by
means of XRD diffractograms reported in fig.4.34. The X-ray diffractograms for
mortar samples conditioned in the alkaline solutions, with and without sulfides (fig.
4.34(a,b)), resulted to be equivalent to that recorded at the beginning of the
monitoring period assessing the carbonation state (fig. 4.25), thus indicating that the
ten-months immersion did not cause any significant change in crystalline phases of
the cement matrix. As expected, and as highlighted by arrows in figure 4.34, the
sample from the acidic conditioning exhibited the XRD signals attributed to gypsum.
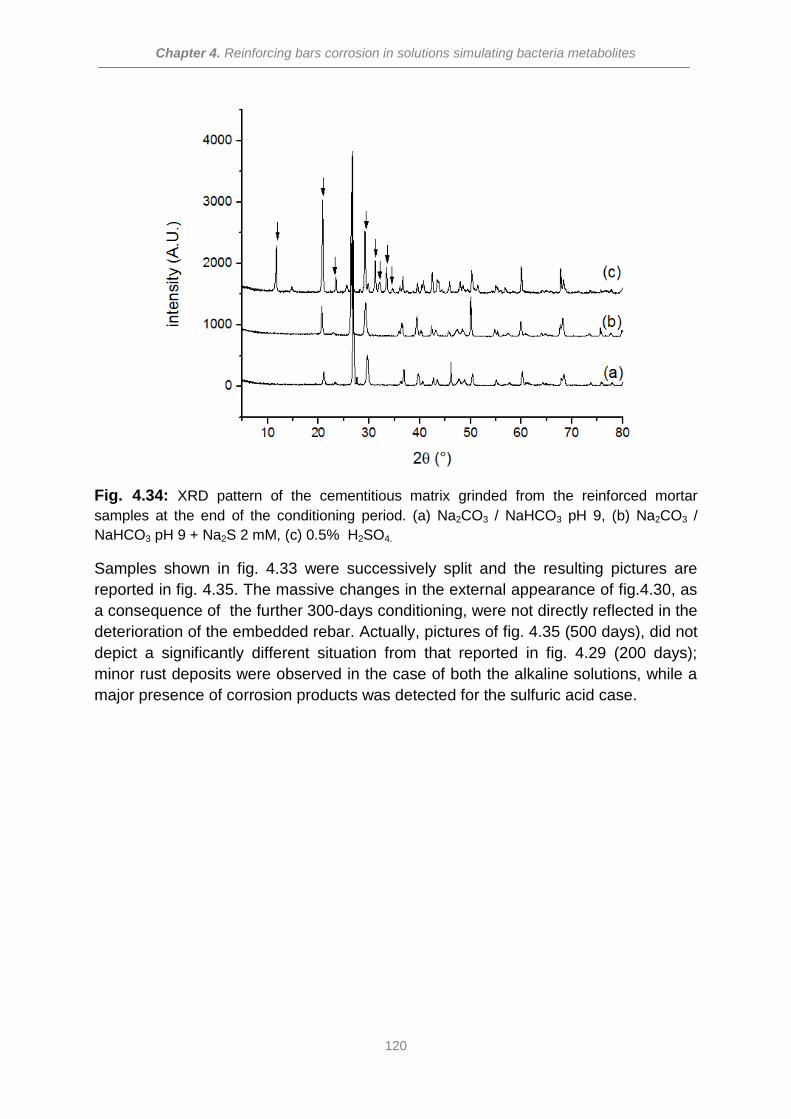
Chapter 4. Reinforcing bars corrosion in solutions simulating bacteria metabolites
120
Fig. 4.34: XRD pattern of the cementitious matrix grinded from the reinforced mortar
samples at the end of the conditioning period. (a) Na2CO3 / NaHCO3 pH 9, (b) Na2CO3 /
NaHCO3 pH 9 + Na2S 2 mM, (c) 0.5% H2SO4.
Samples shown in fig. 4.33 were successively split and the resulting pictures are
reported in fig. 4.35. The massive changes in the external appearance of fig.4.30, as
a consequence of the further 300-days conditioning, were not directly reflected in the
deterioration of the embedded rebar. Actually, pictures of fig. 4.35 (500 days), did not
depict a significantly different situation from that reported in fig. 4.29 (200 days);
minor rust deposits were observed in the case of both the alkaline solutions, while a
major presence of corrosion products was detected for the sulfuric acid case.
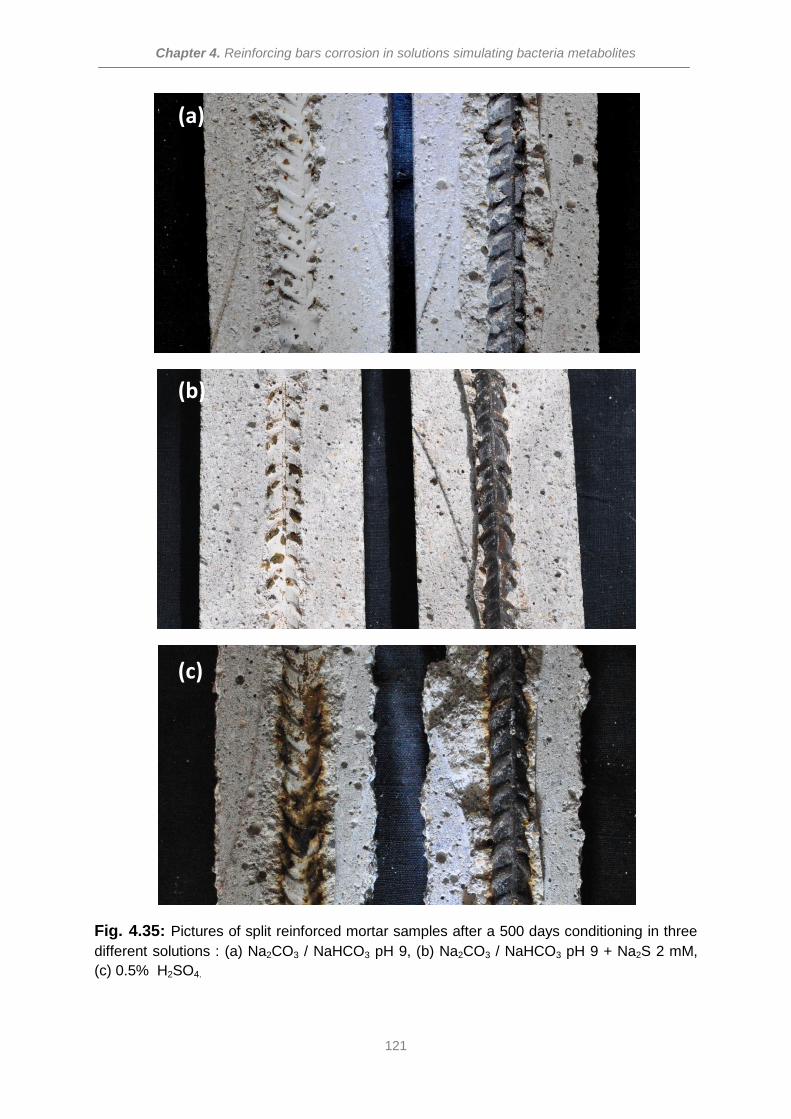
Chapter 4. Reinforcing bars corrosion in solutions simulating bacteria metabolites
121
Fig. 4.35: Pictures of split reinforced mortar samples after a 500 days conditioning in three
different solutions : (a) Na2CO3 / NaHCO3 pH 9, (b) Na2CO3 / NaHCO3 pH 9 + Na2S 2 mM,
(c) 0.5% H2SO4.
(a)
(b)
(c)
Chapter 4. Reinforcing bars corrosion in solutions simulating bacteria metabolites
122
4.4 Conclusions
Aiming to systematically investigate how abiotic solutions, simulating certain
bacteria metabolites, affect the integrity of steel reinforcing bars an experimental plan
was designed, starting from the easier system where the steel samples were directly
immersed into the aggressive solutions, and ending with a 300-days electrochemical
monitoring of reinforced mortar samples conditioned into different media simulating
bacteria metabolites.
Being well known that bacteria mostly involved in the deterioration mechanism of
reinforced concrete structures are those related to the sulfur cycle, Na2S in slightly
alkaline solution and diluted H2SO4 were used for the simulation of SRB and SOB
metabolic products.
As expected, in case of steel directly immersed into the diluted sulfuric acid solution,
both the gravimetric and the electrochemical monitoring pointed out the onset of a
corrosion process, consisting in a fast dissolution of the protective oxide layer and a
subsequent attack to the underneath steel surface. The attack morphology resulted
to be of a generalized type. A more complicated behavior, was instead obtained with
sulfide additions to alkaline solutions simulating a carbonated concrete. In order to
get more insight into the deterioration mechanism, a multivariable study was
required, where different parameters such as sulfide concentration, steel pre-
passivation, electrolyte oxygenation and pH were singularly modified. Sulfides
resulted to be a potentially aggressive species, their interactions with the steel
surface being essentially dependent on the environment pH. At the more alkaline pH,
the protective effect of the oxide layer prevails on the sulfide adsorption, but lowering
the pH, the equilibrium was unbalanced toward the steel-sulfide interaction leading to
a loose iron-sulfide film (mackinawite) and localized corrosion processes.
The electrochemical testing of reinforced mortar samples resulted to be much more
complicated and time consuming as compared with the above discussed case, as the
mortar cover thickness protected the steel by providing a physical barrier against all
the aggressive species. The accelerated carbonation partially neutralized the cement
alkalinity, leading to the rebar transition from the passive state to the active.
However, in the present saturated conditions, once the corrosion process was
initiated by carbonation induced pH drop, the employed electrochemical techniques
were not able to detect significant accelerations in the corrosion process as a
function of the external aggressive environment. Nevertheless, the splitting of
reinforced mortar samples pointed out a major formation of corrosion products in
case of the acidic conditioning, thus highlighting that the external environment,
simulating the biogenic acidity, can affect the steel corrosion process.
Chapter 4. Reinforcing bars corrosion in solutions simulating bacteria metabolites
123
References
[1] X. Shi, N. Xie, K. Fortune, J. Gong, Durability of steel reinforced concrete in
chloride environments: An overview, Construction and Building Materials, 30
(2012) 125-138.
[2] U. Angst, B. Elsener, C. Larsen, Ø. Vennesland, Critical chloride content in
reinforced concrete - A review, Cement and Concrete Research, Vol.39, Issue
12 (2009) 1122-1138.
[3] A. Suryavanshi, J. Scantlebury, S. Lyon, Corrosion of reinforcement steel
embedded in high water-cement ratio concrete contaminated with chloride,
Cement and Concrete Composites, 20 (1998) 263-381.
[4] D. Roberts, D. Nica, G. Zuo, J. Davis; Quantyfying microbially induced
deterioration of concrete, Int. Biodet. Biodeg. 49 (2002) 227-234.
[5] M. O'Connel, C. McNally, M.G. Richardson, Biochemical attack on concrete in
waste water application, Cement and Concrete Composites, 32 (2010) 479-485.
[6] N. De Belie, J.J. Lenehan, C.R. Braam, B. Svennerstedt, M. Richardson, B.
Sonck, Durability of Building Materials and Components in the Agricultural
Environment, Part III: Concrete Structures Journal of Agricultural Engineering
Research, Vol. 76, Issue 1(2000) 3-16.
[7] J. Monteny, E. Vincke, A. Beeldens, N. De Belie, L. Taerwe, D. Van Gemert, W.
Verstraete, Chemical, microbiological, and in situ test methods for biogenic
sulfuric acid corrosion of concrete, Cement and Concrete Research, Vol. 30,
Issue 4 (2000) 623-634.
[8] N. De Belie, J. Monteny, A. Beeldens, E. Vincke, D. Van Gemert, W. Verstraete,
Experimental research and prediction of the effect of chemical and biogenic
sulfuric acid on different types of commercially produced concrete sewer pipes,
Cement and Concrete Research, Vol. 34, Issue 12 (2004) 2223-2236.
[9] S. Wei, M. Sanchez, D.Trejo, C. Gillis, Microbial mediated deterioration of
reinforced concrete structures, International Biodeterioration & Biodegradation,
64 (2010) 748-754
[10] V.A. Abdelmseeh, J. Jofriet, G. Hayward, Sulphate and sulphide corrosion in
livestock buildings, Part II: Reinforcing steel corrosion, Biosystem engineering,
99 (2008) 382-289.
[11] A. Idriss, S.C. Negi, J. Jofriet, G. Hayward, Corrosion of steel reinforcement in
mortar specimens exposed to hydrogen sulphide, Part I: impressed voltage and
eletrochemical potential tests, J. Agric. Engng. Res. 79 (2001) 223-230.
[12] W. Sun and S. Nesic, A mechanistic model of H2S corrosion of mild steel,
NACE corrosion 2007, paper n°07655.
Chapter 4. Reinforcing bars corrosion in solutions simulating bacteria metabolites
124
[13] F.H. Meyer, O.L. Riggs, R.L. McGlasson, J.D. Sudbury, Corrosion Products of
Mild Steel In Hydrogen Sulfide Environments. Corrosion: February 1958, Vol.
14, No. 2, pp. 69-75.
[14] C Ren, D Liu, Z Bai, T Li, Corrosion behavior of oil tube steel in simulant
solution with hydrogen sulfide and carbon dioxide, Materials chemistry and
physics, Volume 93, Issues 2–3, (2005) 305-309.
[15] Scott P. Ewing, Electrochemical Studies of the Hydrogen Sulfide Corrosion
Mechanism. Corrosion: November 1955, Vol. 11, No. 11, pp. 51-55.
[16] Y.Choi, S. Nesic, S. Ling, Effect of H2S on the CO2 corrosion of carbon steel in
acidic solutions Electrochimica Acta, Volume 56, Issue 4 ( 2011) 1752-1760.
[17] D.W. Shoesmith, M. Bailey, B. Ikeda, Electrochemical formation of Mackinawite
in alkaline sulphide solutions, Electrochimica Acta, Vol.23 (1978) 1329-1339.
[18] D.W. Shoesmith, P. Taylor, M. Bailey, B. Ikeda, Electrochemical behavior of iron
in alkaline sulphide solutions, Electrochimica Acta, vol. 23, no. 9 (1978) 903-
916.
[19] R.C. Salvarezza, H. Videla, J. Arvia, A comparative pitting corrosion study of
mild steel in different alkaline solutions sontaining salts with sulphur containing
anions, Corrosion Science, Vol 24, n°9 (1984) 751-767.
[20] R.C. Salvarezza, H. Videla, J. Arvia, The electrodissolution and passivation of
mild steel in alkline sulphide solutions, Corrosion Science, Vol 22, n°9 (1982)
815-829.
[21] W. Sun, S. Nesic, D. Young, Equilibrium expression related to the solubility of
sour corrosion product mackinawite, Ind. Eng. Chem. Res. 47 (2008) 1738-
1742.
[22] P.W. Bolmer, Polarization of Iron in H2S-NaHS Buffers, Corrosion, Vol. 21, No.
3: (1965) 69-75.
[23] D. Tromans, Anodic Polarization Behavior of Mild Steel in Hot Alkaline Sulfide
Solutions, J. Electrochem. Soc. vol. 127, No. 6 (1980) 1253-1256.
[24] B. Sherar, P. Keech, D. Shoesmith, The effect of anaerobic corrosion on
anaerobically formed sulfide layer on carbon steel in ditute near neutral pH
saline solutions, Corrosion Science, 77 (2013) 257-264.
[25] M. O’Connel, C. McNally, M. Richardson, Cement and Concrete Composites 32
(2010) 479-485.
[26] S. Wey, C. Gillis, D. Trejo, Microbial mediated deterioration of reinforced
concrete structures, Int. Biodeterioration & Biodegradation 64 (2010) 748-754.
[27] C. Chang, J. Chen, The experimental investigation of concrete carbonation
depth, Cement and Concrete Research 36 (2006) 1760-1776.
Chapter 4. Reinforcing bars corrosion in solutions simulating bacteria metabolites
125
[28] J. Chi, C.Yang; J. Marine Sci. and Techn. 10 (2002) 14-20.
[29] C. Andrade, C. Alonso, Corrosion rate monitoring in the laboratory and on-site,
Constr. Build.Mater., Vol.10, No 5 (1996) 315-328.
[30] S. Feliú, J.A. González, C. Andrade, Electrochemical methods for on-site
determinations of corrosion rates of rebars, in Techniques to Assess the
Corrosion Activity of Steel Reinforced Concrete Structures, ASTM STP 1276,
N.S. Berke, E. Escalante, C. Nmai, D. Whiting, Eds., ASTM, West
Conshohocken, PA, 1996, 107.
[31] P. Gu, P. Xie, J.J. Beaudoin, Some Applications of AC Impedance
Spectroscopy in Cement Research, Cem. Concr. Aggregates, 17(2) (1995) 113-
118.
[32] P. Gu, Z. Xu, P. Xie, J.J. Beaudoin, Application of A.C. Impedance Techniques
in Studies of Porous Cementitious Materials. (I):Influence of Solid Phase and
Pore Solution on High Frequency Resistance, Cem. Concr. Res., 23(3) (1993)
531-40.
[33] P. Gu, P. Xie, Y. Fu, J.J. Beaudoin, A.C. Impedance Phenomena in Hydrating
Cement Systems: Frequency Dispersion Angle and Pore Size Distribution,
Cem. Concr. Res. 24(1) (1994), 86-88.
[34] D.D. MacDonald, M.C.H. Mckubre, U.Macdonald, Theoretical Assessment of AC
Impedance Spectroscopy for Detecting Corrosion of Rebar in Reinforced
Concrete, Corrosion, Vol. 44, No. 1 (1988) 2-7
[35] M.F. Montemor, A.M.P. Simoes, M.G.S. Ferreira, Chloride-induced corrosion on
reinforcing steel: from the fundamentals to the monitoring techniques, Cement &
Concrete Composites 25 (2003) 491-502.
[36] S.C. Kranc, A.A. Sagues, Polarization current distribution and electrochemical
impedance response of reinforced concrete when using guard ring electrodes,
Electrochim. Acta 38 (1993) 2055-2061.
[37] G. Trabanelli, C. Monticelli, V. Grassi, A. Frignani, Electrochemical study on
inhibitors of rebar corrosion in carbonated concrete, Cement and Concrete
Research, 35 (2005) 1804-1813.
[38] L.Dhoubi, E. Triki, A. Raharinaivo, The application of electrochemical
impedance spectroscopy to determine the long term effectiveness of corrosion
inhibitors for steel in concrete, Cement & Concrete Composites, 24 (2002) 35-
43.
[39] L. Dhoubi, E. Triki, J. Grandet, A. Raharinaivo, Comparing the steel concrete
intarface state and its electrochemical impedance, Cement and Concrete
Research, Vol. 26, No. 2 (1996) 253-266.
Chapter 4. Reinforcing bars corrosion in solutions simulating bacteria metabolites
126
[40] M. Criado, C. Monticelli, S. Fajardo, D. Gelli, V.Grassi, J.M. Bastidas, Organic
corrosion inhibitor mixtures for reinforcing steel embedded in carbonated alkali-
activated fly ash mortar, Construction and Building Material, 35 (2012) 30-37.
[41] A.T. Horne, I.G. Richardson, R.M.D. Brydson, Quantitative analysis of the
microstructure of interfaces in steel reinforced concrete, Cement and Concrete
Research 37 (2007) 1613-1623.
[42] D.A. Koleva, K. van Breugel, J.H.W. de Wit, E. van Westing, O. Copuroglu, L.
Veleva, A.L.A. Fraaij, Correlation of microstructure, electrical properties and
electrochemical phenomena in reinforced mortar. Breakdown to multi-phase
interface structures. Part I: Microstructural observations and electrical
properties, Materials Characterization, 59 (2008) 290-300.
Chapter 5. Development of “smart” corrosion inhibitors for steel protection from MICC
127
Chapter 5.
Development of “smart”
corrosion inhibitors
for steel protection
from MICC
Among a series of different organic / inorganic compounds, known for their
inhibitive properties, methylene blue dye and tri-sodium-phosphate resulted to be the
most promising candidates for steel protection in a diluted sulfuric acid solution. Two
different inorganic reservoirs, constituted of Vaterite (VAT) and Hydroxyapatite
(HAP), impregnated with methylene blue dye, were successfully synthesized. The
novel hybrid systems were characterized by means of SEM, XRD, BET, and the dye
release mechanism was thoroughly investigated. The HAP based hybrid resulted to
have a significantly higher storage capacity if compared to the VAT based system,
therefore was chosen for further electrochemical experimentation.
The electrochemical response of steel specimens in simulated environments, with
loaded and empty HAP host, was monitored by means of Linear Polarization
Resistance (LPR) and Electrochemical Impedance Spectroscopy (EIS). Results
confirm the inhibitive properties of the chosen compounds in acidic medium, pointing
out a synergic effect resulting from the release of the organic compound and the
dissolution of the inorganic matrix.
Chapter 5. Development of “smart” corrosion inhibitors for steel protection from MICC
128
5.1 Introduction
There are several different methods that are widely used in the prevention of
rebar corrosion of reinforced concrete structures, ranging from the use of blended
cement to external concrete coating, from using corrosion resistant steel, to applying
a cathodic protection system etc. The corrosion inhibitor addition is also a very useful
and well established technique having several advantages over the others in terms of
costs and ease of application. According to the Standard ISO 8044 - 1989 a
corrosion inhibitor is defined as "A chemical substance that decrease the corrosion
rate when present in the corrosion system at a suitable concentration, without
significantly changing the concentration of any other corrosion agent."
Corrosion inhibitors for reinforced concrete structures can be applied either by
addition to the fresh mixture or on the hardened concrete surface, being the so called
penetrating inhibitors. Furthermore, corrosion inhibitors can be classified according to
their protection mechanism: film forming agents, locally pH buffering or competitive
migration and adsorption with regards to the aggressive species [1]
The first corrosion inhibitor for RC structures was commercialized around 1970 and
was constituted by nitrite-based compounds. Nitrite is a passivating inhibitor, that
competes with chloride ions for the ferrous ions, promoting the formation of a stable
passive layer. Unfortunately nitrites have some important drawbacks such those due
to their high toxicity and mechanical loss. For such reasons in the last decades many
researchers focused their attentions to news, efficient and environmentally friendly
alternatives. Inorganic compounds such as molibdate, borates and sodium
phosphate, and organic substances such as amines, alkanolamines, aliphatic
carboxylic acid and saturated fatty acids were thoroughly tested [2]. Several reviews,
investigating and trying to compare the protection efficiency of a wide range of
different compounds are available in the open literature [3,4]. However, it is worth
mentioning that most of the available papers deals with chloride induced corrosion;
much less studies were performed on corrosion induced by neutralization of concrete
alkalinity due to carbonation [5] or acid rains [6,7]; none studied a prevention system
for microbial induced acidification.
Being the objective of the present chapter the development of a "smart" corrosion
inhibitor, efficient in the corrosion prevention for structures exposed to biogenic
acidity, several different substances were tested for such a purpose. Starting from
those well known and experimented for concrete applications such as sodium
phosphate salts [8], moving to those tested for acid rain acidification such as sodium
molibdate [6,7] and ending with some organic compounds like cysteine [9] and
methylene blue dye [10,11] that had never been tested for concrete applications.
That of organic molecules, for corrosion inhibition purposes, is a continuously
expanding field of interest, being very strong, especially in recent years, the search
Chapter 5. Development of “smart” corrosion inhibitors for steel protection from MICC
129
for a more efficient protection. It's well known that organic inhibitors act by
adsorption, and protect the metal surface by film formation [12]. In general, the most
effective and efficient compounds are those having bounds in their structure and/or
bearing heteroatoms with high electron density such as nitrogen, sulphur and oxygen
[13]. This is because, taking into consideration that the steel-inhibitor interaction
occurs through iron vacant 'd' orbitals, the higher the electron density on the organic
compound, the stronger the co-ordination bond with steel will be [14].
One of the main problem to be faced when dealing with corrosion inhibitors, either in
concrete or in any other application such as epoxy or sol-gel coatings, is how to
avoid a premature leaching of the active substances with the consequent loss of their
effectiveness. Storing the inhibitors inside nano/micro reservoirs can overcome the
above mentioned limitation [15]. The main feature requested for a material to be
considered of interest as a possible reservoir is a high porosity or a hollow structure
allowing the storage of the active substances. Furthermore, reservoirs, to be efficient
should fulfill a number of other requirements such as chemical and mechanical
stability, compatibility with the surrounding environment, ability to sense the corrosion
onset and ability to release the inhibitor on demand [15].
Polymeric nanovesicles filled with an alkalizing agent were successfully tested for
concrete applications [16]. Layered double hydroxides and hollow cerium molibdate
nanocontainers filled with mercaptobenzothiazole, were studied by Montemor et al.
[17] and the same authors published also on vaterite and hyroxyapatite microbeads,
loaded with different organic and inorganic inhibitors and dispersed into an epoxy
coating [15,18].
The rationale behind the present work is based on the synergism between the
inhibitive properties of phosphate and methylene blue dye in a single product, thus
realizing an hybrid organic/inorganic inhibitor. Furthemore, the immobilization of MBD
in a phosphate based matrix, that can dissolve at a given acidic pH, could result in a
valid and superior alternative to overcome issues due the premature depletion of the
inhibitor.
5.2 Experimental
5.2.1 Materials and testing environment
All the compounds, tested for their potential inhibitive properties, that is
methylene blue dye (MBD), benzothiazole (BTZ), cysteine (CYS), sodium molibdate
(SMD), cerium nitrate (CNT), di-sodium phosphate (DSP) and tri-sodium phosphate
(TSP) were purchased from Sigma-Aldrich as ACS reagent grade.
A saturated Ca(OH)2 and diluted 0.5% H2SO4 solutions were used as model media,
aiming to simulated the alkalinity of sound concrete and its acidification due to
bacteria metabolites. Steel samples for electrochemical and weight loss
Chapter 5. Development of “smart” corrosion inhibitors for steel protection from MICC
130
measurements were prepared according to the procedures, described in Chapters 3
and 4, Sections 3.2.1 and 4.2.1, respectively.
5.2.2 Electrochemical measurements
Experiments in simulated solutions were carried out at room temperature in a
glass electrochemical cell with the classical three-electrodes setup: the carbon steel
was the working electrode, a platinum wire served as a counter electrode and a
saturated calomel electrode (SCE) was used as a reference electrode. Anodic and
cathodic potentiodynamic polarizations with a scan rate of 0.5 mV/s were performed
in order to assess the corrosion protection performance of the inhibitors. Moreover,
4-days monitoring tests were carried out by means of LPR and Electrochemical
Impedance Spectroscopy (EIS) measurements. Linear polarization resistance
measurements were carried out at a scan rate of 0.1667 mV/s in an interval of ± 15
mV vs. OCP. EIS was performed in the frequency range from 50kHz to 10mHz by
superimposing an AC excitation perturbation amplitude of 10 mV (rms).
5.2.3 Synthesis
Similar procedures were used for the two synthesis of the VAT and HAP
based hybrid inhibitors [19]. A 0.2 M Na2CO3 solution for the former or a 0.2 M
Na3PO4 in the case of the latter, were thermostated at 37°C in a glass reactor
together with MBD 0.03 M. An equal volume of a 0.3 M CaCl2 solution was added
drop-wise through a dropping funnel mounted over the reactor. The only difference
between the two synthesis was that vaterite, being thermodynamically unstable,
required L-aspartic acid (1mg/mL) as organic template admixed to the CaCl2
solution. During the addition of CaCl2 and for the subsequent 30 minutes, the system
was maintained under agitation with a magnetic stirrer. The obtained precipitate was
repetitively rinsed and centrifuged with distilled water in order to remove reaction by-
products. Ethanol was used for the last washing; the solid product was then left
drying overnight and finally ground in an agate mortar.
5.2.4 Characterization
X-Ray powder diffraction (XRPD) patterns of the as synthesized powder were
recorded on a Philips PW3020 powder diffractometer, by using the Cu-K radiation
( = 1.54056A˚ ) in a 2θ range from 10 to 80° (0.02° steps, 1s counting). The
Brunauer-Emmett-Teller (BET) specific surface area was obtained from the N2
adsorption/desorption isotherms at 77 K using a Micromeritics Tristar 2 apparatus.
Before measurements, sample powders were heat-treated at 150°C for 4 h under a
N2 flow to remove adsorbed and undesired species from the sample surface. In order
to investigate the MBD release mechanism, six different solutions with pH ranging
from 12.6 to 1.5 were prepared by neutralizing a saturated Ca(OH)2 solution with 1%
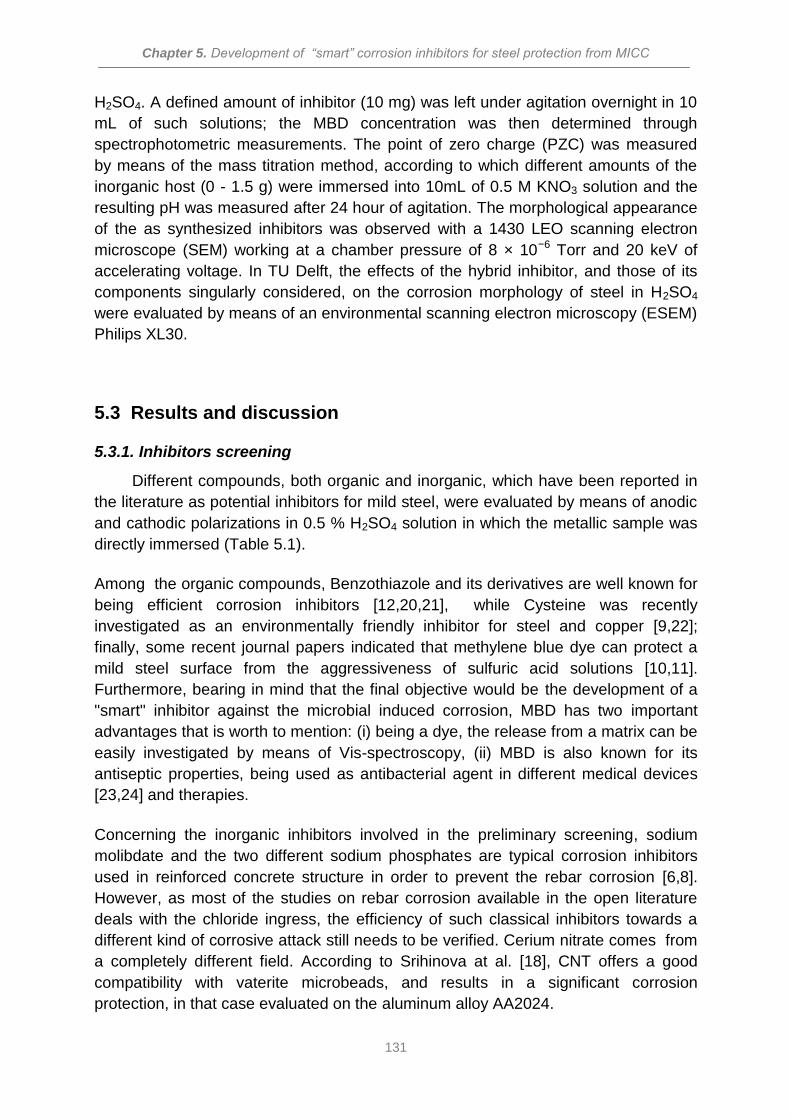
Chapter 5. Development of “smart” corrosion inhibitors for steel protection from MICC
131
H2SO4. A defined amount of inhibitor (10 mg) was left under agitation overnight in 10
mL of such solutions; the MBD concentration was then determined through
spectrophotometric measurements. The point of zero charge (PZC) was measured
by means of the mass titration method, according to which different amounts of the
inorganic host (0 - 1.5 g) were immersed into 10mL of 0.5 M KNO3 solution and the
resulting pH was measured after 24 hour of agitation. The morphological appearance
of the as synthesized inhibitors was observed with a 1430 LEO scanning electron
microscope (SEM) working at a chamber pressure of 8 × 10⁻⁶ Torr and 20 keV of
accelerating voltage. In TU Delft, the effects of the hybrid inhibitor, and those of its
components singularly considered, on the corrosion morphology of steel in H2SO4
were evaluated by means of an environmental scanning electron microscopy (ESEM)
Philips XL30.
5.3 Results and discussion
5.3.1. Inhibitors screening
Different compounds, both organic and inorganic, which have been reported in
the literature as potential inhibitors for mild steel, were evaluated by means of anodic
and cathodic polarizations in 0.5 % H2SO4 solution in which the metallic sample was
directly immersed (Table 5.1).
Among the organic compounds, Benzothiazole and its derivatives are well known for
being efficient corrosion inhibitors [12,20,21], while Cysteine was recently
investigated as an environmentally friendly inhibitor for steel and copper [9,22];
finally, some recent journal papers indicated that methylene blue dye can protect a
mild steel surface from the aggressiveness of sulfuric acid solutions [10,11].
Furthermore, bearing in mind that the final objective would be the development of a
"smart" inhibitor against the microbial induced corrosion, MBD has two important
advantages that is worth to mention: (i) being a dye, the release from a matrix can be
easily investigated by means of Vis-spectroscopy, (ii) MBD is also known for its
antiseptic properties, being used as antibacterial agent in different medical devices
[23,24] and therapies.
Concerning the inorganic inhibitors involved in the preliminary screening, sodium
molibdate and the two different sodium phosphates are typical corrosion inhibitors
used in reinforced concrete structure in order to prevent the rebar corrosion [6,8].
However, as most of the studies on rebar corrosion available in the open literature
deals with the chloride ingress, the efficiency of such classical inhibitors towards a
different kind of corrosive attack still needs to be verified. Cerium nitrate comes from
a completely different field. According to Srihinova at al. [18], CNT offers a good
compatibility with vaterite microbeads, and results in a significant corrosion
protection, in that case evaluated on the aluminum alloy AA2024.
Chapter 5. Development of “smart” corrosion inhibitors for steel protection from MICC
132
Table 5.1: Different organic and inorganic inhibitors used in the preliminary screening.
Compound Structure Reference
Benzothiazole (BTZ)
[ 12, 20, 21 ]
Cysteine (CYS)
[ 9,22 ]
Methylene blue dye (MBD)
[ 10,11 ]
Sodium Molibdate (SMD)
[ 6,7 ]
Cerium Nitrate (CNT)
[ 18 ]
Di-sodium phosphate (DSP)
[ 8]
Tri-sodium phosphate (TSP)
[ 8 ]
Anodic potentiodynamic polarizations, performed into a diluted sulfuric acid solution
containing different amount of MBD ( from 0.01 mM to 5 mM) are reported in Fig. 5.1.
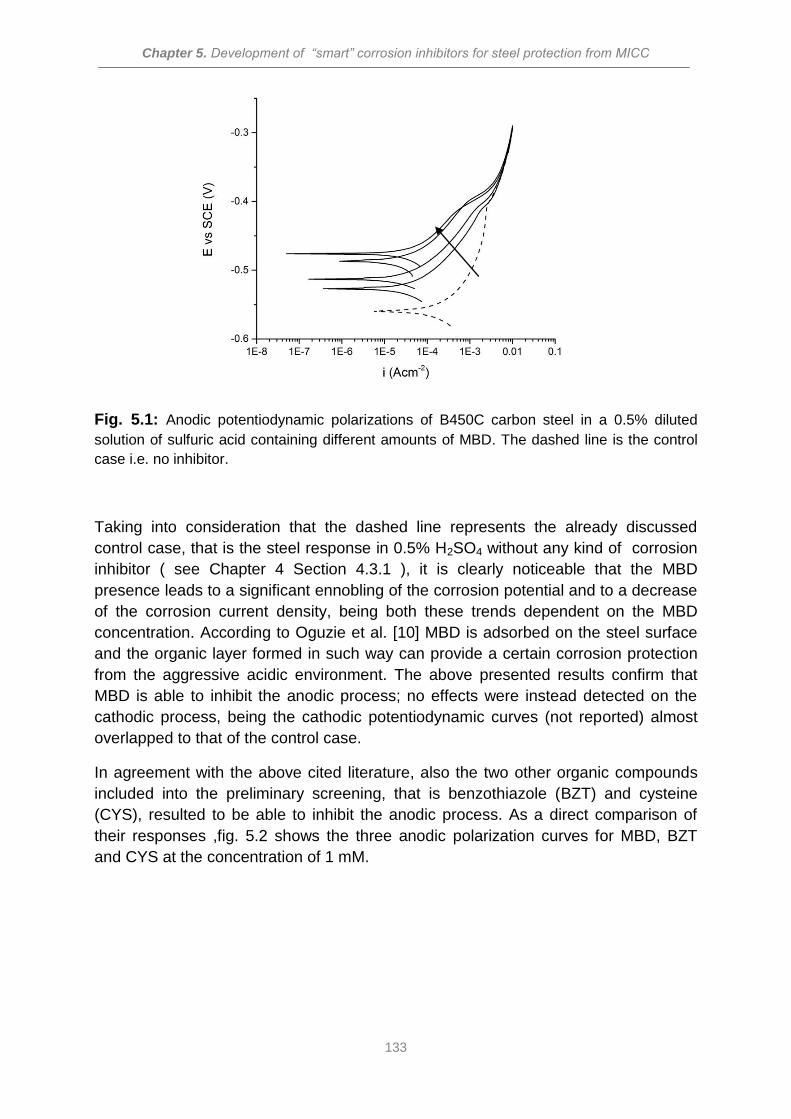
Chapter 5. Development of “smart” corrosion inhibitors for steel protection from MICC
133
Fig. 5.1: Anodic potentiodynamic polarizations of B450C carbon steel in a 0.5% diluted
solution of sulfuric acid containing different amounts of MBD. The dashed line is the control
case i.e. no inhibitor.
Taking into consideration that the dashed line represents the already discussed
control case, that is the steel response in 0.5% H2SO4 without any kind of corrosion
inhibitor ( see Chapter 4 Section 4.3.1 ), it is clearly noticeable that the MBD
presence leads to a significant ennobling of the corrosion potential and to a decrease
of the corrosion current density, being both these trends dependent on the MBD
concentration. According to Oguzie et al. [10] MBD is adsorbed on the steel surface
and the organic layer formed in such way can provide a certain corrosion protection
from the aggressive acidic environment. The above presented results confirm that
MBD is able to inhibit the anodic process; no effects were instead detected on the
cathodic process, being the cathodic potentiodynamic curves (not reported) almost
overlapped to that of the control case.
In agreement with the above cited literature, also the two other organic compounds
included into the preliminary screening, that is benzothiazole (BZT) and cysteine
(CYS), resulted to be able to inhibit the anodic process. As a direct comparison of
their responses ,fig. 5.2 shows the three anodic polarization curves for MBD, BZT
and CYS at the concentration of 1 mM.
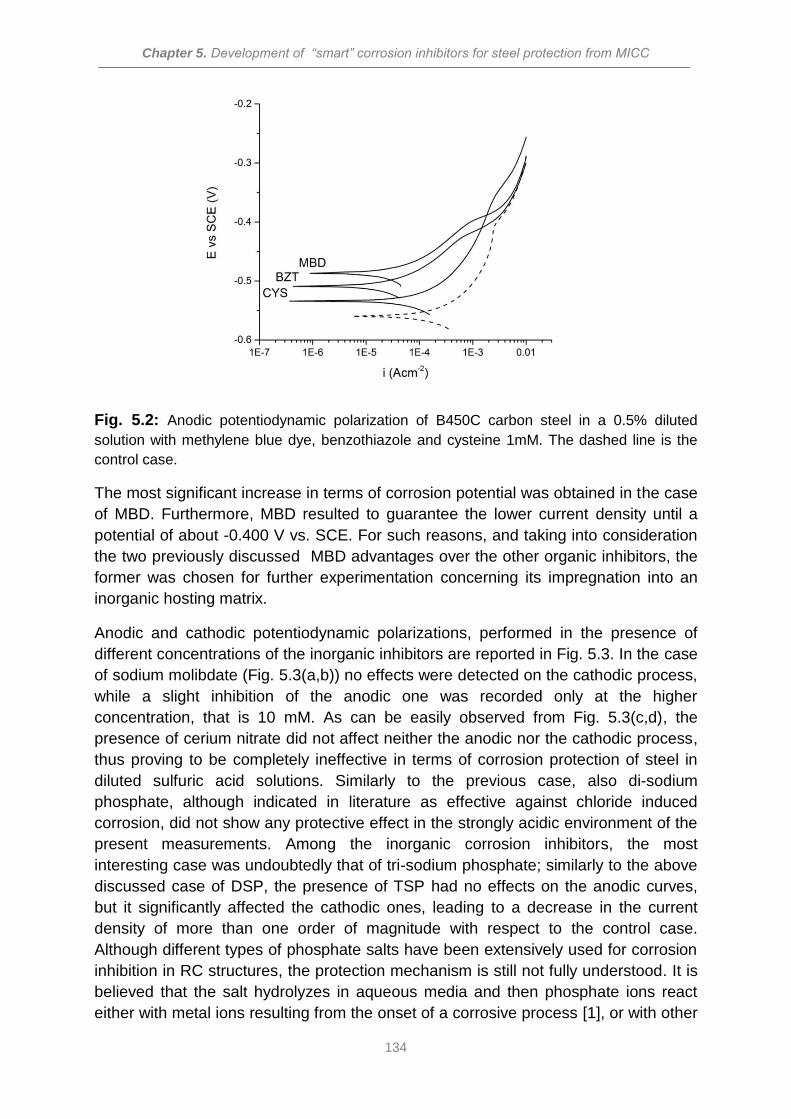
Chapter 5. Development of “smart” corrosion inhibitors for steel protection from MICC
134
Fig. 5.2: Anodic potentiodynamic polarization of B450C carbon steel in a 0.5% diluted
solution with methylene blue dye, benzothiazole and cysteine 1mM. The dashed line is the
control case.
The most significant increase in terms of corrosion potential was obtained in the case
of MBD. Furthermore, MBD resulted to guarantee the lower current density until a
potential of about -0.400 V vs. SCE. For such reasons, and taking into consideration
the two previously discussed MBD advantages over the other organic inhibitors, the
former was chosen for further experimentation concerning its impregnation into an
inorganic hosting matrix.
Anodic and cathodic potentiodynamic polarizations, performed in the presence of
different concentrations of the inorganic inhibitors are reported in Fig. 5.3. In the case
of sodium molibdate (Fig. 5.3(a,b)) no effects were detected on the cathodic process,
while a slight inhibition of the anodic one was recorded only at the higher
concentration, that is 10 mM. As can be easily observed from Fig. 5.3(c,d), the
presence of cerium nitrate did not affect neither the anodic nor the cathodic process,
thus proving to be completely ineffective in terms of corrosion protection of steel in
diluted sulfuric acid solutions. Similarly to the previous case, also di-sodium
phosphate, although indicated in literature as effective against chloride induced
corrosion, did not show any protective effect in the strongly acidic environment of the
present measurements. Among the inorganic corrosion inhibitors, the most
interesting case was undoubtedly that of tri-sodium phosphate; similarly to the above
discussed case of DSP, the presence of TSP had no effects on the anodic curves,
but it significantly affected the cathodic ones, leading to a decrease in the current
density of more than one order of magnitude with respect to the control case.
Although different types of phosphate salts have been extensively used for corrosion
inhibition in RC structures, the protection mechanism is still not fully understood. It is
believed that the salt hydrolyzes in aqueous media and then phosphate ions react
either with metal ions resulting from the onset of a corrosive process [1], or with other
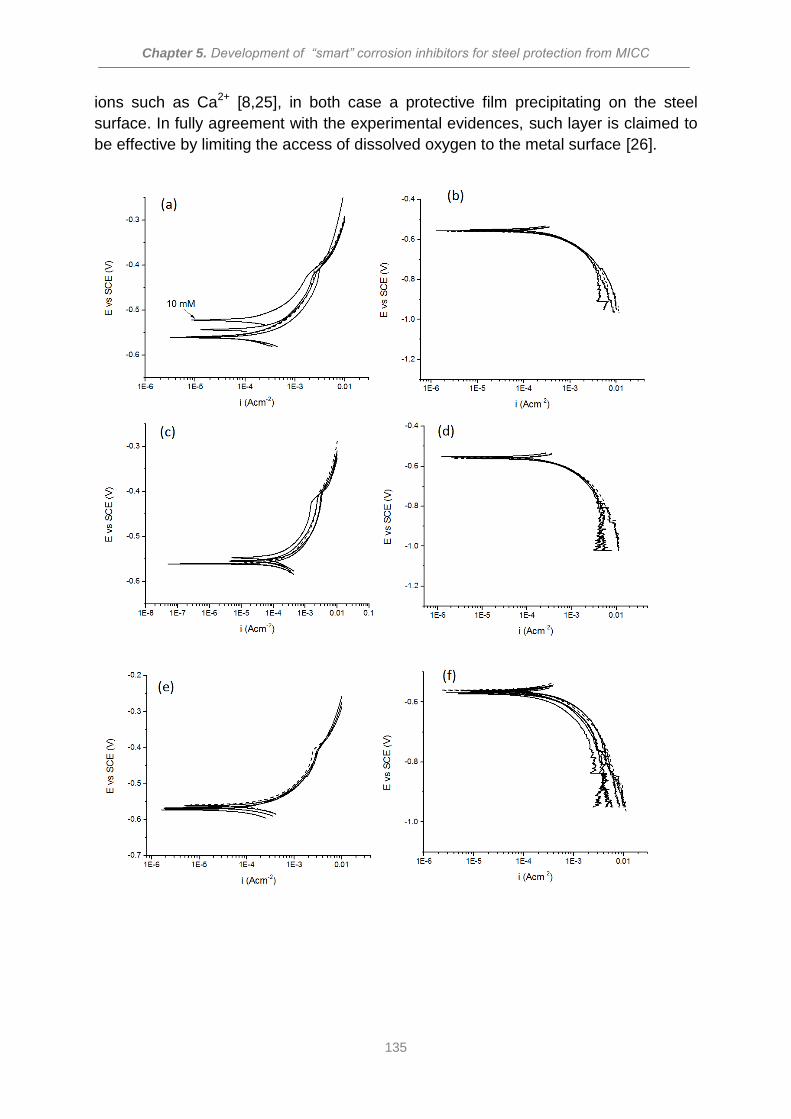
Chapter 5. Development of “smart” corrosion inhibitors for steel protection from MICC
135
ions such as Ca2+ [8,25], in both case a protective film precipitating on the steel
surface. In fully agreement with the experimental evidences, such layer is claimed to
be effective by limiting the access of dissolved oxygen to the metal surface [26].
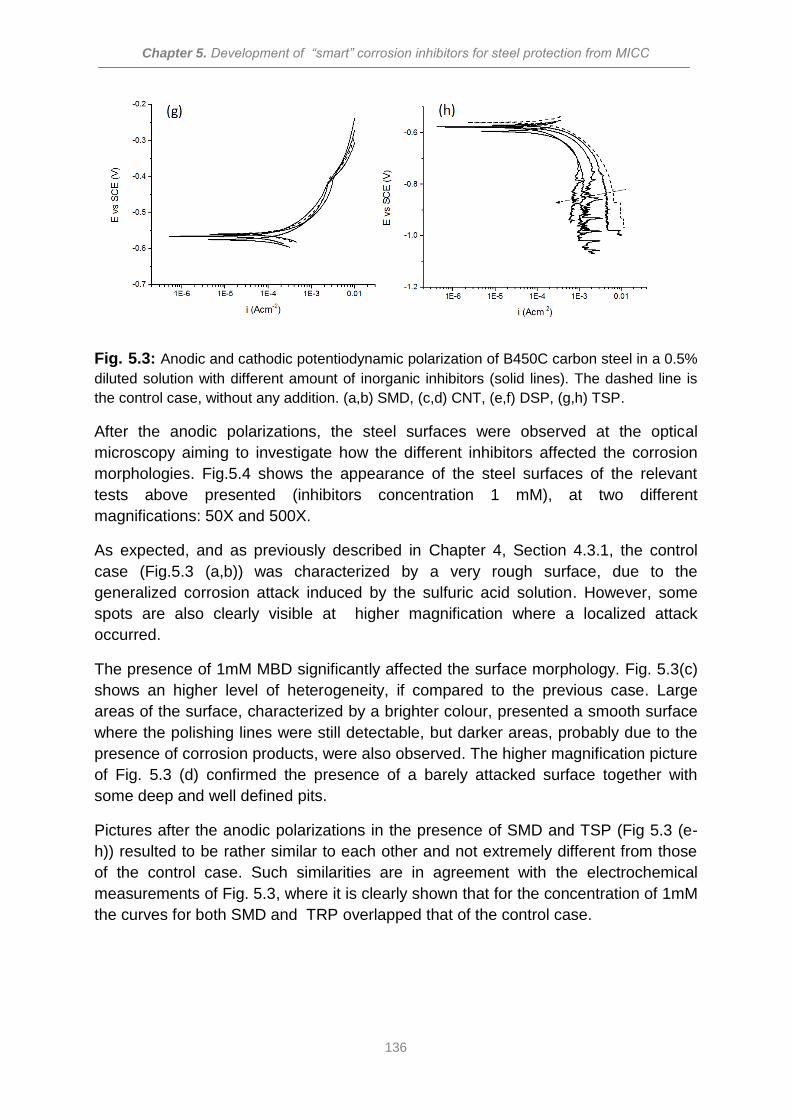
Chapter 5. Development of “smart” corrosion inhibitors for steel protection from MICC
136
Fig. 5.3: Anodic and cathodic potentiodynamic polarization of B450C carbon steel in a 0.5%
diluted solution with different amount of inorganic inhibitors (solid lines). The dashed line is
the control case, without any addition. (a,b) SMD, (c,d) CNT, (e,f) DSP, (g,h) TSP.
After the anodic polarizations, the steel surfaces were observed at the optical
microscopy aiming to investigate how the different inhibitors affected the corrosion
morphologies. Fig.5.4 shows the appearance of the steel surfaces of the relevant
tests above presented (inhibitors concentration 1 mM), at two different
magnifications: 50X and 500X.
As expected, and as previously described in Chapter 4, Section 4.3.1, the control
case (Fig.5.3 (a,b)) was characterized by a very rough surface, due to the
generalized corrosion attack induced by the sulfuric acid solution. However, some
spots are also clearly visible at higher magnification where a localized attack
occurred.
The presence of 1mM MBD significantly affected the surface morphology. Fig. 5.3(c)
shows an higher level of heterogeneity, if compared to the previous case. Large
areas of the surface, characterized by a brighter colour, presented a smooth surface
where the polishing lines were still detectable, but darker areas, probably due to the
presence of corrosion products, were also observed. The higher magnification picture
of Fig. 5.3 (d) confirmed the presence of a barely attacked surface together with
some deep and well defined pits.
Pictures after the anodic polarizations in the presence of SMD and TSP (Fig 5.3 (e-
h)) resulted to be rather similar to each other and not extremely different from those
of the control case. Such similarities are in agreement with the electrochemical
measurements of Fig. 5.3, where it is clearly shown that for the concentration of 1mM
the curves for both SMD and TRP overlapped that of the control case.
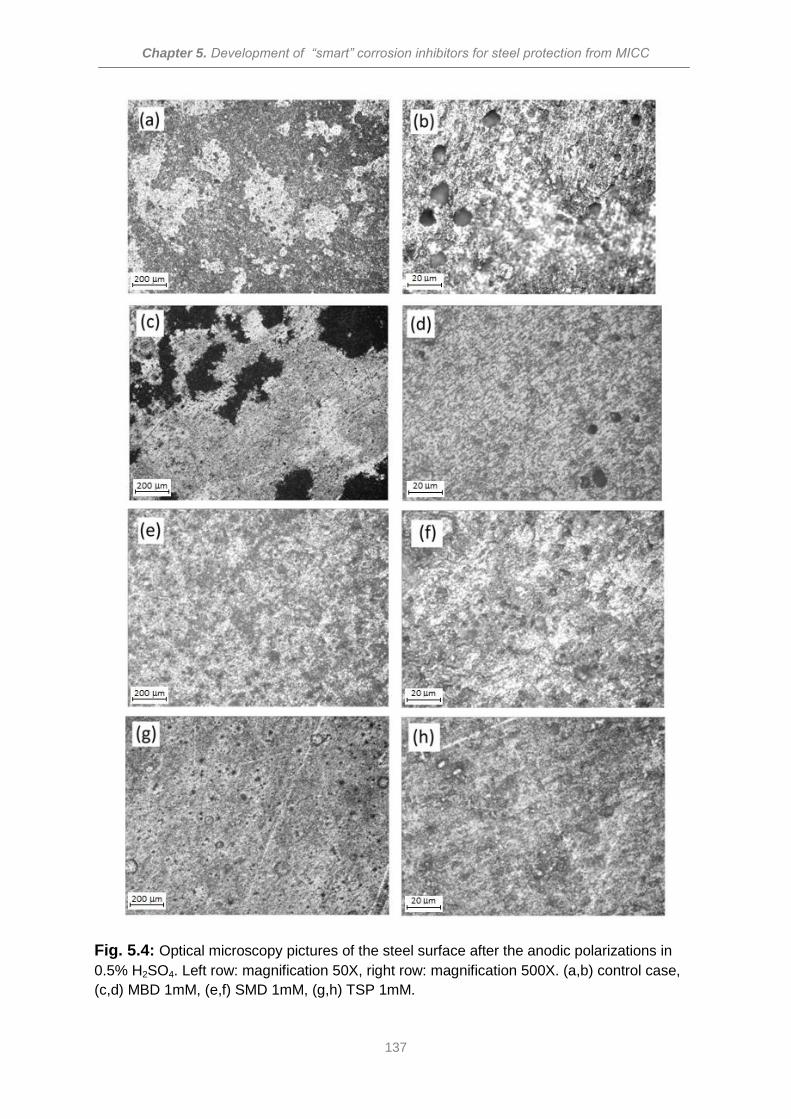
Chapter 5. Development of “smart” corrosion inhibitors for steel protection from MICC
137
Fig. 5.4: Optical microscopy pictures of the steel surface after the anodic polarizations in
0.5% H2SO4. Left row: magnification 50X, right row: magnification 500X. (a,b) control case,
(c,d) MBD 1mM, (e,f) SMD 1mM, (g,h) TSP 1mM.
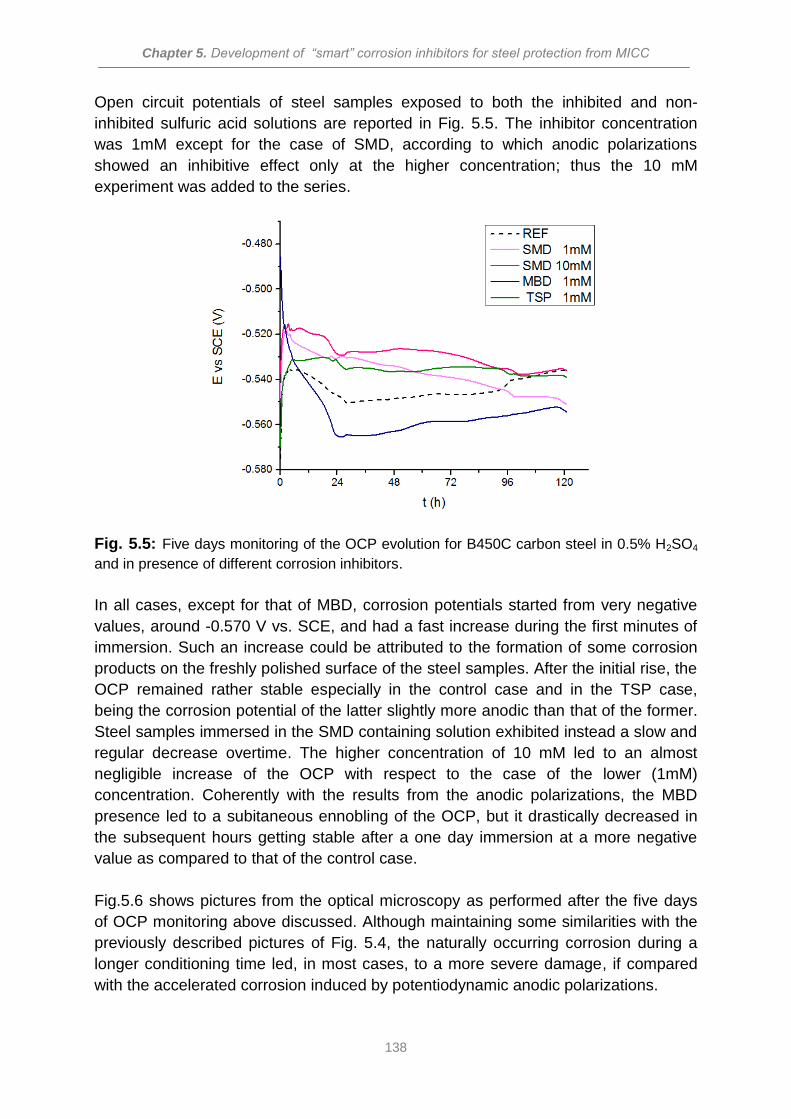
Chapter 5. Development of “smart” corrosion inhibitors for steel protection from MICC
138
Open circuit potentials of steel samples exposed to both the inhibited and non-
inhibited sulfuric acid solutions are reported in Fig. 5.5. The inhibitor concentration
was 1mM except for the case of SMD, according to which anodic polarizations
showed an inhibitive effect only at the higher concentration; thus the 10 mM
experiment was added to the series.
Fig. 5.5: Five days monitoring of the OCP evolution for B450C carbon steel in 0.5% H2SO4
and in presence of different corrosion inhibitors.
In all cases, except for that of MBD, corrosion potentials started from very negative
values, around -0.570 V vs. SCE, and had a fast increase during the first minutes of
immersion. Such an increase could be attributed to the formation of some corrosion
products on the freshly polished surface of the steel samples. After the initial rise, the
OCP remained rather stable especially in the control case and in the TSP case,
being the corrosion potential of the latter slightly more anodic than that of the former.
Steel samples immersed in the SMD containing solution exhibited instead a slow and
regular decrease overtime. The higher concentration of 10 mM led to an almost
negligible increase of the OCP with respect to the case of the lower (1mM)
concentration. Coherently with the results from the anodic polarizations, the MBD
presence led to a subitaneous ennobling of the OCP, but it drastically decreased in
the subsequent hours getting stable after a one day immersion at a more negative
value as compared to that of the control case.
Fig.5.6 shows pictures from the optical microscopy as performed after the five days
of OCP monitoring above discussed. Although maintaining some similarities with the
previously described pictures of Fig. 5.4, the naturally occurring corrosion during a
longer conditioning time led, in most cases, to a more severe damage, if compared
with the accelerated corrosion induced by potentiodynamic anodic polarizations.

Chapter 5. Development of “smart” corrosion inhibitors for steel protection from MICC
139
The non-inhibited control case (Fig. 5.6a) showed the already described rough
surface, but the spots of localized corrosion coalesced leading to a very deep attack;
similar morphologies were also detected in the case of SMD for both the lower and
the higher concentrations, reported in Fig.5.6(c) and 5.6(d), respectively.
When MBD was added to the solution, similarly to the case of the anodic polarization,
large areas of the active surface resulted to be extremely well protected, even better
than in the case of the anodic polarization. However, still some black deposits of
corrosion products pointed out a non completed protection of the surface. In the case
of TSP, as shown in Fig.5.6(e), at the end of the 5th conditioning day, the steel
surface resulted to be homogeneously rough, because of the generalized attack, but
not as damaged as the control case, thus pointing out a good protection offered by
tri-sodium phosphate.
Fig. 5.6: Optical microscopy pictures of the steel surface after the 5 day OCP monitoring in
0.5% H2SO4. Magnification 50X. (a) control case, (b) MBD 1mM, (c) SMD 1mM, (d) SMD
10mM, (e) TSP 1mM.
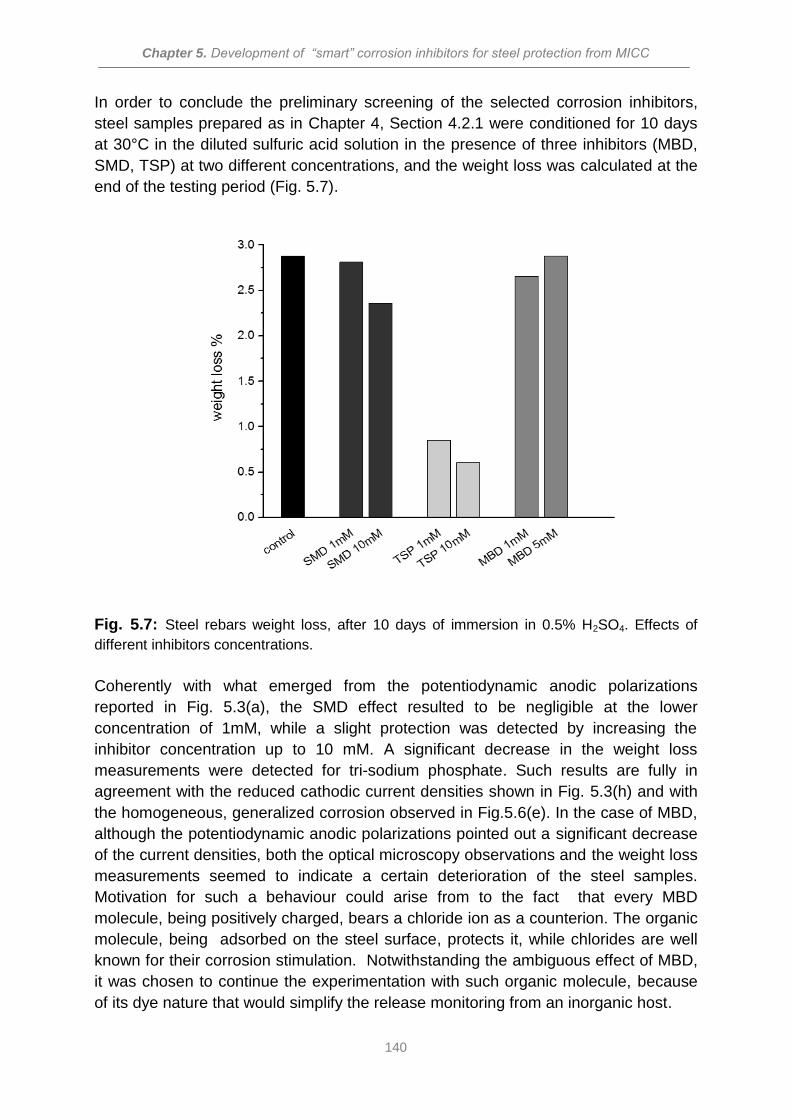
Chapter 5. Development of “smart” corrosion inhibitors for steel protection from MICC
140
In order to conclude the preliminary screening of the selected corrosion inhibitors,
steel samples prepared as in Chapter 4, Section 4.2.1 were conditioned for 10 days
at 30°C in the diluted sulfuric acid solution in the presence of three inhibitors (MBD,
SMD, TSP) at two different concentrations, and the weight loss was calculated at the
end of the testing period (Fig. 5.7).
Fig. 5.7: Steel rebars weight loss, after 10 days of immersion in 0.5% H2SO4. Effects of
different inhibitors concentrations.
Coherently with what emerged from the potentiodynamic anodic polarizations
reported in Fig. 5.3(a), the SMD effect resulted to be negligible at the lower
concentration of 1mM, while a slight protection was detected by increasing the
inhibitor concentration up to 10 mM. A significant decrease in the weight loss
measurements were detected for tri-sodium phosphate. Such results are fully in
agreement with the reduced cathodic current densities shown in Fig. 5.3(h) and with
the homogeneous, generalized corrosion observed in Fig.5.6(e). In the case of MBD,
although the potentiodynamic anodic polarizations pointed out a significant decrease
of the current densities, both the optical microscopy observations and the weight loss
measurements seemed to indicate a certain deterioration of the steel samples.
Motivation for such a behaviour could arise from to the fact that every MBD
molecule, being positively charged, bears a chloride ion as a counterion. The organic
molecule, being adsorbed on the steel surface, protects it, while chlorides are well
known for their corrosion stimulation. Notwithstanding the ambiguous effect of MBD,
it was chosen to continue the experimentation with such organic molecule, because
of its dye nature that would simplify the release monitoring from an inorganic host.
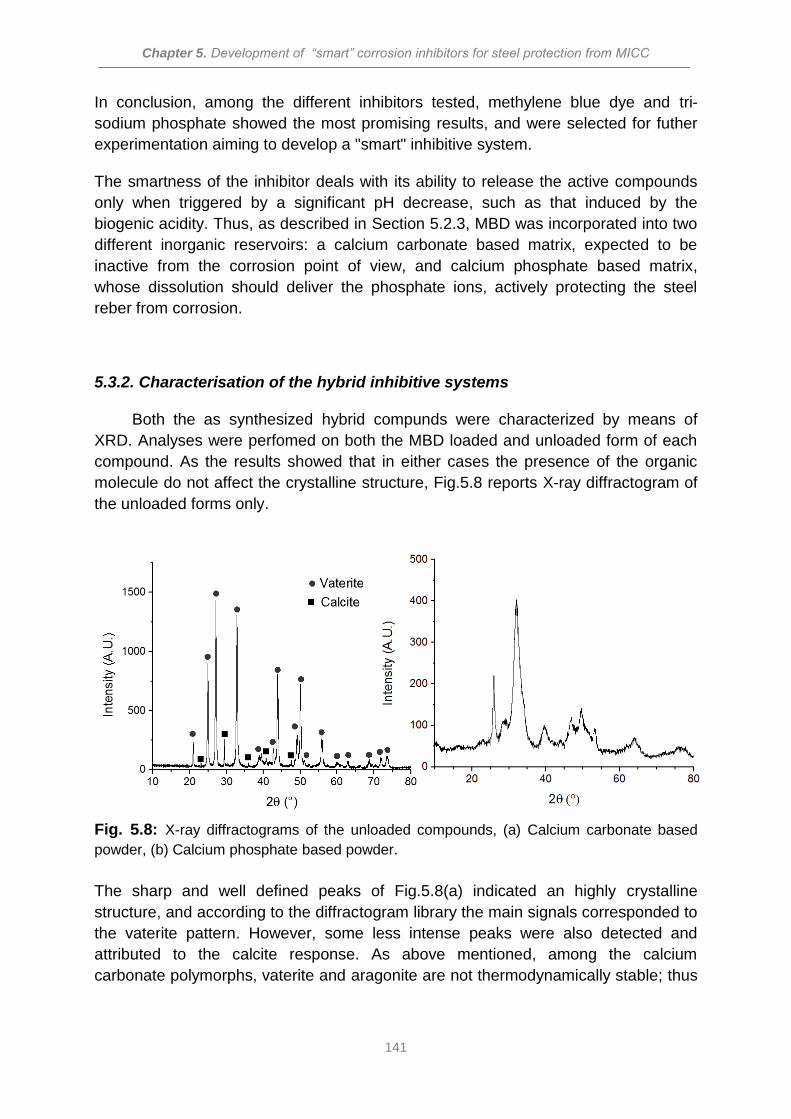
Chapter 5. Development of “smart” corrosion inhibitors for steel protection from MICC
141
In conclusion, among the different inhibitors tested, methylene blue dye and tri-
sodium phosphate showed the most promising results, and were selected for futher
experimentation aiming to develop a "smart" inhibitive system.
The smartness of the inhibitor deals with its ability to release the active compounds
only when triggered by a significant pH decrease, such as that induced by the
biogenic acidity. Thus, as described in Section 5.2.3, MBD was incorporated into two
different inorganic reservoirs: a calcium carbonate based matrix, expected to be
inactive from the corrosion point of view, and calcium phosphate based matrix,
whose dissolution should deliver the phosphate ions, actively protecting the steel
reber from corrosion.
5.3.2. Characterisation of the hybrid inhibitive systems
Both the as synthesized hybrid compunds were characterized by means of
XRD. Analyses were perfomed on both the MBD loaded and unloaded form of each
compound. As the results showed that in either cases the presence of the organic
molecule do not affect the crystalline structure, Fig.5.8 reports X-ray diffractogram of
the unloaded forms only.
Fig. 5.8: X-ray diffractograms of the unloaded compounds, (a) Calcium carbonate based
powder, (b) Calcium phosphate based powder.
The sharp and well defined peaks of Fig.5.8(a) indicated an highly crystalline
structure, and according to the diffractogram library the main signals corresponded to
the vaterite pattern. However, some less intense peaks were also detected and
attributed to the calcite response. As above mentioned, among the calcium
carbonate polymorphs, vaterite and aragonite are not thermodynamically stable; thus
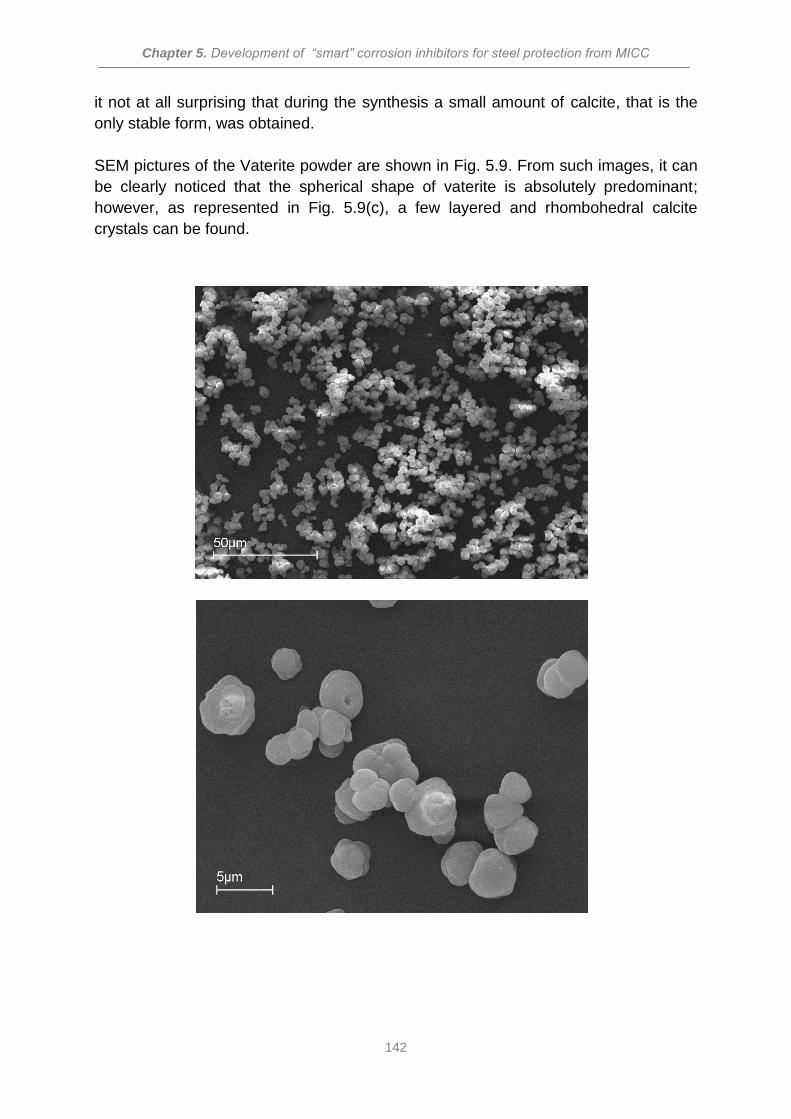
Chapter 5. Development of “smart” corrosion inhibitors for steel protection from MICC
142
it not at all surprising that during the synthesis a small amount of calcite, that is the
only stable form, was obtained.
SEM pictures of the Vaterite powder are shown in Fig. 5.9. From such images, it can
be clearly noticed that the spherical shape of vaterite is absolutely predominant;
however, as represented in Fig. 5.9(c), a few layered and rhombohedral calcite
crystals can be found.
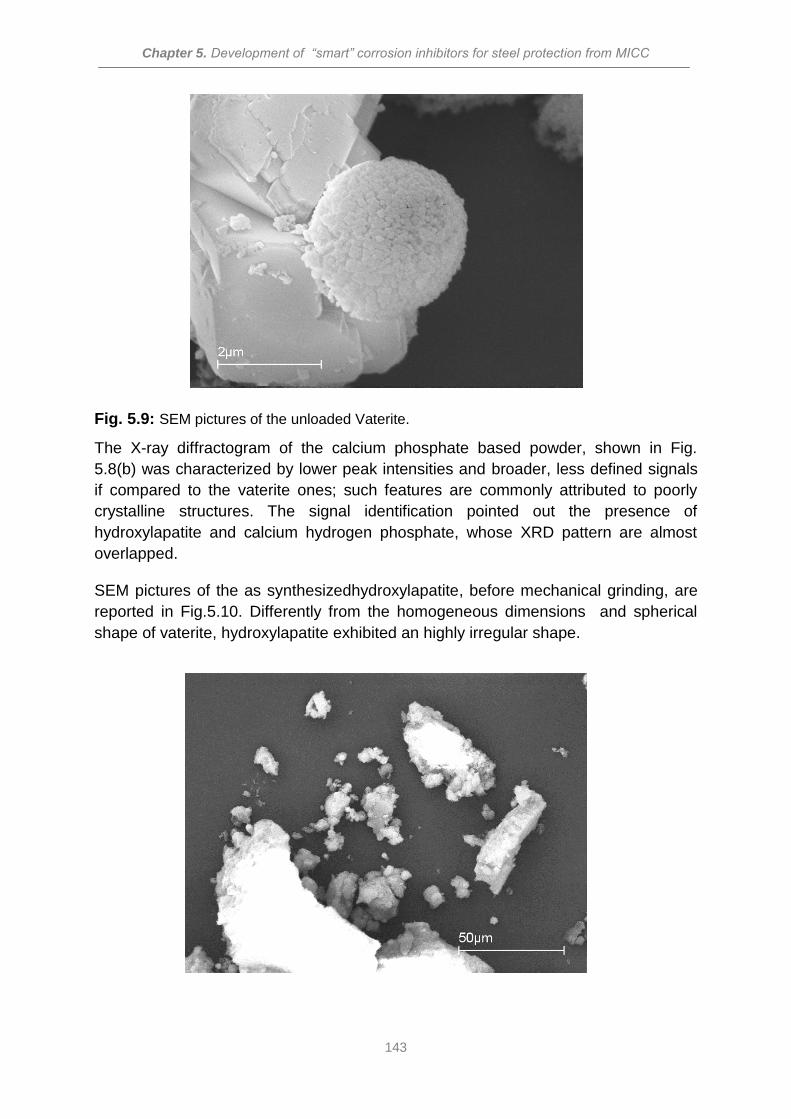
Chapter 5. Development of “smart” corrosion inhibitors for steel protection from MICC
143
Fig. 5.9: SEM pictures of the unloaded Vaterite.
The X-ray diffractogram of the calcium phosphate based powder, shown in Fig.
5.8(b) was characterized by lower peak intensities and broader, less defined signals
if compared to the vaterite ones; such features are commonly attributed to poorly
crystalline structures. The signal identification pointed out the presence of
hydroxylapatite and calcium hydrogen phosphate, whose XRD pattern are almost
overlapped.
SEM pictures of the as synthesizedhydroxylapatite, before mechanical grinding, are
reported in Fig.5.10. Differently from the homogeneous dimensions and spherical
shape of vaterite, hydroxylapatite exhibited an highly irregular shape.
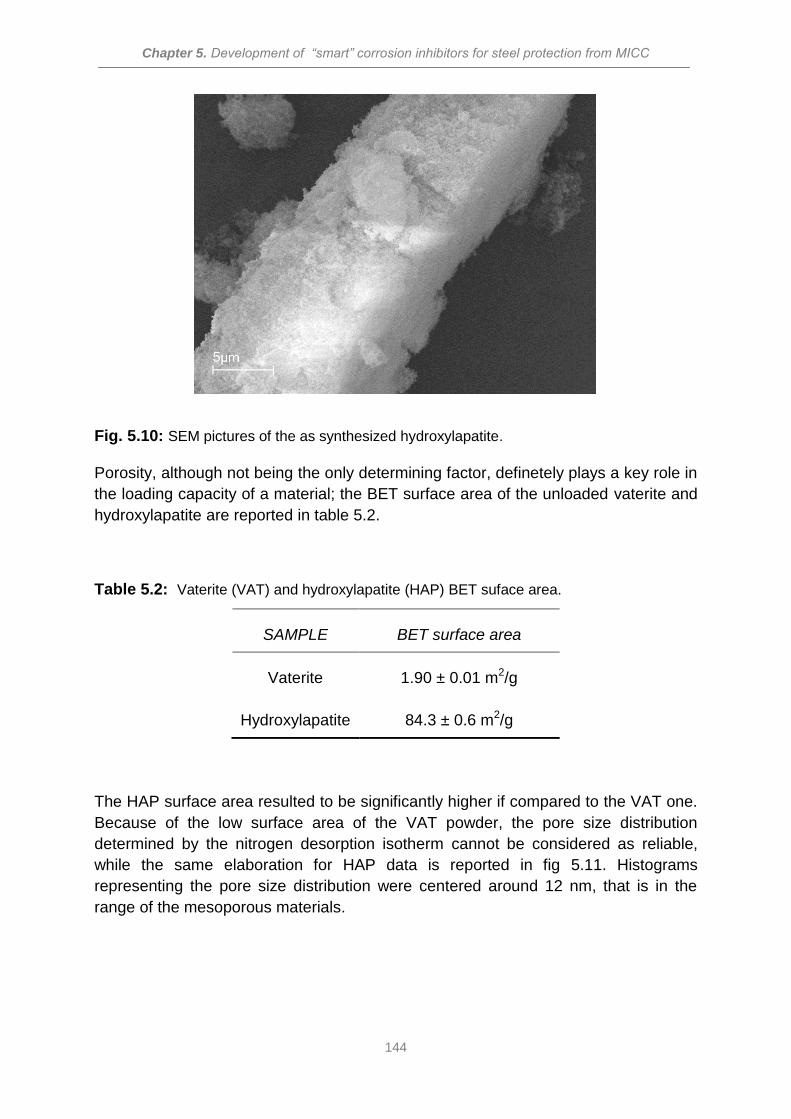
Chapter 5. Development of “smart” corrosion inhibitors for steel protection from MICC
144
Fig. 5.10: SEM pictures of the as synthesized hydroxylapatite.
Porosity, although not being the only determining factor, definetely plays a key role in
the loading capacity of a material; the BET surface area of the unloaded vaterite and
hydroxylapatite are reported in table 5.2.
Table 5.2: Vaterite (VAT) and hydroxylapatite (HAP) BET suface area.
SAMPLE BET surface area
Vaterite 1.90 ± 0.01 m2/g
Hydroxylapatite 84.3 ± 0.6 m2/g
The HAP surface area resulted to be significantly higher if compared to the VAT one.
Because of the low surface area of the VAT powder, the pore size distribution
determined by the nitrogen desorption isotherm cannot be considered as reliable,
while the same elaboration for HAP data is reported in fig 5.11. Histograms
representing the pore size distribution were centered around 12 nm, that is in the
range of the mesoporous materials.
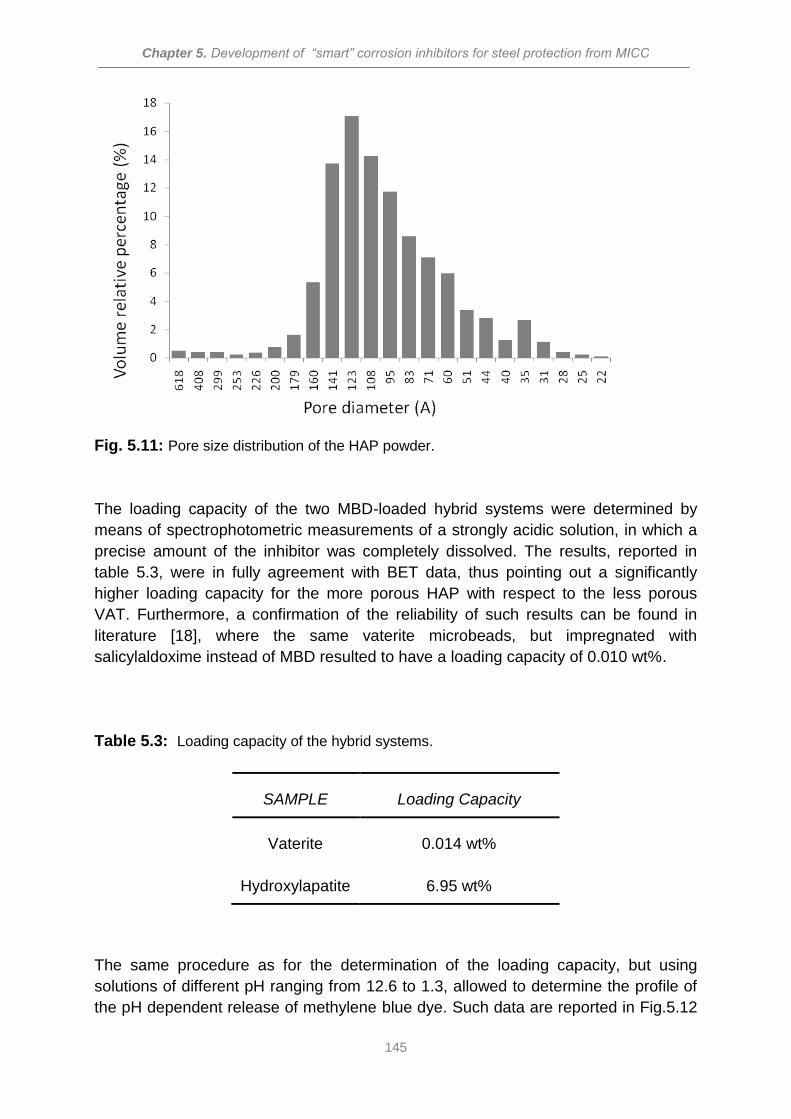
Chapter 5. Development of “smart” corrosion inhibitors for steel protection from MICC
145
Fig. 5.11: Pore size distribution of the HAP powder.
The loading capacity of the two MBD-loaded hybrid systems were determined by
means of spectrophotometric measurements of a strongly acidic solution, in which a
precise amount of the inhibitor was completely dissolved. The results, reported in
table 5.3, were in fully agreement with BET data, thus pointing out a significantly
higher loading capacity for the more porous HAP with respect to the less porous
VAT. Furthermore, a confirmation of the reliability of such results can be found in
literature [18], where the same vaterite microbeads, but impregnated with
salicylaldoxime instead of MBD resulted to have a loading capacity of 0.010 wt%.
Table 5.3: Loading capacity of the hybrid systems.
The same procedure as for the determination of the loading capacity, but using
solutions of different pH ranging from 12.6 to 1.3, allowed to determine the profile of
the pH dependent release of methylene blue dye. Such data are reported in Fig.5.12
SAMPLE Loading Capacity
Vaterite 0.014 wt%
Hydroxylapatite 6.95 wt%
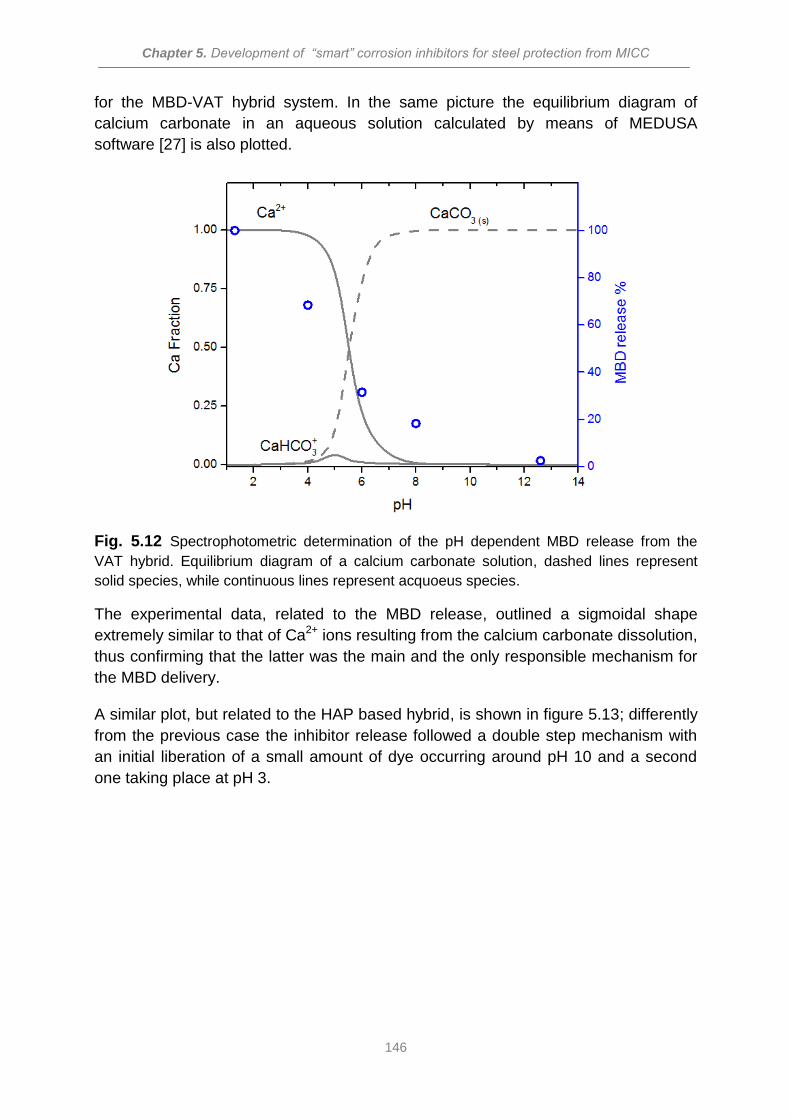
Chapter 5. Development of “smart” corrosion inhibitors for steel protection from MICC
146
for the MBD-VAT hybrid system. In the same picture the equilibrium diagram of
calcium carbonate in an aqueous solution calculated by means of MEDUSA
software [27] is also plotted.
Fig. 5.12 Spectrophotometric determination of the pH dependent MBD release from the
VAT hybrid. Equilibrium diagram of a calcium carbonate solution, dashed lines represent
solid species, while continuous lines represent acquoeus species.
The experimental data, related to the MBD release, outlined a sigmoidal shape
extremely similar to that of Ca2+ ions resulting from the calcium carbonate dissolution,
thus confirming that the latter was the main and the only responsible mechanism for
the MBD delivery.
A similar plot, but related to the HAP based hybrid, is shown in figure 5.13; differently
from the previous case the inhibitor release followed a double step mechanism with
an initial liberation of a small amount of dye occurring around pH 10 and a second
one taking place at pH 3.
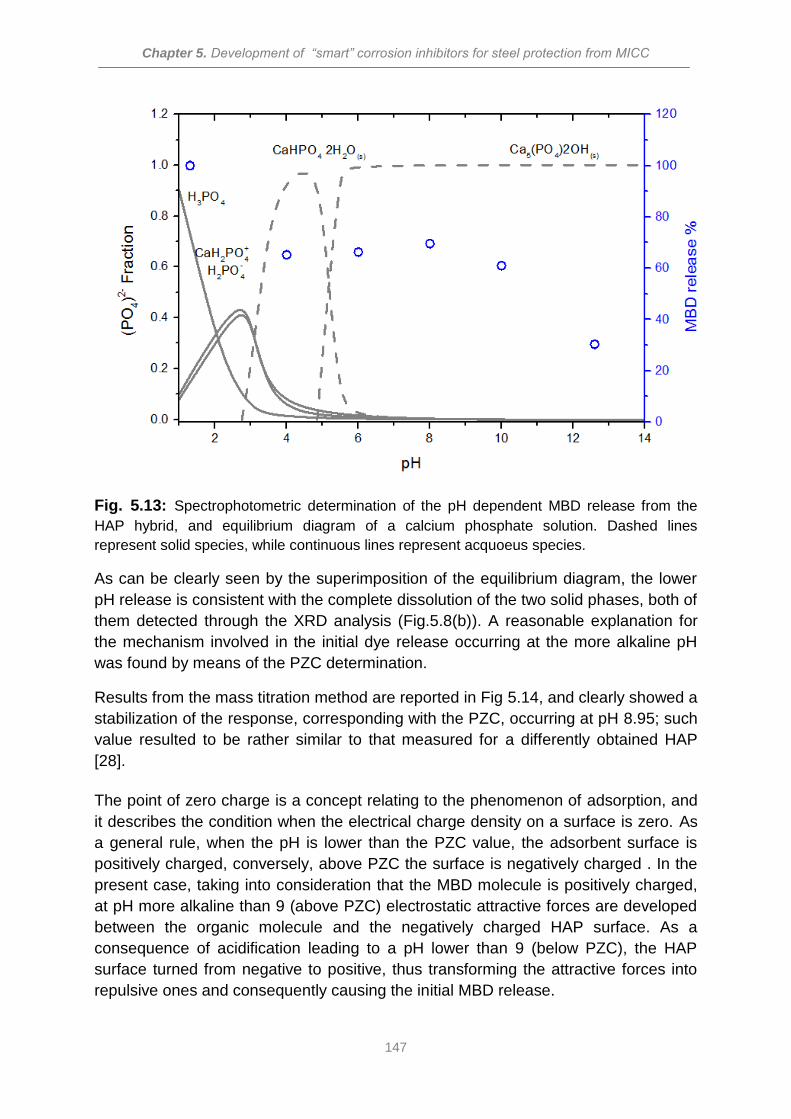
Chapter 5. Development of “smart” corrosion inhibitors for steel protection from MICC
147
Fig. 5.13: Spectrophotometric determination of the pH dependent MBD release from the
HAP hybrid, and equilibrium diagram of a calcium phosphate solution. Dashed lines
represent solid species, while continuous lines represent acquoeus species.
As can be clearly seen by the superimposition of the equilibrium diagram, the lower
pH release is consistent with the complete dissolution of the two solid phases, both of
them detected through the XRD analysis (Fig.5.8(b)). A reasonable explanation for
the mechanism involved in the initial dye release occurring at the more alkaline pH
was found by means of the PZC determination.
Results from the mass titration method are reported in Fig 5.14, and clearly showed a
stabilization of the response, corresponding with the PZC, occurring at pH 8.95; such
value resulted to be rather similar to that measured for a differently obtained HAP
[28].
The point of zero charge is a concept relating to the phenomenon of adsorption, and
it describes the condition when the electrical charge density on a surface is zero. As
a general rule, when the pH is lower than the PZC value, the adsorbent surface is
positively charged, conversely, above PZC the surface is negatively charged . In the
present case, taking into consideration that the MBD molecule is positively charged,
at pH more alkaline than 9 (above PZC) electrostatic attractive forces are developed
between the organic molecule and the negatively charged HAP surface. As a
consequence of acidification leading to a pH lower than 9 (below PZC), the HAP
surface turned from negative to positive, thus transforming the attractive forces into
repulsive ones and consequently causing the initial MBD release.
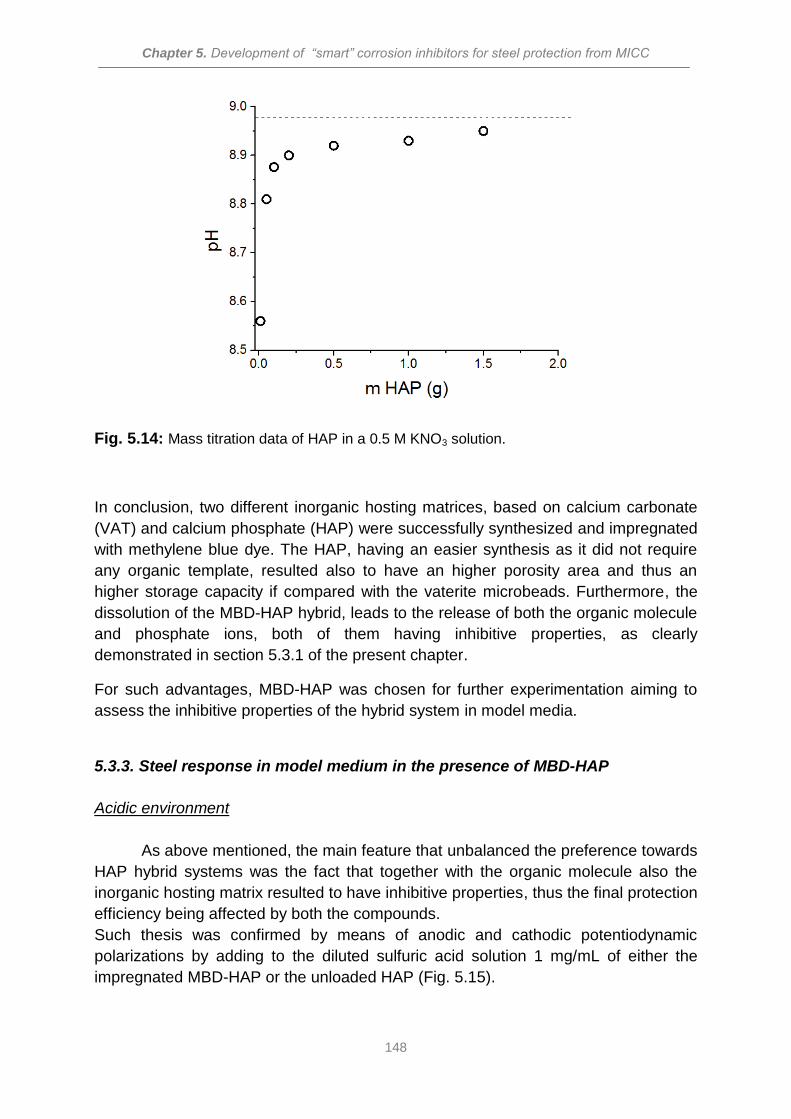
Chapter 5. Development of “smart” corrosion inhibitors for steel protection from MICC
148
Fig. 5.14: Mass titration data of HAP in a 0.5 M KNO3 solution.
In conclusion, two different inorganic hosting matrices, based on calcium carbonate
(VAT) and calcium phosphate (HAP) were successfully synthesized and impregnated
with methylene blue dye. The HAP, having an easier synthesis as it did not require
any organic template, resulted also to have an higher porosity area and thus an
higher storage capacity if compared with the vaterite microbeads. Furthermore, the
dissolution of the MBD-HAP hybrid, leads to the release of both the organic molecule
and phosphate ions, both of them having inhibitive properties, as clearly
demonstrated in section 5.3.1 of the present chapter.
For such advantages, MBD-HAP was chosen for further experimentation aiming to
assess the inhibitive properties of the hybrid system in model media.
5.3.3. Steel response in model medium in the presence of MBD-HAP
Acidic environment
As above mentioned, the main feature that unbalanced the preference towards
HAP hybrid systems was the fact that together with the organic molecule also the
inorganic hosting matrix resulted to have inhibitive properties, thus the final protection
efficiency being affected by both the compounds.
Such thesis was confirmed by means of anodic and cathodic potentiodynamic
polarizations by adding to the diluted sulfuric acid solution 1 mg/mL of either the
impregnated MBD-HAP or the unloaded HAP (Fig. 5.15).
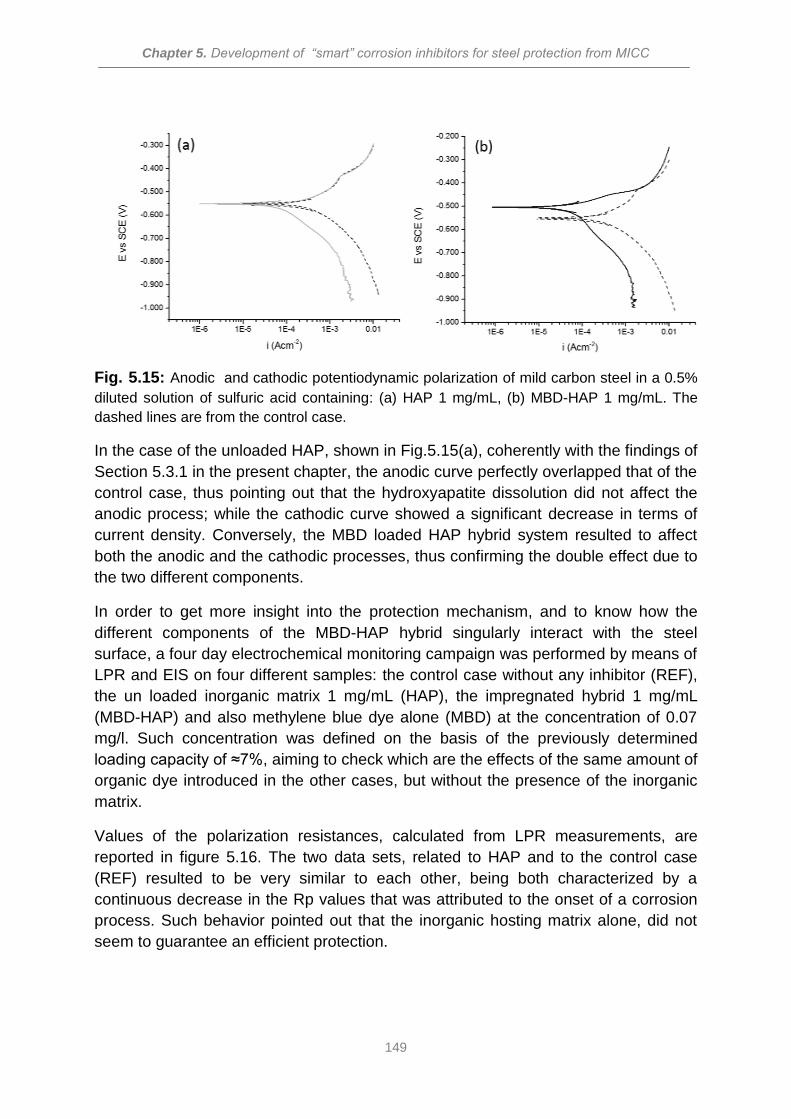
Chapter 5. Development of “smart” corrosion inhibitors for steel protection from MICC
149
Fig. 5.15: Anodic and cathodic potentiodynamic polarization of mild carbon steel in a 0.5%
diluted solution of sulfuric acid containing: (a) HAP 1 mg/mL, (b) MBD-HAP 1 mg/mL. The
dashed lines are from the control case.
In the case of the unloaded HAP, shown in Fig.5.15(a), coherently with the findings of
Section 5.3.1 in the present chapter, the anodic curve perfectly overlapped that of the
control case, thus pointing out that the hydroxyapatite dissolution did not affect the
anodic process; while the cathodic curve showed a significant decrease in terms of
current density. Conversely, the MBD loaded HAP hybrid system resulted to affect
both the anodic and the cathodic processes, thus confirming the double effect due to
the two different components.
In order to get more insight into the protection mechanism, and to know how the
different components of the MBD-HAP hybrid singularly interact with the steel
surface, a four day electrochemical monitoring campaign was performed by means of
LPR and EIS on four different samples: the control case without any inhibitor (REF),
the un loaded inorganic matrix 1 mg/mL (HAP), the impregnated hybrid 1 mg/mL
(MBD-HAP) and also methylene blue dye alone (MBD) at the concentration of 0.07
mg/l. Such concentration was defined on the basis of the previously determined
loading capacity of ≈7%, aiming to check which are the effects of the same amount of
organic dye introduced in the other cases, but without the presence of the inorganic
matrix.
Values of the polarization resistances, calculated from LPR measurements, are
reported in figure 5.16. The two data sets, related to HAP and to the control case
(REF) resulted to be very similar to each other, being both characterized by a
continuous decrease in the Rp values that was attributed to the onset of a corrosion
process. Such behavior pointed out that the inorganic hosting matrix alone, did not
seem to guarantee an efficient protection.
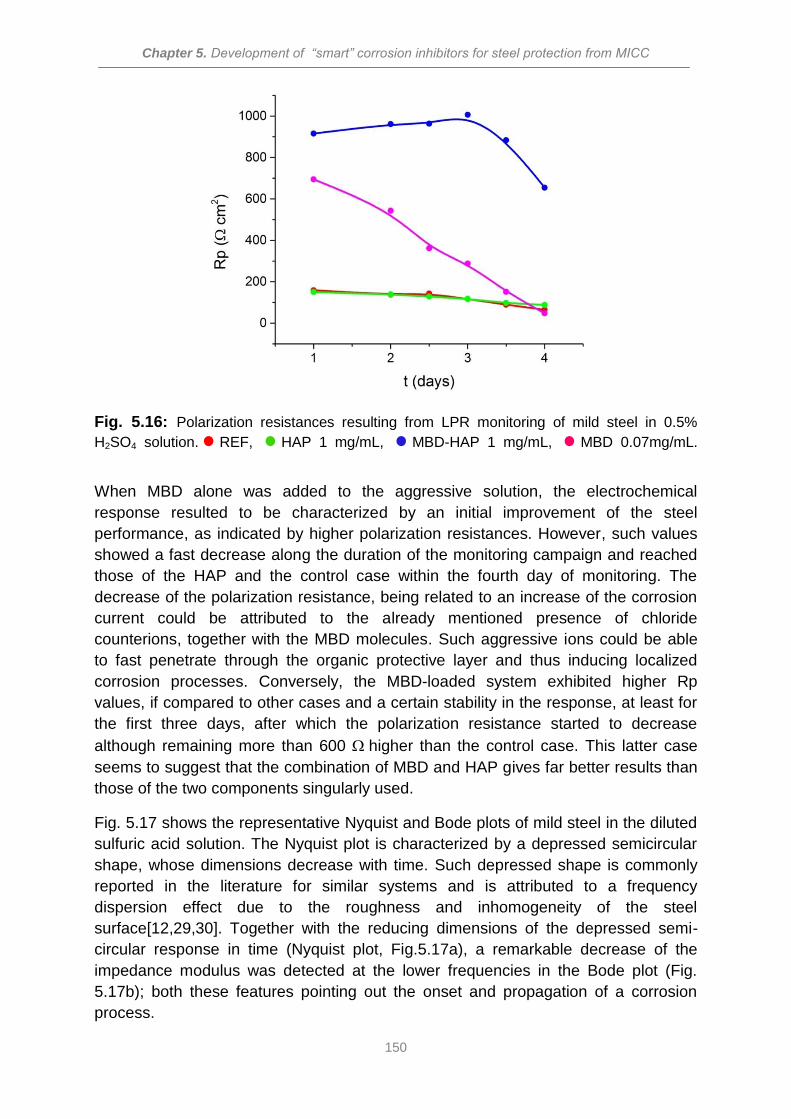
Chapter 5. Development of “smart” corrosion inhibitors for steel protection from MICC
150
Fig. 5.16: Polarization resistances resulting from LPR monitoring of mild steel in 0.5%
H2SO4 solution. REF, HAP 1 mg/mL, MBD-HAP 1 mg/mL, MBD 0.07mg/mL.
When MBD alone was added to the aggressive solution, the electrochemical
response resulted to be characterized by an initial improvement of the steel
performance, as indicated by higher polarization resistances. However, such values
showed a fast decrease along the duration of the monitoring campaign and reached
those of the HAP and the control case within the fourth day of monitoring. The
decrease of the polarization resistance, being related to an increase of the corrosion
current could be attributed to the already mentioned presence of chloride
counterions, together with the MBD molecules. Such aggressive ions could be able
to fast penetrate through the organic protective layer and thus inducing localized
corrosion processes. Conversely, the MBD-loaded system exhibited higher Rp
values, if compared to other cases and a certain stability in the response, at least for
the first three days, after which the polarization resistance started to decrease
although remaining more than 600 higher than the control case. This latter case
seems to suggest that the combination of MBD and HAP gives far better results than
those of the two components singularly used.
Fig. 5.17 shows the representative Nyquist and Bode plots of mild steel in the diluted
sulfuric acid solution. The Nyquist plot is characterized by a depressed semicircular
shape, whose dimensions decrease with time. Such depressed shape is commonly
reported in the literature for similar systems and is attributed to a frequency
dispersion effect due to the roughness and inhomogeneity of the steel
surface[12,29,30]. Together with the reducing dimensions of the depressed semi-
circular response in time (Nyquist plot, Fig.5.17a), a remarkable decrease of the
impedance modulus was detected at the lower frequencies in the Bode plot (Fig.
5.17b); both these features pointing out the onset and propagation of a corrosion
process.
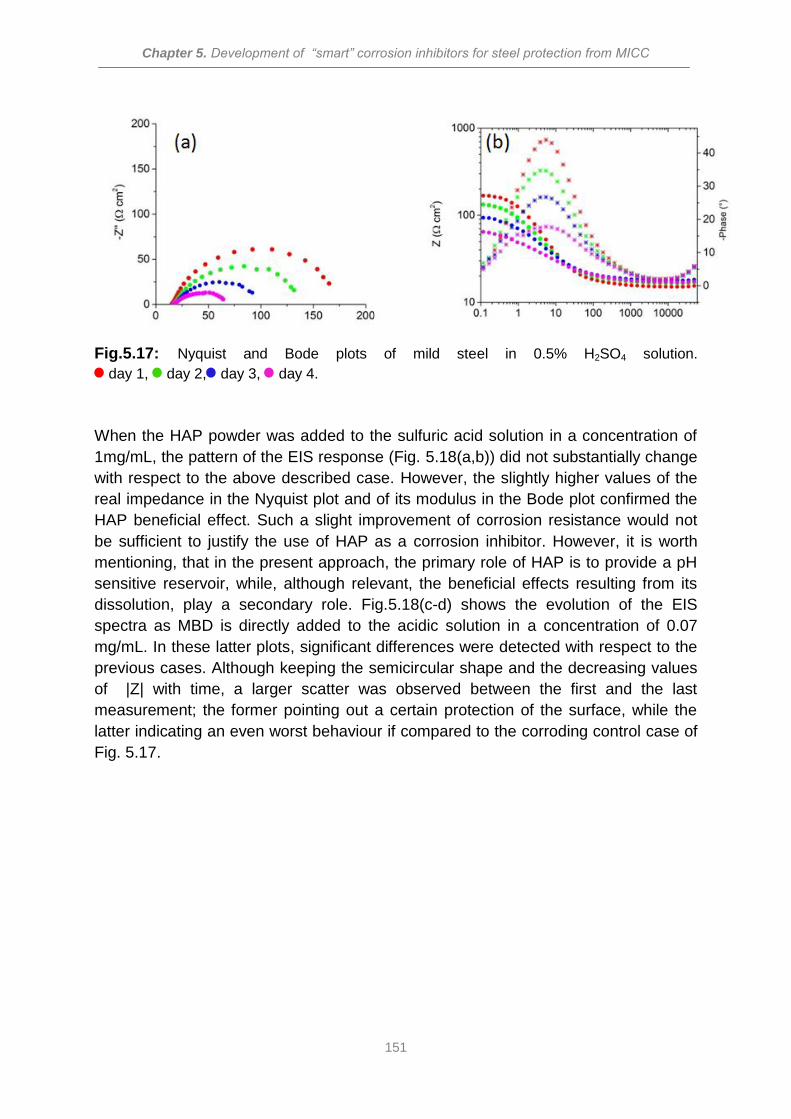
Chapter 5. Development of “smart” corrosion inhibitors for steel protection from MICC
151
Fig.5.17: Nyquist and Bode plots of mild steel in 0.5% H2SO4 solution.
day 1, day 2, day 3, day 4.
When the HAP powder was added to the sulfuric acid solution in a concentration of
1mg/mL, the pattern of the EIS response (Fig. 5.18(a,b)) did not substantially change
with respect to the above described case. However, the slightly higher values of the
real impedance in the Nyquist plot and of its modulus in the Bode plot confirmed the
HAP beneficial effect. Such a slight improvement of corrosion resistance would not
be sufficient to justify the use of HAP as a corrosion inhibitor. However, it is worth
mentioning, that in the present approach, the primary role of HAP is to provide a pH
sensitive reservoir, while, although relevant, the beneficial effects resulting from its
dissolution, play a secondary role. Fig.5.18(c-d) shows the evolution of the EIS
spectra as MBD is directly added to the acidic solution in a concentration of 0.07
mg/mL. In these latter plots, significant differences were detected with respect to the
previous cases. Although keeping the semicircular shape and the decreasing values
of |Z| with time, a larger scatter was observed between the first and the last
measurement; the former pointing out a certain protection of the surface, while the
latter indicating an even worst behaviour if compared to the corroding control case of
Fig. 5.17.
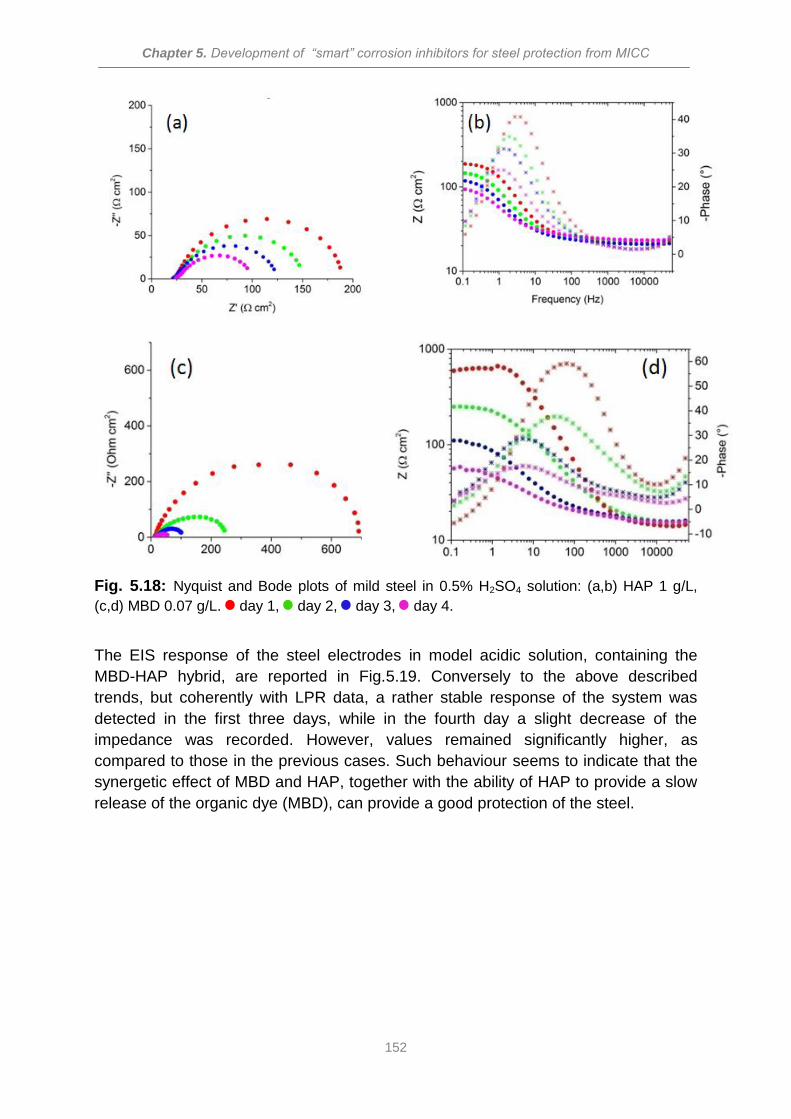
Chapter 5. Development of “smart” corrosion inhibitors for steel protection from MICC
152
Fig. 5.18: Nyquist and Bode plots of mild steel in 0.5% H2SO4 solution: (a,b) HAP 1 g/L,
(c,d) MBD 0.07 g/L. day 1, day 2, day 3, day 4.
The EIS response of the steel electrodes in model acidic solution, containing the
MBD-HAP hybrid, are reported in Fig.5.19. Conversely to the above described
trends, but coherently with LPR data, a rather stable response of the system was
detected in the first three days, while in the fourth day a slight decrease of the
impedance was recorded. However, values remained significantly higher, as
compared to those in the previous cases. Such behaviour seems to indicate that the
synergetic effect of MBD and HAP, together with the ability of HAP to provide a slow
release of the organic dye (MBD), can provide a good protection of the steel.
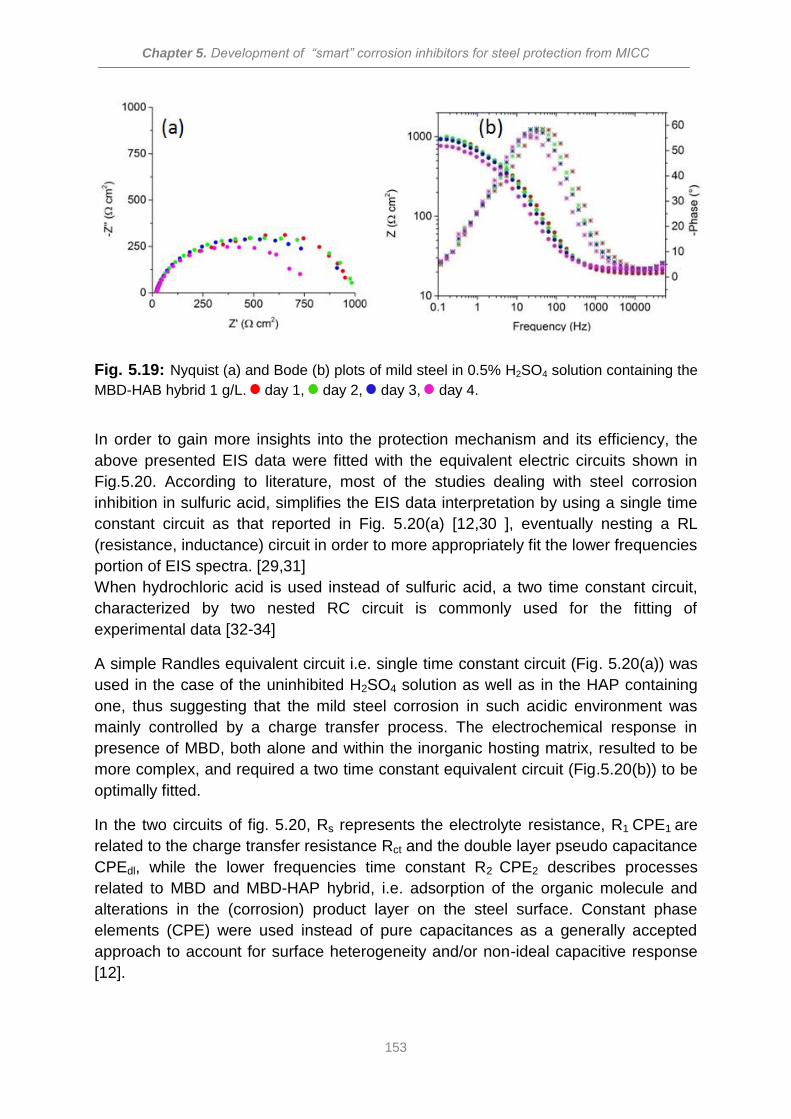
Chapter 5. Development of “smart” corrosion inhibitors for steel protection from MICC
153
Fig. 5.19: Nyquist (a) and Bode (b) plots of mild steel in 0.5% H2SO4 solution containing the
MBD-HAB hybrid 1 g/L. day 1, day 2, day 3, day 4.
In order to gain more insights into the protection mechanism and its efficiency, the
above presented EIS data were fitted with the equivalent electric circuits shown in
Fig.5.20. According to literature, most of the studies dealing with steel corrosion
inhibition in sulfuric acid, simplifies the EIS data interpretation by using a single time
constant circuit as that reported in Fig. 5.20(a) [12,30 ], eventually nesting a RL
(resistance, inductance) circuit in order to more appropriately fit the lower frequencies
portion of EIS spectra. [29,31]
When hydrochloric acid is used instead of sulfuric acid, a two time constant circuit,
characterized by two nested RC circuit is commonly used for the fitting of
experimental data [32-34]
A simple Randles equivalent circuit i.e. single time constant circuit (Fig. 5.20(a)) was
used in the case of the uninhibited H2SO4 solution as well as in the HAP containing
one, thus suggesting that the mild steel corrosion in such acidic environment was
mainly controlled by a charge transfer process. The electrochemical response in
presence of MBD, both alone and within the inorganic hosting matrix, resulted to be
more complex, and required a two time constant equivalent circuit (Fig.5.20(b)) to be
optimally fitted.
In the two circuits of fig. 5.20, Rs represents the electrolyte resistance, R1 CPE1 are
related to the charge transfer resistance Rct and the double layer pseudo capacitance
CPEdl, while the lower frequencies time constant R2 CPE2 describes processes
related to MBD and MBD-HAP hybrid, i.e. adsorption of the organic molecule and
alterations in the (corrosion) product layer on the steel surface. Constant phase
elements (CPE) were used instead of pure capacitances as a generally accepted
approach to account for surface heterogeneity and/or non-ideal capacitive response
[12].
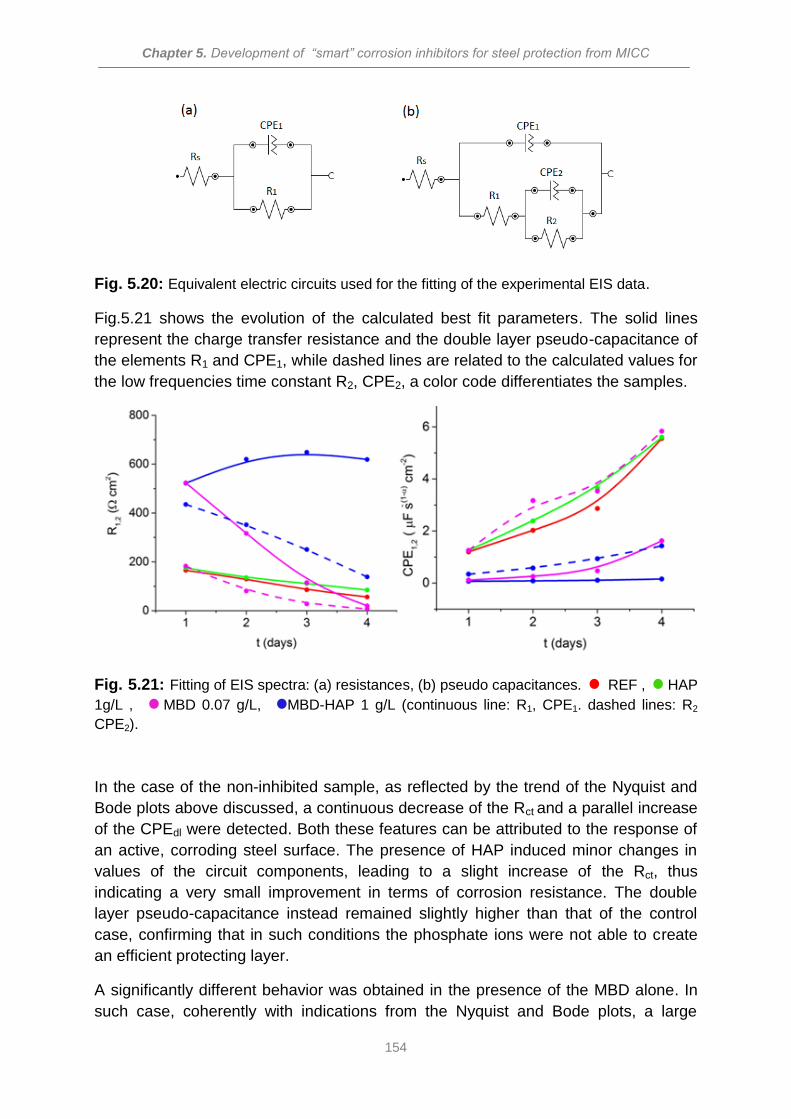
Chapter 5. Development of “smart” corrosion inhibitors for steel protection from MICC
154
Fig. 5.20: Equivalent electric circuits used for the fitting of the experimental EIS data.
Fig.5.21 shows the evolution of the calculated best fit parameters. The solid lines
represent the charge transfer resistance and the double layer pseudo-capacitance of
the elements R1 and CPE1, while dashed lines are related to the calculated values for
the low frequencies time constant R2, CPE2, a color code differentiates the samples.
Fig. 5.21: Fitting of EIS spectra: (a) resistances, (b) pseudo capacitances. REF , HAP
1g/L , MBD 0.07 g/L, MBD-HAP 1 g/L (continuous line: R1, CPE1. dashed lines: R2
CPE2).
In the case of the non-inhibited sample, as reflected by the trend of the Nyquist and
Bode plots above discussed, a continuous decrease of the Rct and a parallel increase
of the CPEdl were detected. Both these features can be attributed to the response of
an active, corroding steel surface. The presence of HAP induced minor changes in
values of the circuit components, leading to a slight increase of the Rct, thus
indicating a very small improvement in terms of corrosion resistance. The double
layer pseudo-capacitance instead remained slightly higher than that of the control
case, confirming that in such conditions the phosphate ions were not able to create
an efficient protecting layer.
A significantly different behavior was obtained in the presence of the MBD alone. In
such case, coherently with indications from the Nyquist and Bode plots, a large
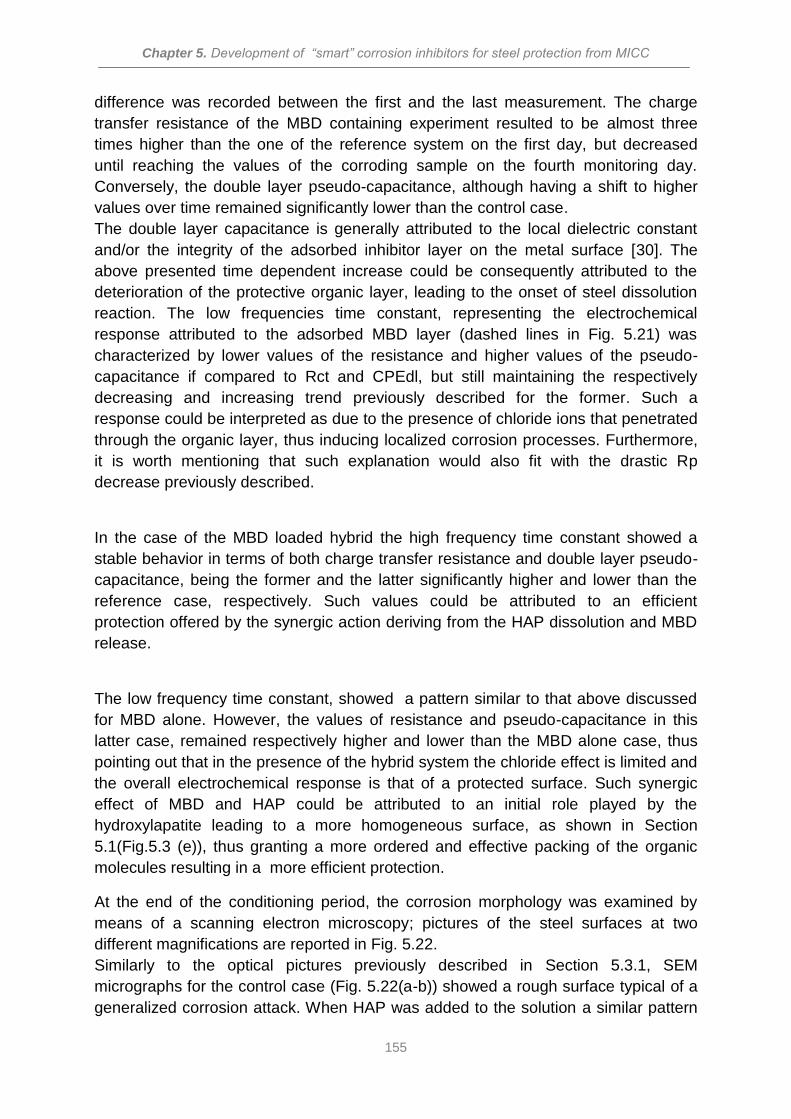
Chapter 5. Development of “smart” corrosion inhibitors for steel protection from MICC
155
difference was recorded between the first and the last measurement. The charge
transfer resistance of the MBD containing experiment resulted to be almost three
times higher than the one of the reference system on the first day, but decreased
until reaching the values of the corroding sample on the fourth monitoring day.
Conversely, the double layer pseudo-capacitance, although having a shift to higher
values over time remained significantly lower than the control case.
The double layer capacitance is generally attributed to the local dielectric constant
and/or the integrity of the adsorbed inhibitor layer on the metal surface [30]. The
above presented time dependent increase could be consequently attributed to the
deterioration of the protective organic layer, leading to the onset of steel dissolution
reaction. The low frequencies time constant, representing the electrochemical
response attributed to the adsorbed MBD layer (dashed lines in Fig. 5.21) was
characterized by lower values of the resistance and higher values of the pseudo-
capacitance if compared to Rct and CPEdl, but still maintaining the respectively
decreasing and increasing trend previously described for the former. Such a
response could be interpreted as due to the presence of chloride ions that penetrated
through the organic layer, thus inducing localized corrosion processes. Furthermore,
it is worth mentioning that such explanation would also fit with the drastic Rp
decrease previously described.
In the case of the MBD loaded hybrid the high frequency time constant showed a
stable behavior in terms of both charge transfer resistance and double layer pseudo-
capacitance, being the former and the latter significantly higher and lower than the
reference case, respectively. Such values could be attributed to an efficient
protection offered by the synergic action deriving from the HAP dissolution and MBD
release.
The low frequency time constant, showed a pattern similar to that above discussed
for MBD alone. However, the values of resistance and pseudo-capacitance in this
latter case, remained respectively higher and lower than the MBD alone case, thus
pointing out that in the presence of the hybrid system the chloride effect is limited and
the overall electrochemical response is that of a protected surface. Such synergic
effect of MBD and HAP could be attributed to an initial role played by the
hydroxylapatite leading to a more homogeneous surface, as shown in Section
5.1(Fig.5.3 (e)), thus granting a more ordered and effective packing of the organic
molecules resulting in a more efficient protection.
At the end of the conditioning period, the corrosion morphology was examined by
means of a scanning electron microscopy; pictures of the steel surfaces at two
different magnifications are reported in Fig. 5.22.
Similarly to the optical pictures previously described in Section 5.3.1, SEM
micrographs for the control case (Fig. 5.22(a-b)) showed a rough surface typical of a
generalized corrosion attack. When HAP was added to the solution a similar pattern
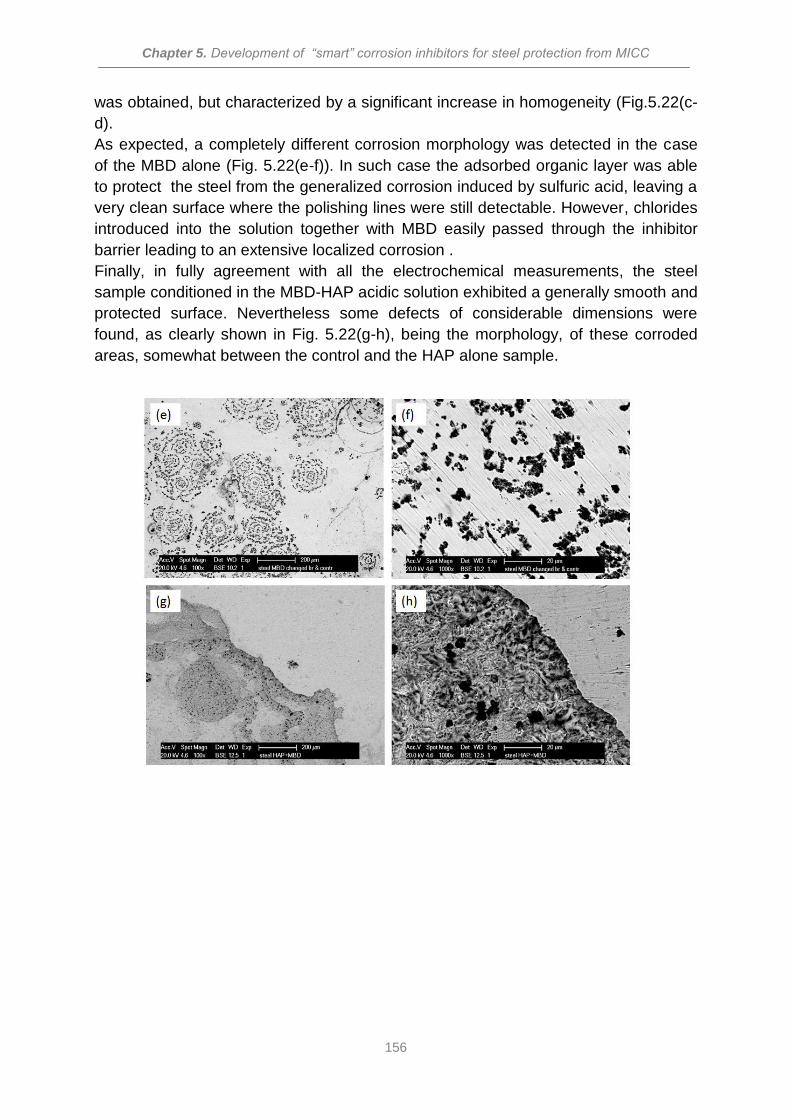
Chapter 5. Development of “smart” corrosion inhibitors for steel protection from MICC
156
was obtained, but characterized by a significant increase in homogeneity (Fig.5.22(c-
d).
As expected, a completely different corrosion morphology was detected in the case
of the MBD alone (Fig. 5.22(e-f)). In such case the adsorbed organic layer was able
to protect the steel from the generalized corrosion induced by sulfuric acid, leaving a
very clean surface where the polishing lines were still detectable. However, chlorides
introduced into the solution together with MBD easily passed through the inhibitor
barrier leading to an extensive localized corrosion .
Finally, in fully agreement with all the electrochemical measurements, the steel
sample conditioned in the MBD-HAP acidic solution exhibited a generally smooth and
protected surface. Nevertheless some defects of considerable dimensions were
found, as clearly shown in Fig. 5.22(g-h), being the morphology, of these corroded
areas, somewhat between the control and the HAP alone sample.
Chapter 5. Development of “smart” corrosion inhibitors for steel protection from MICC
157
Fig. 5.22: SEM pictures of the steel surface after a four days conditioning in diluted sulfuric
acid solution. (a-b) control. (c-d) HAP 1 mg/mL. (e-f) MBD 0.07 mg/mL. (g-h) MBD-HAP 1
mg/mL.
In conclusion, all the performed tests seem to indicate that beneficial effects are
obtained by the combination of the anodic organic inhibitor with the cathodic
inorganic one, resulting in an hybrid characterized by a mixed protective effect.
Conversely to the literature findings [10-11], MBD alone does not result to be a valid
inhibitor as it displaces from the less severe generalized corrosion to a more
insidious localized attack. However, phosphate ions, released as a consequence of
the inorganic matrix dissolution, significantly limited such a drawback.
Alkaline environment
Considering that the final objective of the present study is that of synthesizing
a "smart" inhibitor for reinforced concrete structures, before activation, it is expected
to remain exposed for long time to extremely alkaline environment due to the nature
of concrete. Thus, it seemed important to test if the presence of such compounds can
affect the steel passivation process.
At the highly alkaline pH of sound concrete the HAP should not dissolve and thus,
although a small release of MBD superficially adsorbed is possible during the cement
hydration, the bigger fraction is expected to remain entrapped into the HAP inorganic
matrix. For such a reason, differently from test in acidic environment, only three
cases will be considered:
- Saturated Ca(OH)2 solution (pH 12.6) as control case
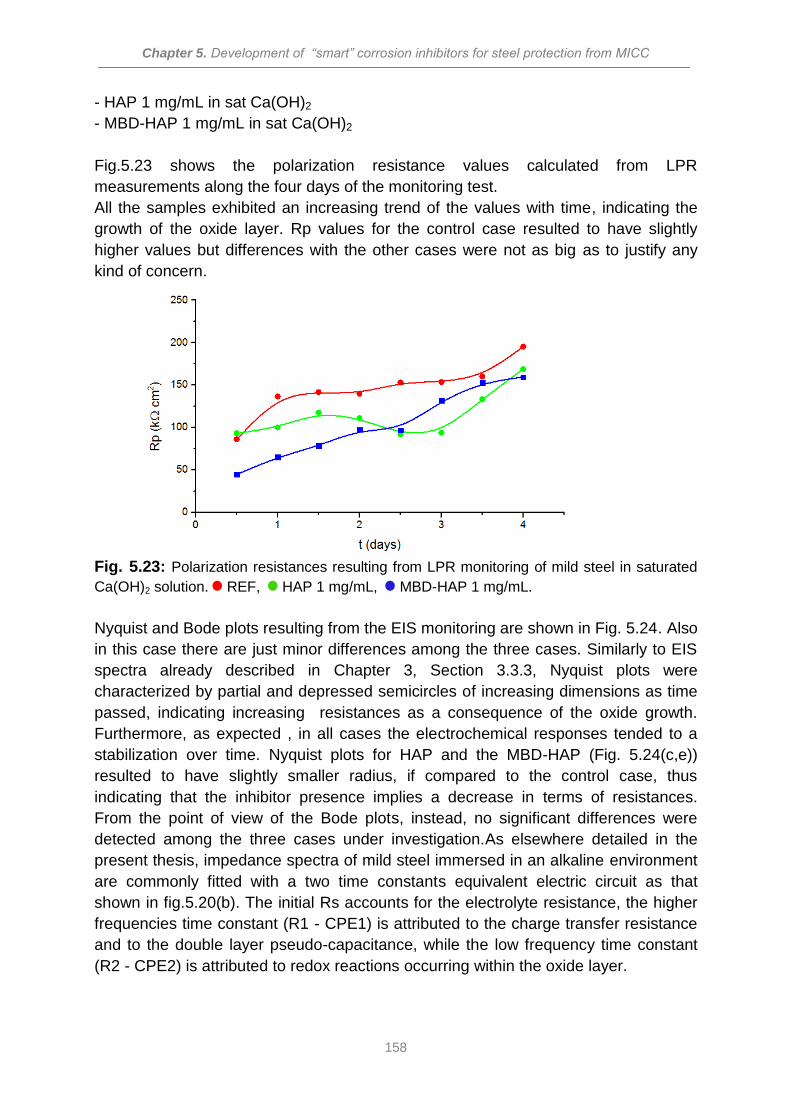
Chapter 5. Development of “smart” corrosion inhibitors for steel protection from MICC
158
- HAP 1 mg/mL in sat Ca(OH)2
- MBD-HAP 1 mg/mL in sat Ca(OH)2
Fig.5.23 shows the polarization resistance values calculated from LPR
measurements along the four days of the monitoring test.
All the samples exhibited an increasing trend of the values with time, indicating the
growth of the oxide layer. Rp values for the control case resulted to have slightly
higher values but differences with the other cases were not as big as to justify any
kind of concern.
Fig. 5.23: Polarization resistances resulting from LPR monitoring of mild steel in saturated
Ca(OH)2 solution. REF, HAP 1 mg/mL, MBD-HAP 1 mg/mL.
Nyquist and Bode plots resulting from the EIS monitoring are shown in Fig. 5.24. Also
in this case there are just minor differences among the three cases. Similarly to EIS
spectra already described in Chapter 3, Section 3.3.3, Nyquist plots were
characterized by partial and depressed semicircles of increasing dimensions as time
passed, indicating increasing resistances as a consequence of the oxide growth.
Furthermore, as expected , in all cases the electrochemical responses tended to a
stabilization over time. Nyquist plots for HAP and the MBD-HAP (Fig. 5.24(c,e))
resulted to have slightly smaller radius, if compared to the control case, thus
indicating that the inhibitor presence implies a decrease in terms of resistances.
From the point of view of the Bode plots, instead, no significant differences were
detected among the three cases under investigation.As elsewhere detailed in the
present thesis, impedance spectra of mild steel immersed in an alkaline environment
are commonly fitted with a two time constants equivalent electric circuit as that
shown in fig.5.20(b). The initial Rs accounts for the electrolyte resistance, the higher
frequencies time constant (R1 - CPE1) is attributed to the charge transfer resistance
and to the double layer pseudo-capacitance, while the low frequency time constant
(R2 - CPE2) is attributed to redox reactions occurring within the oxide layer.
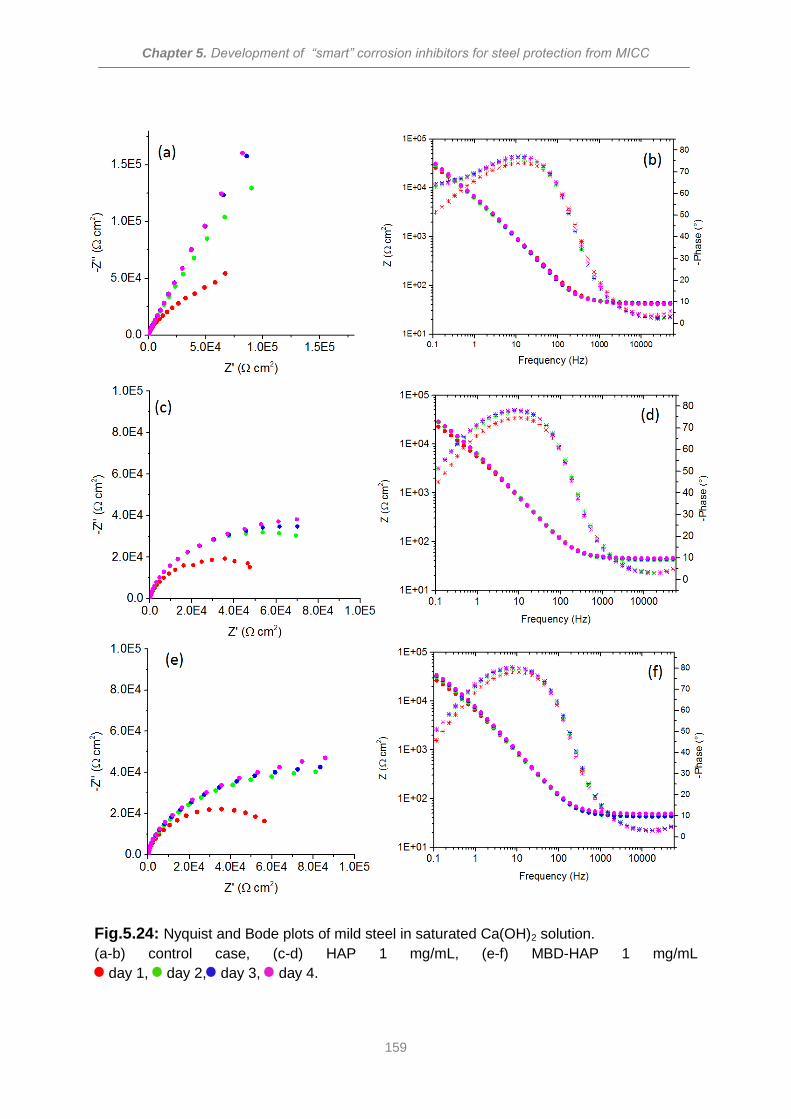
Chapter 5. Development of “smart” corrosion inhibitors for steel protection from MICC
159
Fig.5.24: Nyquist and Bode plots of mild steel in saturated Ca(OH)2 solution.
(a-b) control case, (c-d) HAP 1 mg/mL, (e-f) MBD-HAP 1 mg/mL
day 1, day 2, day 3, day 4.
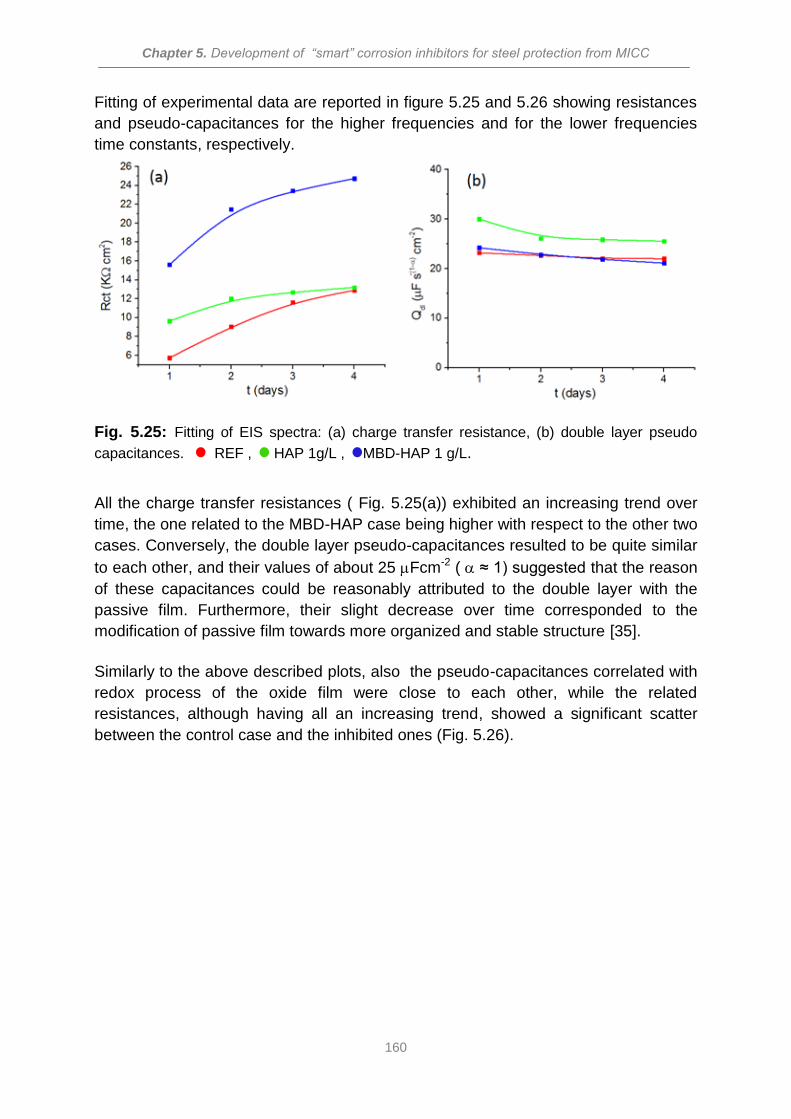
Chapter 5. Development of “smart” corrosion inhibitors for steel protection from MICC
160
Fitting of experimental data are reported in figure 5.25 and 5.26 showing resistances
and pseudo-capacitances for the higher frequencies and for the lower frequencies
time constants, respectively.
Fig. 5.25: Fitting of EIS spectra: (a) charge transfer resistance, (b) double layer pseudo
capacitances. REF , HAP 1g/L , MBD-HAP 1 g/L.
All the charge transfer resistances ( Fig. 5.25(a)) exhibited an increasing trend over
time, the one related to the MBD-HAP case being higher with respect to the other two
cases. Conversely, the double layer pseudo-capacitances resulted to be quite similar
to each other, and their values of about 25 Fcm-2 ( ≈ 1) suggested that the reason
of these capacitances could be reasonably attributed to the double layer with the
passive film. Furthermore, their slight decrease over time corresponded to the
modification of passive film towards more organized and stable structure [35].
Similarly to the above described plots, also the pseudo-capacitances correlated with
redox process of the oxide film were close to each other, while the related
resistances, although having all an increasing trend, showed a significant scatter
between the control case and the inhibited ones (Fig. 5.26).
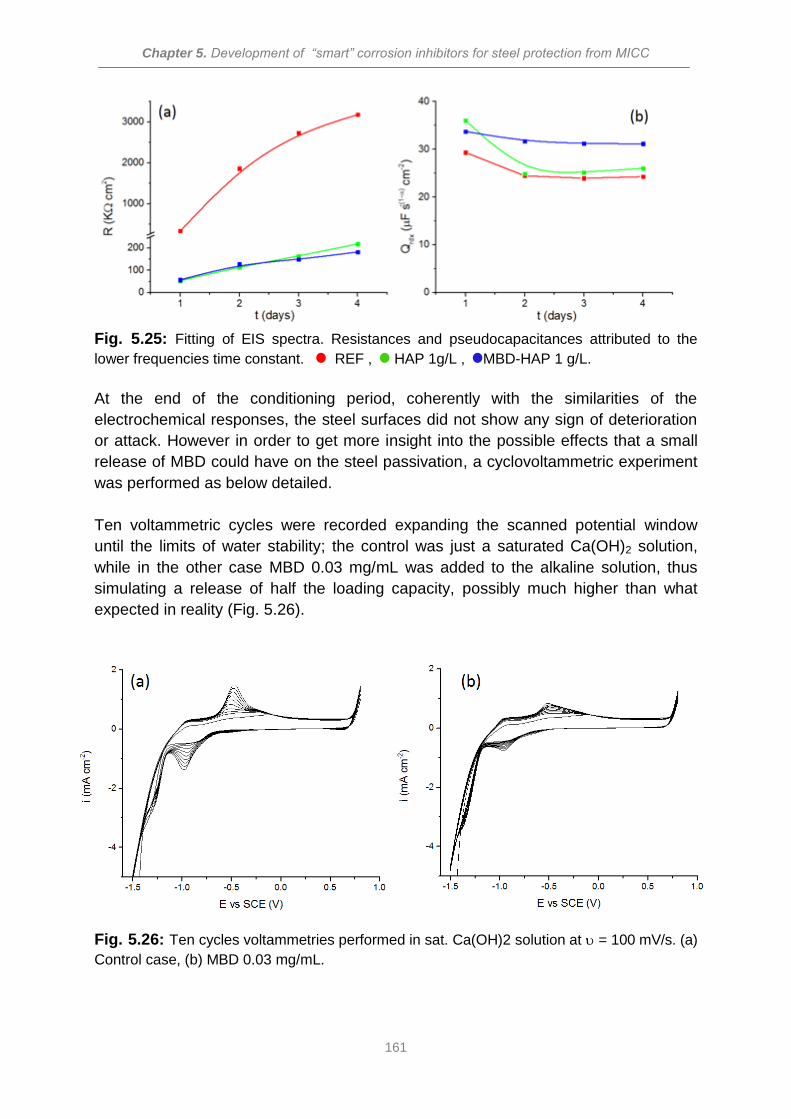
Chapter 5. Development of “smart” corrosion inhibitors for steel protection from MICC
161
Fig. 5.25: Fitting of EIS spectra. Resistances and pseudocapacitances attributed to the
lower frequencies time constant. REF , HAP 1g/L , MBD-HAP 1 g/L.
At the end of the conditioning period, coherently with the similarities of the
electrochemical responses, the steel surfaces did not show any sign of deterioration
or attack. However in order to get more insight into the possible effects that a small
release of MBD could have on the steel passivation, a cyclovoltammetric experiment
was performed as below detailed.
Ten voltammetric cycles were recorded expanding the scanned potential window
until the limits of water stability; the control was just a saturated Ca(OH)2 solution,
while in the other case MBD 0.03 mg/mL was added to the alkaline solution, thus
simulating a release of half the loading capacity, possibly much higher than what
expected in reality (Fig. 5.26).
Fig. 5.26: Ten cycles voltammetries performed in sat. Ca(OH)2 solution at = 100 mV/s. (a)
Control case, (b) MBD 0.03 mg/mL.
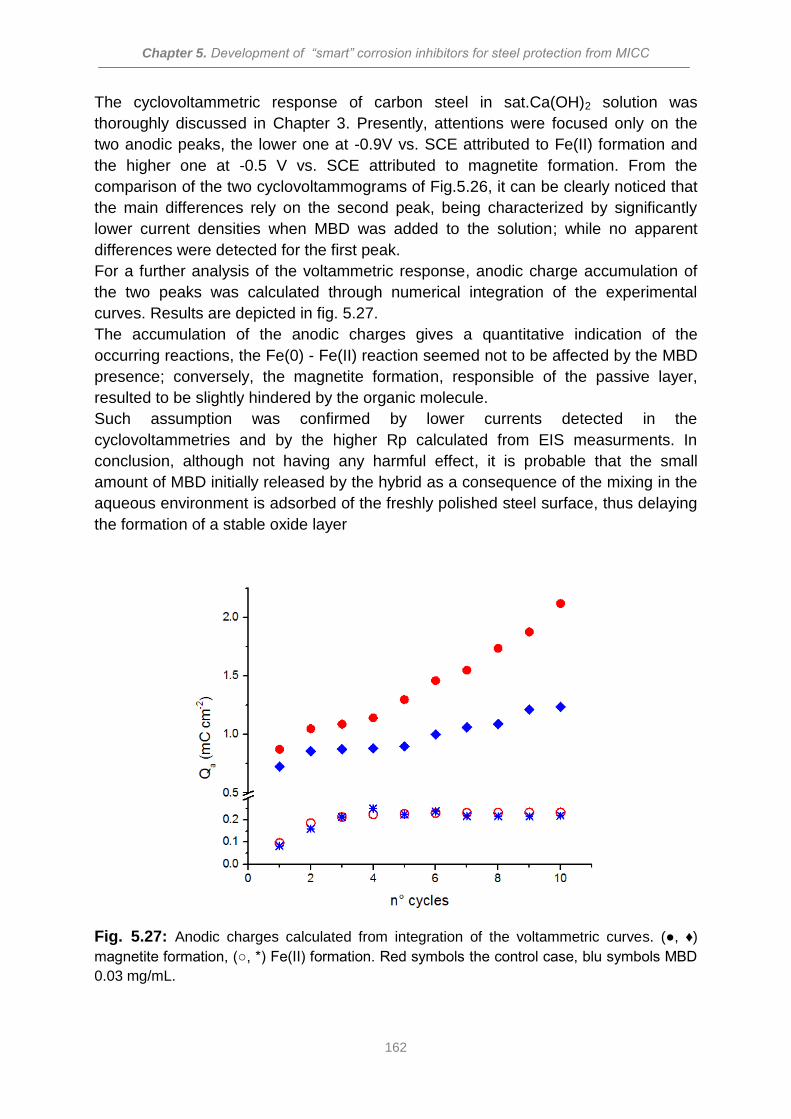
Chapter 5. Development of “smart” corrosion inhibitors for steel protection from MICC
162
The cyclovoltammetric response of carbon steel in sat.Ca(OH)2 solution was
thoroughly discussed in Chapter 3. Presently, attentions were focused only on the
two anodic peaks, the lower one at -0.9V vs. SCE attributed to Fe(II) formation and
the higher one at -0.5 V vs. SCE attributed to magnetite formation. From the
comparison of the two cyclovoltammograms of Fig.5.26, it can be clearly noticed that
the main differences rely on the second peak, being characterized by significantly
lower current densities when MBD was added to the solution; while no apparent
differences were detected for the first peak.
For a further analysis of the voltammetric response, anodic charge accumulation of
the two peaks was calculated through numerical integration of the experimental
curves. Results are depicted in fig. 5.27.
The accumulation of the anodic charges gives a quantitative indication of the
occurring reactions, the Fe(0) - Fe(II) reaction seemed not to be affected by the MBD
presence; conversely, the magnetite formation, responsible of the passive layer,
resulted to be slightly hindered by the organic molecule.
Such assumption was confirmed by lower currents detected in the
cyclovoltammetries and by the higher Rp calculated from EIS measurments. In
conclusion, although not having any harmful effect, it is probable that the small
amount of MBD initially released by the hybrid as a consequence of the mixing in the
aqueous environment is adsorbed of the freshly polished steel surface, thus delaying
the formation of a stable oxide layer
Fig. 5.27: Anodic charges calculated from integration of the voltammetric curves. (, ♦)
magnetite formation, (, *) Fe(II) formation. Red symbols the control case, blu symbols MBD
0.03 mg/mL.
Chapter 5. Development of “smart” corrosion inhibitors for steel protection from MICC
163
5.4 Conclusions
Aiming to develop an efficient smart inhibitor able to protect the steel rebars
from corrosion induced by the acidification arising as a consequence of SOB, an
initial screening of different inhibitors was performed in order to select the most
promising ones.
Among all the tested inhibitors, trisodium sulfate was chosen because of its cathodic
action and because of an already wide literature assessing its efficiency in RC
structure protection. Furthermore MBD, although not resulting fully convincing
because of the presence of chlorides as counterions, provided a good inhibition of
the anodic process.
MBD was initially immobilized into a vaterite matrix, being its release fully due to the
inorganic host dissolution occurring a pH lower than 6. However, because of the low
porosity of vaterite, the storage capacity resulted to be extremely low.
A much more porous matrix was synthesized by reacting tri-sodium phosphate with a
calcium salt, thus obtaining a highly porous, hydroxylapatite characterized by a
higher loading capacity that could be easily impregnated with MBD.
In such way, together with the slow release of the organic molecule granted by the
matrix dissolution, a further beneficial effect was obtained by phosphate ions
liberated from the matrix itself.
Electrochemical tests performed in simulated acidic solutions pointed out a significant
improvement of the corrosion resistance due to the synergic effect of the MBD-HAP
system, while the components (MBD and HAP) do not provide a satisfactory
protection if separately used.
Taking into consideration that such hybrid inhibitors should remain dispersed into the
cementitious matrix and inactive for a long time, until a pH drop triggers the MBD
release, a series of electrochemical tests were performed aiming to asses possible
implications on the steel passivation. Results pointed out that a small release of the
superficially adsorbed MBD was possible at early stage even at the more alkaline pH,
and that could lead to a delay in the passive layer formation, being adsorbed on the
steel surface. However, at the end of the test in the alkaline solution the steel
surfaces were not affected by the inhibitor presence.
Chapter 5. Development of “smart” corrosion inhibitors for steel protection from MICC
164
References
[1] T.A. Soylev, M.G. Richardson, Corrosion inhibitions for steel in concrete: State
of the art report, Construction and Building Materials 22 (2008) 609-622.
[2] M. Diamanti, E. Perez Rosales, G. Raffaini, F. Ganazzoli, A. Brenna, M.
Pedeferri, M. Ormellese, Molecular modeling and electrochemical evaluation of
organic inhibitors in concrete, Corrosion Science (2015) 231-241.
[3] C. Monticelli, A. Frignani, G. Trabanelli, A study on corrosion inhibitors for
concrete application, Cement and Concrete Research, 30 (2000) 635-642.
[4] M. Ormellese, L. Lazzari, S. Goidanich, G. Fuomagalli, A. Brenna, A study on
organic substances as inhibitors for chloride induced corrosion in concrete,
Corrosion Science, 51 (2009) 2959-2968.
[5] G. Trabanelli, C. Monticelli, V. Grassi, A. Frignani, Electrochemical study on
inhibitors of rebar corrosion in carbonated concrete, Cement and Concrete
research 35 (2005) 1804-1813.
[6] Y. Tang, G. Zhang, Y. Zuo, The inhibition effects of several inhibitors on reba in
acidified concrete pore solution, Construction and Building Materials 28 (2012)
327-332.
[7] M. Tommaselli, N. Mariano, S. Kuri, Effectiveness of corrosion inhibitors in
saturates calcium hydroxide solutions acidified by acid rain components,
Construction and Building Materials 23 (2009) 328-333.
[8] D. Bastidas, M. Criado, V. La Iglesia, S. Fajardo, J.M. Bastidas, Comparative
study of three sodium phosphate as corrosion inhibitors for steel
reinforcements, Cem. Concr. Comp. 43 (2013) 31-38.
[9] E.E. Oguzie, Y. Li , F.H. Wang, Effect of cysteine on the corrosion behaviour of
low carbon steel in sulphuric acid, Electrochimica Acta, 2 ( 2007), 909-914.
[10] E.E. Oguzie, G.N. Onuoha, A.I. Onuchukwu, Inhibitory mechanism of mild steel
corrosion in 2 M sulphuric acid solution by methylene blue dye, Mat. Chem. and
Phys. Vol. 89, 2-3 (2005), 305-311.
[11] O Benali, L Larabi, S Merah, Y Harek, Influence of the Methylene Blue Dye
(MBD) on the corrosion inhibition of mild steel in 0.5 M sulphuric acid, Part I:
weight loss and electrochemical studies, J. Mater. Environ. Sci. 2 (2011) 39-48.
[12] A. Doner, R. Solmaz, M. Ozcan, G. Cardas, Experimental and theoretical
studies of thiazoles as corrosion inhibitors for mild steel in sulphuric acid
solution, Corr. Sci. 53 (2011) 2902-2913.
Chapter 5. Development of “smart” corrosion inhibitors for steel protection from MICC
165
[13] M. Quraishi, J. Rawat, Inhibition of mild steel corrosion by some macrocyclic
compounds in hot and concentrated hydrochloric acid, Mater. Chem. Phys. 73
(2002) 118-122.
[14] M.A. Hegazy, H.M. Ahmed, A.S. El-Tabei, Investigation of the inhibitive effect of
p-substituted 4-(N,N,N-dimethyldodecylammonium bromide) benzylidene -
benzene-2-yl-amine on corrosion of carbon steel pipelines in acidic medium,
Corros. Sci. 53 (2011) 671-678.
[15] D. Snihirova, S. Lamaka, M. Taryba, A. Salak, S, Kallip, M. Zheludkevich, M.
Ferreira, M. Montemor, Hydroxyapatite microparticles as feed back active
reservoirs of corrosion inhibitors, Applied Materials and Interfaces, Vol.2 n° 11
(2010) 301-3022.
[16] J. Hu, D.A. Koleva, P. Petrov, K. van Breugel, Polymeric vesicles for corrosion
control in reinforced mortar: electrochemical behavior, steel surface analysis
and bulk matrix properties, Corrosion Science 65 (2012) 414-430.
[17] M. Montemor D. Snihirova, M. Taryba S. Lamaka, I. Kartsonakis, A. Balaskas,
G. Kordas, J. Tedim, A. Kuznestova, M. Zheludkevich, M. Ferreira, Evaluation
of self-healing ability in protective coating modified with combinations of layered
double hydroxides and cerium molibdate nanocontaines filled with corrosion
inhibitors, Electrochimica Acta 60 (2012) 31-40.
[18] D. Snihirova, S. Lamaka, M.F. Montemor, Smart protective ability of water
based epoxy coating loaded with CaCO3microbeads impregnated with corrosion
inhibitors applied on AA2024 substrates, Electrochim. Acta, 83 (2012) 439-447.
[19] H. Tong, W. Ma, L. Wang, P. Wan, J. Hu, L. Cao; Control over crystal phase,
shape, size and aggragation of calcium carbonate via a L-aspartic acid inducing
process, Biomaterials 25 (2004) 3923-3929.
[20] A. Popova , M. Christov, Evaluation of impedance measurements on mild steel
corrosion in acid media in the presence of heterocyclic compounds, Corr. Sci.
Vol. 48 10 (2006) 3208-3221.
[21] M. A. Quraishi, M. A. Wajid Khan, M. Ajmal, S. Muralidharan, S. V. Iyer,
Influence of substituted benzothiazoles on corrosion in acid solution,J. App.
Electrochem., Vol. 26 12 (1996), 1253-1258.
[22] K. M. Ismail, Evaluation of cysteine as environmentally friendly corrosion
inhibitor for copper in neutral and acidic chloride solutions, Electrochimica Acta,
Vol. 52 28 (2007) 7811-7819.
[23] C. Piccirillo, S. Perni, J. Gil-Thomas, P. Prokopovich ,M. Wilson, J. Pratten, I. P.
Parkin; Antimicrobial activity of methylene blue and toluidine blue O covalently
bound to a modified silicone polymer surface, J.Mater.Chem. Vol 19 (2009)
6167-617.
Chapter 5. Development of “smart” corrosion inhibitors for steel protection from MICC
166
[24] Kacem I, Laurent T, Blanchemain N, Neut C, Chai F, Haulon S, Hildebrand H,
Martel B. Dyeing and antibacterial activation with methylene blue of a
cyclodextrin modified polyester vascular graft, J Biomed Mater Res A, 102(9)
(2014) 2942-2951.
[25] I.M Zin, S.B. Lyon, V.I. Pokhmurskii; Corrosion control of galvanized steel using
a phosphate/calcium ion inhibitor mixture, Corr, Sci. 45 (2003) 777-788.
[26] Z. Szklarska-Smialowska, J. Mankowski, Centre Belge d'etude e de
documentation des eaux 20 (1967) 474.
[27] I. Puigdomenech, MEDUSA software, Royal Institute of technology, Stockholm,
1992.
[28] D. Luna-Zaragoza, E. T. Romero-Guzmán, L. R. Reyes-Gutiérrez, Surface and
Physicochemical Characterization of Phosphates Vivianite and Hydroxyapatite;
J. of Minerals & Materials Characterization & Engineering, 8 (2009) 591-609.
[29] K. Khaled, M. Amin, Corrosion monitoring of mild steel in sulfuric acid solutions
in presence of some thiazole derivatives, Corr. Sci. 51 (2009) 1964-1975.
[30] A. Farag, M. Hegazy, Synergistic inhibition effect of potassium iodide and
noveshiff bases on X65 steel corrosion in 0.5 M H2SO4, Corr. Sci. 74 (2013)
168-177.
[31] X. Zheng, S. Zhang, W.Li, L. Yin, J. He, J.Wu, Investigation of 1-butyl-3-methyl-
1H-benzimidazolium iodide as inhibitor for mild steel in sulfuric acid solution,
Corrosion Science 80 (2014) 383-392.
[32] M. Tourabi, K. Nohair, M. Traisnel, C. Jama, F. Bentiss; Electrochemical and
XPS studies of the corrosion inhibition of carbon steel in hydrochloric acid
pickling solutions by 3,5-bis(2-thienylmethyl)-4-amino-1,2,4-triazole, Corrosion
Science 75 (2013) 123-133.
[33] S.E. Nataraja, T.V. Venkatesha, K. Manjunatha, Boja Poojary, M.K. Pavithra,
H.C. Tandon, Inhibition of the corrosion of steel in hydrochloric acid solution by
some organic molecules containing the methylthiophenyl moiety, Corrosion
Science 53 (2011) 2651-2659.
[34] N.S. Ayati, S. Khandandel, M. Momeni, M.H. Moayed , A. Davoodi , M.
Rahimizadeh; Inhibitive effect of synthesized 2-(3-pyridyl)-3,4-dihydro-4-
quinazolinone as acorrosion inhibitor for mild steel in hydrochloric acid,
Materials Chemistry and Physics 126 (2011) 873-879.
[35] N. Etteyeb, L. Dhouibi, H. Takenouti, M.C. Alonso, E. Triki, Corrosion inhibition
of carbon steel in alkaline chloride media by Na3PO4, Electrochimica Acta 52
(2007) 7506-7512.
Chapter 6. Preliminary tests of the "Smart" inhibitors in the cementitious matrix
167
Chapter 6.
Preliminary tests of the
"Smart" inhibitors in the
cementitious matrix
Reinforced concrete is a composite material whose performance comes from
the merging of concrete and steel properties. As a consequence, a key point in the
development of solutions aiming to improve the performance or the durability of
either the cementitious matrix or the steel reinforcing bars, is the assessment of
eventual side effects on the other elements of the composite. The effects of MBD-
HAP hybrid inhibitor on the properties of the cementitious matrix in terms of both
hydration rate and strength development were carefully evaluated by means of
isothermal calorimetry and standard compressive strength tests. Once excluded the
onset of negative side effects, reinforced mortar samples containing different amount
of the unloaded HAP and of the hybrid MBD-HAP were cast and exposed to a diluted
sulfuric acid environment for about four months. Howeve, such a conditioning period
proved not to be long enough to induce the corrosion of the steel reinforcing bars.
Chapter 6. Preliminary tests of the "Smart" inhibitors in the cementitious matrix
168
6.1 Introduction
The previous chapter, dealing with the synthesis, characterization, and
electrochemical testing in model media of hybrid "smart" inhibitors, pointed out
promising features for the methylene blue/hydroxyapatite system (MBD-HAP), being
characterized by high porosity, yielding to a high storage capacity and a pH triggered
release of the organic molecules. Moreover, conversely to the majority of "smart"
inhibitive systems, where reservoirs are just meant to protect the active compounds
until their release, in the present case, the dissolution of the inorganic hosting matrix
also plays a key role in the protection of the steel surface. The validation of the
inhibitor efficiency in model media, although valuable indication of its performance, is
however extremely far from a real situation, where the steel rebar are embedded into
a cementitious matrix. Furthermore, it has to be considered that reinforced concrete
is a composite material, and that what may have beneficial effects in terms of the
steel protection could result, on the other hand, in detrimental effects on the
cementitious matrix properties. It is often emphasized that chemical admixtures, can
lead to collateral issues such as stiffness, variation of initial slump, large slump loss
as well as modifications of the mechanical properties of the hardened cementitious
matrix [1]. The evaluation of possible interactions between cement and chemical
admixtures can be performed by focusing on the short term, that is, investigating how
admixtures affect the cement hydration reaction, or alternatively measuring, in the
long term, the mechanical properties evolution of the hardened paste. According to
literature a common method for the investigation of the early stage of cement
hydration is the thermal calorimetry [2-4], while the long term physical properties can
be easily evaluated my means of the determination of compressive strength [5,6].
6.2 Experimental
6.2.1 Materials and samples
Mortar samples were produced in the shapes of cubes (40x40x40 mm) for
standard compressive strength tests and of reinforced cylinders (ø = 32 mm, h = 100
mm) for corrosion monitoring purposes. In both cases, casting was performed
according to EN 196-1 norm, using standard sand, CEM I 42.5 R cement type and
tap water; the water cement ratio was set to 0.5. Seven sets of samples were cast,
each one constituted by 6 mortar cubes, and 5 reinforced mortar cylinders. Among
the different series, one had no inhibitors; of the remaining six, three contained HAP
and three contained MBD-HAP at concentrations of 0.02%, 0.1% and 0.5%
expressed as percentages of dry cement. Reinforced mortar cylinders had a
FeB500HKN carbon steel rebar embedded in the middle (ø = 6 mm, h = 100 mm).
Before casting, the rust deposits on the steel surface were carefully removed by
brushing and its upper extremity was protected by means of a thermal shrinkable
insulating sheath as to leave an exposed length of 70 mm (fig.6.1). Mortar samples
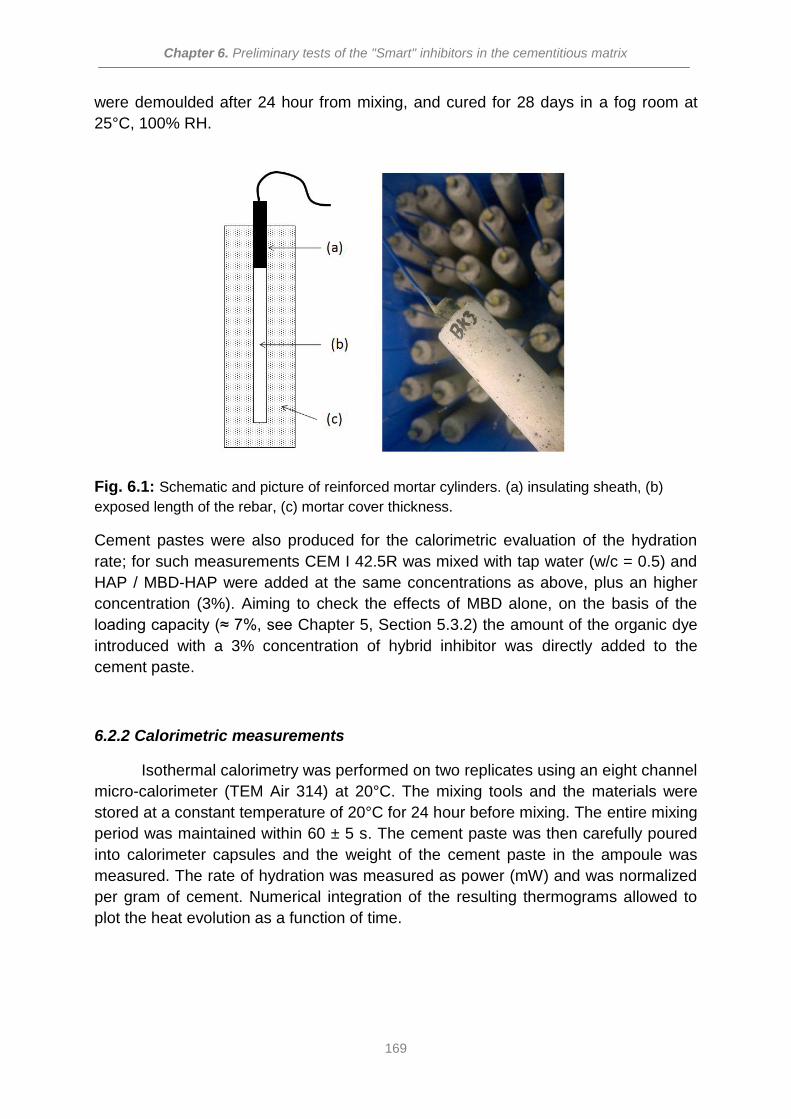
Chapter 6. Preliminary tests of the "Smart" inhibitors in the cementitious matrix
169
were demoulded after 24 hour from mixing, and cured for 28 days in a fog room at
25°C, 100% RH.
Fig. 6.1: Schematic and picture of reinforced mortar cylinders. (a) insulating sheath, (b)
exposed length of the rebar, (c) mortar cover thickness.
Cement pastes were also produced for the calorimetric evaluation of the hydration
rate; for such measurements CEM I 42.5R was mixed with tap water (w/c = 0.5) and
HAP / MBD-HAP were added at the same concentrations as above, plus an higher
concentration (3%). Aiming to check the effects of MBD alone, on the basis of the
loading capacity (≈ 7%, see Chapter 5, Section 5.3.2) the amount of the organic dye
introduced with a 3% concentration of hybrid inhibitor was directly added to the
cement paste.
6.2.2 Calorimetric measurements
Isothermal calorimetry was performed on two replicates using an eight channel
micro-calorimeter (TEM Air 314) at 20°C. The mixing tools and the materials were
stored at a constant temperature of 20°C for 24 hour before mixing. The entire mixing
period was maintained within 60 ± 5 s. The cement paste was then carefully poured
into calorimeter capsules and the weight of the cement paste in the ampoule was
measured. The rate of hydration was measured as power (mW) and was normalized
per gram of cement. Numerical integration of the resulting thermograms allowed to
plot the heat evolution as a function of time.
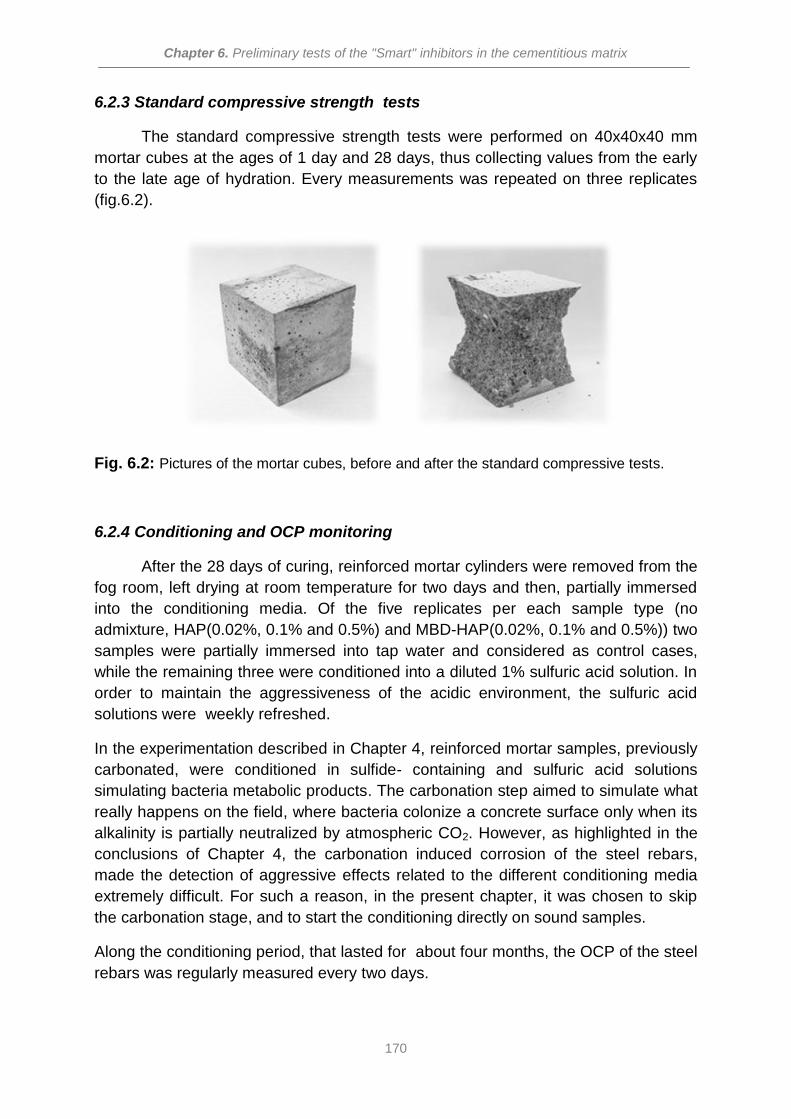
Chapter 6. Preliminary tests of the "Smart" inhibitors in the cementitious matrix
170
6.2.3 Standard compressive strength tests
The standard compressive strength tests were performed on 40x40x40 mm
mortar cubes at the ages of 1 day and 28 days, thus collecting values from the early
to the late age of hydration. Every measurements was repeated on three replicates
(fig.6.2).
Fig. 6.2: Pictures of the mortar cubes, before and after the standard compressive tests.
6.2.4 Conditioning and OCP monitoring
After the 28 days of curing, reinforced mortar cylinders were removed from the
fog room, left drying at room temperature for two days and then, partially immersed
into the conditioning media. Of the five replicates per each sample type (no
admixture, HAP(0.02%, 0.1% and 0.5%) and MBD-HAP(0.02%, 0.1% and 0.5%)) two
samples were partially immersed into tap water and considered as control cases,
while the remaining three were conditioned into a diluted 1% sulfuric acid solution. In
order to maintain the aggressiveness of the acidic environment, the sulfuric acid
solutions were weekly refreshed.
In the experimentation described in Chapter 4, reinforced mortar samples, previously
carbonated, were conditioned in sulfide- containing and sulfuric acid solutions
simulating bacteria metabolic products. The carbonation step aimed to simulate what
really happens on the field, where bacteria colonize a concrete surface only when its
alkalinity is partially neutralized by atmospheric CO2. However, as highlighted in the
conclusions of Chapter 4, the carbonation induced corrosion of the steel rebars,
made the detection of aggressive effects related to the different conditioning media
extremely difficult. For such a reason, in the present chapter, it was chosen to skip
the carbonation stage, and to start the conditioning directly on sound samples.
Along the conditioning period, that lasted for about four months, the OCP of the steel
rebars was regularly measured every two days.
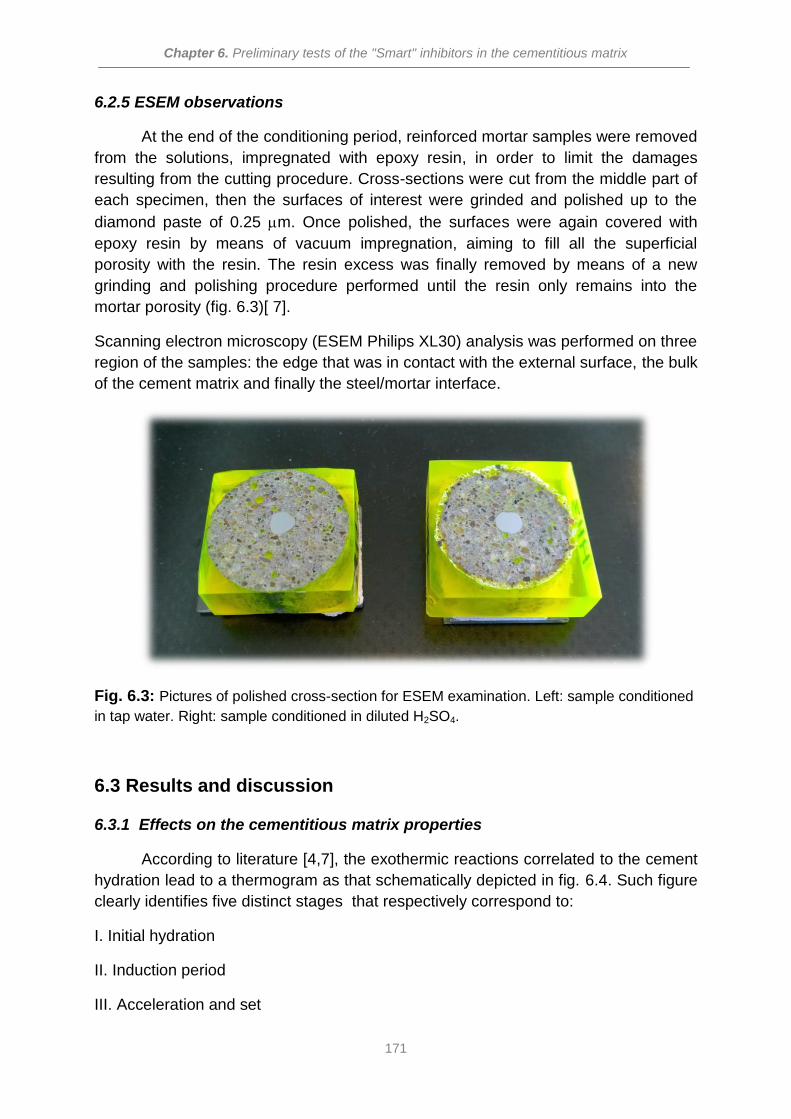
Chapter 6. Preliminary tests of the "Smart" inhibitors in the cementitious matrix
171
6.2.5 ESEM observations
At the end of the conditioning period, reinforced mortar samples were removed
from the solutions, impregnated with epoxy resin, in order to limit the damages
resulting from the cutting procedure. Cross-sections were cut from the middle part of
each specimen, then the surfaces of interest were grinded and polished up to the
diamond paste of 0.25 m. Once polished, the surfaces were again covered with
epoxy resin by means of vacuum impregnation, aiming to fill all the superficial
porosity with the resin. The resin excess was finally removed by means of a new
grinding and polishing procedure performed until the resin only remains into the
mortar porosity (fig. 6.3)[ 7].
Scanning electron microscopy (ESEM Philips XL30) analysis was performed on three
region of the samples: the edge that was in contact with the external surface, the bulk
of the cement matrix and finally the steel/mortar interface.
Fig. 6.3: Pictures of polished cross-section for ESEM examination. Left: sample conditioned
in tap water. Right: sample conditioned in diluted H2SO4.
6.3 Results and discussion
6.3.1 Effects on the cementitious matrix properties
According to literature [4,7], the exothermic reactions correlated to the cement
hydration lead to a thermogram as that schematically depicted in fig. 6.4. Such figure
clearly identifies five distinct stages that respectively correspond to:
I. Initial hydration
II. Induction period
III. Acceleration and set
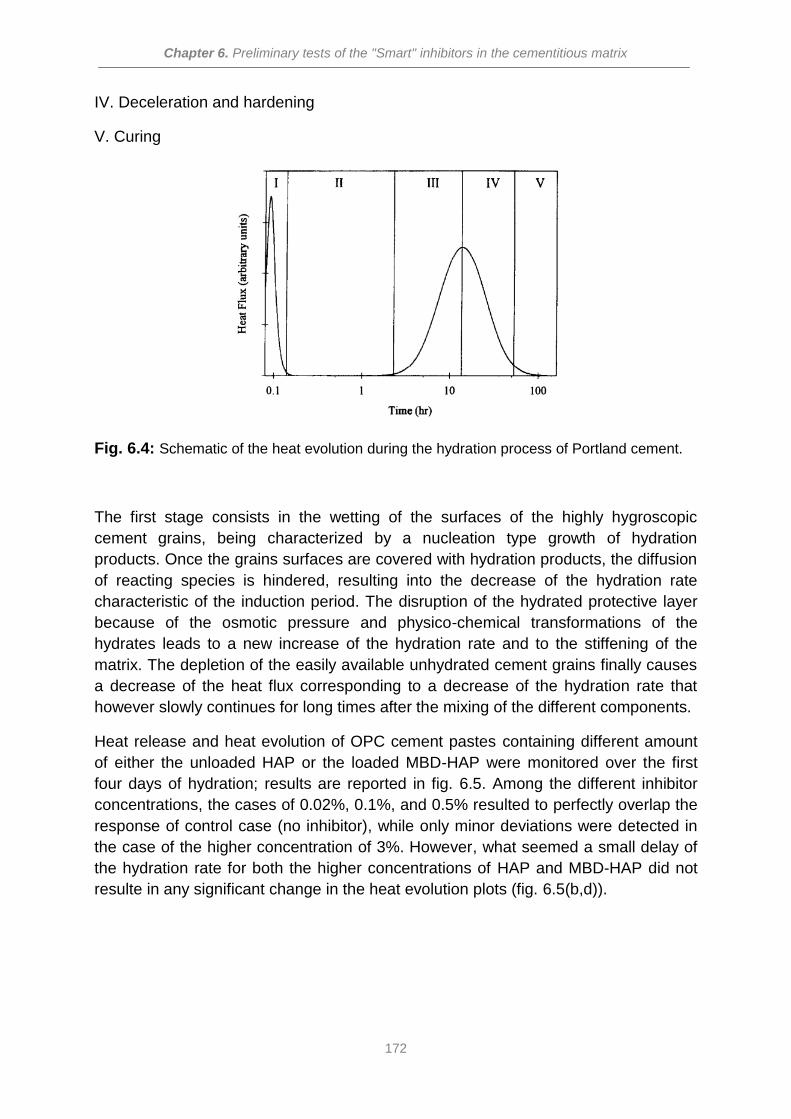
Chapter 6. Preliminary tests of the "Smart" inhibitors in the cementitious matrix
172
IV. Deceleration and hardening
V. Curing
Fig. 6.4: Schematic of the heat evolution during the hydration process of Portland cement.
The first stage consists in the wetting of the surfaces of the highly hygroscopic
cement grains, being characterized by a nucleation type growth of hydration
products. Once the grains surfaces are covered with hydration products, the diffusion
of reacting species is hindered, resulting into the decrease of the hydration rate
characteristic of the induction period. The disruption of the hydrated protective layer
because of the osmotic pressure and physico-chemical transformations of the
hydrates leads to a new increase of the hydration rate and to the stiffening of the
matrix. The depletion of the easily available unhydrated cement grains finally causes
a decrease of the heat flux corresponding to a decrease of the hydration rate that
however slowly continues for long times after the mixing of the different components.
Heat release and heat evolution of OPC cement pastes containing different amount
of either the unloaded HAP or the loaded MBD-HAP were monitored over the first
four days of hydration; results are reported in fig. 6.5. Among the different inhibitor
concentrations, the cases of 0.02%, 0.1%, and 0.5% resulted to perfectly overlap the
response of control case (no inhibitor), while only minor deviations were detected in
the case of the higher concentration of 3%. However, what seemed a small delay of
the hydration rate for both the higher concentrations of HAP and MBD-HAP did not
resulte in any significant change in the heat evolution plots (fig. 6.5(b,d)).
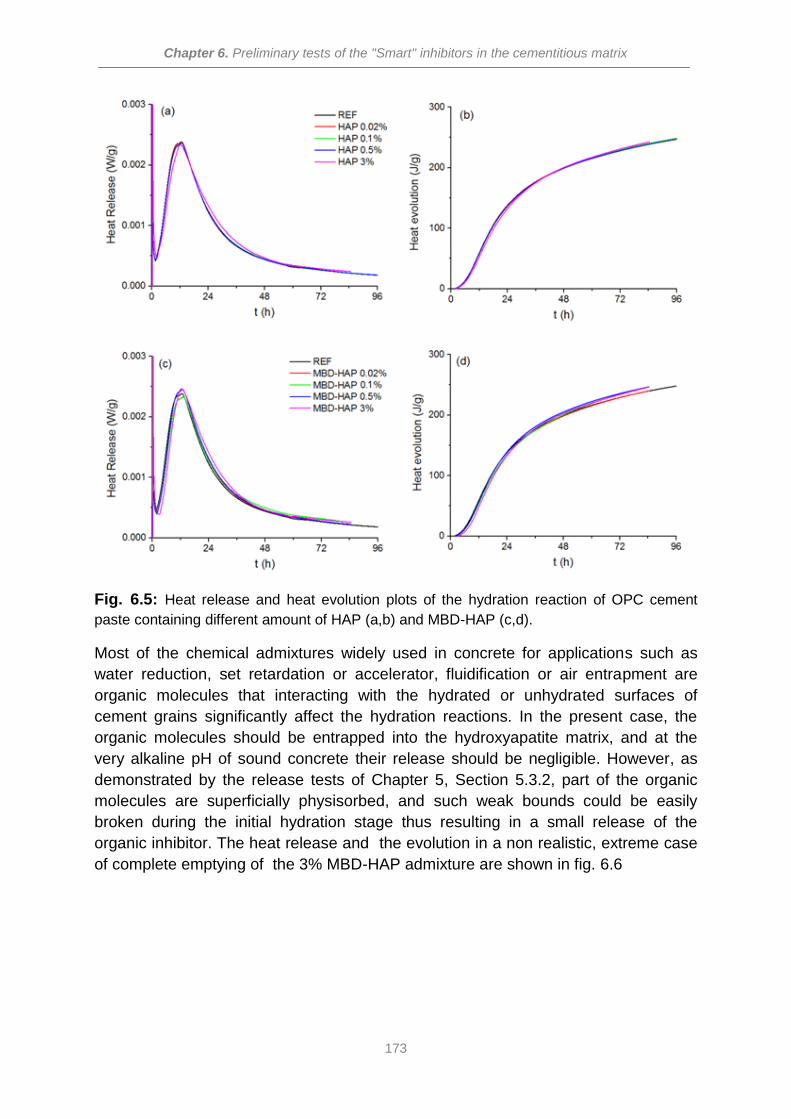
Chapter 6. Preliminary tests of the "Smart" inhibitors in the cementitious matrix
173
Fig. 6.5: Heat release and heat evolution plots of the hydration reaction of OPC cement
paste containing different amount of HAP (a,b) and MBD-HAP (c,d).
Most of the chemical admixtures widely used in concrete for applications such as
water reduction, set retardation or accelerator, fluidification or air entrapment are
organic molecules that interacting with the hydrated or unhydrated surfaces of
cement grains significantly affect the hydration reactions. In the present case, the
organic molecules should be entrapped into the hydroxyapatite matrix, and at the
very alkaline pH of sound concrete their release should be negligible. However, as
demonstrated by the release tests of Chapter 5, Section 5.3.2, part of the organic
molecules are superficially physisorbed, and such weak bounds could be easily
broken during the initial hydration stage thus resulting in a small release of the
organic inhibitor. The heat release and the evolution in a non realistic, extreme case
of complete emptying of the 3% MBD-HAP admixture are shown in fig. 6.6
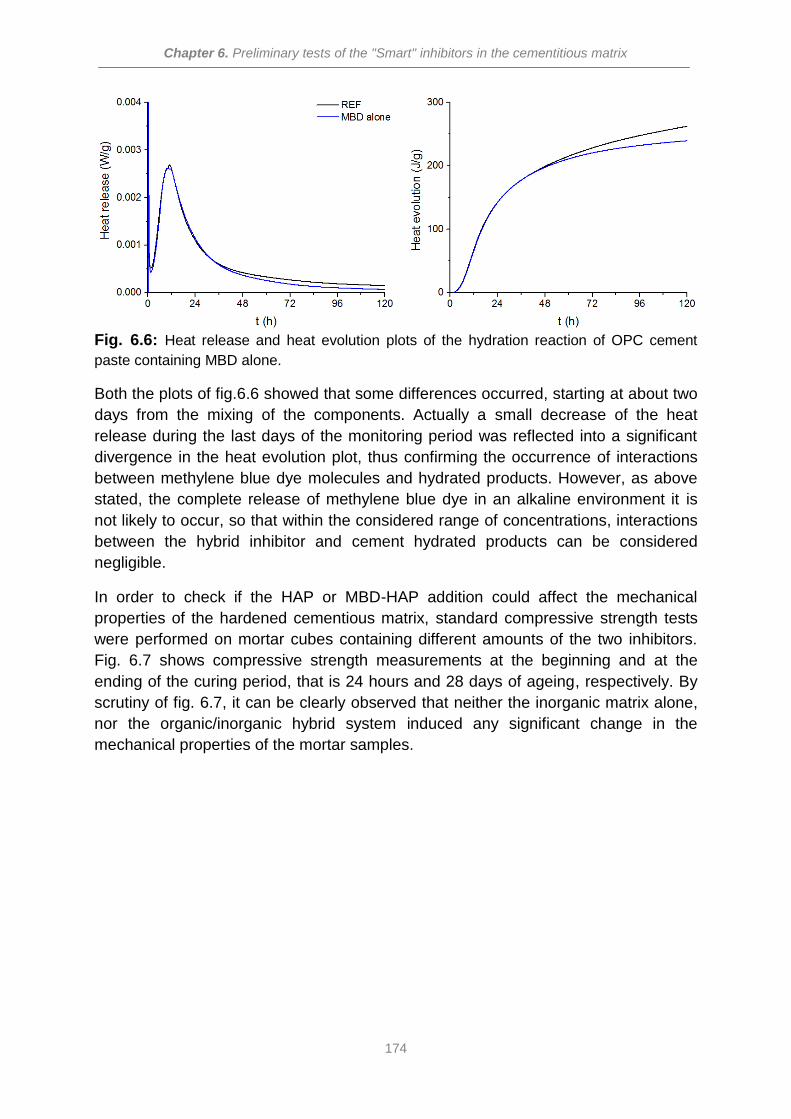
Chapter 6. Preliminary tests of the "Smart" inhibitors in the cementitious matrix
174
Fig. 6.6: Heat release and heat evolution plots of the hydration reaction of OPC cement
paste containing MBD alone.
Both the plots of fig.6.6 showed that some differences occurred, starting at about two
days from the mixing of the components. Actually a small decrease of the heat
release during the last days of the monitoring period was reflected into a significant
divergence in the heat evolution plot, thus confirming the occurrence of interactions
between methylene blue dye molecules and hydrated products. However, as above
stated, the complete release of methylene blue dye in an alkaline environment it is
not likely to occur, so that within the considered range of concentrations, interactions
between the hybrid inhibitor and cement hydrated products can be considered
negligible.
In order to check if the HAP or MBD-HAP addition could affect the mechanical
properties of the hardened cementious matrix, standard compressive strength tests
were performed on mortar cubes containing different amounts of the two inhibitors.
Fig. 6.7 shows compressive strength measurements at the beginning and at the
ending of the curing period, that is 24 hours and 28 days of ageing, respectively. By
scrutiny of fig. 6.7, it can be clearly observed that neither the inorganic matrix alone,
nor the organic/inorganic hybrid system induced any significant change in the
mechanical properties of the mortar samples.
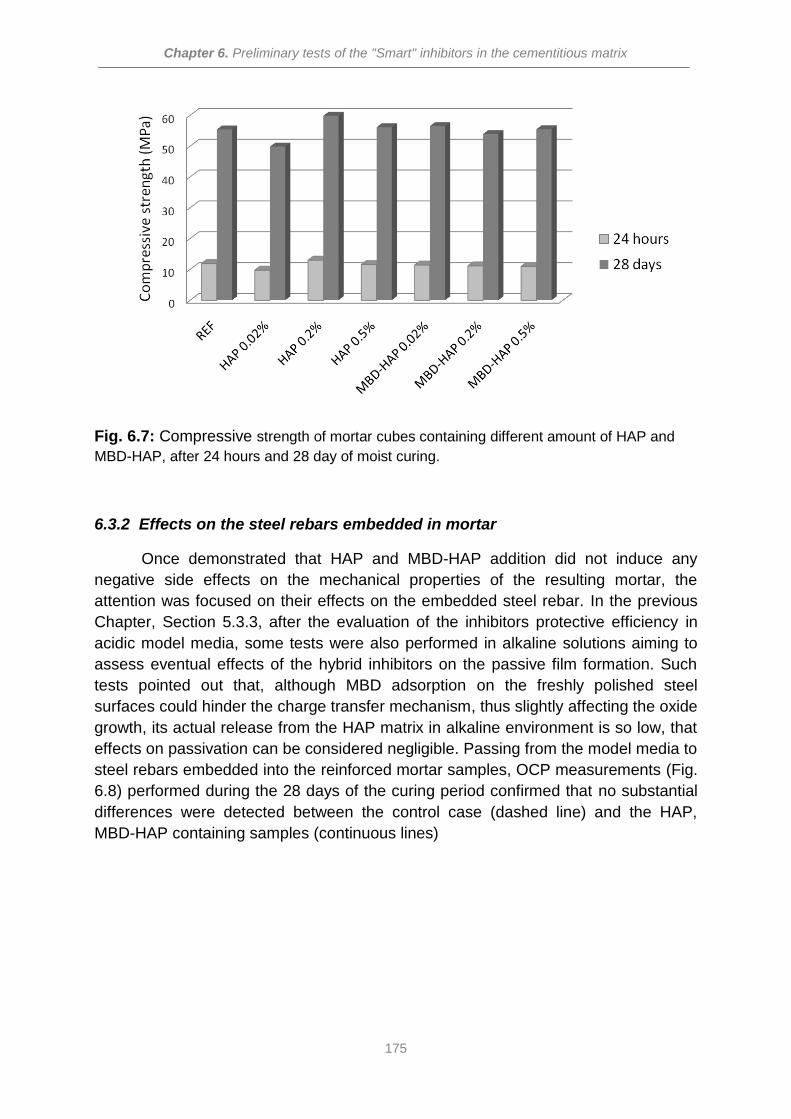
Chapter 6. Preliminary tests of the "Smart" inhibitors in the cementitious matrix
175
Fig. 6.7: Compressive strength of mortar cubes containing different amount of HAP and
MBD-HAP, after 24 hours and 28 day of moist curing.
6.3.2 Effects on the steel rebars embedded in mortar
Once demonstrated that HAP and MBD-HAP addition did not induce any
negative side effects on the mechanical properties of the resulting mortar, the
attention was focused on their effects on the embedded steel rebar. In the previous
Chapter, Section 5.3.3, after the evaluation of the inhibitors protective efficiency in
acidic model media, some tests were also performed in alkaline solutions aiming to
assess eventual effects of the hybrid inhibitors on the passive film formation. Such
tests pointed out that, although MBD adsorption on the freshly polished steel
surfaces could hinder the charge transfer mechanism, thus slightly affecting the oxide
growth, its actual release from the HAP matrix in alkaline environment is so low, that
effects on passivation can be considered negligible. Passing from the model media to
steel rebars embedded into the reinforced mortar samples, OCP measurements (Fig.
6.8) performed during the 28 days of the curing period confirmed that no substantial
differences were detected between the control case (dashed line) and the HAP,
MBD-HAP containing samples (continuous lines)
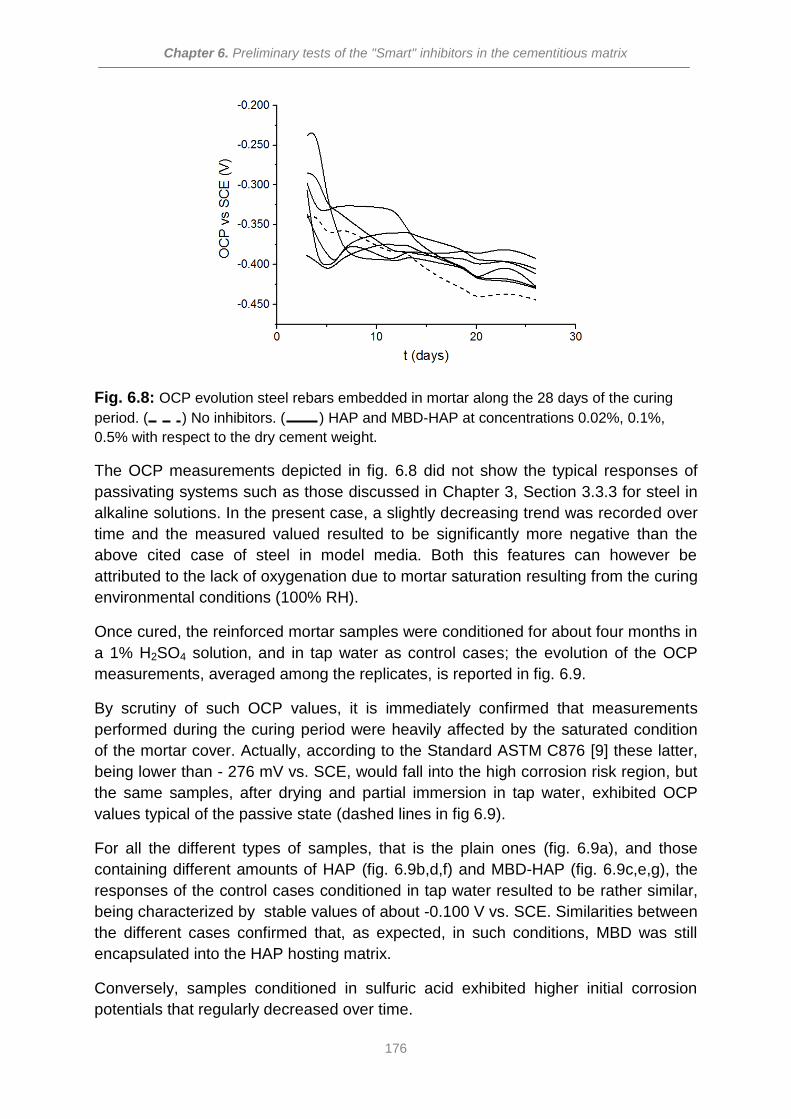
Chapter 6. Preliminary tests of the "Smart" inhibitors in the cementitious matrix
176
Fig. 6.8: OCP evolution steel rebars embedded in mortar along the 28 days of the curing
period. ( ) No inhibitors. ( ) HAP and MBD-HAP at concentrations 0.02%, 0.1%,
0.5% with respect to the dry cement weight.
The OCP measurements depicted in fig. 6.8 did not show the typical responses of
passivating systems such as those discussed in Chapter 3, Section 3.3.3 for steel in
alkaline solutions. In the present case, a slightly decreasing trend was recorded over
time and the measured valued resulted to be significantly more negative than the
above cited case of steel in model media. Both this features can however be
attributed to the lack of oxygenation due to mortar saturation resulting from the curing
environmental conditions (100% RH).
Once cured, the reinforced mortar samples were conditioned for about four months in
a 1% H2SO4 solution, and in tap water as control cases; the evolution of the OCP
measurements, averaged among the replicates, is reported in fig. 6.9.
By scrutiny of such OCP values, it is immediately confirmed that measurements
performed during the curing period were heavily affected by the saturated condition
of the mortar cover. Actually, according to the Standard ASTM C876 [9] these latter,
being lower than - 276 mV vs. SCE, would fall into the high corrosion risk region, but
the same samples, after drying and partial immersion in tap water, exhibited OCP
values typical of the passive state (dashed lines in fig 6.9).
For all the different types of samples, that is the plain ones (fig. 6.9a), and those
containing different amounts of HAP (fig. 6.9b,d,f) and MBD-HAP (fig. 6.9c,e,g), the
responses of the control cases conditioned in tap water resulted to be rather similar,
being characterized by stable values of about -0.100 V vs. SCE. Similarities between
the different cases confirmed that, as expected, in such conditions, MBD was still
encapsulated into the HAP hosting matrix.
Conversely, samples conditioned in sulfuric acid exhibited higher initial corrosion
potentials that regularly decreased over time.
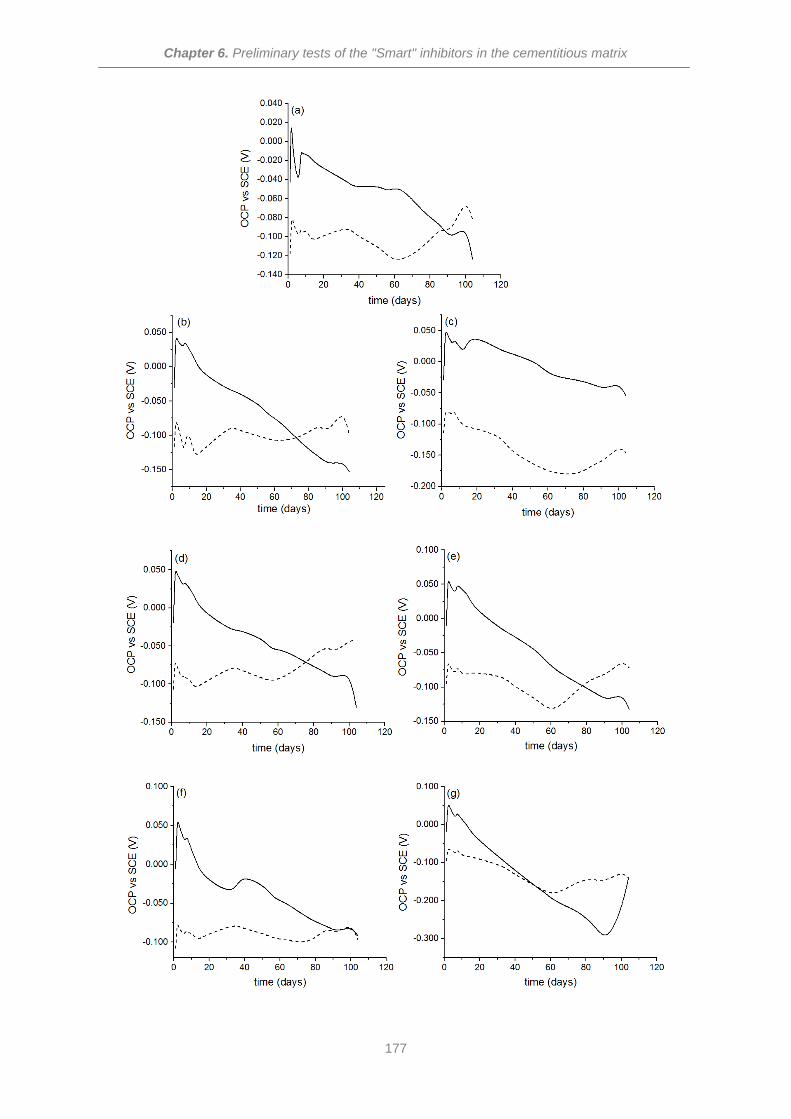
Chapter 6. Preliminary tests of the "Smart" inhibitors in the cementitious matrix
177
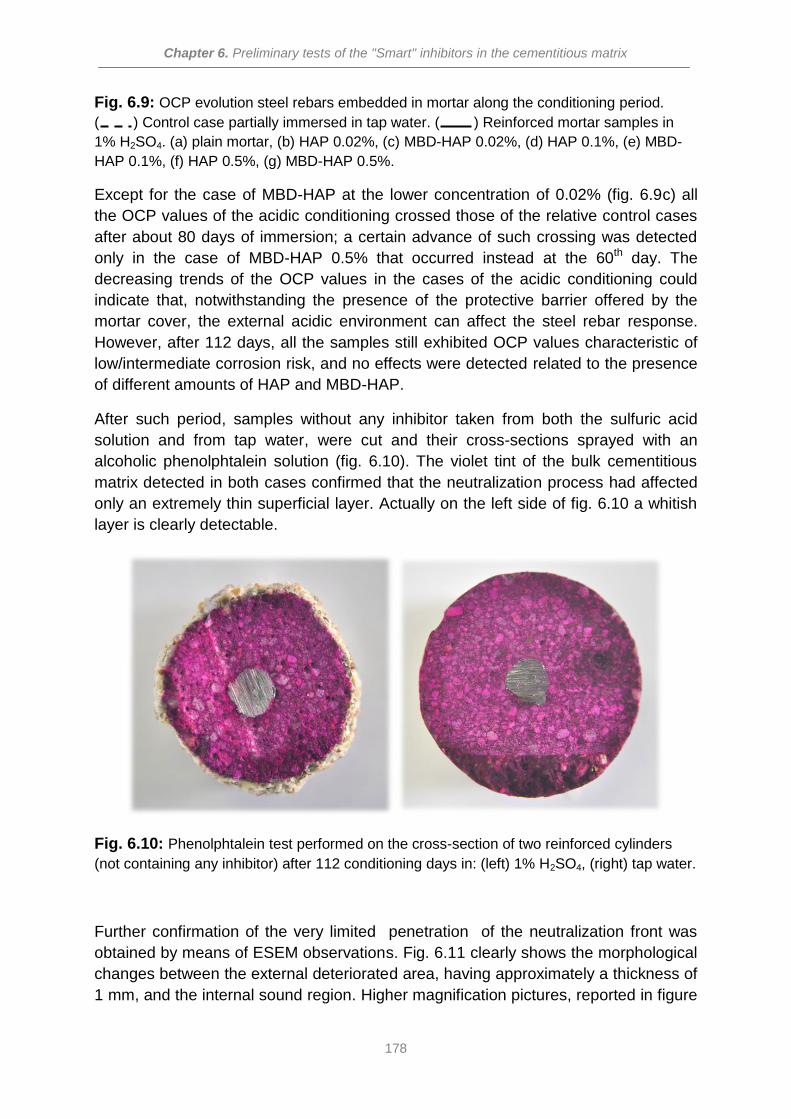
Chapter 6. Preliminary tests of the "Smart" inhibitors in the cementitious matrix
178
Fig. 6.9: OCP evolution steel rebars embedded in mortar along the conditioning period.
( ) Control case partially immersed in tap water. ( ) Reinforced mortar samples in
1% H2SO4. (a) plain mortar, (b) HAP 0.02%, (c) MBD-HAP 0.02%, (d) HAP 0.1%, (e) MBD-
HAP 0.1%, (f) HAP 0.5%, (g) MBD-HAP 0.5%.
Except for the case of MBD-HAP at the lower concentration of 0.02% (fig. 6.9c) all
the OCP values of the acidic conditioning crossed those of the relative control cases
after about 80 days of immersion; a certain advance of such crossing was detected
only in the case of MBD-HAP 0.5% that occurred instead at the 60th day. The
decreasing trends of the OCP values in the cases of the acidic conditioning could
indicate that, notwithstanding the presence of the protective barrier offered by the
mortar cover, the external acidic environment can affect the steel rebar response.
However, after 112 days, all the samples still exhibited OCP values characteristic of
low/intermediate corrosion risk, and no effects were detected related to the presence
of different amounts of HAP and MBD-HAP.
After such period, samples without any inhibitor taken from both the sulfuric acid
solution and from tap water, were cut and their cross-sections sprayed with an
alcoholic phenolphtalein solution (fig. 6.10). The violet tint of the bulk cementitious
matrix detected in both cases confirmed that the neutralization process had affected
only an extremely thin superficial layer. Actually on the left side of fig. 6.10 a whitish
layer is clearly detectable.
Fig. 6.10: Phenolphtalein test performed on the cross-section of two reinforced cylinders
(not containing any inhibitor) after 112 conditioning days in: (left) 1% H2SO4, (right) tap water.
Further confirmation of the very limited penetration of the neutralization front was
obtained by means of ESEM observations. Fig. 6.11 clearly shows the morphological
changes between the external deteriorated area, having approximately a thickness of
1 mm, and the internal sound region. Higher magnification pictures, reported in figure
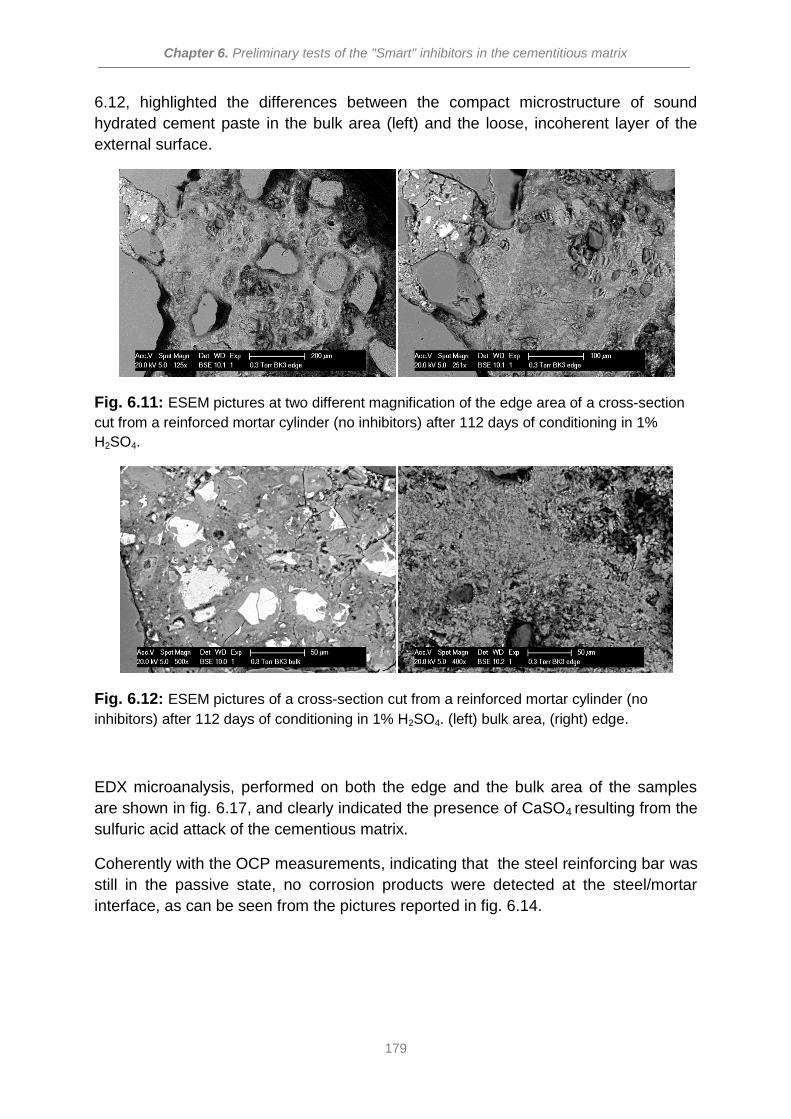
Chapter 6. Preliminary tests of the "Smart" inhibitors in the cementitious matrix
179
6.12, highlighted the differences between the compact microstructure of sound
hydrated cement paste in the bulk area (left) and the loose, incoherent layer of the
external surface.
Fig. 6.11: ESEM pictures at two different magnification of the edge area of a cross-section
cut from a reinforced mortar cylinder (no inhibitors) after 112 days of conditioning in 1%
H2SO4.
Fig. 6.12: ESEM pictures of a cross-section cut from a reinforced mortar cylinder (no
inhibitors) after 112 days of conditioning in 1% H2SO4. (left) bulk area, (right) edge.
EDX microanalysis, performed on both the edge and the bulk area of the samples
are shown in fig. 6.17, and clearly indicated the presence of CaSO4 resulting from the
sulfuric acid attack of the cementious matrix.
Coherently with the OCP measurements, indicating that the steel reinforcing bar was
still in the passive state, no corrosion products were detected at the steel/mortar
interface, as can be seen from the pictures reported in fig. 6.14.
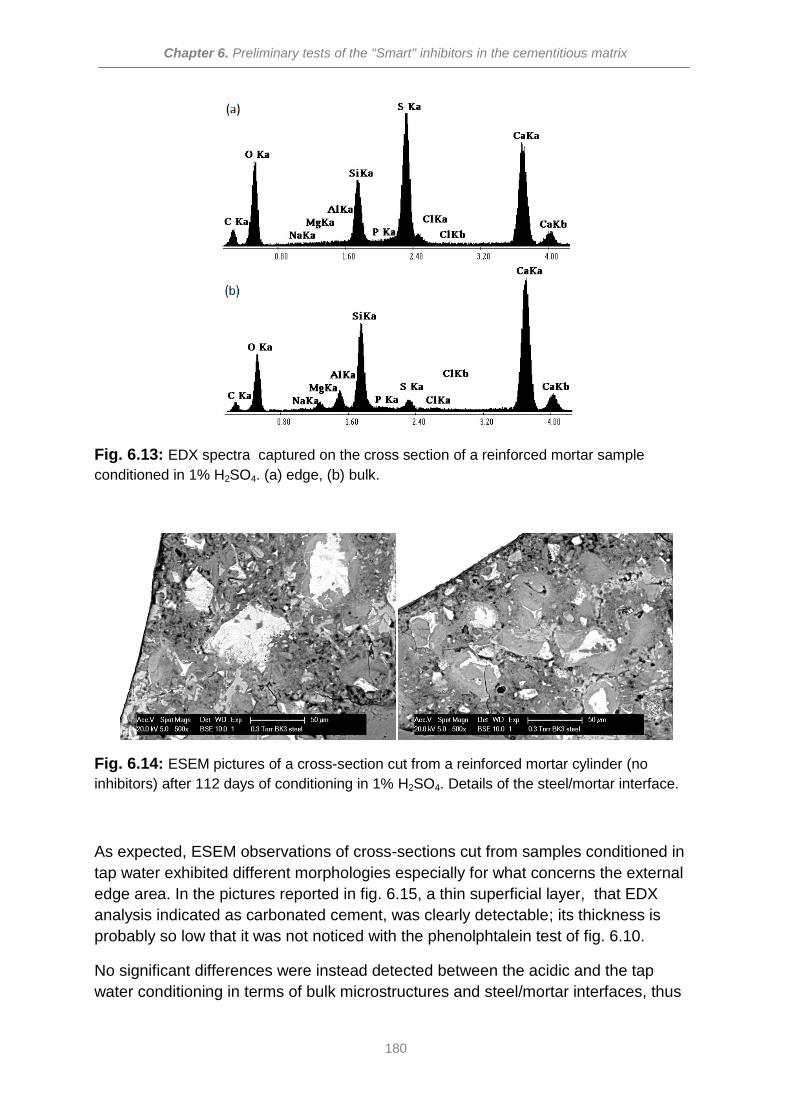
Chapter 6. Preliminary tests of the "Smart" inhibitors in the cementitious matrix
180
Fig. 6.13: EDX spectra captured on the cross section of a reinforced mortar sample
conditioned in 1% H2SO4. (a) edge, (b) bulk.
Fig. 6.14: ESEM pictures of a cross-section cut from a reinforced mortar cylinder (no
inhibitors) after 112 days of conditioning in 1% H2SO4. Details of the steel/mortar interface.
As expected, ESEM observations of cross-sections cut from samples conditioned in
tap water exhibited different morphologies especially for what concerns the external
edge area. In the pictures reported in fig. 6.15, a thin superficial layer, that EDX
analysis indicated as carbonated cement, was clearly detectable; its thickness is
probably so low that it was not noticed with the phenolphtalein test of fig. 6.10.
No significant differences were instead detected between the acidic and the tap
water conditioning in terms of bulk microstructures and steel/mortar interfaces, thus
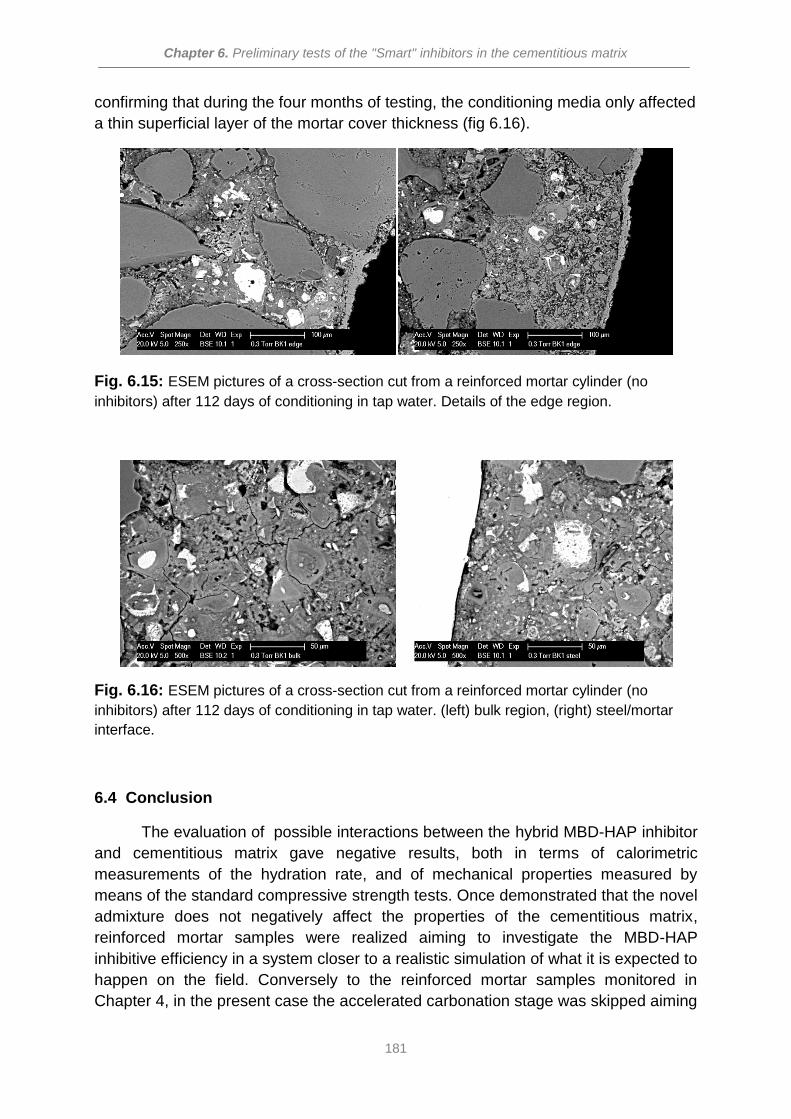
Chapter 6. Preliminary tests of the "Smart" inhibitors in the cementitious matrix
181
confirming that during the four months of testing, the conditioning media only affected
a thin superficial layer of the mortar cover thickness (fig 6.16).
Fig. 6.15: ESEM pictures of a cross-section cut from a reinforced mortar cylinder (no
inhibitors) after 112 days of conditioning in tap water. Details of the edge region.
Fig. 6.16: ESEM pictures of a cross-section cut from a reinforced mortar cylinder (no
inhibitors) after 112 days of conditioning in tap water. (left) bulk region, (right) steel/mortar
interface.
6.4 Conclusion
The evaluation of possible interactions between the hybrid MBD-HAP inhibitor
and cementitious matrix gave negative results, both in terms of calorimetric
measurements of the hydration rate, and of mechanical properties measured by
means of the standard compressive strength tests. Once demonstrated that the novel
admixture does not negatively affect the properties of the cementitious matrix,
reinforced mortar samples were realized aiming to investigate the MBD-HAP
inhibitive efficiency in a system closer to a realistic simulation of what it is expected to
happen on the field. Conversely to the reinforced mortar samples monitored in
Chapter 4, in the present case the accelerated carbonation stage was skipped aiming

Chapter 6. Preliminary tests of the "Smart" inhibitors in the cementitious matrix
182
to better determine the transition from the passive state to the active one, as a
function of the external conditioning environment. However, the non carbonated
mortar cover proved to be a very efficient barrier against the acid attack, impeding
the propagation of the neutralization front and maintained the embedded steel rebar
in its initial passive state. Observations of the reinforced mortar samples cross-
section after the 112 days of conditioning pointed out that the heavily deteriorated
mortar thickness was only a very thin superficial layer, while the bulk of the
cementitious matrix still maintained a sound microstructural morphology and a very
alkaline pH, both these features playing major roles in the protection of the
embedded steel reinforcing bars.
Chapter 6. Preliminary tests of the "Smart" inhibitors in the cementitious matrix
183
References
[1] S. Hanehara, K. Yamada, Interaction between cement and chemical admixture
from the point of cement hydration, absorption behaviour of the admixture and
paste rheology, Cement and Concrete Research 29 (1999) 1159-1165.
[2] P. Lawrence, M. Cyr, E. Ringot, Mineral admixtures in mortars - effect of inert materials on short-term hydration, Cem. Concr. Res., Vol. 33, No. 12 (2003) 1939-1947.
[3] J. Cheung, A. Jeknavorian, L. Roberts, D. Silva, Impact of admixtures on the hydration kinetics of Portland cement, Cem. Concr. Res., Vol. 33, No. 41 (2011) 1298-1309.
[4] C. Jolicoer, M.A. Simard, Chemical admixture-cement interactions:Phenomenology and Physico-chemical Concepts, Cement and Concrete Composites, 20 (1998) 87-101.
[5] P. Lawrence, M. Cyr, E. Ringot, Efficiency of mineral admixtures in mortars:
Quantification of the physical and chemical effects of fine, admixtures in relation
with compressive strength, Cement and Concrete Research, Vol.36, No. 2
(2006) 264-277.
[6] Don L. Ivey, Teddy J. Hirsch, Effects of chemical admixtures in concrete and
mortar, research report (1967) 70-73.
[7] G. Ye, J. Hu, K. van Breugel, P. Stroeven, Characterization of the development
of microstructure and porosity of cement-based materials by numerical
simulation and ESEM image analysis, Mater. Struct. 35 (2002) 603-613.
[8] A.M. Neville, Properties of Concrete, 5th edition, Pearson, 2015.
[9] ASTM C876 (1999) Standard test method for half cell potentials of uncoated
reinforcing steel in concrete.

Chapter 6. Preliminary tests of the "Smart" inhibitors in the cementitious matrix
184

Chapter 7. Conclusions and Pespectives
185
Chapter 7.
Conclusions and Perspectives
Chapter 7. Conclusions and Pespectives
186
7.1 Conclusions
The present text reports and discusses the more relevant results achieved
during the course of my PhD research activity, that was mainly held in the "Corrosion
Engineering and Applied Electrochemistry Laboratory" at Università degli Studi di
Milano from November 2012 to October 2015.
The rationale behind the work was that of investigating the microbial induced
reinforced concrete deterioration, especially focusing on the effects that abiotic
solutions simulating bacteria metabolites have of the corrosion of the steel reinforcing
bars. Once observed their aggressiveness, a specific "smart" corrosion inhibitor was
developed and tested. The smartness consisted in the entrapment on an active
compound into a porous matrix granting its release as a function of a pH triggered
stimulus.
Investigations were started through the easier approach of initially testing the steel
rebar directly immersed into model media, miming the concrete environment either in
sound conditions and deteriorated by microbial activity. Once determined the most
aggressive simulating conditions, a long term (500 days) corrosion monitoring was
performed on reinforced mortar samples. Afterward, an hybrid organic/inorganic
corrosion inhibitor was synthesized, characterized and tested for steel directly
immersed in model media simulating the biogenic acidity. Finally, the effectiveness of
the novel corrosion inhibitor was evaluated in cementitious systems.
Below, the main findings obtained in the present work are summarized:
1. Cyclic voltammetry proved to be a valid tool for investigating the steel passivation in alkaline solutions.
A saturated Ca(OH)2
solution (pH 12.6) is commonly used for the simulation of the
alkaline environment of sound concrete. Such an high pH plays a key role in the
corrosion protection of steel reinforcing bars allowing the growth of a protective
passive layer on the steel surface. Cyclic voltammetry of a steel rebar in such
solution allowed an easy detection of the double step, involving Fe(II) and Fe(III)
transformations, leading to the formation of a protective oxide layer. By changing
experimental parameters, such as the scanned potential windows or the
preconditioning of the metallic surface, significant variations were detected,
especially in the Fe(II) / Fe(III) transition, being such reaction the most relevant in the
protective layer growing process.
Chapter 7. Conclusions and Pespectives
187
2. At least three days of immersion of the steel in sat Ca(OH)2
The stabilization of the electrochemical response of the oxide film, being attributed to
the growth of a passive layer that, in term of thickness, structure and protective
performance, may be comparable to that forming naturally as steel is embedded in
concrete, was monitored with time. Three days of immersion in a saturated Ca(OH)
are required to obtain a mature and protective passive film.
2
solution turned out to be the minimum time required for a realistic simulation of a
stable passive film.
3. Simulation of Sulfur Oxidizing Bacteria metabolic products led to an extensive generalized corrosion of the steel samples.
Diluted sulfuric acid solutions were used for the simulation of SOB metabolic
products. Gravimetric tests and the electrochemical measurements pointed out the
onset of a corrosion process, consisting in a fast dissolution of the protective oxide
layer and a subsequent attack to the underneath steel surface. The attack
morphology resulted to be of a generalized type.
4. Sulfides, simulating Sulfate Reducing Bacteria metabolic products, resulted to be able to interact with the steel surface, leading to localized corrosion.
Sulfides resulted to be a potentially aggressive species, their interactions with the
steel surface being essentially dependent on the environment pH. At the more
alkaline pH, the protective effect of the oxide layer prevails on the sulfide adsorption,
but lowering the pH, the equilibrium was unbalanced toward the steel-sulfide
interaction leading to a loose iron-sulfide film (mackinawite) and localized corrosion
processes.
5. The electrochemical testing of reinforced mortar samples resulted to be much more complicated and time consuming than that of steel directly immersed in solutions
Cementitious materials are inherently heterogeneous because of the their composite
nature, as a consequence, in order to get reliable electrochemical measurements
multiple replicates are required. Furthermore the mortar cover thickness protected
the steel by providing a physical barrier against all the aggressive species thus
requiring very long conditioning times. The accelerated carbonation partially
neutralized the cement alkalinity, leading to the rebar transition from the passive
state to the active. Such transition probably played a preponderant role over the
Chapter 7. Conclusions and Pespectives
188
effect the external conditioning environment, making the distinction of the effects of
the latter rather difficult to detect.
6. The diluted sulfuric acid solution resulted to me more aggressive than the alkaline sulfide-containing one, in terms of corrosion of the mortar embedded rebar.
Notwithstanding the difficulties in the corrosion monitoring of carbonated, and water
saturated reinforced mortar samples, the impedance spectra together with visual
inspections performed on split samples at the end of the monitoring period, pointed
out a major accumulation of corrosion products at the steel/mortar interface in the
case of sulfuric acid conditioning. No significant differences were instead detected
between the control case and the conditioning into the sulfide-containing solution.
7. Methylene blue dye and calcium phosphate were combined together in an hybrid inhibiting system (MBD-HAP).
Methylene blue dye and tri-sodium phosphate emerged from the testing of a series of
different organic and inorganic compounds, as promising inhibitors of the sulfuric
acid induced corrosion of carbon steel. The former, when adsorbed on the steel
surface, was found to inhibit the anodic process, while the latter limited the cathodic
reaction upon precipitation of a protective iron phosphate layer.
The organic dye was immobilized into a porous calcium phosphate matrix granting its
storage until the dissolution of the latter occurring at about pH 3.
In such way together with the slow release of the organic molecule granted by the
matrix dissolution, a further beneficial effect was obtained by phosphate ions freed
from the matrix itself.
8. Both the components of the hybrid inhibitor played a synergic effect in the corrosion protection of a steel surface. Electrochemical tests performed in simulated acidic solutions pointed out a significant
improvement of the corrosion resistance due to the synergic effect of the MBD-HAP
system, while the single components (MBD and HAP) did not provide a satisfactory
protection if separately used. Such synergic effect could be attributed to a better
adsorption of the organic molecules on the homogeneously attacked steel surface
provided by the presence of phosphate ions.
Chapter 7. Conclusions and Pespectives
189
9. The hybrid MBD-HAP inhibitor did not negatively affect the properties of the cementitious matrix.
The evaluation of possible side effects arising from interactions between the hybrid
MBD-HAP inhibitor and cementitious matrix did not highlight any concerning issue.
No effects were detected on the hydration rate, that was investigated by means of
isothermal calorimetry as well as for the strength evolution, measured through
standard compressive strength tests.
7.2 Perspectives
An intriguing feature of scientific research is that in most cases it consists in a
never ending process. Very often, each result opens the way to several new question
marks, or further analyses with different techniques could better confirm the already
obtained results.
Therefore leads of suggested future research are clustered in topics as follows:
Corrosion monitoring of reinforced mortar samples
In the present work, steel testing in model media pointed out that at the pH of
carbonated concrete, sulfides can interact with the steel promoting localized
corrosion, however the electrochemical monitoring did not highlight any difference
between the samples conditioning in the presence or in the absence of sulfides.
Different results could be obtained by using gaseous H2
Alternatively faster corrosion onset could be obtained by the investigation of the
microbial induced corrosion (either with simulating solutions and with real bacteria) in
cracked samples.
S instead of aqueous sulfide
solutions.
"Smart" corrosion inhibitors
The presented results are just preliminary data on a novel system, so that there
exists a wide margins of optimization:
Alternative synthesis of the hydroxyapatite particles could be investigated aiming to
increase porosity and storage capacity.
Methylene blue dye could be replaced with other organic inhibitors, thus overcoming
the issues arising from the related chloride counterions.
New applications, other than concrete, could be investigated such as admixture to
epoxy coating for steel protection etc.

Chapter 7. Conclusions and Pespectives
190


