Embed Size (px)
Citation preview

Microbial methane cycling in the bed of a chalk river:oxidation has the potential to match methanogenesisenhanced by warming
FELICITY SHELLEY, FRAH ABDULLAHI, JONATHAN GREY AND MARK TRIMMER
School of Biological and Chemical Sciences, Queen Mary University of London, London, U.K.
SUMMARY
1. Many rivers are oversaturated in methane (CH4) and carbon dioxide (CO2) relative to the atmo-
sphere, but we know little about the biological controls on the balance between these two important
greenhouse gases and how they might respond to warming.
2. We characterise the potential response to temperature in the biological production of CO2 and
CH4 and the subsequent microbial oxidation of that CH4, that is the sink and source components of
the CH4 cycle, in contrasting river bed sediments: fine sediments, which are largely anoxic, and oxic,
coarse gravels.
3. In the fine sediments, anaerobic production of both CH4 and CO2 increased with temperature,
with apparent activation energies for each being 0.51 eV and 0.24 eV, respectively. The difference
between the two resulted in a 4% increase in the ratio of CH4:CO2 production for a 1 °C increase in
temperature.
4. In the coarse gravels, microbial CH4 oxidation showed no response to temperature at CH4 concen-
trations characteristic of these gravel beds (30–200 nmol CH4 L�1), due to strong substrate limitation.
In contrast, at higher (although still rate limiting) CH4 concentrations, more characteristic of the fine
sediment patches (2–4 lmol CH4 L�1), CH4 oxidation exhibited an increasingly strong response to
temperature, eventually exceeding that for CH4 production.
5. In the fine sediment, the surface layers had a CH4 oxidation capacity over 100 times greater than
the gravels and the kinetic response to differing pore water CH4 concentrations meant CH4 was oxi-
dised some 2000 times faster in the fine sediment patches compared with the coarse gravels.
6. The calculated kinetic and temperature responses showed that with warming, methanogenesis is
unlikely to outstrip methanotrophy and the ratio of CO2 to CH4 emitted could be conserved. Conse-
quently, any changes in the efflux ratio of CH4 to CO2 are unlikely to be due to the incapacity of
methanotrophy to respond to CH4 production, but rather to a physical bypassing of the methano-
trophic community (e.g. through ebullition or transport via plant stems) or contraction of the oxic
layer.
Keywords: chemosynthesis, gravel river bed, greenhouse gas, methanogenesis, methanotrophy
Introduction
Inland waters perform an important role in the global
carbon cycle (Battin et al., 2009), but their small areal
extent, coupled to a poor understanding of the magni-
tude of their carbon cycling processes, has meant they
are seldom integrated into global carbon models (Cole
et al., 2007). However, fresh waters are often oversaturat-
ed in two of the major greenhouse gases (GHG), meth-
ane (CH4) and carbon dioxide (CO2), and are net
emitters to the atmospheric carbon pool, but there is a
paucity of data for rivers (Bastviken et al., 2011). Tradi-
tional global carbon cycling perspectives that disregard
rivers as mere conduits have now been rejected
Correspondence: Mark Trimmer, School of Biological and Chemical Sciences, Queen Mary University of London, Mile End Road, London
E1 4NS, U.K. E-mail: [email protected]
© 2014 The Authors Freshwater Biology Published by John Wiley & Sons Ltd. 1This is an open access article under the terms of the Creative Commons Attribution License,which permits use, distribution and reproduction in any medium, provided the original work is properly cited.
Freshwater Biology (2014) doi:10.1111/fwb.12480

(Aufdenkampe et al., 2011), and rivers are now recogni-
sed as sites of rapid carbon cycling; while some carbon
is ultimately exported to the ocean, much is metabolised
within rivers and lost to the atmosphere (Battin et al.,
2009). Quantifying the rate of GHG production in rivers,
and how this might change under future climate change
scenarios such as warming, and the impact of fine sedi-
ments mobilised via more frequent storms, or indeed
agricultural practice, is of paramount importance if we
are to properly integrate rivers into the global carbon
cycle.
Rivers receive much of their carbon from the sur-
rounding catchment (Cole & Caraco, 2001; Zeug &
Winemiller, 2008), and a combination of changes in
catchment land use and climate over the past century
have increased the delivery of organic carbon to rivers,
in both dissolved and particulate form (Walling &
Amos, 1999; Worrall et al., 2004; Bellamy et al., 2005).
Indeed, anthropogenic manipulation of catchments for
urban or agricultural uses has been shown to have a
greater effect on riverine metabolism than broad regio-
nal differences in catchment biogeography (Bernot et al.,
2010). Conversion from woodland and grassland to ara-
ble farmland has been linked with increased siltation in
rivers (Walling, Collins & Mcmellin, 2003), and this is
problematic because fine sediment clogs gravel river
beds (colmation) and becomes trapped around dense
stands of macrophytes (Sand-Jensen, 1998). In addition
to the destructive biological consequences of habitat
alteration on fish spawning and egg survival (Soulsby
et al., 2001; Greig, Sear & Carling, 2005) and macroinver-
tebrate community structure (Kaller & Hartman, 2004),
the anoxic sediments in some rivers produce as much
CH4 and CO2 per unit area as peat bogs and heavily in-
dustrialised estuaries (Sanders et al., 2007; Trimmer,
Sanders & Heppell, 2009b).
With such amplified allochthonous inputs, the poten-
tial for rivers to emit CO2 and CH4 to the atmosphere is
already high, but how these supplements of carbon will
interact with increased temperatures is largely unknown.
Across both terrestrial and aquatic environments,
respiration has a stronger temperature response than
photosynthesis (Yvon-Durocher et al., 2010a; Regaudie-
De-Gioux & Duarte, 2012). In terrestrial environments,
any potential temperature response in respiration is ulti-
mately constrained by carbon fixed by photosynthesis
whereas, due to their allochthonous carbon sources
(Cole & Caraco, 2001), lakes and rivers have the poten-
tial to emit far more carbon as gases compared with
what they produce, thus becoming greater net sources of
carbon to the atmosphere with increased temperature
(Gudasz et al., 2010; Trimmer et al., 2012). Although less
abundant than CO2, atmospheric CH4 is an especially
potent GHG, with a warming potential, per mole, some
23 times greater (Forster et al., 2007). Moreover, as meth-
anogenesis exhibits a stronger temperature response
than respiration, moderate warming [c. 2 °C by the end
of the 21st century (Stocker et al., 2013)] could result in a
greater proportion of carbon being released from aquatic
systems as CH4 versus CO2 (Yvon-Durocher et al.,
2010b, 2014). Recent carbon gas budgets for lakes and
reservoirs show that the global emissions of CO2 and
CH4 (expressed in CO2 equivalents) are currently equal
with one another (Tranvik et al., 2009), and a further
small increase in temperature could see CH4 overtake
CO2 (Trimmer et al., 2012). However, microbial CH4 oxi-
dation provides a sink for CH4 and could attenuate
some or all of the increase in CH4 production due to
warming.
The oxidation of CH4 has been widely investigated in
lakes (e.g. Eller et al., 2005; Bastviken et al., 2008; Deutz-
mann, W€orner & Schink, 2011) and more recently in
rivers (Trimmer et al., 2010; Shelley, Grey & Trimmer,
2014), and its temperature dependence is often sup-
pressed under substrate limitation (Duc, Crill & Bastvi-
ken, 2010; Lofton, Whalen & Hershey, 2014). A recent
meta-analysis of CH4 emissions from aquatic ecosys-
tems suggested that CH4 oxidation is unlikely to inter-
act with temperature and CH4 production in natural
systems under in situ CH4 concentrations because they
are too low (Yvon-Durocher et al., 2014), and our
recently published kinetic response of CH4 oxidation to
the seasonal range of CH4 concentrations in rivers con-
firms this substrate limitation in gravel river beds (Shel-
ley et al., 2014). Nevertheless, due to the contrasting
environmental requirements of CH4 oxidation and
methanogenesis, the spatial configuration and magni-
tude of CH4 sources and sinks will determine the final
fate of CH4 and therefore the overall balance of GHGs
emitted from a river.
At our study site, a typical lowland chalk river, the
main river bed is a mosaic comprising coarse gravels
with patches of predominantly anoxic fine sediment that
accumulate around dense macrophyte stands (Fig. 1,
Sand-Jensen, 1998). Fine sediments are known to pro-
duce both CH4 and CO2 (Jones & Mulholland, 1998;
Sanders et al., 2007; Trimmer et al., 2009b), whereas the
coarse gravels are a recognised sink for CH4, oxidising
CH4 dissolved in the river water to CO2 (Trimmer et al.,
2010). Benthic photosynthesis has long been recognised
as a sink for CO2 (Odum, 1956), but many river beds are
net heterotrophic, with the sediments acting as a net
© 2014 The Authors Freshwater Biology Published by John Wiley & Sons Ltd., Freshwater Biology, doi: 10.1111/fwb.12480
2 F. Shelley et al.

source of CO2 (Richey et al., 2002). Here, we sought to
understand the interactions and feedbacks between CH4
and CO2 production, CH4 oxidation and temperature in
a naturally heterogeneous river bed to better understand
the role of rivers in global carbon cycling.
We broke our aims down into three research ques-
tions:
1. How will CH4 and CO2 production in river bed
sediments respond to warming?
2. How will river bed CH4 oxidation respond to
increased temperature and CH4 concentrations?
3. To what extent will CH4 oxidation be capable of
mitigating any increase in CH4 production in river bed
sediments?
Methods
Study site and sample collection
Sediment was collected from the River Itchen at Oving-
ton, Hampshire, U.K. (51.083530 N, �1.1995214 W) in
November, 2012. Here, the river is 10–15 m wide,
0.5–1.2 m deep and there are dense stands of submerged
macrophytes (Fig. 1), predominantly Ranunculus, Berula
and Callitriche spp. which trap fine sediment around
their rhizomes and main stems. The River Itchen is a
typical chalk river, and the mosaic of fine sediments
around macrophyte stems and coarser gravels is charac-
teristic of chalk river beds.
We sampled the two sediment types separately to look
at the cycling of CH4 in the river bed as a whole and
how the oxidation and production of CH4 interacts with
temperature. A screen for anaerobic CH4 oxidation v
nitrite found no potential for this process, and so just
aerobic CH4 oxidation was considered. As the river
water is well oxygenated, we also looked at the anoxic–
oxic boundary layer (c. 0.5 cm into the fine sediment) in
the fine sediment patches where we expected methano-
trophic bacteria to be exploiting the high CH4 concentra-
tions (Jones & Mulholland, 1998; Sanders et al., 2007;
Trimmer et al., 2010).
The coarse gravels were taken from the open gravel
bed (Fig. 1), using a fine mesh net and were then sieved,
resulting in a sample with a grain size between 1.4 mm
and 2.4 mm. The fine sediments were collected from
under the macrophytes stands using truncated syringes
which were pushed into the sediment and then sealed
from beneath with a rubber bung. All sediments were
refrigerated and returned to the laboratory within 3 h.
Methane production: temperature dependence
To begin with, we measured the rate of CH4 and CO2
production in anoxic slurries. While some of the CO2
production will be from anaerobic respiration and fer-
mentation, some will also be as a direct result of aceto-
clastic methanogenesis (1 : 1 CH4:CO2 produced) while
a smaller, yet significant, portion of methanogenesis
could also be hydrogenotrophic, whereby CO2 is
reduced with H2 to produce CH4 and H2O
(Kotsyurbenko et al., 2004). Both of these processes must
be considered when interpreting the temperature
response of CO2 production in these anoxic sediments.
The fine sediment cores were transferred to an anoxic
glove-box (CV204; Belle Technologies, Portesham, U.K.),
and then, after careful extrusion to isolate the oxic sur-
face layer from the rest of the anoxic core, c. 2 g sedi-
ment and 2 mL of deoxygenated (10 min flushing with
oxygen-free nitrogen [BOC Industrial Gases, Guildford,
U.K.)] river water were transferred into 12.5-mL gastight
vials (Labco, Lampeter, U.K.) which were then sealed
(n = 32) and left with a nitrogen headspace. Gas samples
(100 lL) were withdrawn from the headspace and
injected into a gas chromatograph (GC) fitted with a
flame-ionisation detector (Agilent Technologies; for
details see Sanders et al. (2007)). Headspace concentra-
tions of CH4 and CO2 (after catalytic reduction over hot
nickel (385 °C) to CH4) were calculated from peak areas
calibrated against known standards (Scientific and Tech-
nical Gases), and the total amount in the vial (headspace
Fig. 1 Photograph of the site on the River Itchen showing the con-
trasting patches of fine sediment within the dense macrophyte
stands (methane sources) and coarse gravel beds (methane sinks)
which are typical for the chalk streams of southern England (Flynn
et al., 2002; Cotton et al., 2006). Dr. J Grey provided the photo-
graph.
© 2014 The Authors Freshwater Biology Published by John Wiley & Sons Ltd., Freshwater Biology, doi: 10.1111/fwb.12480
Methanotrophic capacity tracks methane production in river bed sediments 3

plus water) was calculated using solubility coefficients
(Weiss, 1974; Yamamoto, Alcauskas & Crozier, 1976).
The vials were placed on rollers (Denley, Spiramix 10)
in temperature-controlled rooms set at 3 °C, 10 °C,
15 °C and 22 °C, and further gas measurements were
made after 24, 48 and 72 h. After the final measurement,
the vials were opened and the sediments dried to a con-
stant weight.
Methane oxidation: substrate limitation
To identify the extent of substrate limitation on the
potential for CH4 oxidation in the gravels, gastight vials
(n = 60) were set up with sediment (c. 2 g) and river
water (5 mL) and spiked with pure (100%) CH4 (BOC)
to generate concentrations in the water of 3–10500 nmol
CH4 L�1. For the fine sediment, the oxic surface layer
was homogenised and c. 0.5 mL was transferred into a
gastight vial (n = 18), then river water (5 mL) was
added and the vials spiked, generating CH4 concentra-
tions between 14 and 21300 nmol L�1. The vials were
gently shaken for 30 s, and the concentration of CH4
and CO2 in the headspace was measured by GC/FID (as
above) and then resampled over time (as above). The
vials were incubated on rollers at 10 °C to mimic aver-
age river water temperature (Mackey & Berrie, 1991),
and the change in total CH4 (headspace and water
phase) was used to calculate the rate of CH4 oxidation.
Methane oxidation: temperature dependence in coarse
gravels
Previous work in lake sediments had shown a sup-
pressed response to temperature by CH4 oxidation,
arguing that this was due to strong limitation by CH4
(Duc et al., 2010). To test this, we set up a series of tem-
perature incubations with increasing CH4 concentration
(n = 11). For each concentration, replicate vials (n = 3)
with gravel (2 g) and river water (5 mL) were set up
and spiked, generating CH4 concentrations in the water
phase of 30–6250 nmol CH4 L�1. After spiking, the vials
were gently shaken, the headspace measured and vials
incubated at four different temperatures as above.
Methane oxidation: temperature dependence in fine
sediments
To measure the temperature dependence of CH4 oxida-
tion in the oxic surface layer of the fine sediments, vials
were set up as above (c. 0.5 mL sediment, n = 32), but
the headspace was only enriched to one concentration of
CH4 which was representative of those measured in the
immediately underlying anoxic pore water (c. 3 lmol
CH4 L�1) and the half-saturation constant for CH4 deter-
mined here (see below). The rate of CH4 oxidation at
four different temperatures was measured as above.
Sediment organic carbon content
To quantify the organic carbon content of the gravels
and fine sediments, we used a persulphate oxidation
reaction to convert all organic carbon to CO2. Sediments
were freeze-dried for 24 h, weighed (200 mg) into 20-mL
crimp-top vials (Anatune) and H2PO4 (4 mL of 6% v/v)
added to drive off any carbonate. After 48 h, potassium
persulphate (4 mL of 0.15 M) was added to each vial
and the vials capped with butyl rubber stoppers and
aluminium tear-away seals (Grace Discovery Sciences).
The headspace was then purged with oxygen-free nitro-
gen (BOC) to degas any CO2 from the liquid and then
pure oxygen (BOC) (to ensure complete oxidation), and
the samples were then autoclaved at 120 °C for 3 h.
After cooling, the CO2 concentration in the headspace
was measured by GC/FID as above. The organic carbon
content was calculated using potassium biphthalate pre-
pared in a series of concentrations (resulting in total car-
bon 0–5 mg C) and then treated in the same way as the
samples. This method allows larger sediment samples to
be analysed compared with elemental analysis (<5 mg
for elemental analysis, up to 5 g for wet oxidation), and
complete recovery of carbon was tested for using stan-
dard addition (Harris, 2007).
Deriving the apparent activation energies for the measured
processes
The rates of each measured process (e.g. nmol CH4
oxidised g�1 gravel h�1) were log-transformed, and
the incubation temperatures were converted to the
form 1/kT, where T is absolute temperature in Kelvin
and k is Boltzmann’s constant [8.62 9 10�5 eV K�1
(T)]. The logged rates were then plotted on an Arrhe-
nius plot against 1/kT, where the negative slope of
the linear regression line is equivalent to the apparent
activation energy in electron volts (1 eV = 96.49 kJ
mol�1) of each process. We acknowledge that this
‘apparent’ or ‘realised’ activation energy will always
be lower than the theoretical sensitivity of the bio-
chemical reaction to temperature because of environ-
mental constraints, such as substrate limitation. Here,
we are merely using it as an empirical index of tem-
perature response.
© 2014 The Authors Freshwater Biology Published by John Wiley & Sons Ltd., Freshwater Biology, doi: 10.1111/fwb.12480
4 F. Shelley et al.

Results
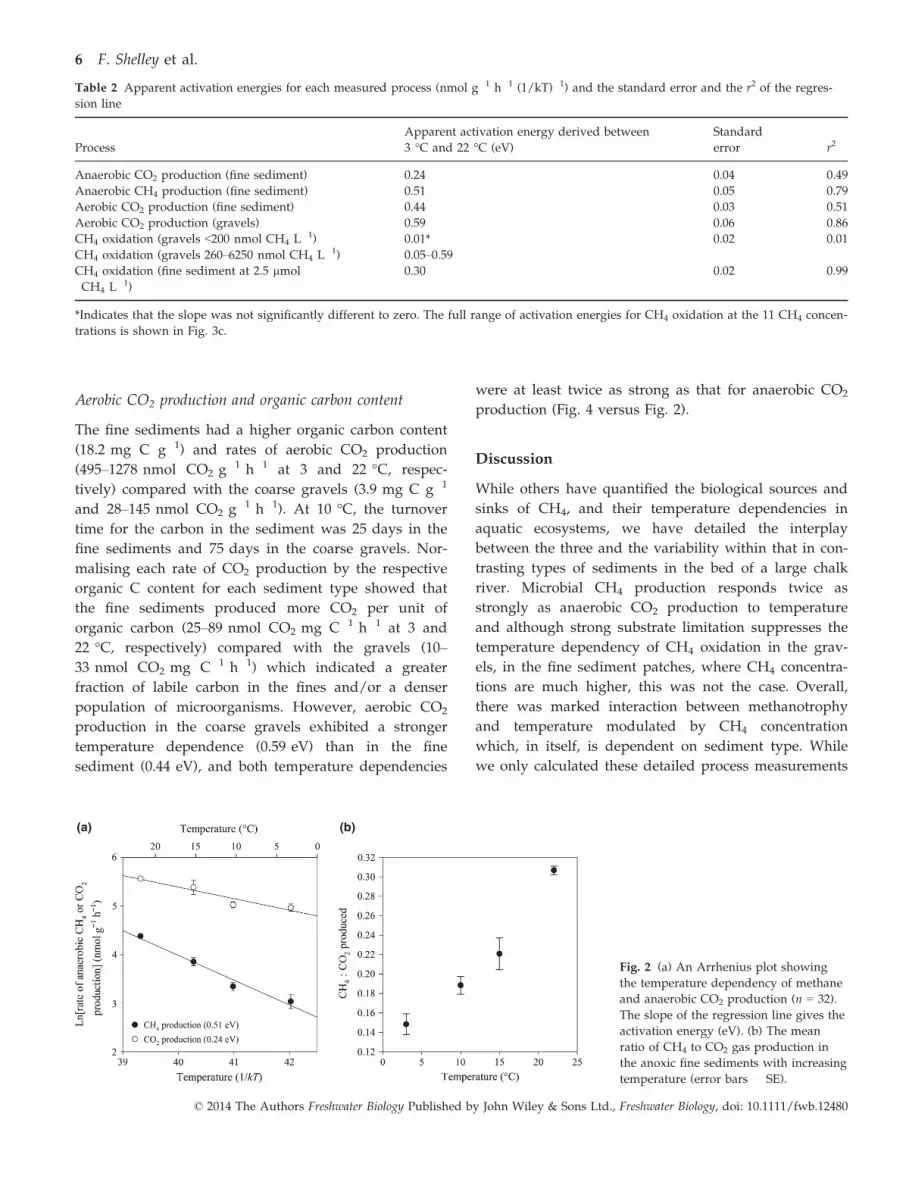
Methane production: temperature dependence
The rate of anaerobic CH4 production in the fine sedi-
ment increased with temperature (Fig. 2a, Table 1) from
22 to 80 nmol CH4 g�1 h�1 (at 3 °C and 22 °C, respec-
tively), as did the production of CO2 (from 147 to
261 nmol CO2 g�1 h�1) but with a lower temperature
dependency than that for CH4 (Fig. 2a, Table 2). The
apparent activation energies for both CH4 and CO2
production in the fine sediments were 0.51 eV and
0.24 eV, respectively (Fig. 2a and Table 2). As a result,
the ratio of anaerobic CH4:CO2 production increased by
0.04 °C �1, approximately doubling over the full range
of temperatures investigated (Fig. 2b). Acetoclastic
methanogenesis is likely to be the dominant pathway
for CH4 production in these sediments because of the
isotopic signature of the CH4 produced (c. �58&,
unpublished data, Trimmer et al.) and because they are
from fresh waters rather than marine (Whiticar, Faber
& Schoell, 1986). If we conservatively estimate that
two-thirds of CH4 production was via this pathway,
then it would account for 20% of the CO2 produced
and would therefore lower the activation energy for
non-methanogenic anaerobic CO2 production from 0.24
to 0.19 eV.
Kinetics of CH4 oxidation in coarse gravels and fine
sediments
In the gravels, we measured a linear increase in the ini-
tial rate of CH4 oxidation with CH4 concentration, from
approximately atmospheric equilibration (2 nmol
CH4 L�1) up to 10.5 CH4 lmol L�1 (Fig. 3a), suggesting
strong substrate limitation at typical riverine concentra-
tions (<200 nmol CH4 L�1). We also measured strong
substrate limitation in the fine sediments, but here, the
capacity for CH4 oxidation was much greater and the
activity became saturated at around 10 lmol CH4 L�1
(Fig. 3a). CH4 oxidation in the fine sediments could be
explained by simple Michaelis–Menten kinetics, taking
the form:
Rate of CH4 oxidation = (586 C)/(3.68 + C)
where C is the starting concentration of CH4 and Vmax
equated to 586 nmol CH4 g�1 h�1, with an apparent Km
equivalent to 3.7 lmol CH4 L�1.
Temperature response of aerobic CH4 oxidation
(i) In the coarse gravels. At 10 °C (approximately average
river temperature) and with CH4 concentrations repre-
sentative of the gravel bed (30–200 nmol L�1), CH4 oxi-
dation was only 0.1 nmol CH4 g�1 h�1 (SE � 0.03), and
there was no significant effect of temperature on the rate
of CH4 oxidation in the gravels (Table 1 and Fig. 3b).
Above this concentration, we measured an increasingly
strong effect of temperature on the rate of oxidation
which increased from a negligible sensitivity (0.05 eV,
SE � 0.031) at 260 nmol CH4 L�1 to 0.6 eV (SE � 0.09)
at 6250 nmol L�1 (Fig. 3c, Table 2). At the highest con-
centration measured, the response to temperature was
even greater than that for methanogenesis (0.6 eV to
0.51 eV).
(ii) In the fine sediments. In the surface layer of fine
sediments where the pore water CH4 is high
(2–4 lmol L�1), the rates of CH4 oxidation were some
1800–3100 times faster than those for the coarse
gravels, ranging from 172 nmol CH4 g�1 h�1 to
376 nmol CH4 g�1 h�1 (over 3 °C to 22 °C), with an
apparent activation energy of 0.3 eV (Fig. 3b and
Table 2). Even when the rates of CH4 oxidation were
normalised to the same starting concentration of
120 nmol CH4 L�1, the fine sediments still oxidised
CH4 112 times faster than the gravels, indicating a
greater methanotrophic capacity (denser population
and/or higher specific cell activities) in the fine sedi-
ment than in the gravel.
Table 1 Response in rate of activity to temperature or initial concentration of CH4. The dimensions of the slopes (b1) are nmol g�1 h�1 °C-1
except for the relationship between initial CH4 concentration and CH4 oxidation where the dimensions are nmol CH4 g�1 h�1
Explanatory variable Response variable d.f. F P Intercept (a1) Slope (b1)
Temperature (°C) CH4 production 1,29 154.18 0.00 6.08 3.11
Temperature (°C) CH4 oxidation (30–200 nM data pooled) 1,46 0.45 0.50 0.102 0.00188
Temperature (°C) CH4 oxidation (260–6250 nM data pooled) 1,106 35.01 0.00 0.390 0.259
Initial concentration (CH4) CH4 oxidation (10 °C) 1,41 838.9 0.00 0.701 0.00266
Temperature (°C) Anaerobic CO2 production (fine sediments) 1,29 22.04 0.00 116 6.64
Temperature (°C) Aerobic CO2 production (gravels) 1,30 147.1 0.00 3.2 6.18
Temperature (°C) Aerobic CO2 production (fine sediments) 1,30 11 0.002 506 41.4
© 2014 The Authors Freshwater Biology Published by John Wiley & Sons Ltd., Freshwater Biology, doi: 10.1111/fwb.12480
Methanotrophic capacity tracks methane production in river bed sediments 5
Aerobic CO2 production and organic carbon content
The fine sediments had a higher organic carbon content
(18.2 mg C g�1) and rates of aerobic CO2 production
(495–1278 nmol CO2 g�1 h�1 at 3 and 22 °C, respec-
tively) compared with the coarse gravels (3.9 mg C g�1
and 28–145 nmol CO2 g�1 h�1). At 10 °C, the turnover
time for the carbon in the sediment was 25 days in the
fine sediments and 75 days in the coarse gravels. Nor-
malising each rate of CO2 production by the respective
organic C content for each sediment type showed that
the fine sediments produced more CO2 per unit of
organic carbon (25–89 nmol CO2 mg C�1 h�1 at 3 and
22 °C, respectively) compared with the gravels (10–
33 nmol CO2 mg C�1 h�1) which indicated a greater
fraction of labile carbon in the fines and/or a denser
population of microorganisms. However, aerobic CO2
production in the coarse gravels exhibited a stronger
temperature dependence (0.59 eV) than in the fine
sediment (0.44 eV), and both temperature dependencies
were at least twice as strong as that for anaerobic CO2
production (Fig. 4 versus Fig. 2).
Discussion
While others have quantified the biological sources and
sinks of CH4, and their temperature dependencies in
aquatic ecosystems, we have detailed the interplay
between the three and the variability within that in con-
trasting types of sediments in the bed of a large chalk
river. Microbial CH4 production responds twice as
strongly as anaerobic CO2 production to temperature
and although strong substrate limitation suppresses the
temperature dependency of CH4 oxidation in the grav-
els, in the fine sediment patches, where CH4 concentra-
tions are much higher, this was not the case. Overall,
there was marked interaction between methanotrophy
and temperature modulated by CH4 concentration
which, in itself, is dependent on sediment type. While
we only calculated these detailed process measurements
Table 2 Apparent activation energies for each measured process (nmol g�1 h�1 (1/kT)�1) and the standard error and the r2 of the regres-
sion line
Process
Apparent activation energy derived between
3 °C and 22 °C (eV)
Standard
error r2
Anaerobic CO2 production (fine sediment) 0.24 0.04 0.49
Anaerobic CH4 production (fine sediment) 0.51 0.05 0.79
Aerobic CO2 production (fine sediment) 0.44 0.03 0.51
Aerobic CO2 production (gravels) 0.59 0.06 0.86
CH4 oxidation (gravels <200 nmol CH4 L�1) 0.01* 0.02 0.01
CH4 oxidation (gravels 260–6250 nmol CH4 L�1) 0.05–0.59CH4 oxidation (fine sediment at 2.5 lmol
CH4 L�1)
0.30 0.02 0.99
*Indicates that the slope was not significantly different to zero. The full range of activation energies for CH4 oxidation at the 11 CH4 concen-
trations is shown in Fig. 3c.
(a) (b)
Fig. 2 (a) An Arrhenius plot showing
the temperature dependency of methane
and anaerobic CO2 production (n = 32).
The slope of the regression line gives the
activation energy (eV). (b) The mean
ratio of CH4 to CO2 gas production in
the anoxic fine sediments with increasing
temperature (error bars � SE).
© 2014 The Authors Freshwater Biology Published by John Wiley & Sons Ltd., Freshwater Biology, doi: 10.1111/fwb.12480
6 F. Shelley et al.

in one chalk river, our work on CH4 in many rivers
across southern England (Sanders et al., 2007; Shelley
et al., 2014) makes us confident of the wider geographi-
cal significance of the data presented here.
CH4 and CO2 production
The difference in the temperature dependencies of CH4
and CO2 production (Fig. 2a) means that if emissions
were driven by temperature alone, the predicted temper-
ature rise of 2 °C by the end of this century (scenarios
RCP4.5, 6.0 and 8.5, Stocker et al., 2013) could result in
an 8% increase in the proportion of carbon emitted as
CH4 (rather than CO2) from our patches of fine sedi-
ment. Further, the delivery of fine sediment is likely to
increase under some climate change scenarios and ongo-
ing intensification of agriculture (Goudie, 2006; Sanders
et al., 2007). Despite this potential for methanogenesis,
however, its apparent activation energy (0.51 eV) was
weaker than those for other aquatic sediments:
1.7–2.0 eV in lake sediments [Lofton et al., 2014); 1.3–
2.8 eV in peat slurries (Dunfield et al., 1993)]; 0.85 eV in
freshwater mesocosms (Yvon-Durocher et al., 2010b);
and 0.96 eV for a meta-analysis of 127 aquatic field sites
(Yvon-Durocher et al., 2014). Such a weak response to
temperature could be explained by poor substrate qual-
ity, as has previously been demonstrated for wetland
sediments (Valentine, Holland & Schimel, 1994; Berg-
man, Svensson & Nilsson, 1998), lakes (Duc et al., 2010)
and rice paddy soils (Fey & Conrad, 2003). Allochtho-
nous sediments often leach their more labile DOC into
rivers long before they are deposited (Stanley et al.,
(a)
(b)
(c) Fig. 3 (a) Initial rates of methane oxidation in the gravels (open cir-
cles) and fine sediments (filled circles) at a range of initial starting
concentrations of methane. Inset shows CH4 concentrations lower
than 150 nmol L�1, that is those typical of the seasonal range found
in many chalk rivers (Shelley et al., 2014). Where c is the starting
concentration of CH4, the trend line for the gravels is a first-order
linear regression, where rate = 0.3 + (2.8 c), and for the fine sedi-
ments a Michaelis–Menten, where rate = (586Vmax c)/(3.68Km + c).
(b) Initial rates of methane oxidation in the gravels (open circles)
and fine sediments, measured with starting CH4 concentrations
equivalent to those found in the pore waters of the two patch types
(120 nmol CH4 L�1 for the gravels and 2.5 lmol CH4 L�1). Rates in
the fine sediment incubations are 1800–3100 times faster than those
in the gravel incubations. (c) Apparent activation energies of CH4
oxidation in the gravels between 30 and 6250 nmol L�1 (open cir-
cles) and for the fine sediments at 2.2 lmol L�1 (filled circles) with
the range of CH4 concentrations expected in the gravels and the
fine sediment patches marked with horizontal grey bars. Error
bars � SE.
© 2014 The Authors Freshwater Biology Published by John Wiley & Sons Ltd., Freshwater Biology, doi: 10.1111/fwb.12480
Methanotrophic capacity tracks methane production in river bed sediments 7

2012), resulting in increasingly refractory particulate car-
bon over time. Further evidence for the relatively poor
carbon quality in the fine sediment could also be seen in
the aerobic production of CO2, where the apparent acti-
vation energy for the gravels [0.59 eV, close to that of
general heterotrophic metabolism 0.65 eV (Yvon-
Durocher et al., 2010a)] was higher than that for the fine
sediments (0.44 eV) which we already know to be
strongly influenced by terrestrial sources (Collins &
Walling, 2007). The greater yield of CO2 per unit of
organic carbon in the fine sediments was, therefore,
most likely due to a denser population of microbes,
rather than a higher proportion of labile carbon.
Methane oxidation
The capacity for CH4 oxidation in gravel river beds has
only recently been quantified (Trimmer et al., 2010; Shel-
ley et al., 2014), and here, we followed the kinetic
response in two contrasting sediment types, which differ
markedly in their pore water CH4 concentrations. Our
calculated Vmax for CH4 oxidation in the fine sediments
(586 nmol CH4 g�1 h�1) is comparable to those reported
around CH4 seeps in Lake Constance (511 nmol
CH4 g�1 h�1,Deutzmann et al., 2011) and landfill soils
(743 nmol CH4 g�1 h�1, Bogner, Spokas & Burton, 1997).
Although we did not find a plateau in the kinetic oxida-
tion response to CH4 in the gravels, oxidation was
clearly much slower than in the fine sediment (Fig. 3a),
probably due to lower densities of methanotrophic
bacteria on the gravel particles and a greater surface
area in the fine sediments (Deutzmann et al., 2011).
Methanotrophs are able to exploit the thin oxic layer
enveloping the anoxic sites of methanogenesis, and as
CH4 production increases, the greater delivery of CH4
stimulates faster oxidation of CH4 (Megonigal & Schle-
singer, 2002). At 10 °C, CH4 oxidation (at 2.5 lmol
CH4 L�1) was c. 8 times faster than CH4 production in
the fine sediments, illustrating the potential of the met-
hanotrophic community to more than match any local
increases in CH4. The effect of substrate limitation on
the temperature dependence of CH4 oxidation in the
gravels gradually weakened as CH4 concentrations rose.
At the top end of our concentration gradient (0.59 eV at
6250 nmol CH4 L�1), the temperature dependence in the
gravels superseded that for methanogenesis (0.51 eV) in
the fine sediments.
Substrate limitation is known to suppress the tempera-
ture dependence of CH4 oxidation as has been shown in
lake sediments (Duc et al., 2010) and hypolimnetic
waters (Lofton et al., 2014). Our experiment, at eleven
different CH4 concentrations (spanning the ambient
range from clean gravels to fine sediments), gives an
even more detailed picture of the potential interaction
between temperature and substrate availability which, in
rivers, is ultimately governed by sediment type. At the
lowest CH4 concentrations observed in rivers, typical of
clean gravel beds (Jones & Mulholland, 1998; Trimmer
et al., 2009a), methanotrophy does not respond to tem-
perature, but there is a marked kinetic effect (see
Fig. 3a), and at only marginally higher concentrations
(where substrate is still limiting, but to a lesser extent),
there is a temperature effect too. These findings contrast
with the observations of Yvon-Durocher et al. (2014) that
methanotrophy does not interact with CH4 production
and temperature under the substrate-limiting conditions
encountered in aquatic ecosystems. Moreover, in other
aquatic ecosystems, where anoxic, fine sediments consti-
tute a much higher proportion of the bed (e.g. lakes and
wetlands), the kinetics of methanotrophy enable it to off-
set temperature-induced increases in CH4 (Megonigal &
Schlesinger, 2002; Duc et al., 2010; Lofton et al., 2014),
resulting in no change in the ratio of CH4 to CO2 emis-
sions with increasing temperature.
Surface flux measurements (Yvon-Durocher et al.,
2010b) and anoxic sediment incubations (Marotta et al.,
2014) which do show an increase in the efflux ratio of
CH4 to CO2 with warming are unlikely to be due to a
lack of CH4 oxidation potential. We propose that any
such increases are likely due to the oxidation zone being
physically bypassed, through plants (Nouchi, Mariko &
Fig. 4 An Arrhenius plot showing the temperature dependency of
aerobic CO2 production in the two different sediment types. Mean
values and error bars � SE. The fine sediment (filled circles) CO2
production is faster but has a weaker response to temperature than
the coarse gravels.
© 2014 The Authors Freshwater Biology Published by John Wiley & Sons Ltd., Freshwater Biology, doi: 10.1111/fwb.12480
8 F. Shelley et al.
Aoki, 1990; Chanton et al., 1993; Sanders et al., 2007),
ebullition (Prairie & Del Giorgio, 2013; Crawford et al.,
2014) or diel contraction of the oxic layer (King, 1990).
Indeed, the seasonal pattern in river water CH4 concen-
tration, often with a peak in summer (Devol et al., 1990;
Trimmer et al., 2009a,b; Kon�e et al., 2010), clearly shows
that some CH4 is avoiding oxidation in the river bed. If
some of the CH4 produced in fine sediments bypasses
methanotrophy, then the relationship between the ratio
of CH4 to CO2 emitted and temperature (Fig. 2) will
apply, and an increasing amount of carbon will be emit-
ted as CH4 with warming. In addition, the coverage of
fine sediment patches, as a proportion of river bed,
changes seasonally from c. 75% in mid-summer to
c. 10% at the end of winter when most of the macro-
phytes have died back (Sand-Jensen, 1998; Cotton et al.,
2006; Shelley et al., 2014).
As far as we are aware, the data presented are the
first to show the potential effect of warming on the
individual CH4 cycling processes and the feedbacks
between them as substrate concentrations vary across
a heterogeneous river bed. We have demonstrated the
potential for CH4 oxidation to respond rapidly to
increasing CH4 production, mitigating efflux of CH4
diffusing through the anoxic–oxic sediment layer. In
clear-water rivers, water column methanotrophy is
negligible. Consequently, once the CH4 is in the over-
lying river water, the permeable, oxic gravel beds are
the final barrier to CH4 escaping to the atmosphere.
Although the rates of oxidation in the gravels are
comparatively slow, relative to the surface fine sedi-
ment layer, the large three-dimensional volume (to
some 35 cm in depth) of the gravels means that they
do oxidise a substantial amount of CH4 to CO2 (Shel-
ley et al., 2014), the less potent of the two GHGs, and,
therefore, provide an important role in carbon cycling
that has, until recently, largely been ignored.
Acknowledgments
The work was funded by the Natural Environment
Research Council and the Freshwater Biological Associa-
tion as part of a PhD studentship. We thank Mr Rams-
botham of Ovington for access to the River Itchen.
References
Aufdenkampe A.K., Mayorga E., Raymond P.A., Melack
J.M., Doney S.C., Alin S.R. et al. (2011) Riverine coupling
of biogeochemical cycles between land, oceans, and atmo-
sphere. Frontiers in Ecology and the Environment, 9, 53–60.
Bastviken D., Cole J.J., Pace M.L. & Van De Bogert M.C.
(2008) Fates of methane from different lake habitats: con-
necting whole-lake budgets and CH(4) emissions. Journal
of Geophysical Research-Biogeosciences, 113, G02024, doi:10.
1029/2007JG000608.
Bastviken D., Tranvik L.J., Downing J.A., Crill P.M. &
Enrich-Prast A. (2011) Freshwater methane emissions off-
set the continental carbon sink. Science, 331, 50.
Battin T.J., Luyssaert S., Kaplan L.A., Aufdenkampe A.K.,
Richter A. & Tranvik L.J. (2009) The boundless carbon
cycle. Nature Geoscience, 2, 598–600.
Bellamy P.H., Loveland P.J., Bradley R.I., Lark R.M. & Kirk
G.J.D. (2005) Carbon losses from all soils across England
and Wales 1978-2003. Nature, 437, 245–248.
Bergman I., Svensson B.H. & Nilsson M. (1998) Regulation
of methane production in a Swedish acid mire by pH,
temperature and substrate. Soil Biology and Biochemistry,
30, 729–741.
Bernot M.J., Sobota D.J., Hall R.O., Mulholland P.J., Dodds
W.K., Webster J.R. et al. (2010) Inter-regional comparison
of land-use effects on stream metabolism. Freshwater Biol-
ogy, 55, 1874–1890.
Bogner J.E., Spokas K.A. & Burton E.A. (1997) Kinetics of
methane oxidation in a landfill cover soil: temporal varia-
tions, a whole-landfill oxidation experiment, and model-
ing of net CH4 emissions. Environmental Science &
Technology, 31, 2504–2514.
Chanton J.P., Whiting G.J., Happell J.D. & Gerard G. (1993)
Contrasting rates and diurnal patterns of methane emis-
sion from emergent aquatic macrophytes. Aquatic Botany,
46, 111–128.
Cole J.J. & Caraco N.F. (2001) Carbon in catchments: con-
necting terrestrial carbon losses with aquatic metabolism.
Marine and Freshwater Research, 52, 101–110.
Cole J.J., Prairie Y.T., Caraco N.F., Mcdowell W.H., Tranvik
L.J., Striegl R.G. et al. (2007) Plumbing the global carbon
cycle: integrating inland waters into the terrestrial carbon
budget. Ecosystems, 10, 171–184.
Collins A.L. & Walling D.E. (2007) Sources of fine sediment
recovered from the channel bed of lowland groundwater-
fed catchments in the UK. Geomorphology, 88, 120–138.
Cotton J.A., Wharton G., Bass J.a.B., Heppell C.M., Wotton
R.S. (2006) The effects of seasonal changes to in-stream
vegetation cover on patterns of flow and accumulation of
sediment. Geomorphology, 77, 320–334.
Crawford J.T., Stanley E.H., Spawn S.A., Finlay J.C., Loken
L.C. & Striegl R.G. (2014) Ebullitive methane emissions
from oxygenated wetland streams. Global Change Biology,
doi:10.1111/gcb.12614.
Deutzmann J.S., W€orner S. & Schink B. (2011) Activity and
diversity of methanotrophic bacteria at methane seeps in
eastern Lake Constance sediments. Applied and Environ-
mental Microbiology, 77, 2573–2581.
Devol A.H., Richey J.E., Forsberg B.R. & Martinelli L.A.
(1990) Seasonal dynamics in methane emissions from the
© 2014 The Authors Freshwater Biology Published by John Wiley & Sons Ltd., Freshwater Biology, doi: 10.1111/fwb.12480
Methanotrophic capacity tracks methane production in river bed sediments 9

Amazon River floodplain to the troposphere. Journal of
Geophysical Research: Atmospheres, 95, 16417–16426.
Duc N.T., Crill P. & Bastviken D. (2010) Implications of
temperature and sediment characteristics on methane for-
mation and oxidation in lake sediments. Biogeochemistry,
100, 185–196.
Dunfield P., Knowles R., Dumont R. & Moore T.R. (1993)
Methane production and consumption in temperate and
subarctic peat soils: response to temperature and pH. Soil
Biology and Biochemistry, 25, 321–326.
Eller G., Deines P., Grey J., Richnow H.H. & Kruger M.
(2005) Methane cycling in lake sediments and its influ-
ence on chironomid larval partial derivative(13)C. Fems
Microbiology Ecology, 54, 339–350.
Ettwig K.F. et al. (2010) Nitrite-driven anaerobic methane
oxidation by oxygenic bacteria. Nature, 464, 543–548, doi:
http://www.nature.com/nature/journal/v464/n7288/
suppinfo/nature08883_S1.html.
Fey A. & Conrad R. (2003) Effect of temperature on the
rate limiting step in the methanogenic degradation
pathway in rice field soil. Soil Biology and Biochemistry,
35, 1–8.
Flynn N.J., Snook D.L., Wade A.J. & Jarvie H.P. (2002) Mac-
rophyte and periphyton dynamics in a UK Cretaceous
chalk stream: the River Kennet, a tributary of the Thames.
Science of the Total Environment, 282, 143–157.
Forster P., Ramaswamy V., Artaxo P., Berntsen T., Betts R.,
Fahey D.W. et al. (2007) Changes in Atmospheric Constitu-
ents and in Radiative Forcing. (Eds S. Solomon, D. Qin, M.
Manning, Z. Chen, M. Marquis , K.B. Averyt, M. Tignor
& H.L. Miller), pp. 129–234. Cambridge University Press,
Cambridge, UK.
Goudie A.S. (2006) Global warming and fluvial geomor-
phology. Geomorphology, 79, 384–394.
Greig S.M., Sear D.A. & Carling P.A. (2005) The impact of
fine sediment accumulation on the survival of incubating
salmon progeny: implications for sediment management.
Science of the Total Environment, 344, 241–258.
Gudasz C., Bastviken D., Steger K., Premke K., Sobek S. &
Tranvik L.J. (2010) Temperature-controlled organic carbon
mineralization in lake sediments. Nature, 466, 478–481.
Harris D. (2007) Quantitative Chemical Analysis. W. H. Free-
man and Company, New York.
Jones J.B. & Mulholland P.J. (1998) Influence of drainage
basin topography and elevation on carbon dioxide and
methane supersaturation of stream water. Biogeochemistry,
40, 57–72.
Kaller M.D. & Hartman K.J. (2004) Evidence of a threshold
level of fine sediment accumulation for altering benthic
macroinvertebrate communities. Hydrobiologia, 518, 95–104.
King G.M. (1990) Regulation by light of methane emissions
from a wetland. Nature, 345, 513–515.
Kon�e Y.J.M., Abril G., Delille B. & Borges A.V. (2010) Sea-
sonal variability of methane in the rivers and lagoons of
Ivory Coast (West Africa). Biogeochemistry, 100, 21–37.
Kotsyurbenko O.R., Chin K.J., Glagolev M.V., Stubner S.,
Simankova M.V., Nozhevnikova A.N. et al. (2004) Aceto-
clastic and hydrogenotrophic methane production and
methanogenic populations in an acidic West-Siberian peat
bog. Environmental Microbiology, 6, 1159–1173.
Lofton D.D., Whalen S.C. & Hershey A.E. (2014) Effect of
temperature on methane dynamics and evaluation of
methane oxidation kinetics in shallow Arctic Alaskan
lakes. Hydrobiologia, 721, 209–222.
Mackey A.P. & Berrie A.D. (1991) The prediction of water
temperatures in chalk streams from air temperatures.
Hydrobiologia, 210, 183–189.
Marotta H., Pinho L., Gudasz C., Bastviken D., Tranvik L.J.
& Enrich-Prast A. (2014) Greenhouse gas production in
low-latitude lake sediments responds strongly to warm-
ing. Nature Climate Change, 4, 467–470.
Megonigal J.P. & Schlesinger W. (2002) Methane-limited
methanotrophy in tidal freshwater swamps. Global Biogeo-
chemical Cycles, 16, 1088, doi:10.1029/2001GB001594.
Nouchi I., Mariko S. & Aoki K. (1990) Mechanism of meth-
ane transport from the rhizosphere to the atmosphere
through rice plants. Plant Physiology, 94, 59–66.
Odum H.T. (1956) Primary production in flowing waters.
Limnology and Oceanography, 1, 102–117.
Prairie Y. & Del Giorgio P. (2013) A new pathway of fresh-
water methane emissions and the putative importance of
microbubbles. Inland Waters, 3, 311–320.
Regaudie-De-Gioux A. & Duarte C.M. (2012) Temperature
dependence of planktonic metabolism in the ocean. Global
Biogeochemical Cycles, 26, GB1015.
Richey J.E., Melack J.M., Aufdenkampe A.K., Ballester V.M.
& Hess L.L. (2002) Outgassing from Amazonian rivers
and wetlands as a large tropical source of atmospheric
CO2. Nature, 416, 617–620.
Sanders I.A., Heppell C.M., Cotton J.A., Wharton G., Hil-
drew A.G., Flowers E.J. et al. (2007) Emission of methane
from chalk streams has potential implications for agricul-
tural practices. Freshwater Biology, 52, 1176–1186.
Sand-Jensen K. (1998) Influence of submerged macrophytes
on sediment composition and near-bed flow in lowland
streams. Freshwater Biology, 39, 663–679.
Shelley F., Grey J. & Trimmer M. (2014) Widespread met-
hanotrophic primary production in lowland chalk rivers.
Proceedings of the Royal Society B: Biological Sciences, 281,
10.1098/rspb.2013.2854.
Soulsby C., Youngson A.F., Moir H.J. & Malcolm I.A. (2001)
Fine sediment influence on salmonid spawning habitat in
a lowland agricultural stream: a preliminary assessment.
Science of the Total Environment, 265, 295–307.
Stanley E.H., Powers S.M., Lottig N.R., Buffam I. &
Crawford J.T. (2012) Contemporary changes in dissolved
organic carbon (DOC) in human-dominated rivers: is there
a role for DOC management? Freshwater Biology, 57, 26–42.
Stocker T.F., D. Qin, G.-K. Plattner, M. Tignor, S.K. Allen, J.
Boschung et al. (Eds.). (2013) IPCC, 2013: summary for
© 2014 The Authors Freshwater Biology Published by John Wiley & Sons Ltd., Freshwater Biology, doi: 10.1111/fwb.12480
10 F. Shelley et al.

policymakers. In: Climate Change 2013: The Physical Science
Basis. Contribution of Working Group I to the Fifth Assess-
ment Report of the Intergovernmental Panel on Climate
Change. p. 33. IPCC, Switzerland. http://www.ipcc.ch/
report/ar5/wg1/docs/WGIAR5_SPM_brochure_en.pdf
Tranvik L.J., Downing J.A., Cotner J.B., Loiselle S.A.,
Striegl R.G., Ballatore T.J. et al. (2009) Lakes and
reservoirs as regulators of carbon cycling and climate.
Limnology and Oceanography, 54, 2298–2314.
Trimmer M., Grey J., Heppell C.M., Hildrew A.G.,
Lansdown K., Stahl H. et al. (2012) River bed carbon and
nitrogen cycling: state of play and some new directions.
Science of the Total Environment, 434, 143–158.
Trimmer M., Hildrew A.G., Jackson M.C., Pretty J.L. &
Grey J. (2009a) Evidence for the role of methane-derived
carbon in a free-flowing, lowland river food web. Limnol-
ogy and Oceanography, 54, 1541–1547.
Trimmer M., Maanoja S., Hildrew A.G., Pretty J.L. & Grey
J. (2010) Potential carbon fixation via methane oxidation
in well-oxygenated riverbed gravels. Limnology and Ocean-
ography, 55, 560–568.
TrimmerM., Sanders I.A. &Heppell C.M. (2009b) Carbon and
nitrogen cycling in a vegetated lowland chalk river
impacted by sediment.Hydrological Processes, 23, 2225–2238.
Valentine D.W., Holland E.A. & Schimel D.S. (1994) Ecosys-
tem and physiological controls over methane production
in northern wetlands. Journal of Geophysical Research:
Atmospheres, 99, 1563–1571.
Walling D.E. & Amos C.M. (1999) Source, storage and
mobilisation of fine sediment in a chalk stream system.
Hydrological Processes, 13, 323–340.
Walling D.E., Collins A.L. & Mcmellin G.K. (2003) A recon-
naissance survey of the source of interstitial fine sediment
recovered from salmonid spawning gravels in England
and Wales. Hydrobiologia, 497, 91–108.
Weiss R.F. (1974) Carbon dioxide in water and seawater:
the solubility of a non-ideal gas. Marine Chemistry, 2,
203–215.
Whiticar M.J., Faber E. & Schoell M. (1986) Biogenic meth-
ane formation in marine and freshwater environments:
CO2 reduction vs. acetate fermentation—Isotope evi-
dence. Geochimica Et Cosmochimica Acta, 50, 693–709.
Worrall F., Harriman R., Evans C.D., Watts C., Adamson J.,
Neal C. et al. (2004) Trends in dissolved organic carbon
in UK rivers and lakes. Biogeochemistry, 70, 369–402.
Yamamoto S., Alcauskas J.B. & Crozier T.E. (1976) Solubility
of methane in distilled water and seawater. Journal of
Chemical and Engineering Data, 21, 78–80.
Yvon-Durocher G., Allen A.P., Bastviken D., Conrad R.,
Gudasz C., St-Pierre A. et al. (2014) Methane fluxes show
consistent temperature dependence across microbial to
ecosystem scales. Nature, 507, 488–491.
Yvon-Durocher G., Jones J.I., Trimmer M., Woodward G. &
Montoya J.M. (2010a) Warming alters the metabolic bal-
ance of ecosystems. Philosophical Transactions of the Royal
Society B: Biological Sciences, 365, 2117–2126.
Yvon-Durocher G., Montoya J.M., Woodward G.U.Y., Jones
J.I. & Trimmer M. (2010b) Warming increases the propor-
tion of primary production emitted as methane from
freshwater mesocosms. Global Change Biology, 17,
1225–1234.
Zeug S.C. & Winemiller K.O. (2008) Evidence supporting
the importance of terrestrial carbon in a large-river food
web. Ecology, 89, 1733–1743.
(Manuscript accepted 11 September 2014)
© 2014 The Authors Freshwater Biology Published by John Wiley & Sons Ltd., Freshwater Biology, doi: 10.1111/fwb.12480
Methanotrophic capacity tracks methane production in river bed sediments 11


