Embed Size (px)
Citation preview
Microsoft Excel Data Analysis and Business Modeling (Office 2021 and Microsoft 365)7th Edition
Wayne Winston
A01_Winston_FM_pi-xxx.indd 1 27/10/21 2:20 PM
MICROSOFT EXCEL DATA ANALYSIS AND BUSINESS MODELING (OFFICE 2021 AND MICROSOFT 365), 7TH EDITION
Published with the authorization of Microsoft Corporation by: Pearson Education, Inc. Copyright © 2022 by Pearson Education, Inc.
All rights reserved. This publication is protected by copyright, and permission must be obtained from the publisher prior to any prohibited reproduction, storage in a retrieval system, or transmission in any form or by any means, electronic, mechanical, photo-copying, recording, or likewise. For information regarding permissions, request forms, and the appropriate contacts within the Pearson Education Global Rights & Permissions Department, please visit www.pearson.com/permissions.
No patent liability is assumed with respect to the use of the information contained herein. Although every precaution has been taken in the preparation of this book, the publisher and author assume no responsibility for errors or omissions. Nor is any liabil-ity assumed for damages resulting from the use of the information contained herein.
ISBN-13: 978-0-13-761366-3 ISBN-10: 0-13-761366-0
Library of Congress Control Number: 2021948290
ScoutAutomatedPrintCode
Trademarks
Microsoft and the trademarks listed at http://www.microsoft.com on the “Trademarks” webpage are trademarks of the Microsoft group of companies. All other marks are property of their respective owners.
Warning and Disclaimer
Every effort has been made to make this book as complete and as accurate as possible, but no warranty or fitness is implied. The information provided is on an “as is” basis. The author, the publisher, and Microsoft Corporation shall have neither liability nor respon-sibility to any person or entity with respect to any loss or damages arising from the information contained in this book or from the use of the programs accompanying it.
Special Sales
For information about buying this title in bulk quantities, or for special sales opportunities (which may include electronic versions; custom cover designs; and content particular to your business, training goals, marketing focus, or branding interests), please contact our corporate sales department at [email protected] or (800) 382-3419.
For government sales inquiries, please contact [email protected].
For questions about sales outside the U.S., please contact [email protected].
EDITOR-IN-CHIEF
Brett Bartow
EXECUTIVE EDITOR
Loretta Yates
SPONSORING EDITOR
Charvi Arora
DEVELOPMENT EDITOR
Kate Shoup
MANAGING EDITOR
Sandra Schroeder
SENIOR PROJECT EDITOR
Tracey Croom
COPY EDITOR
Scout Festa
INDEXER
Erika Millen
PROOFREADER
Abigail Manheim
TECHNICAL EDITOR
David Franson
EDITORIAL ASSISTANT
Cindy Teeters
COVER DESIGNER
Twist Creative, Seattle
COMPOSITOR
codeMantra
A01_Winston_FM_pi-xxx.indd 2 28/10/21 6:35 PM

iii
Pearson’s Commitment to Diversity, Equity, and Inclusion
Pearson is dedicated to creating bias-free content that reflects the diversity of all learners. We embrace the many dimensions of diversity, including but not limited to race, ethnicity, gender, socioeconomic status, ability, age, sexual orientation, and religious or political beliefs.
Education is a powerful force for equity and change in our world. It has the potential to deliver opportunities that improve lives and enable economic mobility. As we work with authors to create content for every product and service, we acknowledge our responsibility to demonstrate inclusivity and incorporate diverse scholarship so that everyone can achieve their potential through learning. As the world’s leading learning company, we have a duty to help drive change and live up to our purpose to help more people create a better life for themselves and to create a better world.
Our ambition is to purposefully contribute to a world where:
■ Everyone has an equitable and lifelong opportunity to succeed through learning.
■ Our educational products and services are inclusive and represent the rich diversity of learners.
■ Our educational content accurately reflects the histories and experi-ences of the learners we serve.
■ Our educational content prompts deeper discussions with learners and motivates them to expand their own learning (and worldview).
While we work hard to present unbiased content, we want to hear from you about any concerns or needs with this Pearson product so that we can investigate and address them.
■ Please contact us with concerns about any potential bias at https://www.pearson.com/report-bias.html.
A01_Winston_FM_pi-xxx.indd 3 28/10/21 5:02 PM

iv
Dedication
To Vivian, Jen, and Greg. You are all so great, and I love all of you so much!
A01_Winston_FM_pi-xxx.indd 4 28/10/21 5:02 PM
v
Contents at a Glance
About the Author xxiii
Introduction xxv
CHAPTER 1 Basic worksheet modeling 1
CHAPTER 2 Range names 11
CHAPTER 3 Lookup functions 25
CHAPTER 4 The INDEX function 39
CHAPTER 5 The MATCH function 43
CHAPTER 6 Text functions and Flash Fill 51
CHAPTER 7 Dates and date functions 73
CHAPTER 8 The net present value functions: NPV and XNPV 85
CHAPTER 9 The internal rate of return: IRR, XIRR, and MIRR functions 93
CHAPTER 10 More Excel financial functions 101
CHAPTER 11 Circular references 117
CHAPTER 12 IF, IFERROR, IFS, CHOOSE, SWITCH, and the IS functions 123
CHAPTER 13 Time and time functions 149
CHAPTER 14 The Paste Special command 157
CHAPTER 15 Three-dimensional formulas and hyperlinks 165
CHAPTER 16 The auditing tool and the Inquire add-in 171
CHAPTER 17 Sensitivity analysis with data tables 183
CHAPTER 18 The Goal Seek command 197
CHAPTER 19 Using the Scenario Manager for sensitivity analysis 203
CHAPTER 20 The COUNTIF, COUNTIFS, COUNT, COUNTA, and COUNTBLANK functions 209
CHAPTER 21 The SUMIF, AVERAGEIF, SUMIFS, AVERAGEIFS, MAXIFS, and MINIFS functions 217
CHAPTER 22 The OFFSET function 225
CHAPTER 23 The INDIRECT function 239
CHAPTER 24 Conditional formatting 251
CHAPTER 25 Excel tables and table slicers 283
A01_Winston_FM_pi-xxx.indd 5 27/10/21 2:20 PM
vi Contents at a Glance
CHAPTER 26 Spin buttons, scrollbars, option buttons, check boxes, combo boxes, and group list boxes 301
CHAPTER 27 Importing data from a text file or document 315
CHAPTER 28 The Power Query Editor 321
CHAPTER 29 Excel’s new data types 343
CHAPTER 30 Summarizing data with histograms and Pareto charts 363
CHAPTER 31 Summarizing data with descriptive statistics 377
CHAPTER 32 Sorting in Excel 397
CHAPTER 33 Filtering data and removing duplicates 411
CHAPTER 34 Summarizing data with database statistical functions 429
CHAPTER 35 Array formulas and functions 441
CHAPTER 36 Excel’s new dynamic array functions 461
CHAPTER 37 Validating data 473
CHAPTER 38 Using PivotTables and slicers to describe data 483
CHAPTER 39 The Data Model 541
CHAPTER 40 Power Pivot 551
CHAPTER 41 Consolidating data 571
CHAPTER 42 Creating subtotals 577
CHAPTER 43 Basic charting 585
CHAPTER 44 Advanced charting 617
CHAPTER 45 Filled and 3D Maps 643
CHAPTER 46 Sparklines 659
CHAPTER 47 Estimating straight-line relationships 665
CHAPTER 48 Modeling exponential growth 675
CHAPTER 49 The power curve 681
CHAPTER 50 Using correlations to summarize relationships 689
CHAPTER 51 Introduction to multiple regression 697
CHAPTER 52 Incorporating qualitative factors into multiple regression 705
CHAPTER 53 Modeling nonlinearities and interactions 719
CHAPTER 54 Analysis of variance: One-way ANOVA 727
CHAPTER 55 Randomized blocks and two-way ANOVA 733
CHAPTER 56 Using moving averages to understand time series 745
A01_Winston_FM_pi-xxx.indd 6 27/10/21 2:20 PM
Contents at a Glance vii
CHAPTER 57 Ratio-to-moving-average forecast method 749
CHAPTER 58 An introduction to probability 753
CHAPTER 59 An introduction to random variables 763
CHAPTER 60 The binomial, hypergeometric, and negative binomial random variables 769
CHAPTER 61 The Poisson and exponential random variable 777
CHAPTER 62 The normal random variable and Z-scores 781
CHAPTER 63 Making probability statements from forecasts 791
CHAPTER 64 Using the lognormal random variable to model stock prices 795
CHAPTER 65 Importing past stock prices, exchange rates, and cryptocurrency prices with the STOCKHISTORY function 799
CHAPTER 66 An introduction to optimization with Excel Solver 807
CHAPTER 67 Using Solver to determine the optimal product mix 813
CHAPTER 68 Using Solver to schedule your workforce 825
CHAPTER 69 Using Solver to solve transportation or distribution problems 831
CHAPTER 70 Using Solver for capital budgeting 837
CHAPTER 71 Using Solver for financial planning 845
CHAPTER 72 Using Solver to rate sports teams 853
CHAPTER 73 The Winters method and the Forecast Sheet tool 859
CHAPTER 74 Forecasting in the presence of special events 869
CHAPTER 75 Warehouse location and the GRG Multistart and Evolutionary Solver engines 877
CHAPTER 76 Penalties and the Evolutionary Solver 889
CHAPTER 77 The traveling salesperson problem 895
CHAPTER 78 Weibull and beta distributions: Modeling machine life and duration of a project 901
CHAPTER 79 Introduction to Monte Carlo simulation 907
CHAPTER 80 Calculating an optimal bid 919
CHAPTER 81 Simulating stock prices and asset-allocation modeling 925
CHAPTER 82 Fun and games: Simulating gambling and sporting-event probabilities 937
A01_Winston_FM_pi-xxx.indd 7 27/10/21 2:20 PM
viii Contents at a Glance
CHAPTER 83 Using resampling to analyze data 947
CHAPTER 84 Pricing stock options 953
CHAPTER 85 Determining customer value 967
CHAPTER 86 The economic order quantity inventory model 973
CHAPTER 87 Inventory modeling with uncertain demand 979
CHAPTER 88 Queuing theory: The mathematics of waiting in line 987
CHAPTER 89 Estimating a demand curve 993
CHAPTER 90 Pricing products by using tie-ins 999
CHAPTER 91 Pricing products by using subjectively determined demand 1005
CHAPTER 92 Nonlinear pricing 1011
CHAPTER 93 Use Analyze Data to find patterns in your data 1019
CHAPTER 94 Recording macros 1031
CHAPTER 95 The LET and LAMBDA functions and the LAMBDA helper functions 1049
CHAPTER 96 Advanced sensitivity analysis 1063
Index 1067
A01_Winston_FM_pi-xxx.indd 8 27/10/21 2:20 PM
ix
Contents
About the Author . . . . . . . . . . . . . . . . . . . . . . . . . . . . . . . . . . . . . . . . . . . . . . . . . . . xxiii
Introduction . . . . . . . . . . . . . . . . . . . . . . . . . . . . . . . . . . . . . . . . . . . . . . . . . . . . . . . . xxv
Chapter 1 Basic worksheet modeling 1Answers to this chapter’s questions . . . . . . . . . . . . . . . . . . . . . . . . . . . . . . . . . . 1
Problems . . . . . . . . . . . . . . . . . . . . . . . . . . . . . . . . . . . . . . . . . . . . . . . . . . . . . . . . . . . 9
Chapter 2 Range names 11How can I create named ranges? . . . . . . . . . . . . . . . . . . . . . . . . . . . . . . . . . . . . . 11
Using the Name box to create a range name . . . . . . . . . . . . . . . . . . . . 12Creating named ranges using the Create from Selection option . 13Creating range names using the Define Name option . . . . . . . . . . . 15The Name Manager . . . . . . . . . . . . . . . . . . . . . . . . . . . . . . . . . . . . . . . . . . . 16
Answers to this chapter’s questions . . . . . . . . . . . . . . . . . . . . . . . . . . . . . . . . . . 17
Remarks . . . . . . . . . . . . . . . . . . . . . . . . . . . . . . . . . . . . . . . . . . . . . . . . . . . . . . . . . . . . 23
Problems . . . . . . . . . . . . . . . . . . . . . . . . . . . . . . . . . . . . . . . . . . . . . . . . . . . . . . . . . . . 23
Chapter 3 Lookup functions 25Syntax of the lookup functions . . . . . . . . . . . . . . . . . . . . . . . . . . . . . . . . . . . . . . . 25
VLOOKUP syntax . . . . . . . . . . . . . . . . . . . . . . . . . . . . . . . . . . . . . . . . . . . . . . 25HLOOKUP syntax . . . . . . . . . . . . . . . . . . . . . . . . . . . . . . . . . . . . . . . . . . . . . 26XLOOKUP syntax . . . . . . . . . . . . . . . . . . . . . . . . . . . . . . . . . . . . . . . . . . . . . . 26
Answers to this chapter’s questions . . . . . . . . . . . . . . . . . . . . . . . . . . . . . . . . . . 27
Problems . . . . . . . . . . . . . . . . . . . . . . . . . . . . . . . . . . . . . . . . . . . . . . . . . . . . . . . . . . . 35
Chapter 4 The INDEX function 39Syntax of the INDEX function . . . . . . . . . . . . . . . . . . . . . . . . . . . . . . . . . . . . . . . . 39
Answers to this chapter’s questions . . . . . . . . . . . . . . . . . . . . . . . . . . . . . . . . . . 39
Problems . . . . . . . . . . . . . . . . . . . . . . . . . . . . . . . . . . . . . . . . . . . . . . . . . . . . . . . . . . . 41
A01_Winston_FM_pi-xxx.indd 9 27/10/21 2:20 PM
x Contents
Chapter 5 The MATCH function 43Syntax of the MATCH function . . . . . . . . . . . . . . . . . . . . . . . . . . . . . . . . . . . . . . . 43
Answers to this chapter’s questions . . . . . . . . . . . . . . . . . . . . . . . . . . . . . . . . . . 45
Problems . . . . . . . . . . . . . . . . . . . . . . . . . . . . . . . . . . . . . . . . . . . . . . . . . . . . . . . . . . . 49
Chapter 6 Text functions and Flash Fill 51Text function syntax . . . . . . . . . . . . . . . . . . . . . . . . . . . . . . . . . . . . . . . . . . . . . . . . . 52
Answers to this chapter’s questions . . . . . . . . . . . . . . . . . . . . . . . . . . . . . . . . . . 56
Problems . . . . . . . . . . . . . . . . . . . . . . . . . . . . . . . . . . . . . . . . . . . . . . . . . . . . . . . . . . . 69
Chapter 7 Dates and date functions 73Answers to this chapter’s questions . . . . . . . . . . . . . . . . . . . . . . . . . . . . . . . . . . 74
Problems . . . . . . . . . . . . . . . . . . . . . . . . . . . . . . . . . . . . . . . . . . . . . . . . . . . . . . . . . . . 82
Chapter 8 The net present value functions: NPV and XNPV 85Answers to this chapter’s questions . . . . . . . . . . . . . . . . . . . . . . . . . . . . . . . . . . 86
Problems . . . . . . . . . . . . . . . . . . . . . . . . . . . . . . . . . . . . . . . . . . . . . . . . . . . . . . . . . . . 90
Chapter 9 The internal rate of return: IRR, XIRR, and MIRR functions 93Answers to this chapter’s questions . . . . . . . . . . . . . . . . . . . . . . . . . . . . . . . . . . 94
Problems . . . . . . . . . . . . . . . . . . . . . . . . . . . . . . . . . . . . . . . . . . . . . . . . . . . . . . . . . . . 98
Chapter 10 More Excel financial functions 101Answers to this chapter’s questions . . . . . . . . . . . . . . . . . . . . . . . . . . . . . . . . . 101
Problems . . . . . . . . . . . . . . . . . . . . . . . . . . . . . . . . . . . . . . . . . . . . . . . . . . . . . . . . . . 112
Chapter 11 Circular references 117Answers to this chapter’s questions . . . . . . . . . . . . . . . . . . . . . . . . . . . . . . . . . 117
Problems . . . . . . . . . . . . . . . . . . . . . . . . . . . . . . . . . . . . . . . . . . . . . . . . . . . . . . . . . . 120
A01_Winston_FM_pi-xxx.indd 10 27/10/21 2:20 PM

Contents xi
Chapter 12 IF, IFERROR, IFS, CHOOSE, SWITCH, and the IS functions 123Answers to this chapter’s questions . . . . . . . . . . . . . . . . . . . . . . . . . . . . . . . . . 124
Problems . . . . . . . . . . . . . . . . . . . . . . . . . . . . . . . . . . . . . . . . . . . . . . . . . . . . . . . . . . 143
Chapter 13 Time and time functions 149Answers to this chapter’s questions . . . . . . . . . . . . . . . . . . . . . . . . . . . . . . . . . 150
Problems . . . . . . . . . . . . . . . . . . . . . . . . . . . . . . . . . . . . . . . . . . . . . . . . . . . . . . . . . . 155
Chapter 14 The Paste Special command 157Answers to this chapter’s questions . . . . . . . . . . . . . . . . . . . . . . . . . . . . . . . . . 157
Problems . . . . . . . . . . . . . . . . . . . . . . . . . . . . . . . . . . . . . . . . . . . . . . . . . . . . . . . . . . 163
Chapter 15 Three-dimensional formulas and hyperlinks 165Answers to this chapter’s questions . . . . . . . . . . . . . . . . . . . . . . . . . . . . . . . . . 165
Problems . . . . . . . . . . . . . . . . . . . . . . . . . . . . . . . . . . . . . . . . . . . . . . . . . . . . . . . . . . 169
Chapter 16 The auditing tool and the Inquire add-in 171Excel auditing options . . . . . . . . . . . . . . . . . . . . . . . . . . . . . . . . . . . . . . . . . . . . . . 172
Show Formulas . . . . . . . . . . . . . . . . . . . . . . . . . . . . . . . . . . . . . . . . . . . . . . . 172Error Checking . . . . . . . . . . . . . . . . . . . . . . . . . . . . . . . . . . . . . . . . . . . . . . . 173Watch Window . . . . . . . . . . . . . . . . . . . . . . . . . . . . . . . . . . . . . . . . . . . . . . 174Trace Precedents, Trace Dependents, and Remove Arrows . . . . . . 174
Answers to this chapter’s questions . . . . . . . . . . . . . . . . . . . . . . . . . . . . . . . . . 175
Problems . . . . . . . . . . . . . . . . . . . . . . . . . . . . . . . . . . . . . . . . . . . . . . . . . . . . . . . . . . 182
Chapter 17 Sensitivity analysis with data tables 183Answers to this chapter’s questions . . . . . . . . . . . . . . . . . . . . . . . . . . . . . . . . . 184
Problems . . . . . . . . . . . . . . . . . . . . . . . . . . . . . . . . . . . . . . . . . . . . . . . . . . . . . . . . . . 192
Chapter 18 The Goal Seek command 197Answers to this chapter’s questions . . . . . . . . . . . . . . . . . . . . . . . . . . . . . . . . . 198
Problems . . . . . . . . . . . . . . . . . . . . . . . . . . . . . . . . . . . . . . . . . . . . . . . . . . . . . . . . . . 201
A01_Winston_FM_pi-xxx.indd 11 27/10/21 2:20 PM
xii Contents
Chapter 19 Using the Scenario Manager for sensitivity analysis 203Answer to this chapter’s question . . . . . . . . . . . . . . . . . . . . . . . . . . . . . . . . . . . 203
Remarks . . . . . . . . . . . . . . . . . . . . . . . . . . . . . . . . . . . . . . . . . . . . . . . . . . . . . . . . . . . 207
Problems . . . . . . . . . . . . . . . . . . . . . . . . . . . . . . . . . . . . . . . . . . . . . . . . . . . . . . . . . . 207
Chapter 20 The COUNTIF, COUNTIFS, COUNT, COUNTA, and COUNTBLANK functions 209Answers to this chapter’s questions . . . . . . . . . . . . . . . . . . . . . . . . . . . . . . . . . 211
Remarks . . . . . . . . . . . . . . . . . . . . . . . . . . . . . . . . . . . . . . . . . . . . . . . . . . . . . . . . . . . 214
Problems . . . . . . . . . . . . . . . . . . . . . . . . . . . . . . . . . . . . . . . . . . . . . . . . . . . . . . . . . . 214
Chapter 21 The SUMIF, AVERAGEIF, SUMIFS, AVERAGEIFS, MAXIFS, and MINIFS functions 217Answers to this chapter’s questions . . . . . . . . . . . . . . . . . . . . . . . . . . . . . . . . . 218
Problems . . . . . . . . . . . . . . . . . . . . . . . . . . . . . . . . . . . . . . . . . . . . . . . . . . . . . . . . . . 222
Chapter 22 The OFFSET function 225Answers to this chapter’s questions . . . . . . . . . . . . . . . . . . . . . . . . . . . . . . . . . 226
Remarks . . . . . . . . . . . . . . . . . . . . . . . . . . . . . . . . . . . . . . . . . . . . . . . . . . . . . . . . . . . 236
Problems . . . . . . . . . . . . . . . . . . . . . . . . . . . . . . . . . . . . . . . . . . . . . . . . . . . . . . . . . . 236
Chapter 23 The INDIRECT function 239Answers to this chapter’s questions . . . . . . . . . . . . . . . . . . . . . . . . . . . . . . . . . 240
Problems . . . . . . . . . . . . . . . . . . . . . . . . . . . . . . . . . . . . . . . . . . . . . . . . . . . . . . . . . . 248
Chapter 24 Conditional formatting 251Answers to this chapter’s questions . . . . . . . . . . . . . . . . . . . . . . . . . . . . . . . . . 253
Problems . . . . . . . . . . . . . . . . . . . . . . . . . . . . . . . . . . . . . . . . . . . . . . . . . . . . . . . . . . 278
Chapter 25 Excel tables and table slicers 283Answers to this chapter’s questions . . . . . . . . . . . . . . . . . . . . . . . . . . . . . . . . . 283
Problems . . . . . . . . . . . . . . . . . . . . . . . . . . . . . . . . . . . . . . . . . . . . . . . . . . . . . . . . . . 298
A01_Winston_FM_pi-xxx.indd 12 27/10/21 2:20 PM
Contents xiii
Chapter 26 Spin buttons, scrollbars, option buttons, check boxes, combo boxes, and group list boxes 301Answers to this chapter’s questions . . . . . . . . . . . . . . . . . . . . . . . . . . . . . . . . . 302
Problems . . . . . . . . . . . . . . . . . . . . . . . . . . . . . . . . . . . . . . . . . . . . . . . . . . . . . . . . . . 313
Chapter 27 Importing data from a text file or document 315Answers to this chapter’s question . . . . . . . . . . . . . . . . . . . . . . . . . . . . . . . . . . 315
Problems . . . . . . . . . . . . . . . . . . . . . . . . . . . . . . . . . . . . . . . . . . . . . . . . . . . . . . . . . . 320
Chapter 28 The Power Query Editor 321Answers to this chapter’s questions . . . . . . . . . . . . . . . . . . . . . . . . . . . . . . . . . 323
Problems . . . . . . . . . . . . . . . . . . . . . . . . . . . . . . . . . . . . . . . . . . . . . . . . . . . . . . . . . . 340
Chapter 29 Excel’s new data types 343Answers to this chapter’s questions . . . . . . . . . . . . . . . . . . . . . . . . . . . . . . . . . 347
Problems . . . . . . . . . . . . . . . . . . . . . . . . . . . . . . . . . . . . . . . . . . . . . . . . . . . . . . . . . . 362
Chapter 30 Summarizing data with histograms and Pareto charts 363Answers to this chapter’s questions . . . . . . . . . . . . . . . . . . . . . . . . . . . . . . . . . 363
Problems . . . . . . . . . . . . . . . . . . . . . . . . . . . . . . . . . . . . . . . . . . . . . . . . . . . . . . . . . . 376
Chapter 31 Summarizing data with descriptive statistics 377Answers to this chapter’s questions . . . . . . . . . . . . . . . . . . . . . . . . . . . . . . . . . 378
Problems . . . . . . . . . . . . . . . . . . . . . . . . . . . . . . . . . . . . . . . . . . . . . . . . . . . . . . . . . . 393
Chapter 32 Sorting in Excel 397Answers to this chapter’s questions . . . . . . . . . . . . . . . . . . . . . . . . . . . . . . . . . 398
Problems . . . . . . . . . . . . . . . . . . . . . . . . . . . . . . . . . . . . . . . . . . . . . . . . . . . . . . . . . . 409
Chapter 33 Filtering data and removing duplicates 411Answers to this chapter’s questions . . . . . . . . . . . . . . . . . . . . . . . . . . . . . . . . . 413
Problems . . . . . . . . . . . . . . . . . . . . . . . . . . . . . . . . . . . . . . . . . . . . . . . . . . . . . . . . . . 428
A01_Winston_FM_pi-xxx.indd 13 27/10/21 2:20 PM
xiv Contents
Chapter 34 Summarizing data with database statistical functions 429Answers to this chapter’s questions . . . . . . . . . . . . . . . . . . . . . . . . . . . . . . . . . 431
Problems . . . . . . . . . . . . . . . . . . . . . . . . . . . . . . . . . . . . . . . . . . . . . . . . . . . . . . . . . . 438
Chapter 35 Array formulas and functions 441Answers to this chapter’s questions . . . . . . . . . . . . . . . . . . . . . . . . . . . . . . . . . 442
Problems . . . . . . . . . . . . . . . . . . . . . . . . . . . . . . . . . . . . . . . . . . . . . . . . . . . . . . . . . . 458
Chapter 36 Excel’s new dynamic array functions 461Answers to this chapter’s questions . . . . . . . . . . . . . . . . . . . . . . . . . . . . . . . . . 461
Problems . . . . . . . . . . . . . . . . . . . . . . . . . . . . . . . . . . . . . . . . . . . . . . . . . . . . . . . . . . 471
Chapter 37 Validating data 473Answers to this chapter’s questions . . . . . . . . . . . . . . . . . . . . . . . . . . . . . . . . . 473
Remarks . . . . . . . . . . . . . . . . . . . . . . . . . . . . . . . . . . . . . . . . . . . . . . . . . . . . . . . . . . . 481
Problems . . . . . . . . . . . . . . . . . . . . . . . . . . . . . . . . . . . . . . . . . . . . . . . . . . . . . . . . . . 481
Chapter 38 Using PivotTables and slicers to describe data 483Answers to this chapter’s questions . . . . . . . . . . . . . . . . . . . . . . . . . . . . . . . . . 485
Problems . . . . . . . . . . . . . . . . . . . . . . . . . . . . . . . . . . . . . . . . . . . . . . . . . . . . . . . . . . 536
Chapter 39 The Data Model 541Answers to this chapter’s questions . . . . . . . . . . . . . . . . . . . . . . . . . . . . . . . . . 542
Problems . . . . . . . . . . . . . . . . . . . . . . . . . . . . . . . . . . . . . . . . . . . . . . . . . . . . . . . . . . 550
Chapter 40 Power Pivot 551Answers to this chapter’s questions . . . . . . . . . . . . . . . . . . . . . . . . . . . . . . . . . 552
Problems . . . . . . . . . . . . . . . . . . . . . . . . . . . . . . . . . . . . . . . . . . . . . . . . . . . . . . . . . . 570
Chapter 41 Consolidating data 571Answer to this chapter’s question . . . . . . . . . . . . . . . . . . . . . . . . . . . . . . . . . . . 571
Problems . . . . . . . . . . . . . . . . . . . . . . . . . . . . . . . . . . . . . . . . . . . . . . . . . . . . . . . . . . 575
A01_Winston_FM_pi-xxx.indd 14 27/10/21 2:20 PM
Contents xv
Chapter 42 Creating subtotals 577Answers to this chapter’s questions . . . . . . . . . . . . . . . . . . . . . . . . . . . . . . . . . 577
Problems . . . . . . . . . . . . . . . . . . . . . . . . . . . . . . . . . . . . . . . . . . . . . . . . . . . . . . . . . . 583
Chapter 43 Basic charting 585Answers to this chapter’s questions . . . . . . . . . . . . . . . . . . . . . . . . . . . . . . . . . 586
Problems . . . . . . . . . . . . . . . . . . . . . . . . . . . . . . . . . . . . . . . . . . . . . . . . . . . . . . . . . . 614
Chapter 44 Advanced charting 617Answers to this chapter’s questions . . . . . . . . . . . . . . . . . . . . . . . . . . . . . . . . . 618
Problems . . . . . . . . . . . . . . . . . . . . . . . . . . . . . . . . . . . . . . . . . . . . . . . . . . . . . . . . . . 641
Chapter 45 Filled and 3D Maps 643Questions answered in this chapter . . . . . . . . . . . . . . . . . . . . . . . . . . . . . . . . . 643
Problems . . . . . . . . . . . . . . . . . . . . . . . . . . . . . . . . . . . . . . . . . . . . . . . . . . . . . . . . . . 657
Chapter 46 Sparklines 659Answers to this chapter’s questions . . . . . . . . . . . . . . . . . . . . . . . . . . . . . . . . . 659
Problems . . . . . . . . . . . . . . . . . . . . . . . . . . . . . . . . . . . . . . . . . . . . . . . . . . . . . . . . . . 664
Chapter 47 Estimating straight-line relationships 665Answers to this chapter’s questions . . . . . . . . . . . . . . . . . . . . . . . . . . . . . . . . . 667
Problems . . . . . . . . . . . . . . . . . . . . . . . . . . . . . . . . . . . . . . . . . . . . . . . . . . . . . . . . . . 672
Chapter 48 Modeling exponential growth 675Answers to this chapter’s questions . . . . . . . . . . . . . . . . . . . . . . . . . . . . . . . . . 676
Problems . . . . . . . . . . . . . . . . . . . . . . . . . . . . . . . . . . . . . . . . . . . . . . . . . . . . . . . . . . 680
Chapter 49 The power curve 681Answers to this chapter’s questions . . . . . . . . . . . . . . . . . . . . . . . . . . . . . . . . . 684
Problems . . . . . . . . . . . . . . . . . . . . . . . . . . . . . . . . . . . . . . . . . . . . . . . . . . . . . . . . . . 687
A01_Winston_FM_pi-xxx.indd 15 27/10/21 2:20 PM
xvi Contents
Chapter 50 Using correlations to summarize relationships 689Answers to this chapter’s questions . . . . . . . . . . . . . . . . . . . . . . . . . . . . . . . . . 691
Problems . . . . . . . . . . . . . . . . . . . . . . . . . . . . . . . . . . . . . . . . . . . . . . . . . . . . . . . . . . 695
Chapter 51 Introduction to multiple regression 697Answers to this chapter’s questions . . . . . . . . . . . . . . . . . . . . . . . . . . . . . . . . . 697
Problems . . . . . . . . . . . . . . . . . . . . . . . . . . . . . . . . . . . . . . . . . . . . . . . . . . . . . . . . . . 703
Chapter 52 Incorporating qualitative factors into multiple regression 705Answers to this chapter’s questions . . . . . . . . . . . . . . . . . . . . . . . . . . . . . . . . . 705
Problems . . . . . . . . . . . . . . . . . . . . . . . . . . . . . . . . . . . . . . . . . . . . . . . . . . . . . . . . . . 718
Chapter 53 Modeling nonlinearities and interactions 719Answers to this chapter’s questions . . . . . . . . . . . . . . . . . . . . . . . . . . . . . . . . . 719
Problems for Chapters 51–53 . . . . . . . . . . . . . . . . . . . . . . . . . . . . . . . . . . . . . . . 723
Chapter 54 Analysis of variance: One-way ANOVA 727Answers to this chapter’s questions . . . . . . . . . . . . . . . . . . . . . . . . . . . . . . . . . 728
Problems . . . . . . . . . . . . . . . . . . . . . . . . . . . . . . . . . . . . . . . . . . . . . . . . . . . . . . . . . . 731
Chapter 55 Randomized blocks and two-way ANOVA 733Answers to this chapter’s questions . . . . . . . . . . . . . . . . . . . . . . . . . . . . . . . . . 734
Problems . . . . . . . . . . . . . . . . . . . . . . . . . . . . . . . . . . . . . . . . . . . . . . . . . . . . . . . . . . 742
Chapter 56 Using moving averages to understand time series 745Answer to this chapter’s question . . . . . . . . . . . . . . . . . . . . . . . . . . . . . . . . . . . 745
Problem . . . . . . . . . . . . . . . . . . . . . . . . . . . . . . . . . . . . . . . . . . . . . . . . . . . . . . . . . . . 747
Chapter 57 Ratio-to-moving-average forecast method 749Answers to this chapter’s questions . . . . . . . . . . . . . . . . . . . . . . . . . . . . . . . . . 749
Problem . . . . . . . . . . . . . . . . . . . . . . . . . . . . . . . . . . . . . . . . . . . . . . . . . . . . . . . . . . . 752
A01_Winston_FM_pi-xxx.indd 16 27/10/21 2:20 PM

Contents xvii
Chapter 58 An introduction to probability 753Answers to this chapter’s questions . . . . . . . . . . . . . . . . . . . . . . . . . . . . . . . . . 753
Problems . . . . . . . . . . . . . . . . . . . . . . . . . . . . . . . . . . . . . . . . . . . . . . . . . . . . . . . . . . 759
Chapter 59 An introduction to random variables 763Answers to this chapter’s questions . . . . . . . . . . . . . . . . . . . . . . . . . . . . . . . . . 763
Problems . . . . . . . . . . . . . . . . . . . . . . . . . . . . . . . . . . . . . . . . . . . . . . . . . . . . . . . . . . 767
Chapter 60 The binomial, hypergeometric, and negative binomial random variables 769Answers to this chapter’s questions . . . . . . . . . . . . . . . . . . . . . . . . . . . . . . . . . 770
Problems . . . . . . . . . . . . . . . . . . . . . . . . . . . . . . . . . . . . . . . . . . . . . . . . . . . . . . . . . . 775
Chapter 61 The Poisson and exponential random variable 777Answers to this chapter’s questions . . . . . . . . . . . . . . . . . . . . . . . . . . . . . . . . . 777
Problems . . . . . . . . . . . . . . . . . . . . . . . . . . . . . . . . . . . . . . . . . . . . . . . . . . . . . . . . . . 780
Chapter 62 The normal random variable and Z-scores 781Answers to this chapter’s questions . . . . . . . . . . . . . . . . . . . . . . . . . . . . . . . . . 781
Problems . . . . . . . . . . . . . . . . . . . . . . . . . . . . . . . . . . . . . . . . . . . . . . . . . . . . . . . . . . 789
Chapter 63 Making probability statements from forecasts 791Answers to this chapter’s questions . . . . . . . . . . . . . . . . . . . . . . . . . . . . . . . . . 792
Problems . . . . . . . . . . . . . . . . . . . . . . . . . . . . . . . . . . . . . . . . . . . . . . . . . . . . . . . . . . 793
Chapter 64 Using the lognormal random variable to model stock prices 795Answers to this chapter’s questions . . . . . . . . . . . . . . . . . . . . . . . . . . . . . . . . . 795
Remarks . . . . . . . . . . . . . . . . . . . . . . . . . . . . . . . . . . . . . . . . . . . . . . . . . . . . . . . . . . . 798
Problems . . . . . . . . . . . . . . . . . . . . . . . . . . . . . . . . . . . . . . . . . . . . . . . . . . . . . . . . . . 798
A01_Winston_FM_pi-xxx.indd 17 27/10/21 2:20 PM
xviii Contents
Chapter 65 Importing past stock prices, exchange rates, and cryptocurrency prices with the STOCKHISTORY function 799Answers to this chapter’s questions . . . . . . . . . . . . . . . . . . . . . . . . . . . . . . . . . 799
Problems . . . . . . . . . . . . . . . . . . . . . . . . . . . . . . . . . . . . . . . . . . . . . . . . . . . . . . . . . . 806
Chapter 66 An introduction to optimization with Excel Solver 807Answers to this chapter’s questions . . . . . . . . . . . . . . . . . . . . . . . . . . . . . . . . . 807
Problems . . . . . . . . . . . . . . . . . . . . . . . . . . . . . . . . . . . . . . . . . . . . . . . . . . . . . . . . . . 811
Chapter 67 Using Solver to determine the optimal product mix 813Answers to this chapter’s questions . . . . . . . . . . . . . . . . . . . . . . . . . . . . . . . . . 813
Problems . . . . . . . . . . . . . . . . . . . . . . . . . . . . . . . . . . . . . . . . . . . . . . . . . . . . . . . . . . 822
Chapter 68 Using Solver to schedule your workforce 825Answers to this chapter’s question . . . . . . . . . . . . . . . . . . . . . . . . . . . . . . . . . . 825
Problems . . . . . . . . . . . . . . . . . . . . . . . . . . . . . . . . . . . . . . . . . . . . . . . . . . . . . . . . . . 827
Chapter 69 Using Solver to solve transportation or distribution problems 831Answer to this chapter’s question . . . . . . . . . . . . . . . . . . . . . . . . . . . . . . . . . . . 831
Problems . . . . . . . . . . . . . . . . . . . . . . . . . . . . . . . . . . . . . . . . . . . . . . . . . . . . . . . . . . 834
Chapter 70 Using Solver for capital budgeting 837Answer to this chapter’s question . . . . . . . . . . . . . . . . . . . . . . . . . . . . . . . . . . . 837
Problems . . . . . . . . . . . . . . . . . . . . . . . . . . . . . . . . . . . . . . . . . . . . . . . . . . . . . . . . . . 842
Chapter 71 Using Solver for financial planning 845Answers to this chapter’s questions . . . . . . . . . . . . . . . . . . . . . . . . . . . . . . . . . 845
Problems . . . . . . . . . . . . . . . . . . . . . . . . . . . . . . . . . . . . . . . . . . . . . . . . . . . . . . . . . . 850
Chapter 72 Using Solver to rate sports teams 853Answer to this chapter’s question . . . . . . . . . . . . . . . . . . . . . . . . . . . . . . . . . . . 854
Problems . . . . . . . . . . . . . . . . . . . . . . . . . . . . . . . . . . . . . . . . . . . . . . . . . . . . . . . . . . 856
A01_Winston_FM_pi-xxx.indd 18 27/10/21 2:20 PM
Contents xix
Chapter 73 The Winters method and the Forecast Sheet tool 859Answers to this chapter’s questions . . . . . . . . . . . . . . . . . . . . . . . . . . . . . . . . . 859
Remarks . . . . . . . . . . . . . . . . . . . . . . . . . . . . . . . . . . . . . . . . . . . . . . . . . . . . . . . . . . . 866
Problems . . . . . . . . . . . . . . . . . . . . . . . . . . . . . . . . . . . . . . . . . . . . . . . . . . . . . . . . . . 867
Chapter 74 Forecasting in the presence of special events 869Answers to this chapter’s questions . . . . . . . . . . . . . . . . . . . . . . . . . . . . . . . . . 869
Problems . . . . . . . . . . . . . . . . . . . . . . . . . . . . . . . . . . . . . . . . . . . . . . . . . . . . . . . . . . 876
Chapter 75 Warehouse location and the GRG Multistart and Evolutionary Solver engines 877Answers to this chapter’s questions . . . . . . . . . . . . . . . . . . . . . . . . . . . . . . . . . 877
Problems . . . . . . . . . . . . . . . . . . . . . . . . . . . . . . . . . . . . . . . . . . . . . . . . . . . . . . . . . . 887
Chapter 76 Penalties and the Evolutionary Solver 889Answers to this chapter’s questions . . . . . . . . . . . . . . . . . . . . . . . . . . . . . . . . . 890
Problems . . . . . . . . . . . . . . . . . . . . . . . . . . . . . . . . . . . . . . . . . . . . . . . . . . . . . . . . . . 893
Chapter 77 The traveling salesperson problem 895Answers to this chapter’s questions . . . . . . . . . . . . . . . . . . . . . . . . . . . . . . . . . 895
Problems . . . . . . . . . . . . . . . . . . . . . . . . . . . . . . . . . . . . . . . . . . . . . . . . . . . . . . . . . . 898
Chapter 78 Weibull and beta distributions: Modeling machine life and duration of a project 901Answers to this chapter’s questions . . . . . . . . . . . . . . . . . . . . . . . . . . . . . . . . . 901
Problems . . . . . . . . . . . . . . . . . . . . . . . . . . . . . . . . . . . . . . . . . . . . . . . . . . . . . . . . . . 906
Chapter 79 Introduction to Monte Carlo simulation 907Answers to this chapter’s questions . . . . . . . . . . . . . . . . . . . . . . . . . . . . . . . . . 908
Problems . . . . . . . . . . . . . . . . . . . . . . . . . . . . . . . . . . . . . . . . . . . . . . . . . . . . . . . . . . 916
Chapter 80 Calculating an optimal bid 919Answers to this chapter’s questions . . . . . . . . . . . . . . . . . . . . . . . . . . . . . . . . . 919
Problems . . . . . . . . . . . . . . . . . . . . . . . . . . . . . . . . . . . . . . . . . . . . . . . . . . . . . . . . . . 922
A01_Winston_FM_pi-xxx.indd 19 27/10/21 2:20 PM
xx Contents
Chapter 81 Simulating stock prices and asset-allocation modeling 925Answers to this chapter’s questions . . . . . . . . . . . . . . . . . . . . . . . . . . . . . . . . . 926
Problems . . . . . . . . . . . . . . . . . . . . . . . . . . . . . . . . . . . . . . . . . . . . . . . . . . . . . . . . . . 934
Chapter 82 Fun and games: Simulating gambling and sporting-event probabilities 937Answers to this chapter’s questions . . . . . . . . . . . . . . . . . . . . . . . . . . . . . . . . . 937
Problems . . . . . . . . . . . . . . . . . . . . . . . . . . . . . . . . . . . . . . . . . . . . . . . . . . . . . . . . . . 945
Chapter 83 Using resampling to analyze data 947Answer to this chapter’s question . . . . . . . . . . . . . . . . . . . . . . . . . . . . . . . . . . . 947
Problems . . . . . . . . . . . . . . . . . . . . . . . . . . . . . . . . . . . . . . . . . . . . . . . . . . . . . . . . . . 950
Chapter 84 Pricing stock options 953Answers to this chapter’s questions . . . . . . . . . . . . . . . . . . . . . . . . . . . . . . . . . 954
Problems . . . . . . . . . . . . . . . . . . . . . . . . . . . . . . . . . . . . . . . . . . . . . . . . . . . . . . . . . . 965
Chapter 85 Determining customer value 967Answers to this chapter’s questions . . . . . . . . . . . . . . . . . . . . . . . . . . . . . . . . . 967
Problems . . . . . . . . . . . . . . . . . . . . . . . . . . . . . . . . . . . . . . . . . . . . . . . . . . . . . . . . . . 972
Chapter 86 The economic order quantity inventory model 973Answers to this chapter’s questions . . . . . . . . . . . . . . . . . . . . . . . . . . . . . . . . . 973
Problems . . . . . . . . . . . . . . . . . . . . . . . . . . . . . . . . . . . . . . . . . . . . . . . . . . . . . . . . . . 977
Chapter 87 Inventory modeling with uncertain demand 979Answers to this chapter’s questions . . . . . . . . . . . . . . . . . . . . . . . . . . . . . . . . . 980
Problems . . . . . . . . . . . . . . . . . . . . . . . . . . . . . . . . . . . . . . . . . . . . . . . . . . . . . . . . . . 985
Chapter 88 Queuing theory: The mathematics of waiting in line 987Answers to this chapter’s questions . . . . . . . . . . . . . . . . . . . . . . . . . . . . . . . . . 987
Problems . . . . . . . . . . . . . . . . . . . . . . . . . . . . . . . . . . . . . . . . . . . . . . . . . . . . . . . . . . 992
A01_Winston_FM_pi-xxx.indd 20 27/10/21 2:20 PM
Contents xxi
Chapter 89 Estimating a demand curve 993Answers to this chapter’s questions . . . . . . . . . . . . . . . . . . . . . . . . . . . . . . . . 993
Problems . . . . . . . . . . . . . . . . . . . . . . . . . . . . . . . . . . . . . . . . . . . . . . . . . . . . . . . . . 998
Chapter 90 Pricing products by using tie-ins 999Answer to this chapter’s question . . . . . . . . . . . . . . . . . . . . . . . . . . . . . . . . . . 999
Problems . . . . . . . . . . . . . . . . . . . . . . . . . . . . . . . . . . . . . . . . . . . . . . . . . . . . . . . . . 1002
Chapter 91 Pricing products by using subjectively determined demand 1005Answers to this chapter’s questions . . . . . . . . . . . . . . . . . . . . . . . . . . . . . . . . 1005
Problems . . . . . . . . . . . . . . . . . . . . . . . . . . . . . . . . . . . . . . . . . . . . . . . . . . . . . . . . . 1009
Chapter 92 Nonlinear pricing 1011Answers to this chapter’s questions . . . . . . . . . . . . . . . . . . . . . . . . . . . . . . . . 1012
Problems . . . . . . . . . . . . . . . . . . . . . . . . . . . . . . . . . . . . . . . . . . . . . . . . . . . . . . . . . 1018
Chapter 93 Use Analyze Data to find patterns in your data 1019Answers to this chapter’s questions . . . . . . . . . . . . . . . . . . . . . . . . . . . . . . . . 1020
Problems . . . . . . . . . . . . . . . . . . . . . . . . . . . . . . . . . . . . . . . . . . . . . . . . . . . . . . . . . 1028
Chapter 94 Recording macros 1031Answers to this chapter’s questions . . . . . . . . . . . . . . . . . . . . . . . . . . . . . . . . 1032
Problems . . . . . . . . . . . . . . . . . . . . . . . . . . . . . . . . . . . . . . . . . . . . . . . . . . . . . . . . . 1047
Chapter 95 The LET and LAMBDA functions and the LAMBDA helper functions 1049Answers to this chapter’s questions . . . . . . . . . . . . . . . . . . . . . . . . . . . . . . . . 1050
Problems . . . . . . . . . . . . . . . . . . . . . . . . . . . . . . . . . . . . . . . . . . . . . . . . . . . . . . . . . 1060
Chapter 96 Advanced sensitivity analysis 1063Answer to this chapter’s question . . . . . . . . . . . . . . . . . . . . . . . . . . . . . . . . . . 1063
Problems . . . . . . . . . . . . . . . . . . . . . . . . . . . . . . . . . . . . . . . . . . . . . . . . . . . . . . . . . 1065
Index 1067
A01_Winston_FM_pi-xxx.indd 21 27/10/21 2:20 PM

This page intentionally left blank

xxiii
About the Author
Wayne L. Winston is Professor Emeritus of Decision Sciences at the Indiana University School of Business. He has also taught at the University of Houston and Wake Forest. He has won more than 40 teaching awards and taught Excel modeling and analytics at many Fortune 500 companies, accounting firms, the U.S. Army, and the U.S. Navy. He is a two-time Jeopardy! champion, and also is a co-developer of a player tracking system utilized by Mark Cuban and the Dallas Mavericks.
A01_Winston_FM_pi-xxx.indd 23 27/10/21 2:20 PM

This page intentionally left blank
xxv
Introduction
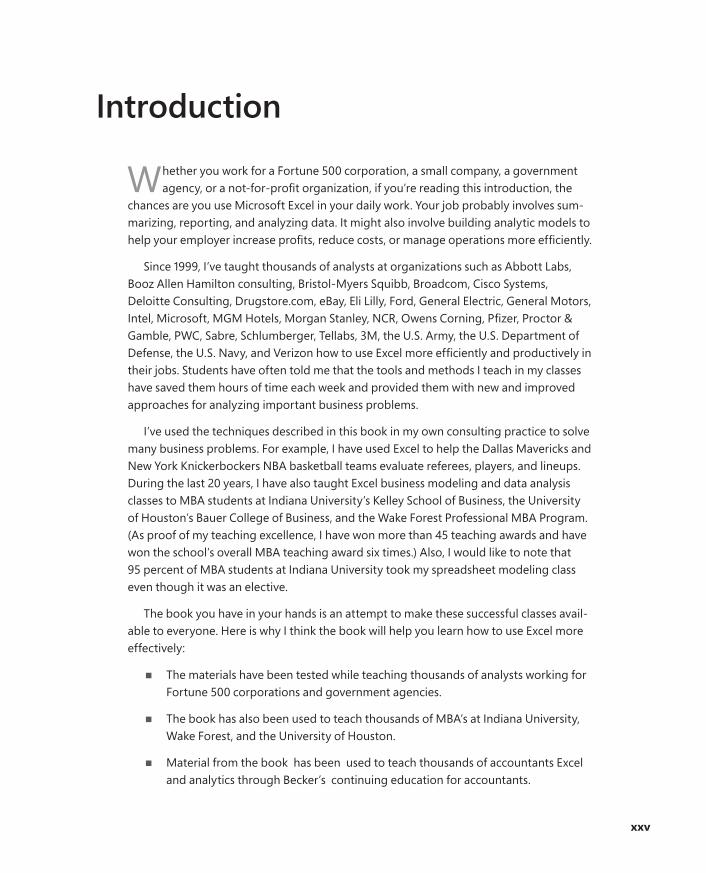
Whether you work for a Fortune 500 corporation, a small company, a government agency, or a not-for-profit organization, if you’re reading this introduction, the
chances are you use Microsoft Excel in your daily work. Your job probably involves sum-marizing, reporting, and analyzing data. It might also involve building analytic models to help your employer increase profits, reduce costs, or manage operations more efficiently.
Since 1999, I’ve taught thousands of analysts at organizations such as Abbott Labs, Booz Allen Hamilton consulting, Bristol-Myers Squibb, Broadcom, Cisco Systems, Deloitte Consulting, Drugstore.com, eBay, Eli Lilly, Ford, General Electric, General Motors, Intel, Microsoft, MGM Hotels, Morgan Stanley, NCR, Owens Corning, Pfizer, Proctor & Gamble, PWC, Sabre, Schlumberger, Tellabs, 3M, the U.S. Army, the U.S. Department of Defense, the U.S. Navy, and Verizon how to use Excel more efficiently and productively in their jobs. Students have often told me that the tools and methods I teach in my classes have saved them hours of time each week and provided them with new and improved approaches for analyzing important business problems.
I’ve used the techniques described in this book in my own consulting practice to solve many business problems. For example, I have used Excel to help the Dallas Mavericks and New York Knickerbockers NBA basketball teams evaluate referees, players, and lineups. During the last 20 years, I have also taught Excel business modeling and data analysis classes to MBA students at Indiana University’s Kelley School of Business, the University of Houston’s Bauer College of Business, and the Wake Forest Professional MBA Program. (As proof of my teaching excellence, I have won more than 45 teaching awards and have won the school’s overall MBA teaching award six times.) Also, I would like to note that 95 percent of MBA students at Indiana University took my spreadsheet modeling class even though it was an elective.
The book you have in your hands is an attempt to make these successful classes avail-able to everyone. Here is why I think the book will help you learn how to use Excel more effectively:
■ The materials have been tested while teaching thousands of analysts working for Fortune 500 corporations and government agencies.
■ The book has also been used to teach thousands of MBA’s at Indiana University, Wake Forest, and the University of Houston.
■ Material from the book has been used to teach thousands of accountants Excel and analytics through Becker’s continuing education for accountants.
A01_Winston_FM_pi-xxx.indd 25 27/10/21 2:20 PM
xxvi Introduction
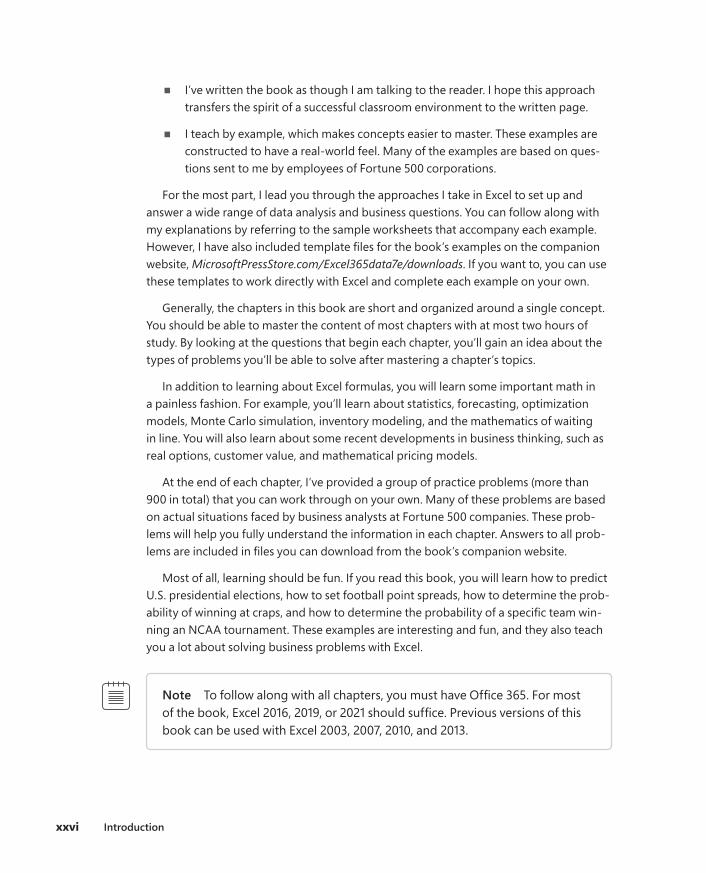
■ I’ve written the book as though I am talking to the reader. I hope this approach transfers the spirit of a successful classroom environment to the written page.
■ I teach by example, which makes concepts easier to master. These examples are constructed to have a real-world feel. Many of the examples are based on ques-tions sent to me by employees of Fortune 500 corporations.
For the most part, I lead you through the approaches I take in Excel to set up and answer a wide range of data analysis and business questions. You can follow along with my explanations by referring to the sample worksheets that accompany each example. However, I have also included template files for the book’s examples on the companion website, MicrosoftPressStore.com/Excel365data7e/downloads. If you want to, you can use these templates to work directly with Excel and complete each example on your own.
Generally, the chapters in this book are short and organized around a single concept. You should be able to master the content of most chapters with at most two hours of study. By looking at the questions that begin each chapter, you’ll gain an idea about the types of problems you’ll be able to solve after mastering a chapter’s topics.
In addition to learning about Excel formulas, you will learn some important math in a painless fashion. For example, you’ll learn about statistics, forecasting, optimization models, Monte Carlo simulation, inventory modeling, and the mathematics of waiting in line. You will also learn about some recent developments in business thinking, such as real options, customer value, and mathematical pricing models.
At the end of each chapter, I’ve provided a group of practice problems (more than 900 in total) that you can work through on your own. Many of these problems are based on actual situations faced by business analysts at Fortune 500 companies. These prob-lems will help you fully understand the information in each chapter. Answers to all prob-lems are included in files you can download from the book’s companion website.
Most of all, learning should be fun. If you read this book, you will learn how to predict U.S. presidential elections, how to set football point spreads, how to determine the prob-ability of winning at craps, and how to determine the probability of a specific team win-ning an NCAA tournament. These examples are interesting and fun, and they also teach you a lot about solving business problems with Excel.
Note To follow along with all chapters, you must have Office 365. For most of the book, Excel 2016, 2019, or 2021 should suffice. Previous versions of this book can be used with Excel 2003, 2007, 2010, and 2013.
A01_Winston_FM_pi-xxx.indd 26 27/10/21 3:41 PM
Introduction xxvii
What you should know before reading this book
To follow the examples in this book, you do not need to be an Excel guru. Basically, the two key actions you should know how to do are the following:
■ Enter a formula You should know that formulas must begin with an equals sign (=). You should also know the basic mathematical operators. For example, you should know that an asterisk (*) is used for multiplication, a forward slash (/) is used for division, and the caret key (̂ ) is used to raise a quantity to a power.
■ Work with cell references You should know that when you copy a formula that contains a cell reference such as $A$4 (an absolute cell reference, which is created by including the dollar signs), the formula still refers to cell A4 in the cells you copy it to. When you copy a formula that contains a cell reference such as $A4 (a mixed cell address), the column remains fixed, but the row changes. Finally, when you copy a formula that contains a cell reference such as A4 (a relative cell reference), both the row and the column of the cells referenced in the formula change.
These ideas are thoroughly described in Chapter 1.
How to use this book
As you read along with the examples in this book, you can take one of two approaches:
■ You can open the template file that corresponds to the example you are studying and complete each step of the example as you read the book. You will be sur-prised how easy this process is and amazed with how much you learn and retain. This is the approach I use in my corporate classes.
■ Instead of working in the template files, you can follow my explanations as you look at the final version of each sample file.
What’s New in this Edition
This edition contains more new material than any previous edition. New material includes
■ Chapter 3 contains discussion of the new XLOOKUP function as well a discussion of approximate lookups and issues that arise when lookup formulas get confused about whether cell entries are text or numbers.
A01_Winston_FM_pi-xxx.indd 27 27/10/21 2:20 PM
xxviii Introduction
■ Chapter 6 contains a discussion of how Excel deals with special formats such as phone numbers and leading zeroes.
■ Chapter 7 contains a discussion of the EOMONTH and EDATE functions.
■ Chapter 25 contains a discussion of issues that arise when you copy formulas involving table references.
■ A completely new Chapter 28 contains an extensive discussion of Power Query.
■ A completely new Chapter 29 provides complete coverage of Office 365’s new data types.
■ Chapter 32 contains a discussion of sorting across columns and sorting based on the case (lower or upper) of the first character in a cell.
■ Chapter 33 contains a discussion of sorting based on a selected cell.
■ Chapter 35 on arrays has been updated to recognize the obsolescence of the dreaded Ctrl+Shift+Enter keystroke combination which was previously required to enter array functions and formulas.
■ A brand new Chapter 36 covers Office 365’s brand new dynamic array UNIQUE, SORT, SORTBY, FILTER, and SEQUENCE functions.
■ Chapter 37 uses dynamic array formulas to create nested dropdown boxes.
■ Chapter 38 uses dynamic arrays to emulate a PivotTable.
■ Chapter 42 discusses the use of SUBTOTAL functions.
■ A completely new Chapter 43 contains a comprehensive introduction to Excel’s most widely used charts. Chapter 44 covers more advanced charting techniques.
■ A new Chapter 65 discusses Office 365’s amazing STOCKHISTORY function.
■ Chapter 79 discusses Office 365’s new RANDARRAY function and shows how to use RANDARRAY to generate a random sample from a data set.
■ Chapter 93 adds several more examples of recording macros.
■ A brand new Chapter 94 discusses Office 365’s Analyze Data feature, which with a single click gives you insights and ideas about your data.
■ A brand new Chapter 95 contains a brief introduction to custom functions and Office 365’s LET, LAMBDA, and LAMBDA helper functions.
A01_Winston_FM_pi-xxx.indd 28 27/10/21 2:20 PM
Introduction xxix
Downloads
This book features a companion website that makes available to you all the sample files, solution files, and templates you can use in the book’s examples (both the final Excel workbooks and the starting templates you can work with on your own). The work-books and templates are organized in folders named for each chapter. The answers to all chapter-ending problems in the book are also included with the sample files. Each answer file is named so that you can identify it easily. For example, the file containing the answer to Problem 2 in Chapter 10 is named S10_2.xlsx.
To work through the examples in this book, you need to copy the book’s sample files to your computer. These practice files can be downloaded from the book’s download page, located at
MicrosoftPressStore.com/Excel365data7e/downloads
Display the page in your web browser and follow the instructions for downloading the files.
Acknowledgments
I am eternally grateful to Jennifer Skoog and Norm Tonina, who had faith in me and first hired me to teach Excel classes for Microsoft finance. Jennifer, in particular, was instrumental in helping design the content and style of the classes on which the book is based. Keith Lange of Eli Lilly, Pat Keating and Doug Hoppe of Cisco Systems, and Dennis Fuller of the U.S. Army also helped me refine my thoughts on teaching data analysis and modeling with Excel.
Kate Shoup did an incredible job as Development Editor. David Franson did a wonderful job technically editing the book. Charvi Aurori did a great job as Sponsoring Editor. Scout Festa was a thorough copy editor. Senior Production Editor Tracey Croom assisted me with the Pearson template when I was clueless. As always, Executive Editor Loretta Yates did a great job shepherding the project to completion and answered many emails instantly! And finally, the team at codeMantra, lead by Project Manager Vaishnavi Venkatesan, produced the chapters at breakneck speed, ensuring the book made it into the hands of readers as soon as possible.
I am also grateful to my many students at the organizations where I’ve taught and students at the Indiana University Kelley School of Business, Wake Forest, and the Uni-versity of Houston Bauer College of Business. Many of them have taught me things I did not know about Excel.
A01_Winston_FM_pi-xxx.indd 29 27/10/21 2:20 PM

xxx Introduction
Alex Blanton, formerly of Microsoft Press, championed this project at the start and shared my vision of developing a user-friendly text designed for use by business analysts.
Finally, my lovely and talented wife, Vivian, and my wonderful children, Jennifer and Gregory, put up with my long weekend hours at the keyboard.
Errata, updates, and book supportWe’ve made every effort to ensure the accuracy of this book and its companion content. You can access updates to this book—in the form of a list of submitted errata and their related corrections—at:
MicrosoftPressStore.com/Excel365data7e/errata
If you discover an error that is not already listed, please submit it to us at the same page.
For additional book support and information, please visit:
MicrosoftPressStore.com/Support
Please note that product support for Microsoft software and hardware is not offered through the previous addresses. For help with Microsoft software or hardware, go to http://support.microsoft.com.
Stay in touchLet’s keep the conversation going! We’re on Twitter:
http://twitter.com/MicrosoftPress
A01_Winston_FM_pi-xxx.indd 30 27/10/21 2:20 PM
39
C H A P T E R 4
The INDEX function
Questions answered in this chapter:
■ I have a list of distances between US cities. How do I write a function that returns the distance between, for example, Seattle and Miami?
■ Is there a way I can write a formula that references the entire column containing the distances between each city and Seattle?
Syntax of the INDEX function
The INDEX function enables you to return the entry in any row and column within an array of numbers. The most commonly used syntax for the INDEX function is the following:
INDEX(array,row_number,column_number)
To illustrate, the formula =INDEX(A1:D12,2,3) returns the entry in the second row and third column of the array A1:D12. This entry is the one in cell C2.
Answers to this chapter’s questions
I have a list of distances between US cities. How do I write a function that returns the distance between, for example, Seattle and Miami?
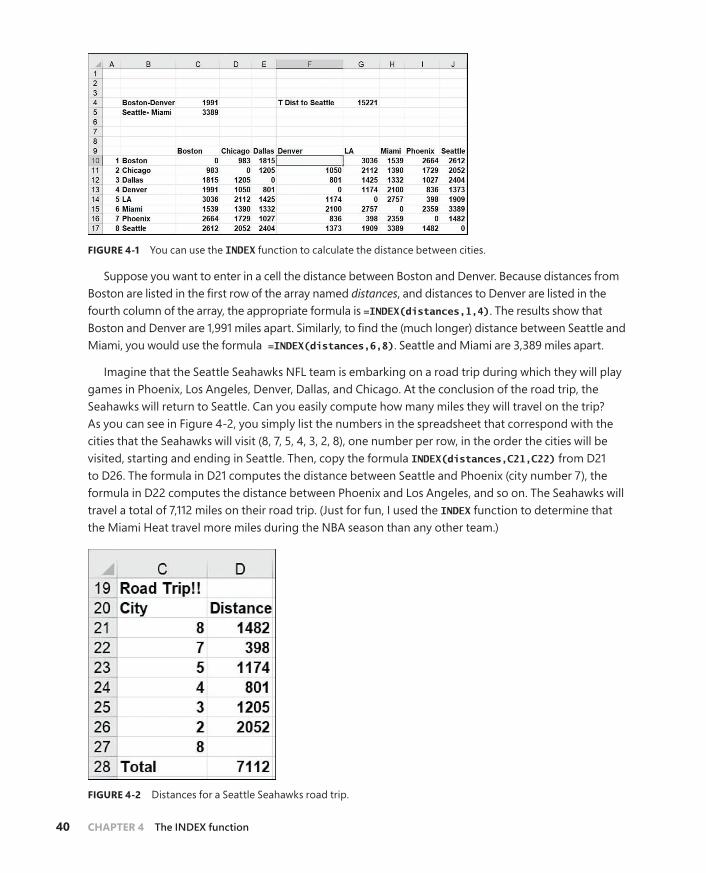
The file named INDEX.xlsx (see Figure 4-1) contains the distances between eight US cities. The range C10:J17, which contains the distances, is named distances.
9780137613663_web.indb 39 26/10/21 10:57 PM
40 CHAPTER 4 The INDEX function
FIGURE 4-1 You can use the INDEX function to calculate the distance between cities.
Suppose you want to enter in a cell the distance between Boston and Denver. Because distances from Boston are listed in the first row of the array named distances, and distances to Denver are listed in the fourth column of the array, the appropriate formula is =INDEX(distances,1,4). The results show that Boston and Denver are 1,991 miles apart. Similarly, to find the (much longer) distance between Seattle and Miami, you would use the formula =INDEX(distances,6,8). Seattle and Miami are 3,389 miles apart.
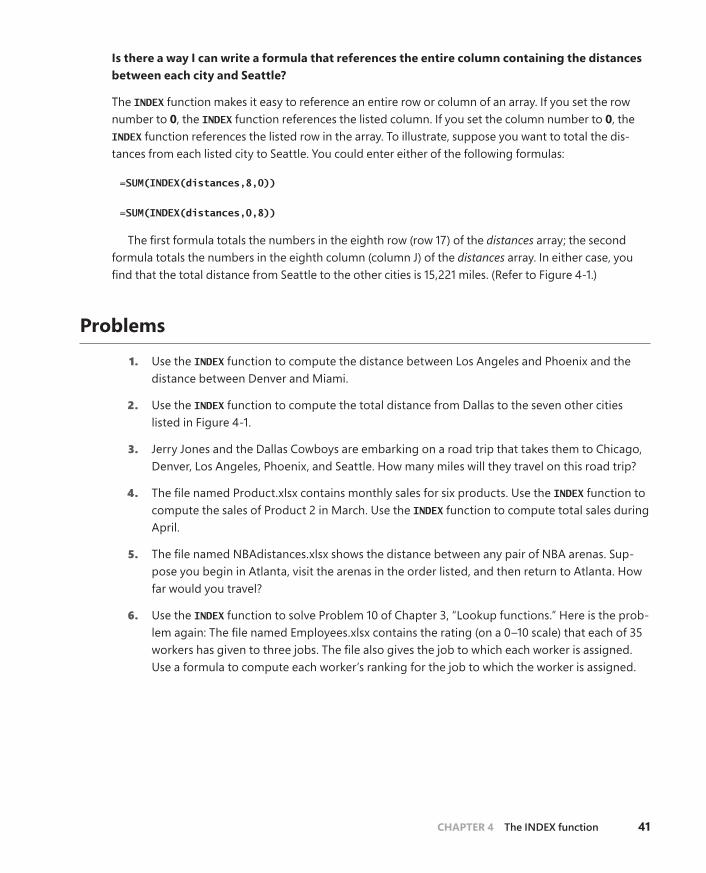
Imagine that the Seattle Seahawks NFL team is embarking on a road trip during which they will play games in Phoenix, Los Angeles, Denver, Dallas, and Chicago. At the conclusion of the road trip, the Seahawks will return to Seattle. Can you easily compute how many miles they will travel on the trip? As you can see in Figure 4-2, you simply list the numbers in the spreadsheet that correspond with the cities that the Seahawks will visit (8, 7, 5, 4, 3, 2, 8), one number per row, in the order the cities will be visited, starting and ending in Seattle. Then, copy the formula INDEX(distances,C21,C22) from D21 to D26. The formula in D21 computes the distance between Seattle and Phoenix (city number 7), the formula in D22 computes the distance between Phoenix and Los Angeles, and so on. The Seahawks will travel a total of 7,112 miles on their road trip. (Just for fun, I used the INDEX function to determine that the Miami Heat travel more miles during the NBA season than any other team.)
FIGURE 4-2 Distances for a Seattle Seahawks road trip.
9780137613663_web.indb 40 26/10/21 10:57 PM
CHAPTER 4 The INDEX function 41
Is there a way I can write a formula that references the entire column containing the distances between each city and Seattle?
The INDEX function makes it easy to reference an entire row or column of an array. If you set the row number to 0, the INDEX function references the listed column. If you set the column number to 0, the INDEX function references the listed row in the array. To illustrate, suppose you want to total the dis-tances from each listed city to Seattle. You could enter either of the following formulas:
=SUM(INDEX(distances,8,0))
=SUM(INDEX(distances,0,8))
The first formula totals the numbers in the eighth row (row 17) of the distances array; the second formula totals the numbers in the eighth column (column J) of the distances array. In either case, you find that the total distance from Seattle to the other cities is 15,221 miles. (Refer to Figure 4-1.)
Problems
1. Use the INDEX function to compute the distance between Los Angeles and Phoenix and the distance between Denver and Miami.
2. Use the INDEX function to compute the total distance from Dallas to the seven other cities listed in Figure 4-1.
3. Jerry Jones and the Dallas Cowboys are embarking on a road trip that takes them to Chicago, Denver, Los Angeles, Phoenix, and Seattle. How many miles will they travel on this road trip?
4. The file named Product.xlsx contains monthly sales for six products. Use the INDEX function to compute the sales of Product 2 in March. Use the INDEX function to compute total sales during April.
5. The file named NBAdistances.xlsx shows the distance between any pair of NBA arenas. Sup-pose you begin in Atlanta, visit the arenas in the order listed, and then return to Atlanta. How far would you travel?
6. Use the INDEX function to solve Problem 10 of Chapter 3, “Lookup functions.” Here is the prob-lem again: The file named Employees.xlsx contains the rating (on a 0–10 scale) that each of 35 workers has given to three jobs. The file also gives the job to which each worker is assigned. Use a formula to compute each worker’s ranking for the job to which the worker is assigned.
9780137613663_web.indb 41 26/10/21 10:57 PM
1067
Index
Symbols& (ampersand), 54, 212* (asterisk), 31, 212, 443[ ] (brackets), 25^ (caret), 87, 685: (colon), 150{ } (curly braces), 76, 451$ (dollar sign), 4–5““ (double quotation marks), 211, 451= (equal sign), 58, 211>= (greater-than-or-equal-to) operator, 212< (less-than sign), 782<= (less-than-or-equal-to) operator, 782- (minus) sign, 207<> (not equal to) operator, 212. (period), 23| (pipe character), 61+ (plus sign), 58, 303? (question mark), 31, 213; (semicolon), 79, 154/ (slash), 803~ (tilde), 31_ (underscore), 232D Chart button, 6542D charts, summarizing 3D maps as, 6542D filled maps
creating, 643–647labeling, 645–646
3D Map button, 648, 6563D maps
animating data in, 651–653creating, 647–649customizing, 650–651map tours, 649–650navigating, 649New York City’s Fourth Avenue subway line example,
655–656pie charts with labels in, 654problems for, 657summarizing with 2D chart, 654
80–20 rule, 37495 percent confidence interval, for mean profit, 91495 percent service level, 982–985
AA Date Occurring dialog box, 257a posteriori probability, 758abandonment options, 964–965absolute addressing, 4–5Access Web Content dialog box, 323accounting costs, returning, 121Accountsums.xlsx file, 280accuracy of predictions, 671, 872–876Across worksheet, 407Adagency.xlsx file, 299Add Chart Element button, 598, 600, 609, 623, 646, 669Add Constraint dialog box, 816–817, 827, 839, 862,
896, 897, 933Add Data Labels button, 590Add Filter command, 650Add option (Paste Special), 162Add This Data to Data Model option (PivotTables), 546Add Trendline command, 668, 677, 684, 746, 1006Add Watch option, 174Add-Ins dialog box, 721, 809, 847, 862, 872, 889, 895, 902
Analysis ToolPak, 364, 378, 692, 698, 728, 735Solver Add-In. See Microsoft Excel Solver
addition, with Paste Special command, 162additive rule, for computing probabilities, 755Addresses.xlsx file, 145addressing, absolute, 4–5adjustable-rate mortgage (ARM), 113Advancedfilter.xlsx file, 436advertising, sales as function of, 682age/gender travel expenditure, PivotTables for, 505–509Ageofmachine.xlsx file, 69AGGREGATE function, 135–136Agingdata.xlsx file, 236airline flight, probability of overbooking, 772Airlinemilestemp.xlsx file, 864
Z01_Winston_Index_p1067-1138.indd 1067 28/10/21 8:12 PM
1068
alerts, error
alerts, error, 474–475algebra problems, Goal Seek for, 199–200AllDifferent constraint, 896alpha, 902, 904alternative hypothesis, ANOVA, 727Amazon.com, upward trend in revenues in, 745–747Amazon.xlsx file, 279, 281American cash flows, option pricing and, 955ampersand (&), 54, 212analysis of variance (ANOVA), 728
for multiple-regression analysis, 710one-way, 727–732
alternative hypothesis, 727book sales case study, 728–731definition of, 727forecasting with, 731null hypothesis, 727problems for, 731–732
single factor, 728Two-Factor With Replication, 735Two-Factor Without Replication, 735two-way, 733–743
forecasting with, 736–737, 740–742overview of, 733–734problems for, 742–743with replication, 737–742without replication, 734–736
Analysis ToolPak, 364, 378, 692, 698, 721, 728, 735Analyze Data, 1019–1029
BOM (bill of materials) reports, 1019overview of, 1019stock market prices, 1022–1024
Analyze Data button, 1019, 1021, 1022–1024, 1025, 1027Analyze group (Data tab), 1000Analyzesurveydata.xlsx file, 539animals, in Excel formulas, 353–354Animals data type, 354–355animating 3D maps, 651–653annuities, 101–103Another Summary worksheet, 245ANOVA. See analysis of variance (ANOVA)antidepressant, determining 99th percentile of demand
for, 785–786Append dialog box, 338–339appending tables, 338–340Applynames.xlsx file, 20area charts, 603–606ARM (adjustable-rate mortgage), 113
Arrange Windows dialog box, 572arrays
array formulas and functionsarray constants in, 451–452averaging numbers with, 447–448calculating median size of transaction with,
452–453calculating standard deviation with, 453–454computing hourly wages with, 442–444editing, 452emulating counts, sums, and averages with,
454–457matching names with, 446monthly stock return updates with, 444–445overview of, 442summarizing data with 2D chart, 448–451summing second digit of list of integers with,
444–445transposing rows/columns with, 444
Boolean, 450constants, 451–452of numbers
computing tax rates with, 27–29definition of, 25looking up prices from product ID codes with, 29–30mismatches between text and numbers in, 34problems for, 35–37syntax of, 25–27wildcard characters with, 31
Arrays.xlsx fileAverage Those > Median worksheet, 447Creating Powers worksheet, 451Matching Names worksheet, 446Total Wages worksheet, 442Transpose worksheet, 444
ASCIIcharacters.xlsx file, 54Asiansales.xlsx file, 228Ask a Question About Your Data, 1021assets
asset-allocation modeling, 929–934depreciation of, 109–110
Assign Macro dialog box, 1036assigning employees to workgroups, 890–893Assign.xlsx file, 35, 890Assumption cells (Scenario Manager),
hiding/showing, 207asterisk (*), 31, 212, 443Asterisks.xlsx file, 31astronomical objects, in Excel formulas, 351
Z01_Winston_Index_p1067-1138.indd 1068 28/10/21 8:12 PM
1069
binary changing cells
At Each Change In menu commandsLocation, 578Name, 580
athletes, salaries of, 542–543auditing options, 171–182
Error Checking, 173–174Inquire add-in, 179–182
analyzing precedents/dependents with, 182analyzing workbook structure with, 181analyzing worksheet/workbook
relationships with, 181cleaning excess cell formatting with, 182comparing workbooks with, 180installing, 179–180
for multiple worksheets, 178–179problems for, 182Remove Arrows, 175, 177Show Formulas, 172Trace Dependents, 174–177Trace Precedents, 174–175, 177–178viewing, 172Watch Window, 174
Audittwosheets.xlsx file, 178, 181auto sales
quarterly predictions for, 705–710sensitivity analysis of, 203–208
AutoComplete, 18, 1053AutoComplete feature, 481Automatic data type, 356–357Automatic Except for Data Tables option, 187–188Automatic option (Map Projection menu), 645AutoSum function, 3AVERAGE function, 2, 18, 212, 751, 788, 793,
855, 861, 862, 871–872, 901, 902, 905, 913, 922, 939, 950
average inventory level, 973–975AVERAGEIFS function, 751
examples of, 220–221syntax of, 218
averages, moving, 745–747four-period moving average, 745–746moving-average graphs, 745–746ratio-to-moving-average forecasting
method for, 749–752axes, chart
modifying, 612–613secondary, 593–594
axioms, for event probabilities, 754Axis option (Sparkline Tools Design), 661–662
Bbakery case study, cost paid to supplier in, 2–5Bakery1temp.xlsx file, 2–3Bakery2temp.xlsx file, 4balloon mortgages, 113band charts, 920–923Bandchart.xlsx file, 620Bank24.xlsx file, 825banks
daily customer counts, 659–660workforce scheduling problem, 825–827
bar charts, 590–591bar graphs, 60–61Barcharts.xlsx file, 590base, of series, 859baseball, 923
lookup functions with, 31–34salary information, 46–47
Baseball96.xlsx file, 724Baseballproblem7.xlsx file, 49Baseball.xlsx file, 46–47Basic Model worksheet, 837basketball
NCAA Final Four, probability of team win in, 942–944salaries, data-validation example, 473–476
Bayes’ theorem, 758–759bear spread, 144Best Fit worksheet, 686beta, 902
beta variable, 901, 904–906random variable
determining probabilities with, 904–905problems for, 906
of stocks, 671, 951Betadata.xlsx file, 672BETA.DIST function, 901Betaresampling.xlsx, 951Beta.xlsx file, 904bias, in forecasts, 792–793bids, calculating optimal, 919–923
bidding simulation model, 920–922binomial random variables, 919–920normal random variables, 920problems for, 922
bill of materials (BOM) reports, 1019binary and integer programming problems for, 841–842binary changing cells, 838
Z01_Winston_Index_p1067-1138.indd 1069 28/10/21 8:12 PM
BINOM.DIST function
1070
BINOM.DIST functionexamples of, 771–772overview of, 770
BINOM.DIST.RANGE functionexamples of, 771–772overview of, 770
binomial probabilities, 770–773Coke/Pepsi preference example, 771defective elevator rails example, 771–772overbooked flight example, 772Village Deli example, 773
binomial random variables, 775–776BINOM.DIST function
examples of, 771–772overview of, 770
BINOM.DIST.RANGE functionexamples of, 771–772overview of, 770
BINOM.INV function, 773computing probabilities for, 770–773
Coke/Pepsi preference example, 771defective elevator rails example, 771–772overbooked flight example, 772Village Deli example, 773
definition of, 770negative, 774–775simulating, 919–920
Binomialexamples.xlsx file, 770Binomialsim.xlsx file, 919BINOM.INV function, 773, 919, 922Bitcoin prices
Bitcoin worksheet, 802importing, 802PivotTables for, 533–535
Black, Fischer, 953. See also Black-Scholes option-pricing formula
Black Swan, The (Taleb), 798Blackjack worksheet, 139Black-Scholes option-pricing formula, 798. See also
option pricingestimating stock volatility with, 959–961implementation of, 957–958
blank cells in ranges, counting, 214blank rows, adding to PivotTables, 501–502Blink (Gladwell), 1028BMI (body mass index), 9BOM (bill of materials) reports, 1019BOM.xlsx file, 1021book sales, one-way analysis of variance (ANOVA)
of, 728–731
Boolean arrays, 450bootstrapping, 925–935
asset-allocation modeling, 929–934problems for, 934–935stock price simulation, 926–929
Boxplotmultiple.xlsx file, 392boxplots, 389–393Boxplottemp.xlsx file, 389braces ({ }), 76brackets ([ ]), 25break-even analysis
with Goal Seek command, 198–199sensitivity analysis of, 189–191
Brent Crude Oil prices, 804Bristol-Myers Squibb, Monte Carlo simulation
used by, 907Bstempprotected.xlsx file, 961Bstemp.xlsx file, 958, 961Bubble button, 654bubble charts, creating, 608–609Bubbledata.xlsx file, 614budgeting, capital, 837–844
additional constraints in, 840–841binary and integer programming problems for,
841–842problems for, 842–844software project selection problem, 837–840
bull spread, 144bundling, price, 1012–1014business expenses, data validation for,
475–477business modeling
cost paid to supplier, 2–5customer estimation, 5–6demand curve, 7–8employee weekly wages, 1–2
business variables, 846correlations between, 689–695
CORREL function, 692Correlation dialog box, 692–693correlation matrix, 693definition of, 689between monthly stock returns during 1990s,
691–694overview of, 689–691problems for, 695regression toward the mean and, 694–695R-squared value and, 694
estimating relationships between, 643–652accuracy of predictions, 671
Z01_Winston_Index_p1067-1138.indd 1070 28/10/21 8:12 PM
cells
1071
dependent variables, 665–666Format Trendline options, 666–667independent variables, 665–666intercept of, 672monthly production and monthly operating
costs, 667–670monthly variation in plant-operating costs,
670–671problems for, 672–673R-squared value, 671scatter charts of data points, 666–667slope of, 672trend curve, 665
profit-maximizing price analysis, 184–188Buslist.xlsx file, 49butterfly spread, 144buttons, assigning macros to, 1036buy-and-hold strategy, 127–130By Changing Variable Cells (Solver Parameters dialog
box), 816, 820, 821, 839BYCOL helper function, 1057BYROW helper function, 1056–1057
CCAGR (compound annual growth rate), 677–678Cakes.xlsx file, 614Calccolumns1.xlsx file, 565Calccolumns2.xlsx file, 568Calccolumns3.xlxs file, 568Calcitemdata.xlsx, 538CALCULATE function, 567–570calculated fields, 515–517calculated items, 519–522calculated measures, 567–570Calculateditem.xlsx file, 519calculations
Enable Iterative Calculation, 118–120moving results of, 157–159
calendar worksheets, 146call options, 953, 955–956, 958–959Candybardata.xlsx file, 482Capbudget.xlsx file
Basic Model worksheet, 837If 3 Then 4 worksheet, 840–841
capital budgeting, 87, 837–844additional constraints in, 840–841binary and integer programming problems
for, 841–842
problems for, 842–844software project selection problem, 837–840
Capitalizefirstletter.xlsx file, 69card counting, 139Cardata.xlsx file, 724caret symbol (̂ ), 87, 685Carsumdata.xlsx file, 237Carville, James, 710case of data
named ranges, 12sorting on, 408–409
Case worksheet, 408Casesensitive.xlsx file, 237cash flows, 96
IRR (internal rate of return), 93–99calculating with IRR function, 94definition of, 93–94for irregularly spaced cash flows, 96lack of, 94–95multiple, 94–95problems for, 98–99scale of project and, 95–96unique, 95
NPV (net present value), computingfor cash flows received at beginning of year, 88for cash flows received at irregular intervals, 88–90for cash flows received at middle of year, 88problems for, 90–91
option pricing and, 954–955category chart labels, 597–598Categorylabels.xlsx file, 597Catsanddogs.xlsx file, 146in-cellIn-Cell Dropdown check box (Data Validation
dialog box), 477, 479CELL function, 247Cell Reference box (Add Constraint dialog box), 827, 839Cell Relationship button (Inquire add-in), 182Cellphonedata.xlsx file, 656cells
changing with INDIRECT, 240–241color, sorting on, 401–402counting, 209–215
COUNT function, 210, 214COUNTA function, 210, 214COUNTBLANK function, 210, 214COUNTIF function, 209–210, 211–213COUNTIFS function, 210, 213DISTINCT COUNT function, 214, 547–549problems for, 214–215
Z01_Winston_Index_p1067-1138.indd 1071 28/10/21 8:12 PM
1072
cells
dependentsanalyzing with Inquire add-in, 182definition of, 175tracing, 174–177
formatting, cleaning excess, 182named ranges
applying to existing formulas, 20AutoComplete capabilities for, 18AVERAGE function, 18case insensitivity of, 12creating, 11–16deleting, 16–17editing, 16–17for entire column, 18errors in, 22examples of, 17–18for last year’s revenues, 21–22naming conventions for, 23noncontiguous, 13numbers in, 23pasting list of, 21problems for, 23symbols in, 23for total salary per day, 22for total sales, 17–18underscore (_) in, 23workbook/worksheet scope for, 18–19
precedentsanalyzing with Inquire add-in, 182definition of, 174tracing, 174–175
result, 203, 206values, pasting to different part of worksheet, 157–159
centered moving averages, 751Central Limit worksheet, 786Ch21p1.xlsx file, 236Ch50data.xlsx file, 695Ch55.xlsx file, 742Ch56data.xlsx file, 747Ch78data.xlsx file, 906Change Chart Type dialog box, 592, 593–594Change Colors button, 590Change Constraint dialog box, 820Changeabsolutetemp.xlsx file, 1041–1044changing cells, in optimization models
bank workforce scheduling problem, 826optimization problems for, 808–809product-mix problem, 815software project selection problem, 838
transportation problem, 831Changing Cells option (Solver Parameters), 896ChangingAxes.xlsx file, 612–613Chapter 58 Solutions.docx file, 759Chapter1customers.xlsx file, 5Chapter29 problems for.xlsx file, 362Chapter32Problem5data.xlsx file, 409Chapter32Problem6data.xlsx file, 409Chapter35data.xlsx file, 458Chapter95data.xlsx file, 1060CHAR function, 54, 61Chart Design tab, 609Chart Elements list, 610, 637Chart Filters button, 611Chart Layouts section (Chart Design tab), 646Chart Styles group, 375, 629Chartdynamicrange.xlsx file, 234charts
band, 620–621, 923bar, 590–591based on sorted data, 627–628bubble, 608–609category labels, 597–598column
adding images to, 588–589creating, 586–587
combination, 591–593conditional colors in, 628–629controlling which series are charted
with check boxes, 624with list boxes, 625
creating from data tables, 191–192data labels, 598–600data tables in, 598–600deleting points from, 610–611dynamic dashboards for, 628–629dynamic labels for, 620–621, 923elements in, 609–610funnel, 638–639Gantt, 626hidden data in, 596–597inserting vertical lines into, 628–629line, 603–606missing data in, 595–596modifying axes in, 612–613Pareto
creating, 374–375design options for, 375
pie, 600–603, 654
Z01_Winston_Index_p1067-1138.indd 1072 28/10/21 8:12 PM
Companydata.xlsx file
1073
PivotCharts, 498–499, 529–531problems for, 614–615, 641–642radar, 607–608sales-force performance over time, 920–923scatter, 606–607, 666–667, 676
Scatter with Smooth Lines, 191, 623, 626, 631, 632Scatter with Smooth Lines and Markers, 746Scatter with Straight Lines, 995
secondary axis, 593–594stacked area, 603–606for stocks, 639–641storing as templates, 620–621, 923sunburst, 635–638switching rows/columns in, 611–612thermometer, 620–621, 923treemap (mosaic), 635–638waterfall, 633–635
Charts section (Insert tab), 191, 586, 593, 603, 604, 608, 644Check Box form control, 307Checkbox.xlsx file, 307chemical compounds and elements, in Excel formulas,
351–352Chemistry data type, 351–352CHOOSE function, 139–140Choosefinal.xlsx file, 139Cigarettedata.xlsx file, 538circular references, 117–121
example of, 117–118pattern of, 117problems for, 120–121resolving, 118–120
Circulartemp.xlsx file, 117Cisco, histogram for, 373–374Ciscoexpo.xlsx file, 676–678cities
returning distance between, 39–40sorting on, 405–407
Cities data type, 347–348Citydata.xlsx file, 36Citydistances.xlsx file, 194Clean Excel Cell Formatting button (Inquire add-in), 182CLEAN function, 55, 61Cleanexample.xlsx file, 61Clear Rules, 253clearing data validation, 481CLT (central limit theorem), 786–787, 796Clustered Column chart option, 586, 591, 628, 629Clustered Column - Line chart option, 592, 593cohorts, 968
Coke/Pepsi preference example, 771collapsing PivotTable fields, 492–493Collegedata.xlsx file, 538colon (:), 150color
in charts, 628–629color coding
of basketball players’ abilities, 274–275of monthly stock returns, 266–269of quarterly corporate revenues, 269–272of weekend dates, 272–273
filtering by, 421sorting on, 401–402
Color Scales, 253, 261–263, 643Coltsdata.xlsx file, 394column charts
adding images to, 588–589creating, 586–587
Column Data Format list (Import Wizard), 319Column Input Cell (Data Table dialog box), 939, 950, 969,
1016Column option (Sparkline Tools Design), 661Column Sparkline worksheet, 662Column worksheet, 586column_index argument (VLOOKUP function), 25Columncharts.xlsx file
Column worksheet, 586One Book worksheet, 588
columnsdelimited, 315fixed-width, 315, 317–319named ranges for, 18sorting across, 407–408switching with rows, 611–612transposing with rows, 159–160
Columns option (Series dialog box), 913COM Add-Ins dialog box, 179, 552combination charts, creating, 591–593Combinationstemp.xlsx file, 591Combo Box form control, 313Combobox.xlsx file, 312commands. See individual commandscomments
creating, 944editing, 944hiding, 944
Commodities.xlsx file, 804commodity prices, importing past data on, 804–805Companydata.xlsx file, 215
Z01_Winston_Index_p1067-1138.indd 1073 28/10/21 8:12 PM
1074
complements, law of
complements, law of, 754compound annual growth rate (CAGR), 677–678Compound Interest.xlsx, 111–112CONCATENATE function, 54, 57Conditional Formatting
New Rule, 873Top/Bottom Rules, 1016
conditional formatting, 251–281checking or customizing, 257–258Clear Rules, 253color coding, 266–275
of basketball players’ abilities, 274–275of monthly stock returns, 266–269of quarterly corporate revenues, 269–272of weekend dates, 272–273
Color Scales, 253, 261–263Conditional Formatting Rules Manager, 257–258Data Bars feature, 253
creating and customizing, 259–260negative, 261
Format Painter feature, 277highlighting employee ratings with, 892–893Highlights Cells feature, 252, 255–257Icon Sets, 253, 263–266Manage Rules, 253monthly stock returns, 266–269New Rule, 253for outliers, 383–384overview of, 251–253in PivotTables, 502–504problems for, 278–281Stop If True option, 275–277of table data, 295–298toggling on/off, 307–312Top/Bottom Rules, 252, 253–255
Conditional Formatting button, 892–893Conditional Formatting Rules Manager, 257–258, 259–260conditional maximums and minimums, 218, 221–222conditional probability, 756–757configuration
data validation criteriaAutoComplete feature, 481clearing data validation, 481custom, 476–477dates, 475–476error alerts, 474–475Go To Special dialog box, 481length of text in cell, 481minimum/maximum, 473–475
nested/dependent drop-down menus, 478–480nonnumeric values, 476–478numeric values, 476–477problems for, 481–482state abbreviations, 477–478time of day, 481in versions prior to Excel 2010, 481
multiple-worksheet workbooks, 167–169hyperlinks, 167–169number of worksheets, 166setting up, 165–167
Consolidate command, 571–575Consolidate dialog box, 573–574consolidating data, 571–575
with Consolidate command, 571–575need for, 571problems for for, 575
constants, array, 451–452constraints
adding, 896AllDifferent, 896in project selection problem, 837–840
consulting costs, 121consumer surplus, 1012contingency tables, 757continuous compounding, 111–112continuous random variables, 765Contoso.xlsx file, 536Contrateeoq.xlsx file, 976, 977controls, form
Check Box, 307Combo Box, 313Format Control dialog box, 304–306, 313Option Button, 307overview of, 302problems for, 313–314Scrollbar, 307Spin Button, 302–307
Controls.xlsx file, 301Convert Text to Columns Wizard, 59–60Convert to Range button, 543converting text strings to times, 152copper, annual volatility for, 966Copy command (File menu), 2, 910Copyingtableformulas.xlsx, 297corporations, in Excel formulas, 349–350CORREL function, 692Correlation dialog box, 692–693Correlationexamples.xlsx, 689
Z01_Winston_Index_p1067-1138.indd 1074 28/10/21 8:12 PM
Customers.xlsx file
1075
correlations, 689–695CORREL function, 692Correlation dialog box, 692–693correlation matrix, 693definition of, 689between monthly stock returns during 1990s,
691–694overview of, 689–691problems for, 695regression toward the mean and, 694–695R-squared value and, 694
Costestimate.xlsx file, 667costs
capital budgeting, 87, 837–844additional constraints in, 840–841binary and integer programming problems for,
841–842problems for, 842–844software project selection problem, 837–840
monthly operating, 697–701paid to supplier, 2–5reciprocal cost allocation, 121
COUNT function, 574examples of, 214syntax of, 210
COUNTA functionexamples of, 214overview of, 210
COUNTBLANK functionexamples of, 214overview of, 210
COUNTIF function, 482, 891, 909, 928, 941, 943examples of, 211–213syntax of, 209–210
COUNTIFS function, 449examples of, 213syntax of, 210
counting cells in ranges, 209–215COUNT function, 210, 214COUNTA function, 210, 214COUNTBLANK function, 210, 214COUNTIF function, 209–210, 211–213COUNTIFS function, 210, 213DISTINCT COUNT function, 214, 547–549
Countryregion.xlsx file, 724Coupondata.xlsx file, 743COVIDcases.xlsx file, 614craps, modeling, 130, 937–939Craps worksheet, 130
Craps.xlsx file, 938Create Custom Combo Chart button, 593Create Data Type dialog box, 360Create Forecast Worksheet dialog box, 864Create from Selection option, 13–15, 20Create PivotTable dialog box, 486, 543, 546, 549, 557, 564Create Relationship dialog box, 543–544Create Sparklines dialog box, 660, 663Create Table dialog box, 284, 290CreateTabletemp.xlsx file, 328–329Createtable.xlsx file, 328–329Creating Powers worksheet, 451credit score, interest rates and, 115Creditunion.xlsx file, 869, 874Crimedata.xlsx file, 642CRITBINOM function, 773CUMPRINC function, 107cumulative interest payments (CUMIPMT), 107cumulative principal (CUMPRINC), 107cumulative probability, 770cumulative units produced, production time and, 683curly braces ({ }), 76, 451Currencies data type, 350currency exchange rates, 803currency ISO codes, 803Currency worksheet, 803current date, displaying, 76current time, displaying, 151Custom AutoFilter, 427–428Custom Column dialog box, 336custom data-validation, 476–477custom functions, creating with LAMBDA, 1051–1055Custom Lists dialog box, 404customer traffic
daily customer counts, sparklines for, 659–660forecasting in presence of special events, 869–876
factors influencing customer traffic, 869–872forecast accuracy, 872–876overview of, 869problems for, 876random errors in, 876
worksheet model for, 5–6customer value, determining, 967–972
cell phone customer case study, 969–971credit-card customer case study, 967–969NPV function, 968–969problems for, 969–971willingness to pay, 997
Customers.xlsx file, 1065
Z01_Winston_Index_p1067-1138.indd 1075 28/10/21 8:12 PM
Customize Data Card dialog box
1076
Customize Data Card dialog box, 651Customize Ribbon option (Excel Options dialog box), 1031customizing 3D maps, 650–651
Ddaily customer counts, sparklines for, 659–660daily suggested prices, importing and transforming,
336–337Dailydow.xlsx files, 673Dallas Mavericks basketball statistics, 163, 315–320dashboards, dynamic, 628–629data
consolidating, 571–575with Consolidate command, 571–575need for, 571problems for, 575problems for for, 575
in Data Model, 542–543adding, 546removing, 543
filtering. See filteringrealigning from column to row, 159–160sorting. See sortingvalidating, 473–482
AutoComplete feature, 481clearing data validation, 481custom, 476–477dates, 475–476error alerts, 474–475Go To Special dialog box, 481length of text in cell, 481minimum/maximum criteria, 473–475nested/dependent drop-down menus, 476–480nonnumeric values, 476–478numeric values, 476–477problems for, 481–482state abbreviations, 477–478time of day, 481in versions prior to Excel 2010, 481
Data Analysis, 692, 721. See also analysis of variance (ANOVA)correlations, 689–695
CORREL function, 692Correlation dialog box, 692–693correlation matrix, 693definition of, 689between monthly stock returns during
1990s, 691–694
overview of, 689–691problems for, 695regression toward the mean and, 694–695R-squared value and, 694
installing/activating, 728Data Analysis dialog box, 377, 378, 692, 698. See also
analysis of variance (ANOVA)Data Analysis Expressions (DAX), 560–562Data Bars, 253
creating and customizing, 259–260negative, 261
data importcombining data into summary worksheet, 338–340combining into single file, 331–333daily suggested prices, 336–337Excel tables
appending, 338–340creating from flat files, 328–329flattening, 327–328
Get & Transform Data options, 321–322hardware store data, 331–333NBA player data, 329–331Power Query Editor, 322US city population data, 323–327
Data Label Range dialog box, 604, 607, 609Data Model, 541–550
creating PivotTables with, 542–543, 544–546data
adding, 542–543, 546removing, 543sample, 541–542
DISTINCT COUNT function, 214, 547–549problems for, 550relationships
creating, 543–544managing, 546–547
worksheets in, 541Data Selector pane, 345data sets
boxplots, 389–393comparing, 384–385finding patterns in, 1019–1029
BOM (bill of materials) reports, 1019daycare late pickups, 1027–1028heights of fathers/sons, 1025–1027hospital data, 1024–1025overview of, 1019problems for, 1028–1029stock market prices, 1022–1024
Z01_Winston_Index_p1067-1138.indd 1076 28/10/21 8:12 PM
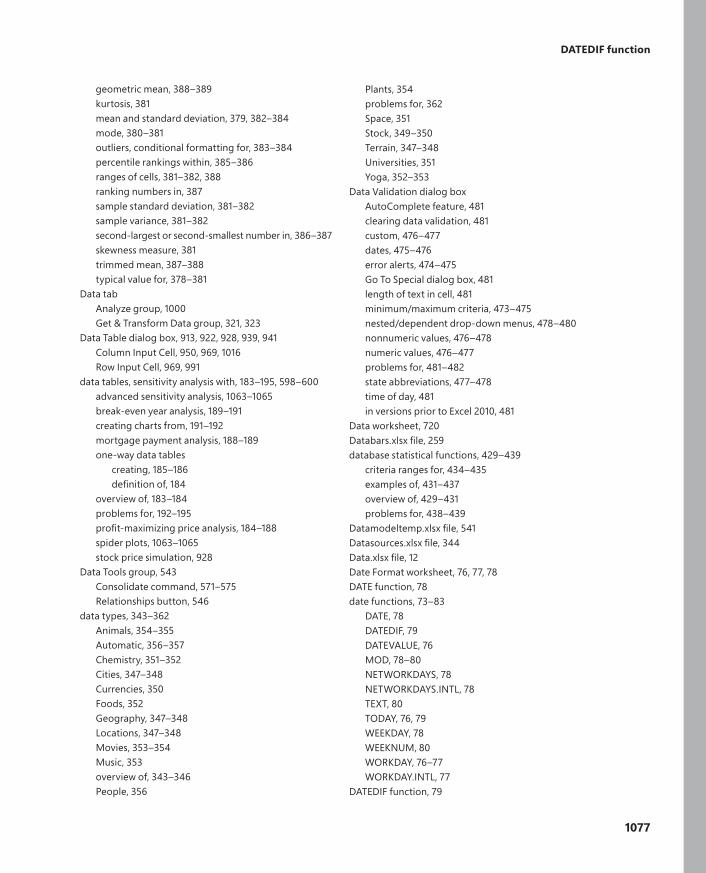
DATEDIF function
1077
geometric mean, 388–389kurtosis, 381mean and standard deviation, 379, 382–384mode, 380–381outliers, conditional formatting for, 383–384percentile rankings within, 385–386ranges of cells, 381–382, 388ranking numbers in, 387sample standard deviation, 381–382sample variance, 381–382second-largest or second-smallest number in, 386–387skewness measure, 381trimmed mean, 387–388typical value for, 378–381
Data tabAnalyze group, 1000Get & Transform Data group, 321, 323
Data Table dialog box, 913, 922, 928, 939, 941Column Input Cell, 950, 969, 1016Row Input Cell, 969, 991
data tables, sensitivity analysis with, 183–195, 598–600advanced sensitivity analysis, 1063–1065break-even year analysis, 189–191creating charts from, 191–192mortgage payment analysis, 188–189one-way data tables
creating, 185–186definition of, 184
overview of, 183–184problems for, 192–195profit-maximizing price analysis, 184–188spider plots, 1063–1065stock price simulation, 928
Data Tools group, 543Consolidate command, 571–575Relationships button, 546
data types, 343–362Animals, 354–355Automatic, 356–357Chemistry, 351–352Cities, 347–348Currencies, 350Foods, 352Geography, 347–348Locations, 347–348Movies, 353–354Music, 353overview of, 343–346People, 356
Plants, 354problems for, 362Space, 351Stock, 349–350Terrain, 347–348Universities, 351Yoga, 352–353
Data Validation dialog boxAutoComplete feature, 481clearing data validation, 481custom, 476–477dates, 475–476error alerts, 474–475Go To Special dialog box, 481length of text in cell, 481minimum/maximum criteria, 473–475nested/dependent drop-down menus, 478–480nonnumeric values, 476–478numeric values, 476–477problems for, 481–482state abbreviations, 477–478time of day, 481in versions prior to Excel 2010, 481
Data worksheet, 720Databars.xlsx file, 259database statistical functions, 429–439
criteria ranges for, 434–435examples of, 431–437overview of, 429–431problems for, 438–439
Datamodeltemp.xlsx file, 541Datasources.xlsx file, 344Data.xlsx file, 12Date Format worksheet, 76, 77, 78DATE function, 78date functions, 73–83
DATE, 78DATEDIF, 79DATEVALUE, 76MOD, 78–80NETWORKDAYS, 78NETWORKDAYS.INTL, 78TEXT, 80TODAY, 76, 79WEEKDAY, 78WEEKNUM, 80WORKDAY, 76–77WORKDAY.INTL, 77
DATEDIF function, 79
Z01_Winston_Index_p1067-1138.indd 1077 28/10/21 8:12 PM
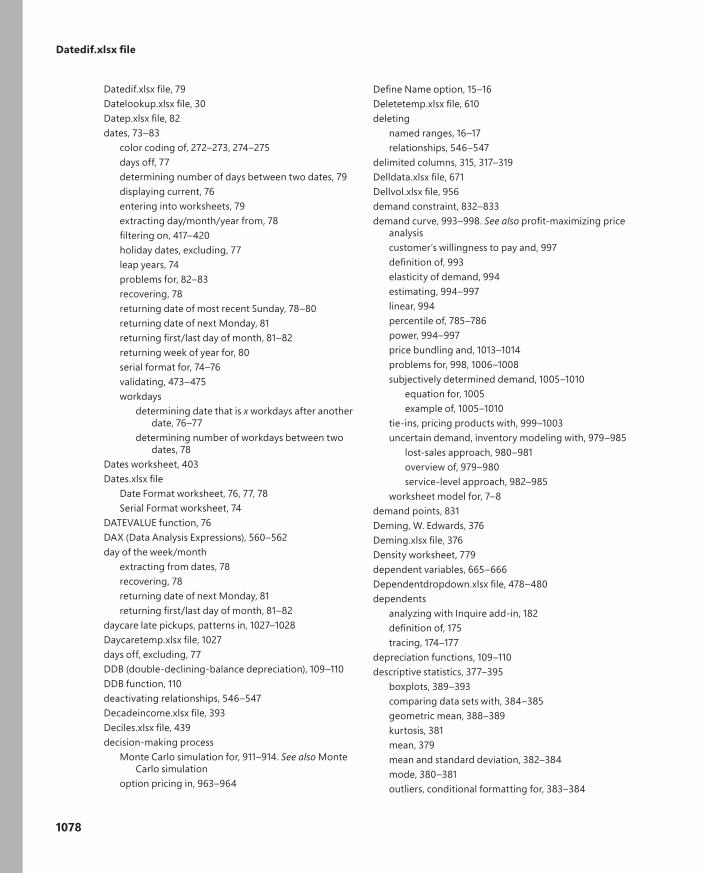
Datedif.xlsx file
1078
Datedif.xlsx file, 79Datelookup.xlsx file, 30Datep.xlsx file, 82dates, 73–83
color coding of, 272–273, 274–275days off, 77determining number of days between two dates, 79displaying current, 76entering into worksheets, 79extracting day/month/year from, 78filtering on, 417–420holiday dates, excluding, 77leap years, 74problems for, 82–83recovering, 78returning date of most recent Sunday, 78–80returning date of next Monday, 81returning first/last day of month, 81–82returning week of year for, 80serial format for, 74–76validating, 473–475workdays
determining date that is x workdays after another date, 76–77
determining number of workdays between two dates, 78
Dates worksheet, 403Dates.xlsx file
Date Format worksheet, 76, 77, 78Serial Format worksheet, 74
DATEVALUE function, 76DAX (Data Analysis Expressions), 560–562day of the week/month
extracting from dates, 78recovering, 78returning date of next Monday, 81returning first/last day of month, 81–82
daycare late pickups, patterns in, 1027–1028Daycaretemp.xlsx file, 1027days off, excluding, 77DDB (double-declining-balance depreciation), 109–110DDB function, 110deactivating relationships, 546–547Decadeincome.xlsx file, 393Deciles.xlsx file, 439decision-making process
Monte Carlo simulation for, 911–914. See also Monte Carlo simulation
option pricing in, 963–964
Define Name option, 15–16Deletetemp.xlsx file, 610deleting
named ranges, 16–17relationships, 546–547
delimited columns, 315, 317–319Delldata.xlsx file, 671Dellvol.xlsx file, 956demand constraint, 832–833demand curve, 993–998. See also profit-maximizing price
analysiscustomer’s willingness to pay and, 997definition of, 993elasticity of demand, 994estimating, 994–997linear, 994percentile of, 785–786power, 994–997price bundling and, 1013–1014problems for, 998, 1006–1008subjectively determined demand, 1005–1010
equation for, 1005example of, 1005–1010
tie-ins, pricing products with, 999–1003uncertain demand, inventory modeling with, 979–985
lost-sales approach, 980–981overview of, 979–980service-level approach, 982–985
worksheet model for, 7–8demand points, 831Deming, W. Edwards, 376Deming.xlsx file, 376Density worksheet, 779dependent variables, 665–666Dependentdropdown.xlsx file, 478–480dependents
analyzing with Inquire add-in, 182definition of, 175tracing, 174–177
depreciation functions, 109–110descriptive statistics, 377–395
boxplots, 389–393comparing data sets with, 384–385geometric mean, 388–389kurtosis, 381mean, 379mean and standard deviation, 382–384mode, 380–381outliers, conditional formatting for, 383–384
Z01_Winston_Index_p1067-1138.indd 1078 28/10/21 8:12 PM
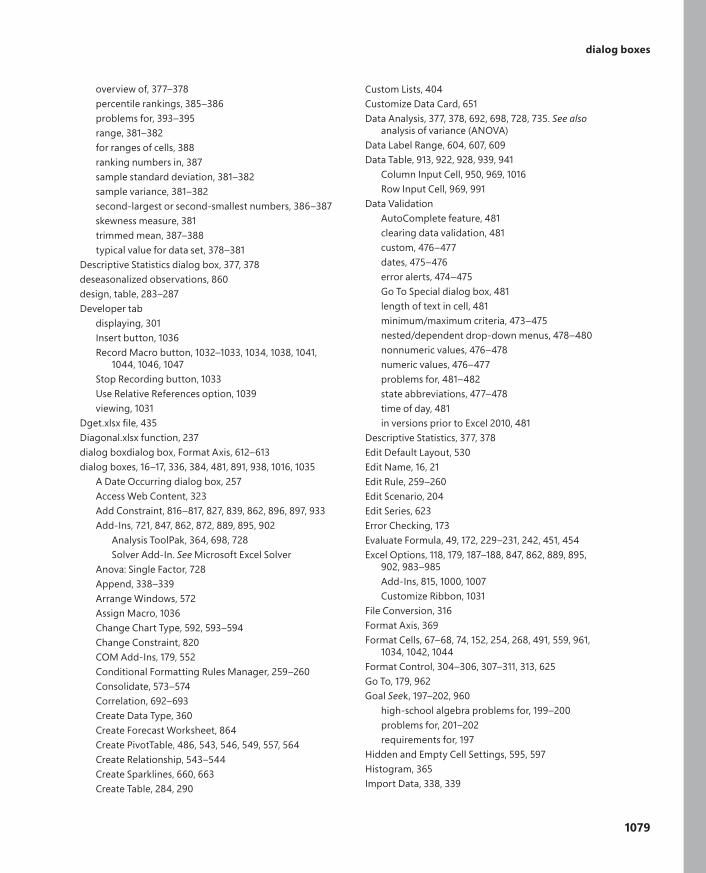
dialog boxes
1079
overview of, 377–378percentile rankings, 385–386problems for, 393–395range, 381–382for ranges of cells, 388ranking numbers in, 387sample standard deviation, 381–382sample variance, 381–382second-largest or second-smallest numbers, 386–387skewness measure, 381trimmed mean, 387–388typical value for data set, 378–381
Descriptive Statistics dialog box, 377, 378deseasonalized observations, 860design, table, 283–287Developer tab
displaying, 301Insert button, 1036Record Macro button, 1032–1033, 1034, 1038, 1041,
1044, 1046, 1047Stop Recording button, 1033Use Relative References option, 1039viewing, 1031
Dget.xlsx file, 435Diagonal.xlsx function, 237dialog boxdialog box, Format Axis, 612–613dialog boxes, 16–17, 336, 384, 481, 891, 938, 1016, 1035
A Date Occurring dialog box, 257Access Web Content, 323Add Constraint, 816–817, 827, 839, 862, 896, 897, 933Add-Ins, 721, 847, 862, 872, 889, 895, 902
Analysis ToolPak, 364, 698, 728Solver Add-In. See Microsoft Excel Solver
Anova: Single Factor, 728Append, 338–339Arrange Windows, 572Assign Macro, 1036Change Chart Type, 592, 593–594Change Constraint, 820COM Add-Ins, 179, 552Conditional Formatting Rules Manager, 259–260Consolidate, 573–574Correlation, 692–693Create Data Type, 360Create Forecast Worksheet, 864Create PivotTable, 486, 543, 546, 549, 557, 564Create Relationship, 543–544Create Sparklines, 660, 663Create Table, 284, 290
Custom Lists, 404Customize Data Card, 651Data Analysis, 377, 378, 692, 698, 728, 735. See also
analysis of variance (ANOVA)Data Label Range, 604, 607, 609Data Table, 913, 922, 928, 939, 941
Column Input Cell, 950, 969, 1016Row Input Cell, 969, 991
Data ValidationAutoComplete feature, 481clearing data validation, 481custom, 476–477dates, 475–476error alerts, 474–475Go To Special dialog box, 481length of text in cell, 481minimum/maximum criteria, 473–475nested/dependent drop-down menus, 478–480nonnumeric values, 476–478numeric values, 476–477problems for, 481–482state abbreviations, 477–478time of day, 481in versions prior to Excel 2010, 481
Descriptive Statistics, 377, 378Edit Default Layout, 530Edit Name, 16, 21Edit Rule, 259–260Edit Scenario, 204Edit Series, 623Error Checking, 173Evaluate Formula, 49, 172, 229–231, 242, 451, 454Excel Options, 118, 179, 187–188, 847, 862, 889, 895,
902, 983–985Add-Ins, 815, 1000, 1007Customize Ribbon, 1031
File Conversion, 316Format Axis, 369Format Cells, 67–68, 74, 152, 254, 268, 491, 559, 961,
1034, 1042, 1044Format Control, 304–306, 307–311, 313, 625Go To, 179, 962Goal Seek, 197–202, 960
high-school algebra problems for, 199–200problems for, 201–202requirements for, 197
Hidden and Empty Cell Settings, 595, 597Histogram, 365Import Data, 338, 339
Z01_Winston_Index_p1067-1138.indd 1079 28/10/21 8:12 PM
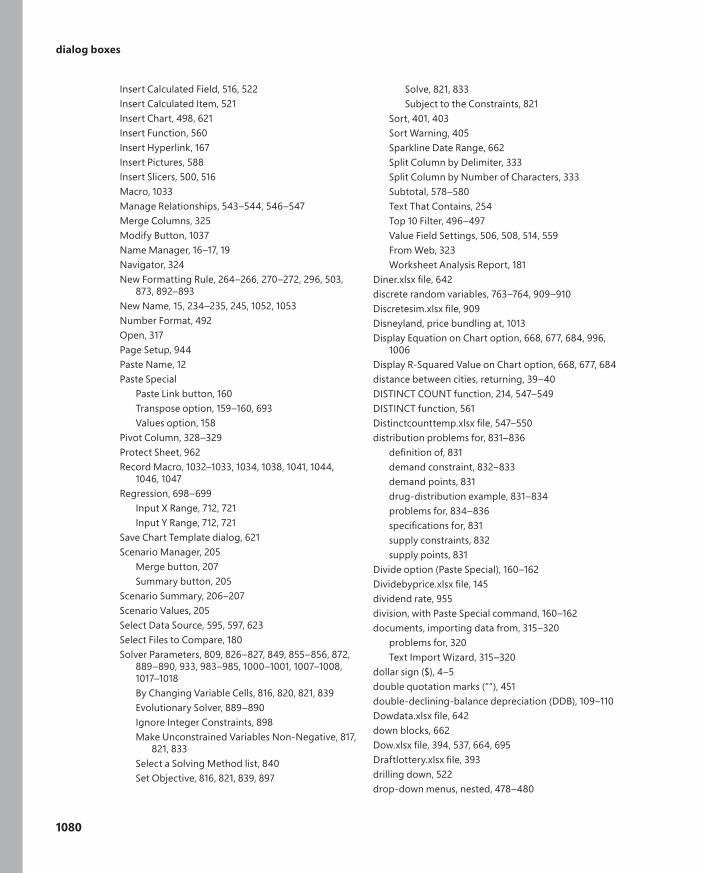
1080
dialog boxes
Insert Calculated Field, 516, 522Insert Calculated Item, 521Insert Chart, 498, 621Insert Function, 560Insert Hyperlink, 167Insert Pictures, 588Insert Slicers, 500, 516Macro, 1033Manage Relationships, 543–544, 546–547Merge Columns, 325Modify Button, 1037Name Manager, 16–17, 19Navigator, 324New Formatting Rule, 264–266, 270–272, 296, 503,
873, 892–893New Name, 15, 234–235, 245, 1052, 1053Number Format, 492Open, 317Page Setup, 944Paste Name, 12Paste Special
Paste Link button, 160Transpose option, 159–160, 693Values option, 158
Pivot Column, 328–329Protect Sheet, 962Record Macro, 1032–1033, 1034, 1038, 1041, 1044,
1046, 1047Regression, 698–699
Input X Range, 712, 721Input Y Range, 712, 721
Save Chart Template dialog, 621Scenario Manager, 205
Merge button, 207Summary button, 205
Scenario Summary, 206–207Scenario Values, 205Select Data Source, 595, 597, 623Select Files to Compare, 180Solver Parameters, 809, 826–827, 849, 855–856, 872,
889–890, 933, 983–985, 1000–1001, 1007–1008, 1017–1018By Changing Variable Cells, 816, 820, 821, 839Evolutionary Solver, 889–890Ignore Integer Constraints, 898Make Unconstrained Variables Non-Negative, 817,
821, 833Select a Solving Method list, 840Set Objective, 816, 821, 839, 897
Solve, 821, 833Subject to the Constraints, 821
Sort, 401, 403Sort Warning, 405Sparkline Date Range, 662Split Column by Delimiter, 333Split Column by Number of Characters, 333Subtotal, 578–580Text That Contains, 254Top 10 Filter, 496–497Value Field Settings, 506, 508, 514, 559From Web, 323Worksheet Analysis Report, 181
Diner.xlsx file, 642discrete random variables, 763–764, 909–910Discretesim.xlsx file, 909Disneyland, price bundling at, 1013Display Equation on Chart option, 668, 677, 684, 996,
1006Display R-Squared Value on Chart option, 668, 677, 684distance between cities, returning, 39–40DISTINCT COUNT function, 214, 547–549DISTINCT function, 561Distinctcounttemp.xlsx file, 547–550distribution problems for, 831–836
definition of, 831demand constraint, 832–833demand points, 831drug-distribution example, 831–834problems for, 834–836specifications for, 831supply constraints, 832supply points, 831
Divide option (Paste Special), 160–162Dividebyprice.xlsx file, 145dividend rate, 955division, with Paste Special command, 160–162documents, importing data from, 315–320
problems for, 320Text Import Wizard, 315–320
dollar sign ($), 4–5double quotation marks (““), 451double-declining-balance depreciation (DDB), 109–110Dowdata.xlsx file, 642down blocks, 662Dow.xlsx file, 394, 537, 664, 695Draftlottery.xlsx file, 393drilling down, 522drop-down menus, nested, 478–480
Z01_Winston_Index_p1067-1138.indd 1080 28/10/21 8:12 PM
EOQ (economic order quantity) inventory model
1081
drug distribution problem, 831–834drug sales, forecasts for, 792–793Drugfore.xlsx file, 792Drug.xlsx, 1028DSUM function, 429–439
criteria ranges for, 434–435examples of, 431–437overview of, 429–431problems for, 438–439syntax of, 430–431
Duedates.xlsx file, 278dummy variables, 706duplicates, removing in Excel AutoFilter, 424Durant, Kevin, 776duration of activity
call/put options, 955modeling, 904–905
DVDsales.xlsx file, 237dynamic array functions, 461–471
FILTER, 466–468INDIRECT, 465–466nested drop-down menus, creating, 478–480overview of, 461PivotTables compared to, 535–536problems for, 471SEQUENCE, 469–470SORT, 464–466SORTBY, 464–466UNIQUE, 461–464
dynamic chart labels, 620–621, 923dynamic ranges, 232–235Dynamiclabelstemp.xlsx file, 622Dynamicrange.xlsx file, 232–235
Eearnings before interest and taxes (EBIT), 144East sales, extracting from total US sales, 58–60EASTER function, 1054–1055Eastwest.xlsx file, 12East.xlsx file, 575EBIT (earnings before interest and taxes), 144economic order batch (EOB) size, 976–977economic order quantity inventory model. See EOQ
(economic order quantity) inventory modelEDATE function, 81Edit command (Macro dialog box), 1033Edit Comment button, 944Edit Data option (Sparkline Tools Design), 661
Edit Default Layout dialog box, 530Edit In Formula Bar option (Error Checking dialog box),
174Edit Name dialog box, 16, 21Edit Rule dialog box, 259–260Edit Scenario dialog box, 204Edit Series dialog box, 623editing
array formulas, 452. See also Power Query Editormacros, 1033named ranges, 16–17PivotTables, 509queries, 334relationships, 546–547
editor, Power Query. See Power Query EditorEinstein, Albert, 111elasticity of demand, 994Electiondata.xlsx file, 673Electoralvotes.xlsx file, 657elements, chart, 609–610Eli Lilly, Monte Carlo simulation used by, 907email addresses, creating, 62–64email lists, creating from list of names, 62–64Emailproblem.xlsx file, 69employees, 667–668
assigning to workgroups, 890–892dollar amount of merchandise sold by, 218–221highlighting ratings for, 892–893length of time worked by, calculating, 152–153, 312–313sales by region, subtotals of, 580–581scheduling with Microsoft Excel Solver, 825–829total salary per day, 22weekly wages, 1–2, 22
Employees.xlsx file, 37, 41empty cells, in PivotTables, 501–502Enable Iterative Calculation option, 118–120, 134engines (Solver)
overview of, 810–811Simplex LP, 817–819, 833
entering times, 150EOB (economic order batch) size, 976–977EOMONTH function, 81EOMONTHEDATE.xlsx file, 81–82EOQ (economic order quantity) inventory model, 973–978
computer-manufacturing plant case study, 976–977development of, 973economic order batch (EOB) size, 976–977electronics store case study, 973–975equations for, 973–975
Z01_Winston_Index_p1067-1138.indd 1081 28/10/21 8:12 PM
1082
EOQ (economic order quantity) inventory model
problems for, 977–978EOQ Protected worksheet, 975Eoq.xlsx file, 975equal sign (=), 58, 211equation solver. See Goal Seek commandError Alert tab (Data Validation dialog box), 474–475error alerts, 474–475Error Checking dialog box, 173–174errors, 95, 481–482
circular references, 117–121example of, 117–118pattern of, 117problems for, 120–121resolving, 118–120
data validation, 473–482clearing data validation, 481dates, 475–476error alerts, 474–475Go To Special dialog box, 481minimum/maximum criteria, 473–475nested/dependent drop-down menus, 478–480numeric values, 476–477problems for, 481–482state abbreviations, 477–478in versions prior to Excel 2010, 481
Error Checking feature, 173–174in forecasts, 876#N/A, 26, 28, 134–136, 174#NUM!98#SPILL, 22, 349, 464#VALUE, 61–62
Errortrap.xlsx file, 134, 173Errortypes.xlsx file, 136European cash flows, option pricing and, 954–955European options, 124, 953Evaluate Formula dialog box, 49, 172, 229–231,
242, 451, 454evaluating forecasts, 792–793events
definition of, 754forecasting in presence of, 869–876
factors influencing customer traffic, 869–872forecast accuracy, 872–876overview of, 869problems for, 876random errors in, 876
independent, 755–756mutually exclusive, 754–755
Evolutionary Solver, 810–811, 889–894
assigning employees to workgroups with, 890–892highlighting employee ratings with, 892–893options for, 889–890problems for, 893–894tips for success, 889–894
Evolutionary Solver engine, 1017EXACT function, 237Excel Add-Ins, 692, 847, 933, 1000, 1007Excel AutoFilter feature
examples of, 413–428clearing, 415Color, 421Custom AutoFilter, 427–428Date, 417–420Location, 413–415Name, 420Numbers, 416–417, 421–422Reapply option, 425Remove Duplicates, 424
overview of, 411–413problems for, 428
Excel Data Analysis feature, 698Excel Data Model, 541–550
creating PivotTables with, 542–543, 544–546data
adding, 542–543, 546removing, 543sample, 541–542
DISTINCT COUNT function, 214, 547–549problems for, 550relationships
creating, 543–544managing, 546–547
worksheets in, 541Excel Options dialog box, 118, 179, 187–188, 847, 862, 889,
895, 897, 902, 983–985Add-Ins, 809, 815, 839, 862, 1000, 1007Customize Ribbon, 1031
Excelfinfunctions.xlsx file, 102FV worksheet, 104PMT worksheet, 105PV worksheet, 102Rate worksheet, 108
excess cell formatting, cleaning with Inquire add-in, 182exchange rates
in Excel formulas, 350importing past data on, 803
exercise date/expiration date, 953exercise price, 125
Z01_Winston_Index_p1067-1138.indd 1082 28/10/21 8:12 PM
files
1083
EXP function, 679, 723expanding PivotTable fields, 492–493experience curve, 683, 684–685experiments, 753, 763EXPON.DIST function, 779–780Exponential command (Format Trendline menu), 666,
675–678exponential growth, 675–680
CAGR (compound annual growth rate), 675–678Exponential command, 675–678GROWTH function, 679–680modeling, 676–678overview of, 675predictions based on, 679–680problems for, 680S-curve, 678trend curve parameters for, 678–679
exponential random variablecomputing probabilities for, 779–780problems for, 780
exponential smoothing, Winters method ofequations for, 860–861Forecast Sheet tool, 863–866initialization of, 861level of series, 860–861overview of, 859problems for, 867seasonal index for current month, 860–861smoothing constants, estimation of, 862–863time series characteristics, 859–860trend of series, 860–861
Exponentialdata.xlsx file, 680Exponentialdist.xlsx file, 779extracting hour/minute/second from times, 152EyeColor.xlsx file, 1028
FF4 key, 5Faberu.xlsx file, 550FACTORIAL function, 1056Fair, Ray, 710father/son heights, patterns in, 1025–1027Fax.xlsx file, 684FCFs (free cash flows), 130Feasible Solution worksheet, 813, 820feasible solutions, 811, 813–819, 820Febcon.xlsx file, 575
federal aid, determining 99th percentile of demand for, 785–786
Fermat, Pierre de, 776Fibonacci sequence, 9fields, PivotTable
calculated, 515–517collapsing/expanding, 492–493filtering, 495–498format of, 491–492PivotTable Fields pane, 487–488sorting, 493–494
File Conversion dialog box, 316File menu commands
Copy, 910Options, 64, 809Paste Special Values, 910
files, 41, 49, 249, 634, 672, 676–678, 961Accountsums.xlsx, 280Adagency.xlsx, 299Addresses.xlsx, 145Advancedfilter.xlsx, 436Ageofmachine.xlsx, 69Agingdata.xlsx, 236Airlinemilestemp.xlsx, 864Amazon.xlsx, 279, 281Analyzesurveydata.xlsx, 539Applynames.xlsx, 20Arrays.xlsx, 447
Creating Powers worksheet, 451Matching Names worksheet, 446Total Wages worksheet, 442Transpose worksheet, 444
ASCIIcharacters.xlsx, 54Asiansales.xlsx, 228Assign.xlsx, 35, 890Asterisks.xlsx, 31Audittwosheets.xlsx, 178, 181Bakery1temp.xlsx, 2–3Bakery2temp.xlsx, 4Bandchart.xlsx, 620Bank24.xlsx, 825Barcharts.xlsx, 590Baseball96.xlsx, 724Baseballproblem7.xlsx, 49Baseball.xlsx, 46–47Betaresampling.xlsx, 951Beta.xlsx, 904Binomialexamples.xlsx, 770Binomialsim.xlsx, 919
Z01_Winston_Index_p1067-1138.indd 1083 28/10/21 8:12 PM
files
1084
BOM.xlsx, 1021Boxplotmultiple.xlsx, 392Boxplottemp.xlsx, 389Bstemp.xlsx, 958, 961Bubbledata.xlsx, 614Cakes.xlsx, 614Calccolumns1.xlsx, 565Calccolumns3.xlxs, 568Calcitemdata.xlsx, 538Calculateditem.xlsx, 519Candybardata.xlsx, 482Capbudget.xlsx
Basic Model worksheet, 837If 3 Then 4 worksheet, 840–841
Capitalizefirstletter.xlsx, 69Cardata.xlsx, 724Carsumdata.xlsx, 237Casesensitive.xlsx, 237Categorylabels.xlsx, 597Catsanddogs.xlsx, 146Cellphonedata.xlsx, 657Ch21p1.xlsx, 236Ch50data.xlsx, 695Ch55.xlsx, 742Ch78data.xlsx, 906Changeabsolutetemp.xlsx, 1041–1044ChangingAxes.xlsx, 612–613Chapter 58 Solutions.docx, 759Chapter1customers.xlsx, 5Chapter29 problems for.xlsx, 362Chapter32Problem5data.xlsx, 409Chapter32Problem6data.xlsx, 409Chapter35data.xlsx, 458Chapter95data.xlsx, 1060Chartdynamicrange.xlsx, 234Checkbox.xlsx, 307Choosefinal.xlsx, 139–140Cigarettedata.xlsx, 538Circulartemp.xlsx, 117Ciscoexpo.xlsx, 676Citydata.xlsx, 36Citydistances.xlsx, 194Cleanexample.xlsx, 61Collegedata.xlsx, 538Coltsdata.xls, 394Columncharts.xlsx
Column worksheet, 586One Book worksheet, 588
Combinationstemp.xlsx, 591
Combobox.xlsx, 312Commodities.xlsx, 804Companydata.xlsx, 215Compound Interest.xlsx, 111–112Contoso.xlsx, 536Contrateeoq.xlsx, 977Controls.xlsx, 301Copyingtableformulas.xlsx, 297Correlationexamples.xlsx, 689Costestimate.xlsx, 667Countryregion.xlsx, 724Coupondata.xlsx, 743COVIDcases.xlsx, 614Craps.xlsx, 938CreateTabletemp.xlsx, 328–329Createtable.xlsx, 328–329Creditunion.xlsx, 869, 874Crimedata.xlsx, 642Customers.xlsx, 1065Dailydow.xlsx, 673Databars.xlsx, 259Datamodeltemp.xlsx, 541Datasources.xlsx, 344Data.xlsx, 12Datedif.xlsx, 79Datelookup.xlsx, 30Datep.xlsx, 82Dates.xlsx
Date Format worksheet, 76, 77, 78Serial Format worksheet, 74
Daycaretemp.xlsx, 1027Decadeincome.xlsx, 393Deciles.xlsx, 439Deletetemp.xlsx, 610Delldata.xlsx, 671Dellvol.xlsx, 956Deming.xlsx, 376Dependentdropdown.xlsx, 478–480Dget.xlsx, 435Diagonal.xlsx, 237Diner.xlsx, 642Discretesim.xlsx, 909Distinctcounttemp.xlsx, 547–550Dividebyprice.xlsx, 145Dowdata.xlsx, 642Dow.xlsx, 537, 664, 695Draftlottery.xlsx, 393Drugfore.xlsx, 792Drug.xlsx, 1028
Z01_Winston_Index_p1067-1138.indd 1084 28/10/21 8:12 PM

files
1085
Duedates.xlsx, 278DVDsales.xlsx, 237Dynamiclabelstemp.xlsx, 622Dynamicrange.xlsx, 232–235Eastwest.xlsx, 12East.xlsx, 575Electiondata.xlsx, 673Electoralvotes.xlsx, 657Emailproblem.xlsx, 69Employees.xlsx, 37EOMONTHEDATE.xlsx, 81–82Eoq.xlsx, 975Errortrap.xlsx, 134, 173Errortypes.xlsx, 136Excelfinfunctions.xlsx, 102
FV worksheet, 104PMT worksheet, 105PV worksheet, 102Rate worksheet, 108
Exponentialdata.xlsx, 680Exponentialdist.xlsx, 779EyeColor.xlsx, 1028Faberu.xlsx, 550Fax.xlsx, 684Febcon.xlsx, 575Filledmaptemp.xlsx, 643Finearts.xlsx, 537Finmathsolver.xlsx, 848Fizzy.xlsx, 723Flashfill.xlsx, 62Flattentabletemp.xlsx, 327–328Footballdata.xlsx, 146FootballProblem8.xlsx, 49FormattingDDAnum.xlsx, 145Fourthavenuetemp.xlsx, 655Fractiondefective.xlsx, 279Galton.xlsx, 614Gamestop.xlsx, 540Gasprices507.xlsx, 287Geommean.xlsx, 388Globalwarming2011.xlsx, 279, 280GNP.xlsx, 280Goals.xlsx, 664Golfdata.xlsx, 237Grades.xlsx, 36Grocery.xlsx, 723Hardware.xlsx, 37Heighttemp.xlsx, 1025Hidden.xlsx, 596
Highlightcells.xlsx, 255–257Historicalinvest2009.xlsx, 376Historicalinvest.xlsx, 279, 394, 459Hockey.xlsx, 1028Hospitaltemp.xlsx, 1024–1025Hospital.xlsx, 537House2.xlsx, 861Housepricedata.xlsx, 438Hr.xlsx, 35Hypergeom.dist.xlsx, 773–774Hyperlinkstemp.xlsx, 167IDprice.xlsx, 69IFSfinal.xlsx, 138Ifstatement.xlsx, 124, 126, 130Incomedata.xlsx, 394Incomefrequency.xlsx, 69INDEX.xlsx, 39Index.xlsx, 49Indirectconsolidate.xlsx, 244Indirectinsertrow.xlsx, 242Interactions.xlsx
Data worksheet, 720Nonlinearity worksheet, 719
IRR.xlsx, 96MIRR worksheet, 97XIRR worksheet, 96
ISFORMULA_TEXT.xlsx, 172Jancon.xlsx, 575Jordan.xlsx, 394Kingslineups.docx, 320Lagged.xlsx, 236Lambdahelper.xlsx, 1056–1060Last year.xlsx, 21LastSunday.xlsx, 80Latitude.xlsx, 482Lawdata.xlsx, 951Lefthandlookup.xlsx, 227Lemonadegs.xlsx, 198Lemonade.xlsx, 184Lenora.xlsx, 56LETandLAMBDA.xlsx, 1050Lillydata.xlsx, 459Lineupdata.xlsx, 69Lineupsch27temp.docx, 315–320Lineupsch27.txt, 316Lognormal.xlsx, 797Lookupmultiplecolumns.xlsx, 36Lookuptwocolumns.xlsx, 69Lookup.xlsx, 27, 29
Z01_Winston_Index_p1067-1138.indd 1085 28/10/21 8:12 PM
files
1086
Machinedates.xlsx, 83Makeup2007.xlsx, 218–219, 222, 223Makeuparray.xlsx, 448Makeupdb.xlsx, 435, 438, 459, 537Makeupfiltertemp.xlsx, 412, 428Makeupsortfont.xlsx, 409Makeupsorttemp.xlsx
Across worksheet, 407Case worksheet, 408Dates worksheet, 403Makeup worksheet, 401
Makeupsubtotals.xlsx, 577Makeuptimeline.xlsx, 525Marketbasketdata.xlsx, 249Matchex.xlsx, 44Matchlist.xlsx, 146Matchthemax.xlsx, 49Matchthesecond.xlsx, 215Matchtype1.xlsx, 49Matradingrule.xlsx, 127, 128, 236Mavsscores.xlsx, 615Mavs.xlsx, 163Maxifsminifs.xlsx, 221Mcdonalds.xlsx, 537Meanvariance.xlsx, 764Medians.xlsx, 452MIRR.xlsx, 97–98Modefunctions.xlsx, 380Monday.xlsx, 81Monthlysales.xlsx, 615Monthtomonth.xlsx, 526, 528Moore.xlsx, 680Mostrecent.xlsx, 232Moviedata.xlsx, 69Movienumbers.xlsx, 69Movies.xlsx, 229–231Mrcostest.xlsx, 697–698Multipleworksheetstemp.xlsx, 169Myexample.xlsx, 562Names.xlsx, 278Nancybonds.xlsx, 145Nba01_02.xlsx, 857Nba02_03.xlsx, 857Nbadvl.xlsx, 474NBAfinal.xlsx, 329–331Nbamiles.xlsx, 899NBAplayers.xlsx, 37Nbasalaries.xlsx, 279NBAtemp.xlsx, 329–331
NBA.xlsx, 215, 222Negbinom.dist.xlsx, 774–775Nfl01.xlsx, 856NFL2012data.xlsx, 857NFLinfo.xlsx, 725Nflpoints.xlsx, 376Nflwinslosses.xlsx, 662Nikedata.xlsx, 299Nlp.xlsx
Nonlinear Pricing Examples worksheet, 1012Nonlinear Pricing Examples worksheet i, 1011–1012OnePrice worksheet, 1013Two-Part Tariff worksheet, 1014
Noncontigtemp.xlsx, 13Normalexamples.xlsx, 783, 786NPVauditscenario.xlsx, 203NPVspinnerstemp.xlsx, 303Numberdv.xlsx, 476Numbers.xlsx, 215, 223Nursejackiedata.xlsx, 894Offsetcost.xlsx, 228–229Offsetexample.xlsx, 226–227Oldfaithful.xlsx, 673Onewayanovatemp.xlsx, 728, 730Optionbuttons.xlsx, 311P23_2.xlsx, 248P23_3.xlsx, 249Paretotemp.xls, 374Pastespecial.xlsx, 157
Paste Special Divide Before worksheet, 160–161Paste Special Transpose worksheet, 159Paste Special Value worksheet, 157
Payback.xlsx, 47Paymentgs.xlsx, 199Phoneloyalty.xlsx, 969Pinevalley.xlsx, 36Pivotwithslicers.xlsx, 559Poisson.xlsx, 778Poker.xlsx, 939Powerpivotexample1.xlsx, 561PQappendtemp.xlsx, 338Pqappend.xlsx, 339PQdatatypestemp.xlsx, 359PQPROBLEM5DATA.XLSX, 340PQPROBLEM6DATA.XLSX, 341PQPROBLEM7DATA.XLSX, 341PQPROBLM4DATA.XLSX, 340Priceads.xlsx, 724Problem5_9.xlsx, 50
Z01_Winston_Index_p1067-1138.indd 1086 28/10/21 8:12 PM

files
1087
Problem6data.xlsx, 894Problem7data.xlsx, 376, 680Problem8data.xlsx, 376Problem9data.xlsx, 376, 844Problem10data.xlsx, 790Problem11data.xlsx, 299Problem12data.xlsx, 299Problem13data.xlsx, 299, 673, 725Problem15data.xsls, 726Problem16data.xlsx, 69, 726Problem17datat.xlsx, 394Problem17data.xlsx, 69Problem18data.xlsx, 395Problem19data.xlsx, 223Problem20data.xlsx, 223, 539Problem21data.xlsx, 223, 539Problem22data.xlsx, 69, 223, 539Problem23_24data.xlsx, 223Problem23data.xlsx, 69, 539Problem24data.xlsx, 69, 539Problem25data.xlsx, 69, 540Problem26data.xlsx, 69, 540Problem27data.xlsx, 69, 280, 540Problem28data.xlsx, 146, 281Problem30data.xlsx, 281Problem32data.xlsx, 281Problem33data.xlsx, 281Problem34data.xlsx, 146Problem35data.xlsx, 147, 281Problem36data.xlsx, 281, 471Problem37data.xlsx, 147Problem38data.xlsx, 147Problem40data.xlsx, 147Problem41data.xlsx, 147Problem42.xlsx, 147Problem43data.xlsx, 147Prodmix.xlsx, 820
Feasible Solution worksheet, 813No Feasible Solution worksheet, 820–821Set Values Do Not Converge worksheet, 821
Productlookup.xlsx, 45, 299Productmix.xlsx, 182Productpaste.xlsx, 163Productsalespaste.xlsx, 163Proforma.xlsx, 130Ptableexample.xlsx, 512Ptablepartsdata.xlsx, 538Ptcustomerstemp.xlsx, 1047Ptcustomers.xlsx, 495
Qb2013.xlsx, 37Qd.xlsx, 1017Quarterlygnpdata.xlsx, 69Quarterly.xlsx, 867Queuingtemplate.xlsx, 989–990Randarray.xlsx, 916Randdemo.xlsx, 908Randy.xlsx, 629Ratioma.xlsx, 750Razorsandblades.xlsx, 999Redbold.xlsm, 1034Reorderpoint_backorder.xlsx, 980Reorderpoint_lostsales.xlsx, 982Repeatedhisto.xlsx, 60Returnstemp.xlsx, 17Reversed.xlsx, 237Reversenames.xlsx, 69Rock.xlsx, 210, 214Rowsnamed.xlsx, 22Salaries.xlsx, 460Salesdata.xlsx, 49, 181Salesfixfinal.xlsx, 331–334Salesfixtemp.xlsx, 331–334Salesstripping.xlsx, 58Salessummary.xlsx, 181Sales.xlsx, 438Sandp.xlsx, 278Satissuper.xlsx, 278Scatter.xlsx, 606Secondaryaxis.xlsx, 593Sequence.xlsx, 469Servicelevelreorder.xlsx, 983Shading.xlsx, 280Sheetnames.xlsx, 18–19Showbiz.xlsx, 69Singers.xlsx, 298Sortandsortby.xlsx, 465Sortday.xlsx, 409Sortedgraph.xlsx, 627Sorticons.xlsx, 409spaces.xlsx, 247Sparklines.xlsx, 659
Column Sparkline worksheet, 662High Low worksheet, 661
Special Tricks.xlsx, 67Spiderplottemplate.xlsx, 1063Sportinglife.xlsx, 614Sports.xlsx, 614StartFixMinutestemp.xlsx, 1045
Z01_Winston_Index_p1067-1138.indd 1087 28/10/21 8:12 PM
1088
files
Statedv.xlsx, 477Stateincome.xlsx, 657States.xlsx, 16, 17, 552Staticdate.xlsx, 79Station.xlsx, 509Stdevif.xlsx, 453Stockcorrel.xlsx, 691Stockhistoryfinal.xlsx
Bitcoin worksheet, 802Currency worksheet, 803Stocks worksheet, 800
Stockpricestemp.xlsx, 1022–1024Stock.xlsx, 373, 376, 383, 393Storesales.txt, 552Sumifrows.xlsx, 222Sumindirect.xlsx, 240Superbowlspreads.xlsx, 787–788Suppliers.xlsx, 314Switchfinal.xlsx, 141Tableexampletemp.xlsx, 283–284Tableexample.xlsx, 298Tablemakeuptemp.xlsx, 289, 299Tablemakeuptotals.xlsx, 291, 292Tablepie.xlsx, 299Tablestructure.xlsx, 294Tablexnpvdata.xlsx, 299Teachers.xlsx, 1028Teams.xlsx, 376Temperature2020.xlsx, 253Test.xlsx, 278Textandnumbers.xlsx, 34Textfunctions.xlsx, 52Textjoinfinal.xlsx, 65Textstylesdata.xlsx, 69Threetimes.xlsx, 280Timeseries.xlsx, 603Time.xlsx, 151Top5.xlsx, 280Top20.xlsx, 657Toysrusformat.xlsx, 278Toysrus.xlsx, 222Transactiondata.xlsx, 237Transport.xlsx, 831–832Traveldatatemp.xlsx, 505Treemapbookstoretemp.xlsx, 636Trendandseasonality.xlsx, 1028Trimmean.xlsx, 386, 388Unemployment.xlsx, 376Unique.xlsx, 462
USC.xlsx, 794USfilledmapstemp.xlsx, 646Valentine.xlsx, 911, 914Varianceanalysis.xlsx, 278Verizondata.xlsx, 236Verizon.xlsx, 237Volatility.xlsx, 965Wagestemp.xlsx, 1–2Walmartdata.xlsx, 752Walmartrev.xlsx, 136Waterfallpandltemp.xlsx, 633Weekendformatting.xlsx, 278WEEKNUM.xlsx, 80Weibullest.xlsx, 901Weirddata.xlsx, 69West.xlsx, 571, 575Worksheetnames.xlsm, 245Worldball.xlsx, 857XLOOKUP.xlsx, 31Yeartodate.xlsx, 237
Fill button, 950filled maps
creating, 643–647labeling, 645–646
Filledmaptemp.xlsx file, 643FILTER function, 466–468filtering
dynamic array functions for, 466–468with Excel AutoFilter feature
examples of, 413–428overview of, 411–413problems for, 428
PivotTable fields, 495–498with Quick Access toolbar, 425–427tables, 289–292
Filters option (Layer pane), 650Final Four basketball, probability of team win in, 942–944Finalregression worksheet, 721financial functions
CUMIPMT, 107CUMPRINC, 107DDB, 110FV, 103–105, 111–112interest rate
calculating with RATE, 108compound interest, 111–112cumulative interest payments. See cumulative
interest payments (CUMIPMT)IPMT, 106–107
Z01_Winston_Index_p1067-1138.indd 1088 28/10/21 8:12 PM
Format Trendline pane
1089
IRR, 94MIRR, 97–98NPER, 108–109NPV. See NPV (net present value)PMT, 101–107PPMT, 106–107problems for, 112–115PV, 101–105RATE, 108SLN, 109–110SYD, 109–110XIRR, 93–94XNPV, 88–90
financial planning, with Solver, 845–851overview of, 845PMT function, verifying accuracy of, 845retirement savings, determining, 848–849
Find Errors worksheet, 458FIND function, 53, 57–58, 59, 61, 482Finearts.xlsx file, 537Finmathsolver.xlsx file, 848first day of month
returning date of next Monday, 81returning first/last day of month, 81–82
First Point option (Sparkline Tools Design), 661five-card draw poker, probability of three of a kind in,
939–942fixed-width columns, 315, 317–319Fizzy.xlsx file, 723Flash Fill, 62–64, 65Flashfill.xlsx file, 62flat files, creating tables from, 328–329Flat Map button, 654flattening Excel tables, 327–328Flattentabletemp.xlsx file, 327–328font color, sorting on, 401–402Foods data type, 352Footballdata.xlsx file, 146FootballProblem8.xlsx file, 49Ford, Gerald, 712FORECAST function, 866Forecast Sheet tool, 863–866FORECAST.ETS function, 866forecasting. See also multiple regression analysis
bias in, 792–793evaluating, 792–793forecasting future values of time series, Winters
method ofequations for, 860–861
problems for, 867making probability statements from, 791–794with one-way ANOVA, 731in presence of special events, 869–876
factors influencing customer traffic, 869–872forecast accuracy, 872–876overview of, 869problems for, 876random errors in, 876
ratio-to-moving-average forecasting method for, 749–752
seasonal indexesinterpretation of, 749–750Toys “R” Us example, 715–718Walmart example, 749–750
twith wo-way analysis of variance (ANOVA), 740–742with two-way ANOVA, 736–737Winters method of
Forecast Sheet tool, 863–866initialization of, 861level of series, 860–861overview of, 859seasonal index for current month, 860–861smoothing constants, estimation of, 862–863time series characteristics, 859–860trend of series, 860–861
Foreign columnCreate Relationships dialog box, 544Data Model, 544
form controlsCheck Box, 307Combo Box, 313Format Control, 304–306, 313Option Button, 307overview of, 301problems for, 313–314Scrollbar, 307Spin Button, 302–307
Format Axis dialog box, 369, 612–613Format Cells dialog box, 67–68, 74, 152, 254, 268, 491,
559, 961, 1034, 1042, 1044Format Control dialog box, 304–306, 307–311, 313, 625Format Data Labels pane, 599, 601, 602, 604, 607, 609,
646Format Data Series pane, 589, 602, 622, 637, 645Format Painter feature, 277Format Selection button, 669Format Trendline pane, 666–667
Exponential command, 675–678
Z01_Winston_Index_p1067-1138.indd 1089 28/10/21 8:12 PM
1090
Format Trendline pane
Moving Average option, 746Number section, 669Polynomial option, 1006Power command, 684
Format Values Where This Formula Is True option, 873formatting
conditional. See conditional formattingdates, 74–76excess cell formatting, 182PivotTable fields, 491–492times, 150, 151
formatting, conditional. See conditional formattingFormattingDDAnum.xlsx file, 145Formula Auditing group, 172
Error Checking, 173–174multiple worksheets and, 178–179Remove Arrows, 175, 177Show Formulas, 172Trace Dependents, 174–177Trace Precedents, 174–175, 177–178Watch Window, 174
formulasapplying named ranges to, 20cost paid to supplier, 2–5customer estimation, 5–6locking/unlocking, 961–963order of operations in, 6–7properties and data types in
animals, 353–354astronomical objects, 351chemical compounds and elements, 351–352corporations, 349–350exchange rates, 350flowers and trees, 353–354geographic locations, 347–348HR data, 359–361movies and music, 353–354nutritional characteristics, 352people, 356problems for, 362universities, 351weather data, 357–359
weekly wages, 1–2Formulas menu commands
Create from Selection, 20Defined Names, 20Enable Iterative Calculation option, 118–120Evaluate Formula, 49
FORMULATEXT function, 2, 172
four-period moving average, 745–746Fourthavenuetemp.xlsx file, 655Fractiondefective.xlsx file, 279free cash flows (FCFs), 130Freeze First Column command (Freeze Panes menu), 128Freeze Panes, 127–128, 306–307Freeze Top Row command (Freeze Panes menu), 128FREQUENCY function, 444–445From Web dialog box, 323Fuller, Dennis, 1BETWEEN function, 1053–1054Function Wizard, 135functions, 18, 194, 272, 482, 679–680, 687, 1054–1055
& (ampersand), 54ABVERA, 922AGGREGATE, 135–136AutoComplete capabilities for, 18AutoSum, 3AVERAGE, 2, 212, 751, 788, 793, 855, 861, 862, 871–872,
901, 902, 905, 913, 939, 950AVERAGEIF, 751AVERAGEIFS, 218, 220–221BETA.DIST, 901BETWEEN, 1053–1054BINOM.DIST
examples of, 771–772overview of, 770
BINOM.DIST.RANGEexamples of, 771–772overview of, 770
BINOM.INV, 773, 922CALCULATE, 567–570CELL, 247CHAR, 54, 61CHOOSE, 139–140CLEAN, 55, 61CONCATENATE, 54, 57CORREL, 692COUNT, 574
examples of, 214syntax of, 210
COUNTAexamples of, 214overview of, 210
COUNTBLANKexamples of, 214overview of, 210
COUNTIF, 482, 891, 909, 928, 941, 943examples of, 211–213
Z01_Winston_Index_p1067-1138.indd 1090 28/10/21 8:12 PM
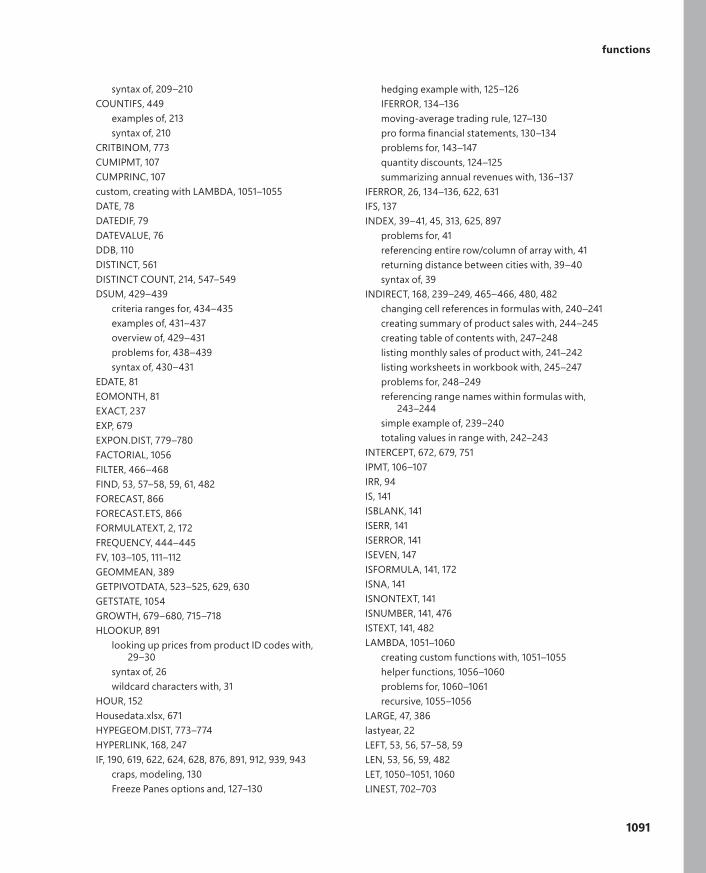
functions
1091
syntax of, 209–210COUNTIFS, 449
examples of, 213syntax of, 210
CRITBINOM, 773CUMIPMT, 107CUMPRINC, 107custom, creating with LAMBDA, 1051–1055DATE, 78DATEDIF, 79DATEVALUE, 76DDB, 110DISTINCT, 561DISTINCT COUNT, 214, 547–549DSUM, 429–439
criteria ranges for, 434–435examples of, 431–437overview of, 429–431problems for, 438–439syntax of, 430–431
EDATE, 81EOMONTH, 81EXACT, 237EXP, 679EXPON.DIST, 779–780FACTORIAL, 1056FILTER, 466–468FIND, 53, 57–58, 59, 61, 482FORECAST, 866FORECAST.ETS, 866FORMULATEXT, 2, 172FREQUENCY, 444–445FV, 103–105, 111–112GEOMMEAN, 389GETPIVOTDATA, 523–525, 629, 630GETSTATE, 1054GROWTH, 679–680, 715–718HLOOKUP, 891
looking up prices from product ID codes with, 29–30
syntax of, 26wildcard characters with, 31
HOUR, 152Housedata.xlsx, 671HYPEGEOM.DIST, 773–774HYPERLINK, 168, 247IF, 190, 619, 622, 624, 628, 876, 891, 912, 939, 943
craps, modeling, 130Freeze Panes options and, 127–130
hedging example with, 125–126IFERROR, 134–136moving-average trading rule, 127–130pro forma financial statements, 130–134problems for, 143–147quantity discounts, 124–125summarizing annual revenues with, 136–137
IFERROR, 26, 134–136, 622, 631IFS, 137INDEX, 39–41, 45, 313, 625, 897
problems for, 41referencing entire row/column of array with, 41returning distance between cities with, 39–40syntax of, 39
INDIRECT, 168, 239–249, 465–466, 480, 482changing cell references in formulas with, 240–241creating summary of product sales with, 244–245creating table of contents with, 247–248listing monthly sales of product with, 241–242listing worksheets in workbook with, 245–247problems for, 248–249referencing range names within formulas with,
243–244simple example of, 239–240totaling values in range with, 242–243
INTERCEPT, 672, 679, 751IPMT, 106–107IRR, 94IS, 141ISBLANK, 141ISERR, 141ISERROR, 141ISEVEN, 147ISFORMULA, 141, 172ISNA, 141ISNONTEXT, 141ISNUMBER, 141, 476ISTEXT, 141, 482LAMBDA, 1051–1060
creating custom functions with, 1051–1055helper functions, 1056–1060problems for, 1060–1061recursive, 1055–1056
LARGE, 47, 386lastyear, 22LEFT, 53, 56, 57–58, 59LEN, 53, 56, 59, 482LET, 1050–1051, 1060LINEST, 702–703
Z01_Winston_Index_p1067-1138.indd 1091 28/10/21 8:12 PM
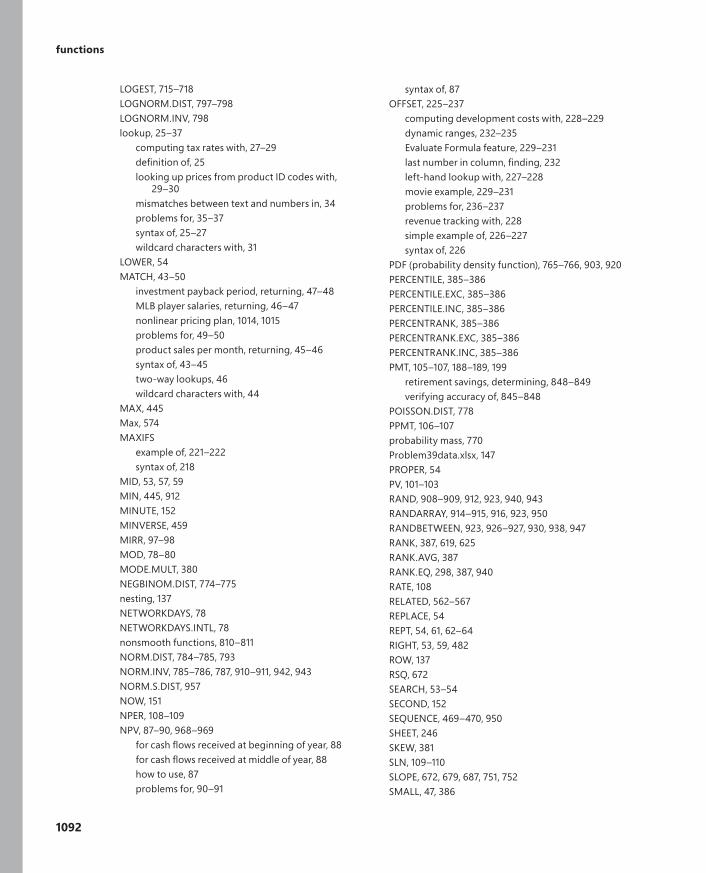
functions
1092
LOGEST, 715–718LOGNORM.DIST, 797–798LOGNORM.INV, 798lookup, 25–37
computing tax rates with, 27–29definition of, 25looking up prices from product ID codes with,
29–30mismatches between text and numbers in, 34problems for, 35–37syntax of, 25–27wildcard characters with, 31
LOWER, 54MATCH, 43–50
investment payback period, returning, 47–48MLB player salaries, returning, 46–47nonlinear pricing plan, 1014, 1015problems for, 49–50product sales per month, returning, 45–46syntax of, 43–45two-way lookups, 46wildcard characters with, 44
MAX, 445Max, 574MAXIFS
example of, 221–222syntax of, 218
MID, 53, 57, 59MIN, 445, 912MINUTE, 152MINVERSE, 459MIRR, 97–98MOD, 78–80MODE.MULT, 380NEGBINOM.DIST, 774–775nesting, 137NETWORKDAYS, 78NETWORKDAYS.INTL, 78nonsmooth functions, 810–811NORM.DIST, 784–785, 793NORM.INV, 785–786, 787, 910–911, 942, 943NORM.S.DIST, 957NOW, 151NPER, 108–109NPV, 87–90, 968–969
for cash flows received at beginning of year, 88for cash flows received at middle of year, 88how to use, 87problems for, 90–91
syntax of, 87OFFSET, 225–237
computing development costs with, 228–229dynamic ranges, 232–235Evaluate Formula feature, 229–231last number in column, finding, 232left-hand lookup with, 227–228movie example, 229–231problems for, 236–237revenue tracking with, 228simple example of, 226–227syntax of, 226
PDF (probability density function), 765–766, 903, 920PERCENTILE, 385–386PERCENTILE.EXC, 385–386PERCENTILE.INC, 385–386PERCENTRANK, 385–386PERCENTRANK.EXC, 385–386PERCENTRANK.INC, 385–386PMT, 105–107, 188–189, 199
retirement savings, determining, 848–849verifying accuracy of, 845–848
POISSON.DIST, 778PPMT, 106–107probability mass, 770Problem39data.xlsx, 147PROPER, 54PV, 101–103RAND, 908–909, 912, 923, 940, 943RANDARRAY, 914–915, 916, 923, 950RANDBETWEEN, 923, 926–927, 930, 938, 947RANK, 387, 619, 625RANK.AVG, 387RANK.EQ, 298, 387, 940RATE, 108RELATED, 562–567REPLACE, 54REPT, 54, 61, 62–64RIGHT, 53, 59, 482ROW, 137RSQ, 672SEARCH, 53–54SECOND, 152SEQUENCE, 469–470, 950SHEET, 246SKEW, 381SLN, 109–110SLOPE, 672, 679, 687, 751, 752SMALL, 47, 386
Z01_Winston_Index_p1067-1138.indd 1092 28/10/21 8:12 PM
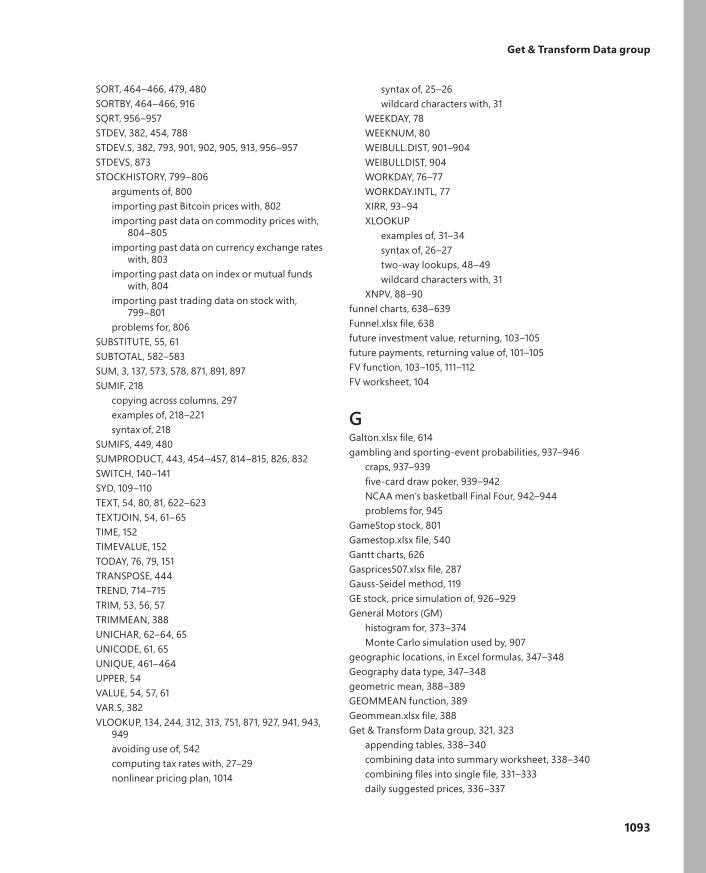
Get & Transform Data group
1093
SORT, 464–466, 479, 480SORTBY, 464–466, 916SQRT, 956–957STDEV, 382, 454, 788STDEV.S, 382, 793, 901, 902, 905, 913, 956–957STDEVS, 873STOCKHISTORY, 799–806
arguments of, 800importing past Bitcoin prices with, 802importing past data on commodity prices with,
804–805importing past data on currency exchange rates
with, 803importing past data on index or mutual funds
with, 804importing past trading data on stock with,
799–801problems for, 806
SUBSTITUTE, 55, 61SUBTOTAL, 582–583SUM, 3, 137, 573, 578, 871, 891, 897SUMIF, 218
copying across columns, 297examples of, 218–221syntax of, 218
SUMIFS, 449, 480SUMPRODUCT, 443, 454–457, 814–815, 826, 832SWITCH, 140–141SYD, 109–110TEXT, 54, 80, 81, 622–623TEXTJOIN, 54, 61–65TIME, 152TIMEVALUE, 152TODAY, 76, 79, 151TRANSPOSE, 444TREND, 714–715TRIM, 53, 56, 57TRIMMEAN, 388UNICHAR, 62–64, 65UNICODE, 61, 65UNIQUE, 461–464UPPER, 54VALUE, 54, 57, 61VAR.S, 382VLOOKUP, 134, 244, 312, 313, 751, 871, 927, 941, 943,
949avoiding use of, 542computing tax rates with, 27–29nonlinear pricing plan, 1014
syntax of, 25–26wildcard characters with, 31
WEEKDAY, 78WEEKNUM, 80WEIBULL.DIST, 901–904WEIBULLDIST, 904WORKDAY, 76–77WORKDAY.INTL, 77XIRR, 93–94XLOOKUP
examples of, 31–34syntax of, 26–27two-way lookups, 48–49wildcard characters with, 31
XNPV, 88–90funnel charts, 638–639Funnel.xlsx file, 638future investment value, returning, 103–105future payments, returning value of, 101–105FV function, 103–105, 111–112FV worksheet, 104
GGalton.xlsx file, 614gambling and sporting-event probabilities, 937–946
craps, 937–939five-card draw poker, 939–942NCAA men’s basketball Final Four, 942–944problems for, 945
GameStop stock, 801Gamestop.xlsx file, 540Gantt charts, 626Gasprices507.xlsx file, 287Gauss-Seidel method, 119GE stock, price simulation of, 926–929General Motors (GM)
histogram for, 373–374Monte Carlo simulation used by, 907
geographic locations, in Excel formulas, 347–348Geography data type, 347–348geometric mean, 388–389GEOMMEAN function, 389Geommean.xlsx file, 388Get & Transform Data group, 321, 323
appending tables, 338–340combining data into summary worksheet, 338–340combining files into single file, 331–333daily suggested prices, 336–337
Z01_Winston_Index_p1067-1138.indd 1093 28/10/21 8:12 PM
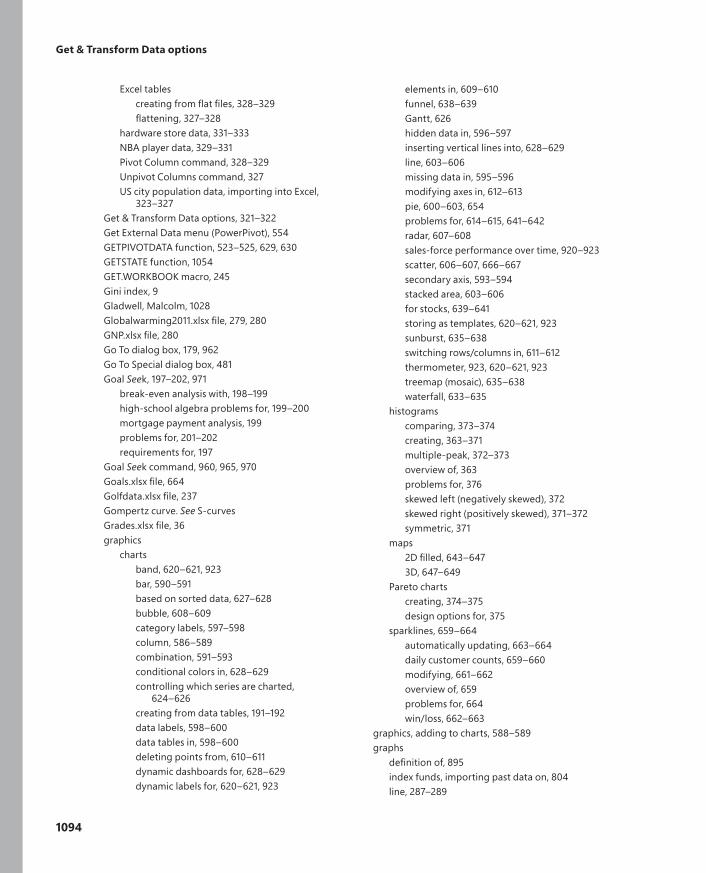
Get & Transform Data options
1094
Excel tablescreating from flat files, 328–329flattening, 327–328
hardware store data, 331–333NBA player data, 329–331Pivot Column command, 328–329Unpivot Columns command, 327US city population data, importing into Excel,
323–327Get & Transform Data options, 321–322Get External Data menu (PowerPivot), 554GETPIVOTDATA function, 523–525, 629, 630GETSTATE function, 1054GET.WORKBOOK macro, 245Gini index, 9Gladwell, Malcolm, 1028Globalwarming2011.xlsx file, 279, 280GNP.xlsx file, 280Go To dialog box, 179, 962Go To Special dialog box, 481Goal Seek, 197–202, 971
break-even analysis with, 198–199high-school algebra problems for, 199–200mortgage payment analysis, 199problems for, 201–202requirements for, 197
Goal Seek command, 960, 965, 970Goals.xlsx file, 664Golfdata.xlsx file, 237Gompertz curve. See S-curvesGrades.xlsx file, 36graphics
chartsband, 620–621, 923bar, 590–591based on sorted data, 627–628bubble, 608–609category labels, 597–598column, 586–589combination, 591–593conditional colors in, 628–629controlling which series are charted,
624–626creating from data tables, 191–192data labels, 598–600data tables in, 598–600deleting points from, 610–611dynamic dashboards for, 628–629dynamic labels for, 620–621, 923
elements in, 609–610funnel, 638–639Gantt, 626hidden data in, 596–597inserting vertical lines into, 628–629line, 603–606missing data in, 595–596modifying axes in, 612–613pie, 600–603, 654problems for, 614–615, 641–642radar, 607–608sales-force performance over time, 920–923scatter, 606–607, 666–667secondary axis, 593–594stacked area, 603–606for stocks, 639–641storing as templates, 620–621, 923sunburst, 635–638switching rows/columns in, 611–612thermometer, 923, 620–621, 923treemap (mosaic), 635–638waterfall, 633–635
histogramscomparing, 373–374creating, 363–371multiple-peak, 372–373overview of, 363problems for, 376skewed left (negatively skewed), 372skewed right (positively skewed), 371–372symmetric, 371
maps2D filled, 643–6473D, 647–649
Pareto chartscreating, 374–375design options for, 375
sparklines, 659–664automatically updating, 663–664daily customer counts, 659–660modifying, 661–662overview of, 659problems for, 664win/loss, 662–663
graphics, adding to charts, 588–589graphs
definition of, 895index funds, importing past data on, 804line, 287–289
Z01_Winston_Index_p1067-1138.indd 1094 28/10/21 8:12 PM
HYPERLINK function
1095
moving-average, 745–746greater than or equal to (>=) operator, 212greeting cards, Monte Carlo simulation of, 911–914GRG Nonlinear engine, 810Grocery.xlsx file, 723grouping PivotTable items, 518–519growth, exponential, 675–680
CAGR (compound annual growth rate), 675–678equation for, 675Exponential command, 675–678GROWTH function, 679–680modeling, 676–678overview of, 675predictions based on, 679–680problems for, 680S-curve, 678trend curve parameters for, 678–679
GROWTH function, 679–680, 715–718
HHall, Monty, 759hardware store data
combining into single file, 334–336importing and formatting, 331–334
Hardware.xlsx file, 37Harris, F.973health club case study, 5–6heat maps, 643. See also filled mapshedging, with IF function, 125–126Hedging worksheet, 126heights of fathers/sons, finding patterns in, 1025–1027Heighttemp.xlsx file, 1025Help On This Error option (Error Checking dialog box),
173helper functions, LAMBDA, 1056–1060
BYCOL, 1057BYROW, 1056–1057ISOMITTED, 1060MAKEARRAY, 1059–1060MAP, 1057–1058problems for, 1060–1061REDUCE, 1058SCAN, 1059–1060
Hidden and Empty Cell Settings dialog box, 595, 597hidden data, in charts, 596–597Hidden.xlsx file, 596Hide Columns command, 189Hide Rows command, 189
hidingAssumption cells (Scenario Manager), 207comments, 944
High Low worksheet, 661High Point option (Sparkline Tools Design), 661Highlightcells.xlsx file, 255–257Highlights Cells conditional formatting, 252, 255–257High-Low-Close chart option, 640high-school algebra problems for, Goal Seek command
for, 199–200Histogram dialog box, 365histograms
of annual stock returns, 1024comparing, 373–374creating, 363–371of father/son heights, 1025–1026multiple-peak, 372–373overview of, 363problems for, 376skewed left (negatively skewed), 372skewed right (positively skewed), 371–372symmetric, 371
historical volatility of stock, 956–957Historicalinvest2009.xlsx file, 376Historicalinvest.xlsx file, 279, 394, 459HLOOKUP function, 891
looking up prices from product ID codes with, 29–30syntax of, 26wildcard characters with, 31
Hockey.xlsx file, 1028holiday dates, excluding, 77Holt, Charles, 859hospital data, patterns in, 1024–1025Hospitaltemp.xlsx file, 1024–1025Hospital.xlsx file, 537hour, extracting from time, 152HOUR function, 152hourly wages, computing, 442–444House2.xlsx file, 861Housedata.xlsx file, 671Housepricedata.xlsx file, 438HR data, in Excel formulas, 359–361Hr.xlsx file, 35HYPEGEOM.DIST function, 773–774Hypergeom.dist.xlsx file, 773–774hypergeometric random variables
binomial, 775–776definition of, 773–774
HYPERLINK function, 168, 247
Z01_Winston_Index_p1067-1138.indd 1095 28/10/21 8:12 PM
hyperlinks
1096
hyperlinks, 167–169, 181Hyperlinkstemp.xlsx file, 167
IIcon Sets, 253, 263–266, 402–403IDprice.xlsx file, 69If 3 Then 4 worksheet, 840–841IF function, 190, 619, 622, 624, 628, 876, 891, 912, 939, 943
craps, modeling, 130Freeze Panes options and, 127–130hedging example with, 125–126IFERROR, 134–136moving-average trading rule, 127–130nesting, 137overview of, 123–124pro forma financial statements, 130–134problems for, 143–147quantity discounts, 124–125summarizing annual revenues with, 136–137
if_not_found argument (XLOOKUP function), 26IFERROR function, 26, 134–136, 194, 622, 631IFS function, 137IFSfinal.xlsx file, 138Ifstatement.xlsx file, 130
Hedging worksheet, 126Quantity Discount worksheet, 124
Ignore Blank check box (Data Validation dialog box), 474, 475, 480
Ignore Error option (Error Checking dialog box), 173Ignore Integer Constraints option (Solver), 898implied volatility, 796, 960Import Data dialog box, 338, 339importing data
appending tables, 338–340Bitcoin prices, 802combining data into summary worksheet, 338–340combining into single file, 331–333daily suggested prices, 336–337Excel tables
creating from flat files, 328–329flattening, 327–328
Get & Transform Data options, 321–322hardware store data, 331–333NBA player data, 329–331past data
on commodity prices, 804–805on currency exchange rates, 803on index or mutual funds, 804
on stock, 799–801Power Query Editor, 322from text files, 315–320
problems for, 320Text Import Wizard, 315–320
US city population data, 323–327Include This Many Sheets option, 166income, computing tax rates based on, 27–29Incomedata.xlsx file, 394Incomefrequency.xlsx file, 69independent events, 755–756independent random variables, 766independent variables, 665–666INDEX function, 39–41, 45, 313, 625, 897
problems for, 41referencing entire row/column of array with, 41returning distance between cities with, 39–40syntax of, 39
indexes, seasonalin forecasting of future product sales, 750–752interpretation of, 749–750Toys “R” Us example, 715–718Walmart example, 749–750
INDEX.xlsx file, 39, 49Indiana Pacers, minutes played by lineup, 1045–1046INDIRECT function, 168, 239–249, 465–466, 480, 482
changing cell references in formulas with, 240–241creating summary of product sales with, 244–245creating table of contents with, 247–248listing monthly sales of product with, 241–242listing worksheets in workbook with, 245–247problems for, 248–249referencing range names within formulas with,
243–244simple example of, 239–240totaling values in range with, 242–243
Indirectconsolidate.xlsx file, 244Indirectinsertrow.xlsx file, 242inferences, resampling, 947–951initialization, of Winters method, 861Input Message tab (Data Validation dialog box), 475Input Y Range (Regression dialog box), 712Inquire add-in, 179–182
analyzing precedents/dependents with, 182analyzing workbook structure with, 181analyzing worksheet/workbook relationships with, 181cleaning excess cell formatting with, 182comparing workbooks with, 180installing, 179–180
Z01_Winston_Index_p1067-1138.indd 1096 28/10/21 8:12 PM
IRR function
1097
Insert Calculated Field dialog box, 516, 522Insert Calculated Item dialog box, 521Insert Chart dialog box, 498, 621Insert Column or Bar Chart button, 586, 587, 588, 591,
620, 621, 628, 629Insert Combo Chart button, 593Insert Function dialog box, 560Insert Hyperlink dialog box, 167Insert Line or Area Chart button, 603, 605Insert Pictures dialog box, 588Insert Pie or Doughnut Chart button, 601, 602Insert PivotTable button, 1021Insert Scatter (X,Y) or Bubble Chart button, 191, 606, 608,
623, 626, 631, 632, 667, 676, 746, 995, 1006Insert Slicers dialog box, 500, 516Insert tab
Charts, 644Charts section, 191, 586, 593, 603, 604, 608
Insert Waterfall, Funnel, Stock, Surface, or Radar Chart button, 608, 639
Insig worksheet, 730installing, Microsoft Excel Solver, 809insurance, portfolio, 126integer constraint, 827Integer Optimality settings, 842integer programming problems for, 841–842interactions, 719–726
definition of, 719–720problems for, 720–723testing for presence of, 720–723
Interactions.xlsx fileData worksheet, 720Nonlinearity worksheet, 719
interarrival time, 988intercept
of straight-line relationship predictions, 672of trendlines, 751
INTERCEPT function, 671, 672, 679, 687, 751interdependence of returns, 931interest rate
calculating with RATE, 108compound, 111–112computing with IPMT function, 106–107cumulative. See cumulative interest payments
(CUMIPMT)internal rate of return. See IRR (internal rate of return)inventory modeling
EOQ (economic order quantity) model, 973–978computer-manufacturing plant case study, 976–977
development of, 973economic order batch (EOB) size, 976–977electronics store case study, 973–975equations for, 973–975problems for, 977–978
with uncertain demand, 979–985lost-sales approach, 980–981overview of, 979–980service-level approach, 982–985
investment returns, uncertainty in, 925–935asset-allocation modeling, 929–934problems for, 934–935stock price simulation, 926–929
Investment Science (Luenberger), 953, 958, 963investments
beta, 951hedging example, 127–130option pricing, 953–966
abandonment options, 964–965American cash flows, 955American options, 953Black-Scholes formula, 798, 957–958, 959–961call/put options, 953, 955–956, 958–959in decision-making process, 963–964European cash flows, 954–955European options, 953exercise date/expiration date, 953historical volatility, 956–957parameters for, 955problems for, 965–966real options, 963–964volatility of stock, estimating, 956–957worksheet protection, 961–963
payback period, 47–48returning future value of, 103–105
IPMT (interest payment) function, 106–107IQs
computing probabilities for, 784–785PDF (probability density function) for, 782–784
IRR (internal rate of return), 93–99calculating with IRR function, 94definition of, 93–94for irregularly spaced cash flows, 96lack of, 94–95modified internal rate of return, 97–98multiple, 94–95problems for, 98–99scale of project and, 95–96
IRR function, 94
Z01_Winston_Index_p1067-1138.indd 1097 28/10/21 8:12 PM
irregularly spaced cash flows
1098
irregularly spaced cash flowsIRR (internal rate of return), 96NPV (net present value), 88–90
IRR.xlsx file, 96MIRR worksheet, 97XIRR worksheet, 96
IS functions, 141ISBLANK function, 141ISERR function, 141ISERROR function, 141ISEVEN function, 147ISFORMULA function, 141, 172ISFORMULA_TEXT.xlsx file, 172ISNA function, 141ISNONTEXT function, 141ISNUMBER function, 141, 476ISOMITTED helper function, 1060ISTEXT function, 141, 482items, PivotTable
calculated, 519–522grouping, 518–519
IVolatility.com, 796
JJancon.xlsx file, 575JDS Uniphase stock, 965Jelen, Bill, 1031Jordan.xlsx file, 394
KKeep Solver Solution option, 819keystroke combinations
Copy command, 2New Sheet, 166Paste command, 2static dates, 79worksheet navigation, 168
Kingslineups.docx, 320kurtosis, 381, 920
Llabels, chart, 598–600
2D filled maps, 645–646category labels, 597–598creating, 620–621, 923data labels, 598–600
dynamic labels for, 620–621, 923pie charts, 654trendlines, 669for two-way analysis of variance (ANOVA), 738
labor. See employeeslagged independent variables, 708Lagged.xlsx file, 236LAMBDA functions, 1051–1060
creating custom functions with, 1051–1055helper functions, 1056–1060
BYCOL, 1057BYROW, 1056–1057ISOMITTED, 1060MAKEARRAY, 1059–1060MAP, 1057–1058problems for, 1060–1061REDUCE, 1058SCAN, 1059
problems for, 1060–1061recursive, 1055–1056
Lambdahelper.xlsx file, 1056–1060LARGE function, 47, 386last day of month
returning date of next Monday, 81returning first/last day of month, 81–82
last number in column, finding, 232Last Point option (Sparkline Tools Design), 661last year’s revenues, named ranges for, 21–22Last year.xlsx file, 21LastSunday.xlsx file, 80lastyear function, 22Latitude.xlsx file, 482law of complements, 754law of total probability, 757Lawdata.xlsx file, 951layouts, PivotTable, 489–490leap years, 74learning curve, 683, 684–685least-squares line, 669–670LEFT function, 53, 56, 57–58, 59left-hand lookup, 227–228Lefthandlookup.xlsx file, 227lemonade store case study
break-even analysis, 198–199profit-maximizing price analysis, 184–188
Lemonadegs.xlsx file, 198Lemonade.xlsx file, 184LEN function, 53, 56, 59, 482
Z01_Winston_Index_p1067-1138.indd 1098 28/10/21 8:12 PM
lookup functions
1099
length of time worked by employees, calculating, 152–153, 312–313
Lenora.xlsx file, 56less-than sign (<), 782less-than-or-equal-to sign (<=), 782LET function, 1050–1051, 1060LETandLAMBDA.xlsx file, 1050Let’s Make a Deal problem, 759Lewent, Judy, 963lifetime of machine, modeling
problems for, 906Weibull random variable, 901–904WEIBULL.DIST function, 901–904
Lillydata.xlsx file, 459line, waiting in. See queueing theoryline charts, 603–606line graphs, creating from tables, 287–289Line option (Sparkline Tools Design), 661Linear command (Format Trendline menu), 666linear demand curve, 994linear models, 818linear pricing, 1011linear relationships, 643–652
accuracy of predictions, 671dependent variables, 665–666Format Trendline options, 666–667independent variables, 665–666intercept of, 672between monthly production and monthly operating
costs, 667–670monthly variation in plant-operating costs, 670–671problems for, 672–673scatter charts of data points, 666–667slope of, 672trend curve, 665
LINEST function, 702–703Lineupdata.xlsx file, 69Lineupsch27temp.docx, 315–320Lineupsch27.txt file, 316lipstick-pricing model, 1005–1010loans
computing, 105–107dependence on credit score, 115future payments, returning value of, 101–103interest rate, 108
calculating with RATE, 108compound, 111–112computing with IPMT function, 106–107
cumulative. See cumulative interest payments (CUMIPMT)
number of periods, determining, 108–109periodic payments, computing, 105–107principal payment, 106–107
locationfiltering by, 413–415sorting data by, 580
Location option (At Each Change In menu), 578Locations data type, 347–348Locked option, 962locking
formulas, 961–963rows, 4–5
Logarithmic command (Format Trendline menu), 666Logarithmic Polynomial (Format Trendline menu), 666LOGEST function, 715–718logistic curve. See S-curveslognormal random variables, 795–798, 956
definition of, 795LOGNORM.DIST function, 797–798LOGNORM.INV function, 798mean, 795modeling future prices of stock as, 796–797problems for, 798standard deviation, 795stock prices following, 796
Lognormal.xlsx file, 797LOGNORM.DIST function, 797–798LOGNORM.INV function, 798lookup functions, 25–37
computing day/date with, 83computing tax rates with, 27–29definition of, 25HLOOKUP
looking up prices from product ID codes with, 29–30
syntax of, 26wildcard characters with, 31
looking up prices from product ID codes with, 29–30mismatches between text and numbers in, 34problems for, 35–37VLOOKUP
computing tax rates with, 27–29syntax of, 25–26wildcard characters with, 31
wildcard characters with, 31XLOOKUP
examples of, 31–34
Z01_Winston_Index_p1067-1138.indd 1099 28/10/21 8:12 PM
1100
lookup functions
syntax of, 26–27two-way lookups, 48–49wildcard characters with, 31
lookup range argument (MATCH function), 43lookup value argument (MATCH function), 43lookup_array argument (XLOOKUP function), 26lookup_value argument
VLOOKUP function, 25XLOOKUP function, 26
Lookupmultiplecolumns.xlsx file, 36lookups, left-hand, 227–228Lookuptwocolumns.xlsx file, 69Lookup.xlsx file, 27, 29loops, circular references, 117–121
example of, 117–118pattern of, 117problems for, 120–121resolving, 118–120
lost-sales approach to reorder points, 980–981Low Point option (Sparkline Tools Design), 661LOWER function, 54lowercase, sorting on, 408–409Luenberger, David G.953, 958, 963
Mmachine life, modeling
problems for, 906Weibull random variable, 901–904WEIBULL.DIST function, 901–904
Machinedates.xlsx file, 83machinery, depreciation of, 109–110Macro dialog box, 1035macros
assigning to buttons, 1036editing, 1033GET.WORKBOOK, 245Namedaterelative, 1040placing on Quick Access Toolbar, 1037recording, 1031–1048
macros to format a selected range of cells, 1031–1048
minutes played by lineup, 1045–1046overview of, 1031–1048problems for, 1047–1048Record Macro dialog box, 1032–1033relative references, 1037–1040step-by-step process for, 1032–1033Top 10 Filter (Customer), 1047
weekly changes in sales, 1041–1044running, 1035–1037
Major League Baseball, 923lookup functions with, 31–34salary information, 46–47
Make Unconstrained Variables Non-Negative option, 817, 821, 827, 833, 849, 855
MAKEARRAY helper function, 1059–1060Makeup worksheet, 401Makeup2007.xlsx file, 218, 222, 223Makeuparray.xlsx file, 448Makeupdb.xlsx file, 435, 438, 459, 537Makeupfiltertemp.xlsx file, 412, 428Makeupsortfont.xlsx file, 409Makeupsorttemp.xlsx file
Across worksheet, 407Case worksheet, 408Dates worksheet, 403Makeup worksheet, 401
Makeupsubtotals.xlsx file, 577, 583Makeuptimeline.xlsx file, 525Manage Relationships dialog box, 543–544, 546–547Manage Rules, 253managing relationships, 546–547manufacturing, predicted monthly operating costs,
697–701Map Area menu, 645MAP helper function, 1057–1058Map Labels button, 645, 654, 656Map Projection menu, 645map tours, 649–650MAPE (mean absolute percentage error), 863Mapping Confidence report, 655maps
2D filledcreating, 643–647labeling, 645–646
3Danimating data in, 651–653creating, 647–649customizing, 650–651map tours, 649–650navigating, 649New York City’s Fourth Avenue subway line
example, 655–656pie charts with labels in, 654summarizing data with 2D chart, 654
heat maps, 643problems for, 657
Z01_Winston_Index_p1067-1138.indd 1100 28/10/21 8:12 PM
1101
Merton, Robert
Maps button, 644Marker Color option (Sparkline Tools Design), 661Markers option (Sparkline Tools Design), 661Marketbasketdata.xlsx file, 249Marketing Analytics (Winston), 678, 747, 993master workbooks, consolidating data into, 571–575MATCH function, 43–50
investment payback period, returning, 47–48MLB player salaries, returning, 46–47nonlinear pricing plan, 1014, 1015problems for, 49–50product sales per month, returning, 43–45syntax of, 43–45two-way lookups, 46wildcard characters with, 44
match type argument (MATCH function), 44match_mode argument (XLOOKUP function), 27Matchex.xlsx file, 44Matching Names worksheet, 446Matchlist.xlsx file, 146Matchthemax.xlsx file, 49Matchthesecond.xlsx file, 215Matchtype1.xlsx, 49materials, bill of. See BOM (bill of materials) reportsmathematical functions, 147
AVERAGEIFSexamples of, 220–221syntax of, 218
COUNT, 574examples of, 214syntax of, 210
COUNTAexamples of, 214overview of, 210
COUNTBLANKexamples of, 214overview of, 210
COUNTIF, 482, 891, 909, 928, 941, 943examples of, 211–213syntax of, 209–210
COUNTIFSexamples of, 213syntax of, 210
MAXIFSexample of, 221–222syntax of, 218
OFFSET, 225–237computing development costs with, 228–229dynamic ranges, 232–235
Evaluate Formula feature, 229–231last number in column, finding, 232left-hand lookup with, 227–228movie example, 229–231problems for, 236–237revenue tracking with, 228simple example of, 226–227syntax of, 226
order of operations in, 6–7with Paste Special command, 160–162SUMIF, 218
examples of, 218–221syntax of, 218
Matradingrule.xlsx files, 127, 128, 236matrices, correlations, 693matrix multiplication, 459Mavsscores.xlsx file, 615Mavs.xlsx file, 163MAX function, 445, 574MAXIFS function
example of, 221–222syntax of, 218
Maxifsminifs.xlsx file, 221Maximum Change setting (Goal Seek), 199Maximum Time Without Improvement option (Solver),
889maximum values
conditional, 218, 221–222validating, 473–475
Mcdonalds.xlsx file, 537mean, 382–384, 764–765, 910–911
95 percent confidence interval for, 914definition of, 379geometric, 388–389lognormal random variables, 795MAPE (mean absolute percentage error), 863normal random variables, 786regression toward, 694–695of service times, 988trimmed, 387–388
Meanvariance.xlsx file, 764Medians.xlsx file, 452Mercator, Gerardus, 645Mercator option (Map Projection menu), 645Merck, 963, 966Merge button (Scenario Manager dialog box), 207Merge Columns dialog box, 325Merton, Robert, 953. See also Black-Scholes
option-pricing formula
Z01_Winston_Index_p1067-1138.indd 1101 28/10/21 8:12 PM
messages
1102
messages“Set values do not converge”, 820–821“Solver could not find a feasible solution”, 820–821
microchip data, PivotTables for, 512–515Microsoft Excel 2019 VBA and Macros (Jelen and Syrstad),
1031Microsoft Excel Solver, 1007
capital budgeting, 837–844additional constraints in, 840–841binary and integer programming problems for,
841–842problems for, 842–844software project selection problem, 837–840
determining optimal product mix with, 813–823feasible solutions, 813–820infeasible solutions, 820problems for, 822–823“Set values do not converge” message, 821–822“Solver could not find a feasible solution”
message, 820–821Evolutionary Solver, 889–894
assigning employees to workgroups with, 890–892
highlighting employee ratings with, 892–893options for, 889–890problems for, 893–894tips for success, 889–894
financial planning with, 845–851overview of, 845PMT function, verifying accuracy of, 845–848problems for, 848–850
forecasting in presence of special events, 869–876factors influencing customer traffic, 869–872forecast accuracy, 872–876overview of, 869problems for, 876random errors in, 876
how it works, 811installing/activating, 809, 815, 839, 862, 889, 902, 933,
983, 1000, 1007–1008Integer Optimality settings, 842optimization with, 807–811
optimization models, 808–809sample optimization problems for, 807–808
problems for, 811, 827profit-maximizing nonlinear pricing plan, finding,
1014–1018rating sports teams with, 853–857
NFL point spreads, setting, 854–856nonlinear nature of, 856
overview of, 853–854problems for, 856–857
reorder points, determining, 983–985retirement savings, determining, 848–850running, 809–810, 872scheduling workforce with, 825–829solution engines, 810–811terminology for, 811tie-ins, pricing products with, 999–1003transportation or distribution problems for, 831–836
definition of, 831demand constraint, 832–833demand points, 831drug-distribution example, 831–834problems for, 834–836specifications for, 831supply constraints, 832supply points, 831
Winters methodequations for, 860–861Forecast Sheet tool, 863–866initialization of, 861level of series, 860–861overview of, 859problems for, 867seasonal index for current month, 860–861smoothing constants, estimation of, 862–863time series characteristics, 859–860trend of series, 860–861
Microsoft stock, modeling future price of, 796–797Microsoft Word documents, importing data from, 315–320
problems for, 320Text Import Wizard, 315–320
MID function, 53, 57, 59Miller option (Map Projection menu), 645MIN function, 445, 912minimum values
conditional, 218, 221–222validating, 473–475
minus (-) sign, in Scenario Manager dialog box, 207MINUTE function, 152minutes
extracting from times, 152played by lineup, macro for, 1045–1046
MINVERSE function, 459MIRR function, 97–98MIRR.xlsx file, 97–98missing data, in charts, 595–596MLB player salaries, returning, 46–47
Z01_Winston_Index_p1067-1138.indd 1102 28/10/21 8:12 PM
Movies data type
1103
MOD function, 78–80mode
definition of, 380MODE.SNGL function, 380
Modefunctions.xlsx file, 380Model worksheet, 684, 989modeling
exponential growth, 675–680CAGR (compound annual growth rate), 675–678equation for, 675example of, 676–678Exponential command, 675–678GROWTH function, 679–680overview of, 675predictions based on, 679–680problems for, 680S-curve, 678trend curve parameters for, 678–679
inventory. See inventory modelingmachine life
problems for, 906Weibull random variable, 901–904WEIBULL.DIST function, 901–904
nonlinearities and interactions, 719–726definitions of, 719–720problems for, 720–723testing for presence of, 720–723
optimization models, 808–809changing cells, 808–809, 815, 826, 831, 838problem constraints, 809, 815, 826, 831, 838target cells, 808, 815, 826, 831, 838
stock prices with lognormal random variables, 795–798definition of, 795LOGNORM.DIST function, 797–798LOGNORM.INV function, 798modeling future prices of stock as, 796–797problems for, 798stock prices following, 796
MODE.MULT function, 380modified internal rate of return (MIRR), 97–98Modify Button dialog box, 1037modifying sparklines, 661–662Monday.xlsx file, 81Monte Carlo simulation, 907–917
95 percent confidence interval for mean profit, 914corporate use of, 907–908as decision-making tool, 911–914discrete random variables, 909–910gambling and sporting-event probabilities, 937–946
craps, 937–939five-card draw poker, 939–942NCAA men’s basketball Final Four, 942–944problems for, 945
greeting-card case study, 911–914history of, 907normal random variables, 910–911problems for, 916–917RAND function, 908–909RANDARRAY function, 914–915random sample generation, 916sensitivity analysis and, 207
month, sales bylast day of, returning, 81–82returning date of next Monday, 81summarizing with PivotTables, 528–529
MONTH function, 78month of year
extracting from dates, 78recovering, 78
monthly product sales, 45–46monthly production
accuracy of predictions, 671intercept of, 672monthly operating costs, predicting, 697–701monthly payments, worksheet model for, 199monthly variation in plant-operating costs, 670–671relationship with monthly operating costs, 667–670R-squared value, 671slope of, 672
monthly stock returnscolor coding of, 266–269correlations between, 691–694
Monthlysales.xlsx file, 615months, sorting in chronological order, 403–404Monthtomonth.xlsx file, 526, 528Moore’s Law, 680Moore.xlsx file, 680More Data Table Options button, 600mortgage payment analysis
with Goal Seek command, 199sensitivity analysis of, 188–189
mosaic charts, 635–638most-likely scenarios, for automobile sale, 203–208Mostrecent.xlsx file, 232Moviedata.xlsx file, 69Movienumbers.xlsx file, 69movies, in Excel formulas, 353–354Movies data type, 353–354
Z01_Winston_Index_p1067-1138.indd 1103 28/10/21 8:12 PM
Movies.xlsx file
1104
Movies.xlsx file, 229–231Moving Average command (Format Trendline menu),
666, 746moving averages, 745–747
four-period moving average, 745–746moving-average graphs, 745–746moving-average trading rule, 127–130ratio-to-moving-average forecasting method for,
749–752Mrcostest.xlsx file, 697–698Multiple Consolidation Ranges option, 575multiple IRRs (internal rates of return), 94–95multiple regression analysis
with GROWTH function, 715–718with LOGEST function, 715–718nonlinearities and interactions, 719–726
definition of, 719–720problems for, 720–723testing for presence of, 720–723
problems for, 718qualitative factors, 705–714quantitative independent variables in, 705with TREND function, 714–715
multiple worksheets, auditing options for, 178–179multiple-peak histograms, 372–373multiple-worksheet workbooks
hyperlinks in, 167–169navigating between, 167–169number of worksheets in, 166problems for, 169setting up, 165–167
Multipleworksheetstemp.xlsx file, 169multiplication, with Paste Special command, 162Multiply option (Paste Special), 162Multistart engine, 903Multistart option, GRG Nonlinear engine, 810music, in Excel formulas, 353–354Music data type, 353Mutation Rate options (Solver), 889, 897Mutation Rate setting, 1017–1018mutual funds, importing past data on, 804mutually exclusive events, 754–755My Table Has Headers check box, 284Myexample.xlsx file, 562
N#N/A error, 26, 28, 134–136, 174, 381Name box, defining range names with, 12–13
Name columns, sorting data by, 580Name command (At Each Change In menu), 580Name Manager, 16–17, 19named ranges
applying to existing formulas, 19, 20AutoComplete capabilities for, 18AVERAGE function, 18case insensitivity of, 12creating, 11–16
with Create from Selection option, 13–15with Define Name option, 15–16with Name box, 12–13
deleting, 16–17editing, 16–17for entire column, 18errors in, 22examples of, 17–18for last year’s revenues, 21–22Name Manager, 16–17, 19naming conventions for, 13, 23noncontiguous, 13numbers in, 23pasting list of, 21problems for, 23referencing within formulas, 243–244symbols in, 23for total salary per day, 22for total sales, 17–18underscore (_) in, 23workbook scope for, 18–19workbook/worksheet scope for, 18–19worksheet scope for, 18–19
Namedaterelative() macro, 1040names
extracting, 62–64filtering by, 420
Names.xlsx file, 278naming conventions, for named ranges, 23Nancybonds.xlsx file, 145navigating
3D maps, 649between worksheets, 167–169
Navigator dialog box, 324Navy, BOM (bill of materials) reports for, 1019NBA player statistics
Copyingtableformulas.xlsx, 297data-validation example, 473–476filling and loading into separate rows, 329–331
Nba01_02.xlsx file, 857
Z01_Winston_Index_p1067-1138.indd 1104 28/10/21 8:12 PM
NPV (net present value)
1105
Nba02_03.xlsx file, 857Nbadvl.xlsx file, 474NBAfinal.xlsx file, 329–331Nbamiles.xlsx file, 899NBAplayers.xlsx file, 37Nbasalaries.xlsx file, 279NBAtemp.xlsx file, 329–331NBA.xlsx file, 215, 222NCAA men’s basketball Final Four, probability of team
win in, 942–944negative binomial random variables, 774–776negative Data Bars, 261Negative Points option (Sparkline Tools Design), 661negatively skewed histograms, 372NEGBINOM.DIST function, 774–775Negbinom.dist.xlsx file, 774–775nested drop-down menus, validating, 478–480nesting
IF function, 137subtotals, 580–581
net present value. See NPV (net present value)NETWORKDAYS function, 78NETWORKDAYS.INTL function, 78New Comment button, 944New Formatting Rule dialog box, 264–266, 270–272, 296,
384, 503, 873, 892–893New Name dialog box, 15, 234–235, 245, 1052, 1053New Rule command (Conditional Formatting menu),
253, 873New Scene button, 650New Sheet icon, 166New Worksheet Ply option, 721New York City’s Fourth Avenue subway line, 3D map of,
655–656Next option (Error Checking dialog box), 174NFL point spreads, setting, 854–856NFL team wins/losses, sparklines for, 662–663Nfl01.xlsx file, 856NFL2012data.xlsx file, 857NFLinfo.xlsx, 725Nflpoints.xlsx file, 376Nflwinslosses.xlsx file, 662Nikedata.xlsx files, 299Nlp.xlsx file
Nonlinear Pricing Examples worksheet, 1011–1012OnePrice worksheet, 1013Two-Part Tariff worksheet, 1014
No Feasible Solution worksheet, 820–821nonblank cells in ranges, counting, 214
Noncontigtemp.xlsx file, 13noncontiguous named ranges, 13nonlinear pricing, 1011–1018
definition of, 1011price bundling, 1012–1014profit-maximizing, 1014–1018quantity discounts, 1011two-part tariff, 1012
Nonlinear Pricing Examples worksheet, 1011–1012nonlinearities, 719–726
definition of, 719–720problems for, 720–723testing for presence of, 720–723
Nonlinearity worksheet, 719nonsmooth functions, 810–811normal random variables, 781–790, 920
CLT (central limit theorem), 786–787, 796computing probabilities for, 784–785finding percentiles for, 785–786mean, 786Monte Carlo simulation of, 910–911NORM.DIST function, 784–785NORM.INV function, 785–786, 787PDF (probability density function), 782–784problems for, 789–790properties of, 781–784standard deviation, 786variance, 786Z-scores, 787–788
Normalexamples.xlsx file, 783, 786NORM.DIST function, 784–785, 793NORM.INV function, 785–786, 787, 910–911, 942, 943NORM.S.DIST function, 957North sales, extracting from total US sales, 58–60not equal to operator (<>), 212NOW function, 151NPER function, 108–109NPV (net present value), 85–91, 201, 837, 966, 1063–1064
computing with NPV function, 87–90for cash flows received at beginning of year, 88for cash flows received at middle of year, 88how to use, 87problems for, 90–91syntax of, 87
computing with XNPV function, 88–90cost of capital, 87customer value, determining, 967–972
cell phone customer case study, 969–971credit-card customer case study, 967–969
Z01_Winston_Index_p1067-1138.indd 1105 28/10/21 8:12 PM
1106
NPV (net present value)
NPV function, 968–969problems for, 969–971
definition of, 86–87sensitivity analysis related to, 203–208tracing dependents for, 175–177
NPV function, 87–90, 968–969for cash flows received at beginning of year, 88for cash flows received at middle of year, 88how to use, 87problems for, 90–91syntax of, 87
NPVauditscenario.xlsx file, 203NPVspinnerstemp.xlsx file, 303null hypothesis, 727#NUM! error, 90, 95, 98Number Filters, Excel AutoFilter feature, 416–417, 421–422Number Format dialog box, 492number of periods (NPER) function, 108–109Number section, Format Trendline pane, 669Numberdv.xlsx file, 476numbers
arrays of numbers, returning entries incomputing tax rates with, 27–29definition of, 25looking up prices from product ID codes with,
29–30mismatches between text and numbers in, 34problems for, 35–37syntax of, 25–27wildcard characters with, 31
matching with MATCH function, 43–50investment payback period, 47–48MLB player salaries, returning, 46–47problems for, 49–50product sales per month, 45–46syntax of, 43–45two-way lookups, 46wildcard characters with, 44
in named ranges, 23ranking in data sets, 387
Numbers.xlsx file, 215, 223numeric values, validating, 476–477Nursejackiedata.xlsx file, 894nutritional characteristics, in Excel formulas, 352
OOFFSET function, 225–237
computing development costs with, 228–229
dynamic ranges, 232–234Evaluate Formula feature, 229–231left-hand lookup with, 227–228movie example, 229–231problems for, 236–237revenue tracking with, 228simple example of, 226–227syntax of, 226
Offsetcost.xlsx file, 228–229Offsetexample.xlsx file, 226–227Oldfaithful.xlsx file, 673on-base percentage (OPS), 724One Book worksheet, 588OnePrice worksheet, 1013one-way analysis of variance (ANOVA), 727–732
alternative hypothesis, 727book sales case study, 728–731definition of, 727forecasting with, 731null hypothesis, 727problems for, 731–732
one-way data tablescreating, 185–186definition of, 184
Onewayanovatemp.xlsx file, 728, 730Only Regions with Data option (Map Projection menu),
645Open 3D Maps command, 648, 656Open dialog box, 317Open-High-Low-Close chart option, 640opening new workbooks, 166operating costs
monthly variation in, 670–671predicting, 697–701relationship with production, 667–670
operations, order of, 6–7Operations area, Paste Special dialog box, 160–162Operations Research (Winston), 975, 992operators
<= (less-than-or-equal-to), 782<> (not equal to), 212= (equal to), 211>= (greater than or equal to), 212
OPS (on-base percentage), 724optimal bids, calculating, 919–923
bidding simulation model, 920–922binomial random variables, 919–920normal random variables, 920problems for, 922
Z01_Winston_Index_p1067-1138.indd 1106 28/10/21 8:12 PM
Pastespecial.xlsx file
1107
optimal product mix, determining with Solver, 813–823feasible solutions, 813–820infeasible solutions, 820problems for, 822–823“Set values do not converge” message, 821–822“Solver could not find a feasible solution” message,
820–821optimal solutions, 811, 819–820optimization, 808–809
changing cellsbank workforce scheduling problem, 826optimization problems for, 808–809product-mix problem, 815software project selection problem, 838transportation problem, 831
with Evolutionary Solver, 889–894assigning employees to workgroups with,
890–892highlighting employee ratings with, 892–893options for, 889–890problems for, 893–894tips for success, 889–894
with Microsoft Excel Solver, 807–811optimization models, 808–809sample optimization problems for, 807–808
problem constraints, 809bank workforce scheduling problem, 826product-mix problem, 815software project selection problem, 838transportation problem, 831
target cellsbank workforce scheduling problem, 826optimization problems for, 808product-mix problem, 815software project selection problem, 838transportation problem, 831
Option Button form control, 307option pricing, 953–966
abandonment options, 964–965American cash flows, 955Black-Scholes formula, 798, 957–958, 959–961call/put options, 953, 955–956, 958–959in decision-making process, 963–964European cash flows, 954–955European options, 953historical volatility, 956–957parameters for, 955real options, 963–964volatility of stock, estimating, 956–957
worksheet protection, 961–963Optionbuttons.xlsx file, 311Options command (File menu), 64, 809Options dialog box, 179Or Select a Place in This Document option (Insert
Hyperlink dialog box), 167order of operations, 6–7Original Model worksheet, 303outliers, 383–384, 671Outline group, Subtotal command, 577–581Output Range option, 735, 739overbooked flight case study, 772
Pp values, 700, 730P23_2.xlsx file, 248P23_3.xlsx fie, 249Page Setup dialog box, 944parent/child relationships, 633Pareto, Vilfredo, 374Pareto charts
creating, 374–375design options for, 375
Paretotemp.xlsx file, 374Pascal, Blaise, 776Paste Link button, 160Paste List button, 21Paste Name dialog box, 12Paste Special command, 157–163, 187
operations in, 160–162overview of, 157Paste Link button, 160problems for, 163transposing rows/columns with, 159–160values of cells, pasting to different part of worksheet,
157–159Paste Special dialog box
Paste Link button, 160Transpose option, 159–160, 693Values option, 158
Paste Special Divide Before worksheet, 160–161Paste Special Transpose worksheet, 159Paste Special Value worksheet, 157Paste Special Values command (File menu), 910Pastespecial.xlsx file, 157
Paste Special Divide Before worksheet, 160–161Paste Special Transpose worksheet, 159Paste Special Value worksheet, 157
Z01_Winston_Index_p1067-1138.indd 1107 28/10/21 8:12 PM
1108
pattern-recognition technology, Flash Fill
pattern-recognition technology, Flash Fill, 62–64patterns, finding with Analyze Data, 1019–1029
BOM (bill of materials) reports, 1019daycare late pickups, 1027–1028heights of fathers/sons, 1025–1027hospital data, 1024–1025overview of, 1019problems for, 1028–1029stock market prices, 1022–1024
payback period, returning, 47–48Payback.xlsx file, 47Paymentgs.xlsx file, 199payments, future, 101–105payroll, weekly, worksheet model for, 1–2PDF (probability density function), 765–766, 782–784,
903, 920PEMDAS order of operations, 6–7People data type, 356Pepsi/Coke preference example, 771PERCENTILE function, 385–386percentile rankings, 385–386PERCENTILE.EXC function, 385–386PERCENTILE.INC function, 385–386percentiles, for normal random variables, 785–786PERCENTRANK function, 385–386PERCENTRANK.EXC function, 385–386PERCENTRANK.INC function, 385–386period (.), in named ranges, 23periodic payments, computing, 105–107perpetuity, 112Personal Macro Workbook, 1033Pfizer, Monte Carlo simulation used by, 907pharmaceuticals, probability statements from forecasts,
792–793phone numbers, formats for, 65–69Phoneloyalty.xlsx file, 969pie charts, 600–603, 654Pinevalley.xlsx file, 36pipe character (|), 61Pivot Column dialog box, 328–329PivotCharts, 498–499, 529–531PivotTable and PivotChart Wizard, 529–531PivotTable Fields pane, 487–488, 544–546, 630PivotTables
age/gender travel expenditure example, 505–509blank rows in, 501–502calculated items in, 519–522chip microchip from different countries/regions,
512–515
conditional formatting in, 502–504creating, 542–543
based on existing PivotTable, 531–532from data in different locations, 529–531with Data Model, 544–546multiple, 532–533with PowerPivot, 557–559
daycare late pickups, 1027default settings for, 533design options for, 491drilling down, 522dynamic array functions compared to, 535–536editing, 509fields
calculated, 515–517collapsing/expanding, 492–493filtering, 495–498format of, 491–492PivotTable Fields pane, 487–488sorting, 493–494
GETPIVOTDATA function, 523–525grouping items in, 518–519hiding subtotals in, 501–502inserting, 1021–1022layouts, 489–490modifying empty cells in, 501–502origins of name, 491overview of, 483–485PivotCharts, 498–499PivotTable and PivotChart Wizard, 529–531problems for, 536–540Reports Filter, 499–500, 532–533slicers, 500–501station wagon ownership by family size and salary,
509–512summarizing Bitcoin prices and returns with, 533–535summarizing grocery sales with, 485–489summarizing sales by month with, 528–529summarizing total sales to date with, 526–527Timeline feature, 525–526updating calculations in, 504
Pivotwithslicers.xlsx file, 559Place In This Document option (Insert Hyperlink dialog
box), 167plants, in Excel formulas, 353–354Plants data type, 354Play Tour button, 649player statistics, filling and loading into separate rows,
329–331
Z01_Winston_Index_p1067-1138.indd 1108 28/10/21 8:12 PM
prices and pricing
1109
“Please excuse my dear Aunt Sally” (PEMDAS), 6–7plus sign (+), 58, 303PMT function, 101–107, 188–189, 199
mortgage payments, determining, 845retirement savings, determining, 845verifying accuracy of, 845
point spreads, setting with Solver, 853–857example of, 854–856nonlinear nature of, 856overview of, 853–854problems for, 856–857
points, 937–946deleting from charts, 610–611problem of, 776
Poisson random variable, 777–778computing probabilities for, 778definition of, 777POISSON.DIST function, 778problems for, 777
POISSON.DIST function, 778Poisson.xlsx file, 778poker, five-card draw, probability of three of a kind in,
939–942Poker.xlsx file, 939policy, reorder-point
lost-sales approach, 980–981overview of, 979–980problems for, 985service-level approach, 982–985
Polynomial option (Format Trendline pane), 1006population data, importing into Excel, 323–327portfolio insurance, 126positively skewed histograms, 371–372posterior probability, 758Power command (Format Trendline menu), 666, 684power curve, 681–688, 994–997
equation for, 681learning curve and, 684–685problems for, 687–688properties of, 683relationships modeled by, 681–683SSE (sum of squared errors), 685trend curve parameters for, 686–687
Power Query Editor, 322, 340–341daily suggested prices, importing and transforming,
336–337Excel tables
creating from flat files, 328–329flattening, 327–328
hardware store datacombining into single file, 334–336importing and formatting, 331–334
NBA player statistics, filling and loading into separate rows, 329–331
overview of, 321–322queries, editing, 334tables, appending, 338–340Unpivot Columns command, 327US city population data, importing into Excel,
323–327PowerPivot, 551–570
CALCULATE function, 567–570calculated measures, 567–570creating PivotTables with, 557–559DAX (Data Analysis Expressions), 560–562importing data into, 552–557installing/activating, 552problems for, 570RELATED function, 562–567slicers with, 559–560
Powerpivotexample1.xlsx file, 561PPMT (principal payment) function, 106–107PQappendtemp.xlsx file, 338Pqappend.xlsx file, 339PQdatatypestemp.xlsx file, 359PQPROBLEM5DATA.XLSX file, 340PQPROBLEM6DATA.XLSX file, 341PQPROBLEM7DATA.XLSX file, 341PQPROBLM4DATA.XLSX file, 340pre- and post-merger performance, separating in charts,
628–629precedents
analyzing with Inquire add-in, 182definition of, 174tracing, 174–175
predictionsaccuracy of, 671, 872–876auto sales, 705–710based on exponential growth, 679–680of presidential elections, 710–714straight-line relationship, 672
presidential elections, predictions for, 710–714Previous option (Error Checking dialog box), 174price bundling, 1012–1014Priceads.xlsx file, 724prices and pricing
Bitcoin prices, importing, 802demand curve, 993–998
Z01_Winston_Index_p1067-1138.indd 1109 28/10/21 8:12 PM
1110
prices and pricing
customer’s willingness to pay and, 997definition of, 993elasticity of demand, 994estimating, 993–998linear, 994problems for, 998subjectively determined demand, 1005–1010tie-ins, pricing products with, 999–1003worksheet model for, 7–8
effect on profits, 7–8extracting dollar and cents amounts from, 62–64extracting from text strings, 56–58linear, 1011looking up from product ID codes, 29–30nonlinear, 1011–1018
definition of, 1011profit-maximizing, 1014–1018quantity discounts, 1011two-part tariff, 1012
option buttons for, 311–312option pricing, 953–966
abandonment options, 964–965American cash flows, 955American options, 953Black-Scholes formula, 798, 957–958, 959–961call/put options, 953, 955–956, 958–959in decision-making process, 963–964European cash flows, 954–955European options, 953exercise date/expiration date, 953historical volatility, 956–957parameters for, 955problems for, 965–966real options, 963–964volatility of stock, estimating, 956–957worksheet protection, 961–963
price bundling, 1012–1014profit-maximizing price analysis, 184–188, 993–994stock prices
lognormal random variables, 795–798simulation, 926–929
tie-ins, pricing products with, 999–1003principal
cumulative, 107PPMT function, 106–107
pro forma financial statements, 130–134probability, 753–762. See also forecasting
additive rule for computing, 755axioms for, 754
Bayes’ theorem, 758–759binomial, 770–773
Coke/Pepsi preference example, 771defective elevator rails example, 771–772overbooked flight example, 772Village Deli example, 773
conditional, 756–757contingency tables for, 757cumulative, 770events
definition of, 754independent, 755–756mutually exclusive, 754–755
experiments, 753law of complements, 754law of total probability, 757making probability statements from forecasts,
791–794Monte Carlo simulation, 907–917
95 percent confidence interval for mean profit, 914
corporate use of, 907–908as decision-making tool, 911–914discrete random variables, 909–910greeting-card case study, 911–914history of, 907normal random variables, 910–911problems for, 916–917RAND function, 908–909RANDARRAY function, 914–915random sample generation, 916
for normal random variables, 784–785PDF (probability density function), 765–766, 903, 920for Poisson random variable, 778a posteriori, 758probability mass function, 770problems for, 759–762sample space, 753Weibull random variable, 906
probability density function (PDF), 765–766, 782–784, 903, 920
probability mass function, 770problem constraints, in optimization models, 809
bank workforce scheduling problem, 826product-mix problem, 815software project selection problem, 838transportation problem, 831
problem of points, 776Problem5_9.xlsx file, 50
Z01_Winston_Index_p1067-1138.indd 1110 28/10/21 8:12 PM

problems
1111
Problem6data.xlsx file, 894Problem7data.xlsx file, 376, 680Problem8data.xlsx file, 376Problem9data.xlsx file, 376, 844Problem10data.xlsx file, 790Problem11data.xlsx file, 299Problem12data.xlsx file, 299Problem13data.xlsx file, 299, 673, 725Problem15data.xslx file, 726Problem16data.xlsx file, 69, 726Problem17datat.xlsx file, 394Problem17data.xlsx file, 69Problem18data.xlsx file, 395Problem19data.xlsx file, 223Problem20data.xlsx file, 223, 539Problem21data.xlsx file, 223, 539Problem22data.xlsx file, 69, 223, 539Problem23_24data.xlsx file, 223Problem23data.xlsx file, 69, 539Problem24data.xlsx file, 69, 539Problem25data.xlsx file, 69, 540Problem26data.xlsx file, 69, 540Problem27data.xlsx file, 69, 280, 540Problem28data.xlsx file, 146, 281Problem30data.xlsx file, 281Problem32data.xlsx file, 281Problem33data.xlsx file, 281Problem34data.xlsx file, 146Problem35data.xlsx file, 147, 281Problem36data.xlsx file, 281, 471Problem37data.xlsx file, 147Problem38data.xlsx file, 147Problem39data.xlsx file, 147Problem40data.xlsx file, 147Problem41data.xlsx file, 147Problem42.xlsx file, 147Problem43data.xlsx file, 147problems
Analyze Data, 1028–1029auditing options, 182beta random variable, 906binomial random variables, 775–776bootstrapping, 934–935capital budgeting, 842–844charts, 614–615, 641–642circular references, 120–121conditional formatting, 278–281consolidating data, 575correlations and, 695
counting cells in ranges, 214–215customer value, determining, 969–971data importing from text files, 320Data Model, 550data types, 362data validation, 481–482database statistical functions, 438–439dates, 82–83demand curve, 998descriptive statistics, 393–395dynamic array functions, 471EOQ (economic order quantity) model, 977–978Evolutionary Solver, 893–894Excel AutoFilter feature, 428exponential growth modeling, 680financial functions, 112–115forecasting in presence of special events, 876form controls, 313–314gambling and sporting-event probabilities, 945Goal Seek command, 201–202histograms, 376hypergeometric random variables, 775–776IF function, 143–147INDEX function, 41INDIRECT function, 248–249LET function, 1060lognormal random variables, 798lookup functions, 35–37machine life, modeling, 906maps, 657MATCH function, 49–50Microsoft Excel Solver, 827Monte Carlo simulation, 916–917multiple regression analysis, 703, 718
problems for, 703negative binomial random variables, 775–776normal random variables, 789–790NPV (net present value), 90–91OFFSET function, 236–237one-way analysis of variance (ANOVA), 731–732optimal bids, calculating, 922optimal product mix, determining with Solver,
822–823option pricing, 965–966Paste Special command, 163PivotTables, 536–540Poisson random variable, 777power curve, 687–688Power Query Editor, 340–341
Z01_Winston_Index_p1067-1138.indd 1111 28/10/21 8:12 PM
1112
problems
PowerPivot, 570probability, 759–762queueing theory, 992random variables, 767recording macros, 1047–1048retirement savings, determining, 845–848Scenario Manager, 207–208sensitivity analysis, with data tables, 192–195sorting, 409sparklines, 664sports team ratings, with Solver, 856–857STOCKHISTORY function, 806straight-line relationships, estimation of, 672–673subjectively determined demand, 1006–1008,
1009–1010subtotals, 583text functions, 67–68times, 155transportation or distribution problems for, 834–836two-way analysis of variance (ANOVA), 742–743Winters method, 867worksheet modeling, 9
Procter & Gamble, Monte Carlo simulation used by, 907Prodmix.xlsx file, 820
Feasible Solution worksheet, 813No Feasible Solution worksheet, 820–821Set Values Do Not Converge worksheet, 821
product descriptions, extracting from text strings, 56–58product IDs
extracting from text strings, 56–58looking up prices from, 29–30
product salescreating summary of, 244–245forecasting of, 750–752per month, returning, 45–46
Product worksheet, 458production
accuracy of predictions, 671cost, as function of number of units produced, 681–682intercept of, 672monthly variation in plant-operating costs, 670–671relationship with operating costs, 667–670R-squared value, 671slope of, 672time, cumulative units produced and, 683
Productlookup.xlsx file, 45, 299product-mix problem, 813–820Productmix.xlsx file, 182Productpaste.xlsx file, 163
Productsalespaste.xlsx file, 163profit-maximizing price analysis, 184–188, 1005–1010
95 percent confidence interval for mean profit, 914demand curve, 993–998. See also profit-maximizing
price analysiscustomer’s willingness to pay and, 997definition of, 993elasticity of demand, 994estimating, 994–997linear, 994power, 994–997problems for, 998subjectively determined demand, 1005–1010tie-ins, pricing products with, 999–1003worksheet model for, 7–8
effect of price on, 7–8nonlinear pricing plan, 1014–1018price bundling, 1012–1014profit-maximizing price analysis, 993–994tie-ins, pricing products with, 999–1003
Proforma.xlsx file, 130project duration, modeling, 904–905project selection problem
additional constraints in, 840–841example of, 837–840
PROPER function, 54Protect Sheet dialog box, 962Protected worksheet, 977Ptableexample.xlsx file, 512Ptablepartsdata.xlsx file, 538Ptcustomerstemp.xlsx file, 1047Ptcustomers.xlsx file, 495Pujols, Albert, 725put options, 125, 953, 955–956, 958–959Put worksheet, 954PV function, 101–105PV worksheet, 102
QQb2013.xlsx file, 37Qbinfo.xlsx file, 725Qd.xlsx file, 1017qualitative factors, in multiple-regression analysis, 705
quarterly US auto sales predictions, 705–710US presidential elections, 710–714
quality ratings, of employees, highlighting with Evolutionary Solver, 892–893
Z01_Winston_Index_p1067-1138.indd 1112 28/10/21 8:12 PM
range_lookup argument (VLOOKUP function)
1113
quantitative independent variables, in multiple-regression analysis, 705
quantity discounts, 124, 125–126, 1011quarterly corporate revenues, color coding of, 269–272quarterly US auto sales predictions, 705–710Quarterlygnpdata.xlsx file, 69Quarterly.xlsx file, 867Quarters worksheet, 140queries, editing, 334question mark (?), 31, 213queueing theory, 987–992
factors influencing, 987–988interarrival time in, 988mean and standard deviation of service times, 988number of servers in, 987overview of, 987problems for, 992queueing template, 989–991sensitivity analysis in, 989–991steady-state characteristics in, 988variability degrading performance of, 988–989
Queuingtemplate.xlsx file, 989–990Quick Access toolbar
placing macros on, 1037sorting with, 425–427
quotation marks (“), 211
Rradar charts, 607–608RAND function, 908–909, 912, 923, 938, 940, 943RANDARRAY function, 914–915, 916, 923, 950Randarray.xlsx file, 916RANDBETWEEN function, 923, 926–927, 930, 938, 947Randdemo.xlsx file, 908random errors, in forecasts, 876random samples, generating, 916random variables, 763–767
betadetermining probabilities with, 904–905problems for, 906
binomial, 919–920BINOM.DIST function, 770–772BINOM.DIST.RANGE function, 770–772BINOM.INV function, 773computing binomial probabilities with, 770–773definition of, 770negative, 774–775problems for, 775–776
continuous, 765definition of, 763discrete, 763–764, 909–910exponential
computing probabilities for, 779–780problems for, 780
hypergeometricbinomial, 775–776definition of, 773–774
independent, 766lognormal, 795–798, 956
definition of, 795LOGNORM.DIST function, 797–798LOGNORM.INV function, 798mean, 795modeling future prices of stock as, 796–797problems for, 798standard deviation, 795stock prices following, 796
mean, 764–765negative binomial, 774–776normal, 781–790, 920
CLT (central limit theorem), 786–787, 796computing probabilities for, 784–785finding percentiles for, 785–786mean, 786Monte Carlo simulation of, 910–911NORM.DIST function, 784–785NORM.INV function, 785–786, 787PDF (probability density function), 782–784problems for, 789–790properties of, 781–784standard deviation, 786variance, 786Z-scores, 787–788
PDF (probability density function), 765–766, 782–784Poisson, 777–778
computing probabilities for, 778definition of, 777POISSON.DIST function, 778problems for, 777
problems for, 767standard deviation, 764–765uniform, 923variance, 764–765Weibull, 901–904
randomized blocks design, 734–736Randy.xlsx, 629range_lookup argument (VLOOKUP function), 25–26
Z01_Winston_Index_p1067-1138.indd 1113 28/10/21 8:12 PM
ranges
1114
ranges, 381–382counting cells in, 209–215
COUNT function, 210, 214COUNTA function, 210, 214COUNTBLANK function, 210, 214COUNTIF function, 209–210, 211–213COUNTIFS function, 210, 213DISTINCT COUNT function, 214, 547–549problems for, 214–215
descriptive statistics for, 388dynamic, 232–234named
applying to existing formulas, 19, 20AutoComplete capabilities for, 18AVERAGE function, 18case insensitivity of, 12creating, 11–16deleting, 16–17editing, 16–17for entire column, 18errors in, 22examples of, 17–18for last year’s revenues, 21–22Name Manager, 16–17, 19naming conventions for, 23noncontiguous, 13numbers in, 23pasting list of, 21problems for, 23referencing within formulas, 243–244symbols in, 23for total salary per day, 22for total sales, 17–18underscore (_) in, 23workbook/worksheet scope for, 18–19
totaling values in, 242–243RANK function, 387, 619, 625RANK.AVG function, 387RANK.EQ function, 298, 387, 940ranking numbers, 387rate formula, 846RATE function, 108ratings, of employees, 892–893Ratioma.xlsx file, 750ratio-to-moving-average forecasting method for,
749–752razors, profit-maximizing price analysis of, 999–1003Razorsandblades.xlsx file, 999Real Best Fit worksheet, 678
real options, 963–964Reapply option, Excel AutoFilter feature, 425reciprocal cost allocation, 121Record Macro button, 1032–1033, 1034, 1038, 1041, 1044,
1046, 1047Record Macro dialog box, 1032–1033, 1034, 1038, 1041,
1044, 1046, 1047recording macros, 1031–1048
to format a selected range of cells, 1031–1048macros to format a selected range of cells, 1031–1048minutes played by lineup, 1045–1046overview of, 1031–1048problems for, 1047–1048Record Macro dialog box, 1032–1033relative references, 1037–1040step-by-step process for, 1032–1033Top 10 Filter (Customer), 1047weekly changes in sales, 1041–1044
recreation, gambling and sporting-event probabilities, 937–946craps, 937–939five-card draw poker, 939–942NCAA men’s basketball Final Four, 942–944problems for, 945
recursive LAMBDA functions, 1055–1056redbold macro, 1034Redbold.xlsm file, 1034REDUCE helper function, 1058references
relative, 1037–1040structured, 294–295
regional salesconsolidating data for, 571–575
with Consolidate command, 571–575need for, 571problems for for, 575
subtotals of, 577–583need for, 577revenue and units sold by region, 577–580sales by each salesperson, 580–581
worksheet model for, 169regression, standard error of, 671regression analysis, multiple, 697–703
accuracy of forecasts from, 702with GROWTH function, 715–718with LOGEST function, 715–718nonlinearities and interactions, 719–726
definition of, 719–720problems for, 720–723
Z01_Winston_Index_p1067-1138.indd 1114 28/10/21 8:12 PM
revenues
1115
testing for presence of, 720–723predicted monthly operating costs, 697–701problems for, 703, 718qualitative factors, 705
quarterly US auto sales predictions, 705–710US presidential elections, 710–714
quantitative independent variables in, 705running with LINEST, 702–703with TREND function, 714–715
Regression dialog box, 698–699Input X Range, 712, 721Input Y Range, 712, 721
regression forecasting model, 870regression toward the mean, 694–695regularly spaced time intervals, creating, 153–154Reichheld, Frederick, 969–971RELATED function, 562–567relationships. See also trend curve
correlations, 689–695Correlation dialog box, 689–691correlation matrix, 693definition of, 689between monthly stock returns during 1990s,
691–694overview of, 689–691problems for, 695regression toward the mean and, 694–695R-squared value and, 694
Data Modelcreating, 543–544managing, 546–547
power curve for, 681–688equation, 681learning curve and, 684–685problems for, 687–688properties of, 683relationships modeled by, 681–683SSE (sum of squared errors), 685trend curve parameters for, 686–687
straight-line, 643–652accuracy of predictions, 671dependent variables, 665–666Format Trendline options, 666–667independent variables, 665–666intercept of, 672between monthly production and monthly
operating costs, 667–670monthly variation in plant-operating costs,
670–671
problems for, 672–673R-squared value, 671scatter charts of data points, 666–667slope of, 672trend curve, 665
between workbooks/worksheets, 181relative references, 1037–1040Remove Arrows feature, 175, 177Remove Duplicates, in Excel AutoFilter, 424reorder-point policy
lost-sales approach, 980–981overview of, 979–980problems for, 985service-level approach, 982–985
Reorderpoint_backorder.xlsx file, 980Reorderpoint_lostsales.xlsx file, 982Repeatedhisto.xlsx file, 60Replace Current Totals check box, 578REPLACE function, 54replication
two-way ANOVA with, 737–742two-way ANOVA without, 734–737
Report Filter, 532–533reports
BOM (bill of materials), 1019PivotTable Reports Filter, 499–500Scenario PivotTable Report, 207Scenario Summary, 207
Reps worksheet (Datamodeltemp.xlsx), 541REPT function, 54, 61resampling, 947–951residuals, 787–788, 874–876resolving circular references, 118–120result cells, 203, 206results of calculations, moving, 157–159retention rate (customer), profitability and, 967–969Retire worksheet, 848retirement savings
determining, 845–849retirement-planning problem, 848–849returning future value of, 103–105
return_array argument (XLOOKUP function), 26Returnstemp.xlsx file, 17revenues
color coding of, 269–272exponential growth, 675–680
CAGR (compound annual growth rate), 675–678equation for, 675Exponential command, 675–678
Z01_Winston_Index_p1067-1138.indd 1115 28/10/21 8:12 PM
1116
revenues
GROWTH function, 679–680modeling, 676–678overview of, 675predictions based on, 679–680problems for, 680S-curve, 678trend curve parameters for, 678–679
filtering tables on, 289–292last year’s, named ranges for, 21–22profit-maximizing price analysis, 184–188subtotals by region, 577–580summarizing annual, 136–137
Reversed.xlsx function, 237Reversenames.xlsx file, 69RIGHT function, 53, 59, 482risk-free rate, 955Robinson option (Map Projection menu), 645Rock.xlsx file, 210, 214Ronstadt, Linda, 353ROW function, 137Row Input Cell (Data Table), 969, 991rows
locking, 4–5transposing with columns, 159–160, 611–612
Rowsnamed.xlsx file, 22RSQ function, 672R-squared value, 671, 672, 677, 694Rules Manager, Conditional Formatting, 257–258running macros, 1035–1037running Microsoft Excel Solver, 809–810
Ssafety-stock level. See reorder-point policySalaries.xlsx file, 460salary
total salary per day, 22weekly wages, 1–2
salesconsolidating
with Consolidate command, 571–575need for, 571problems for, 575
as function of advertising, 682listing with INDIRECT, 241–242product sales per month, 45–46summarizing with PivotTables
sales by month, 528–529total sales to date, 526–527
total sales, named ranges for, 17–18trend and seasonality in, 750–752weekly changes in, 1041–1044
sales force, effectiveness oftwo-way ANOVA with replication, 737–742two-way ANOVA without replication, 734–736
Sales worksheet (Datamodeltemp.xlsx), 541Salesdata.xlsx file, 49, 181Salesfixfinal.xlsx file, 331–334Salesfixtemp.xlsx file, 331–334sales-force performance over time, charts of, 920–923Salesstripping.xlsx file, 58Salessummary.xlsx file, 181sales-transaction data, sorting, 398–401Sales.xlsx file, 438sample space, 753sample standard deviation, 381–382sample variance, 381–382samples, random, 916. See also resamplingSandp.xlsx file, 278satisfaction ratings, of employees, 892–893Satissuper.xlsx file, 278Savant, Marilyn vos, 759Save As Template command, 621Save Chart Template dialog box, 621scale
chart axes, 612–613projects, 95–96
SCAN helper function, 1059scatter charts, 606–607, 666–667, 676
Scatter with Smooth Lines, 191, 623, 626, 631, 632Scatter with Smooth Lines and Markers, 746Scatter with Straight Lines, 995
Scatter.xlsx file, 606Scenario Manager dialog box, 204, 205, 207Scenario Manager, sensitivity analysis with, 203–208
Assumption cells, hiding/showing, 207example of, 203–208merging scenarios in, 207Monte Carlo simulation, 207problems for, 207–208Scenario PivotTable Report, 207Scenario Summary reports, 207–208
Scenario PivotTable Report, 207Scenario Summary dialog box, 206–207Scenario Values dialog box, 205Scene Options pane, 650, 653scheduling, traveling salesperson problem
definition of, 895, 896–898
Z01_Winston_Index_p1067-1138.indd 1116 28/10/21 8:12 PM
SKEW function
1117
examples of, 895–896problems for, 898–899
Scholes, Myron, 953. See also Black-Scholes option-pricing formula
scope, of named ranges, 16, 18–19Scrollbar control, 307S-curves, 678, 747SEARCH function, 53–54search_mode argument (XLOOKUP function), 26Sears, Monte Carlo simulation used by, 908seasonal index for current month, 860–861seasonality
in forecasting of future product sales, 750–752in multiple-regression analysis, 705–710seasonal indexes
in forecasting of future product sales, 750–752interpretation of, 749–750Toys “R” Us example, 715–718Walmart example, 749–750
of series, 860SECOND function, 152secondary axis, 593–594Secondaryaxis.xlsx file, 593second-largest number in data set, finding, 386–387seconds, extracting from times, 152second-smallest number in data set, finding, 386–387Select a Solving Method command, 810, 817, 840, 847,
862, 896, 933Select a Solving Method list, 897Select Data button, 996Select Data Source dialog box, 595, 597, 623Select Files to Compare dialog box, 180Select Unlocked Cells option, 962semicolon (;), 79, 154sensitivity analysis, 989–991
with data tables, 183–195advanced sensitivity analysis, 1063–1065break-even year analysis, 189–191creating charts from, 191–192mortgage payment analysis, 188–189one-way data tables, 184, 185–186overview of, 183–184problems for, 192–195profit-maximizing price analysis, 184–188spider plots, 1063–1065spin button for, 302–307two-way data tables, 184
with Scenario Manager, 203–208Assumption cells, hiding/showing, 207
example of, 203–208merging scenarios in, 207Monte Carlo simulation, 207problems for, 207–208Scenario PivotTable Report, 207Scenario Summary reports, 207–208
SEQUENCE function, 469–470, 950sequences of times, 153–154Sequence.xlsx file, 469sequencing problems
job-shop scheduling problems for, 895traveling salesperson problem
definition of, 895, 896–898examples of, 895–896problems for, 898–899
sequential numbers, generating list of, 469–470SER (standard error of regression), 671serial format
for dates, 74–76for times, 149
Serial Format worksheet, 74Series Color section, Format Data Series pane, 645Series dialog box, 913servers, number of, 987service-level approach, to reorder points, 982–985Servicelevelreorder.xlsx file, 983Set Objective option (Solver Parameters), 816, 821, 839,
896, 897“Set values do not converge” message, 821–822Shading.xlsx file, 280shapes, histogram, 371–373SHEET function, 246Sheetnames.xlsx file, 18–19shortcut keys, 1033Show Calculation Steps option (Error Checking dialog
box), 173Show Data in Hidden Rows and Columns chart option,
597Show Formulas feature, 172Showbiz.xlsx file, 69Show/Hide Comments button, 944side-by-side view, 572sigma, 910–911Signif worksheet, 728Sim worksheet, 909, 911, 914Simplex LP engine, 810, 817–819, 827, 833–834, 849simulation, Monte Carlo. See Monte Carlo simulationSingers.xlsx file, 298SKEW function, 381
Z01_Winston_Index_p1067-1138.indd 1117 28/10/21 8:12 PM
skewness measure
1118
skewness measure, 381, 920skewed left histograms, 372skewed right histograms, 371–372
slash (/), 803slicers, table, 292–294, 500–501, 559–560SLN (straight-line depreciation), 109–110SLN function, 109–110slope
in ratio-to-moving-average forecasting method, 751of straight-line relationship predictions, 672of trendlines, 751
SLOPE function, 671, 672, 679, 687, 751, 752slugging percentage (SLG), 725SMALL function, 47, 386smoothing, Winters method of
equations for, 860–861Forecast Sheet tool, 863–866initialization of, 861level of series, 860–861overview of, 859problems for, 867seasonal index for current month, 860–861smoothing constants, estimation of, 861time series characteristics, 859–860trend of series, 860–861
software project selection problemadditional constraints in, 840–841example of, 837–840
solution engines, Microsoft Excel Solver, 810–811Solver. See Microsoft Excel Solver“Solver could not find a feasible solution” message,
820–821Solver Parameters dialog box, 809, 826–827, 842, 848,
849, 855–856, 872, 889–890, 891, 933, 983–985, 1000–1001, 1007–1008, 1017–1018Changing Cells option, 896By Changing Variable Cells, 816, 820, 821, 839Evolutionary Solver, 889–890Ignore Integer Constraints, 898Make Unconstrained Variables Non-Negative, 817,
821, 833Select a Solving Method list, 840Set Objective, 816, 821, 839, 896, 897Solve, 821, 833Subject to the Constraints, 821
songs played on radio, counting, 209–215blank cells in ranges, 214function syntax for, 209–211nonblank cells in ranges, 214
songs longer than average length, 212songs not sung by a particular singer, 212songs of minimum length, 212songs of specific length, 213songs of specific length by specific singer, 213songs played after a certain date, 213songs played before a certain date, 213songs sung by a particular singer, 211songs sung by singers whose last names being with a
certain letter, 212songs sung by singers whose last names contain x
letters, 213Sort dialog box. See sortingSORT function, 464–466, 479, 480. See also sortingSort Warning dialog box, 405Sortandsortby.xlsx file, 465SORTBY function, 464–466, 916Sortday.xlsx file, 409sorted data, charts based on, 627–628Sortedgraph.xlsx file, 627Sorticons.xlsx file, 409sorting
across columns, 407–408on a cell or font color, 401–402by city, 405–407dynamic array functions for, 464–466on icon sets, 402–403by lowercase/uppercase, 408–409months in chronological order, 403–404PivotTable fields, 493–494problems for, 409with Quick Access toolbar, 425–427sales-transaction data, 398–401without Sort dialog box, 405
South sales, extracting from total US sales, 58–60Space data type, 351spaces, sample, 753spaces.xlsx file, 247Sparkline Color option (Sparkline Tools Design), 661Sparkline Date Range dialog box, 662Sparkline Tools Design tab, 661sparklines, 659–664
automatically updating, 663–664daily customer counts, 659–660modifying, 661–662overview of, 659problems for, 664win/loss, 662–663
Z01_Winston_Index_p1067-1138.indd 1118 28/10/21 8:12 PM
Stocks worksheet
1119
Sparklines.xlsx file, 659Column Sparkline worksheet, 662High Low worksheet, 661
special formats, 67Special Tricks.xlsx, 67specifiers, table, 295spider plots, 1063–1065Spiderplottemplate.xlsx file, 1063#SPILL error, 22, 349, 464Spin Button form control, 302–307Split Column button, 333Split Column by Delimiter dialog box, 333Split Column by Number of Characters dialog box, 333sporting-event probabilities, 937–946
craps, 937–939five-card draw poker, 939–942NCAA men’s basketball Final Four, 942–944problems for, 945
Sportinglife.xlsx file, 614sports team ratings, with Solver, 853–857
NFL point spreads, setting, 854–856nonlinear nature of, 856overview of, 853–854problems for, 856–857
Sports.xlsx file, 614spread of points, around least-squares line, 672SQRT function, 956–957squared errors, sum of, 670SSE (sum of squared errors), 670, 685stacked area charts, 603–606Stacked Bar chart option, 626Stacked Column chart option, 587, 652standard deviation, 381–382, 764–765, 920
lognormal random variables, 795normal random variables, 786of service times, 988
standard error of regression (SER), 671standard normal, 957StartFixMinutestemp.xlsx file, 1045state abbreviations, validating, 477–478Statedv.xlsx file, 477Stateincome.xlsx file, 657States.xlsx file, 16, 17, 552static times, entering, 154–155Staticdate.xlsx file, 79station wagon ownership, by family size and salary,
509–512Station.xlsx file, 509statistical inferences, resampling, 947–951
statistics, descriptive. See descriptive statisticsSTDEV function, 382, 454, 788Stdevif.xlsx file, 453STDEV.S function, 382, 793, 901, 902, 905, 913, 956–957STDEVS function, 873steady-state characteristics of queueing system, 988STEYX function, 671Stock data type, 349–350stock volatility, 955Stockcorrel.xlsx file, 691STOCKHISTORY function, 799–806
arguments of, 800importing past with, Bitcoin prices, 802past data, importing
commodity prices, 804–805currency exchange rates, 803index or mutual funds, 804trading data on stoc, 799–801
problems for, 806Stockhistoryfinal.xlsx file
Bitcoin worksheet, 802Currency worksheet, 803Stocks worksheet, 800
Stockpricestemp.xlsx file, 1022–1024stocks
asset-allocation modeling, 929–934beta, 671, 951charts for, 639–641modeling as lognormal random variables, 796–797option pricing, 953–966
abandonment options, 964–965American cash flows, 955American options, 953Black-Scholes formula, 798, 957–958, 959–961call/put options, 953, 955–956, 958–959in decision-making process, 963–964European cash flows, 954–955European options, 953exercise date/expiration date, 953historical volatility, 956–957parameters for, 955problems for, 965–966real options, 963–964volatility of stock, estimating, 956–957worksheet protection, 961–963
prices, finding patterns in, 1022–1024stock price simulation, 926–929, 951STOCKHISTORY function, 799–806
Stocks worksheet, 800
Z01_Winston_Index_p1067-1138.indd 1119 28/10/21 8:12 PM
Stock.xlsx file
1120
Stock.xlsx file, 373, 376, 383, 393Stop If True option, 275–277Stop Recording button, 1033, 1038, 1044, 1046, 1047Store Macro In option, 1033Storesales.txt file, 552storing, 620–621, 923story problems for, Goal Seek for, 199–200straight-line depreciation (SLN), 109–110straight-line relationships, 643–652
accuracy of predictions, 671dependent variables, 665–666Format Trendline options, 666–667independent variables, 665–666intercept of, 672between monthly production and monthly operating
costs, 667–670monthly variation in plant-operating costs, 670–671problems for, 672–673R-squared value, 671scatter charts of data points, 666–667slope of, 672trend curve, 665
stringsconverting to times, 152extracting product ID, price, and product description
from, 56–58matching with MATCH function, 43–50
investment payback period, 47–48MLB player salaries, returning, 46–47problems for, 44, 49–50product sales per month, 45–46syntax of, 43–45two-way lookups, 46
structured references, 294–295Subject to the Constraints list (Solver Parameters dialog
box), 821subjectively determined demand, 1005–1010
equation for, 1005example of, 1006–1008problems for, 1006–1008, 1009–1010
SUBSTITUTE function, 55, 61Subtotal dialog box, 577–581SUBTOTAL function, 582–583subtotals, 577–583
hiding in PivotTables, 501–502need for, 577nesting, 580–581problems for, 583revenue and units sold by region, 577–580
sales by each salesperson, 580–581with Subtotal command, 577–581with SUBTOTAL function, 582–583
Subtract option (Paste Special), 162subtraction, with Paste Special command, 162Suggestion1 worksheet, 1021, 1027SUM function, 3, 137, 242, 573, 578, 871, 891, 897sum of squared errors (SSE), 670, 685SUMIF function, 218
copying across columns, 297examples of, 218–220syntax of, 218
Sumifrows.xlsx file, 222SUMIFS function, 449, 480Sumindirect.xlsx file, 240summaries of workbooks, 244–245summarizing data
3D maps as 2D charts, 654database statistical functions, 429–439
criteria ranges for, 434–435examples of, 431–437overview of, 429–431problems for, 431–437
descriptive statistics, 377–395boxplots, 389–393comparing data sets with, 384–385geometric mean, 388–389kurtosis, 381mean and standard deviation, 379, 382–384mode, 380–381outliers, conditional formatting for, 383–384overview of, 377–378percentile rankings, 385–386problems for, 393–395range, 381–382, 388ranking numbers in, 387sample standard deviation, 381–382sample variance, 381–382second-largest or second-smallest numbers,
386–387skewness measure, 381trimmed mean, 387–388typical value for data set, 378–381
histogramscomparing, 373–374creating, 363–371multiple-peak, 372–373overview of, 363problems for, 376
Z01_Winston_Index_p1067-1138.indd 1120 28/10/21 8:12 PM
tables
1121
skewed left (negatively skewed), 372skewed right (positively skewed), 371–372symmetric, 371
PivotTables, 485–489sales by month, 528–529total sales to date, 526–527
relationships, 695Summary Below Data option, 579Summary button (Scenario Manager dialog box), 205Summary worksheet, 244sum-of-years’ digits depreciation (SYD), 109–110SUMPRODUCT function, 443, 454–457, 814–815, 826, 832sunburst charts, 635–638Sundays, returning date of most recent, 78–80Super Bowl outcomes, Z-scores for, 787–788Superbowlspreads.xlsx file, 787–788suppliers, cost paid to, 2–5Suppliers.xlsx file, 314supply constraints, 832supply points, 831surplus, consumer, 1012SWITCH function, 140–141Switch Row/Column chart option, 995Switchfinal.xlsx file, 141SYD (sum-of-years’ digits depreciation), 109–110SYD function, 109–110symbols, in named ranges, 23symmetric histograms, 371Syrstad, Tracy, 1031
TTable Design tab, 210, 284–287Table Import Wizard, 554–556table of contents, creating with INDIRECT, 247–248table_range argument (VLOOKUP function), 25Tableexampletemp.xlsx file, 283–284Tableexample.xlsx file, 298Tablemakeuptemp.xlsx file, 289, 299Tablemakeuptotals.xlsx file, 291, 292Tablepie.xlsx file, 299tables, 283–299
appending, 338–340conditional formatting in, 295–298contingency, 757creating from flat files, 328–329creating line graphs from, 287–289design options for, 283–287filtering, 289–292
flattening, 327–328lookup functions
computing tax rates with, 27–29definition of, 25looking up prices from product ID codes with,
29–30mismatches between text and numbers in, 34problems for, 35–37syntax of, 25–27wildcard characters with, 31
PivotTablesage/gender travel expenditure example, 505–509blank rows in, 501–502calculated items in, 519–522chip microchip from different countries/regions,
512–515conditional formatting in, 502–504creating, 529–533, 542–543, 544–546default settings for, 533design options for, 491drilling down, 522dynamic array functions compared to, 535–536editing, 509fields, 487–488, 491–499, 515–517GETPIVOTDATA function, 523–525grouping items in, 518–519hiding subtotals in, 501–502layouts, 489–490modifying empty cells in, 501–502origins of name, 491overview of, 483–485PivotCharts, 498–499PivotTable and PivotChart Wizard, 529–531problems for, 536–540Reports Filter, 499–500, 532–533slicers, 500–501station wagon ownership by family size and salary,
509–512summarizing Bitcoin prices and returns with,
533–535summarizing grocery sales with, 485–489summarizing sales by month with, 528–529summarizing total sales to date with, 526–527Timeline feature, 525–526updating calculations in, 504
sensitivity analysis with, 183–195advanced sensitivity analysis, 1063–1065break-even year analysis, 189–191creating charts from, 191–192
Z01_Winston_Index_p1067-1138.indd 1121 28/10/21 8:12 PM
1122
tables
mortgage payment analysis, 188–189one-way data tables, 184, 185–186overview of, 183–184problems for, 192–195profit-maximizing price analysis, 184–188spider plots, 1063–1065two-way data tables, 184
structured references in, 294–295table slicers, 292–294table specifiers, 295
Tablestructure.xlsx file, 294Tablexnpvdata.xlsx file, 299Taleb, Nassim Nicholas, 798target cells, 826target cells, in optimization models
bank workforce scheduling problem, 826optimization problems for, 808product-mix problem, 815software project selection problem, 838transportation problem, 831
tariff, two-part, 1012tax rates, computing with VLOOKUP function, 27–29Teachers.xlsx file, 1028teaching evaluation scores, bar graph of, 60–61team wins/losses, sparklines for, 662–663Teams.xlsx file, 376temperature data, conditional formatting of, 253–255Temperature2020.xlsx file, 253templates
queueing, 989–991storing charts as, 620–621, 923
terminology, for Microsoft Excel Solver, 811Terrain data type, 347–348testing, for nonlinearities and interactions, 719–720Test.xlsx file, 278text (TXT) files, importing data from, 315–320
problems for, 320Text Import Wizard, 315–320
Text Encoding option (File Conversion), 316TEXT function, 54, 80, 81, 622–623text functions, 51–69
& (ampersand), 54CHAR, 54, 61CLEAN, 55, 61CONCATENATE, 54, 57FIND, 53, 57–58, 59, 61Flash Fill, 62–64LEFT, 53, 56, 57–58, 59LEN, 53, 56, 59
LOWER, 54MID, 53, 57, 59overview of, 51–52problems for, 67–68PROPER, 54REPLACE, 54REPT, 54, 61RIGHT, 53, 59SEARCH, 53–54SUBSTITUTE, 55, 61syntax of, 52–56TEXT, 54, 80, 81, 622–623TEXTJOIN, 54, 64–69TRIM, 53, 56, 57UNICHAR, 61, 65UNICODE, 61, 65Unicode characters in, 64–65UPPER, 54VALUE, 54, 57, 61
Text Import Wizardimporting files with, 315–320problems, 320
text stringsconverting to times, 152extracting product ID, price, and product description
from, 56–58matching with MATCH function, 43–50
investment payback period, 47–48MLB player salaries, returning, 46–47problems for, 49–50product sales per month, 45–46syntax of, 43–45two-way lookups, 46wildcard characters with, 44
Text That Contains dialog box, 254Textandnumbers.xlsx file, 34Textfunctions.xlsx file, 52TEXTJOIN function, 54, 61–65Textjoinfinal.xlsx file, 65text/number mismatches, 34Textstylesdata.xlsx file, 69thermometer charts, 620–621, 923Thorpe, Edward, 139–140Three-Color heat maps, 645three-dimensional formulas
multiple-worksheet workbookshyperlinks in, 167–169navigating between, 167–169setting up, 165–167
Z01_Winston_Index_p1067-1138.indd 1122 28/10/21 8:12 PM
1123
trading data, importing
Threetimes.xlsx file, 280tie-ins, pricing products with, 999–1003tilde (~), 31TIME function, 152time functions
HOUR, 152MINUTE, 152NOW, 151SECOND, 152TIME, 152TIMEVALUE, 152TODAY, 151
time seriesbase of, 859characteristics of, 859–860forecasting future values of, 859forecasting in presence of special events, 869–876
factors influencing customer traffic, 869–872forecast accuracy, 872–876overview of, 869problems for, 876random errors in, 876
moving averages, 745–747four-period moving average, 745–746moving-average graphs, 745–746ratio-to-moving-average forecasting method for,
749–752seasonal indexes
in forecasting of future product sales, 750–752interpretation of, 749–750Toys “R” Us example, 715–718Walmart example, 749–750
seasonality of, 860smoothing, Winters method of
equations for, 860–861Forecast Sheet tool, 863–866initialization of, 861level of series, 860–861overview of, 859problems for, 867seasonal index for current month, 860–861smoothing constants, estimation of, 862–863
trend of, 860–861Timeline feature, PivotTables, 525–526times, 149–155
computations with, 150–151converting text strings to, 152creating, 152data validation of, 481
displaying current, 151entering, 150entering sequences of, 153–154extracting hour/minute/second from, 152formats for, 150, 151length of time worked by employees, calculating,
152–153, 312–313problems for, 155regularly spaced time intervals, creating, 153–154serial numbers assigned to, 149static, 154–155
time-series data, moving averages of, 745–747four-period moving average, 745–746moving-average graphs, 745–746
Timeseries.xlsx file, 603TIMEVALUE function, 152Time.xlsx file, 151titles, of straight-line relationship charts, 669TODAY function, 76, 79, 151Tolerance settings. See Integer Optimality settingsTop 10 Filter dialog box, 496–497, 1047Top 10 Items dialog box, 1016Top5.xlsx file, 280Top20.xlsx file, 657Top/Bottom conditional formatting, 253–255Top/Bottom Rules, 252total probability, law of, 757Total Wages worksheet, 454–457totals
subtotals, 577–583need for, 577nesting, 580–581problems for, 583revenue and units sold by region, 577–580sales by each salesperson, 580–581with Subtotal command, 577–581with SUBTOTAL function, 582–583
total salesextracting East, North, and South sales from,
58–60named ranges for, 17–18summarizing with PivotTables, 526–527
Toys “R” Us, seasonal indexes in, 715–718Toysrusformat.xlsx file, 278Toysrus.xlsx file, 222Trace Dependents feature, 174–177Trace Error option, 174Trace Precedents feature, 174–175, 177–178trading data, importing, 799–801
Z01_Winston_Index_p1067-1138.indd 1123 28/10/21 8:12 PM
Transactiondata.xlsx file
1124
Transactiondata.xlsx file, 237transactions, filtering. See filteringTransform Data button, 324transportation problems, 831–836
definition of, 831demand constraint, 832demand points, 831drug-distribution example, 831–834problems for, 834–836specifications for, 831supply constraints, 832supply points, 831
Transport.xlsx file, 831–832TRANSPOSE function, 444Transpose option, Paste Special dialog box, 159–160transposing rows/columns, 159–160, 444travel expenditures, age/gender breakdown of, 505–509Traveldatatemp.xlsx file, 505traveling salesperson problem (TSP)
definition of, 895, 896–898examples of, 895–896problems for, 898–899
treemap charts, 635–638Treemapbookstoretemp.xlsx file, 636trend curve, 860
exponential growth, 678–679in forecasting of future product sales, 750–752power curve, 686–687straight-line relationships, 665
TREND function, 714–715Trendandseasonality.xlsx file, 1028trendlines
creating, 668estimating demand with, 1005–1010Format Trendline options, 666–667intercept of, 751linear
creating, 667–670labeling, 669
overview of, 665–670slope of, 751
TRIM function, 53, 56, 57TRIMMEAN function, 388Trimmean.xlsx file, 386, 388trimmed mean, 387–388troubleshooting. See errorsTSP. See traveling salesperson problem (TSP)Tufte, Edward, 659
two-bin policy. See reorder-point policytwo-part tariff, 1012, 1014two-way analysis of variance (ANOVA), 733–743
forecasting with, 736–737, 740–742overview of, 733–734problems for, 742–743with replication, 737–742without replication, 734–736
two-way data tables. See also sensitivity analysis, What-If Analysis, 184
two-way lookupswith MATCH function, 46with XLOOKUP, 48–49
Type the Cell Reference option (Insert Hyperlink dialog box), 167
Uuncertain demand, inventory modeling with, 979–985
lost-sales approach, 980–981overview of, 979–980service-level approach, 982–985
uncertainty. See also random variablesbootstrapping approach to, 925–935
asset-allocation modeling, 929–934problems for, 934–935stock price simulation, 926–929
inventory modeling with uncertain demand, 979–985lost-sales approach, 980–981overview of, 979–980service-level approach, 982–985
Monte Carlo simulation, 907–91795 percent confidence interval for mean profit,
914corporate use of, 907–908as decision-making tool, 911–914discrete random variables, 909–910greeting-card case study, 911–914history of, 907normal random variables, 910–911problems for, 916–917RAND function, 908–909RANDARRAY function, 914–915random sample generation, 916
optimal bids, calculating, 919–923bidding simulation model, 920–922binomial random variables, 919–920normal random variables, 920problems for, 922
underscore (_), 23
Z01_Winston_Index_p1067-1138.indd 1124 28/10/21 8:12 PM
1125
variables, random
Unemployment.xlsx file, 376Unfreeze Panes command (Freeze Panes menu), 128Unhide Columns command, 189Unhide Rows command, 189UNICHAR, 61, 65UNICODE, 61, 65Unicode characters, 64–65uniform random variables, 923UNIQUE function, 461–464unique IRRs (internal rates of return), 95Unique.xlsx file, 462unit sales
filtering tables on, 289–292subtotals by region, 577–580
universities, in Excel formulas, 351Universities data type, 351unlocking formulas, 961–963Unpivot Columns command (Transform tab), 327–328up blocks, 662UPPER function, 54uppercase, sorting on, 408–409US city population data, importing into Excel, 323–327US presidential elections, predictions for, 710–714US T-bill interest rates, 160–162USC.xlsx file, 794Use a Formula option (New Formatting Rule dialog box),
270–271Use a Formula to Determine Which Cells to Format
option, 873, 892–893Use Automatic Scaling option, 848Use Function menu commands, 1–2Use Multistart option (Solver), 984Use Relative References option, 1039USfilledmapstemp.xlsx file, 646
VValentine.xlsx file, 911, 914validating data, 473–482
AutoComplete feature, 481clearing data validation, 481custom, 476–477dates, 475–476error alerts, 474–475Go To Special dialog box, 481length of text in cell, 481minimum/maximum criteria, 473–475nested/dependent drop-down menus, 478–480nonnumeric values, 476–478
numeric values, 476–477problems for, 481–482state abbreviations, 477–478time of day, 481in versions prior to Excel 2010, 481
#VALUE error, 61–62Value Field Settings dialog box, 506, 508, 514, 559VALUE function, 54, 57, 61Values option, Paste Special dialog box, 158Van Exel, Nick, 316variability, in queueing theory, 988–989variables, 726
alpha, 904beta, 901, 904–906
determining probabilities with, 904–905problems for, 906
discrete random, 909–910dummy, 706lagged independent, 708lognormal random, 956normal random, 910–911, 920qualitative, 705quantitative independent, 705Weibull, 901–904
variables, business. See business variablesvariables, random, 763–767
binomial, 919–920BINOM.DIST function, 770–772BINOM.DIST.RANGE function, 770–772BINOM.INV function, 773computing binomial probabilities with, 770–773definition of, 770negative, 774–775problems for, 775–776
continuous, 765definition of, 763discrete, 763–764exponential
computing probabilities for, 779–780problems for, 780
hypergeometricbinomial, 775–776definition of, 773–774
independent, 766lognormal, 795–798
definition of, 795LOGNORM.DIST function, 797–798LOGNORM.INV function, 798mean, 795
Z01_Winston_Index_p1067-1138.indd 1125 28/10/21 8:12 PM
1126
variables, random
modeling future prices of stock as, 796–797problems for, 798standard deviation, 795stock prices following, 796
mean, 764–765negative binomial, 774–776normal, 781–790
CLT (central limit theorem), 786–787, 796computing probabilities for, 784–785finding percentiles for, 785–786mean, 786NORM.DIST function, 784–785NORM.INV function, 785–786, 787PDF (probability density function), 782–784problems for, 789–790properties of, 781–784standard deviation, 786variance, 786Z-scores, 787–788
PDF (probability density function), 765–766, 782–784Poisson, 777–778
computing probabilities for, 778definition of, 777POISSON.DIST function, 778problems for, 777
problems for, 767standard deviation, 764–765variance, 764–765
variance, 381–382, 764–765, 786. See also analysis of vari-ance (ANOVA)
Varianceanalysis.xlsx file, 278VAR.S function, 382VBA (Visual Basic for Applications), 1031Verizondata.xlsx file, 236Verizonindirectdata.xlsx file, 249Verizon.xlsx file, 237vertical lines, adding to charts, 628–629View Side by Side command (Window group), 572View tab, Freeze Panes option, 127–128Village Deli case study, 773Visual Basic for Applications (VBA), 1031VLOOKUP function, 134, 244, 312, 313, 751, 871, 927, 941,
943, 949avoiding use of, 542computing tax rates with, 27–29#N/A errors, 134–136nonlinear pricing plan, 1014syntax of, 25–26wildcard characters with, 31
volatilityhistorical, 956–957implied, 796of stock, 955, 956–957, 960
Volatility.xlsx file, 965Volume-High-Low-Close chart option, 640Volume-Open-High-Low-Close chart option, 641
Wwage*hours function, 22wages
hourly, 442–444total salary per day, 22weekly, 1–2
Wagestemp.xlsx file, 1–2wait time. See queueing theorywaiting in line. See queueing theoryWalmart
ratio-to-moving-average forecasting method for, 750–752
seasonal indexes in, 749–750summarizing annual revenues for, 136–137Walmartdata.xlsx file, 752
Walmartdata.xlsx file, 752Walmartrev.xlsx file, 136Watch Window feature, 174waterfall charts, 633–635Waterfallcashtemp.xlsx file, 634Waterfallpandltemp.xlsx file, 633weather data, in Excel formulas, 357–359week of year, 80WEEKDAY function, 78, 272, 482weekend dates, color coding of, 272–273
of basketball players’ abilities, 274–275Weekendformatting.xlsx file, 278weekly changes in sales, macro for, 1041–1044weekly wages, worksheet model for, 1–2WEEKNUM function, 80WEEKNUM.xlsx file, 80Weibull random variable, 901–904WEIBULL.DIST function, 901–904WEIBULLDIST function, 904Weibullest.xlsx file, 901Weirddata.xlsx file, 69Westinghouse Corporation, 973West.xlsx file, 571, 575What-If Analysis. See data tables, sensitivity analysis with;
Goal Seek
Z01_Winston_Index_p1067-1138.indd 1126 28/10/21 8:12 PM
1127
worksheets
wildcard characters, 31, 44willingness to pay, demand curve and, 997Win Loss worksheet, 662Window group commands, 572Win/Loss option (Sparkline Tools Design), 661win/loss sparklines, 662–663Winters, Peter, 859Winters method
equations for, 860–861Forecast Sheet tool, 863–866initialization of, 861level of series, 860–861overview of, 859problems for, 867seasonal index for current month, 860–861smoothing constants, estimation of, 862–863time series characteristics, 859–860trend of series, 860–861
wizardsConvert Text to Columns Wizard, 59–60Function Wizard, 135PivotTable and PivotChart Wizard, 529–531Table Import Wizard, 554–556Text Import Wizard
importing files with, 315–320problems for for, 320
WKRP radio station, counting songs onblank cells in ranges, 214function syntax for, 209–211nonblank cells in ranges, 214songs longer than average length, 212songs not sung by a particular singer, 212songs of minimum length, 212songs of specific length, 213songs of specific length by specific singer, 213songs played after a certain date, 213songs played before a certain date, 213songs sung by a particular singer, 211songs sung by singers whose last names being with a
certain letter, 212songs sung by singers whose last names contain x
letters, 213Workbook Analysis button (Inquire add-in), 181Workbook Relationship button (Inquire add-in), 181workbooks. See also individual workbooks
analyzing relationships between, 181analyzing structure of, 181comparing, 180
consolidating data inwith Consolidate command, 571–575need for, 571
hyperlinks in, 181multiple-worksheet
changing number of worksheets in, 166hyperlinks in, 167–169navigating between, 167–169number of worksheets in, 166problems for, 169setting up, 165–167
opening new, 166scope, 18–19
WORKDAY function, 76–77WORKDAY.INTL function, 77workdays
determining date that is x workdays after another date, 76–77
determining number of workdays between two dates, 78workforce. See employeesworkgroups, assigning employees to, 890–892Worksheet Analysis Report dialog box, 181worksheet models
cost paid to supplier, 2–5customer estimation, 5–6demand curve, 7–8employee weekly wages, 1–2order of operations in, 6–7problems for, 9total salary per day, 22
Worksheet Relationship button (Inquire add-in), 181worksheet scope, for named ranges, 18–19Worksheetnames.xlsm file, 245worksheets. See also individual worksheets
analyzing relationships between, 181auditing options for, 171–182
Error Checking, 173–174Inquire add-in, 179–182multiple worksheets, 178–179Remove Arrows, 175, 177Show Formulas, 172Trace Dependents, 174–177Trace Precedents, 174–175, 177–178viewing, 172Watch Window, 174
dates. See dateshyperlinks in, 167–169, 181inserting into workbooks, 165–167listing, 245–247
Z01_Winston_Index_p1067-1138.indd 1127 28/10/21 8:12 PM
1128
worksheets
multiple-worksheet workbookshyperlinks in, 167–169navigating between, 167–169problems for, 169setting up, 165–167
navigating between, 167–169number of, 166Paste Special Divide Before, 160–161Paste Special Transpose, 159Paste Special Value, 157viewing side by side, 572
World option (Map Projection menu), 645Worldball.xlsx file, 857worst-case scenario, for automobile sale, 203–208
XXIRR function, 93–94XLOOKUP function
examples of, 31–34syntax of, 26–27two-way lookups, 48–49wildcard characters with, 31
XLOOKUP.xlsx file, 31.xlsx extension, 320XNPV function, 88–90
Yyears
extracting from dates, 78leap years, 74recovering, 78
Yeartodate.xlsx file, 237Yoga data type, 352–353
ZZ-scores, 787–788
Z01_Winston_Index_p1067-1138.indd 1128 28/10/21 6:31 PM


