Embed Size (px)
Citation preview

ISDN 1039-3218
Microzooplankton Grazing onPhytoplankton in Port Phillip Bay
Gillian Beattie1, Anna Redden2 and Rick Royle2,Department of Ecology and Evolutionary Biology1 and
Water Studies Centre2, Monash University
Technical Report No.31
Port Phillip Bay Environmental StudyCSIRO Environmental Projects Office
Canberra, ACT, Australia
GPO Box 1666, Canberra, ACT 2602, Australia
December 1997

i
EXECUTIVE SUMMARY
The primary objective of this study was to estimate microzooplankton grazing impacton phytoplankton in Port Phillip Bay. The study was conducted over the periodOctober 1994 to September 1995 and included monthly investigations usingexperimental water collected from mid-depth at four coastal and two midbay sites.The Dilution Method was employed to estimate grazing rates under laboratoryconditions. Estimates of phytoplankton growth rate were also determined from thesame experiments but interpretation of growth rates in this study is somewhat limiteddue to the use of an artificial light:dark cycle and the addition of dissolved inorganicnitrogen to incubated seawater samples. Estimates of phytoplankton growth withoutnutrient addition were determined using control bottles.
Seasonal patterns in total phytoplankton growth were apparent for all stations, withgrowth rates being highest during spring and summer and lowest during winter, forboth nutrient enhanced and nonspiked treatments. Phytoplankton growth rates of thepico, nano and micro fractions were positively correlated with temperature wheninorganic nitrogen was added. Without additional nutrients, only the pico fractiongrowth rates showed a positive relationship with temperature. Nonspiked growthrates of the nano and micro fractions were low during summer; relatively highersummer growth rates exhibited by the pico fraction indicate that they were better ableto utilise available and regenerated pools of dissolved inorganic nitrogen at hightemperatures and low ambient nitrogen concentrations.
Nutrient enhanced growth rate estimates were very similar to rates determined withoutadditional nitrogen during the autumn and winter months, when ambient NH4 levelswere relatively high (0.4-1 µM). Because ambient nutrient levels appeared to be lesslimiting for microalgal growth during autumn and winter, estimates determined forthis period may be good approximations of in situ growth rates.
Seasonal trends in grazing rate were apparent all sites, except Sandringham, withmaximum grazing rates in summer (mean = 0.51 d-1) and with low grazing impact inwinter (mean = 0.13 d-1). At most sites, grazing rates on the total phytoplanktonpopulation tended to mirror total chlorophyll a growth rates, with high grazing ratesobserved during peaks in chlorophyll a growth, and with reduced grazing rates whenchlorophyll a growth rates were low.
The grazing coefficients tended to be higher for the pico and nano fractions than forthe microphytoplankton suggesting that the microzooplankton grazers in Port PhillipBay are most important in regulating phytoplankton cells <20 µm. Low butsignificant levels of grazing on the micro fraction were shown at some stations insummer, however, in 75% of experiments conducted during this study, estimates ofgrazing rate on the micro fraction were not significantly different from zero (p<0.05).
Though estimates of grazing impact determined in this study show much temporal andspatial variability, general seasonal trends suggest that, over all sites, the mean grazingimpact on the initial phytoplankton standing stock was approximately 16% in spring,38% in summer, 18% in autumn and 11% in winter.

ii
Baywide estimates of grazing impact on potential production during summer averaged48% when nitrogen was added and 82% when phytoplankton growth was notenhanced by nutrient addition. Mean estimates of grazing impact on algal productionduring autumn, winter and spring were in the range of 23-48% (nitrogen enhanced)and 47-64% (nonspiked) of daily production.
The grazing rates estimated in this study include the grazing impact ofmicrozooplankters and some mesozooplankters and are thus more representative ofthe broader zooplankton community in Port Phillip Bay. Other mesozooplanktonwhich may contribute greatly to the grazing impact in the Bay, and whose impactsneed to be assessed, are the larvacean, Oikopleura dioica, and the polyphagousdinoflagellate, Noctiluca scintillans, a relatively new resident of Port Phillip Baywaters.
Overall, it appears that the microzooplankton are currently very important incontrolling the phytoplankton population in Port Phillip Bay. Although an increase inmicroalgal growth rates, resulting from potentially larger inputs of nutrients to theBay, could decrease the grazing impact of current concentrations of micrograzers, it isalso possible that greater phytoplankton production may result in increases in the sizeof the zooplankton population in Port Phillip Bay.

iii
TABLE OF CONTENTS
Page No.
Executive Summary....................................................................................................2
Table of Contents........................................................................................................4
List of Tables...............................................................................................................6
List of Figures.............................................................................................................7
List of Appendices.......................................................................................................9
1. INTRODUCTIO N..............................................................................................10
1.1. Importance of Microzooplankton.........................................................................10
1.2. Overall Aims of the Study....................................................................................10
1.3. Study Sites............................................................................................................11
2. METHOD S.........................................................................................................13
2.1. The Dilution Technique.......................................................................................13
2.2. Field Collections..................................................................................................13
2.3. Experimental Set-up.............................................................................................15
2.4. Sample Collection and Analysis..........................................................................16
3. RESULTS...........................................................................................................18
3.1. Initial Conditions : Temperature and Nitrogen Concentration.............................18
3.2. Initial Chlorophyll Concentrations and Algal Cell Densities...............................18
3.3. Phytoplankton Composition.................................................................................20
3.4. Algal Cell Growth Response to Added Nitrogen.................................................20
3.5. Net NH4 Consumption and Chlorophyll Production............................................24
3.6. Chlorophyll Growth Rates vs Temperature.........................................................24
3.7. Zooplankton Taxa and Abundance......................................................................273.7.1. Taxonomic composition.........................................................................................................273.7.2. Zooplankton abundance.........................................................................................................27

iv
3.8. Spatial and Temporal Variation in Grazing and Growth Rates........................... 303.8.1. Chlorophyll a growth rates for coastal and midbay sites.........................................................303.8.2. Grazing rates for coastal and midbay sites..............................................................................333.8.3. Limitations of the size fraction data........................................................................................333.8.4. Total population: site-specific grazing and growth rates.........................................................333.8.5. Size fractions: site-specific grazing and growth rates..............................................................37
3.9. Grazing Impact..................................................................................................... 413.9.1. Growth vs grazing for nitrogen-spiked and nonspiked treatments ..........................................413.9.2. Seasonal and annual estimates of grazing impact....................................................................41
4. DISCUSSION ..................................................................................................... 46
4.1. The dilution method and its use in oligotrophic waters....................................... 46
4.2. Interpretation of phytoplankton growth data........................................................ 47
4.3. Phytoplankton growth responses to temperature and NH4 addition..................... 48
4.4. Grazing rates........................................................................................................ 49
4.5. Total grazing impact ............................................................................................ 50
4.6. Other potentially important grazers...................................................................... 51
5. ACKNOWLEDGMENT S................................................................................. 52
6. REFERENCES................................................................................................... 52

v
LIST OF TABLES
Table 1. Station locations, total depth at each site and approximate depth from whichseawater samples were collected.
Table 2. Grazing experiments which included control bottles (NH4 not added).
Table 3. Cell shapes and representative equations used to calculate biovolume ofphytoplankton cells.
Table 4. Summary of the dominant phytoplankton species (cells >2 µM) by season.
Table 5. Percent change in chlorophyll a content per cell (nano plus micro fractions)by sampling location.
Table 6. Percent change in chlorophyll a content per cell (nano plus micro fractions)by season.
Table 7. Statistical analyses of nitrogen-spiked growth rates and nonspiked growthrates vs temperature for the total phytoplankton population and for each size fraction.
Table 8. List of zooplankton taxa identified from undiluted seawater samples (6-10L) in grazing experiments conducted during October 1994 - September 1995.
Table 9. Summary of grazer densities (#/L) in the undiluted experimental bottles.
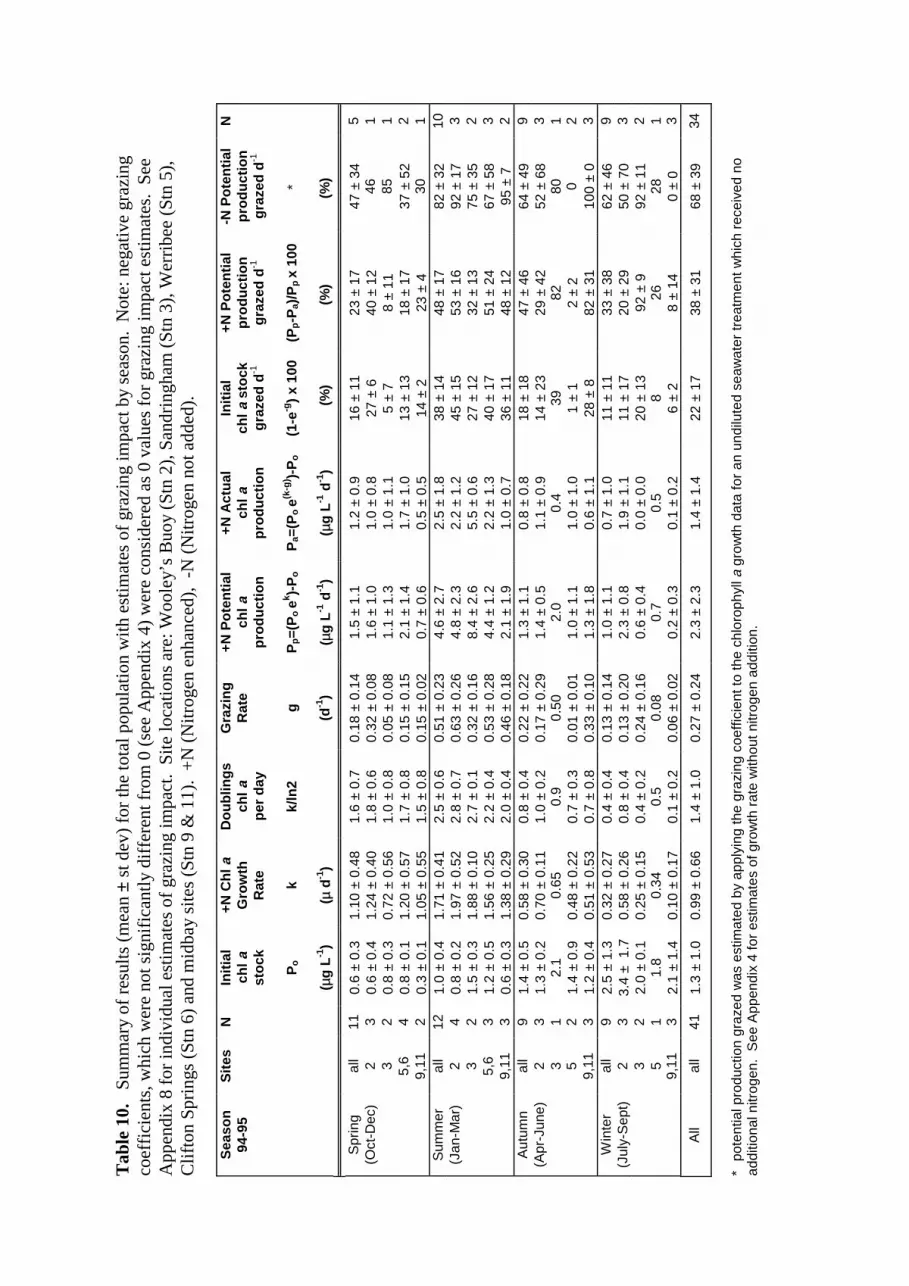
Table 10. Summary table of results (mean ± st dev) with estimates of grazing impacton the total phytoplankton population by season and by location.
Table 11. A comparison of the published growth rates (k) and microzooplanktongrazing rates (g) determined using the dilution technique.

vi
LIST OF FIGURES
Figure 1. Map showing the locations of the six sampling sites in Port Phillip Bay,Melbourne, Australia.
Figure 2. Examples of dilution method plots for estimating chlorophyll a growth rateand microzooplankton grazing rate
Figure 3. Plots of a) ambient water temperature and b) initial NH4 concentration inseawater collected from mid-depth at all sites sampled during the study period.
Figure 4. Initial concentrations of chlorophyll a (µg L-1) and algal cells (# L-1) priorto incubation.
Figure 5. Phytoplankton cell growth in nitrogen-spiked, undiluted seawatertreatments.
Figure 6. Net changes in NH4 and chlorophyll a concentrations in nitrogen-spikedundiluted seawater and the effects of water temperature and initial levels of NH4 andchlorophyll a.
Figure 7. Relationship between temperature and chlorophyll a growth rates for the a)total phytoplankton population, b) pico fraction, c) nano fraction and d) microfraction.
Figure 8. Coastal and midbay chlorophyll a growth rate estimates, with nitrogenaddition (a-d) and without nitrogen addition (e-f), for the total population and foreach fraction, from October 1994 until mid-September 1995.
Figure 9. Microzooplankton grazing rates for the a) total phytoplankton population,
b) pico fraction, c) nano fraction and d) micro fraction, from coastal and midbay sitesfrom October 1994 until mid-September 1995.
Figure 10. Mean standard error and standard deviation of the mean for a) chlorophylla growth rates (nitrogen-spiked) and b) microzooplankton grazing rates, for each sizefraction and for the total phytoplankton population.
Figure 11. Microzooplankton grazing rates and chlorophyll a growth rates for thetotal phytoplankton population, at sites sampled from October 1994 until mid-September 1995.
Figure 12. Microzooplankton grazing rates and chlorophyll a growth rates for thepico-phytoplankton fraction, at sites sampled from October 1994 until mid-September1995.

vii
Figure 13. Microzooplankton grazing rates and chlorophyll a growth rates for thenano-phytoplankton fraction, at sites sampled from October 1994 until mid-September1995.
Figure 14. Microzooplankton grazing rates and chlorophyll a growth rates for themicro-phytoplankton fraction, at sites sampled from October 1994 until mid-September 1995.
Figure 15. Plots of chlorophyll a growth rate versus microzooplankton grazing rate,for the total phytoplankton population and for each fraction.

viii
LIST OF APPENDICES
Appendix 1. Summary of the sample collection dates, water temperature (in situ andincubation), initial NH4 levels and initial chlorophyll a concentrations.
Appendix 2. Phytoplankton cell concentration and cell volume (cells >2 µm) inundiluted, unfractionated samples before and after 24 hr incubation with 1-3 µMinorganic nitrogen.
Appendix 3. Dominant phytoplankton species (<2 µm) and cell concentrations inundiluted experimental bottles before and after 24 hr incubation with 1-3 µMinorganic nitrogen.
Appendix 4. Total phytoplankton population grazing and chl a growth coefficientsdetermined using the Dilution Method with and without nitrogen addition.
Appendix 5. Picophytoplankton fraction (0.2-2 µm) grazing and chl a growthcoefficients determined using the Dilution Method with and without nitrogen addition.
Appendix 6. Nanophytoplankton fraction (2-20 µm) grazing and chl a growthcoefficients determined using the Dilution Method with and without nitrogen addition.
Appendix 7. Microphytoplankton fraction (<20 µm) grazing and chl a growthcoefficients determined using the Dilution Method with and without nitrogen addition.
Appendix 8. Chlorophyll a production in bottles incubated with 1-3 µM inorganicnitrogen and estimates of initial stock and potential production grazed for eachexperiment.

1
1. INTRODUCTION
1.1. Importance of MicrozooplanktonGrazing by microzooplankton on phytoplankton is now widely recognised as significant inmost aquatic ecosystems. The microzooplankton comprise abundant and diverse taxa whichgrow rapidly and which feed efficiently on cells primarily <20 µm (Gifford 1985, Verity1985). They include consumers of both phytoplankton and bacterial production and, becauseof their abundance, contribute significantly to trophic flux and nutrient cycling (Sherr andSherr 1984, Porter et al. 1985, Fenchel 1988). These small grazers can be effective incontrolling the size of phytoplankton populations (Gifford 1988) and the size structure of thephytoplankton community (Verity 1986) and may also control, by selective predation,phytoplankton species composition (Burkill et al. 1987, Paranjape 1990). Pierce and Turner(1992) suggest that it is likely that the relative importance of the microzooplankton vs netzooplankton shifts seasonally as well as spatially with shifts in phytoplankton size structure.
The planktonic food web interactions and the role of microzooplankton in Port Phillip Bayhas not been well understood. Earlier zooplankton studies, which are reviewed in Crawfordet al. (1992) and Holloway and Jenkins (1993), provide information on the composition anddistribution of primarily net zooplankton. References to the microzooplankton are few, anddo not include abundances of heterotrophs <50 µm. Overall, the microzooplanktoncommunity has received little attention and its role in regulating the phytoplankton populationin Port Phillip Bay has not been previously examined.
1.2. Overall Aims of the StudyThis study (Task E.10.5) is the first attempt to quantify the impact of communitymicrozooplankton grazing on phytoplankton in Port Phillip Bay. The main objectives of thestudy were:
1. to estimate the microzooplankton grazing impact on phytoplankton on amonthly basis at selected coastal and midbay sites in Port Phillip Bay,
2. to estimate grazing rates on the pico-, nano- and microphytoplankton fractions,and
3. to estimate phytoplankton growth rates, with and without additional inorganicnitrogen, for the total population and for the pico-, nano- andmicrophytoplankton fractions.
Estimates of zooplankton grazing impact determined from this study contribute to theunderstanding of the Bay ecology and to the ongoing development of a model of the physical,chemical and biological processes in Port Phillip Bay.

2
1.3. Study SitesMicrozooplankton grazing experiments were conducted at approximately four weeklyintervals with seawater collected from mid-depth at six sites (four coastal and two midbay) inPort Phillip Bay (Figure 1, Table 1). A total of 41 laboratory grazing experiments wereconducted from October 1994 until September 1995. Grazing rates for Wooley’s Buoy (Stn2) was investigated on a monthly basis; grazing rates for most other sites were examined bi-monthly.
Table 1. Station locations, total depth at each site and approximate depth from whichseawater samples were collected.
Station StationNumber
Location Site depth(m)
Samplingdepth (m)
Wooley's Buoy 2 38.1508 °S, 145.0745 °E 14 7
Werribee 5 37.9876 °S, 144.7153 °E 8.5 4
Sandringham 3 37.9447 °S, 144.9779 °E 10.5 5
Clifton Springs 6 38.1412 °S, 144.5365 °E 11.5 6
midbay NE 9 38.0502 °S, 144.9139 °E 22.5 10
midbay SW 11 38.1548 °S, 144.8278 °E 22.5 10

2a
Figure 1. Map showing the locations of the six sampling sites in Port Phillip Bay,Melbourne, Australia. Seawater for microzooplankton experiments was collectedfrom selected coastal and midbay sites at four weekly intervals from October 1994until mid-September 1995.

3
2. METHODS
2.1. The Dilution TechniqueThe Dilution Technique of Landry and Hassett (1982) was employed to estimate communitymicrozooplankton grazing rates in Port Phillip Bay, as recommended by Holloway andJenkins (1993) in their review of the role of zooplankton feeding in Port Phillip Bay. Thistechnique is the most widely used method for measuring microzooplankton grazing in coastaland open ocean waters (Paranjape 1987, Gifford 1988, Gallegos 1989, Kamiyana 1994, Dagg1995 and others). The main advantages of the dilution technique are that it 1) provides bothgrazing and phytoplankton growth estimates in a single experiment and 2) involves minimalhandling and disruption of phytoplankton and microzooplankton grazers.
The method is based on the exponential growth of phytoplankton (as estimated by chlorophylla concentration) in a series of diluted seawater samples, which reflect grazer density. Thetechnique uses differences in measured net chlorophyll a growth rates at different dilutionlevels to effectively uncouple growth and grazing rates. The net observed rate of growth ateach dilution level is the difference between the instantaneous rate of chlorophyll a growthand mortality due to grazing;
k = ln (Pt/P0)/t = µ - g
where Pt and P0 are the final and initial chlorophyll a concentrations at times t and 0, and kand g are the instantaneous coefficients of growth and grazing, respectively. Grazing andgrowth coefficients are determined from a linear least squares regression analysis betweenapparent growth rate of chlorophyll a and the proportion of undiluted seawater in each bottle.The intercept is k and the slope is g (see Figure 2 for Dilution Method plots). Thesignificance of the regression line is tested at a level of p<0.05 and 95% confidence intervalsare calculated for the coefficients of growth (k) and grazing (g).
In addition to exponential growth, the dilution method also assumes that specificphytoplankton growth rates will be density-independent in a dilution series but that grazingmortality will be dependent on the grazer density, as reduced by dilution. It also assumes thatgrowth of phytoplankton is not limited by available or regenerated nutrients. For oligotrophicwaters, addition of dissolved inorganic nitrogen to experimental seawater is necessary toensure exponential growth during the incubation period.
Other requirements of the method include phytoplankton concentrations in the dilution serieswhich are neither at “threshold” nor at “saturated” feeding levels for the microzooplankton.These and other assumptions, however, may be difficult to test. The advantages anddisadvantages of employing the dilution technique and the assumptions of the method arefurther detailed in Landry (1993).
2.2. Field CollectionsFrom October 1994 to early March 1995, seawater was collected during daylight hours fromapproximately mid-depth using a water pump and polycarbonate tubing from onboard the

3a
Figure 2. Examples of dilution method plots for estimating chlorophyll a growth rateand microzooplankton grazing rate:
a) common plot type: X-axis represents the fraction of unfiltered seawater; Y-axisrepresents apparent growth rate; Y-intercept (k) is the estimate of chlorophyll agrowth rate in the absence of grazers; the negative slope (g) is the estimate of grazingrate.
b) plot in which the slope of the regression is positive; the grazing rate is therefore"negative" suggesting that grazing rate increases as the fraction of unfiltered seawaterand density of grazers, decreases. Such plots were generally found for the microfraction only. In most cases where g<0, g was not significantly different from 0.
c) plot which shows the estimation of chlorophyll a growth rates for nonspikedtreatments. The slope (g) for the NH4 spiked dilution series is applied to the netgrowth rate in the nonspiked undiluted treatment (open square, X=1).
d) plot which shows data from an experiment in which nitrogen was not added to thedilution series. At X= 0.8 and 1.0, nutrient limitation is apparent and grazing exceedsalgal growth. An undiluted seawater treatment spiked with NH4 (solid circle, X=1.0)is included for comparison and shows nutrient limitation in all nonspiked treatments.

4
Marine Science Laboratory's research vessel, the Melita. The seawater from each site wasstored in two acid washed and rinsed 20-L polycarbonate carboys. To maintain near ambientlight and temperature conditions during storage on the Melita, the carboys were housed in alarge seawater-filled tank, fitted with a shadecloth cover (permitting about 30% ambient light)and entry and exit ports to allow for the continuous pumping of surface seawater. From lateMarch through to mid-September, experimental seawater was collected using a 5-L Niskinwater sampler from onboard a Monash University research vessel, stored in carboys andtransported immediately to the laboratory at the Water Studies Centre, Monash University.All experiments were conducted at the Water Studies Centre and were initiated within 12 hrof sample collection.
2.3. Experimental Set-upPrior to each experiment, all incubation bottles (2.4 L, polycarbonate), carboys (20 L,polycarbonate) and other glass and plastic labware were detergent (phosphorus free) washed,acid (10% HCl) washed and thoroughly rinsed with Milli-Q water. Filtered seawater fromeach site was prepared from the contents of one of the two carboys by filtering seawaterthrough an acid-washed and rinsed 0.2 µm, 147 mm diameter membrane filter using an S&Sfiltering system. The filtered seawater was used to dilute the seawater contained in theremaining carboy. The filters were frozen in liquid nitrogen and later extracted for calibrationpurposes.
In order to minimise damage to large phytoplankton cells and fragile protozoan grazers, theexperimental water was not pre-screened through a 200 µm mesh for the elimination of netzooplankton. Experimental water therefore contained some mesozooplankters (eg. copepodsand large heterotrophic dinoflagellates) in the size range of 200-2000 µM.
The dilution series used in each experiment generally comprised treatments of 20, 40, 60, 80and 100% unfiltered seawater. Each 2.4 L incubation bottle was gently filled with waterusing silicone tubing (previously rinsed) which was positioned in the bottom corner of thebottle in order to avoid bubbling and potential damage to phytoplankton cells and grazers. Alldilution levels were run in duplicate and, on occasion, triplicate.
Due to low dissolved inorganic nitrogen conditions which prevail in Port Phillip Bay waters(Longmore et al. 1995), and the need to avoid nutrient limitation during the 24 hr period ofincubation, inorganic nitrogen (either as NO3 or NH4) was added to all incubation bottles,except for those run as controls. The amount added was dependent on initial standing stocksof chlorophyll a and projected requirements for growth. Approximately 1-3 µM NO3 wasadded to experimental bottles in October, 3µM NH4 was added in November and thereafter,all experimental bottles received 1.5 - 2.0 µM NH4 prior to incubation.
In most experiments, a control bottle containing 100% unfiltered seawater and no additionalnitrogen was also incubated (Table 2). The observed growth rate from this bottle was addedto the grazing rate determined for the nitrogen-spiked dilution series in order to estimate thegrowth coefficient for phytoplankton in the absence of additional nutrient (see Figure 2c).
Table 2. Microzooplankton grazing experiments which included control bottles.

5
Station No. Experiments which included control bottles (100% unfiltered seawater, nitrogen not added)
Wooley's Buoy 2 all except October and November 1994
Werribee 5 all except October 1994
Sandringham 3 all except October 1994
Clifton Springs 6 all except October 1994
midbay NE 9 all except January 1994
midbay SW 11 all except October 1994
An additional bottle, containing 100% filtered seawater and additional nitrogen, was alsoincubated and used as a check on the efficiency of filtration and the extent of growth in thepresence of phytoplankton cell contamination.
All bottles were incubated in a water-filled incubator with a clear acrylic base and maintainedat near ambient Bay temperatures by circulating the bath water through a heating/cooling unitset to the in situ temperature. Ten Duro-lite® True-light® 40W fluorescent tubes, locatedapproximately 20 cm below the incubator, were used as a light source for phytoplanktongrowth. A metal mesh fixed to the underside of the acrylic base attenuated the light to 90-100µE m-2 s-1. The bottles were exposed to a 12hr light: 12hr dark regime during September toMarch and to a 10 hr light : 14 hr dark regime during April to late August. Bottle incubationsbegan after local sunset, between 1800 hr and 2300 hr, and continued for 24 hr.
2.4. Sample Collection and AnalysisBefore and after incubation, 20 ml seawater samples were removed from a set of selectedincubation bottles for inorganic nitrogen analysis (NH4, NO2, NO3). Nutrient samples werefiltered through either a Whatman GF/F filter or a 0.2 µm polycarbonate membrane to removeparticles, and then stored in Whirlpak bags at -20 °C. All nitrogen analyses were conductedat the Marine Science Laboratory in Queenscliff.
Water samples for chlorophyll analysis were removed before and after incubation to establishinitial chlorophyll a levels and to estimate phytoplankton growth in incubated treatments.Two samples were removed from each bottle; one sample for the measurement of totalchlorophyll a (>0.2 µm) and one sample which was size-fractioned in order to examinegrowth and grazing rates for the pico (0.2-2 µm), nano (2-20 µm) and micro (>20 µm)fractions. Fractionation was conducted using a three tiered filtration apparatus, 0.2 µm and2.0 µm membrane filters (Poretics) and filters made from 20 µm nylon mesh (Nitex).Following filtration under low vacuum, the filters were immediately frozen in liquid nitrogenfor short-term storage. Chlorophyll a was extracted overnight in 90% acetone at 4°C in thedark and measured in a fluorescence spectrophotometer (Hitachi F-2000). Concentration ofchlorophyll a was calculated using the equations of Jeffrey and Humphrey (1975) andcalibrations were conducted using acetone extracts of algal cells collected on the large 0.2 µmmembrane filters, which were used to prepare filtered seawater.

6
Additional water samples (100 ml) were removed from the 100% unfiltered seawatertreatments, before and after incubation, for microscopic analysis of phytoplankton taxa andcell counts. Samples were preserved using 1% Lugol's Iodine solution followed by 2%buffered formalin (final concentration). Algal cells were identified and enumerated using 25ml settling chambers and inverted light microscopy. Biovolume was determined using themean of three measurements (length, diameter and perpendicular diameter) and assigning ageometric shape to each species (Table 3). Most cells could be estimated using a sphere,ellipse, cone, cylinder or elliptical cylinder. Some cells, with more complex shapes, wereestimated using the sum of the same or different solids.
Table 3. Cell shapes and representative equations used to calculate biovolume ofphytoplankton cells. V= volume, L = length and D = diameter (longest for elliptical solids)and Dp = perpendicular diameter (perpendicular to D).
Algal Cell Shape Equation for Calculating Biovolume
sphere V=3.141 (4/3) (1/2D)3
cylinder V=3.141 [(1/2)D]2 L
cylinder (elliptic) V=(3.141/4) L D Dp
ellipsoid V=(3.141/6) L2 D
cone V=31.41(1/3)[(1/2)D]2 L
Zooplankton taxa were collected from seawater remaining in the incubation bottles followingeach experiment. A PVC cylinder fitted with 20 µm nylon mesh was used to collect grazersfrom the equivalent of 6-10 L of undiluted seawater. The contents were then backwashed into60 ml bottles with filtered seawater and preserved with 2-3% buffered formalin (finalconcentration). Counts of fixed heterotrophic protozoans were conducted using inverted lightmicroscopy; larger grazers were identified and enumerated using stereomicroscopy. Thoughheterotrophs <20 µm are known to dominate the microzooplankton of coastal waters (Beers etal. 1975), their identity was not examined in this study due to the complex preservationtechniques required to adequately preserve all non-loricate ciliates and heterotrophicnanoflagellates (Sherr et al. 1993, review in Pierce and Turner 1992).

7
3. RESULTS
3.1. Initial Conditions : Temperature and Nitrogen ConcentrationAll experimental bottles were incubated at near ambient water temperatures. Figure 3a showsthe range (10-22°C) in monthly temperature observed at mid-depth at sites sampled duringthe 1994-95 study period. Mid-depth water temperatures were generally <15°C during Mayto November and in the range of 18-22°C during December through to late March (seeAppendix 1 for site-specific details).
Initial levels of ammonia, determined for experiments conducted from December 1994 toSeptember 1995, show concentrations of <0.1 - 1 µM NH4 in seawater samples prior toincubation (Figure 3b). NO3 and NO2 levels are not reported as they were always at or neardetection levels. Ammonia concentrations of <0.3 µM were commonly found in watercollected at mid-depth during the summer months (January to March 1995); levels >0.5 µMNH4 were observed in December 1994 and during autumn and winter months (April toAugust 1995). In July 1995, an unusually high NH4 concentration of 20 µM was observed inmid-depth water collected from Wooley’s Buoy. In non-summer months, NH4 levels wereoften spatially variable with coastal stations generally showing higher levels than midbay sites(see Appendix 1).
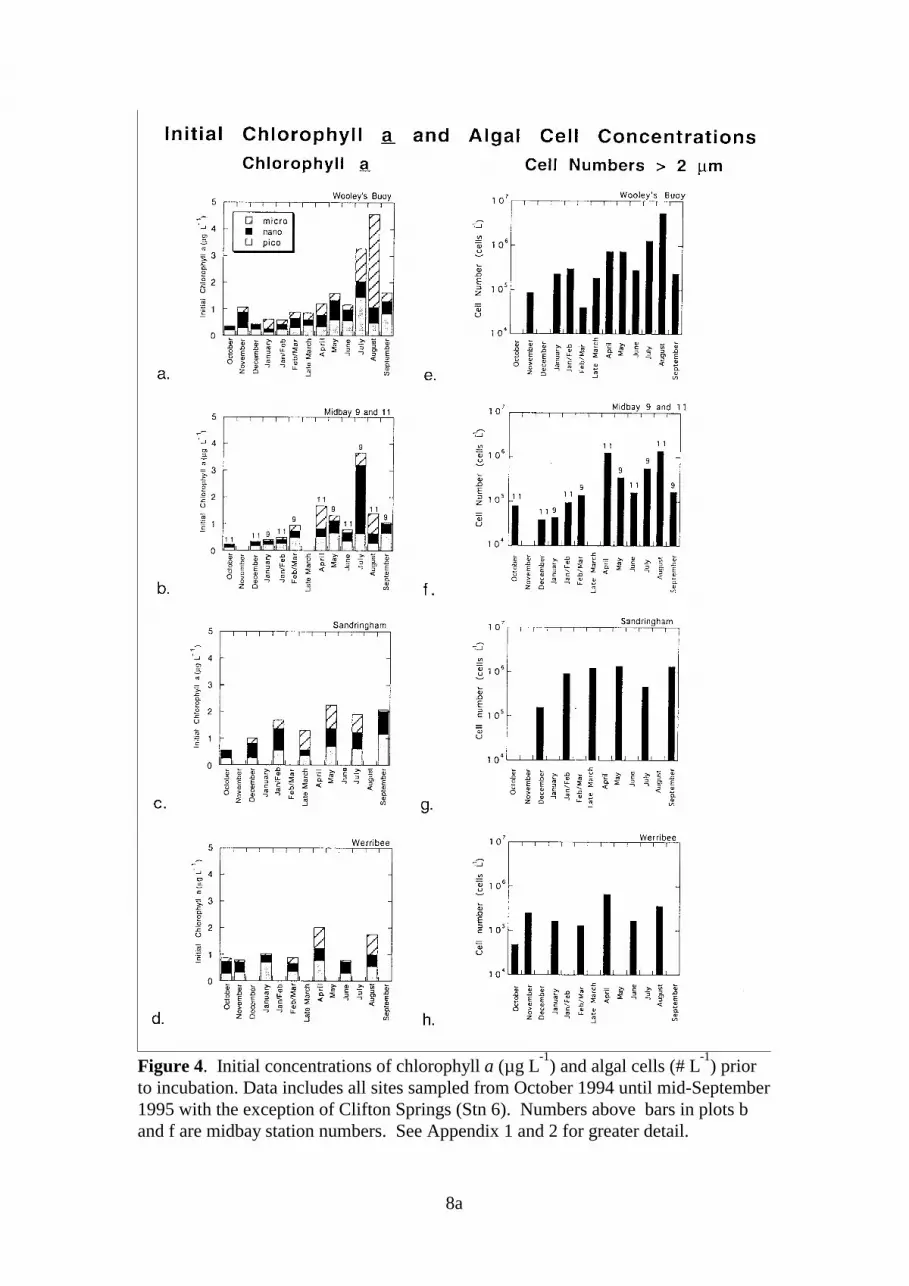
3.2. Initial Chlorophyll Concentrations and Algal Cell DensitiesFigure 4 shows mid-depth chlorophyll a levels (with size fraction composition) andphytoplankton concentrations (cells >2 µM) for all sites with the exception of Clifton Springs(sampled on only three occasions; data included in Appendices 1 and 2).
Chlorophyll a concentrations for the total phytoplankton population were <1 µg L-1 at mostsites during the spring and summer months (October 1994 - late March 1995). Over thisperiod, levels at Sandringham tended to be slightly higher, with observations in the range of0.5-1.5 µg chlorophyll a L-1. Chlorophyll a concentrations were often much higher during theautumn and winter months (April to September 1995) with concentrations at Werribee andSandringham generally about 2 µg chl L-1; Wooley’s Buoy exhibited autumn and winterlevels in the range of 1-5 µg chl L-1 while concentrations at the midbay sites were in the rangeof 1-4 µg chl L-1). Over the sampling period, chlorophyll a concentrations were much morevariable at Wooley’s Buoy and the midbay sites than at Sandringham and Werribee.
During the spring and summer months, levels of chlorophyll a within the micro fraction wereat times very low (<0.1 µg L-1), comprising <20% of the total chlorophyll a. Inorganicnitrogen levels were also low during this period (Figure 3b). Considerably higher levels ofchlorophyll a were found in the micro fraction during the autumn and winter months whenambient NH4 concentrations were typically >0.5 µM. The most notable feature regarding thenano fraction was its dominance (70%) and concentration (2.6 µg chl L-1) at midbay Stn 9 inJuly. Overall, nano fraction concentrations were generally in the range of 0.2-1 µg chl L-1
with dominance appearing primarily during spring (October to December). For all stations,

7a
Figure 3. Plots of a) ambient water temperature and b) initial NH4 concentration inseawater collected from mid-depth at all sites sampled during the study period. Panelb excludes one unusually high concentration of 20 µM NH4 observed at Wooley'sBuoy (Stn 2) in July 1995. See Appendix 1 for data from individual sites.

8
the pico fraction often represented >40% of the total phytoplankton but in most cases, suchdominance occurred when total chlorophyll levels were <1.5 µg L-1.
Phytoplankton cell counts (cells >2 µM only) were also seasonally more variable at Wooley’sBuoy and at the midbay sites than at Sandringham or Werribee (Figure 4e-h). For most of thestudy, cell concentrations fell in the range of 1x10⁵ - 1x10⁶. Peaks were generally observedduring the autumn and winter months when chlorophyll a concentrations in the combinednano and micro fractions exceeded 1 µg L-1.
3.3. Phytoplankton CompositionTable 4 presents a summary of those species which were seasonally dominant in experimentalwater collected from mid-depth. Data on species concentration (Appendix 3) usuallyindicated no major changes in the dominance of phytoplankton taxa following a 24 hrincubation with additional nitrogen.
Table 4. Summary of the dominant phytoplankton species (cells >2 µM) by season.
Season1994-95
Dominant Diatom Species Other Dominant Phytoplankton
Spring Thallasiosira malaPseudonitzchia pungens
Leucocryptus marinaKatodinium rotundatumPyramimonas sp
Summer Pseudonitzchia pungensRhizosolenia delicatulaSkeletonema costatumProboscia alata
Leucocryptus marinaPlagioselmis prolonga
Autumn Chaeotoceros socialisPseudonitzchia pungensSkeletonema costatumRhizosolenia delicatula
Plagioselmis prolongaPhaeocystis pouchettii
Winter Pseudonitzchia spp.Rhizosolenia sppThalassionema spSkeletonema costatum
Gymnodinium spp.Plagioselmis prolongaTeleaulax acuta
3.4. Algal Cell Growth Response to Added NitrogenIn most experiments, the undiluted treatment with additional nitrogen showed an increase inphytoplankton cell concentration which was generally accompanied by an increase in totalcell volume (Figure 5a, Appendix 2). Growth rates in cell number and cell volume werevariable but generally indicated a net growth rate of ≤1 µ d-1 or ≤1.5 cell doublings per day.
Chlorophyll a and cell count data indicated an increase in mean chlorophyll a content per cell(cells >2 µM diam) in most experiments following a 24 hr incubation with additional nitrogen(Figure 5b). In a few experiments conducted during summer, the average post-incubationchlorophyll a content per cell was 6-9 times higher than the initial level. When it was more
8a
Figure 4. Initial concentrations of chlorophyll a (µg L-1
) and algal cells (# L-1
) priorto incubation. Data includes all sites sampled from October 1994 until mid-September1995 with the exception of Clifton Springs (Stn 6). Numbers above bars in plots band f are midbay station numbers. See Appendix 1 and 2 for greater detail.

9
than 3 times the initial level, total cell numbers following incubation were either equal to orlower than initial cell counts. In some of these cases, the micro fraction (>20 µm) contained agreater proportion of the total chlorophyll a following incubation and, in part, explains theobserved increases in average chlorophyll a content per cell. It should be remembered,however, that when the cellular levels of chlorophyll a are elevated without an increase in cellsize, phytoplankton growth rates determined using the Dilution Method will beoverestimated.
Table 5 summarises the spatial variation in percent change in chlorophyll a content per celland includes experiments conducted from October 1994 until mid-September 1995.Interestingly, the midbay sites exhibited a narrower range and a lower mean than the coastalsites (Stns 2, 3, 5 and 6). The coastal sites showed on average a >100% increase inchlorophyll a content per cell following incubation while the midbay sites showed a meanincrease of only 44% and a much lower standard deviation than for coastal waters.
Table 5. Percent change in chlorophyll a content per cell (nano plus micro fractions) bysampling location. Data includes all seasons.
Stn Location % change in chlorophyll a content per cellRange Mean StDev N
2 Wooley’s Buoy -39 to 902 120 296 9
3 Sandringham -25 to 623 230 271 6
5, 6 Werribee and Clifton Springs -86 to 504 127 210 6
9, 11 midbay Sites -49 to 140 44 65 10
Table 6. Percent change in chlorophyll a content per cell (nano plus micro fractions) byseason. Data includes all sampling locations. * data for December only.
Season 1994-95 Temp°°C
NH4
µµM% change in chlorophyll a content
per cellRange Range Range Mean StDev N
Spring Oct - Dec 12-18°C 0.6-0.8* 55 to 423 182 151 5
Summer Jan - Mar 18-22°C 0.1-0.4 -28 to 623 191 238 9
Autumn April - June 11-15°C 0.4-1.0 -49 to 124 23 54 8
Winter July - Sept 10-11°C 0.3-0.8 -86 to 902 94 305 9
Seasonal trends are shown in Table 6. The months selected as representative of each seasonduring 1994-1995 were based on patterns observed in ambient water temperature andammonia concentrations (Figure 3). Experiments conducted during the autumn monthsshowed a narrower range and a lower mean in percent change in chlorophyll a content percell. During this period (April to June), initial NH4 levels were relatively high (0.4 - 1 µM) atall stations. The autumn data represents five experiments from coastal sites and three frommidbay sites.

9a
Figure 5. Phytoplankton cell growth in nitrogen-spiked, undiluted seawatertreatments. Data represent algal cells >2 µM as cell counts did not include pico-phytoplankton. Plot a shows the relationship between apparent growth rates in cellnumber and cell volume. See Appendix 2 for site-specific detail. Plot b shows initialvs final concentrations of chlorophyll a cell
-1.

10
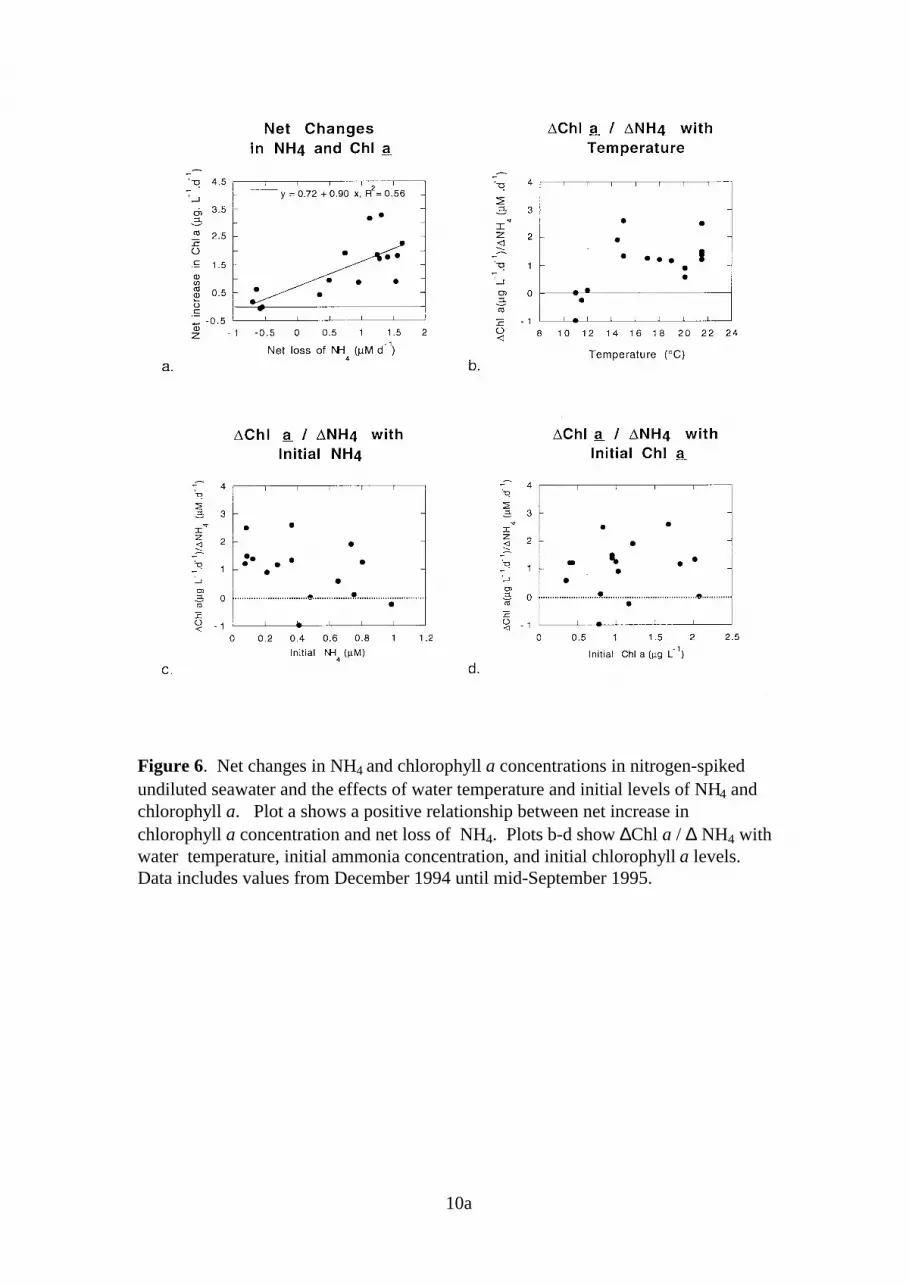
3.5. Net NH4 Consumption and Chlorophyll ProductionIn undiluted treatments, a positive relationship was observed between net losses in NH4 andnet increases in chlorophyll a (Figure 6a). In four experiments, slightly higher NH4 levelswere observed following incubation; in these cases, which were conducted during winter (10-12°C), there was little net increase in chlorophyll a. At warmer temperatures (>14°C), netincreases in chlorophyll a were higher and in the range of 1-2.5 µg chlorophyll a / µM NH4
consumed (plot b). High net increases in chlorophyll a per µM NH4 consumed were alsoassociated with low initial NH4 levels (<0.4 µM) (plot c), which appear primarily duringsummer. The relationship between chlorophyll a growth and NH4 consumption does notappear to be related to the initial concentration of chlorophyll a (plot d).
3.6. Chlorophyll Growth Rates vs TemperatureAn examination of the effect of incubation temperature (range 10-22°C) on the chlorophyll agrowth rates for nitrogen-spiked and nonspiked treatments is shown in Figure 7. Growth ratewas positively correlated with temperature for the total population and for all fractions intreatments receiving additional nitrogen. For nonspiked treatments, a weak positiverelationship was exhibited by both the total population and the pico fraction; for the nano andmicro fractions, the slope was not significantly different from zero (Table 7). Growth ratesfor nonspiked treatments were similar to treatments with nitrogen spiked growth only whenincubation temperatures were low (10-12°C).
Table 7. Statistical analyses of nitrogen-spiked growth rates and nonspiked growth rates vstemperature for the total phytoplankton population and for each size fraction.
Fraction Nutrient Addition Slope Significance R 2 N
Total + NH4 0.134 p<0.001 0.71 41
Pico + NH4 0.131 p<0.001 0.64 41
Nano + NH4 0.095 p<0.001 0.41 41
Micro + NH4 0.124 p<0.001 0.50 41
Total none 0.040 p<0.01 0.21 34
Pico none 0.036 p<0.01 0.20 34
Nano none 0.033 p=0.09 0.09 34
Micro none 0.013 p=0.05 0.01 34
10a
Figure 6. Net changes in NH4 and chlorophyll a concentrations in nitrogen-spikedundiluted seawater and the effects of water temperature and initial levels of NH4 andchlorophyll a. Plot a shows a positive relationship between net increase inchlorophyll a concentration and net loss of NH4. Plots b-d show ∆Chl a / ∆ NH4 withwater temperature, initial ammonia concentration, and initial chlorophyll a levels.Data includes values from December 1994 until mid-September 1995.

10b
Figure 7. Relationship between temperature and chlorophyll a growth rates for the a)total phytoplankton population, b) pico fraction, c) nano fraction and d) microfraction. Open squares and solid lines represent NH4 spiked treatments; solid circlesand dashed lines represent treatments without nitrogen addition. Least squares linearregression lines are included where the slopes are significantly different from zero.See Table 7 for statistical significance.

11
3.7. Zooplankton Taxa and Abundance
3.7.1. Taxonomic composition
The zooplankton taxa identified in the undiluted seawater samples (6-10 L) collected from allexperiments (n=41) are listed in Table 8. Though formalin is an adequate and commonlyused fixative for most zooplankton, it will not preserve the naked or non-loricate protozoans,which require more complex fixation methods (Sherr et al. 1993). The zooplankton specieslist therefore includes only those protists (primarily ciliates) which preserve well in formalinand which were larger than 20 µm. As the net zooplankton were not removed from theexperimental water, grazers in this study also include a few taxa >200 µM.
The most common protozoan grazers found throughout the study period were the largedinoflagellate Noctiluca scintillans (100-2000 µm diam), the tintinnids Favella sp.,Helicostomella sp., Tintinnopsis sp. and the oligotrich, Strobilidium sp.. Many other speciesof loricate ciliates were identified but appeared less regularly. Copepods, including thecopepodite and naupliar forms, appeared in all samples and were largely represented by twoAcartia species, Paracalanus indicus and the cyclopoid, Oithona similis. Cladocerans werealso common year-round with apparent seasonal changes in species occurrence. The mostnotable cladoceran was Penilia avirostris, which was relatively abundant (5-20 L-1) at moststations during the summer months.
The larvacean, Oikopleura dioica, was also found in samples throughout most of study and inconcentrations of 1-7 L-1 during the spring, summer and autumn months. Their gelatinoushouses (>2 mm diam), which collect food particles and are regularly produced and discarded,were often abundant and generally contained large numbers of faecal pellets. It is unknownwhether or not larvacean faecal pellets were produced during incubation but it is highly likelythat most or all of the oikopleurids in the experimental bottles died prior to incubation aspreserved specimens generally appeared in very poor condition. Oikopleurids are highlysensitive to mechanical disturbance and bottle containment and require very gentle handlingprocedures when collected for experimental studies (Redden, pers. obser.).
Faecal pellets were commonly observed in most of the samples and were in greatestabundance when grazing coefficients were >0.3 d-1. Many samples throughout the study alsocontained mucous sheets and large amounts of fine amorphous material of unknown identity.It should be noted that the presence of amorphous and gelatinous matter in incubated waterwould probably have an effect on the efficiency of filtration for the size-fractioned samplesand potentially increase error associated with the fraction data.
3.7.2. Zooplankton abundance
Grazer densities (excluding oikopleurids and medusae) for the 41 grazing experiments aresummarised in Table 9. Total concentrations represent densities from mid-depth waters andare conservative estimates as aloricate protists and grazers <20 µm were not preserved. Taxawere grouped according to relative dominance and classification.

12
Table 8. List of zooplankton taxa identified from undiluted seawater samples (6-10 L) ingrazing experiments conducted during October 1994 - September 1995.
Occurrence: r (rare, <5 ind L-1), c (common, 5-50 ind L-1), a (abundant, >50 ind L-1)
Phylum orSubPhylum
Class orSubClass
Order orSubOrder
Taxa Abundance
Sarcomastogophora Phytomastigophorea Dinoflagellida Noctiluca scintillans c-a
Ciliophora Litostomatea Haptorida Didinium sp.Monodinium sp
rr
Choreotrichea Oligotrichida Strobilidium sp.4 unid spp.
cr-c
Choreotrichea Choreotrichida Codonella sp.Codonellopsis sp.Ptychocylis sp.Favella sp.Helicostomella sp.Metacylis sp.Eutintinnus sp.5 unid tintinnid spp.
ccr
c-ac-arrc
Arthropoda Copepoda Calanoida Acartia spp.(2)Paracalanus indicusTortanus barbatus
c-ac-ar
Cyclopoida Oithona similisOithona rigidaUnid cyclopoids
c-ac-ar
Harpacticoida Unid harpacticoids c
Branchiopoda Cladocera Evadne nordmaniE. tergestinaPodon intermediusP. polyphemoidesPenilia avirostris
cccc
c-a
Urochordata Larvacea Oikopleuridae Oikopleura dioica r-c
Juvenile forms and other zooplankters: Various nauplii c-aBivalve larvae c-aGastropod larvae cEchinoderm larvae cPolychaete larvae rPteropod larvae rDecapod zoea rUnid rotifers rUnid medusae r

13
Table 9. Summary of grazer densities (# ind L-1) in the undiluted experimental bottles.Counts of larvaceans and medusa not included. All grazers collected with 20 µm mesh.
Station Date94- 95
Noctiluca# L-1
Ciliates# L-1
Nauplii# L-1
Copepods# L-1
Cladocerans# L-1
Other# L-1
Total# L-1
Wooley's 12 Oct 2 2 10 4 0 4 21Buoy 9 Nov 27 276 12 8 1 2 327
Site # 2 6 Dec 85 30 4 64 1 2 1854 Jan 22 2 4 8 6 3 46
31 Jan 52 9 9 27 11 3 10927 Feb 6 82 25 38 7 14 17127 Mar <1 27 <1 1 0 <1 2926 Apr 68 19 17 6 1 2 11323 May 45 10 9 3 0 1 6720 Jun <1 150 7 5 0 <1 16218 Jul 18 8 6 1 8 2 4415 Aug 46 69 3 2 4 1 12511 Sep 14 47 4 2 <1 1 69
Sandringham 13 Oct 49 73 8 6 1 6 142Site # 3 11 Dec 102 66 5 6 1 33 213
24 Jan 92 66 26 23 0 7 21329 Mar <1 1137 35 10 0 9 119224 May 19 332 10 3 <1 1 36417 Jul 2 23 8 3 <1 1 3814 Sep <1 45 7 8 0 <1 61
Werribee 13 Oct 10 11 13 11 0 5 49Site # 5 10 Nov 3 56 4 4 0 1 68
4 Jan 17 4 21 27 5 3 773 Mar 2 40 33 7 <1 4 8624 Apr 1 78 23 31 0 13 14622 Jun 6 69 7 2 <1 <1 8414 Aug 9 82 16 3 <1 2 113
Clifton 14 Oct 3 40 2 5 0 <1 51Springs 11 Nov 43 42 16 8 <1 6 115Site # 6 28 Mar 32 4 34 23 <1 18 111
midbay NE 5 Jan 134 5 6 11 20 1 176Site # 9 1 Mar 11 92 23 35 7 6 173
22 May 10 36 7 4 1 1 5920 Jul 3 13 5 1 <1 1 2310 Sep <1 15 3 8 <1 1 27
midbay SW 14 Oct 3 4 3 9 <1 2 21Site # 11 10 Dec 35 3 5 22 2 2 68
2 Feb 39 <1 3 23 2 <1 6727 Apr 4 37 3 7 0 2 5321 Jun 4 328 8 4 0 <1 34419 Aug 27 5 2 3 <1 <1 37

14
Of particular significance was the year-round occurrence of the large dinoflagellate, Noctilucascintillans, in seawater samples collected from mid-depth at all sites sampled. Noctilucadensities, ranged from <1-134 L-1, with concentrations of >50 L-1 occurring during thesummer months at the eastern Bay stations (Wooley’s Buoy, Sandringham and midbay Stn 9).
Tintinnids were present in all experimental water but densities were highly variable (<1 to>1000 L-1). Interestingly, tintinnid concentrations were very low (<10 L-1) during early andlate January when both growth and grazing coefficients were high (Figs 8a and 9a). Thehighest ciliate densities were observed during March to June with the greatest numbers inseawater from the Sandringham site. Helicostomella sp. (40-70 µm long) was found at allsites during most of the study (found in 76% of samples) and was typically the mostabundant. loricate ciliate during the summer and autumn months. Favella sp. (60-100 µmlong) was also present year-round and in highest densities during the winter and spring.
Throughout the study, nauplii were present in mid-depth waters at concentrations of <1 to 35L-1 and with peak densities during summer. They were also more abundant in seawatercollected from the coastal sites (4-7 m) than from the midbay sites (10 m). Copepods(primarily copepodites) were seasonally abundant with densities of 10-60 L-1 during thesummer months at all sites. Cladocerans were present in most samples but densities weregenerally <5 L-1 and rarely exceed 10 L-1. Other taxa comprised various benthic larvae andjuvenile zooplankters; collectively, they were most abundant during summer at the coastalstations.
Highly variable total zooplankton concentrations (20-1200 ind L-1) observed throughout thestudy (Table 9) were largely due to seasonally variable tintinnid concentrations. Whenciliates are removed from the total population, grazer concentrations are <200 L-1. And, ifdensities of both ciliates and Noctiluca are excluded, concentrations are <100 ind L-1 andtypically in the range of 10-50 L-1.
3.8. Spatial and Temporal Variation in Grazing and Growth Rates
3.8.1. Chlorophyll a growth rates for coastal and midbay sites
Monthly estimates of chlorophyll a growth rate, with and without nutrient addition, are shownfor the four coastal and two midbay sites in Figure 8 (for site-specific detail and standarderrors, see Appendices 4-7). For both coastal and midbay sites, growth rates in the nitrogen-spiked treatments were typically higher than growth rates without nitrogen addition. Thoughmidbay sites often showed chlorophyll a growth rates, which were lower than those for thecoastal stations, no consistent pattern was apparent. Seasonal trends in growth rates of bothcoastal and midbay sites were more evident for the nitrogen-spiked treatments, with highestrates in summer and lowest rates in winter for the total phytoplankton population and formost fractions. Seasonal trends are further discussed in Section 3.9.1

14a
Figure 8. Coastal and midbay chlorophyll a growth rate estimates, with nitrogenaddition (a-d) and without nitrogen addition (e-f), for the total population and foreach fraction, from October 1994 until mid-September 1995. Open squares representthe four coastal stations; closed circles represent the two midbay stations. Dashedlines show k = 0.

14b
Figure 9. Microzooplankton grazing rates for the a) total phytoplankton population,
b) pico fraction, c) nano fraction and d) micro fraction, from coastal and midbay sitesfrom October 1994 until mid-September 1995. Open squares represent the fourcoastal stations; closed circles represent the two midbay stations. Dashed lines showg = 0. For more detail of the monthly grazing rates, see Appendices 4-7.

15
3.8.2. Grazing rates for coastal and midbay sites
Monthly grazing rates for both coastal and midbay sites show seasonal trends in grazingimpact for the total phytoplankton population (Fig 9a). Peaks in grazing occurred during thesummer months (g>0.5 d-1) with lowest rates observed in winter (g<0.2 d-1). These trends areconsistent with seasonal patterns in grazer abundance (Table 9). Monthly grazing rates forthe coastal sites do not appear to differ greatly from those of midbay sites. Seasonal trends aredetailed in Section 3.9.1. For the pico, nano and microphytoplankton fractions, seasonaltrends in grazing (Fig 9b-d) are less apparent than those for the total chlorophyll a data.
3.8.3. Limitations of the size fraction data
Interpretation of the fraction data in Figures 8 and 9 is made difficult by the occurrence of anumber of negative grazing rate estimates (g<0), especially for the micro fraction, whichfrequently occurred during spring and summer when total chlorophyll a concentrations werelow (<1 µg L-1). During this time, the micro fraction generally represented < 20% of the totalchlorophyll a. Concentrations of chlorophyll a, which are at or near levels of detection, mayresult in errors in growth rate estimates. The fraction data is also subject to error due topotential clogging of the 2 and 20 µm filters in the 3-tiered filtration assembly. The presenceof gelatinous and amorphous material, which was found in many of the samples (see Section3.7.1), would no doubt contribute to filtration inefficiencies.
The mean standard errors of the chlorophyll a growth and microzooplankton grazingcoefficients, for the total phytoplankton population and for each size fraction, for all nitrogen-spiked treatments (N=41), are shown in Figure 10. Mean standard errors associated with bothgrowth and grazing coefficients were much greater for each of the pico, nano and micro sizefractions than for the total population. The grazing rates for the individual fractions shouldtherefore be used with due regard of their uncertainty.
3.8.4. Total population: site-specific grazing and growth rates
Estimates of monthly grazing and growth rates for the total phytoplankton population fromeach site sampled (except Clifton Springs) are shown in Figure 11. More detail on thecoefficients and standard errors for all stations are included in Appendix 4.
Wooley’s Buoy - Total population
Monthly estimates of grazing rate on the total phytoplankton population at Wooley’s Buoy(Fig 11a) showed a seasonal pattern with rates of >0.6 d-1 observed in three of the fourexperiments conducted in summer. A maximum rate of 0.9 d-1 occurred in late Jan. Non-summer rates were in the range of 0-0.5 d-1. Grazing rates were very low during theautumn/winter months of April, May, July and August and, on these occasions, were notsignificantly different from zero.

15a
Figure 10. Mean standard error and standard deviation of the mean for a) chlorophylla growth rates (nitrogen-spiked) and b) microzooplankton grazing rates, for each sizefraction and for the total phytoplankton population. Data represent experimentsconducted from October 1994 until mid-September 1995 (n=41).

16
Growth rates of 1-2.5 µ d-1 were estimated for nitrogen-spiked treatments in experimentsconducted from November to late March; for all other months, growth coefficients were inthe range of 0.5-1 µ d-1 (Fig 11e). Estimates of growth rate without added nitrogen were >1 µd-1 during early summer (December and January) but were reduced to <0.5 µ d-1 duringautumn, winter and spring.
Midbay Sites (Stns 9 & 11) - Total population
Grazing rates at the midbay sites (Fig 11b) were generally not as high as those observed atWooley’s Buoy. The highest grazing rate (g = 0.65 d-1) was observed for Stn 9 in earlyMarch. For all other experiments, estimates of g were <0.5 d-1 and, during the winter/springperiod (July to December), the grazing coefficient was <0.2 d-1.
Nitrogen-spiked growth rates for the midbay sites (Fig 11f) showed a similar seasonal patternto those for Wooley’s Buoy. Midbay waters exhibited a growth rate range of 1-1.7 µ d-1
during summer and very low rates (0-0.4 µ d-1) during May to September. Nonspiked growthrates approached 0.7 µ d-1 during December but were <0.5 µ d-1 for all other samplingperiods.
Sandringham - Total population
Bimonthly grazing data for Sandringham (Fig 11c) show no clear seasonal pattern or strongsimilarity to other sites. Grazing rates of 0.4-0.5 were observed in late January, late May andmid-September. All other sampling periods showed rates of <0.2 d-1.
Nitrogen-spiked growth showed rates of about 1 µ d-1 in December and peaks of 1.5-2 µ d-1 inlate January and late March (Fig 11g) . Growth rates were <0.5 µ d-1 during July, Septemberand October. Nonspiked growth rates at Sandringham were generally lower than those forWooley’s Buoy and showed rates of ≤0.5 µ d-1 during both summer and nonsummer periods.
Werribee - Total population
Grazing rates of 0.3 d-1 were determined for three of the four experiments conducted duringspring and summer (Fig 11d). A peak rate of 0.8 d-1 was exhibited in early January. Grazingimpact in autumn and winter at Werribee was very low with rates of <0.1 d-1.
Growth rates for nitrogen-spiked treatments were in the range of 1-2 µ d-1 during spring andsummer (Fig 11h). This was followed by a decline and growth rates of only 0.3 µ d-1 inwinter. Nonspiked treatments showed growth rates of <0.5 µ d-1 during all months sampled.

16a
Figure 11. Microzooplankton grazing rates and chlorophyll a growth rates for thetotal phytoplankton population, for sites sampled from October 1994 until mid-September 1995. Plots a-d show grazing rates and standard errors. Plots e-h showchlorophyll a growth rates and standard errors: grey bars are nitrogen-spikedtreatments; black filled bars are nonspiked treatments (standard error for nonspiked issame as for grazing coefficient). Numbers above bars in plots b and f are midbay sitenumbers.

17
3.8.5. Size fractions: site-specific grazing and growth rates
The grazing and growth rates for the three size fractions are shown in Figures 12-14 and ingreater detail in Appendices 5-7. Interpretation of the fraction data, however, is somewhatcomplicated by seasonal differences in the size fraction composition of the phytoplankton andrelatively high mean standard errors of the coefficients for grazing and growth (Figure 10, seeSection 3.8.3). Analysis of the fraction data is therefore limited to discussion of the generaltrends.
Wooley’s Buoy - Size Fractions
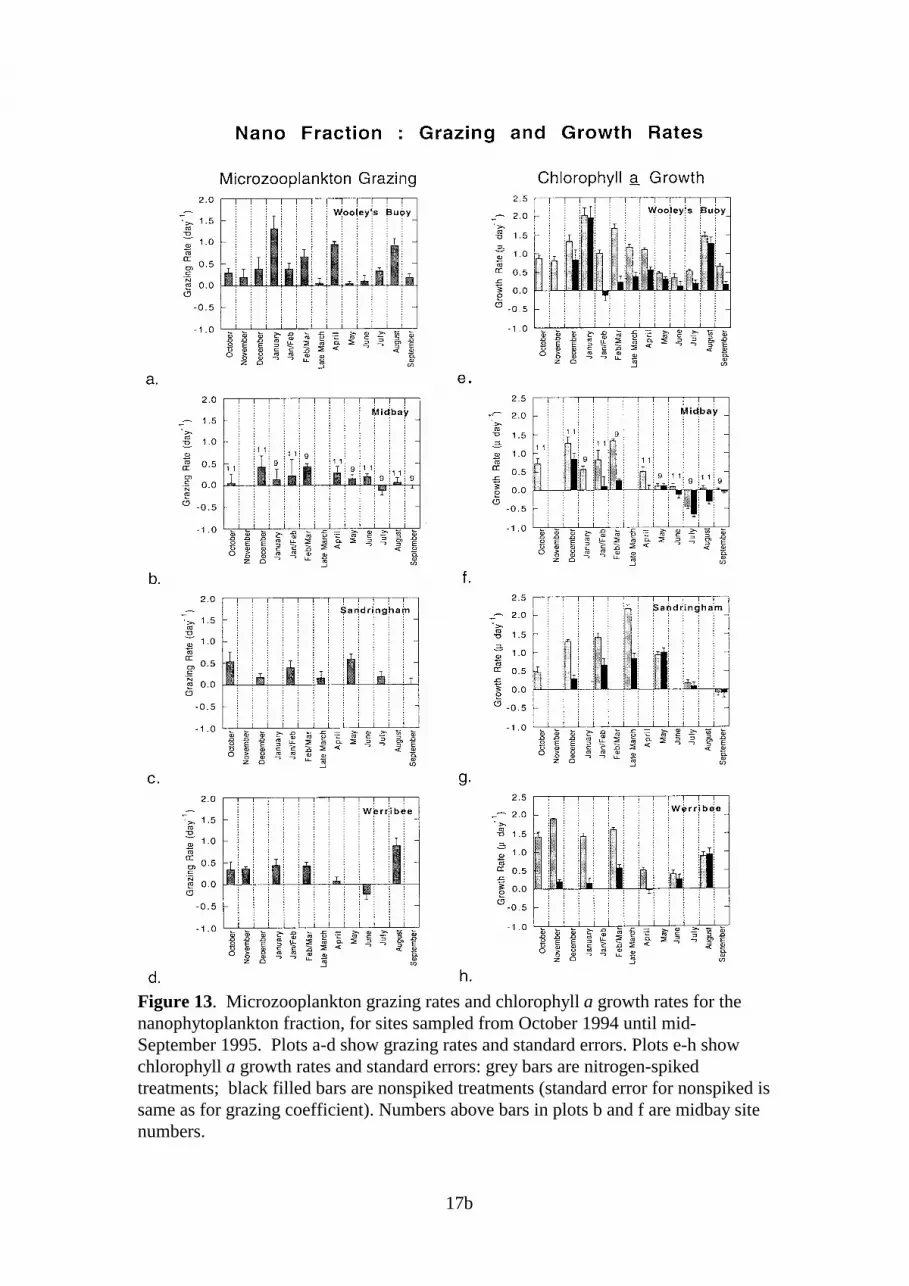
Throughout the study, grazing coefficients for the pico and nano fractions were higher thanthose for the micro fraction (Fig 12a, 13a, 14a). Grazing rates of >0.5 d-1, on cells >20µm,were found only during early January and late March. The highest grazing coefficients for allthree fractions were observed during the summer months.
Pico growth rates in nitrogen-spiked treatments were consistently high (1.3-1.8 µ d-1) inexperiments conducted during December to late March and were <0.5 µ d-1 during the wintermonths. Though less consistent, the nano and micro fractions also showed peak growth ratesin summer (>1.5 µ d-1) and reduced growth in winter. In nonspiked treatments, peak growthoccurred during summer for all fractions. During winter, growth rates of picos and nanos innonspiked treatments were often similar to those estimated for treatments with additionalnitrogen.
Midbay Sites - Size Fractions
Grazing impact during the summer and winter months appears to be greatest on the picofraction, with g >0.5 d-1 (Figs 13b, 14b). Grazing rates were generally <0.5 d-1 for both thenano and micro fractions; no clear seasonal trends were apparent.
All three fractions exhibited peaks in nitrogen-spiked growth rates during summer.Coefficients were highest for the picos, which exhibited growth rates in the range of 1.5-2 µd-1 from December to early March. Summer growth rates for the nano and micro fractionswere generally <1.5 µ d-1 and during winter, g was <0.5 µ d-1 for all three fractions. In non-spiked treatments, growth rates of the pico fraction were higher than those of the nano ormicro fractions in both summer and winter.
Sandringham - Size Fractions
Grazing rates for the pico fraction were >0.3 d-1 during summer and autumn and <0.2 d-1
during winter and spring months. No seasonal trends were apparent for the nano fractionwhich showed peak rates of about 0.5 d-1 in January, May and October. Similar rates wereobserved for the micro fraction but during summer only.
Seasonal trends in nitrogen-spiked growth rates were shown for all three fractions; growthrates peaked in summer (>1.5 µ d-1) and were low in winter (<0.5 µ d-1). For treatments
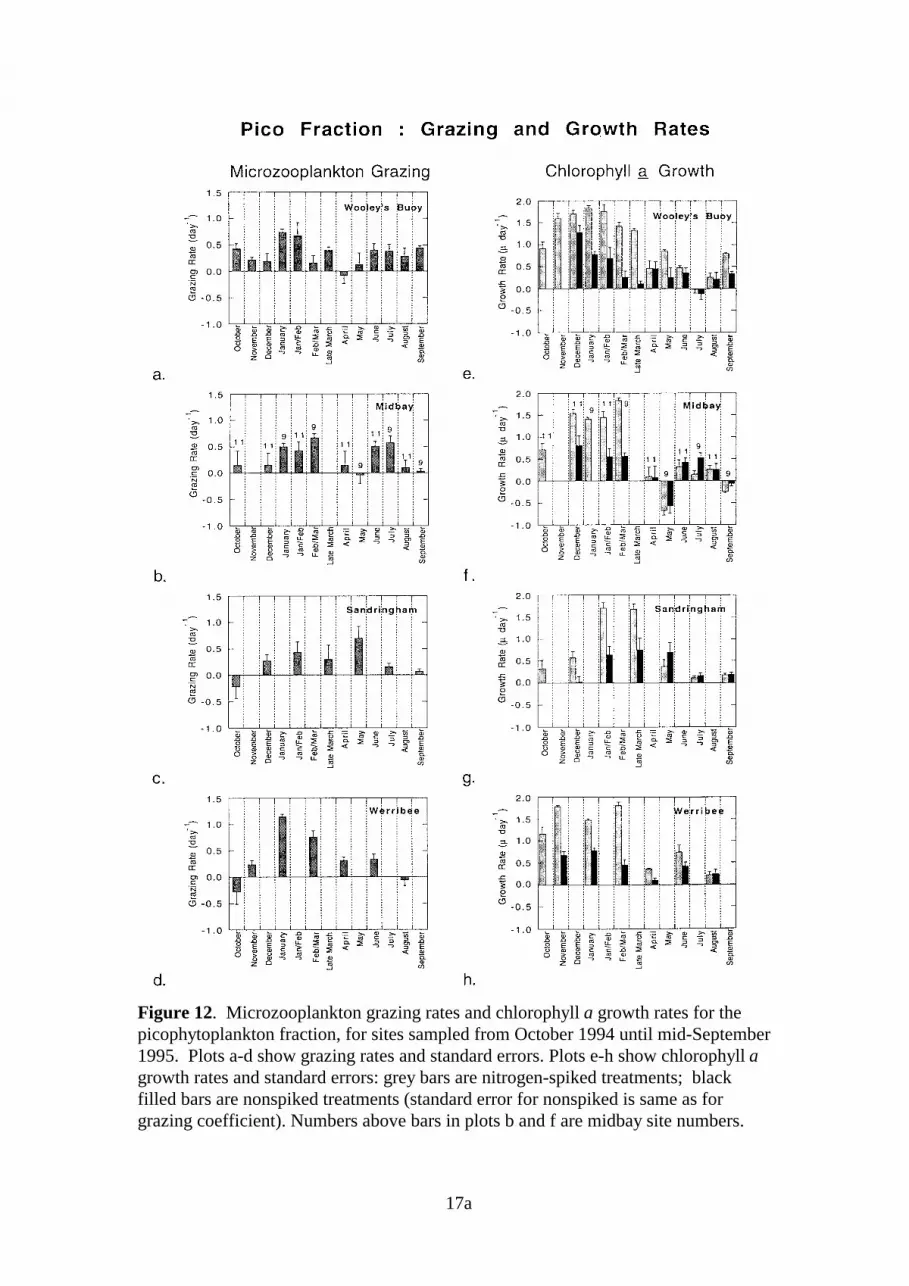
17a
Figure 12. Microzooplankton grazing rates and chlorophyll a growth rates for thepicophytoplankton fraction, for sites sampled from October 1994 until mid-September1995. Plots a-d show grazing rates and standard errors. Plots e-h show chlorophyll agrowth rates and standard errors: grey bars are nitrogen-spiked treatments; blackfilled bars are nonspiked treatments (standard error for nonspiked is same as forgrazing coefficient). Numbers above bars in plots b and f are midbay site numbers.
17b
Figure 13. Microzooplankton grazing rates and chlorophyll a growth rates for thenanophytoplankton fraction, for sites sampled from October 1994 until mid-September 1995. Plots a-d show grazing rates and standard errors. Plots e-h showchlorophyll a growth rates and standard errors: grey bars are nitrogen-spikedtreatments; black filled bars are nonspiked treatments (standard error for nonspiked issame as for grazing coefficient). Numbers above bars in plots b and f are midbay sitenumbers.

17c
Figure 14. Microzooplankton grazing rates and chlorophyll a growth rates for themicrophytoplankton fraction, for sites sampled from October 1994 until mid-September 1995. Plots a-d show grazing rates and standard errors. Plots e-h showchlorophyll a growth rates and standard errors: grey bars are nitrogen-spikedtreatments; black filled bars are nonspiked treatments (standard error for nonspiked issame as for grazing coefficient). Numbers above bars in plots b and f are midbay sitenumbers.
18
without nutrient addition, pico and nano growth rate estimates were higher than those for themicro fraction during summer and autumn.
Werribee - Size Fractions
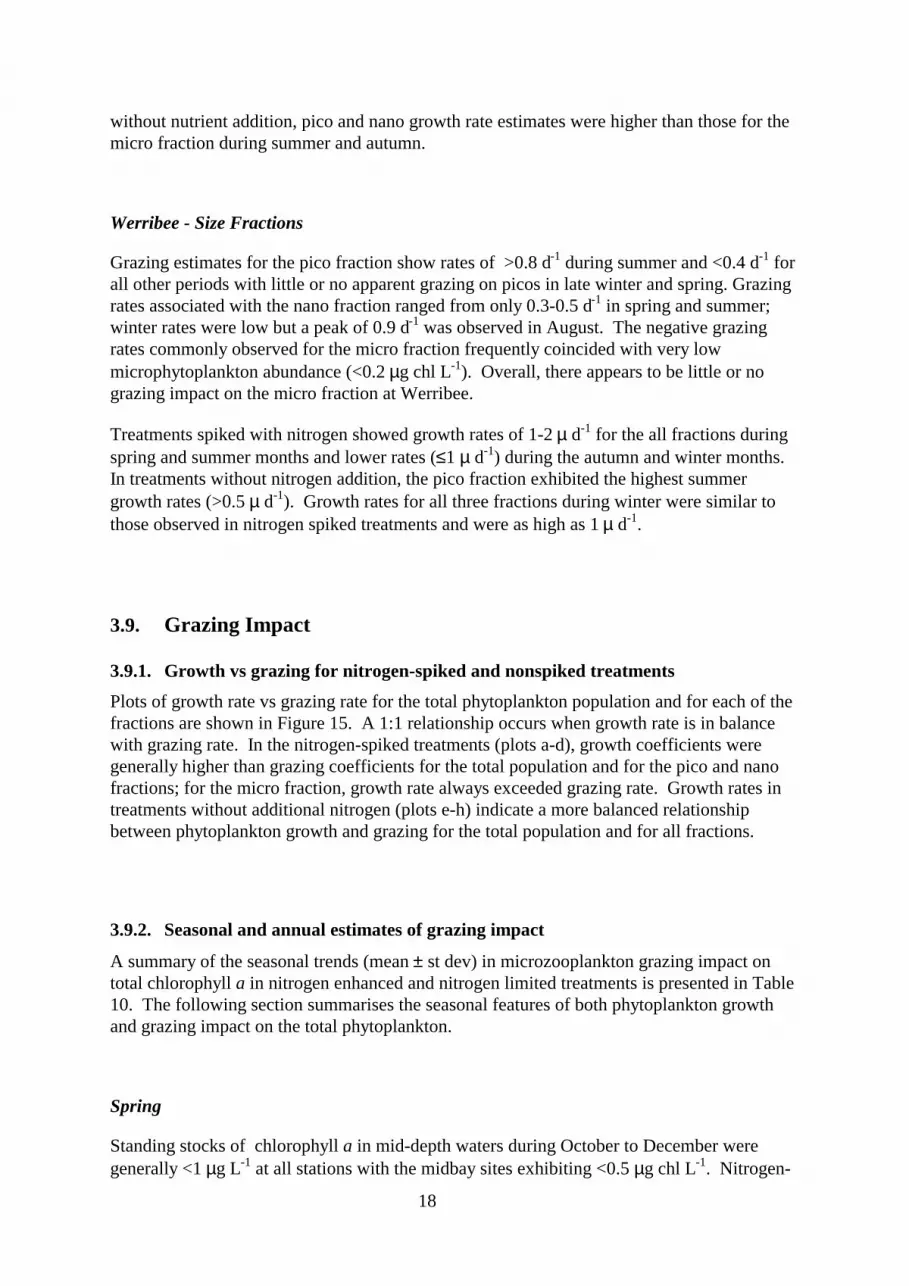
Grazing estimates for the pico fraction show rates of >0.8 d-1 during summer and <0.4 d-1 forall other periods with little or no apparent grazing on picos in late winter and spring. Grazingrates associated with the nano fraction ranged from only 0.3-0.5 d-1 in spring and summer;winter rates were low but a peak of 0.9 d-1 was observed in August. The negative grazingrates commonly observed for the micro fraction frequently coincided with very lowmicrophytoplankton abundance (<0.2 µg chl L-1). Overall, there appears to be little or nograzing impact on the micro fraction at Werribee.
Treatments spiked with nitrogen showed growth rates of 1-2 µ d-1 for the all fractions duringspring and summer months and lower rates (≤1 µ d-1) during the autumn and winter months.In treatments without nitrogen addition, the pico fraction exhibited the highest summergrowth rates (>0.5 µ d-1). Growth rates for all three fractions during winter were similar tothose observed in nitrogen spiked treatments and were as high as 1 µ d-1.
3.9. Grazing Impact
3.9.1. Growth vs grazing for nitrogen-spiked and nonspiked treatments
Plots of growth rate vs grazing rate for the total phytoplankton population and for each of thefractions are shown in Figure 15. A 1:1 relationship occurs when growth rate is in balancewith grazing rate. In the nitrogen-spiked treatments (plots a-d), growth coefficients weregenerally higher than grazing coefficients for the total population and for the pico and nanofractions; for the micro fraction, growth rate always exceeded grazing rate. Growth rates intreatments without additional nitrogen (plots e-h) indicate a more balanced relationshipbetween phytoplankton growth and grazing for the total population and for all fractions.
3.9.2. Seasonal and annual estimates of grazing impact
A summary of the seasonal trends (mean ± st dev) in microzooplankton grazing impact ontotal chlorophyll a in nitrogen enhanced and nitrogen limited treatments is presented in Table10. The following section summarises the seasonal features of both phytoplankton growthand grazing impact on the total phytoplankton.
Spring
Standing stocks of chlorophyll a in mid-depth waters during October to December weregenerally <1 µg L-1 at all stations with the midbay sites exhibiting <0.5 µg chl L-1. Nitrogen-

18a
Figure 15. Plots of chlorophyll a growth rate versus microzooplankton grazing rate,for the total phytoplankton population and for each fraction. Plots a-d representtreatments spiked with 1-3 µM inorganic nitrogen (n=41). Plots e-h representtreatments without nitrogen addition (n=31). One point excluded from plots b and f ask<-0.5.

19
spiked chlorophyll a growth rates showed an overall mean of 1.1 (± 0.5) µ d-1 or 1.6 (± 0.7)chlorophyll a doublings per day. Over all sites, potential production for nitrogen enhancedtreatments averaged 1.5 µg chl L-1 d-1, with lowest production at the midbay sites (0.7 ± 0.6µg chl L-1 d-1) due only to lower initial standing stocks (0.3 ± 0.1 µg chl L-1).
Grazing rates were more variable than chlorophyll a growth rates; the lowest mean grazingrate observed during spring was for Sandringham (0.05 d-1) and the highest was for Wooley’sBuoy (0.32 d-1). The mean estimate for all sites during spring indicates 16% (± 11%) of theinitial chlorophyll a stock was grazed, an amount equivalent to 23% (± 17%) of the potentialchlorophyll a production in nitrogen enhanced waters and 47% (± 34%) in nitrogen limitedwaters.
Summer
Mid-depth chlorophyll a concentrations were slightly higher at all sites during January toMarch than during spring; the overall summer average was 1 µg chl L-1. Again, the lowestchlorophyll a concentrations were found at the midbay sites (mean = 0.6 µg chl L-1).Nitrogen spiked chlorophyll a growth rates were higher during summer than all other seasons,with an overall mean rate of 1.7 (± 0.4) µ d-1, representing 2-3 doublings of chlorophyll a perday. Estimates of potential production for treatments with additional nitrogen show summermeans ranging from 2.1 µg chl L-1 d-1 (midbay sites) to 8.4 µg chl L-1 d-1 (Sandringham) withan overall summer average of 4.6 (± 2.7) µg chl L-1 d-1.
The highest grazing rates in this study were observed during summer with station meansranging from 0.32-0.63 d-1. When all sites are combined, estimates indicate 38% (± 14%) ofthe initial chlorophyll a stock was grazed per day, an amount equivalent to 48% (± 17%) ofthe potential daily chlorophyll a production when inorganic nitrogen levels are enhanced and82% (± 32%) of the potential production in the absence of additional nitrogen.
Autumn
During April to June, initial chlorophyll a concentrations at mid-depth were fairly constantfrom site to site, with an overall average of 1.4 (± 0.5) µg chl L-1. Mean growth coefficientsdid not vary greatly, however, they were much lower than those observed in spring andsummer. The overall mean growth rate for nitrogen enhanced treatments was 0.6 (± 0.3)
µ d-1, which equates to an average of 0.8 (± 0.4) chlorophyll a doublings per day. Fortreatments with additional nitrogen, mean potential production was 1.3 µg chl L-1d-1.
Grazing rates were highly variable during autumn with station averages ranging from 0.01 d-1
(Werribee) to 0.5 d-1 at Sandringham. The mean grazing rate for all sites examined duringautumn indicates 18% (± 18%) of initial chlorophyll a stock was grazed per day. This isequivalent to the grazing of 47% (± 46%) of the potential daily chlorophyll a productionwhen nutrients are added and 64% (± 49%) when nutrients are limiting.

20
Winter
The mid-depth chlorophyll a concentrations were highest during winter (July to September).Over all sites, the average was 2.5 (± 1.3) µg chl L-1. Mean growth rates in nutrient enhancedtreatments varied with site, with the lowest mean rate for midbay waters (0.1 ± 0.2 µ d-1) andthe highest for Wooley’s Buoy (0.6 ± 0.3 µ d-1). All sites combined, the average wintergrowth rate was 0.3 (± 0.3) µ d-1 (about 0.4 chlorophyll a doublings per day). Estimates ofpotential production in nutrient enhanced treatments were highly variable; station meansranged from 0.2 µg chl L-1d-1 (midbay) to 2.3 µg chl L-1d-1 (Wooley’s Buoy).
Grazing rates in winter were variable but generally low, particularly for midbay and Werribeewaters (g < 0.1 d-1). The mean grazing rate for all sites indicates 11 % (± 11 %) of the initialchlorophyll a stock was grazed per day, an amount equivalent to 33% (± 38) of the potentialdaily chlorophyll a production when inorganic nitrogen is added and 62% (± 46%) in theabsence of additional nutrients.
Annual
The overall average mid-depth chlorophyll a concentration, representing sites sampled duringOctober 1994 to mid-September 1995, was 1.3 µg chl L-1. The mean nitrogen enhancedgrowth rate for the combined sites was 1.0 (± 0.7) µ d-1, with average potential productionestimated at 2.3 (± 2.3) µg chl L-1d-1.
For all experiments, the mean microzooplankton grazing rate indicates an average of 22% (±17%) of the initial chlorophyll a standing stock was grazed per day. This is equivalent to38% (± 31%) of the potential total chlorophyll a production when nitrogen is not limiting.The estimated annual grazing impact, without additional inorganic nitrogen, is 68% (± 39%)of potential chlorophyll a production.
Tab
le 1
0. S
umm
ary
of r
esul
ts (
mea
n ± st
dev
) fo
r th
e to
tal p
opul
atio
n w
ith e
stim
ates
of g
razi
ng im
pact
by
seas
on.
Not
e: n
egat
ive
graz
ing
coef
ficie
nts,
whi
ch w
ere
not s
igni
fican
tly d
iffer
ent f
rom
0 (
see
App
endi
x 4)
wer
e co
nsid
ered
as
0 va
lues
for
graz
ing
impa
ct e
stim
ates
. S
eeA
ppen
dix
8 fo
r in
divi
dual
est
imat
es o
f gra
zing
impa
ct.
Site
loca
tions
are
: Woo
ley’
s B
uoy
(Stn
2),
San
drin
gham
(S
tn 3
), W
errib
ee (
Stn
5),
Clif
ton
Spr
ings
(S
tn 6
) an
d m
idba
y si
tes
(Stn
9 &
11)
. +
N (
Nitr
ogen
enh
ance
d),
-N (
Nitr
ogen
not
add
ed).
Sea
son
94-9
5S
ites
NIn
itial
chl
ast
ock
Po
+N C
hl a
Gro
wth
Rat
e
k
Dou
blin
gsch
l a
per
day
k/ln
2
Gra
zing
Rat
e
g
+N P
oten
tial
chl
apr
oduc
tion
Pp=(
Po
ek )-P
o
+N A
ctua
lch
l a
prod
uctio
n
Pa=
(Po
e(k-g
) )-P
o
Initi
alch
l a
stoc
kgr
azed
d-1
(1-e
-g)
x 10
0
+N P
oten
tial
prod
uctio
ngr
azed
d-1
(Pp-P
a)/P
p x
100
-N P
oten
tial
prod
uctio
ngr
azed
d-1
∗
N
(µµg
L-1
)(µµ
d-1
)(d
-1)
(µµg
L-1
d-1
)(µµ
g L
-1 d
-1)
(%)
(%)
(%)
Spr
ing
all
110.
6 ±
0.3
1.10
± 0
.48
1.6
± 0.
70.
18 ±
0.1
41.
5 ±
1.1
1.2
± 0.
916
± 1
123
± 1
747
± 3
45
(Oct
-Dec
)2
30.
6 ±
0.4
1.24
± 0
.40
1.8
± 0.
60.
32 ±
0.0
81.
6 ±
1.0
1.0
± 0.
827
± 6
40 ±
12
461
32
0.8
± 0.
30.
72 ±
0.5
61.
0 ±
0.8
0.05
± 0
.08
1.1
± 1.
31.
0 ±
1.1
5 ±
78
± 11
851
5,6
40.
8 ±
0.1
1.20
± 0
.57
1.7
± 0.
80.
15 ±
0.1
52.
1 ±
1.4
1.7
± 1.
013
± 1
318
± 1
737
± 5
22
9,11
20.
3 ±
0.1
1.05
± 0
.55
1.5
± 0.
80.
15 ±
0.0
20.
7 ±
0.6
0.5
± 0.
514
± 2
23 ±
430
1S
umm
eral
l12
1.0
± 0.
41.
71 ±
0.4
12.
5 ±
0.6
0.51
± 0
.23
4.6
± 2.
72.
5 ±
1.8
38 ±
14
48 ±
17
82 ±
32
10(J
an-M
ar)
24
0.8
± 0.
21.
97 ±
0.5
22.
8 ±
0.7
0.63
± 0
.26
4.8
± 2.
32.
2 ±
1.2
45 ±
15
53 ±
16
92 ±
17
33
21.
5 ±
0.3
1.88
± 0
.10
2.7
± 0.
10.
32 ±
0.1
68.
4 ±
2.6
5.5
± 0.
627
± 1
232
± 1
375
± 3
52
5,6
31.
2 ±
0.5
1.56
± 0
.25
2.2
± 0.
40.
53 ±
0.2
84.
4 ±
1.2
2.2
± 1.
340
± 1
751
± 2
467
± 5
83
9,11
30.
6 ±
0.3
1.38
± 0
.29
2.0
± 0.
40.
46 ±
0.1
82.
1 ±
1.9
1.0
± 0.
736
± 1
148
± 1
295
± 7
2A
utum
nal
l9
1.4
± 0.
50.
58 ±
0.3
00.
8 ±
0.4
0.22
± 0
.22
1.3
± 1.
10.
8 ±
0.8
18 ±
18
47 ±
46
64 ±
49
9(A
pr-J
une)
23
1.3
± 0.
20.
70 ±
0.1
11.
0 ±
0.2
0.17
± 0
.29
1.4
± 0.
51.
1 ±
0.9
14 ±
23
29 ±
42
52 ±
68
33
12.
10.
650.
90.
502.
00.
439
8280
15
21.
4 ±
0.9
0.48
± 0
.22
0.7
± 0.
30.
01 ±
0.0
11.
0 ±
1.1
1.0
± 1.
01
± 1
2 ±
20
29,
113
1.2
± 0.
40.
51 ±
0.5
30.
7 ±
0.8
0.33
± 0
.10
1.3
± 1.
80.
6 ±
1.1
28 ±
882
± 3
110
0 ±
03
Win
ter
all
92.
5 ±
1.3
0.32
± 0
.27
0.4
± 0.
40.
13 ±
0.1
41.
0 ±
1.1
0.7
± 1.
011
± 1
133
± 3
862
± 4
69
(Jul
y-S
ept)
23
3.4
± 1
.70.
58 ±
0.2
60.
8 ±
0.4
0.13
± 0
.20
2.3
± 0.
81.
9 ±
1.1
11 ±
17
20 ±
29
50 ±
70
33
22.
0 ±
0.1
0.25
± 0
.15
0.4
± 0.
20.
24 ±
0.1
60.
6 ±
0.4
0.0
± 0.
020
± 1
392
± 9
92 ±
11
25
11.
80.
340.
50.
080.
70.
58
2628
19,
113
2.1
± 1.
40.
10 ±
0.1
70.
1 ±
0.2
0.06
± 0
.02
0.2
± 0.
30.
1 ±
0.2
6 ±
28
± 14
0 ±
03
All
all
411.
3 ±
1.0
0.99
± 0
.66
1.4
± 1.
00.
27 ±
0.2
42.
3 ±
2.3
1.4
± 1.
422
± 1
738
± 3
168
± 3
934
∗ p
oten
tial p
rodu
ctio
n gr
azed
was
est
imat
ed b
y ap
plyi
ng th
e gr
azin
g co
effic
ient
to th
e ch
loro
phyl
l a g
row
th d
ata
for
an u
ndilu
ted
seaw
ater
trea
tmen
t whi
ch r
ecei
ved
noad
ditio
nal n
itrog
en.
See
App
endi
x 4
for
estim
ates
of g
row
th r
ate
with
out n
itrog
en a
dditi
on.

22
4. DISCUSSION
4.1. The dilution method and its use in oligotrophic watersThere are a number of assumptions and limitations associated with the use of thedilution method for estimating microzooplankton grazing and phytoplankton growthrates, and these are reviewed in detail in Landry (1993). Some of the assumptions andrequirements of the dilution method, however, are difficult to examine. In particular,the grazing coefficient estimated by the dilution method reflects the mean number andcomposition of the grazers, which are present during the incubation period. Changesin grazer density over the incubation period, however, are not easily assessed and inthis study, they were not quantified. The initial grazer density (represented by dilutionlevel), rather than the average grazer density, was used in determinations of thegrowth and grazing coefficients. Although the application of initial dilution levels, inrepresenting relative concentrations of grazers, has been commonly practiced, it islikely to introduce some error in estimating growth and grazing coefficients.
Procedures of the dilution method generally include the pre-screening of experimentalseawater through a 200 µm mesh to remove larger zooplankters. The pre-screeningprocess, however, may cause considerable damage to large phytoplankton cells and tofragile nanoflagellates and ciliates. In this study, we chose not to pre-screen in orderto minimise grazer mortality and because concentrations of holozooplankton in PortPhillip Bay are known to be quite low compared to other temperate bays (MMBW &FWD 1973, Axelrad et al. 1981). Kimmerer and McKinnon (1985) reported netzooplankton (>200 µM) mean densities of only 1480 m-3 or <2 ind L-1. Because thegrazing rates estimated in this study include the grazing impact of microzooplanktersand some mesozooplankters, grazing rate estimates may be more representative of thebroader zooplankton community in Port Phillip Bay. And because mesozooplanktonpredate on the microzooplankton (review in Pierce and Turner 1992) as well as grazeon phytoplankton, they have the capacity to limit heterotrophic nanoflagellate andciliate population growth during incubation and thus may reduce errors associatedwith the use of initial grazer densities (dilution levels) for estimating growth andgrazing coefficients.
The dilution method assumes that chlorophyll a can be used as a reasonable measureof the growth of phytoplankton. It seems that this technique may be most appropriatefor use in waters, which do not require the addition of nutrients to ensure exponentialmicroalgal growth. Nutrient enhancement undoubtedly affects the physiological stateand growth rates of phytoplankton cells from oligotrophic waters. In this study,samples incubated with additional inorganic nitrogen during the spring and summer,when ambient levels were low (<0.4 µM NH4), often showed higher post-incubationlevels of chlorophyll a per cell within cells >2 µm. Observed growth in chlorophyll adid not always correspond to increases in cell concentration or cell size. It seems thatthe nutrient history of cells, as well as temperature (Geider 1987), may have beenfactors contributing to enhanced cellular levels of chlorophyll a when nutrients wereadded, particularly during summer. The experiments conducted for the midbay sites,which are likely to experience less dramatic fluctuations in NH4 concentration, and

23
where picophytoplankton predominate for much of the year, showed lower percentincreases in chlorophyll a content per cell than those observed for the coastal sites.This study suggests that the introduction of additional inorganic nitrogen may at timesraise cellular concentrations of chlorophyll a in Port Phillip Bay phytoplankton. Thisis an important issue as it is the chorophyll a data from the dilution series which isused to estimate phytoplankton growth rates. When the cellular level of chlorophyll ais elevated following incubation with additional nitrogen, then phytoplankton growthrates determined using the Dilution Method will be overestimated. Though thegrazing rate estimates are unaffected by changes in chlorophyll a content per cell, itmay be prudent to use an alternate method for future determinations of phytoplanktongrowth rates in Port Phillip Bay. Studies conducted in situ are also preferable to thosewhich are conducted in the laboratory under artificial light conditions.
4.2. Interpretation of phytoplankton growth dataSeasonal patterns in total phytoplankton growth were apparent for all stations, withgrowth rates being highest during spring and summer and lowest during winter, forboth nutrient enhanced and nonspiked treatments.
The nitrogen enhanced growth rates were often very high in summer, indicating up tothree chlorophyll a doublings per day, which cannot be considered reflective ofphytoplankton growth in the Bay at the time of sampling. Maximum growth ratesobserved in nitrogen spiked treatments exceeded those which have been reported fordilution experiments conducted elsewhere (Table 11). The rates observed in thisstudy, however, provide an indication of chlorophyll a growth when additionaldissolved inorganic nitrogen is added, and the likely growth response ofphytoplankton in the event of increased nutrient loading to Port Phillip Bay. Growthrates within the treatments which did not receive additional nutrients are probablyconservative estimates of phytoplankton growth for Bay waters due to potentialnutrient exhaustion during incubation, especially during the summer months. In situgrowth rates at the time of sampling were probably similar to, or slightly higher, thanthe nonspiked growth rates.

24
Table 11. A comparison of reported phytoplankton (chlorophyll a) growth rates (k)and microzooplankton grazing rates (g) determined using the dilution technique.Table adapted and extended from Gallegos (1989). * nitrogen added to incubationbottles.
Study Location Rangek (d -1)
Rangeg(d -1)
Source
Coastal Waters, Washington, USA 0.45-0.63 * 0.07-0.28 Landry & Hassett 1982
Kaneohe Bay, Hawaii, USA 1.40-2.00 * 0.10-0.40 Landry et al. 1984
Celtic Sea, British Isles 0.16-0.35 * 0.36-1.04 Burkill et al. 1987
Jones Sound, Canadian Arctic 0.06-0.34 * 0.02-0.17 Paranjape 1987
Halifax Harbour, Nova Scotia, CA 0.24-1.68 0.42-2.01 Gifford 1988
Rhode River, Maryland, USA 0.48-2.30 * 0.19-2.01 Gallegos 1989
Subarctic Pacific Ocean 0.25-0.67 0.05-0.31 Strom & Welschmeyer 1991
Norwegian fjords 0.37-0.67 * 0.43-0.56 Verity & Vernet 1992
Chesapeake Bay, USA 0.00-2.15 0.00-1.60 McManus & Ederington-Cantrell1992
Hiroshima Bay, Seto Inland Sea 0.33-1.87 0.14-1.23 Kamiyana 1994
Four League Bay, Gulf of Mexico 0.46-2.14 0.32-2.11 Dagg 1995
Port Phillip Bay, Australia 0.00-2.65 * 0.00-0.87 This study
4.3. Phytoplankton growth responses to temperature and NH4 additionIn spring and summer, when inorganic nitrogen levels were low, the addition of NH4
resulted in high growth rates (k = 1-2 µ d-1) for all three phytoplankton size fractions,particularly the nano and micro fractions. Without additional nitrogen, the growthrates of the nano and micro fractions during summer were limited (k generally < 0.5 µd-1). Relatively higher growth rates of the pico fraction under summer temperaturesand low nitrogen conditions demonstrated that the picophytoplankton were better ableto utilise available and regenerated pools of dissolved inorganic nitrogen and thusoutcompete the nano and microphytoplankton. This phenomenon is commonlyobserved in oligotrophic waters (Fenchel 1988) and explains the predominance of thepico fraction (up to 65% of total chlorophyll a) in mid-depth waters at most sitesduring the summer months.
During the autumn and winter months, when ambient NH4 levels were relatively high(0.4-1 µM), growth rates were reduced (k generally <0.6 µ d-1) and nutrient enhancedgrowth rate estimates were very similar to rates determined without additionalnitrogen. Because ambient nutrient levels appeared to be less limiting for microalgalgrowth during autumn and winter, estimates determined for this period may be goodapproximations of in situ growth rates.

25
Phytoplankton growth rates of the pico, nano and micro fractions were positivelycorrelated with temperature when inorganic nitrogen was added. One would thereforeexpect that increased NH4 loadings to the Bay during spring and summer would resultin substantial growth, particularly of the nano- and microphytoplankton, whichexhibited higher summer growth rates than the pico fraction. At temperatures >14°C,nutrient levels in bottles with undiluted seawater showed that, for a loss of 1 µM NH4,chlorophyll a concentration increased by 1-2.5 µg L-1. Experiments conducted duringwinter indicated no net decrease in NH4 concentration and little or no increases inchlorophyll a in undiluted seawater treatments. Though standing stocks ofchlorophyll a were relatively high in winter (1-5 µg L-1), phytoplankton growth rateswere low (mean = 0.32 µ d-1). This suggests that if inorganic nitrogen loads arefurther increased during winter, such inputs would not be immediately utilised byphytoplankton. This relationship should be further investigated in experimentsspecifically designed to assess year-round inorganic nitrogen utilisation andphytoplankton growth.
4.4. Grazing ratesSeasonal trends in community grazing rate were apparent at most sites, withmaximum grazing rates in summer (mean = 0.51 d-1) and with low grazing impact inwinter (mean = 0.13 d-1). High summer grazing coefficients observed in this studyhave also been noted in other estuarine and coastal water systems (Gallegos 1989,Kamiyana 1994, Dagg 1995). The grazing rates estimated for Port Phillip Bay watersalso fall within the range of values reported for other grazing studies which have usedthe dilution method (Table 11).
The high grazing rates exhibited during summer coincided with the seasonal increasein abundance of naulpii, copepodites and bivalve larvae. But, due to limited data onzooplankton composition in this study, the relative importance of the various grazers,including heterotrophic nanoflagellates and ciliates, remains unknown.
At most sites, grazing rates on the total phytoplankton population tended to mirrortotal chlorophyll a growth rates, with high grazing rates observed during peaks inchlorophyll a growth and reduced grazing rates when chlorophyll a growth rates werelow. The grazing impact on the fractions also tended to follow seasonal patterns ingrowth rates associated with the fractions. The grazing coefficients, however, tendedto be higher for the pico and nano fractions than for the microphytoplanktonsuggesting that small heterotrophs in Port Phillip Bay are most important in regulatingphytoplankton cells <20 µm. Similar results have been reported for other studies(Gifford 1985, Verity 1985).
The grazing rate on the pico fraction was highest for the midbay sites while the coastalsites, Werribee and Wooley’s Buoy, frequently showed highest grazing rates on thenano fraction. Low but significant levels of grazing on the micro fraction were shownat some stations in summer, however, 75% of experiments during this study exhibitedgrazing rate estimates on the micro fraction which were not significantly different

26
from zero (p<0.05). Strom and Welschmeyer (1991) also report very low grazingrates of microzooplankton on large phytoplankton cells in oligotrophic waters.
Negative grazing rates, which were commonly observed for the micro fraction duringthis study, were often associated with low initial chlorophyll a levels within the microfraction. Potential errors associated with the size fractionation process and thefrequent occurrence of gelatinous and amorphous material in incubated seawater mayhave contributed to low and negative grazing coefficients. Under-representation of thelarger zooplankton in the incubation bottles could also be a factor. Interestingly,negative grazing coefficients for the microphytoplankton were most frequentlyobserved for the western bay sites, Werribee and Clifton Springs. On only oneoccasion (June 1995) was the grazing coefficient for the micro fraction at Werribeesignificantly greater than zero (p<0.05). This is of interest as the Werribee sitereceives relatively large inputs of NH4 from the Werribee Treatment Plant (Murray1994), which could result in relatively high production of large diatoms anddinoflagellates within the micro fraction size range (>20 µm). Sedimentation of largecells is likely to occur if they are not grazed within the water column.
4.5. Total grazing impactEstimates of grazing impact determined in this study show much temporal and spatialvariability but general seasonal trends suggest that, over all sites, the mean grazingimpact on the initial phytoplankton standing stock was approximately 16% in spring,38% in summer, 18% in autumn and 11% in winter. High chlorophyll a standingstocks in winter reflect the reduced grazing pressure observed during this period.
Baywide estimates of grazing impact on potential production during summer averaged48% when nitrogen was added and 82% when phytoplankton growth was notenhanced by nutrient addition. Potential production calculations, for nitrogenenhanced treatments (Table 10), are likely to be overestimates, particularly duringsummer when ambient nutrient levels were low. Overestimates of daily growth wouldresult in an underestimation of grazing impact on phytoplankton production. Incontrast, potential production determined from growth rates without nitrogen additionmay be underestimated if incubated phytoplankton were more nutrient limited thanphytoplankton in situ. This scenario would result in overestimation of grazing impact,which is also most likely to occur for the summer months.
Mean estimates of grazing impact on algal production during autumn, winter andspring were in the range of 23-48% (nitrogen enhanced) and 47-64% (nonspiked) ofdaily production. The nonspiked estimates may be reasonable estimates of in situgrazing impact as most estimates from studies conduct elsewhere suggest thatmicrozooplankton graze between 40% and 60% of the primary production (Verity1986, Gifford 1988, Strom and Welschmeyer 1991, and others).
Overall, it appears that the microzooplankton are currently very important incontrolling the phytoplankton population, and perhaps even the size structure ofphytoplankton, in Port Phillip Bay. Though increased microalgal growth rates,

27
resulting from potentially larger inputs of nutrient to the Bay, could decrease thegrazing impact of current concentrations of micrograzers, it is also possible thatgreater phytoplankton production may result in increases in the size of thezooplankton population in Port Phillip Bay.
4.6. Other potentially important grazersGrazing by the larvacean, Oikopleura dioica, was not included in this study due toapparent high larvacean mortalities prior to incubation. However, they were presentduring November to June and in 65% of all experiments. Larvacean densities peakedduring summer with concentrations of up to 7 ind L-1. Zooplankton surveysconducted in previous years showed that Oikopleura dioica comprised approximately20% of holozooplankton (>200 µm) in Port Phillip Bay in 1983-84 (Kimmerer andMcKinnon 1985) and in 1986 (Fancett 1988). Larvaceans are capable of efficientlyclearing both pico- and nanophytoplankton (Deibel and Lee 1992) and whenabundant, may clear significantly more of the water column than crustaceanzooplankton (Knoechel and Steel-Flynn 1989). It is therefore highly probable thatOikopleura dioica has a significant impact on the pico- and nanophytoplanktonproduction in the Bay, particularly during nonwinter months.
The grazing and predation potential of Noctiluca scintillans, which is a relatively newresident of Port Phillip Bay waters, may be great and needs to be monitored. Theselarge flagellates (up to 2000 µM diam) have a tendency to congregate near the surface,are polyphagous (without any food preference) and have the capacity to efficientlyclear a broad range of food particles from the water column (Uhlig and Sahlig 1990).The fact that they feed on microzooplankton as well as phytoplankton was confirmedby occasional observations of bivalve larvae and nauplii in Noctiluca food vacuoles.In this study, the highest mid-depth densities of Noctiluca were found in seawatercollected from the eastern side of the Bay during December and early January (>80ind L-1). Their concentrations in surface waters were probably, at times, much greater.
28
5. ACKNOWLEDGMENTS
The successful completion of this study was the result of the contributions of many.Stan Gemlitski conducted the phytoplankton cell counts, Janelle Boyall identified andenumerated the ciliates, and Rob Cowdell conducted nitrogen analyses at the Marineand Freshwater Resources Institute Laboratory in Queenscliff. We extend muchappreciation to Simon Roberts for his assistance in the field, discussions re datainterpretation and for his support throughout the study. Many thanks are also extendedto Tara Vagg, Stuart Minchin, Ashley Liang and the crew of the Melita for theirassistance in the collection and transport of field samples. The advice and support ofJohn Beardall throughout the study was also greatly appreciated.
Melbourne Water Corporation as part of the Port Phillip Bay Environmental Studyfunded this work.
6. REFERENCES
Axelrad, D.M., Poore, G.C.B., Arnott, G.H., Bauld, J., Brown, V., Edwards, R.R.C.and N.H. Hickman. 1981. The effects of treated sewage discharge on the biota of PortPhillip Bay, Victoria, Australia. pp 279-306. In Estuaries and Nutrients. B.J. Neilsonand L.E. Cronin (eds). Humana Press, Clifton, N.J.
Beers, J.R., Reid, F.M.H. and G.L. Stewart. 1975. Microplankton of the North PacificCentral Gyre. Population structure and abundance, June 1973. Int. Revue ges.Hydrobiol. 60: 607-638.
Burkill, P.H., Mantoura, R.F.C., Llewellyn, C.A. and N.J.P. Owens. 1987.Microzooplankton grazing and selectivity of phytoplankton in coastal waters.Mar.Biol. 93: 581-590.
Crawford, C., Jenkins, G. and G. Edgar. 1992. Water column trophodynamics in PortPhillip Bay. Technical Report No.1, CSIRO Port Phillip Bay Environmental Study,Melbourne.
Dagg, M. 1995. Ingestion of phytoplankton by micro- and mesoplanktoncommunities in a productive subtropical estuary. J. Plankton Res. 17: 845-857.
Deibel, D. and S.H. Lee. 1992. Retention efficiency of sub-micrometer particles bythe pharyngeal filter of the pelagic tunicate Oikopleura vanhoeffeni. Mar. Ecol. Prog.Ser. 81: 25-30.
Fancett, M.S. 1988. The impact of predation by the scyphomedusae upon theabundance and species composition of the zooplankton of Port Phillip Bay, Victoria.Ph.D. thesis, University of Melbourne.
Fenchel, T. 1988. Marine plankton food chains. Annu. Rev. Ecol. Syst. 19: 19-38.

29
Gallegos, C.L. 1989. Microzooplankton grazing on phytoplankton in the RhodeRiver, Maryland: nonlinear feeding kinetics. Mar. Ecol. Prog. Ser. 57:23-33.
Geider, R.J. 1987. Light and temperature dependence of the carbon to chlorophyll aratio in microalgae and cyanobacteria: implications for physiology and growth ofphytoplankton. New Phytol. 106: 1-34
Gifford, D.J. 1985. Laboratory culture of marine planktonic oligotrichs (Ciliophora,Oligotrichida). Mar. Biol. Prog. Ser. 23: 257-267.
Gifford, D.J. 1988. Impact of grazing by microzooplankton in the north west arm ofHalifax Harbour Nova Scotia. Mar. Ecol. Prog. Ser. 47:249-258.
Holloway, M. and G. Jenkins. 1993. The role of zooplankton feeding in nitrogen andcarbon cycling in Port Phillip Bay. Technical Report No. 11. CSIRO Port Phillip BayEnvironmental Study, Melbourne.
Jeffrey, S.W. and G.F. Humphrey. 1975. New spectrophotometric equations fordetermining chlorophyll a, b, c1, and c2 in higher plants, algae and naturalphytoplankton. Biochem. Physiol. Pflanz. 167: 191-194.
Kamiyana T. 1994. The impact of grazing by microzooplankton in the northernHiroshima Bay the Seto Inland Seam, Japan. Mar. Biol. 119:77-88.
Kimmerer, W.J. and A.D. McKinnon. 1985. A comparative study of the zooplanktonin two adjacent embayments, Port Phillip and Western Port Bays, Australia. Estuar.Coast. Shelf. Sci. 21: 145-159.
Knoechel, R. and Steel-Flynn, D. 1989. Clearance rates of Oikopleura in cold coastalNewfoundland waters: a predictive model and its trophodynamic implications. Mar.Ecol. Prog. Ser. 53: 257-266.
Landry, M.R. 1993. Estimating rates of growth and grazing mortality ofphytoplankton by the dilution method. pp 715-722. In Handbook of Methods inAquatic Microbial Ecology. P.F. Kemp et al. (eds.) Lewis Publishers.
Landry, M.R., Haas, L.W. and V.L. Fagerness. 1984. Dynamics of microbial planktoncommunities: experiments in Kaneohe Bay, Hawaii. Mar. Ecol. Prog. Ser. 16:127-133.
Landry, M.R. and R.P. Hassett. 1982. Estimating the grazing impact of marinemicrozooplankton. Mar. Biol. 67: 283-288.
Longmore, A.R., Cowdell, R.A. and B. Abbott. 1995. Water Quality In Port PhillipBay 1990-95: Trends in nitrogen concentrations and evidence of nitrogen limitation.Interim Report, Victorian Fisheries Research Institute, Queenscliff, Australia.
McManus, G.B. and M.C. Ederington-Cantrell. 1992. Phytoplankton pigments andgrowth rates, and microzooplankton grazing in a large temperate estuary. Mar. Ecol.Prog. Ser. 87: 77-85.

30
MMBW and FWD (Melbourne and Metropolitan Board of Works and Fisheries andWildlife Division). 1973. Environmental Study of Port Phillip Bay: Report on PhaseOne 1968-1971. Melbourne and Metropolitan Board of Works, Melbourne, Victoria.372 pp.
Murray, A.G. 1994. Western Treatment Plant outputs to Port Phillip Bay. TechnicalReport No. 15, CSIRO Port Phillip Bay Environmental Study, Melbourne.
Paranjape, M.A. 1987. Grazing by microzooplankton in eastern Canadian Arcticsummer 1983. Mar. Ecol. Prog. Ser. 40: 239-246.
Paranjape, M.A. 1990. Microzooplankton herbivory on the Grand Bank(Newfoundland, Canada): a seasonal study. Mar. Biol 107: 321-328.
Pierce, R.W. and J.T. Turner. 1992. Ecology of planktonic ciliates in marine foodwebs. Rev. Aquat. Sci. 6(2): 139-181.
Porter, K.G., Sherr, E.B., Sherr, B.F., Pace, M. and R.W. Sanders. 1985. Protozoa inplanktonic food webs. J Protozool. 32: 409-415.
Sherr E.B., Caron D.A. and B.F. Sherr. 1993. Staining of heterotrophic protists forvisualization via epifluorescence. pp 213-228. In Handbook of Methods in AquaticMicrobial Ecology. P.F. Kemp et al. (eds.), Lewis Publishers.
Sherr E.B. and B.F. Sherr. 1984. Role of heterotrophic protozoa in carbon and energyflow in aqautic ecosystems. pp 412-423. In Current Perspectives in MicrobialEcology. M.J. King and C.A.Reddy (eds.), American Society for Microbiology,Washington, DC.
Strom, S.L. and N.A. Welschmeyer. 1991. Pigment-specific rates of phytoplanktongrowth and microzooplankton grazing in the open subarctic Pacific Ocean. Limnol.Oceanogr. 36: 50-63.
Uhlig, G. and G. Sahling, 1990. Long-term studies on Noctiluca scintillans in theGerman Bight: population dynamics and red tide phenomena 1968-1988. Neth. J. SeaRes.: 25: 101-112.
Verity, P.G. 1985. Grazing, respiration, excretion and growth rates of tintinnids.Limnol. Oceanogr. 30: 1268-1282.
Verity, P.G. 1986. Grazing of the phototrophic nanoplankton by microzooplankton inNarragansett Bay. Mar. Ecol. Prog. Ser. 29: 105-115.
Verity, P.G. and M.Vernet. 1992. Microzooplankton grazing, pigments andcomposition of plankton communities during late spring in two Norwegian fjords.Sarsia 77: 263-274.

31
Appendix 1. Summary of the sample collection dates, water temperature (in situ andincubation), initial NH4 levels and initial chlorophyll a concentrations. (nd = notdetermined)
Station Date of Sample Temp Initial Initial Chloroph yll aLocation Collection
(°C)NH4(µM)
Total
(µgL-1) %
Pico%
Nano% Micro
Wooley's 12-Oct-94 12.5 nd 0.34 55 41 4Buoy 9-Nov-94 14.5 nd 1.06 27 56 17
(Stn 2) 6-Dec-94 18.0 0.85 0.43 52 44 44-Jan-95 20.5 0.46 0.62 18 22 60
31-Jan-95 21.8 nd 0.58 38 36 2627-Feb-95 21.5 0.12 0.95 37 37 2627-Mar-95 19.0 0.11 0.85 45 25 3126-Apr-95 14.5 0.73 1.21 27 37 3623-May-95 14.0 nd 1.54 43 45 1220-Jun-95 11.5 0.99 1.17 48 37 1618-Jul-95 10.5 nd 4.03 38 32 2815-Aug-95 10.5 0.44 4.66 11 12 7711-Sep-95 10.0 0.40 1.46 45 33 22
Sandringham 13-Oct-94 12.5 nd 0.56 42 53 4(Stn 3) 11-Dec-94 17.0 0.80 1.00 27 54 19
24-Jan-95 21.5 0.13 1.70 32 48 1929-Mar-95 18.5 0.28 1.29 27 17 5724-May-95 14.0 nd 2.15 32 32 3617-Jul-95 11.0 0.81 1.91 31 33 3714-Sep-95 11.0 0.48 2.08 56 41 3
Werribee 13-Oct-94 13.1 nd 0.87 30 54 15(Stn 5) 10-Nov-94 14.1 nd 0.78 41 51 8
4-Jan-95 20.1 0.21 1.03 67 28 43-Mar-95 21.5 0.08 0.83 35 39 2624-Apr-95 15.0 0.36 2.02 38 23 3922-Jun-95 11.0 0.41 0.78 38 54 814-Aug-95 10.5 0.72 1.76 36 20 44
Clifton 14-Oct-94 13.0 nd 0.70 51 43 6Springs 11-Nov-94 17.0 nd 0.78 43 40 16(Stn 6) 28-Mar-95 19.0 nd 1.83 33 13 54
midbay NE 5-Jan-95 21.5 0.08 0.40 55 37 8(Stn 9) 1-Mar-95 21.5 0.09 0.95 51 26 23
22-May-95 13.0 nd 1.22 48 38 1420-Jul-95 10.0 nd 3.67 17 70 1310-Sep-95 10.0 0.47 1.20 68 30 3
midbay SW 14-Oct-94 12.6 nd 0.23 44 47 9(Stn 11) 10-Dec-94 20.1 0.65 0.35 51 42 7
2-Feb-95 21.5 0.24 0.49 54 32 1427-Apr-95 15.0 0.36 1.68 31 18 5121-Jun-95 12.0 0.75 0.80 47 42 1119-Aug-95 10.0 0.33 1.40 21 26 53

32
Appendix 2. Phytoplankton cell concentration and cell volume (cells >2 µm) inundiluted, unfractionated samples before and after 24 hr incubation with 1-3 µMinorganic nitrogen.
Date Site Cell Concentration (L -1) % Cell Volume ( µm3 L-1) %Initial Final diff Initial Final diff
12-Oct-94 2* 7.6 x 10 2 8.4 x 10 2 11 4.3 x 10 6 5.9 x 10 6 3714-Oct-94 3* 5.6 x 10 2 6.0 x 10 2 7 1.7 x 10 6 3.3 x 10 6 9414-Oct-94 5 4.8 x 10 4 2.0 x 10 4 -59 9.0 x 10 7 1.5 x 10 7 -8315-Oct-94 6 3.4 x 10 4 2.0 x 10 4 -39 1.7 x 10 7 1.1 x 10 7 -3314-Oct-94 11 8.0 x 10 4 5.5 x 10 4 -32 4.0 x 10 7 7.2 x 10 7 809-Nov-94 2 8.7 x 10 4 1.0 x 10 5 19 7.0 x 10 7 4.6 x 10 7 -35
10-Nov-94 5 2.5 x 10 5 nd nd 1.3 x 10 8 nd nd11-Nov-94 6 4.8 x 10 4 7.5 x 10 4 57 3.4 x 10 7 7.4 x 10 7 1197-Dec-94 2* 1.3 x 10 3 1.1 x 10 4 750 5.2 x 10 6 1.9 x 10 7 265
11-Dec-94 3 1.5 x 10 5 9.6 x 10 4 -38 2.0 x 10 8 1.6 x 10 8 -2111-Dec-94 11 3.8 x 10 4 5.7 x 10 4 49 1.0 x 10 8 1.1 x 10 8 94-Jan-95 2 2.2 x 10 5 nd nd 3.1 x 10 8 nd nd4-Jan-95 5 1.6 x 10 5 nd nd 4.5 x 10 7 nd nd6-Jan-95 9 4.3 x 10 4 nd nd 5.8 x 10 7 nd nd
31-Jan-95 2 3.0 x 10 5 3.8 x 10 5 29 3.6 x 10 9 3.8 x 10 9 424-Jan-95 3 9.0 x 10 5 9.0 x 10 5 0 7.2 x 10 9 6.3 x 10 9 -122-Feb-95 11 9.5 x 10 4 1.9 x 10 5 102 1.1 x 10 9 1.2 x 10 9 5
27-Feb-95 2 3.9 x 10 4 1.1 x 10 5 174 2.6 x 10 9 3.2 x 10 9 344-Mar-95 5 1.3 x 10 5 1.3 x 10 5 -1 1.5 x 10 9 1.1 x 10 9 -311-Mar-95 9 1.4 x 10 5 1.7 x 10 5 25 4.1 x 10 9 6.2 x 10 9 52
27-Mar-95 2 1.8 x 10 5 2.5 x 10 5 35 6.8 x 10 9 1.4 x 10 10 11229-Mar-95 3 1.2 x 10 6 8.8 x 10 5 -29 1.7 x 10 10 1.5 x 10 10 -1228-Mar-95 6 4.7 x 10 5 5.3 x 10 5 12 5.2 x 10 10 6.0 x 10 10 1526-Apr-95 2 7.3 x 10 5 9.4 x 10 5 29 3.2 x 10 9 3.9 x 10 9 2224-Apr-95 5 6.6 x 10 5 1.0 x 10 6 53 8.3 x 10 8 4.2 x 10 9 40527-Apr-95 11 1.2 x 10 6 1.4 x 10 6 12 7.1 x 10 9 2.9 x 10 9 -5823-May-95 2 7.2 x 10 5 nd nd 5.1 x 10 9 nd nd24-May-95 3 1.3 x 10 6 1.4 x 10 6 8 3.4 x 10 9 3.2 x 10 9 -422-May-95 9 3.5 x 10 5 4.6 x 10 5 31 8.8 x 10 8 1.1 x 10 9 2020-Jun-95 2 2.7 x 10 5 5.6 x 10 5 104 6.4 x 10 8 1.7 x 10 9 16322-Jun-95 5 1.7 x 10 5 2.8 x 10 5 65 7.9 x 10 8 1.2 x 10 9 5321-Jun-95 11 1.6 x 10 5 2.2 x 10 5 37 2.5 x 10 8 5.6 x 10 8 12018-Jul-95 2 1.3 x 10 6 1.8 x 10 6 42 9.5 x 10 9 1.1 x 10 10 1617-Jul-95 3 4.6 x 10 5 8.0 x 10 5 71 3.1 x 10 9 3.6 x 10 9 1720-Jul-95 9 5.6 x 10 5 7.6 x 10 5 34 2.6 x 10 9 2.7 x 10 9 215-Aug-95 2 5.3 x 10 6 9.5 x 10 5 -82 2.3 x 10 10 1.1 x 10 10 -5214-Aug-95 5 3.6 x 10 5 3.4 x 10 6 836 1.2 x 10 9 1.5 x 10 10 118019-Aug-95 11 1.4 x 10 6 1.3 x 10 6 -7 5.9 x 10 9 5.5 x 10 9 -711-Sep-95 2 2.4 x 10 5 3.2 x 10 5 36 3.9 x 10 8 4.7 x 10 8 2214-Sep-95 3 1.3 x 10 6 1.4 x 10 6 8 4.1 x 10 9 3.9 x 10 9 -410-Sep-95 9 1.7 x 10 5 1.9 x 10 5 12 2.2 x 10 8 2.4 x 10 8 7
nd = not determined * cell counts very low (probably due to incomplete fixation)

33
Appendix 3. Dominant phytoplankton species (<2 µm) and cell concentrations inundiluted experimental bottles before and after 24 hr incubation with 1-3 µMinorganic nitrogen.
Date ofIncubation
Site InitialDominant Species
Initial cells L -1
FinalDominant Species
Finalcells L -1
14-Oct-94 5 Thalassiosira mala 4.7 x 10⁴ Thalassiosira mala 1.8 x 10415-Oct-94 6 Pyramimonas sp. 1.5 x 10⁴ Pyramimonas sp. 1.0 x 10414-Oct-94 11 Pseudonitzschia pungens 1.4 x 10⁴ Teleaulax amphioxeia 1.4 x 10⁴
Leucocryptos marina 3.8 x 10⁴ Proboscia alata 2.8 x 1049-Nov-94 2 Thalassiosira mala 4.9 x 10⁴ Thalassiosira mala 3.6 x 10⁴
10-Nov-94 5 Thalassiosira mala 2.2 x 10⁵ Thalassiosira mala 5.2 x 10411-Nov-94 6 Plagioselmis prolonga 2.5 x 10⁴ Katodinium rotundatum 3.9 x 10411-Dec-94 3 Pseudonitzchia pungens 6.2 x 10⁴ Pseudonitzchia pungens 1.6 x 10⁴
Imantonia rotunda 1.6 x 10411-Dec-94 11 Leucocryptos marina 1.7 x 10⁴ Leucocryptos marina 2.1 x 10⁴
Cymbomonas tetramitiformis 1.3 x 10⁴Pseudonitzchia pungens 1.2 x 10⁴
4-Jan-95 2 Corymbellus aureus 1.3 x 10⁵ nd4-Jan-95 5 Leucocryptos marina 4.3 x 10⁴ nd
Hemiselmis virescens 6.1 x 1046-Jan-95 9 Plagioselmis prolonga 1.2 x 10⁴ nd
31-Jan-95 2 Rhizosolenia delicatula 1.4 x 10⁵ Rhizosolenia delicatula 1.2 x 10⁵Guinardia flaccida 5.8 x 10⁴ Guinardia flaccida 6.5 x 10⁴
24-Jan-95 3 Skeletonema costatum 2.6 x 10⁵ Skeletonema costatum 2.0 x 10⁵Plagioselmis prolonga 1.2 x 10⁵ Plagioselmis prolonga 6.7 x 10⁴Leucocryptos marina 6.7 x 10⁴ Leucocryptos marina 8.0 x 10⁴
2-Feb-95 11 Leucocryptos marina 3.2 x 10⁴ Pseudonitzchia pungens 5.3 x 10⁴Rhizosolenia delicatula 3.4 x 10⁴
27-Feb-95 2 Proboscia alata 1.9 x 10⁴ Proboscia alata 2.0 x 10⁴Plagioselmis prolonga 6.7 x 10⁴
4-Mar-95 5 Plagioselmis prolonga 2.2 x 10⁴ Plagioselmis prolonga 2.1 x 10⁴Leucocryptos marina 2.1 x 10⁴
1-Mar-95 9 Proboscia alata 1.9 x 10⁴ Proboscia alata 2.5 x 10⁴Pyramimonas spp. 2.4 x 10⁴ Pyramimonas spp. 2.5 x 10⁴
27-Mar-95 2 Proboscia alata 6.2 x 10⁴ Proboscia alata 7.2 x 10⁴Leucocryptos marina 2.2 x 10⁴ Leucocryptos marina 2.4 x 10⁴
Gymnodinium sp. 3.6 x 10429-Mar-95 3 Proboscia alata 7.2 x 10⁴ Proboscia alata 1.0 x 10⁵
Skeletonema costatum 6.3 x 10⁵ Skeletonema costatum 1.7 x 10⁵Chaetoceros sp. 1.6 x 10⁵ Chaetoceros sp. 1.2 x 10⁵
Cymbomonas tetramitiformis 1.2 x 10528-Mar-95 6 Proboscia alata 2.5 x 10⁵ Proboscia alata 3.4 x 10526-Apr-95 2 Pseudonitzchia pungens 9.1 x 10⁴ Pseudonitzchia pungens 1.6 x 10⁵
Phaeocystis pouchettii 1.2 x 10⁵ Phaeocystis pouchettii 1.1 x 10524-Apr-95 5 Chaetoceros socialis 5.5 x 10⁵ Chaetoceros socialis 2.1 x 10⁵
Plagioselmis prolonga 3.1 x 10⁴ Plagioselmis prolonga 1.7 x 10⁵
nd = not determined. Data from 3 samples with very low cell counts (<104 cells L-1) notincluded.
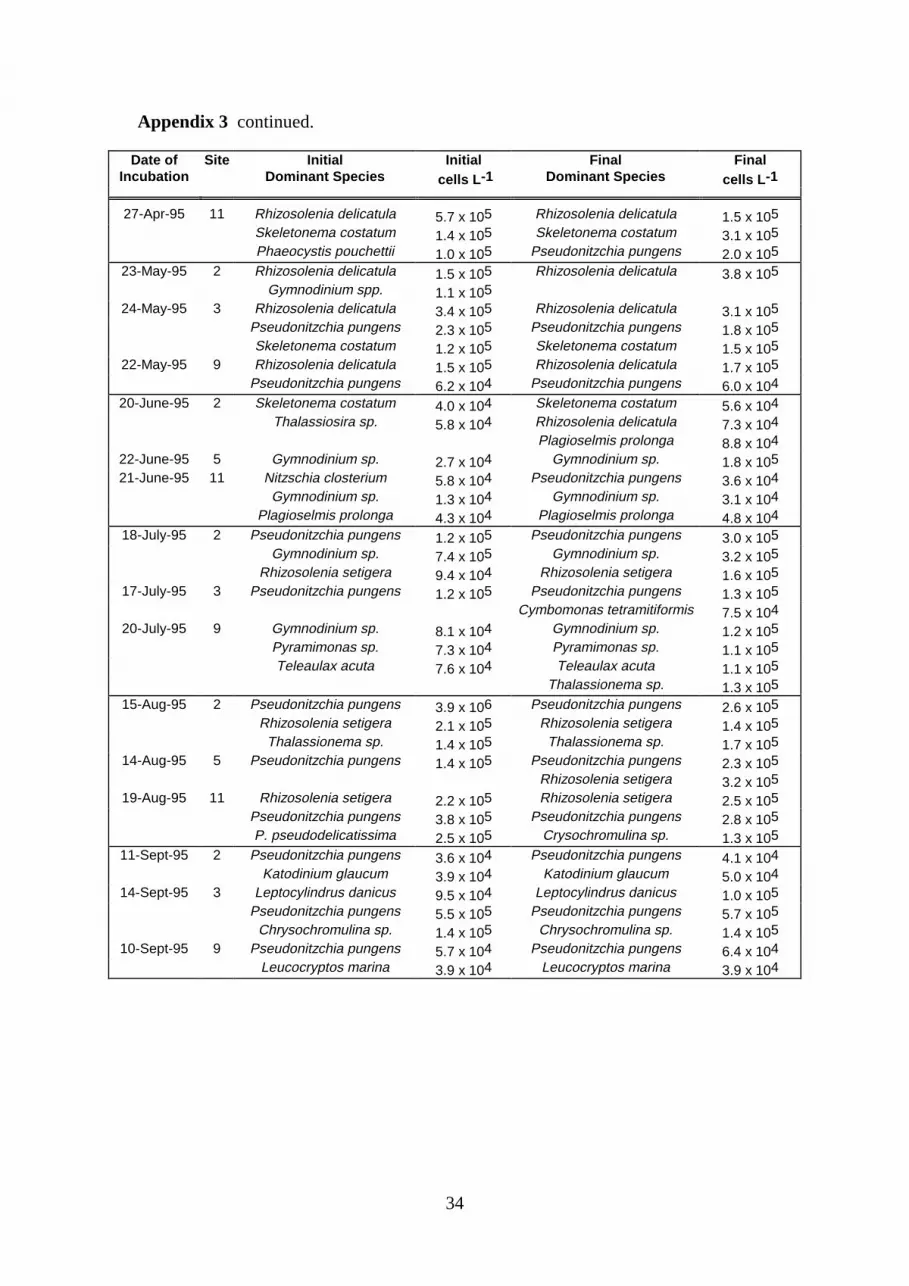
34
Appendix 3 continued.
Date ofIncubation
Site InitialDominant Species
Initial cells L -1
FinalDominant Species
Finalcells L -1
27-Apr-95 11 Rhizosolenia delicatula 5.7 x 10⁵ Rhizosolenia delicatula 1.5 x 10⁵Skeletonema costatum 1.4 x 10⁵ Skeletonema costatum 3.1 x 10⁵Phaeocystis pouchettii 1.0 x 10⁵ Pseudonitzchia pungens 2.0 x 10⁵
23-May-95 2 Rhizosolenia delicatula 1.5 x 10⁵ Rhizosolenia delicatula 3.8 x 10⁵Gymnodinium spp. 1.1 x 10⁵
24-May-95 3 Rhizosolenia delicatula 3.4 x 10⁵ Rhizosolenia delicatula 3.1 x 10⁵Pseudonitzchia pungens 2.3 x 10⁵ Pseudonitzchia pungens 1.8 x 10⁵Skeletonema costatum 1.2 x 10⁵ Skeletonema costatum 1.5 x 10⁵
22-May-95 9 Rhizosolenia delicatula 1.5 x 10⁵ Rhizosolenia delicatula 1.7 x 10⁵Pseudonitzchia pungens 6.2 x 10⁴ Pseudonitzchia pungens 6.0 x 10⁴
20-June-95 2 Skeletonema costatum 4.0 x 10⁴ Skeletonema costatum 5.6 x 10⁴Thalassiosira sp. 5.8 x 10⁴ Rhizosolenia delicatula 7.3 x 10⁴
Plagioselmis prolonga 8.8 x 10422-June-95 5 Gymnodinium sp. 2.7 x 10⁴ Gymnodinium sp. 1.8 x 10521-June-95 11 Nitzschia closterium 5.8 x 10⁴ Pseudonitzchia pungens 3.6 x 10⁴
Gymnodinium sp. 1.3 x 10⁴ Gymnodinium sp. 3.1 x 10⁴Plagioselmis prolonga 4.3 x 10⁴ Plagioselmis prolonga 4.8 x 10⁴
18-July-95 2 Pseudonitzchia pungens 1.2 x 10⁵ Pseudonitzchia pungens 3.0 x 10⁵Gymnodinium sp. 7.4 x 10⁵ Gymnodinium sp. 3.2 x 10⁵
Rhizosolenia setigera 9.4 x 10⁴ Rhizosolenia setigera 1.6 x 10517-July-95 3 Pseudonitzchia pungens 1.2 x 10⁵ Pseudonitzchia pungens 1.3 x 10⁵
Cymbomonas tetramitiformis 7.5 x 10420-July-95 9 Gymnodinium sp. 8.1 x 10⁴ Gymnodinium sp. 1.2 x 10⁵
Pyramimonas sp. 7.3 x 10⁴ Pyramimonas sp. 1.1 x 10⁵Teleaulax acuta 7.6 x 10⁴ Teleaulax acuta 1.1 x 10⁵
Thalassionema sp. 1.3 x 10515-Aug-95 2 Pseudonitzchia pungens 3.9 x 10⁶ Pseudonitzchia pungens 2.6 x 10⁵
Rhizosolenia setigera 2.1 x 10⁵ Rhizosolenia setigera 1.4 x 10⁵Thalassionema sp. 1.4 x 10⁵ Thalassionema sp. 1.7 x 10⁵
14-Aug-95 5 Pseudonitzchia pungens 1.4 x 10⁵ Pseudonitzchia pungens 2.3 x 10⁵Rhizosolenia setigera 3.2 x 10⁵
19-Aug-95 11 Rhizosolenia setigera 2.2 x 10⁵ Rhizosolenia setigera 2.5 x 10⁵Pseudonitzchia pungens 3.8 x 10⁵ Pseudonitzchia pungens 2.8 x 10⁵P. pseudodelicatissima 2.5 x 10⁵ Crysochromulina sp. 1.3 x 10⁵
11-Sept-95 2 Pseudonitzchia pungens 3.6 x 10⁴ Pseudonitzchia pungens 4.1 x 10⁴Katodinium glaucum 3.9 x 10⁴ Katodinium glaucum 5.0 x 10⁴
14-Sept-95 3 Leptocylindrus danicus 9.5 x 10⁴ Leptocylindrus danicus 1.0 x 10⁵Pseudonitzchia pungens 5.5 x 10⁵ Pseudonitzchia pungens 5.7 x 10⁵
Chrysochromulina sp. 1.4 x 10⁵ Chrysochromulina sp. 1.4 x 10510-Sept-95 9 Pseudonitzchia pungens 5.7 x 10⁴ Pseudonitzchia pungens 6.4 x 10⁴
Leucocryptos marina 3.9 x 10⁴ Leucocryptos marina 3.9 x 10⁴

35
Appendix 4. Total phytoplankton population grazing and chl a growth coefficientsdetermined using the Dilution Method with and without nitrogen addition.
Date ofIncubation
Site Grazing rate (g) Growth rate (k)NH4 added
Growth rateNH4 not added
g (day-1) St Error k (day-1) St Error k (day-1)
12-Oct-94 2 0.358 0.134 0.862 0.092 nd14-Oct-94 3 -0.001^ 0.110 0.324 0.075 nd14-Oct-94 5 0.283^ 0.125 1.210 0.086 nd15-Oct-94 6 -0.016^ 0.047 0.405 0.032 nd14-Oct-94 11 0.133^ 0.107 0.661 0.073 nd9-Nov-94 2 0.228 0.056 1.211 0.037 nd
10-Nov-94 5 0.277 0.046 1.740 0.028 0.40211-Nov-94 6 0.051^ 0.080 1.438 0.053 -0.0407-Dec-94 2 0.380 0.049 1.654 0.033 1.181
11-Dec-94 3 0.108 0.030 1.117 0.020 0.12811-Dec-94 11 0.168 0.048 1.437 0.032 0.7074-Jan-95 2 0.645 0.045 2.651 0.029 1.2424-Jan-95 5 0.811 0.048 1.417 0.031 0.4216-Jan-95 9 0.426 0.025 1.156 0.017 nd
31-Jan-95 2 0.868 0.086 2.095 0.047* 0.57624-Jan-95 3 0.437 0.088 1.947 0.058 0.3282-Feb-95 11 0.291 0.047 1.272 0.031 0.327
27-Feb-95 2 0.266 0.034 1.498 0.023 0.0874-Mar-95 5 0.245 0.058 1.853 0.038 0.2251-Mar-95 9 0.655 0.044 1.702 0.029 0.354
27-Mar-95 2 0.721 0.094 1.655 0.062 0.68829-Mar-95 3 0.206 0.031 1.804 0.021 0.46628-Mar-95 6 0.539 0.151 1.412 0.021 -0.18526-Apr-95 2 -0.012^ 0.065 0.640 0.089 -0.02324-Apr-95 5 0.016^ 0.032 0.638 0.015 -0.16827-Apr-95 11 0.369 0.120 1.107 0.096 0.35023-May-95 2 0.009^ 0.056 0.829 0.038 0.31724-May-95 3 0.500 0.050 0.653 0.122 0.67722-May-95 9 0.214 0.083 0.110 0.055 -0.08920-Jun-95 2 0.508 0.073 0.622 0.128 0.43422-Jun-95 5 -0.210~ 0.069 0.323 0.062 0.03921-Jun-95 11 0.407 0.060 0.314 0.124 0.23318-Jul-95 2 -0.009^ 0.092 0.349 0.061 0.07917-Jul-95 3 0.120^ 0.097 0.141 0.070 0.14420-Jul-95 9 0.076^ 0.138 -0.128 0.091 -0.31015-Aug-95 2 0.029^ 0.077 0.531 0.056 -0.51914-Aug-95 5 0.078^ 0.067 0.342 0.044 0.31719-Aug-95 11 0.064^ 0.104 0.288 0.071 -0.07311-Sep-95 2 0.366 0.077 0.867 0.099 0.36914-Sep-95 3 0.351 0.047 0.359 0.088 0.22910-Sep-95 9 0.041^ 0.051 -0.065 0.023 -0.310
nd not determined, * standard error for chl a growth rate without NH4 addition,
^ not significantly different from zero, ~ significantly less than zero.

36
Appendix 5. Picophytoplankton fraction (0.2-2 µm) grazing and chl a growthcoefficients determined using the Dilution Method with and without nitrogen addition.
Date ofIncubation
Site Grazing rate (g) Growth rate (k)NH4 added
Growth rateNH4 not added
g (day-1) St Error k (day-1) St Error k (day-1)
12-Oct-94 2 0.431^ 0.096 0.910 0.157 nd14-Oct-94 3 -0.218^ 0.218 0.320 0.198 nd14-Oct-94 5 -0.282^ 0.229 1.160 0.171 nd15-Oct-94 6 0.361 0.290 0.552 0.066 nd14-Oct-94 11 0.151^ 0.270 0.712 0.149 nd9-Nov-94 2 0.213^ 0.053 1.596 0.116 nd
10-Nov-94 5 0.235 0.085 1.786 0.033 0.67811-Nov-94 6 0.416 0.174 1.393 0.057 0.2737-Dec-94 2 0.189^ 0.152 1.709 0.078 1.283
11-Dec-94 3 0.273^ 0.118 0.570 0.148 0.01911-Dec-94 11 0.156^ 0.224 1.541 0.101 0.8084-Jan-95 2 0.736 0.063 1.837 0.047 0.7834-Jan-95 5 1.147 0.052 1.484 0.034 0.7936-Jan-95 9 0.497 0.072 1.403 0.043 nd
31-Jan-95 2 0.672 0.250 1.747 0.166* 0.68424-Jan-95 3 0.434 0.200 1.705 0.119 0.6382-Feb-95 11 0.424 0.179 1.450 0.132 0.558
27-Feb-95 2 0.162^ 0.136 1.419 0.090 0.2594-Mar-95 5 0.759 0.122 1.813 0.081 0.4581-Mar-95 9 0.672 0.074 1.837 0.049 0.567
27-Mar-95 2 0.402 0.059 1.331 0.039 0.11029-Mar-95 3 0.300^ 0.269 1.674 0.120 0.75628-Mar-95 6 0.216^ 0.181 1.532 0.184 0.17926-Apr-95 2 -0.078^ 0.152 0.470 0.174 0.45524-Apr-95 5 0.320 0.053 0.359 0.026 0.10327-Apr-95 11 0.150^ 0.261 0.106 0.208 0.07523-May-95 2 0.126^ 0.224 0.850 0.042 0.25224-May-95 3 0.702 0.225 0.378 0.149 0.69422-May-95 9 -0.044^ 0.164 -0.674 0.109 -0.57420-Jun-95 2 0.404 0.117 0.479 0.049 0.36022-Jun-95 5 0.339 0.098 0.749 0.154 0.42121-Jun-95 11 0.511 0.095 0.321 0.160 0.42518-Jul-95 2 0.381 0.130 -0.023 0.086 -0.13017-Jul-95 3 0.156 0.063 0.113 0.042 0.16420-Jul-95 9 0.578 0.123 0.150 0.084 0.52215-Aug-95 2 0.284 0.150 0.261 0.100 0.22014-Aug-95 5 -0.057^ 0.108 0.217 0.072 0.23919-Aug-95 11 0.105 0.136 0.259 0.090 0.25511-Sep-95 2 0.434 0.049 0.795 0.033 0.34314-Sep-95 3 0.074^ 0.043 0.182 0.028 0.19010-Sep-95 9 0.037 0.053 -0.241 0.035 -0.072
nd not determined, * standard error for chl a growth rate without NH4 addition,
^ not significantly different from zero.

37
Appendix 6. Nanophytoplankton fraction (2-20 µm) grazing and chl a growthcoefficients determined using the Dilution Method with and without nitrogen addition.
Date ofIncubation
Site Grazing rate (g) Growth rate (k)NH4 added
Growth rateNH4 not added
g (day-1) St Error k (day-1) St Error k (day-1)
12-Oct-94 2 0.294 0.110 0.880 0.075 nd14-Oct-94 3 0.542^ 0.222 0.463 0.152 nd14-Oct-94 5 0.342^ 0.184 1.415 0.126 nd15-Oct-94 6 -0.507~ 0.168 0.211 0.115 nd14-Oct-94 11 0.055^ 0.208 0.722 0.142 nd9-Nov-94 2 0.192^ 0.185 0.811 0.123 nd
10-Nov-94 5 0.365 0.049 1.899 0.030 0.20811-Nov-94 6 -0.044^ 0.079 1.624 0.052 -0.0447-Dec-94 2 0.384^ 0.264 1.327 0.175 0.834
11-Dec-94 3 0.171^ 0.087 1.300 0.058 0.29611-Dec-94 11 0.432^ 0.257 1.276 0.171 0.8394-Jan-95 2 1.309 0.299 2.030 0.194 1.9654-Jan-95 5 0.447 0.135 1.436 0.088 0.1626-Jan-95 9 0.139^ 0.232 0.571 0.088 nd
31-Jan-95 2 0.382 0.140 1.007 0.093* -0.13224-Jan-95 3 0.392 0.168 1.407 0.111 0.6652-Feb-95 11 0.216^ 0.390 0.825 0.259 0.107
27-Feb-95 2 0.665 0.161 1.680 0.107 0.2314-Mar-95 5 0.430 0.085 1.610 0.056 0.5801-Mar-95 9 0.438 0.068 1.332 0.045 0.260
27-Mar-95 2 0.057^ 0.113 1.171 0.075 0.38329-Mar-95 3 0.157^ 0.147 2.170 0.097 0.83128-Mar-95 6 0.292 0.070 1.238 0.042 0.52026-Apr-95 2 0.939 0.072 1.105 0.048 0.56224-Apr-95 5 0.078^ 0.096 0.521 0.063 -0.03427-Apr-95 11 0.284^ 0.158 0.506 0.126 0.00523-May-95 2 0.040^ 0.058 0.475 0.032 0.31524-May-95 3 0.589 0.109 0.942 0.073 1.00522-May-95 9 0.150^ 0.091 0.109 0.060 0.11720-Jun-95 2 0.102^ 0.134 0.370 0.089 0.13022-Jun-95 5 -0.238^ 0.128 0.405 0.091 0.26921-Jun-95 11 0.197 0.065 0.090 0.089 -0.11818-Jul-95 2 0.326 0.074 0.533 0.049 0.20917-Jul-95 3 0.181^ 0.111 0.181 0.074 0.08920-Jul-95 9 -0.120^ 0.107 -0.434 0.073 -0.64815-Aug-95 2 0.909 0.166 1.469 0.110 1.27414-Aug-95 5 0.893 0.160 0.883 0.106 0.93319-Aug-95 11 0.061^ 0.107 0.049 0.071 -0.30411-Sep-95 2 0.183^ 0.089 0.665 0.059 0.16914-Sep-95 3 0.007^ 0.124 -0.079 0.082 -0.09210-Sep-95 9 -0.004^ 0.074 0.002 0.049 -0.038
nd not determined, * standard error for chl a growth rate without NH4 addition,
^ not significantly different from zero, ~ significantly less than zero.

38
Appendix 7. Microphytoplankton fraction (<20 µm) grazing and chl a growthcoefficients determined using the Dilution Method with and without nitrogen addition.
Date ofIncubation
Site Grazing rate (g) Growth rate (k)NH4 added
Growth rateNH4 not added
g (day-1) St Error k (day-1) St Error k (day-1)
12-Oct-94 2 -0.325~ 0.130 0.638 0.089 nd14-Oct-94 3 -0.351~ 0.112 -0.079 0.076 nd14-Oct-94 5 -0.978~ 0.127 0.377 0.089 nd15-Oct-94 6 -0.482~ 0.116 0.250 0.080 nd14-Oct-94 11 -0.417~ 0.130 -0.516 0.099 nd9-Nov-94 2 0.128^ 0.219 0.879 0.145 nd
10-Nov-94 5 -0.451^ 0.227 1.739 0.140 0.46211-Nov-94 6 -0.215^ 0.252 1.287 0.167 0.4477-Dec-94 2 -0.026^ 0.092 2.000 0.061 1.052
11-Dec-94 3 -0.343^ 0.153 1.191 0.102 -0.09011-Dec-94 11 0.058^ 0.147 1.714 0.089 0.4964-Jan-95 2 0.578 0.063 2.980 0.041 1.2794-Jan-95 5 -0.384~ 0.132 0.976 0.086 0.1026-Jan-95 9 0.297 0.117 0.778 0.080 nd
31-Jan-95 2 -0.003^ 0.129 1.808 0.086* 0.18624-Jan-95 3 0.515 0.184 2.850 0.122 0.6142-Feb-95 11 0.100^ 0.174 1.230 0.116 -0.094
27-Feb-95 2 0.172^ 0.150 1.372 0.100 0.0804-Mar-95 5 -0.194~ 0.061 2.196 0.040 0.1771-Mar-95 9 0.424 0.181 1.305 0.120 0.230
27-Mar-95 2 0.609 0.085 1.402 0.057 0.59829-Mar-95 3 0.677 0.112 1.660 0.085 0.60028-Mar-95 6 0.694 0.105 1.326 0.072 -1.41826-Apr-95 2 -0.050^ 0.096 1.052 0.064 -0.08924-Apr-95 5 0.091^ 0.128 1.106 0.094 -0.11527-Apr-95 11 0.312 0.086 1.233 0.068 0.27423-May-95 2 0.033^ 0.121 1.075 0.080 0.44024-May-95 3 0.099^ 0.121 0.788 0.080 0.53422-May-95 9 0.315^ 0.161 0.448 0.107 0.05720-Jun-95 2 0.072^ 0.119 1.099 0.079 0.44122-Jun-95 5 0.358 0.083 0.889 0.059 0.67521-Jun-95 11 0.026^ 0.125 0.133 0.111 -0.00818-Jul-95 2 0.049^ 0.142 0.599 0.094 0.20117-Jul-95 3 0.150 0.071 0.345 0.111 0.44320-Jul-95 9 0.135^ 0.078 0.286 0.054 0.18115-Aug-95 2 -0.204^ 0.099 0.484 0.069 -1.04614-Aug-95 5 -0.230^ 0.118 0.161 0.078 0.30119-Aug-95 11 -0.180~ 0.078 0.380 0.052 -0.09011-Sep-95 2 0.325 0.100 1.233 0.066 0.15514-Sep-95 3 -0.220^ 0.275 0.287 0.183 0.20110-Sep-95 9 0.461^ 0.100 0.559 0.147 0.398
nd not determined, * standard error for chl a growth rate without NH4 addition,
^ not significantly different from zero, ~ significantly less than zero.

39
Appendix 8. Chlorophyll a production in bottles incubated with 1-3 µM inorganicnitrogen and estimates of initial stock and potential production grazed for eachexperiment.
Date Site Initialchl astock
Po
Doublingschl a
per day
k/ln2
Potential chl a
productionPp=
(Poek)-Po
Actual chl a
productionPa=
(Poe(k-g))-Po
Initialchl a stock
grazed
1-e-g
Potentialproduction
grazed
Pp- Pa
µµg L -1 µµg L -1d-1 µµg L -1d-1 µµg L -1d-1 (%) µµg L -1d-1 (%)
12-Oct-94 2 0.34 1.2 0.47 0.22 0.10 (30) 0.24 (52)14-Oct-94 3 0.56 0.5 0.21 0.22 0.00 (0) 0.00 (0)14-Oct-94 5 0.87 1.7 2.05 1.33 0.21 (25) 0.72 (35)15-Oct-94 6 0.70 0.6 0.35 0.37 0.00 (0) -0.02 (-0)14-Oct-94 11 0.23 1.0 0.22 0.16 0.03 (12) 0.06 (26)9-Nov-94 2 1.06 1.7 2.50 1.77 0.22 (20) 0.73 (29)
10-Nov-94 5 0.78 2.5 3.66 2.59 0.19 (24) 1.08 (29)11-Nov-94 6 0.78 2.1 2.51 2.34 0.04 (5) 0.16 (7)7-Dec-94 2 0.43 2.4 1.82 1.11 0.14 (32) 0.71 (39)
11-Dec-94 3 1.00 1.6 2.06 1.74 0.10 (10) 0.31 (15)11-Dec-94 11 0.35 2.1 1.12 0.90 0.05 (15) 0.23 (20)4-Jan-95 2 0.62 3.8 8.16 3.99 0.29 (48) 4.18 (51)4-Jan-95 5 1.03 2.0 3.22 0.86 0.57 (56) 2.36 (73)6-Jan-95 9 0.40 1.7 0.87 0.43 0.14 (35) 0.44 (51)
31-Jan-95 2 0.58 3.0 4.13 1.40 0.34 (58) 2.73 (66)24-Jan-95 3 1.70 2.8 10.21 6.00 0.60 (35) 4.22 (41)2-Feb-95 11 0.49 1.8 1.26 0.82 0.12 (25) 0.44 (35)
27-Feb-95 2 0.95 2.2 3.30 2.31 0.22 (23) 0.99 (30)4-Mar-95 5 0.83 2.7 4.46 3.31 0.18 (22) 1.15 (26)1-Mar-95 9 0.95 2.5 4.26 1.76 0.46 (48) 2.50 (59)
27-Mar-95 2 0.85 2.4 3.60 1.31 0.44 (51) 2.29 (64)29-Mar-95 3 1.29 2.6 6.55 5.09 0.24 (19) 1.46 (22)28-Mar-95 6 1.83 2.0 5.68 2.55 0.76 (42) 3.13 (55)26-Apr-95 2 1.22 0.9 1.09 1.12 0.00 (0) 0.03 (0)24-Apr-95 5 2.02 0.9 1.80 1.74 0.03 (2) 0.06 (3)27-Apr-95 11 1.68 1.6 3.40 1.83 0.52 (31) 1.57 (46)23-May-95 2 1.54 1.2 1.99 1.96 0.01 (1) 0.03 (2)24-May-95 3 2.15 0.9 1.98 0.36 0.85 (39) 1.63 (82)22-May-95 9 1.22 0.2 0.14 -0.12 0.24 (19) 0.26 (185)20-Jun-95 2 1.17 0.9 1.01 0.14 0.46 (40) 0.87 (86)22-Jun-95 5 0.78 0.5 0.30 0.55 0.00 (0) -0.25 (-85)21-Jun-95 11 0.80 0.5 0.29 -0.07 0.27 (33) 0.37 (124)18-Jul-95 2 4.04 0.5 1.69 1.74 0.00 (0) -0.05 (-3)17-Jul-95 3 1.91 0.2 0.29 0.04 0.22 (11) 0.25 (86)20-Jul-95 9 3.67 -0.2 -0.44 -0.68 0.27 (7) 0.24 (-54)15-Aug-95 2 4.66 0.8 3.26 3.04 0.13 (3) 0.23 (7)14-Aug-95 5 1.76 0.5 0.72 0.53 0.13 (8) 0.19 (26)19-Aug-95 11 1.40 0.4 0.47 0.35 0.09 (6) 0.12 (25)11-Sep-95 2 1.46 1.3 2.01 0.95 0.45 (31) 1.06 (53)14-Sep-95 3 2.08 0.5 0.90 0.02 0.61 (30) 0.88 (98)10-Sep-95 9 1.20 -0.1 -0.08 -0.12 0.05 (4) 0.05 (-60)


