Embed Size (px)
Citation preview
Information Sciences 184 (2012) 64–74
Contents lists available at ScienceDirect
Information Sciences
journal homepage: www.elsevier .com/locate / ins
MiniMax e-stable cluster validity index for Type-2 fuzziness
Ibrahim Ozkan a, I. Burhan Türks�en b,c,⇑a Department of Economics, Hacettepe Univ., Ankara, Turkeyb Department of Industrial Engineering, TOBB ETU, Ankara, Turkeyc Department of Mechanical and Industrial Engineering, University of Toronto, Ontario, Canada M5S 3G8
a r t i c l e i n f o
Article history:Received 4 July 2010Received in revised form 6 July 2011Accepted 20 July 2011Available online 28 July 2011
Keywords:UncertaintyEntropyOptimum number of clustersType-2 fuzziness
0020-0255/$ - see front matter � 2011 Elsevier Incdoi:10.1016/j.ins.2011.07.036
⇑ Corresponding author at: Department of MechaE-mail addresses: [email protected] (I. Ozk
a b s t r a c t
In this paper, we concentrate on the usage of uncertainty associated with the level of fuzz-iness in determination of the number of clusters in FCM for any data set. We propose aMiniMax e-stable cluster validity index based on the uncertainty associated with the levelof fuzziness within the framework of interval valued Type 2 fuzziness. If the data have aclustered structure, the optimum number of clusters may be assumed to have minimumuncertainty under upper and lower levels of fuzziness. Upper and lower values of the levelof fuzziness for Fuzzy C-Mean (FCM) clustering methodology have been found as m = 2.6and 1.4, respectively, in our previous studies. Our investigation shows that the stabilityof cluster centers with respect to the level of fuzziness is sufficient for the determinationof the number of clusters.
� 2011 Elsevier Inc. All rights reserved.
1. Introduction
Data clustering is an important tool to analyze a data set in order to explore its structure. Several clustering algorithmshave been developed and successfully applied in many different fields. These algorithms are aimed at extracting group struc-ture in a data set. Such extractions are often validated by means of cluster validity indices. A very brief survey of the clustervalidity indices will be included for both crisp and fuzzy clustering algorithms in this section.
In general, one can find three types of cluster validity indices in literature [12,25,38]. These are:
(i) Internal criteria that look for both small dispersion in clusters and high dissimilarity between clusters.(ii) External criteria in which pre-specified structures are used to validate the clustering results.
(iii) Relative criteria that need a decision objective to be chosen before clustering. Then the clustering algorithm is appliedwith different input parameter set. The results are assessed and the optimal clustering structure is selected based onpreviously chosen criterion [7,8,21,38].
Apart from this general classification, stability and biological types of validation can be seen in literature. In case of bio-logical criteria, the result is assessed by means of intuition where clustering produced meaningful clusters. Stability type val-idation is a special case of relative criteria approach in which the variables are removed one by one and the results arecompared for the selection of the optimum number of clusters (see for example, [1,2,16,28,30]). Other stability approachesuses re-sampling to assess the cluster stability (see for example, [17,29,36]).
Since the clustering algorithms can be seen in three basic categories, namely compactness, connectedness and separation[24,36], the validity indices naturally are formed based on the basis of such categories. These indices are also classified asinternal type validation measures. Compactness and separation measurements are the most common in classification of such
. All rights reserved.
nical and Industrial Engineering, University of Toronto, Ontario, Canada M5S 3G8.an), [email protected], [email protected] (I.B. Türks�en).
I. Ozkan, I.B. Türks�en / Information Sciences 184 (2012) 64–74 65
indices within cluster variability and gap statistics type validation measures. (One may want to refer to the following brieflist of papers for a discussion of the cluster validity: (i) Compactness and separation: [18,22,23,26,15]; (ii) within clustervalidity and gap statistics: [10,35,40–42], and (iii) others, [43,46,50].)
There are several works on the validation of the number of clusters for FCM. Amongst them following articles are worthmentioning: [4,6,9,15,19,20,26,27,35,37,44,45,47,49,50].
In this paper, we propose a new validation criterion called ‘‘e-stable cluster validity index’’, which can be classified as astability type validation. In particular, the stability of the clusters is assessed by means of the uncertainty associated with thelevel of fuzziness in FCM clustering algorithms.
In Section 2, we state a brief introduction of FCM algorithm with an overview of selected and widely used cluster validityindices. In Section 3, our proposed validity index is given together with a comparison of the performances of these indicesand the conclusions are stated in Section 4.
2. FCM, fuzziness and number of clusters
2.1. Fuzzy C-Means
The well known Fuzzy C-Means (FCM) algorithm partitions data into clusters in which each observation is assigned amembership value between zero and one to each cluster. Bezdek [3] proposed the minimization of the following objectivefunction:
JmðU;V : XÞ ¼Xnd
k¼1
Xnc
c¼1
lmc;kkxk � vck2
A ð1Þ
where lc,k: membership value of kth vector in cth cluster such that lc,k 2 [0,1], nd is the number of vectors used in the anal-ysis, nc is the number of clusters, k�kA is norm and m is the level of fuzziness, the membership values are calculated as:
li;k ¼Xnc
c¼1
kxk � v ikA
kxk � vckA
� � 2m�1
" #�1
ð2Þ
wherePnc
c¼1lk;c ¼ 1 for some given m > 1, and finally the cluster centers are computed as:
vc ¼Pnd
k¼1lmckxkPnd
k¼1lmck
ð3Þ
In fuzzy clustering analysis, the number of clusters and the level of fuzziness need to be identified before clustering. Onecan find limited studies for the level of fuzziness [48]. The most widely used value for the level of fuzziness is two. And thisvalue is usually accepted as the rule of thumb. Yu et al. [48] suggest that the proper value of the level of fuzziness depends onthe data itself. Pal and Bezdek [35] investigate that the value of the level of fuzziness should be between 1.5 and 2.5 based ontheir analysis on the performance of cluster validity indices. Ozkan and Turksen [33] show that the proper values for upperand lower bounds of level of fuzziness are 1.4 and 2.6. respectively. Since the upper and lower values of the level of fuzzinessdo not depend on the number of clusters, thus one can use uncertainty related with fuzziness to find the optimum number ofclusters among the possible stable clusters. This in fact is an extension of our previous work.
2.2. Selected validation indices
In the current literature, several cluster validity indices have been introduced to identify the number of clusters in fuzzydata with FCM [6,9,13–15,20,27,35,37,44]. In this section, we briefly review those cluster validity indices which are mostfrequently investigated.
Bezdek proposed partition coefficient (PC) and partition entropy (PE) as cluster validity criteria [4,5]. Both indices usemembership values of fuzzy clusters. Minimizing PC or maximizing PE with respect to the number of clusters,nc, wherenc 2 [cmin,cmax], are used to determine the optimum number of clusters:
PCðUÞ ¼ 1nd
Xnd
k¼1
Xnc
c¼1
l2c;k
!ð4Þ
PEðUÞ ¼ � 1nd
Xnd
k¼1
Xnc
c¼1
lc;klogaðlc;kÞ !
ð5Þ
Fukuyama and Sugeno’s [20] selection index uses both membership values and data as:
FSðU;V : XÞ ¼Xnc
c¼1
Xnd
k¼1
lmc;k kxk � vck2
d � kvc � �vk2d
� �ð6Þ
where �v ¼ 1nd
Pndk¼1xk, is the mean of the whole data set.
66 I. Ozkan, I.B. Türks�en / Information Sciences 184 (2012) 64–74
3. Minimax – e stable index
‘‘Parametric uncertainty’’ in clustering is the uncertainty associated with the parameters of clustering algorithms and howit affects to the performance of the methodology. In the FCM clustering algorithm, two parameters, the level of fuzziness andthe number of clusters, are to be set before clustering starts. The level of fuzziness affects the success of clustering validationas reported by Pal and Bezdek [35]. They suggest that the value of the level of fuzziness should be between 1.5 and 2.5 basedon their analysis on the performance of cluster validity indices. If the value of the level of fuzziness is important in FCM, onecan conclude the uncertainty associated with the value of the level of fuzziness is also important. In order to incorporate thisuncertainty to the clustering, we propose a stability based cluster validity index for FCM which we call MiniMax e-stableindex.
Falasconi et al. [19] suggest a stability based cluster validity based on the partition stability under re-sampling and per-turbation of data. This is extension of the concept of partition stability which was proposed by Breckenridge [11]. One canrefer to several works given in the section one above about the examples in a crisp clustering. Our proposed method stillseeks cluster stability but it is based on one of the parametric uncertainty, namely, level of fuzziness. Ozkan and Turksen[33] prove that the uncertainty associated with the level of fuzziness, m, is contained in a range of values between 1.4and 2.6. As a novel approach, we argued that the optimum number of clusters can be found by minimizing the uncertaintyin the information content of the data set. Hence, upper and lower values of the level of fuzziness can be used as a guide tofind the number of clusters in FCM.
It can be observed from the Eq. (3), the level of fuzziness, m, appears as an exponent of the membership values. Well sep-arated clusters produce membership values that are closer to the either 0 or 1. In such cases, one can expect that the level offuzziness does not change cluster center values significantly. Thus, the effect of the changes of the level of fuzziness to thechanges in the cluster centers should be minimized for the optimum number of clusters. Hence;
min Dvcjml ;mu¼ D
Pndk¼1lm
ckxkPndk¼1lm
ck
" #ml ;mu
0@
1A ð7Þ
where ml and mu are the lower and the upper values of the level of fuzziness to be used to assess the stability of clustercenters.
In this paper, several data sets are used to assess the proposed cluster validity index mentioned in (7). Some data sets areobtained by controlled experiment and others are selected among well known real world data sets used in the literature. Inorder to keep the experiment simple and understandable, other sources of uncertainties are not investigated. As a furtherinvestigation of Ozkan and Turksen [31], the same data sets that were used to assess the fuzziness with an entropy functionare also used in this study.
If the membership values are close to {0,1}, the effects of m disappear. But in fuzzy data the membership values are ex-pected to be between 0 and 1. Therefore one can expect a significant change in cluster centers with change in the value of thelevel of fuzziness. Tracing a range of the level of fuzziness may help us to find the optimum number of clusters but it wouldrequire time consuming search for relatively big data sets. Hence we propose to use boundary values for the level of fuzz-iness in determining the number of clusters.
At this point of the analysis, it might be useful to analyze the behavior of the membership function. Intuitively, if thechange in membership values, for the upper and the lower level of fuzziness used in analysis (ml and mu), is small for a givennumber of clusters then the changes in the clusters centers should be small (Kim et al. [26], used similar intuition and sug-gested that the optimal number of clusters can be found by minimizing the change in cluster center with respect to the num-ber of clusters). This means that one can create a cluster validity index by finding the number of clusters so that the changesin membership values are at their minimums with respect to the change in the level of fuzziness. (This also means that thechange in entropy should be minimized with respect to the change in the level of fuzziness.)
The data vectors that are exactly at a particular cluster center have membership values of 1 for that cluster and 0 for theother clusters. For the data vectors that are in between cluster centers, their membership values in a cluster decreases inrelation to their distance to that cluster center and the level of fuzziness. To get an idea of the change in membership valueswith respect to change in the level of fuzziness, we investigate:
ddm
lm ¼ lm ddm
m lnðlÞ� �
¼ lm lnðlÞ þd
dm ll
m
!ð8Þ
Assume that l0 � 0 for a given center or l0l m � 0 then Eq. (8) approximately becomes:
ddm
lm
� �¼ lm lnðlÞ ð9Þ
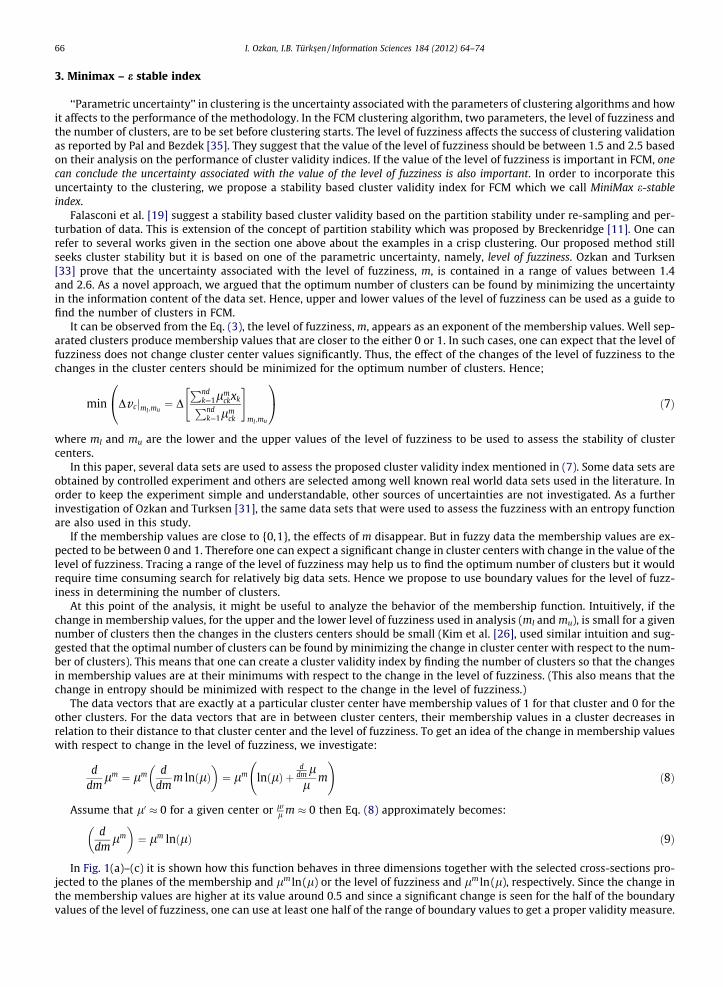
In Fig. 1(a)–(c) it is shown how this function behaves in three dimensions together with the selected cross-sections pro-jected to the planes of the membership and lm ln(l) or the level of fuzziness and lm ln(l), respectively. Since the change inthe membership values are higher at its value around 0.5 and since a significant change is seen for the half of the boundaryvalues of the level of fuzziness, one can use at least one half of the range of boundary values to get a proper validity measure.
Fig. 1. (a) 3-D plot of Eq. (9), (b) cross section with values of m = {1.5,2,2.5,3} (c) cross section with values l = {0.2,0.4,0.6,0.8}.
I. Ozkan, I.B. Türks�en / Information Sciences 184 (2012) 64–74 67
Minimizing some distance measures between cluster values obtained with m = 2.6 and m = 1.4 should create enough infor-mation to decide the optimum number of clusters since the latter produces membership values near crisp membershipvalues.
One can come up with several indices to find the optimum number of clusters in fuzzy data sets with an application of theupper and lower boundary levels of fuzziness. All these indices in a way should be related to each other since the FCM mem-bership function and the cluster centers are well defined functions. The examples of validity indices are in the forms listedbelow (with respect to the different number of clusters):
– Average change in cluster centers measured by the values of a distance measure (Average change in distance, ACI).– The change in specific entropy measure Ozkan and Turksen [31] used in their analysis (Change in Entropy, CIE).– The minimum of the maximum changes in cluster centers measured by the values of a distance measure (Minimum of the
Maximum change in distance, MMI).– The minimum of the maximum changes in cluster centers in any dimension, MiniMax e-stable index. MiniMax e-stable
index tries to identify stability in every dimension and finds out the minimum of all maximum distances in all dimen-sions. For example two sets of cluster centers are obtained with the perturbation of the level of fuzziness, m. Thus, firstset of cluster centers is calculated with an application of FCM by setting the level of fuzziness 2.6. Then the second setof centers is calculated with the perturbation of the level of fuzziness from the value of 2.6 to the value of 1.4, inEq. (3). MiniMax e-stable index is calculated by using the minimum of the maximum (MiniMax) change in clustercenters’ values. In particular, it is computed on the projections of distance between cluster pairs in all dimensions.(MiniMax e-stable index, MMS).
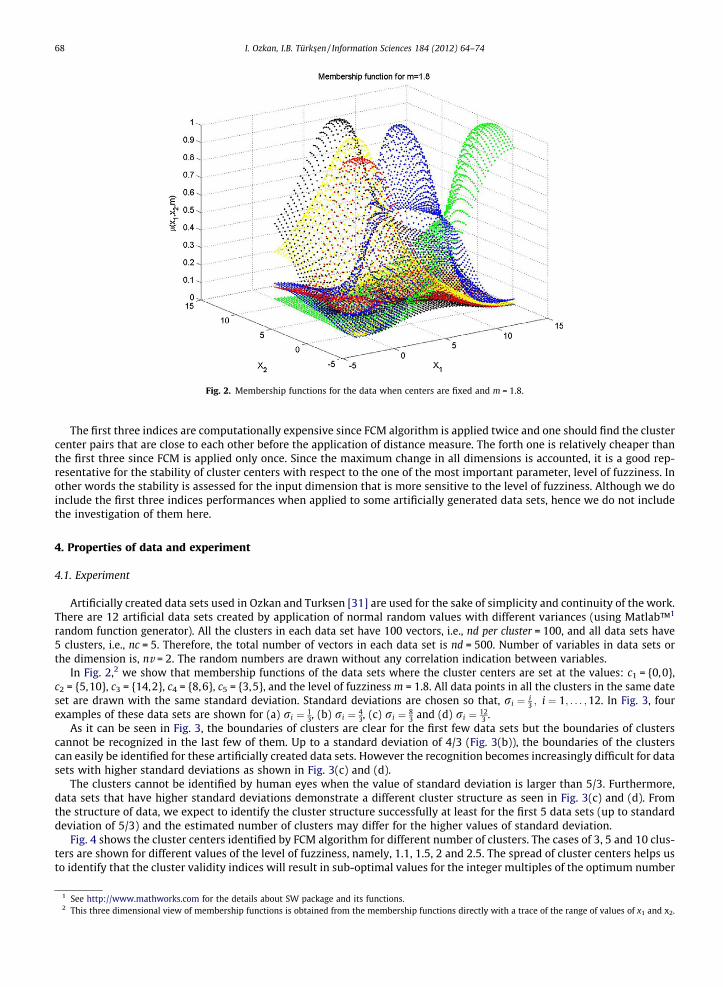
Fig. 2. Membership functions for the data when centers are fixed and m = 1.8.
68 I. Ozkan, I.B. Türks�en / Information Sciences 184 (2012) 64–74
The first three indices are computationally expensive since FCM algorithm is applied twice and one should find the clustercenter pairs that are close to each other before the application of distance measure. The forth one is relatively cheaper thanthe first three since FCM is applied only once. Since the maximum change in all dimensions is accounted, it is a good rep-resentative for the stability of cluster centers with respect to the one of the most important parameter, level of fuzziness. Inother words the stability is assessed for the input dimension that is more sensitive to the level of fuzziness. Although we doinclude the first three indices performances when applied to some artificially generated data sets, hence we do not includethe investigation of them here.
4. Properties of data and experiment
4.1. Experiment
Artificially created data sets used in Ozkan and Turksen [31] are used for the sake of simplicity and continuity of the work.There are 12 artificial data sets created by application of normal random values with different variances (using Matlab™1
random function generator). All the clusters in each data set have 100 vectors, i.e., nd per cluster = 100, and all data sets have5 clusters, i.e., nc = 5. Therefore, the total number of vectors in each data set is nd = 500. Number of variables in data sets orthe dimension is, nv = 2. The random numbers are drawn without any correlation indication between variables.
In Fig. 2,2 we show that membership functions of the data sets where the cluster centers are set at the values: c1 = {0,0},c2 = {5,10}, c3 = {14,2}, c4 = {8,6}, c5 = {3,5}, and the level of fuzziness m = 1.8. All data points in all the clusters in the same dateset are drawn with the same standard deviation. Standard deviations are chosen so that, ri ¼ i
3 ; i ¼ 1; . . . ;12. In Fig. 3, fourexamples of these data sets are shown for (a) ri ¼ 1
3, (b) ri ¼ 43, (c) ri ¼ 8
3 and (d) ri ¼ 123 .
As it can be seen in Fig. 3, the boundaries of clusters are clear for the first few data sets but the boundaries of clusterscannot be recognized in the last few of them. Up to a standard deviation of 4/3 (Fig. 3(b)), the boundaries of the clusterscan easily be identified for these artificially created data sets. However the recognition becomes increasingly difficult for datasets with higher standard deviations as shown in Fig. 3(c) and (d).
The clusters cannot be identified by human eyes when the value of standard deviation is larger than 5/3. Furthermore,data sets that have higher standard deviations demonstrate a different cluster structure as seen in Fig. 3(c) and (d). Fromthe structure of data, we expect to identify the cluster structure successfully at least for the first 5 data sets (up to standarddeviation of 5/3) and the estimated number of clusters may differ for the higher values of standard deviation.
Fig. 4 shows the cluster centers identified by FCM algorithm for different number of clusters. The cases of 3, 5 and 10 clus-ters are shown for different values of the level of fuzziness, namely, 1.1, 1.5, 2 and 2.5. The spread of cluster centers helps usto identify that the cluster validity indices will result in sub-optimal values for the integer multiples of the optimum number
1 See http://www.mathworks.com for the details about SW package and its functions.2 This three dimensional view of membership functions is obtained from the membership functions directly with a trace of the range of values of x1 and x2.
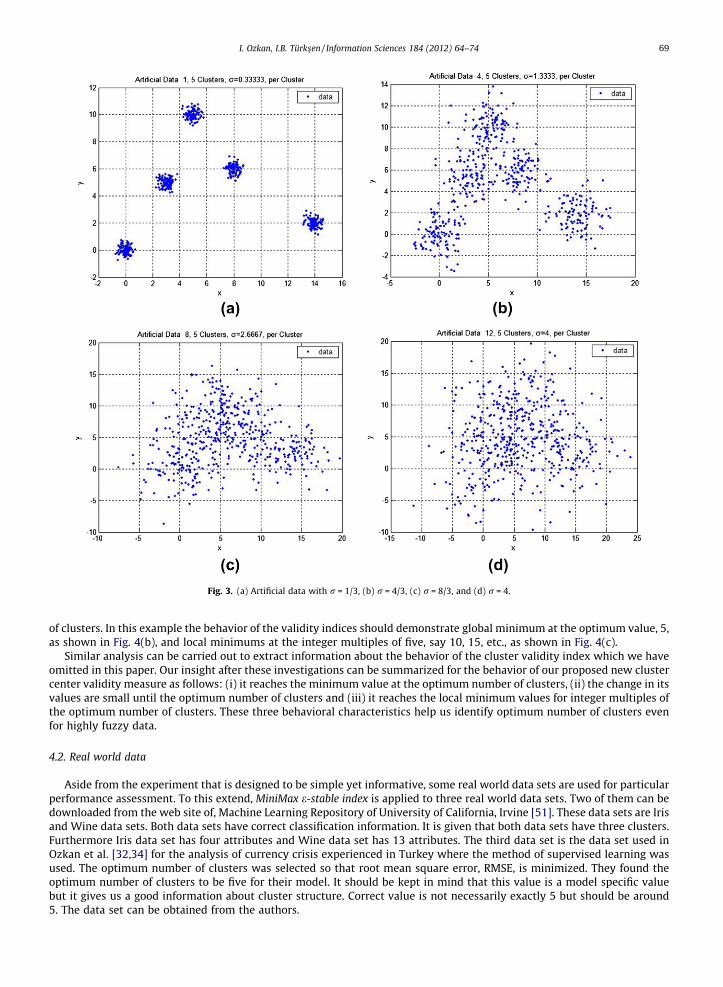
Fig. 3. (a) Artificial data with r = 1/3, (b) r = 4/3, (c) r = 8/3, and (d) r = 4.
I. Ozkan, I.B. Türks�en / Information Sciences 184 (2012) 64–74 69
of clusters. In this example the behavior of the validity indices should demonstrate global minimum at the optimum value, 5,as shown in Fig. 4(b), and local minimums at the integer multiples of five, say 10, 15, etc., as shown in Fig. 4(c).
Similar analysis can be carried out to extract information about the behavior of the cluster validity index which we haveomitted in this paper. Our insight after these investigations can be summarized for the behavior of our proposed new clustercenter validity measure as follows: (i) it reaches the minimum value at the optimum number of clusters, (ii) the change in itsvalues are small until the optimum number of clusters and (iii) it reaches the local minimum values for integer multiples ofthe optimum number of clusters. These three behavioral characteristics help us identify optimum number of clusters evenfor highly fuzzy data.
4.2. Real world data
Aside from the experiment that is designed to be simple yet informative, some real world data sets are used for particularperformance assessment. To this extend, MiniMax e-stable index is applied to three real world data sets. Two of them can bedownloaded from the web site of, Machine Learning Repository of University of California, Irvine [51]. These data sets are Irisand Wine data sets. Both data sets have correct classification information. It is given that both data sets have three clusters.Furthermore Iris data set has four attributes and Wine data set has 13 attributes. The third data set is the data set used inOzkan et al. [32,34] for the analysis of currency crisis experienced in Turkey where the method of supervised learning wasused. The optimum number of clusters was selected so that root mean square error, RMSE, is minimized. They found theoptimum number of clusters to be five for their model. It should be kept in mind that this value is a model specific valuebut it gives us a good information about cluster structure. Correct value is not necessarily exactly 5 but should be around5. The data set can be obtained from the authors.
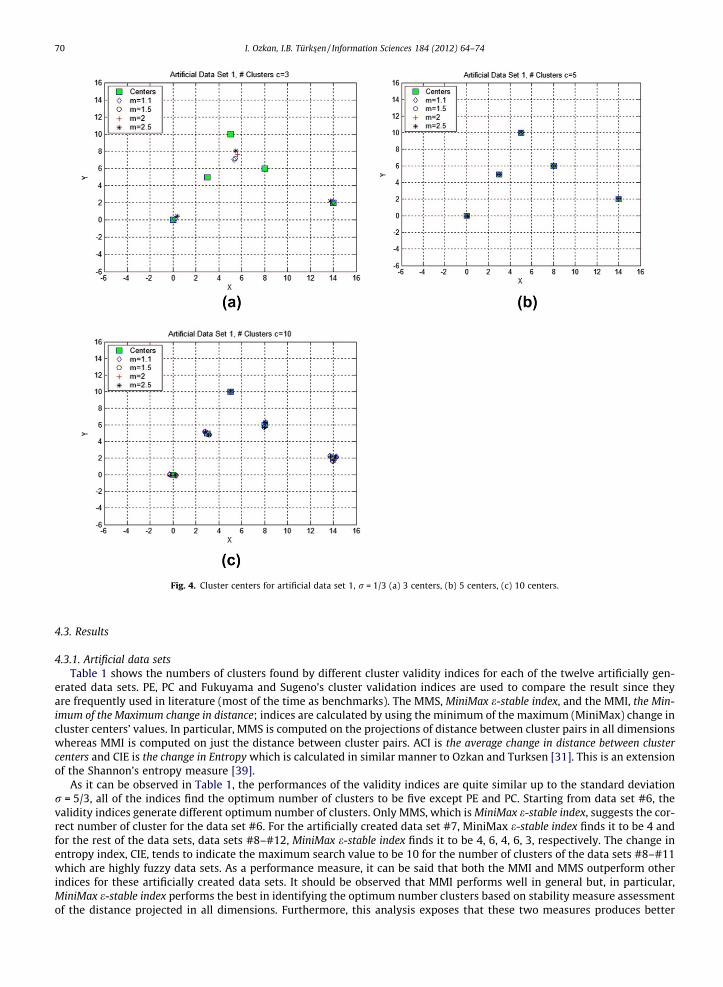
Fig. 4. Cluster centers for artificial data set 1, r = 1/3 (a) 3 centers, (b) 5 centers, (c) 10 centers.
70 I. Ozkan, I.B. Türks�en / Information Sciences 184 (2012) 64–74
4.3. Results
4.3.1. Artificial data setsTable 1 shows the numbers of clusters found by different cluster validity indices for each of the twelve artificially gen-
erated data sets. PE, PC and Fukuyama and Sugeno’s cluster validation indices are used to compare the result since theyare frequently used in literature (most of the time as benchmarks). The MMS, MiniMax e-stable index, and the MMI, the Min-imum of the Maximum change in distance; indices are calculated by using the minimum of the maximum (MiniMax) change incluster centers’ values. In particular, MMS is computed on the projections of distance between cluster pairs in all dimensionswhereas MMI is computed on just the distance between cluster pairs. ACI is the average change in distance between clustercenters and CIE is the change in Entropy which is calculated in similar manner to Ozkan and Turksen [31]. This is an extensionof the Shannon’s entropy measure [39].
As it can be observed in Table 1, the performances of the validity indices are quite similar up to the standard deviationr = 5/3, all of the indices find the optimum number of clusters to be five except PE and PC. Starting from data set #6, thevalidity indices generate different optimum number of clusters. Only MMS, which is MiniMax e-stable index, suggests the cor-rect number of cluster for the data set #6. For the artificially created data set #7, MiniMax e-stable index finds it to be 4 andfor the rest of the data sets, data sets #8–#12, MiniMax e-stable index finds it to be 4, 6, 4, 6, 3, respectively. The change inentropy index, CIE, tends to indicate the maximum search value to be 10 for the number of clusters of the data sets #8–#11which are highly fuzzy data sets. As a performance measure, it can be said that both the MMI and MMS outperform otherindices for these artificially created data sets. It should be observed that MMI performs well in general but, in particular,MiniMax e-stable index performs the best in identifying the optimum number clusters based on stability measure assessmentof the distance projected in all dimensions. Furthermore, this analysis exposes that these two measures produces better
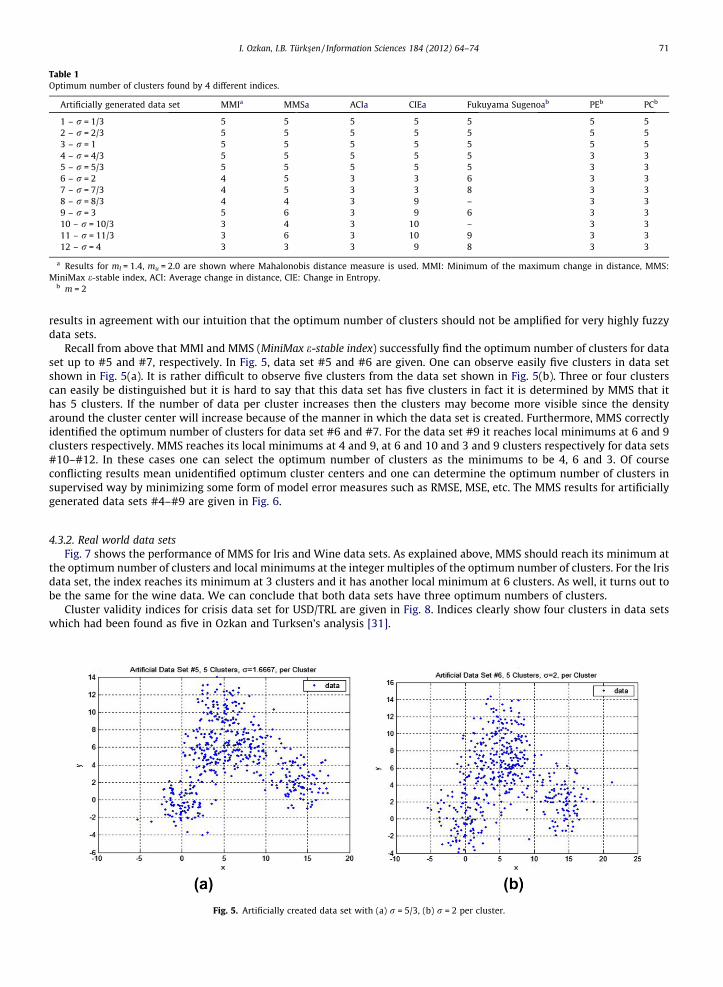
Table 1Optimum number of clusters found by 4 different indices.
Artificially generated data set MMIa MMSa ACIa CIEa Fukuyama Sugenoab PEb PCb
1 – r = 1/3 5 5 5 5 5 5 52 – r = 2/3 5 5 5 5 5 5 53 – r = 1 5 5 5 5 5 5 54 – r = 4/3 5 5 5 5 5 3 35 – r = 5/3 5 5 5 5 5 3 36 – r = 2 4 5 3 3 6 3 37 – r = 7/3 4 5 3 3 8 3 38 – r = 8/3 4 4 3 9 – 3 39 – r = 3 5 6 3 9 6 3 310 – r = 10/3 3 4 3 10 – 3 311 – r = 11/3 3 6 3 10 9 3 312 – r = 4 3 3 3 9 8 3 3
a Results for ml = 1.4, mu = 2.0 are shown where Mahalonobis distance measure is used. MMI: Minimum of the maximum change in distance, MMS:MiniMax e-stable index, ACI: Average change in distance, CIE: Change in Entropy.
b m = 2
I. Ozkan, I.B. Türks�en / Information Sciences 184 (2012) 64–74 71
results in agreement with our intuition that the optimum number of clusters should not be amplified for very highly fuzzydata sets.
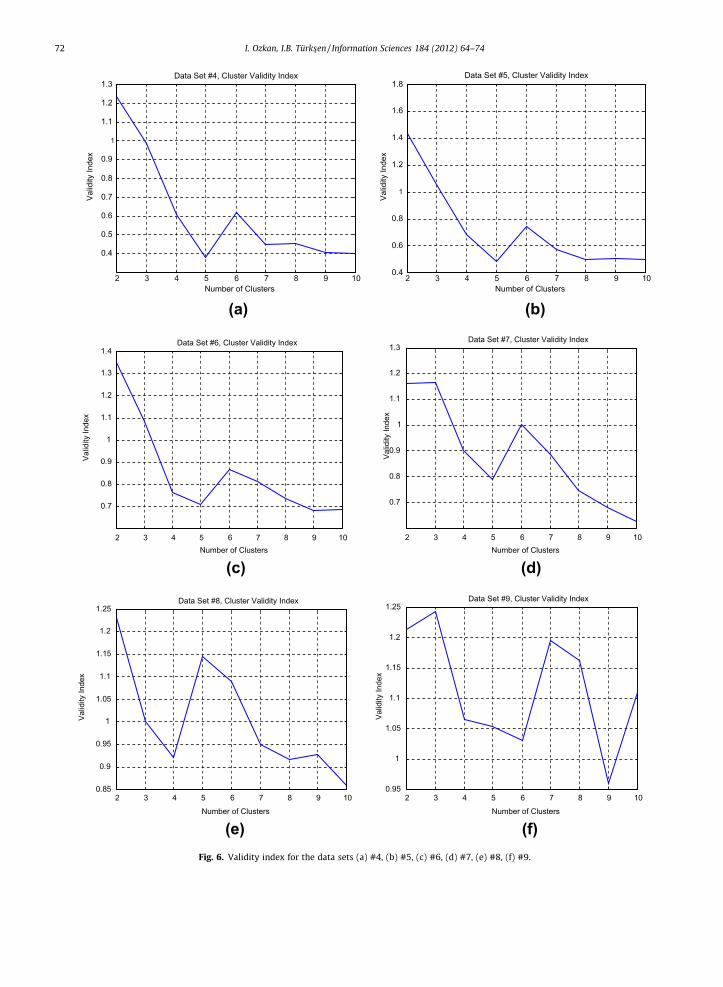
Recall from above that MMI and MMS (MiniMax e-stable index) successfully find the optimum number of clusters for dataset up to #5 and #7, respectively. In Fig. 5, data set #5 and #6 are given. One can observe easily five clusters in data setshown in Fig. 5(a). It is rather difficult to observe five clusters from the data set shown in Fig. 5(b). Three or four clusterscan easily be distinguished but it is hard to say that this data set has five clusters in fact it is determined by MMS that ithas 5 clusters. If the number of data per cluster increases then the clusters may become more visible since the densityaround the cluster center will increase because of the manner in which the data set is created. Furthermore, MMS correctlyidentified the optimum number of clusters for data set #6 and #7. For the data set #9 it reaches local minimums at 6 and 9clusters respectively. MMS reaches its local minimums at 4 and 9, at 6 and 10 and 3 and 9 clusters respectively for data sets#10–#12. In these cases one can select the optimum number of clusters as the minimums to be 4, 6 and 3. Of courseconflicting results mean unidentified optimum cluster centers and one can determine the optimum number of clusters insupervised way by minimizing some form of model error measures such as RMSE, MSE, etc. The MMS results for artificiallygenerated data sets #4–#9 are given in Fig. 6.
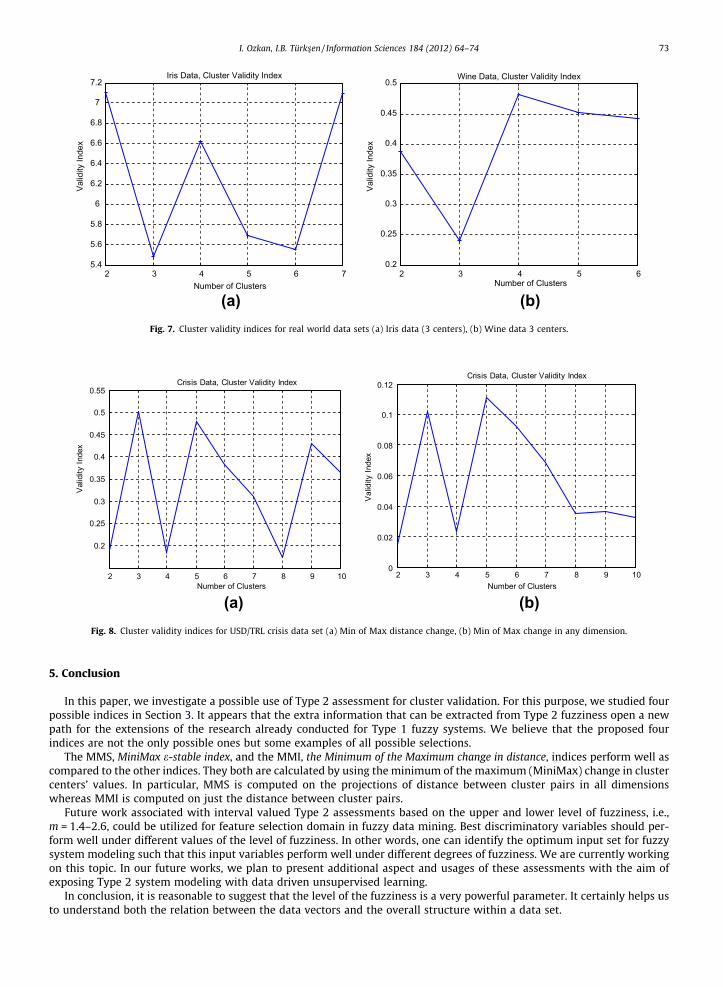
4.3.2. Real world data setsFig. 7 shows the performance of MMS for Iris and Wine data sets. As explained above, MMS should reach its minimum at
the optimum number of clusters and local minimums at the integer multiples of the optimum number of clusters. For the Irisdata set, the index reaches its minimum at 3 clusters and it has another local minimum at 6 clusters. As well, it turns out tobe the same for the wine data. We can conclude that both data sets have three optimum numbers of clusters.
Cluster validity indices for crisis data set for USD/TRL are given in Fig. 8. Indices clearly show four clusters in data setswhich had been found as five in Ozkan and Turksen’s analysis [31].
Fig. 5. Artificially created data set with (a) r = 5/3, (b) r = 2 per cluster.
2 3 4 5 6 7 8 9 10
0.4
0.5
0.6
0.7
0.8
0.9
1
1.1
1.2
1.3Va
lidity
Inde
x
Number of Clusters
Data Set #4, Cluster Validity Index
2 3 4 5 6 7 8 9 100.4
0.6
0.8
1
1.2
1.4
1.6
1.8
Valid
ity In
dex
Number of Clusters
Data Set #5, Cluster Validity Index
(b)(a)
2 3 4 5 6 7 8 9 10
0.7
0.8
0.9
1
1.1
1.2
1.3
1.4
Valid
ity In
dex
Number of Clusters
Data Set #6, Cluster Validity Index
2 3 4 5 6 7 8 9 10
0.7
0.8
0.9
1
1.1
1.2
1.3
Valid
ity In
dex
Number of Clusters
Data Set #7, Cluster Validity Index
(d)(c)
2 3 4 5 6 7 8 9 100.85
0.9
0.95
1
1.05
1.1
1.15
1.2
1.25
Valid
ity In
dex
Number of Clusters
Data Set #8, Cluster Validity Index
2 3 4 5 6 7 8 9 100.95
1
1.05
1.1
1.15
1.2
1.25
Valid
ity In
dex
Number of Clusters
Data Set #9, Cluster Validity Index
(f)(e)Fig. 6. Validity index for the data sets (a) #4, (b) #5, (c) #6, (d) #7, (e) #8, (f) #9.
72 I. Ozkan, I.B. Türks�en / Information Sciences 184 (2012) 64–74
2 3 4 5 6 75.4
5.6
5.8
6
6.2
6.4
6.6
6.8
7
7.2Iris Data, Cluster Validity Index
Number of Clusters
Valid
ity In
dex
2 3 4 5 60.2
0.25
0.3
0.35
0.4
0.45
0.5
Number of Clusters
Valid
ity In
dex
Wine Data, Cluster Validity Index
(a) (b) Fig. 7. Cluster validity indices for real world data sets (a) Iris data (3 centers), (b) Wine data 3 centers.
2 3 4 5 6 7 8 9 10
0.2
0.25
0.3
0.35
0.4
0.45
0.5
0.55Crisis Data, Cluster Validity Index
Val
idity
Inde
x
Number of Clusters2 3 4 5 6 7 8 9 10
0
0.02
0.04
0.06
0.08
0.1
0.12Crisis Data, Cluster Validity Index
Val
idity
Inde
x
Number of Clusters
(a) (b)Fig. 8. Cluster validity indices for USD/TRL crisis data set (a) Min of Max distance change, (b) Min of Max change in any dimension.
I. Ozkan, I.B. Türks�en / Information Sciences 184 (2012) 64–74 73
5. Conclusion
In this paper, we investigate a possible use of Type 2 assessment for cluster validation. For this purpose, we studied fourpossible indices in Section 3. It appears that the extra information that can be extracted from Type 2 fuzziness open a newpath for the extensions of the research already conducted for Type 1 fuzzy systems. We believe that the proposed fourindices are not the only possible ones but some examples of all possible selections.
The MMS, MiniMax e-stable index, and the MMI, the Minimum of the Maximum change in distance, indices perform well ascompared to the other indices. They both are calculated by using the minimum of the maximum (MiniMax) change in clustercenters’ values. In particular, MMS is computed on the projections of distance between cluster pairs in all dimensionswhereas MMI is computed on just the distance between cluster pairs.
Future work associated with interval valued Type 2 assessments based on the upper and lower level of fuzziness, i.e.,m = 1.4–2.6, could be utilized for feature selection domain in fuzzy data mining. Best discriminatory variables should per-form well under different values of the level of fuzziness. In other words, one can identify the optimum input set for fuzzysystem modeling such that this input variables perform well under different degrees of fuzziness. We are currently workingon this topic. In our future works, we plan to present additional aspect and usages of these assessments with the aim ofexposing Type 2 system modeling with data driven unsupervised learning.
In conclusion, it is reasonable to suggest that the level of the fuzziness is a very powerful parameter. It certainly helps usto understand both the relation between the data vectors and the overall structure within a data set.
74 I. Ozkan, I.B. Türks�en / Information Sciences 184 (2012) 64–74
Acknowledgments
This work was partially supported by Natural Science and Engineering Research Council (NSERC) Grant (RPGIN 7698-05)to University of Toronto. As well, partial support is provided by Hacettepe University and TOBB Economics and TechnologyUniversity. Their support is greatly appreciated.
References
[1] A. Ben-Hur, A. Elisseeff, I. Guyon, A Stability based Method for Discovering Structure in Clustered Data, Pacific Symposium on Biocomputing, vol. 7,World Scientific Publishing Co, New Jersey, 2002.
[2] A. Ben-Hur, I. Guyon, Detecting stable clusters using principal component analysis, in: M.J. Brownstein, A. Kohodursky (Eds.), Methods in MolecularBiology, Humana Press, 2003, pp. 159–182.
[3] J.C. Bezdek, Fuzzy Mathematics in Pattern Classification, Ph.D. Thesis, Applied Mathematics Center, Cornell University, Ithaca, 1973.[4] J.C. Bezdek, Cluster validity with fuzzy sets, J. Cybernet. 3 (1974) 58–72.[5] J.C. Bezdek, Mathematical models for systematics and taxonomy, in: G. Estabrook (Ed.), Proc. 8th Int. Conf. Numerical Taxonomy, Freeman, San
Francisco, CA, 1975, pp. 143–166.[6] J.C. Bezdek, Pattern Recognition with Fuzzy Objective Function Algorithms, Plenum Press, New York, 1981.[7] N. Bolshakova, F. Azuaje, Cluster validation techniques for genome expression data, Signal Process. 83 (2003) 825–833.[8] N. Bolshakova, F. Azuaje, P. Cunningham, A knowledge-driven approach to cluster validity assessment, Bioinformatics 21 (10) (2005) 2546–2547.[9] A.O. Boudraa, Dynamic estimation of number of clusters in data set, Electron. Lett. 35 (1999) 1606–1608.
[10] M. Bouguessa, S. Wang, H. Sun, An objective approach to cluster validation, Pattern Recognit. Lett. 27 (2006) 1419–1430.[11] J. Breckenridge, Replicating cluster analysis: method, consistency and validity, Multivar. Behav. Res. 24 (1989) 147–161.[12] G.N. Brock, V. Pihur, S. Datta, S. Datta, clValid, an R package for cluster validation, J. Statist. Softw. 25 (4) (2008). <http://www.jstatsoft.org/v25/i04>.[13] Asli Celikyilmaz, I.Burhan Türksen, Enhanced fuzzy system models with improved fuzzy clustering algorithm, IEEE Trans. Fuzzy Syst. 16 (3) (2008)
779–794.[14] Asli Celikyilmaz, I.Burhan Türks�en, Validation criteria for enhanced fuzzy clustering, Pattern Recognit. Lett. 29 (2008) 97–108.[15] M.Y. Chen, A. Linkens, Rule-base self-generation and simplification for data-driven fuzzy models, J. Fuzzy Sets Syst. 142 (2004) 243–265.[16] D.L. Davies, D.W. Bouldin, A cluster separation measure, IEEE Trans. Pattern Anal. Mach. Intell. 1 (2) (1979) 224–227.[17] S. Dudoit, J. Fridlyand, A prediction based re-sampling method for estimating the number of clusters in a data set, Genome Biol. 3 (2002) 1–21.[18] J.C. Dunn, Well separated clusters and fuzzy partitions, J. Cybernet. 4 (1974) 95–104.[19] M. Falasconi, A. Gutierrez, M. Pardo, G. Sberveglieri, S. Marco, A stability based validity method for fuzzy clustering, Pattern Recognit. 43 (2010) 1292–
1305.[20] Y. Fukuyama, M. Sugeno, A new method of choosing the number of clusters for the fuzzy c-means method, in: Proc. of Fifth Fuzzy Systems Symposium,
1989, pp. 247–250 (in Japanese).[21] Guojun Gan, Chaoqun Ma, Jianhong Wu, Data Clustering: Theory, Algorithms, and Applications, ASA-SIAM Series on Statistics and Applied Probability,
SIAM, Philadelphia, ASA, Alexandria, VA, 2007.[22] M. Halkidi, Y. Batistakis, M. Vazirgiannis, Clustering validity methods. Part I, ACM SIGMOD Rec. 31 (2) (2002) 40–45;
M. Halkidi, Y. Batistakis, M. Vazirgiannis, Clustering validity methods. Part II, ACM SIGMOD Rec. 31 (3) (2002) 19–27.[23] M. Halkidi, Y. Batistakis, M. Vazirgiannis, On clustering validation techniques, Intell. Inform. Syst. J. 17 (2–3) (2001) 107–145.[24] J. Handl, J. Knowles, D.B. Kell, Computational cluster validation in post-genomic data analysis, Bioinformatics 21 (15) (2005) 3201–3212.[25] A. Jain, R. Dubes, Algorithms for Clustering Data, Prentice Hall, Englewood Cliffs, New Jersey, 1988.[26] D.W. Kim, K.H. Lee, D. Lee, On cluster validity index for estimation of the optimal number of fuzzy clusters, Pattern Recognit. 37 (2004) 2009–2025.[27] S.K. Kwon, Cluster validity index for fuzzy clustering, Electron. Lett. 34 (22) (1998) 2176–2177.[28] T. Lange, V. Roth, M.L. Braun, J.M. Buhmann, Stability based validation of clustering solutions, Neural Comput. 16 (2004) 1299–1323.[29] E. Levine, E. Domany, Resampling method for unsupervised estimation of cluster validity, Neural Comput. 13 (2001) 2573–2593.[30] G.B. Mufti, P. Bertrand, L. El Moubarki, Determining the number of groups from measures of cluster validity, Proceedings of ASMDA2005 (2005) 404–
414.[31] I. Ozkan, I.B. Türks�en, Entropy assessment of Type-2 Fuzziness, IEEE Int. Conf. Fuzzy Syst. 2 (2004) 1111–1115.[32] I. Ozkan, I.B. Turksen, H.Okan Aktan, Currency crises analyzed by Type-1 fuzzy logic system, Fuzzy Econ. Rev. 9 (2004) 36–59.[33] I. Ozkan, I.B. Turksen, Upper and lower values for the level of fuzziness in FCM, Inform. Sci. 177 (2007) 5143–5152.[34] I. Ozkan, I.B. Turksen, N. Canpolat, Currency crisis and its perception with fuzzy C-means, Inform. Sci. 178 (8) (2008) 1923–1934.[35] N.R. Pal, J.C. Bezdek, On cluster validity for the fuzzy c-means model, IEEE Trans. Fuzzy Syst. 3 (1995) 370–379.[36] D. Pascual, F. Pla, J.S. Sánchez, Cluster validation using information stability measures, Pattern Recognit. Lett. 31 (6) (2010) 454–461.[37] M.R. Rezaee, B.P.F. Lelieveldt, J.H.C. Reiber, A new cluster validity index for the fuzzy c-means, Pattern Recognit. Lett. 19 (1998) 237–246.[38] Sameh A. Salem, Asoke K. Nandi, Development of assessment criteria for clustering algorithms, Pattern Anal. Appl. 12 (2009) 79–98.[39] C.E. Shannon, The mathematical theory of communication, The Bell Syst. Tech. J. 27 (July and October) (1948) 379–423. 623–656.[40] C. Sugar, G. James, Finding the number of clusters in a data set: an information theoretic approach, J. Amer. Stat. Assoc. 98 (2003) 750–763.[41] C. Sugar, L. Lenert, R. Olshen, An application of cluster analysis to health services research: empirically defined health states for depression from the sf-
12. Technical Report, Stanford University, Stanford. 1999.[42] R. Tibshirani, G. Walther, T. Hastie, Estimating the number of clusters in a data set via the gap statistic, J.R. Stat. Soc. B, Part 2 (2004) 411–423.[43] R. Tibshirani, G. Walther, Cluster validation by prediction strength, J. Comput. Graph. Stat. 14 (3) (2005) 511–528.[44] Z. Volkovich, Z. Barzily, L. Morozensky, Astatistical model of cluster stability, Pattern Recognit. 41 (2008) 2174–2188.[45] W. Wang, Y. Zhang, On fuzzy clustervalidity indices, Fuzzy Sets Syst. 158 (2007) 2095–2117.[46] Kuo-Lung Wu, Miin-Shen Yang, June-Nan Hsieh, Robust cluster validity indexes, Pattern Recognit. 42 (2009) 2541–2550.[47] X.L. Xie, G. Beni, A validity measure for fuzzy clustering, IEEE Trans. Pattern Anal. Mach. Intell. 13 (1991) 841–847.[48] J. Yu, Q. Cheng, H. Huang, Analysis of the weighting exponent in the FCM, IEEE Trans. Syst. Man Cybernet. B 34 (1) (2004) 634–639.[49] Shihong Yue, Jeen-Shing Wang, Teresa Wu, Huaxiang Wang, A new separation measure for improving the effectiveness of validity indices, Inform. Sci.
180 (5, 1) (2010) 748–764, doi:10.1016/j.ins.2009.11.005.[50] Y. Zhang, W. Wang, X. Zhang, Y. Li, A cluster validity index for fuzzy clustering, Inform. Sci. 178 (2008) 1205–1218.[51] <http://www.ics.uci.edu/�mlearn/databases.html>.


![evidence for AGN feedback in galaxies with CIII]-λ1908 Ε](https://img.pdfslide.net/doc/110x75/63249bfcbe5419ea700f1fc4/evidence-for-agn-feedback-in-galaxies-with-ciii-l1908-e-.jpg)


