Embed Size (px)
Citation preview
This article appeared in a journal published by Elsevier. The attachedcopy is furnished to the author for internal non-commercial researchand education use, including for instruction at the authors institution
and sharing with colleagues.
Other uses, including reproduction and distribution, or selling orlicensing copies, or posting to personal, institutional or third party
websites are prohibited.
In most cases authors are permitted to post their version of thearticle (e.g. in Word or Tex form) to their personal website orinstitutional repository. Authors requiring further information
regarding Elsevier’s archiving and manuscript policies areencouraged to visit:
http://www.elsevier.com/authorsrights
Author's personal copy
Preventive Veterinary Medicine 112 (2013) 266– 275
Contents lists available at ScienceDirect
Preventive Veterinary Medicine
j ourna l ho me pag e: ww w.elsev ier .com/ locate /prevetmed
Minimization of bovine tuberculosis control costs in USdairy herds
Rebecca L. Smitha,∗, Loren W. Tauerc, Ynte H. Schukkenb,Zhao Lua, Yrjo T. Grohna
a Section of Epidemiology, Department of Population Medicine and Diagnostic Sciences, College of Veterinary Medicine, CornellUniversity, Ithaca, NY 14853, United Statesb Quality Milk Production Services, Department of Population Medicine and Diagnostic Sciences, College of Veterinary Medicine, CornellUniversity, Ithaca, NY 14853, United Statesc Dyson School of Applied Economics and Management, Cornell University, Ithaca, NY 14853, United States
a r t i c l e i n f o
Article history:Received 2 January 2013Received in revised form 5 July 2013Accepted 12 July 2013
Keywords:EconomicsModelingCattleTuberculosisControl strategies
a b s t r a c t
The objective of this study was to minimize the cost of controlling an isolated bovinetuberculosis (bTB) outbreak in a US dairy herd, using a stochastic simulation model of bTBwith economic and biological layers. A model optimizer produced a control program thatrequired 2-month testing intervals (TI) with 2 negative whole-herd tests to leave quar-antine. This control program minimized both farm and government costs. In all cases,test-and-removal costs were lower than depopulation costs, although the variability incosts increased for farms with high holding costs or small herd sizes. Increasing herd sizesignificantly increased costs for both the farm and the government, while increasing indem-nity payments significantly decreased farm costs and increasing testing costs significantlyincreased government costs. Based on the results of this model, we recommend 2-monthtesting intervals for herds after an outbreak of bovine tuberculosis, with 2 negative wholeherd tests being sufficient to lift quarantine. A prolonged test and cull program may causea state to lose its bTB-free status during the testing period. When the cost of losing thebTB-free status is greater than $1.4 million then depopulation of farms could be preferredover a test and cull program.
© 2013 Elsevier B.V. All rights reserved.
1. Introduction
Bovine tuberculosis (bTB) is a disease of ruminants andcervids caused by chronic infection with Mycobacteriumbovis. It is extremely rare in US cattle, with an estimatedprevalence of 0.0006% herds in 2007 (USDA:APHIS:VS,2009a). Between 2001 and 2009, approximately $342 mil-lion was spent on national bTB surveillance and control
∗ Corresponding author at: 3-007 Schurman Hall, Ithaca 14853, UnitedStates. Tel.: +1 785 341 7974; fax: +1 607 257 8485.
E-mail addresses: [email protected], [email protected](R.L. Smith).
(USDA:APHIS:VS, 2009b). This number is likely to riseas costs of indemnity increase due to depopulation withlarger herds sizes (USDA:APHIS:VS, 2007). For these rea-sons, Veterinary Services, a branch of the USDA Animaland Plant Health Inspection Service, recently recom-mended changes to the national bTB control program,including a need to prioritize selective animal removaland develop test-and-removal protocols (USDA:APHIS:VS,2009b).
The USDA has proposed to control bTB in areasdesignated as bTB-free primarily using slaughter housesurveillance and a pulsed test-and-remove strategy, inwhich the entire herd is tested at one time and all pos-itive animals are culled, although a minimum level of
0167-5877/$ – see front matter © 2013 Elsevier B.V. All rights reserved.http://dx.doi.org/10.1016/j.prevetmed.2013.07.014
Author's personal copy
R.L. Smith et al. / Preventive Veterinary Medicine 112 (2013) 266– 275 267
herd surveillance may be required for herd accreditation,between-state animal movement, or the requirementsdefined in the Grade ‘A’ Pasteurized Milk Ordinance(USDA:APHIS:VS, 2010). Currently, after infected animalsare identified at the slaughter house, the source herd willbe placed under quarantine and a whole-herd test (WHT)will be performed. In this WHT, all animals are testedwith the caudal fold test (CFT). All CFT+ animals will betested with either the comparative cervical test (CCT) or theinterferon gamma assay, and all test-positive animals willbe slaughtered and tested post-mortem by histopathologyand mycobacterial culture, with PCR of all acid-fast stainsand cultured organisms. This process will be repeated atintervals of at least 2 months until the WHT is negative (noPCR-positive samples or all cows are CFT or CCT negative)for a pre-defined number of WHTs. Under current rules(USDA:APHIS:VS, 2005a), herds are required to have 8 neg-ative WHTs before being declared bTB negative again. Thetesting intervals (Tti) of these 8 WHTs are such that thereare 60 days between the first 4 tests, 180 days between the4th and 5th test, and 12 months between the remainingtests. All WHT prior to 2 negative WHTs under the currentplan require postmortem inspection of all CFT+ animals.Deviations from this protocol have been allowed in thepast on a case-by-case basis. Depopulated herds are cur-rently required to have 2 negative annual WHTs, starting 6months after repopulation.
While the costs associated with depopulating bTB-infected dairy herds have been previously calculated (Wolfet al., 2000), the costs associated with the new test-and-remove strategy have not been quantified. Our previouswork has detailed the costs associated with a WHT, assum-ing that all animals are bTB-negative (Dressler et al., 2010).We have also previously developed a stochastic discrete-time model for the spread and control of bTB in US herds(Smith et al., 2013). This model (Smith et al., 2013) hasbeen validated against both an uncontrolled outbreak ina US beef herd (Perumaalla et al., 1999) and 10 controlledoutbreaks in US dairy herds (USAHA, 2008). In the model,there are 2 user-defined control variables that will repre-sent regulatory control programs: the testing interval (Tti),and the number of negative WHTs required for clearance(NWHT).
The purpose of this study is to find the economic opti-mal control for minimizing the separate government andfarmer costs of controlling a bTB outbreak in individualstates that are currently bTB-free, using California (CA)and New York (NY) as examples. This optimal cost willbe compared to the cost of depopulation to determine thebreak-even point at which depopulation is economicallyjustifiable.
2. Materials and methods
Our previously defined model (Smith et al., 2013)served as the basis for the economic model describedbelow. Briefly, we implemented a stochastic (�-leap) statetransition model (Gillespie, 2001) with 4 compartments:susceptible (S), exposed (E), reactor (R), and infectious (I).Animals in the S category can become latently infected
(exposed, E) at the frequency-dependent transmission rateˇ(N)SI/N, where ˇ(N) is the population-dependent (N)transmission coefficient. Latent animals become detectable(reactors, R) with ante-mortem tests at rate � , and reactorsbecome infectious (I) at rate �. New susceptible ani-mals enter the herd at rate �N(t), and all animals couldbe culled at rate �N(t)/N* where N* is the ideal herdsize. The outbreak was initiated with 1 latent infectedanimal.
We assumed that animals in the R and I compartmentscan be detected at slaughter with imperfect sensitivity,and that such detection will trigger an immediate WHT.We have assumed that the herd will be tested using theCFT alone during the removal phase (all testing up toand including the second negative WHT) and using theCFT followed by the CCT during the validation phase (alltesting after the second negative WHT). All animals inthe R and I categories could be detected by the WHTduring the removal phase with probability SeCFT and dur-ing the validation phase with probability SeCFT*SeCCT, theproduct of the sensitivity of the 2 ante-mortem tests,with SeCCT defined as the sensitivity of the CCT in CFT+animals. Animals in the S and E categories could beremoved from the herd during the removal phase withprobability 1 − SpCFT and during the validation phase withprobability (1 − SpCFT)*(1 − SpCCT), the product of the com-plements of the specificity of the 2 ante-mortem tests,with SpCCT defined as the specificity of the CCT in CFT+animals. We assumed perfect sensitivity and specificityfor enhanced post-mortem inspection and PCR after apositive ante-mortem test result. A WHT was considerednegative if all animals tested by post-mortem inspectionand PCR were negative; that is, if all animals tested bypost-mortem inspection were uninfected (in the S cate-gory) or had undetectable infections (in the E category).A herd was modeled to receive WHTs at the time inter-val Tti until the number of consecutive negative WHTs wasequal to NWHT; the minimum Tti is 60 days (2 months).The model was run until the herd was both infection-free (no bTB-infected animals) and declared to be freeof bTB infection (undetected or detected with the vali-dation phase completed), or until 10 years had passedwith the herd remaining infected with bTB, whicheveroccurred first. All biological model parameters are shownin Table 1.
2.1. Economic model
The calculation of the costs to be minimized was basedon Dressler et al. (2010), but divided into costs for the aver-age farm and costs for the government (state and federalcombined). The parameters used for the economic analysisare shown in Table 2.
2.1.1. Government-levelAt the government level, the cost of an outbreak
consisted primarily of testing and indemnity expenses; thecost of a state-wide movement ban was not considered, norwere cleanup or transportation costs, as these costs varywidely and are difficult to estimate. Thus, the total cost was
Author's personal copy
268 R.L. Smith et al. / Preventive Veterinary Medicine 112 (2013) 266– 275
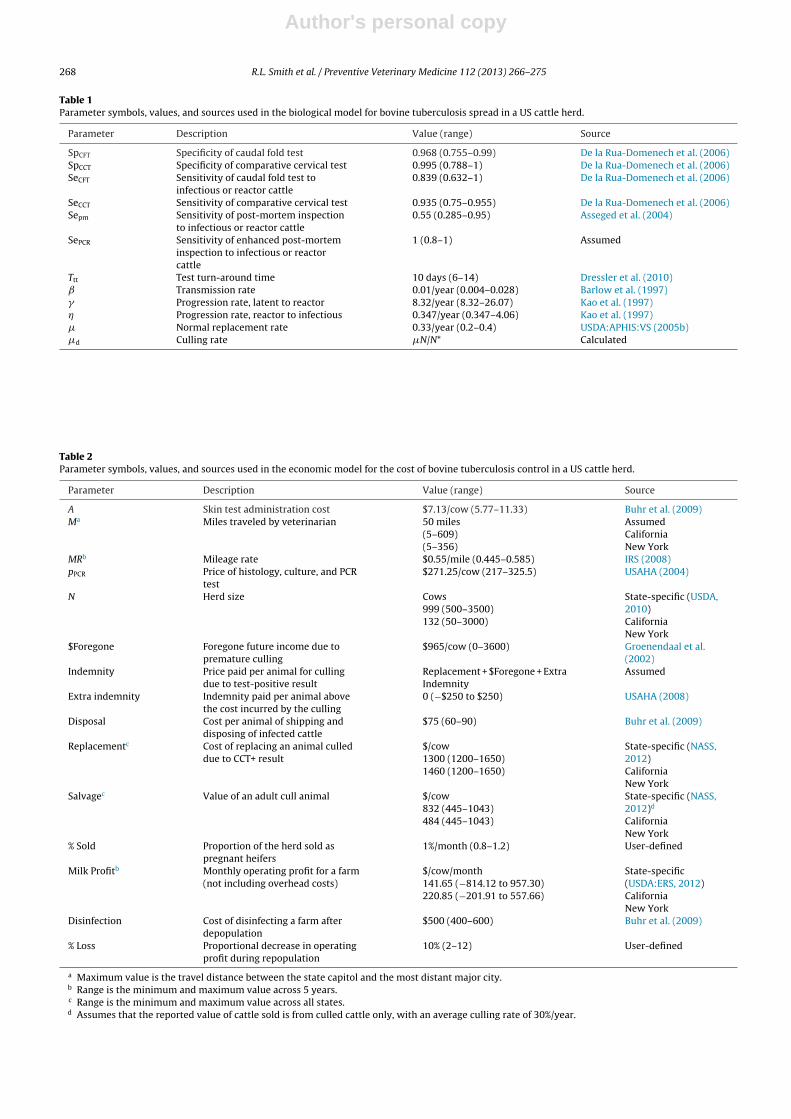
Table 1Parameter symbols, values, and sources used in the biological model for bovine tuberculosis spread in a US cattle herd.
Parameter Description Value (range) Source
SpCFT Specificity of caudal fold test 0.968 (0.755–0.99) De la Rua-Domenech et al. (2006)SpCCT Specificity of comparative cervical test 0.995 (0.788–1) De la Rua-Domenech et al. (2006)SeCFT Sensitivity of caudal fold test to
infectious or reactor cattle0.839 (0.632–1) De la Rua-Domenech et al. (2006)
SeCCT Sensitivity of comparative cervical test 0.935 (0.75–0.955) De la Rua-Domenech et al. (2006)Sepm Sensitivity of post-mortem inspection
to infectious or reactor cattle0.55 (0.285–0.95) Asseged et al. (2004)
SePCR Sensitivity of enhanced post-morteminspection to infectious or reactorcattle
1 (0.8–1) Assumed
Ttt Test turn-around time 10 days (6–14) Dressler et al. (2010) ̌ Transmission rate 0.01/year (0.004–0.028) Barlow et al. (1997)
� Progression rate, latent to reactor 8.32/year (8.32–26.07) Kao et al. (1997)� Progression rate, reactor to infectious 0.347/year (0.347–4.06) Kao et al. (1997)� Normal replacement rate 0.33/year (0.2–0.4) USDA:APHIS:VS (2005b)�d Culling rate �N/N* Calculated
Table 2Parameter symbols, values, and sources used in the economic model for the cost of bovine tuberculosis control in a US cattle herd.
Parameter Description Value (range) Source
A Skin test administration cost $7.13/cow (5.77–11.33) Buhr et al. (2009)Ma Miles traveled by veterinarian 50 miles
(5–609)(5–356)
AssumedCaliforniaNew York
MRb Mileage rate $0.55/mile (0.445–0.585) IRS (2008)pPCR Price of histology, culture, and PCR
test$271.25/cow (217–325.5) USAHA (2004)
N Herd size Cows999 (500–3500)132 (50–3000)
State-specific (USDA,2010)CaliforniaNew York
$Foregone Foregone future income due topremature culling
$965/cow (0–3600) Groenendaal et al.(2002)
Indemnity Price paid per animal for cullingdue to test-positive result
Replacement + $Foregone + ExtraIndemnity
Assumed
Extra indemnity Indemnity paid per animal abovethe cost incurred by the culling
0 (−$250 to $250) USAHA (2008)
Disposal Cost per animal of shipping anddisposing of infected cattle
$75 (60–90) Buhr et al. (2009)
Replacementc Cost of replacing an animal culleddue to CCT+ result
$/cow1300 (1200–1650)1460 (1200–1650)
State-specific (NASS,2012)CaliforniaNew York
Salvagec Value of an adult cull animal $/cow832 (445–1043)484 (445–1043)
State-specific (NASS,2012)d
CaliforniaNew York
% Sold Proportion of the herd sold aspregnant heifers
1%/month (0.8–1.2) User-defined
Milk Profitb Monthly operating profit for a farm(not including overhead costs)
$/cow/month141.65 (−814.12 to 957.30)220.85 (−201.91 to 557.66)
State-specific(USDA:ERS, 2012)CaliforniaNew York
Disinfection Cost of disinfecting a farm afterdepopulation
$500 (400–600) Buhr et al. (2009)
% Loss Proportional decrease in operatingprofit during repopulation
10% (2–12) User-defined
a Maximum value is the travel distance between the state capitol and the most distant major city.b Range is the minimum and maximum value across 5 years.c Range is the minimum and maximum value across all states.d Assumes that the reported value of cattle sold is from culled cattle only, with an average culling rate of 30%/year.
Author's personal copy
R.L. Smith et al. / Preventive Veterinary Medicine 112 (2013) 266– 275 269
calculated as:
costsgov = NWHT ∗ c(CFT) +∑
t
c(CCT |NCCT (t))
+∑
t
c(PCR|Nslaughter,R,I(t)) + cullI,R(t) ∗ indemnity
+ cullS,E(t) ∗ (indemnity − salvage) (1)
where NWHT is the number of WHTs given to all animals andNCCT(t) and Nslaughter,{R,I}(t) are the total numbers of animalstested by CCT and by PCR, respectively, over the course of atesting period t, where it is assumed that only animals in theR and I classes will have gross lesions at slaughter requiringPCR testing. The number of detectable and undetectableanimals culled due to positive tests are cullI,R and cullS,E,respectively. The cost of each CFT is represented by c(CFT),
c(CFT) = A ∗ N + 2(M ∗ MR) (2)
with all variables as described in Dressler et al. and inTable 2. Briefly, A is the cost of administering the test peranimal, M is the miles traveled by the veterinarian perform-ing the test, and MR is the cost of traveling per mile. Duringthe validation phase, all CFT-positive animals at time t weretested by CCT at cost c(CCT|NCCT(t)), where NCCT(t) is equalto the number of CFT-positive animals at time t and
c(CCT |NCCT (t)) = A ∗ NCCT (t) + 2(M ∗ MR) (3)
All CCT + animals were then culled (in Eq. (1),cullI,R(t) + cullS,E(t)). During the removal phase, all CFT+animals were culled (in Eq. (1), cullI,R(t) + cullS,E(t)). Theexpenses for the number of animals culled (in Eq. (1)) werethe cost of indemnity in all animals culled (cullI,R + cullS,E)plus the cost of PCR in animals with gross lesions (cullI,R),less the salvage value of animals without gross lesions(cullS,E),
c(PCR|Nslaughter,R,I(t)) = cullR,I(t) ∗ [pPCR + indem + disposal]
+ cullS,E(t) ∗ [indem − salvage] (4)
where indem is the indemnity amount paid for each animalculled for tuberculosis, disposal is the cost of transport-ing and disposing of positive animals, and ppcr is the costof testing gross lesions by histopathology and PCR. It isassumed that only animals culled by testing in the reactorand infectious categories, cullR,I, would have gross lesions.The number of animals culled by testing in the Susceptibleand Latent categories is represented by cullS,E and salvageis the value of their carcasses. Salvage value was calculatedfrom published values of cattle sold by state.
Under current rules, the value of indemnity is officially100% of the fair market value, minus salvage and plus dis-posal costs, up to $3000 per animal (USDA:APHIS:VS, 2010).This value will change for each animal, but an averagefor the herd may be considered. For instance, in a NewMexico herd of 1500 cows, indemnity for depopulation in2002 was calculated to cost $3,750,000, or $2500/animal(USAHA, 2008; Wolf et al., 2000); during that year in NewMexico, replacement cost was approximately $1675/ani-mal (National Agricultural Statistics Service, 2003), so thetotal indemnity was similar to the replacement cost plus
the assumed $965/animal (Groenendaal et al., 2002) costof early culling ($Foregone, in Eq. (5) below). We can there-fore assume that indemnity would remain approximatelyequal to the replacement cost plus the cost of early culling(the total cost to the farm of losing the animal). This main-tains the observed relationship between indemnity andcontemporary farm-level slaughter costs, in which valuesapproach parity.
2.1.2. Farm-levelAt the farm level, the cost of an outbreak included
replacement costs, decrease in milk sold, and a holding costdue to quarantine. We assume a simple cost structure,
costsfarm =∑
t
[cullS,E(t) + cullI,R(t)] ∗ [$Foregene
+ replacement − indem] + c(holding) (5)
where $Foregone is the cost of the money foregone byearly culling of a CCT+ animal (cullS,E + cullR,I, from Eq. (1)),assuming that replacements are able to enter the herdimmediately. The cost of replacing animals culled is rep-resented as replacement, and indem is as defined above.
We considered 3 situations with regards to holdingcosts: no loss due to quarantine, fixed costs, and monthlylosses. Fixed costs are used to represent herds in which off-site heifer rearing is used; upfront costs associated with calfhousing ($housing in Eq. (6)) will be required, but operatingcosts were assumed to be unchanged. With monthly losses,the least common scenario, we assumed that a propor-tion of pregnant heifers would have been sold each monthas surplus. The holding cost during the quarantine periodtherefore consisted primarily of lost sales. Thus, the cost ofquarantine in Eq. (5) was
c (holding) = $housing +q∑
t=1
%sold ∗ (replacement
− salvge) ∗ N(t) (6)
where % sold is the proportion of the herd sold each monthas pregnant heifers, salvage is the salvage value of an adultcow, N is the herd size, and q is the number of months theherd spends in quarantine. In this situation, we assumedthat the heifers would replace older cows, which would beculled.
2.2. Simulation
The model was first simulated at a range of Tti and NWHTvalues, with 1000 iterations at each combination of param-eters. Farm and government level cost distributions (Eqs.(1) and (5)) were recorded for each combination of param-eters.
2.3. Sensitivity analysis
A global sensitivity analysis was performed using LatinHypercube sampling on all 24 parameters with 100 modelruns of 1000 iterations each, with iterations in which herdswere undetected discarded. Parameters were varied over
Author's personal copy
270 R.L. Smith et al. / Preventive Veterinary Medicine 112 (2013) 266– 275
an expected range based on the literature; if a range for aparameter was not available in the literature, it was variedover ±20% of its base value (in Tables 1 and 2). The partialrank correlation coefficient for mean cost was calculatedfor each of the 3 scenarios (government, Eq. (1); farm withno holding cost, Eq. (5) with Eq. (6) set to 0; and farm withvaried holding cost, Eq. (5) with Eq. (6) added). Effects wereassumed to be significant at the ̨ = 0.05 level.
2.4. Stochastic optimization
First, we examined the results of the original simula-tion for first-order dominance in either cost distribution(farm, Eq. (5), and government, Eq. (1), level). When firstorder dominance was not obtained leading to a dominantaction, we utilized a global non-parametric optimizationalgorithm developed by Andradottir (1996) to obtain anoptimal action. In this method, the goal is
minv ∈ V f (v) = E[Xv] (7)
where Xv is a sequence of random variables (in this case,the cost of bTB control, either Eq. (1) or Eq. (5) depend-ing on the focus of the optimization), but E[Xv] is unknowndue to the stochastic nature of the system. Given that V isa vector of possible variable sets (in our case, a matrix of{Tti, NWHT} combinations), we selected a single point v andchoose another point v′ at random. The simulation was iter-ated once for each variable set chosen, and the costs (f(v)and f(v′))were calculated. The combination of Tti and NWHTproducing a lower cost was chosen, and the process wasrepeated starting with the chosen random value. After asufficient number of iterations, the point visited most oftenis the global optimizer.
The model described above was optimized separatelyfor government (Eq. (1)) and farm costs (Eq. (5)), assum-ing c(holding) = 0 (Eq. (6) set to 0), Tti = {2:12}, andNWHT = {1:8}. The optimizer was run for 1 million iterationseach.
2.5. Cost of depopulation
The alternative to test and slaughter is the currentpractice of farm depopulation. Government costs underdepopulation are a simple linear function of herd size, lessthe salvage value of PCR-negative animals.
costg(depop, t) = NI,R(t) ∗ (indemnity + pPCR + disposal)
+ NS,E(t) ∗ (indemnity − salvage) + costg(test)
+ disinfection (8)
where costg (test) is the cost of 2 annual WHTs in an unin-fected herd, as in Eqs. (2) and (3) for a herd in the validationphase, and disinfection is the cost of cleaning the farm afterdepopulation. Farm costs of depopulation were adaptedfrom Wolf et al. (2000) as
costf (depop) = CRV(t) + NMP(t) + c(holding) (9)
where CRV is the cattle replacement value assuming thatcalves and yearlings can be replaced at no loss,
CRV = N(t) ∗ (replacement + $Foregone − indemnity) (10)
NMP is the net milk profit lost,
NMP = [(Milk Profit)q + (Milk Profit)r ∗ %loss] ∗ N(t) (11)
c(holding) is as defined in Eq. (6), assuming that thequarantine period q is equal to the season of repopula-tion, s, and cullS,E,R,I is the number of animals culled by the2 annual WHTs following repopulation. We defined (MilkProfit)q in Eq. (11) as the profit from milk produced dur-ing the season of quarantine, q, in the most recent year.Milk Profit was assumed to be the value of milk ($/cwt)(National Agricultural Statistics Service, 2012a) less theoperating costs ($/cwt) (USDA:ERS, 2012) times the pro-duction per cow (cwt/cow) (National Agricultural StatisticsService, 2012b); all values were averaged at the state levelover the years 2006–2010. The %loss in Eq. (11) was theassumed proportional loss of production during the periodof repopulation, r.
We compared the distribution of the cost of depop-ulation (Eqs. (8) and (9)) to the distribution of thecosts of the optimal test-and-remove plan (Eqs. (1)and (5)) across a spectrum of herd sizes (100–10,000head), variable monthly losses per animal due to quar-antine ($0–$1000), and variable average indemnity values($500–$2500). Comparisons were made for both farm-leveland government-level costs.
The model and all analyses were programmed in R2.12.2,1 which was accessed through the Revolution R Ana-lytics 4.3.0 interface.2
3. Results
The system was optimized separately for the farm andgovernment level costs. The optimizer visited each value ofTti between 2 and 4 for more than 10,000 of the 1,000,000iterations for both farm and government level analyses,with a preference for 2 at 15.8% of iterations. There wasa strong preference for fewer NWHT, with 2 visited by 95.9%of iterations.
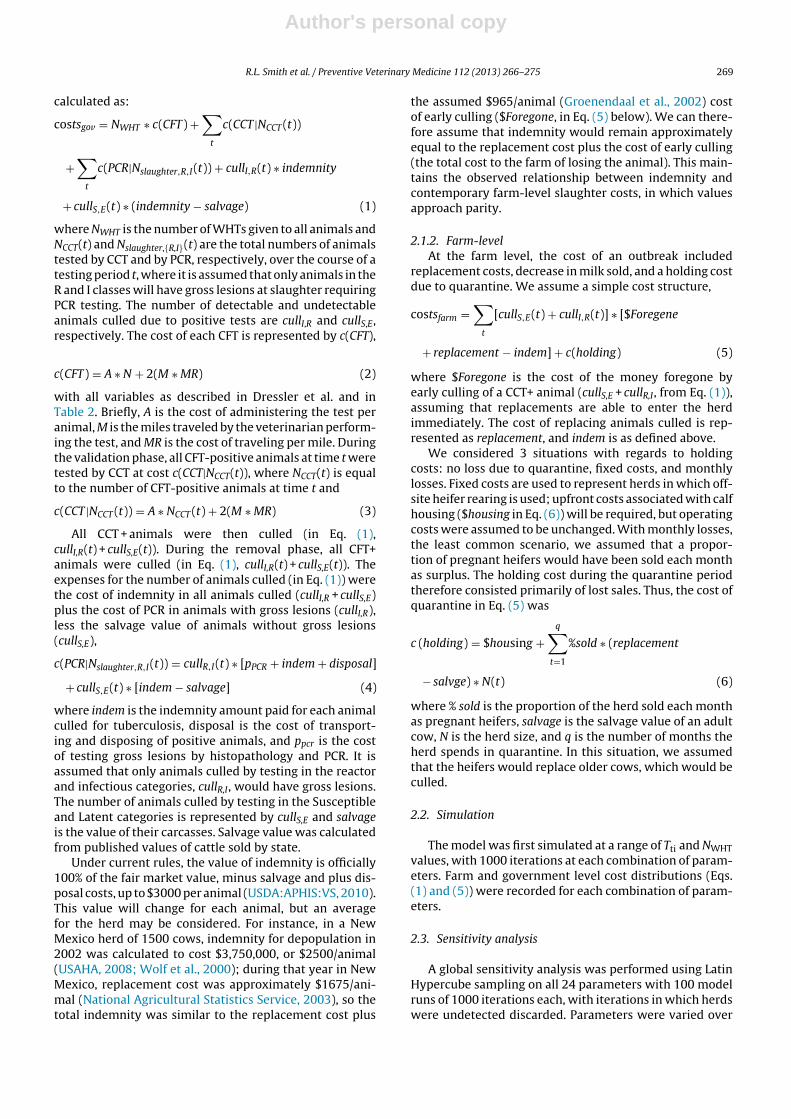
The range of mean government and farm costs in CAacross Tti and NWHT is shown in Fig. 1. These costs increasesignificantly as the required number of tests increase forclearance but change little over the number of testing inter-vals. Government costs are much more sensitive to NWHTthan to Tti. Although not shown for brevity, similar rela-tionships are seen in NY herds.
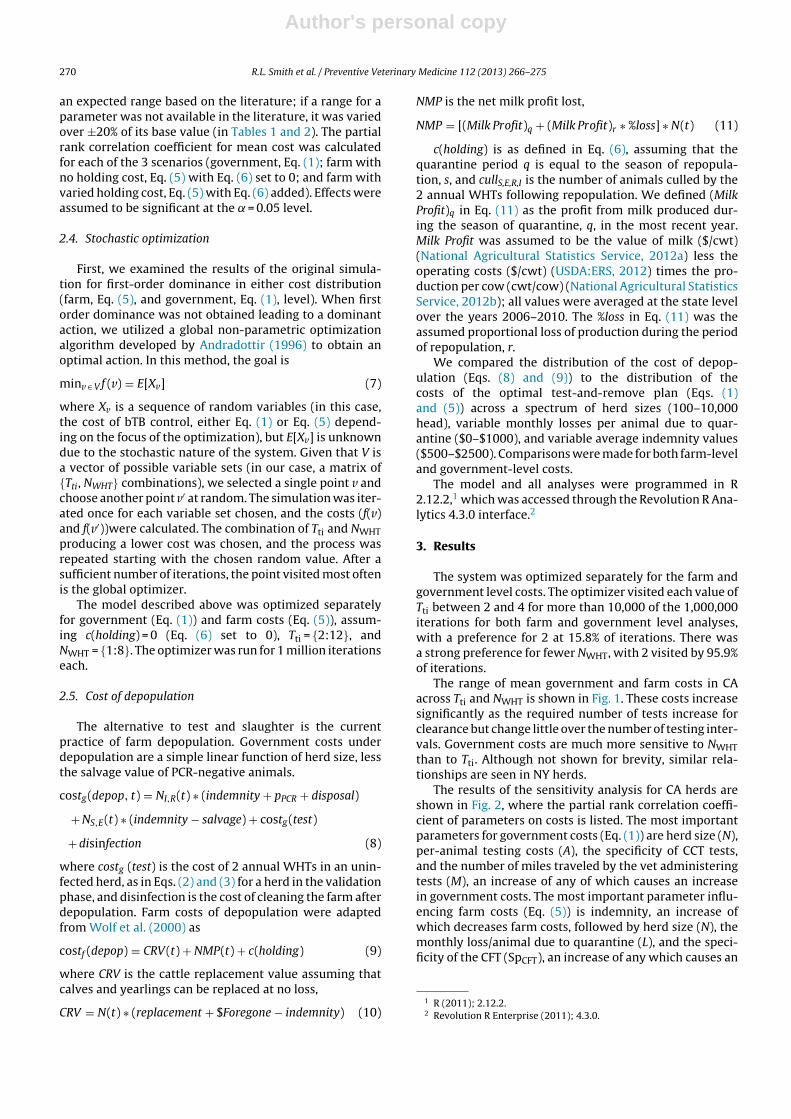
The results of the sensitivity analysis for CA herds areshown in Fig. 2, where the partial rank correlation coeffi-cient of parameters on costs is listed. The most importantparameters for government costs (Eq. (1)) are herd size (N),per-animal testing costs (A), the specificity of CCT tests,and the number of miles traveled by the vet administeringtests (M), an increase of any of which causes an increasein government costs. The most important parameter influ-encing farm costs (Eq. (5)) is indemnity, an increase ofwhich decreases farm costs, followed by herd size (N), themonthly loss/animal due to quarantine (L), and the speci-ficity of the CFT (SpCFT), an increase of any which causes an
1 R (2011); 2.12.2.2 Revolution R Enterprise (2011); 4.3.0.
Author's personal copy
R.L. Smith et al. / Preventive Veterinary Medicine 112 (2013) 266– 275 271
Fig. 1. Mean cost per farm for the government to control a bovine tuber-culosis outbreak in an average California dairy herd, by the interval ofwhole-herd tests and the number of negative whole-herd tests needed todeclare the herd to be clear of infection.
increase in farm costs. If monthly loss/animal due to quar-antine is restricted to 0, only indemnity significantly affectsfarm costs. The results for NY herds are similar.
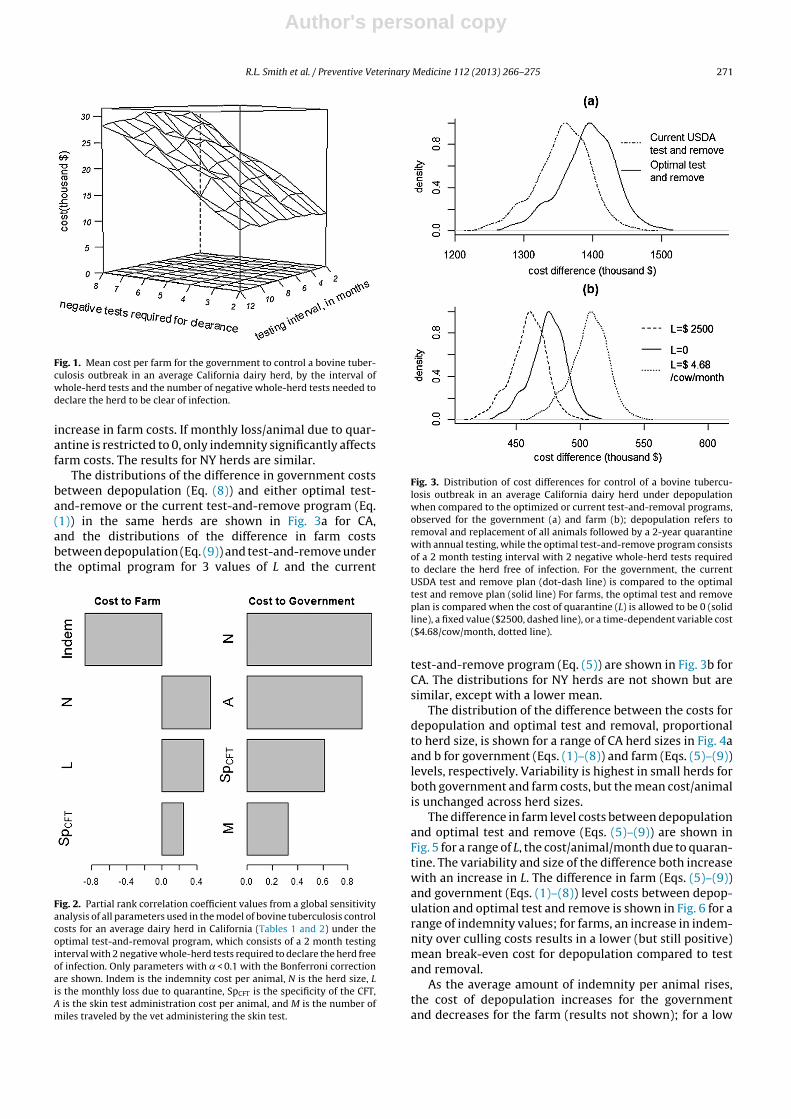
The distributions of the difference in government costsbetween depopulation (Eq. (8)) and either optimal test-and-remove or the current test-and-remove program (Eq.(1)) in the same herds are shown in Fig. 3a for CA,and the distributions of the difference in farm costsbetween depopulation (Eq. (9)) and test-and-remove underthe optimal program for 3 values of L and the current
Fig. 2. Partial rank correlation coefficient values from a global sensitivityanalysis of all parameters used in the model of bovine tuberculosis controlcosts for an average dairy herd in California (Tables 1 and 2) under theoptimal test-and-removal program, which consists of a 2 month testinginterval with 2 negative whole-herd tests required to declare the herd freeof infection. Only parameters with ̨ < 0.1 with the Bonferroni correctionare shown. Indem is the indemnity cost per animal, N is the herd size, Lis the monthly loss due to quarantine, SpCFT is the specificity of the CFT,A is the skin test administration cost per animal, and M is the number ofmiles traveled by the vet administering the skin test.
Fig. 3. Distribution of cost differences for control of a bovine tubercu-losis outbreak in an average California dairy herd under depopulationwhen compared to the optimized or current test-and-removal programs,observed for the government (a) and farm (b); depopulation refers toremoval and replacement of all animals followed by a 2-year quarantinewith annual testing, while the optimal test-and-remove program consistsof a 2 month testing interval with 2 negative whole-herd tests requiredto declare the herd free of infection. For the government, the currentUSDA test and remove plan (dot-dash line) is compared to the optimaltest and remove plan (solid line) For farms, the optimal test and removeplan is compared when the cost of quarantine (L) is allowed to be 0 (solidline), a fixed value ($2500, dashed line), or a time-dependent variable cost($4.68/cow/month, dotted line).
test-and-remove program (Eq. (5)) are shown in Fig. 3b forCA. The distributions for NY herds are not shown but aresimilar, except with a lower mean.
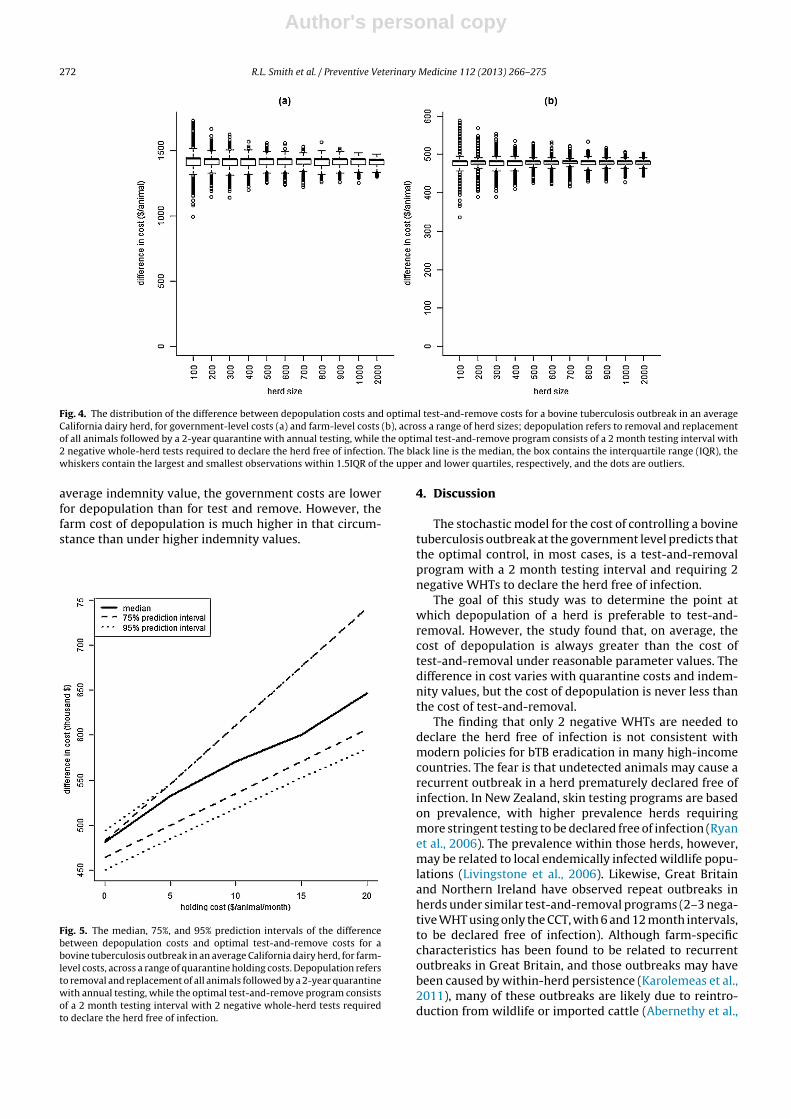
The distribution of the difference between the costs fordepopulation and optimal test and removal, proportionalto herd size, is shown for a range of CA herd sizes in Fig. 4aand b for government (Eqs. (1)–(8)) and farm (Eqs. (5)–(9))levels, respectively. Variability is highest in small herds forboth government and farm costs, but the mean cost/animalis unchanged across herd sizes.
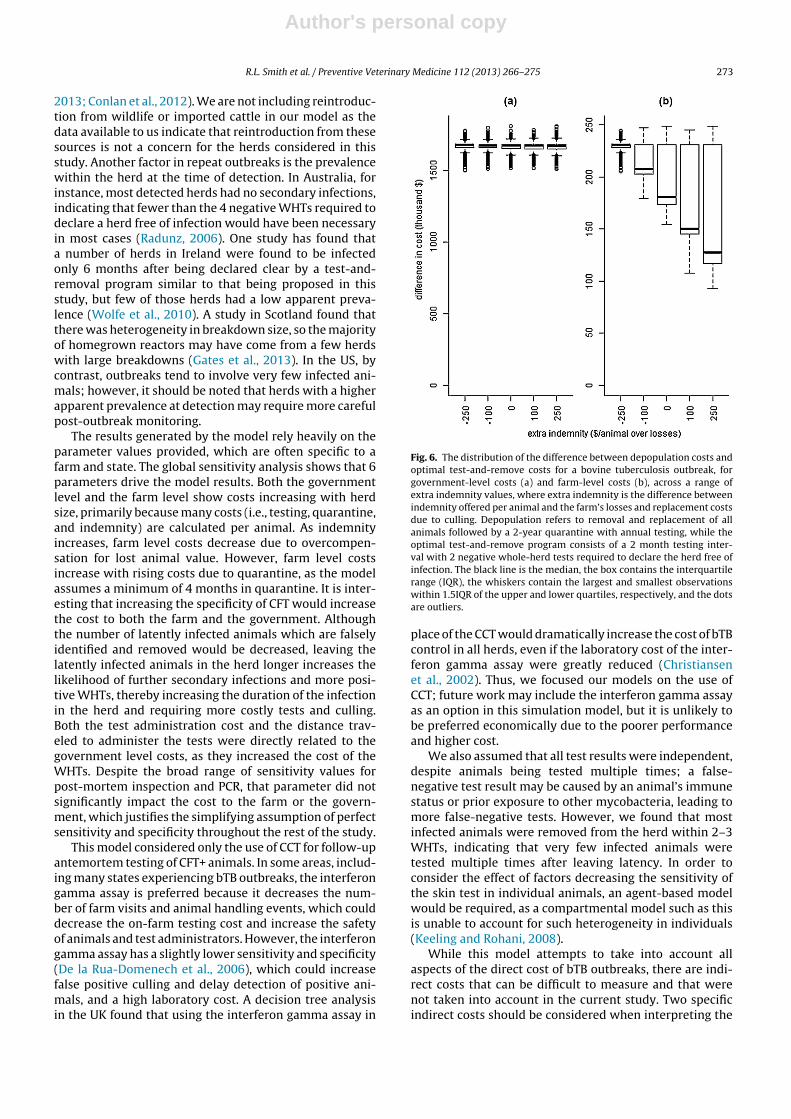
The difference in farm level costs between depopulationand optimal test and remove (Eqs. (5)–(9)) are shown inFig. 5 for a range of L, the cost/animal/month due to quaran-tine. The variability and size of the difference both increasewith an increase in L. The difference in farm (Eqs. (5)–(9))and government (Eqs. (1)–(8)) level costs between depop-ulation and optimal test and remove is shown in Fig. 6 for arange of indemnity values; for farms, an increase in indem-nity over culling costs results in a lower (but still positive)mean break-even cost for depopulation compared to testand removal.
As the average amount of indemnity per animal rises,the cost of depopulation increases for the governmentand decreases for the farm (results not shown); for a low
Author's personal copy
272 R.L. Smith et al. / Preventive Veterinary Medicine 112 (2013) 266– 275
Fig. 4. The distribution of the difference between depopulation costs and optimal test-and-remove costs for a bovine tuberculosis outbreak in an averageCalifornia dairy herd, for government-level costs (a) and farm-level costs (b), across a range of herd sizes; depopulation refers to removal and replacementof all animals followed by a 2-year quarantine with annual testing, while the optimal test-and-remove program consists of a 2 month testing interval with2 negative whole-herd tests required to declare the herd free of infection. The black line is the median, the box contains the interquartile range (IQR), thewhiskers contain the largest and smallest observations within 1.5IQR of the upper and lower quartiles, respectively, and the dots are outliers.
average indemnity value, the government costs are lowerfor depopulation than for test and remove. However, thefarm cost of depopulation is much higher in that circum-stance than under higher indemnity values.
Fig. 5. The median, 75%, and 95% prediction intervals of the differencebetween depopulation costs and optimal test-and-remove costs for abovine tuberculosis outbreak in an average California dairy herd, for farm-level costs, across a range of quarantine holding costs. Depopulation refersto removal and replacement of all animals followed by a 2-year quarantinewith annual testing, while the optimal test-and-remove program consistsof a 2 month testing interval with 2 negative whole-herd tests requiredto declare the herd free of infection.
4. Discussion
The stochastic model for the cost of controlling a bovinetuberculosis outbreak at the government level predicts thatthe optimal control, in most cases, is a test-and-removalprogram with a 2 month testing interval and requiring 2negative WHTs to declare the herd free of infection.
The goal of this study was to determine the point atwhich depopulation of a herd is preferable to test-and-removal. However, the study found that, on average, thecost of depopulation is always greater than the cost oftest-and-removal under reasonable parameter values. Thedifference in cost varies with quarantine costs and indem-nity values, but the cost of depopulation is never less thanthe cost of test-and-removal.
The finding that only 2 negative WHTs are needed todeclare the herd free of infection is not consistent withmodern policies for bTB eradication in many high-incomecountries. The fear is that undetected animals may cause arecurrent outbreak in a herd prematurely declared free ofinfection. In New Zealand, skin testing programs are basedon prevalence, with higher prevalence herds requiringmore stringent testing to be declared free of infection (Ryanet al., 2006). The prevalence within those herds, however,may be related to local endemically infected wildlife popu-lations (Livingstone et al., 2006). Likewise, Great Britainand Northern Ireland have observed repeat outbreaks inherds under similar test-and-removal programs (2–3 nega-tive WHT using only the CCT, with 6 and 12 month intervals,to be declared free of infection). Although farm-specificcharacteristics has been found to be related to recurrentoutbreaks in Great Britain, and those outbreaks may havebeen caused by within-herd persistence (Karolemeas et al.,2011), many of these outbreaks are likely due to reintro-duction from wildlife or imported cattle (Abernethy et al.,
Author's personal copy
R.L. Smith et al. / Preventive Veterinary Medicine 112 (2013) 266– 275 273
2013; Conlan et al., 2012). We are not including reintroduc-tion from wildlife or imported cattle in our model as thedata available to us indicate that reintroduction from thesesources is not a concern for the herds considered in thisstudy. Another factor in repeat outbreaks is the prevalencewithin the herd at the time of detection. In Australia, forinstance, most detected herds had no secondary infections,indicating that fewer than the 4 negative WHTs required todeclare a herd free of infection would have been necessaryin most cases (Radunz, 2006). One study has found thata number of herds in Ireland were found to be infectedonly 6 months after being declared clear by a test-and-removal program similar to that being proposed in thisstudy, but few of those herds had a low apparent preva-lence (Wolfe et al., 2010). A study in Scotland found thatthere was heterogeneity in breakdown size, so the majorityof homegrown reactors may have come from a few herdswith large breakdowns (Gates et al., 2013). In the US, bycontrast, outbreaks tend to involve very few infected ani-mals; however, it should be noted that herds with a higherapparent prevalence at detection may require more carefulpost-outbreak monitoring.
The results generated by the model rely heavily on theparameter values provided, which are often specific to afarm and state. The global sensitivity analysis shows that 6parameters drive the model results. Both the governmentlevel and the farm level show costs increasing with herdsize, primarily because many costs (i.e., testing, quarantine,and indemnity) are calculated per animal. As indemnityincreases, farm level costs decrease due to overcompen-sation for lost animal value. However, farm level costsincrease with rising costs due to quarantine, as the modelassumes a minimum of 4 months in quarantine. It is inter-esting that increasing the specificity of CFT would increasethe cost to both the farm and the government. Althoughthe number of latently infected animals which are falselyidentified and removed would be decreased, leaving thelatently infected animals in the herd longer increases thelikelihood of further secondary infections and more posi-tive WHTs, thereby increasing the duration of the infectionin the herd and requiring more costly tests and culling.Both the test administration cost and the distance trav-eled to administer the tests were directly related to thegovernment level costs, as they increased the cost of theWHTs. Despite the broad range of sensitivity values forpost-mortem inspection and PCR, that parameter did notsignificantly impact the cost to the farm or the govern-ment, which justifies the simplifying assumption of perfectsensitivity and specificity throughout the rest of the study.
This model considered only the use of CCT for follow-upantemortem testing of CFT+ animals. In some areas, includ-ing many states experiencing bTB outbreaks, the interferongamma assay is preferred because it decreases the num-ber of farm visits and animal handling events, which coulddecrease the on-farm testing cost and increase the safetyof animals and test administrators. However, the interferongamma assay has a slightly lower sensitivity and specificity(De la Rua-Domenech et al., 2006), which could increasefalse positive culling and delay detection of positive ani-mals, and a high laboratory cost. A decision tree analysisin the UK found that using the interferon gamma assay in
Fig. 6. The distribution of the difference between depopulation costs andoptimal test-and-remove costs for a bovine tuberculosis outbreak, forgovernment-level costs (a) and farm-level costs (b), across a range ofextra indemnity values, where extra indemnity is the difference betweenindemnity offered per animal and the farm’s losses and replacement costsdue to culling. Depopulation refers to removal and replacement of allanimals followed by a 2-year quarantine with annual testing, while theoptimal test-and-remove program consists of a 2 month testing inter-val with 2 negative whole-herd tests required to declare the herd free ofinfection. The black line is the median, the box contains the interquartilerange (IQR), the whiskers contain the largest and smallest observationswithin 1.5IQR of the upper and lower quartiles, respectively, and the dotsare outliers.
place of the CCT would dramatically increase the cost of bTBcontrol in all herds, even if the laboratory cost of the inter-feron gamma assay were greatly reduced (Christiansenet al., 2002). Thus, we focused our models on the use ofCCT; future work may include the interferon gamma assayas an option in this simulation model, but it is unlikely tobe preferred economically due to the poorer performanceand higher cost.
We also assumed that all test results were independent,despite animals being tested multiple times; a false-negative test result may be caused by an animal’s immunestatus or prior exposure to other mycobacteria, leading tomore false-negative tests. However, we found that mostinfected animals were removed from the herd within 2–3WHTs, indicating that very few infected animals weretested multiple times after leaving latency. In order toconsider the effect of factors decreasing the sensitivity ofthe skin test in individual animals, an agent-based modelwould be required, as a compartmental model such as thisis unable to account for such heterogeneity in individuals(Keeling and Rohani, 2008).
While this model attempts to take into account allaspects of the direct cost of bTB outbreaks, there are indi-rect costs that can be difficult to measure and that werenot taken into account in the current study. Two specificindirect costs should be considered when interpreting the
Author's personal copy
274 R.L. Smith et al. / Preventive Veterinary Medicine 112 (2013) 266– 275
results of this study for government-level optimization.First, the model assumes that the presence of a bTB-positiveherd generates no externality cost to the state or the state’swider cattle industry. Currently, only depopulation willguarantee that result; test and removal may result in astate’s bTB status being downgraded from Accredited Freeto Modified Accredited or Modified Accredited Advanced(USDA:APHIS:VS, 2005a), although this may change whennew BTB program standards are adopted (USDA:APHIS:VS,2009b). Such a downgrade could cost the state’s cattleindustry through a loss of exports, and cost the statethrough increased surveillance requirements. Second, themodel assumes that the outbreak is contained within oneherd and that spread to other herds and/or wildlife willnot occur during the quarantine period. If quarantine is not100% effective at containing the outbreak, the state couldsuffer losses controlling the secondary outbreaks. In eitherof these 2 cases, depopulation could become preferable totest-and-removal, and shorter testing intervals are likelyto be preferred, especially in major dairy states. In stateswith small dairy industries these 2 situations might incurminor costs, such that test-and-removal would clearly bepreferred over depopulation. The break-even cost for theseexternalities can be assumed to be the difference betweendepopulation and test and removal costs at the governmentlevel.
Due to the stochasticity of the model, the variability ofcosts decreased with herd size and increased with aver-age indemnity and with holding costs. In smaller herds,a single secondary infection has a much greater effect onthe cost/animal, as there are additional costs (primarilyfurther testing visits) associated with a secondary infec-tion. Stochasticity also means variation in the number ofanimals removed by testing (due to variation in false pos-itive results) and in the number of months in quarantine(due to variation in true positive results, the number ofsecondary infections, and the time at which secondaryinfections become detectable). These numbers increase thecost multiplicatively with indemnity and holding costs,respectively.
5. Conclusion
Our model predicts that WHTs at a 2 month interval,with 2 negative WHTs required to declare a herd bTB-free,is the economically optimal control strategy in most sce-narios. This would greatly decrease the cost of bTB controlin individual herds in the US which now relies upon depop-ulation of the herd or extended testing programs. However,depopulation may be preferred if the loss of a state’s bTB-free status is sufficiently costly.
Conflict of interest
None to declare.
Acknowledgments
This project was supported by the National Center forResearch Resources and the Office of Research Infrastruc-ture Programs (ORIP) of the National Institutes of Health
through Grant Number 8K01OD010968-02. The studysponsors had no involvement in the study or manuscript.
References
Abernethy, D.A., Upton, P., Higgins, I.M., McGrath, G., Goodchild, A.V.,Rolfe, S.J., Broughan, J.M., Downs, S.H., Clifton-Hadley, R., Menzies,F.D., De la Rua-Domenech, R., Blissitt, M.J., Duignan, A., More, S.J.,2013. Bovine tuberculosis trends in the UK and the Republic of Ireland,1995–2010. Vet. Rec. 172, 312.
Andradottir, S., 1996. A global search method for discrete stochastic opti-mization. SIAM J. Optimiz. 6, 513.
Asseged, B., Woldesenbet, Z., Yimer, E., Lemma, E., 2004. Evaluation ofabattoir inspection for the diagnosis of Mycobacterium bovis infectionin cattle at Addis Ababa abattoir. Trop. Anim. Health Pro. 36, 537–546.
Barlow, N.D., Kean, J.M., Hickling, G., Livingstone, P.G., Robson, A.B., 1997.A simulation model for the spread of bovine tuberculosis within NewZealand cattle herds. Prev. Vet. Med. 32, 57–75.
Buhr, B., McKeever, K., Adachi, K., 2009. Economic impact of bovine tuber-culosis on Minnesota’s cattle and beef sector. In: Michigan BovineTuberculosis Bibliography and Database, St. Paul, MN., pp. 20.
Christiansen, K., Goodchild, T., Vordermeier, M., Clifton-Hadley, R., Hewin-son, G., 2002. Cost-effectiveness of using the gamma-interferon testin herds with multiple tuberculin reactors. In: DEFRA Report #SE., pp.3018.
Conlan, A., McKinley, T., Karolemeas, K., Pollock, E.B., Goodchild, A.V.,Mitchell, A.P., Birch, C.P.D., Clifton-Hadley, R.S., Wood, J.L.N., 2012.Estimating the hidden burden of bovine tuberculosis in Great Britain.PLoS Comput. Biol. 8, e1002730.
De la Rua-Domenech, R., Goodchild, A.T., Vordermeier, H.M., Hewin-son, R.G., Christiansen, K.H., Clifton-Hadley, R.S., 2006. Ante mortemdiagnosis of tuberculosis in cattle: a review of the tuberculin tests,g-interferon assay and other ancillary diagnostic techniques. Res. Vet.Sci. 81, 190–210.
Dressler, J.B., Smith, R.L., Tauer, L.W., Schukken, Y.H., Grohn, Y.T., 2010.Economic analysis of the cross-reactivity of Johne’s disease vac-cination with tuberculosis in dairy cattle. Am. J. Agric. Econ. 92,1446–1455.
Gates, M.C., Volkova, V.V., Woolhouse, M.E.J., 2013. Impact of changes incattle movement regulations on the risks of bovine tuberculosis forScottish farms. Prev. Vet. Med. 108, 125–136.
Gillespie, D., 2001. Approximate accelerated stochastic simulation ofchemically reacting systems. J. Chem. Phys. 115, 1716–1733.
Groenendaal, H., Nielen, M., Jalvingh, A.W., Horst, S.H., Galligan, D.T., Hes-selink, J.W., 2002. A simulation of Johne’s disease control. Prev. Vet.Med. 54, 225–245.
Internal Revenue Service, 2008. Standard Mileage Rates, Washington, D.C.,IR–2008–131.
Kao, R.R., Roberts, M.G., Ryan, T.J., 1997. A model of bovine tuberculosiscontrol in domesticated cattle herds. Proc. Biol. Sci. 264, 1069–1076.
Karolemeas, K., Kinley, M.C., Clifton-Hadley, T.J., Goodchild, R.S., Mitchell,A.V., Johnston, A., Conlan, W.T., a, J.K., Donnelly, C.A., Wood, J.L.N.,2011. Recurrence of bovine tuberculosis breakdowns in Great Britain:risk factors and prediction. Prev. Vet. Med. 102, 22–29.
Keeling, M.J., Rohani, P., 2008. Modeling Infectious Diseases in Humansand Animals. Princeton University Press, Princeton, NJ.
Livingstone, P.G., Ryan, T.J., Hancox, N.G., Crews, K.B., Bosson, M.A.,Knowles, G.J., McCook, W., 2006. Regionalization: a strategy that willassist with bovine tuberculosis control and facilitate trade. Vet. Micro-biol. 112, 291–301.
National Agricultural Statistics Service, 2003. Agricultural Prices 2002Summary, Washington, DC, Pr 1-3 (03)a, Available at http://usda01.library.cornell.edu/usda/nass/AgriPricSu//2000s/2002/AgriPricSu-08-12-2002.pdf
National Agricultural Statistics Service, 2012a. Agricultural Prices,Washington, DC, Available at http://www.usda.gov/nass/PUBS/TODAYRPT/agpr0412.txt (ISSN: 1937–4216).
National Agricultural Statistics Service, 2012b. Milk Produc-tion, Available at http://usda.mannlib.cornell.edu/MannUsda/viewDocumentInfo.do?documentID=1103
Perumaalla, V.S., Adams, L.G., Payeur, J., Baca, D., Ficht, T.A., 1999.Molecular fingerprinting confirms extensive cow-to-cow intra-herdtransmission of a single Mycobacterium bovis strain. Vet. Microbiol.70, 269–276.
Radunz, B., 2006. Surveillance and risk management during the latterstages of eradication: experiences from Australia. Vet. Microbiol. 112,283–290.
Author's personal copy
R.L. Smith et al. / Preventive Veterinary Medicine 112 (2013) 266– 275 275
Ryan, T.J., Livingstone, P.G., Ramsey, D.S.L., De Lisle, G.W., Nugent, G.,Collins, D.M., Buddle, B.M., 2006. Advances in understanding diseaseepidemiology and implications for control and eradication of tuber-culosis in livestock: the experience from New Zealand. Vet. Microbiol.112, 211–219.
Smith, R.L., Schukken, Y.H., Lu, Z., Mitchell, R.M., Grohn, Y.T., 2013. Model-ing infection dynamics of Mycobacterium bovis in US cattle herds andimplications for control. J. Am. Vet. Med. Assoc. 243, 411–423.
USAHA, 2004. Report of the Committee on Tuberculosis, Available at:http://portals5.gomembers.com/Portals/6/Reports/2004/report-tb-2004.pdf
USAHA, 2008. Report of the Committee on Tuberculosis, Available athttp://portals5.gomembers.com/Portals/6/Reports/2008/report-tb-2008.pdf
USDA:APHIS:VS, 2005a. Bovine Tuberculosis Eradication: Uni-form Methods and Rules, Available at http://www.aphis.usda.gov/publications/animal health/content/printable version/bovindturb errad 1 1 05.pdf
USDA:APHIS:VS, 2005b. Highlights of NAHMS Johne’s Disease on U. S.Dairy Operations, 2002, System. National Animal Health MonitoringSystem, Fort Collins, CO, pp. 1991–2002.
USDA:APHIS:VS, 2007. Dairy 2007 Part II: Changes in the U.S. Dairy CattleIndustry, 1991–2007, Fort Collins, CO, Available at http://www.aphis.
usda.gov/animal health/nahms/dairy/downloads/dairy07/Dairy07dr PartII.pdf
USDA:APHIS:VS, 2009a. Analysis of bovine tuberculosis surveillancein accredited free states, Available at http://www.aphis.usda.gov/vs/nahss/cattle/tb 2009 evaluation of tb in accredited freestates jan 09.pdf
USDA:APHIS:VS, 2009b. A New Approach for Managing Bovine Tubercu-losis: Veterinary Services’ Proposed Action Plan, Available at http://www.aphis.usda.gov/animal health/animal diseases/tuberculosis/downloads/tb concept paper.pdf
USDA:APHIS:VS, 2010. Proposed Bovine Tuberculosis and Brucel-losis Draft Regulatory Framework, Available at http://www.aphis.usda.gov/animal health/tb bruc/downloads/tb bruc framework.pdf
USDA:ERS, 2012. Monthly Milk Costs of Production, Historical, Available athttp://www.ers.usda.gov/Data/CostsAndReturns/MonthlyStateCOP.zip
Wolf, C., Harsh, S., Lloyd, J., 2000. Valuing losses from depopulatingmichigan dairy herds. Agric. Econ., Available at http://ageconsearch.umn.edu/handle/11497
Wolfe, D.M., Berke, O., Kelton, D.F., White, P.W., More, S.J., O’Keeffe, J.,Martin, S.W., 2010. From explanation to prediction: a model for recur-rent bovine tuberculosis in Irish cattle herds. Prev. Vet. Med. 94,170–177.


