Embed Size (px)
Citation preview
For Peer Review
miR-192, miR-194 and miR-215: A Convergent miRNA
Network Suppressing Tumor Progression in Renal Cell
Carcinoma
Journal: Carcinogenesis
Manuscript ID: CARCIN-2013-00051.R2
Manuscript Type: Original Manuscript
Date Submitted by the Author: 22-May-2013
Complete List of Authors: Khella, Heba; Li Ka Shing Knowledge Institute of St. Michael’s Hospital,
Department of Laboratory Medicine and the Keenan Research Centre Bakhet, Marize; Li Ka Shing Knowledge Institute of St. Michael’s Hospital, Department of Laboratory Medicine and the Keenan Research Centre Allo, Ghassan; University of Toronto, Department of Laboratory Medicine and Pathobiology Jewett, Michael; 4. Division of Urologic Oncology, Princess Margaret Hospital, University Health Network, University of Toronto, Department of Surgery Girgis, Andrew; Li Ka Shing Knowledge Institute of St. Michael’s Hospital, Department of Laboratory Medicine and the Keenan Research Centre Latif, Ashraf; Li Ka Shing Knowledge Institute of St. Michael’s Hospital, Department of Laboratory Medicine and the Keenan Research Centre
Girgis, Hala; Li Ka Shing Knowledge Institute of St. Michael’s Hospital, Department of Laboratory Medicine and the Keenan Research Centre Von Both, Ingo; University of Toronto, Department of Laboratory Medicine and Pathobiology Bjarnason, Georg; Sunnybrook Odette Cancer Center, 5. Division of Medical Oncology and Hematology Yousef, GM; Li Ka Shing Knowledge Institute of St. Michael’s Hospital, Department of Laboratory Medicine and the Keenan Research Centre ; University of Toronto, Institute of Medical Science; University of Toronto, Department of Laboratory Medicine and Pathobiology
Keywords: Renal cell carcinoma, miRNA, Tumor Markers, Personalized Medicine, Targeted Therapy
Carcinogenesis Carcinogenesis Advance Access published May 28, 2013 by guest on O
ctober 15, 2016http://carcin.oxfordjournals.org/
Dow
nloaded from
For Peer Review
1
miR-192, miR-194 and miR-215: A Convergent miRNA Network Suppressing
Tumor Progression in Renal Cell Carcinoma
Heba WZ Khella1, 2
, Marize Bakhet1, Ghassan Allo
3, Michael AS Jewett
4, Andrew H
Girgis1, Ashraf Latif
1, Hala Girgis
1, Ingo Von Both
3, Georg A Bjarnason
5, George M
Yousef1,2, 3,ж
1. Department of Laboratory Medicine and the Keenan Research Centre in the Li Ka
Shing Knowledge Institute of St. Michael’s Hospital, Toronto, ON, M5B 1W8,
Canada.
2. Institute of Medical Science, University of Toronto, Toronto, ON, M5S 1A8, Canada
3. Department of Laboratory Medicine and Pathobiology, University of Toronto,
Toronto, ON, M5S 1A8, Canada.
4. Division of Urologic Oncology, Princess Margaret Hospital, University Health
Network, Department of Surgery, University of Toronto, Toronto, ON, M5G 2M9,
Canada
5. Division of Medical Oncology and Hematology, Sunnybrook Odette Cancer Center,
Toronto, ON, M4N 3M5, Canada
ж To whom correspondence should be addressed
Running Title: microRNA in renal cell carcinoma
Corresponding Author:
George M Yousef, MD PhD FRCPC (Path)
Department of Laboratory Medicine,
St. Michael's
30 Bond Street, Toronto, ON, M5B 1W8, Canada
Tel: +1-416-864-6060 Ext: 77605
Fax: 416-864-5648
E-Mail: [email protected]
Page 1 of 66 Carcinogenesis
123456789101112131415161718192021222324252627282930313233343536373839404142434445464748495051525354555657585960
by guest on October 15, 2016
http://carcin.oxfordjournals.org/D
ownloaded from
For Peer Review
2
Abstract
miRNAs play a crucial role in tumor progression and metastasis. We and others
recently identified a number of miRNAs that are dysregulated in metastatic, compared to
primary renal cell carcinoma (RCC). Here, we investigated three miRNAs that are
significantly downregulated in metastatic tumors; miR-192, miR-194 and miR-215. Gain-
of-function analyses showed that restoration of their expression decreases cell migration
and invasion in RCC cell line models, while knockdown of these miRNAs resulted in
enhancing cellular migration and invasion abilities. We identified three targets of these
miRNAs with potential role in tumor aggressiveness; MDM2, TYMS, and SIP1/ZEB2.
We observed a convergent (the same molecule can be targeted by all three miRNAs) and
a divergent (the same miRNA can control multiple targets) effects for these miRNAs. We
experimentally validated these miRNA-target interactions using three independent
approaches. First, we observed that miRNA overexpression significantly reduces the
mRNA and protein levels of their targets. In the second, we observed significant
reduction of the luciferase signal of a vector containing the 3’UTR of the target upon
miRNA overexpression. Finally, we show the presence of inverse correlation between
miRNA changes and the expression levels of their targets in patient specimens. We also
examined the prognostic significance of miR-215 in RCC. Lower expression of miR-215
is associated with significantly reduced disease-free survival time. These findings were
validated on an independent dataset from The Cancer Genome Atlas. These results can
pave the way to the clinical use of miRNAs as prognostic markers and therapeutic
targets.
Page 2 of 66Carcinogenesis
123456789101112131415161718192021222324252627282930313233343536373839404142434445464748495051525354555657585960
by guest on October 15, 2016
http://carcin.oxfordjournals.org/D
ownloaded from
For Peer Review
3
Keywords
Renal cell carcinoma; miRNA; tumor markers; metastasis; prognosis; miR-192; miR-
194; miR-215; kidney cancer; personalized medicine; targeted therapy.
Non-standard abbreviations
ccRCC, clear cell renal cell carcinoma; EMT, epithelial to mesenchymal; miRNA,
microRNA ; qRT-PCR, quantitative reverse transcription polymerase chain reaction;
SIP1/ZEB2, Smad Interacting protein 1/zinc finger E-box binding homeobox 2; MDM2,
murine double minute 2; TYMS, thymidylate synthase ; HIF-1α, hypoxia inducible factor
1 alpha subunit; PPIA, Peptidylprolyl isomerase A (cyclophilin A); HPRT1,
hypoxanthine phosphoribosyltransferase 1; 5-FU, 5-fluorouracil
Page 3 of 66 Carcinogenesis
123456789101112131415161718192021222324252627282930313233343536373839404142434445464748495051525354555657585960
by guest on October 15, 2016
http://carcin.oxfordjournals.org/D
ownloaded from
For Peer Review
4
Introduction
Renal cell carcinoma (RCC) accounts for about 90% of the adult kidney cancers,
[1] and is one of the top ten prevalent cancers in North America. The incidence of RCC is
steadily rising in the past few decades [2]. It is also an aggressive tumor with 35% overall
mortality and 30% metastatic potential. Favorable prognosis of RCC is associated with
early diagnosis and treatment while patients diagnosed at the metastatic stage have poor
prognosis with only 9% 5-year survival rate. 90% of cancer associated mortality in RCC
is due to metastasis [3]. Unfortunately, there are no biomarkers available to accurately
predict the prognosis of RCC. Therefore, there is an urgent need for more understanding
of the pathogenesis of RCC metastasis as a crucial step towards identification of
prognostic markers and development of targeted therapies for this aggressive tumor.
miRNAs are short non-coding RNAs that regulate gene expression by binding to
their target genes. They regulate critical biological processes including development, cell
differentiation, proliferation and apoptosis [4]. They also play important roles in tumor
development and metastasis [5]. miRNAs were found to be differentially expressed in
cancer, and were shown to target key molecules involved in tumor progression [6].
miRNA dysregulation in RCC is recently reported [7;8], and their involvement in RCC
pathogenesis is also documented [9-12]. They have potential utilities as cancer
biomarkers and therapeutic targets [13;14].
We, and others, identified a number of miRNAs that are differentially expressed
in metastatic RCC compared to primary tumors [15-17]. miR-192, miR-194 and miR-215
Page 4 of 66Carcinogenesis
123456789101112131415161718192021222324252627282930313233343536373839404142434445464748495051525354555657585960
by guest on October 15, 2016
http://carcin.oxfordjournals.org/D
ownloaded from
For Peer Review
5
were among the most significantly downregulated in metastatic ccRCC. These three
miRNAs are highly enriched in the normal kidney [18], and miR-192 and miR-194 were
reported to be strongly expressed in renal cortex [19]. All three miRNAs can be induced
by p53 [20] and they are also reported to be p53 positive regulators through an
autoregulatory loop [21]. A recent study reported the role of these miRNAs in
endometrial cancer progression, and suggested their potential therapeutic utility [22].
Also, miR-194 overexpression is reported to suppress liver cancer metastasis.
The three miRNAs are found in two clusters, the miR-215/miR-194-1 cluster on
chromosome 1 (1q41) and the miR-192/miR-194-2 cluster on chromosome 11 (11q13.1).
miR-194-1 and miR-194-2 have the same mature sequence that are derived from two
different precursors on two chromosomal locations. miR-192 and miR-215 are closely
related with similar seed sequence.
In this study, we delineate the functional involvement of miR-192, miR-194 and
miR-215 in RCC progression. We provide experimental evidence that these miRNAs
affect cell migration and invasion abilities. We also identified three targets of these
miRNAs that are related to cancer aggressiveness; MDM2, TYMS, and SIP1/ZEB2. We
experimentally validated the miRNA-target interactions using three independent
approaches in vitro and in vivo. We finally provide preliminary evidence on the potential
significance of miR-215 as a prognostic marker in RCC. Our findings document the
active involvement of miRNAs in kidney cancer progression. We also uncover a miRNA
network with convergent properties (where multiple miRNAs target the same molecule).
Page 5 of 66 Carcinogenesis
123456789101112131415161718192021222324252627282930313233343536373839404142434445464748495051525354555657585960
by guest on October 15, 2016
http://carcin.oxfordjournals.org/D
ownloaded from

For Peer Review
6
We further document the presence of a divergent effect of these miRNAs with the same
miRNA being able to simultaneously control a number of targets.
Page 6 of 66Carcinogenesis
123456789101112131415161718192021222324252627282930313233343536373839404142434445464748495051525354555657585960
by guest on October 15, 2016
http://carcin.oxfordjournals.org/D
ownloaded from
For Peer Review
7
Materials and methods
Specimen collection
20 Primary ccRCC cancerous tissue specimens and 61 formalin-fixed paraffin-
embedded tissues were collected from St. Michael’s Hospital, and the Ontario Tumor
Bank, Toronto, Canada. Expression data from additional 218 patients with primary
ccRCC were obtained from The Cancer Genome Atlas (TCGA) Database. Fresh
specimens were collected immediately after resection, snap frozen in liquid nitrogen, and
stored at -80ºC until total RNA extraction. Areas of pure tumor tissues were identified by
a pathologist. Samples were taken from areas with no hemorrhage or necrosis and
multiple sections were mixed from the same tumor to compensate for tumor
heterogeneity. All the procedures were approved by the Research Ethics Board at St.
Michael’s Hospital, Toronto, Canada
RNA Extraction and quantitative RT-PCR (qRT-PCR)
Two mg of fresh frozen ccRCC tissues were used for nucleic acid isolation. For
formalin-fixed tumors, nucleic acid isolation was done using 6 cores of pure tumor areas
from formalin-fixed paraffin-embedded tissues of ccRCC (each core was 1.0 mm in
diameter). Total RNA was extracted using the miRNeasy Kit (Qiagen, Mississauga,
Canada) according to the manufacture’s protocol. RNA quality and concentration were
determined spectrophotometrically.
For miRNA analyses, miRNA-specific reverse transcription was performed with
5ng total RNA using the TaqMan® MicroRNA Reverse Transcription Kit (Applied
Page 7 of 66 Carcinogenesis
123456789101112131415161718192021222324252627282930313233343536373839404142434445464748495051525354555657585960
by guest on October 15, 2016
http://carcin.oxfordjournals.org/D
ownloaded from
For Peer Review
8
Biosystems, Foster City, CA) as described by the manufacture for miR-192, miR-194,
and miR-215. Thermal cycling conditions are shown in Supplementary Table (1-A).
qRT-PCR was performed using the TaqMan microRNA Assay® Kit on the Step
One™ Plus Real-Time PCR System (Applied Biosystems, Foster City, CA). Thermal
cycling conditions were according to the manufacture’s fast protocol and all reactions
were performed in triplicate. Relative expression was determined using the ∆∆CT method
and expression values were normalized to small nuclear RNA, RNU48 (Applied
Biosystems, Foster City, CA) which was shown to be stably expressed in ccRCC tissues
[23]. Thermal cycling conditions are shown in Supplementary Table (1-B).
For the expression analyses of target genes, the primer sequence are shown in
Supplementary Table (2)
Reverse transcription was preformed with High capacity RNA-to-cDNA kit
(Applied Biosystems, Foster City, CA) as per the manufacture’s instructions. Thermal
cycling conditions are shown in Supplementary Table (1-C).
qRT-PCR was performed using the Fast Syber Green Master Mix (Applied
Biosystems, Foster City, CA). Peptidylprolyl isomerase A (cyclophilin A) (PPIA) or
hypoxanthine phosphoribosyltransferase 1 (HPRT1) were used as endogenous controls.
Thermal cycling conditions are shown in Supplementary Table (1-D).
Page 8 of 66Carcinogenesis
123456789101112131415161718192021222324252627282930313233343536373839404142434445464748495051525354555657585960
by guest on October 15, 2016
http://carcin.oxfordjournals.org/D
ownloaded from
For Peer Review
9
Cell culture and miRNA transfection
786-O, ACHN and CAKI-1 renal cell carcinoma cell lines were obtained from
American Type Culture Collection (ATCC; Manassas, VA) and were grown according to
manufacturer’s protocol. Pre-miR™ precursors and anti-miR™ miR inhibitors for miR-
192, miR-194 and miR-215 were purchased from Applied Biosystems (Foster City,
USA). Cells were transfected using siPORT™ NeoFX™ transfection agent (Ambion,
Austin, TX) as recommended by the manufacture and described in our previous
publications [24;25]. Briefly, transfection agent was diluted in Opti-MEM® Reduced
Serum Media (Invitrogen, Carlsbad, USA) and incubated for 10 minutes at room
temperature. miRNA precursors and inhibitors were diluted in the same Media to a final
concentration of 30nM, and then combined with transfection agent and incubated for 10
minutes at room temperature. Transfection mixtures were added to the cell culture plate
and overlaid with cell suspensions. Cells were then incubated at 37ºC and 5% CO2. Three
separate transfections were performed and each was analyzed in triplicate. Transfection
efficiency was confirmed using BLOCK-IT Fluorescent Oligo (Invitrogen)
Migration assay
786-O cells were seeded in a 12-well plate, and transfected either with SiPORT™
NeoFX™ transfection agent, scrambled miRNA, miR-192, miR-194 and miR-215 or
their inhibitors, or co-transfected with the miRNA and its inhibitor. Twenty four hours
after transfection, the cell monolayer was wounded using a 200µL pipette tip.
Hydroxyurea 100mM was added to the cell culture to inhibit cell proliferation.
Photomicrographs were taken every 30 minutes starting at the time of wounding (0 hrs)
Page 9 of 66 Carcinogenesis
123456789101112131415161718192021222324252627282930313233343536373839404142434445464748495051525354555657585960
by guest on October 15, 2016
http://carcin.oxfordjournals.org/D
ownloaded from
For Peer Review
10
and continued up to 9 hrs using a microscope in an incubation chamber with 37ºC and
5% CO2. This microscope was programmed to take a series of photomicrographs at the
exact place. Image J Software (National Institutes of Health, Bethesda, MD, USA,
http://rsbweb.nih.gov/ij/) was used for cell migration analysis. Percent cell-free area was
calculated as [(cell-free area9hrs/cell-free area0hrs) x 100] and cell migration rate was
displayed as the percent of cell covered area (100 - percent cell-free area). Each
experiment was performed in triplicate.
Invasion Assay
The effect of miR-192, miR-194 and miR-215 on cellular invasion were examined
using BD BioCoat Matrigel Invasion Chamber (BD Biosciences, Bedford, MA). 786-O
and ACHN cells were transfected either with SiPORT™ NeoFX™ transfection agent,
scrambled miRNA, miR-192, miR-194, miR-215 or their inhibitors, or co-transfected
with the miRNA and its inhibitor. Twenty four hours later, cells were trypsinized and
resuspended in low serum media (DMEM supplemented with 0.5% FBS). DMEM
supplemented with 10% FBS was used as a chemoattractant, added to the bottom
chamber, and cells (5.0 x 10⁴
cells/ml) were plated on the upper chamber. Cells were
incubated for 22 hours at 37ºC and 5% CO2 in a humidified tissue culture incubator.
After incubation, non-invading cells were removed from the upper surface of the
membrane and cells on the lower surface were stained with Diff-Quick. The experiment
was performed in triplicate. Photomicrographs at 40X magnification in three fields were
taken and invading cells were counted. The percentage invasion was calculated [(Mean
Page 10 of 66Carcinogenesis
123456789101112131415161718192021222324252627282930313233343536373839404142434445464748495051525354555657585960
by guest on October 15, 2016
http://carcin.oxfordjournals.org/D
ownloaded from
For Peer Review
11
number of cells that invaded through Matrigel insert/ Mean number of cells that migrated
through the control insert membrane) x 100].
Cell proliferation assay
Cellular proliferation was measured by the 3-(4, 5-Dimethylthiazol-2-yl)-2, 5-
diphenyltetrazolium bromide (MTT; Roche, Mississauga, ON) assay. Cells were plated at
6.0 x 10³ cells per well in a 96 well plate and transfected either with SiPORT™ NeoFX™
transfection agent, miR-192, miR-194 and miR-215 or co-transfected with the miRNA
and its inhibitor. Cells were incubated for 3 days after which 10µL of 5 mg/mL solution
of MTT in phosphate buffered saline (PBS) was added and incubated for 4 hours at 37°C.
The precipitate was then solubilized in 100µL solubilization solution (10% SDS in 0.01
M HCl) and incubated at 37°C overnight. The absorbance of each well was measured at a
wavelength of 550nm. Each test was repeated in triplicate.
Western Blot
CAKI-1 cells were transfected either with miR-192, miR-194, or miR-215 or co-
transfected with the miRNA and its inhibitor. 48 hours later, cells were lysed using
NETN lysis buffer (pH 8.0) with protease inhibitor cocktail tablets (Roche, Mississauga,
Canada). Proteins were collected after centrifugation at 21,000 x g for 10 minutes at 4°C.
BCA Protein Assay Reagent (Pierce Biotechnology, Rockford, IL) was used to determine
protein concentrations. Total cellular proteins were separated in a 10% sodium dodecyl
sulfate polyacrylamide gel electrophoresis (SDS-PAGE) and transferred to a
nitrocellulose membrane. The membrane was blocked with 5% BSA or 5% milk in TBST
Page 11 of 66 Carcinogenesis
123456789101112131415161718192021222324252627282930313233343536373839404142434445464748495051525354555657585960
by guest on October 15, 2016
http://carcin.oxfordjournals.org/D
ownloaded from
For Peer Review
12
and incubated with primary antibodies diluted in blocking solution overnight at 4ºC with
shaking. The membranes were then washed with TBST, incubated with appropriate
secondary antibody diluted in blocking solution for one hour. The following antibodies
were used in this study anti-Thymidylate Synthase (Millipore Corporation), MDM2
antibody (Santa Cruz Biotechnology Inc.) and anti-SIP1/ ZEB2 (Abcam, Camridge, MA,
USA). Membranes were stripped and re-probed for anti-α-tubulin (Cell Signalling
Technology Inc.) as a loading control. Western blot photos were taken and quantified
using the VersaDoc Imaging System (Bio-Rad, Hercules, CA), QuantityOne and Image
Lab 3.0 programs.
Luciferase assay
Luciferase reporter plasmids containing the 3’ UTR of TYMS, MDM2 and ZEB2
were obtained from SwitchGear Genomics (Menlo Park, CA). Empty vector was used as
a positive control. 786-O cells were seeded in 96-well plates. On the second day, cells
were transfected with the Luciferase reporter plasmids containing the 3’UTR of TYMS,
MDM2 and ZEB2, the empty vector or co-transfected with the plasmids and miRNAs
(miR-192, miR-194 or miR-215) using the DharmaFect Duo transfection agent
(Dharmacon, Thermoscientific) as recommended by the manufacture. On the third day,
luciferase activity was measured using the LightSwitch Luciferase Assay Reagents
(SwitchGear Genomics, Menlo Park, CA). Luminescence was calculated for each
construct (luminescence = specific miRNA/non-targeting control).
Page 12 of 66Carcinogenesis
123456789101112131415161718192021222324252627282930313233343536373839404142434445464748495051525354555657585960
by guest on October 15, 2016
http://carcin.oxfordjournals.org/D
ownloaded from
For Peer Review
13
Survival Analysis
miR-215 expression was measured using qRT-PCR in 61 formalin-fixed paraffin-
embedded (FFPE) tissues of primary ccRCC. Survival analysis was performed by
constructing Kaplan-Meier disease-free survival (DFS) curve. Disease-free survival was
defined as the time between the initial resection of the kidney tumor and the occurrence
of recurrence or metastasis.
Bioinformatic analysis
‘Level 3’ miRNA expression data (normalized gene expression generated using
the Illumina GA miRNASeq platform) for miR-215 in 218 patients with primary ccRCC
and overall survival data were obtained from The Cancer Genome Atlas (TCGA). The X-
tile algorithm [26] was used to generate a prognostic optimal cutoff point to dichotomize
miR-215 miRNA expression as ‘miR-215 – High Expression’ and ‘miR-215 – Low
Expression’ using the lowest Monte Carlo p value <0.05. TCGA data types, platforms,
and methodologies are as described previously (The Cancer Genome Atlas Research
Network 2008).
Phylogenetic analysis
The University of California Santa Cruise (UCSC) Genome Browser was used for
sequence comparison of miR-192, miR-194 and miR-215. Conservation among species
of these miRNAs was examined with sequence alignment in the genomes of 28 vertebrate
species, including 17 mammalian species.
Page 13 of 66 Carcinogenesis
123456789101112131415161718192021222324252627282930313233343536373839404142434445464748495051525354555657585960
by guest on October 15, 2016
http://carcin.oxfordjournals.org/D
ownloaded from
For Peer Review
14
Results
miR-192, miR-194 and miR-215 overexpression decrease cellular migration rate
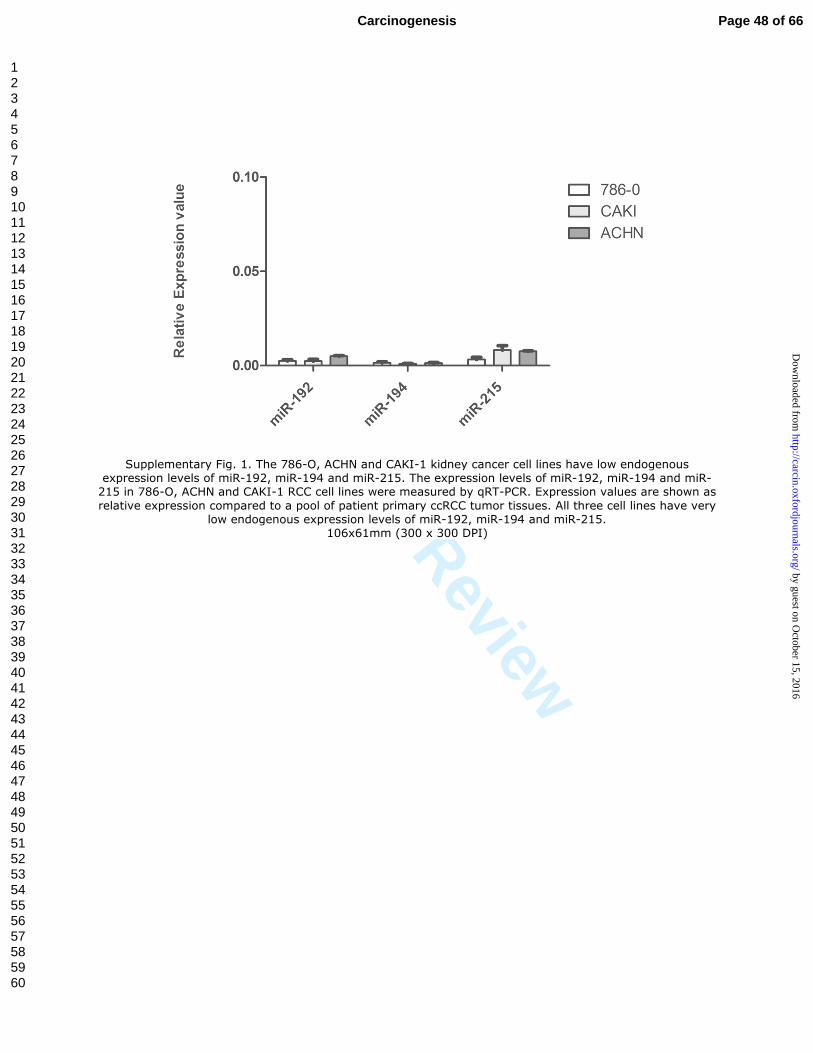
We first checked the endogenous expression levels of miR-192, miR-194 and
miR-215 in a number of kidney cancer cell lines. The 786-O, ACHN and CAKI-1 cell
lines were found to have very low expression (compared to a pool of patient primary
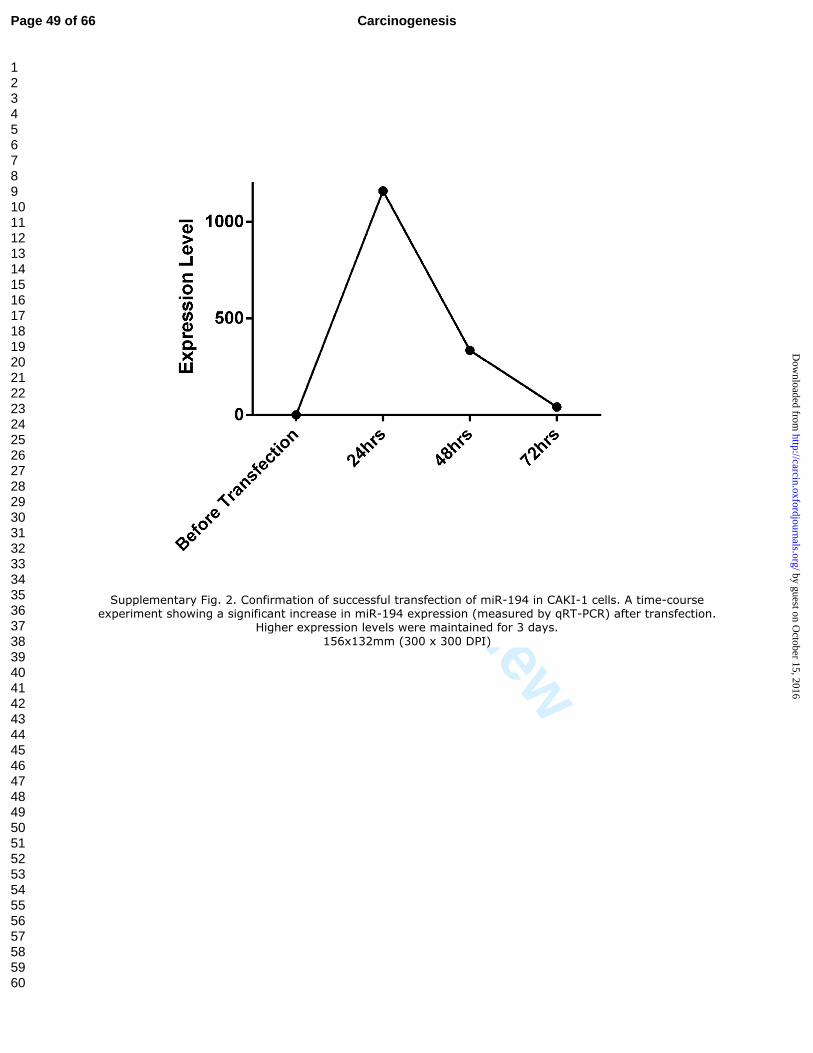
ccRCC tumor tissues) (Supplementary Figure 1). The cells were then transfected with
each of these miRNAs. Successful transfection was confirmed by qRT-PCR by
comparing the pre to post transfection levels of the miRNA (Supplementary Figure 2).
The efficiency of the anti-miR decreased when the cell doubled. However, the cells
maintained enough levels during the experimental procedures (up to 3 days).
Next, we investigated the effect of these miRNAs on cell migration using wound
healing assay. The 786-O cells were transfected with miR-192, miR-194, miR-215, or
their inhibitors, or co-transfected with each of these miRNAs and its inhibitor. A number
of controls were also used including untransfected cells, cells transfected with
transfection agent only, a miRNA with no effect on migration (as a negative control), and
cells transfected with positive control (a miRNA with known effect on migration).
Transfection with each of the three miRNAs resulted in significant reduction in the rate
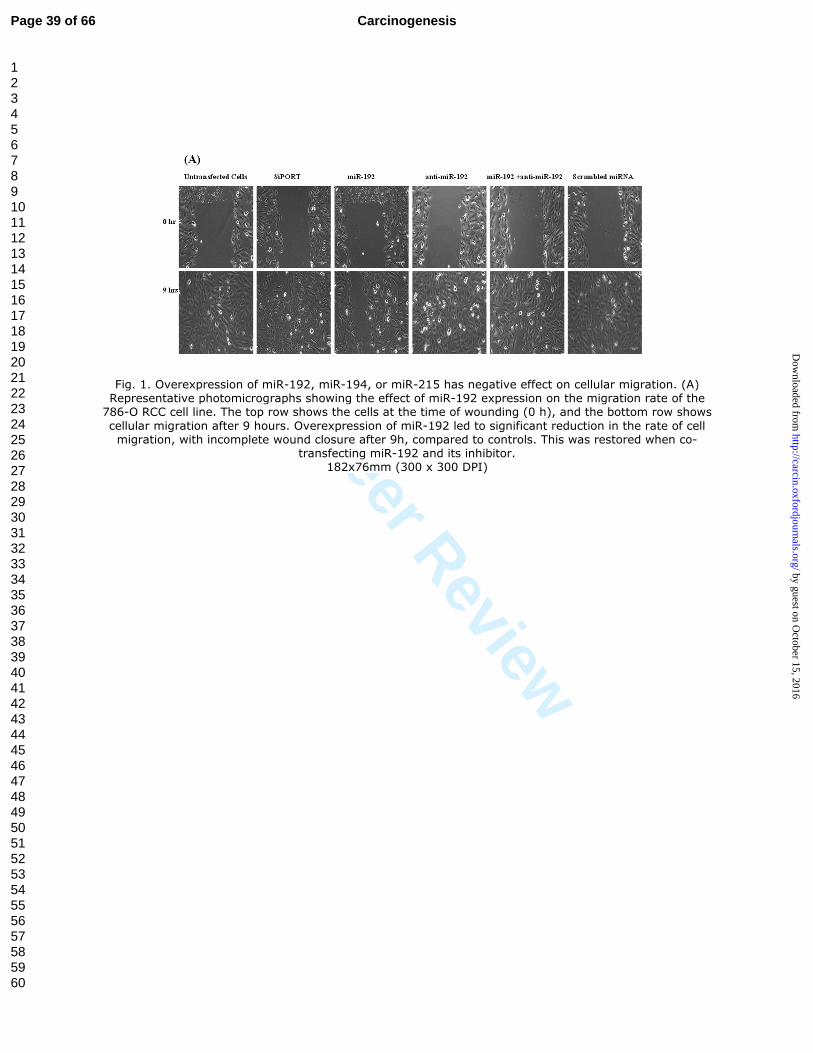
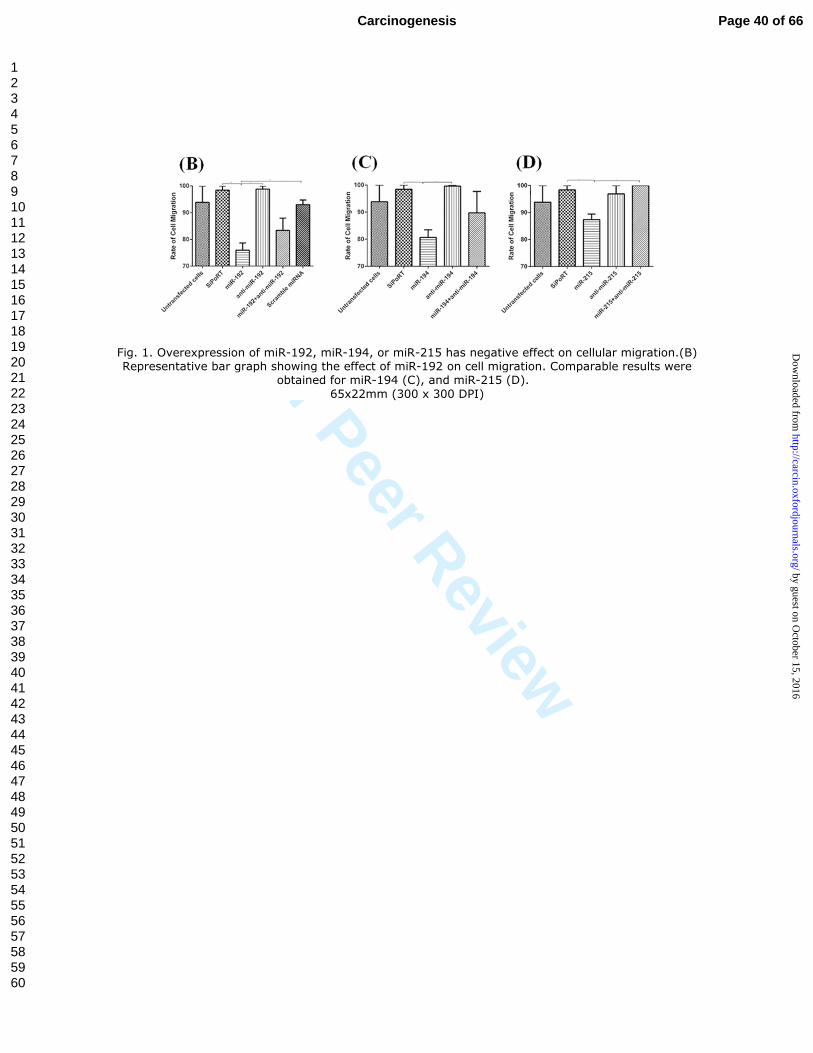
of cell migration compared to controls. As shown in Figure 1A and 1B, overexpression
of miR-192 significantly reduced cellular migration compared to untransfected cells, cells
transfected with transfection reagent only (p = 0.0045), anti-miR-192 (p = 0.0061), or
scrambled miRNA control (p = 0.0094). Also, miR-194 significantly slowed cellular
migration compared to control cells transfected with transfection agent only or with anti-
Page 14 of 66Carcinogenesis
123456789101112131415161718192021222324252627282930313233343536373839404142434445464748495051525354555657585960
by guest on October 15, 2016
http://carcin.oxfordjournals.org/D
ownloaded from
For Peer Review
15
miR-194 (p = 0.0105 and p = 0.0196, respectively) (Figure 1C). The same was observed
for miR-215, where transfected cells showed significantly reduced cell migration rate
compared to transfection reagent control (p = 0.0143) (Figure 1D). The co-transfection
of the miRNA and its inhibitor resulted in restoration of the rate of cellular migration,
further confirming our results (Figure 1). We were not able to identify other cell lines
with overexpression of these miRNAs and thus, knockdown experiments were not
performed.
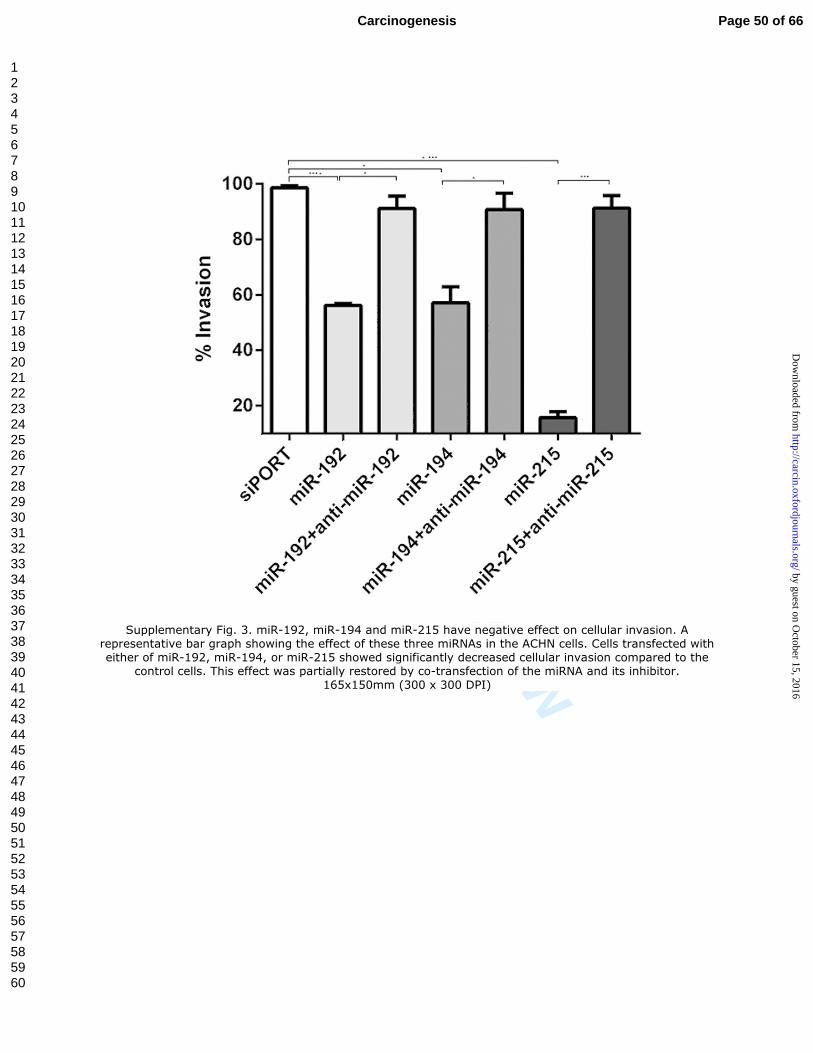
miR-192, miR-194 and miR-215 overexpression reduce cellular invasion
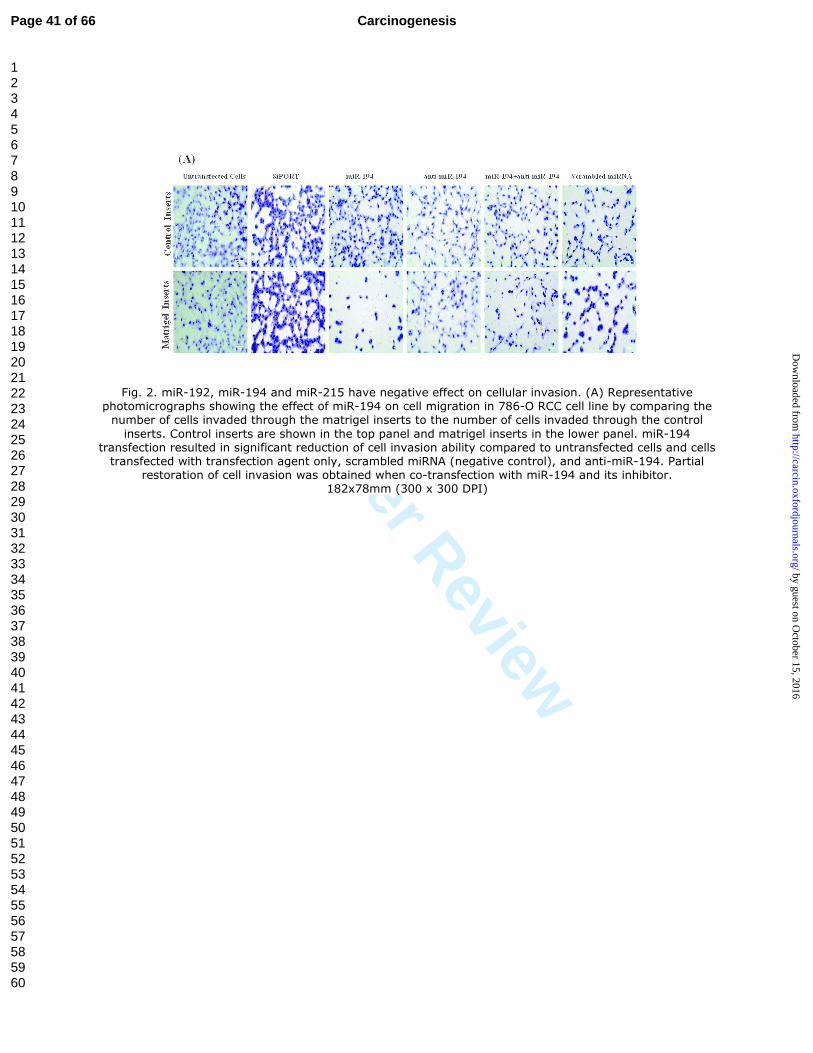
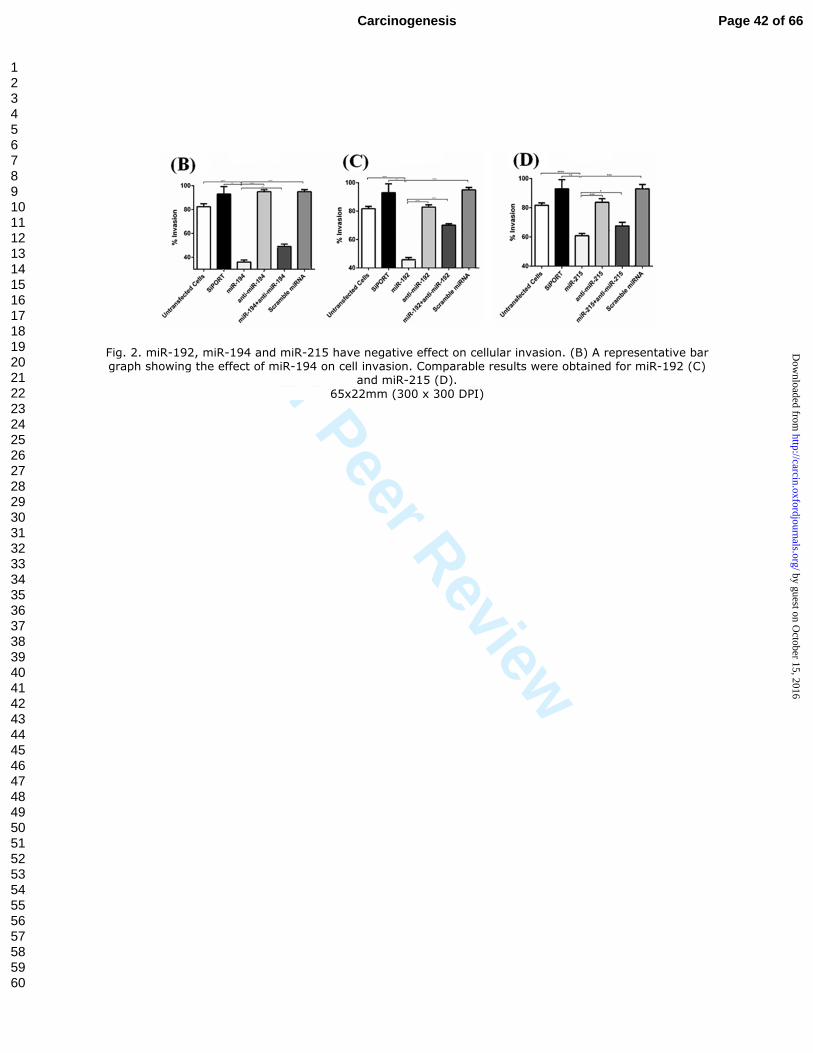
We also examined the effect of miR-192, miR-194 and miR-215 on cellular invasion
ability using 786-O and ACHN cell line models. Appropriate controls were used as
above. Cells transfected with miR-192, miR-194 or miR-215 showed significant decrease
in cellular invasion compared to untransfected cells, cells transfected with transfection
agent only, scrambled miRNA or each of these miRNAs inhibitor. The rate of cellular
invasion was partially restored when co-transfecting the miRNA and its inhibitor (Figure
2 & Supplementary Figure 3).
miR-192, miR-194 and miR-215 overexpression have insignificant effects on cellular
proliferation
We assessed the effect of miR-192, miR-194 and miR-215 on cellular
proliferation. Three kidney cancer cell lines; ACHN, CAKI-1 and 786-O, were
transfected with miR-192, miR-194, or miR-215. These three miRNAs showed little
Page 15 of 66 Carcinogenesis
123456789101112131415161718192021222324252627282930313233343536373839404142434445464748495051525354555657585960
by guest on October 15, 2016
http://carcin.oxfordjournals.org/D
ownloaded from
For Peer Review
16
insignificant reduction of cellular proliferation in ACHN cells (Supplementary Figure
4). There was no significant effect on cell proliferation in CAKI-1 and 786-0 cell lines.
miR-192, miR-194 and miR-215 can target ZEB2, MDM2 and TYMS
To elucidate the mechanisms by which 192, miR-194 and miR-215 can affect
cellular processes involved in metastasis as cellular migration and invasion; we
performed target prediction analysis and identified a number of pathways and targets that
are known to be involved in tumor progression (Supplementary Table 3). It is worth
mentioning that targets of these three miRNAs are overlapping because of the high
degree of similarity in the seed sequence of the miRNAs. We selected three potential
targets; Murine double minute 2 (MDM2), Thymidylate Synthetase (TYMS), and Smad
Interacting protein 1/zinc finger E-box binding homeobox 2 (SIP1/ZEB2) for
experimental validation. These molecules are reported in the literature to contribute to
tumor progression and metastasis.
We experimentally validated the miRNA-target interactions using three
independent approaches. The first is by measuring the effect of miRNA overexpression
on mRNA and protein levels of the predicted target. The second approach was to measure
the effect of miRNA overexpression on a luciferase signal of a vector containing the
3’UTR of the predicted target. The third is to examine the presence of inverse correlation
between miRNA expression and the expression levels of their targets in vivo in patient
tissues.
Page 16 of 66Carcinogenesis
123456789101112131415161718192021222324252627282930313233343536373839404142434445464748495051525354555657585960
by guest on October 15, 2016
http://carcin.oxfordjournals.org/D
ownloaded from
For Peer Review
17
In the first approach, we examined the effect of overexpression of these three
miRNAs on the expression of the targets. We screened a number of kidney cancer cell
lines and identified three RCC cell line models (786-O, ACHN and CAKI-1) with high
endogenous expression levels of ZEB2, MDM2 and TYMS (Supplementary Figure 5).
We then compared the level of expression of these targets; at both the mRNA and protein
levels, before and after transfection of each of these miRNAs.
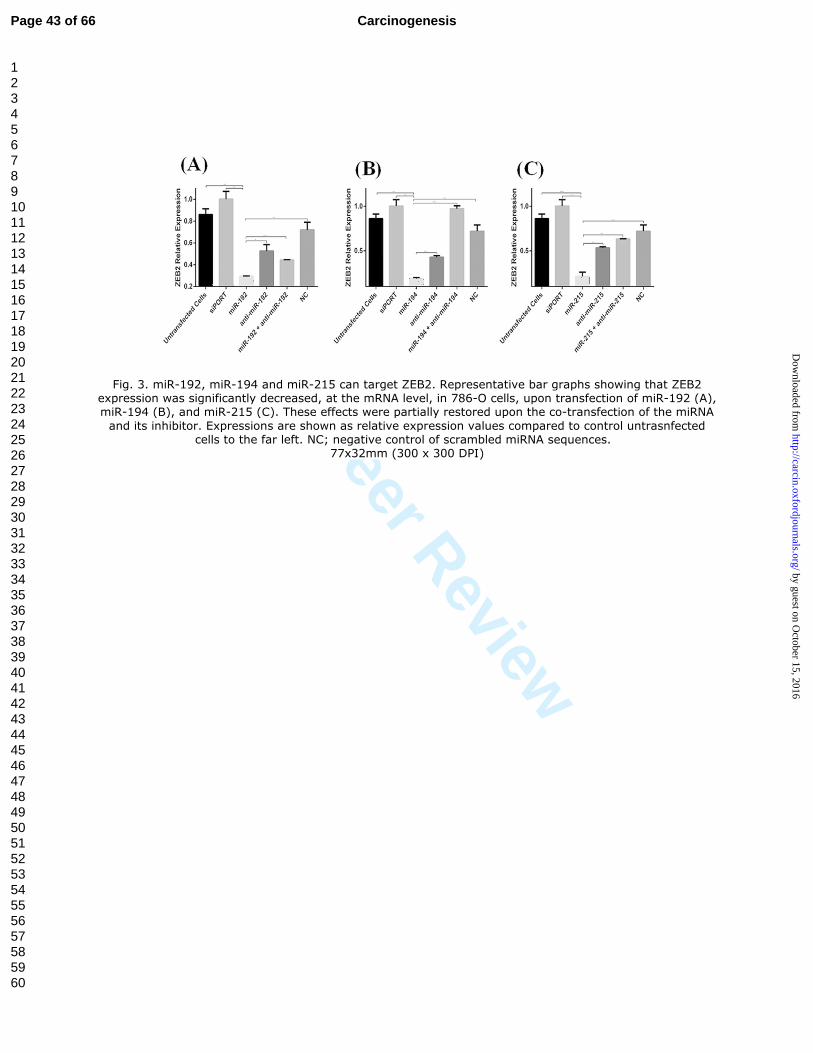
At the mRNA level, overexpression of each of miR-192, miR-194, and miR-215
significantly decrease ZEB2 expression in 786-O (Figure 3A-C), CAKI
(Supplementary Figure 6A) and ACHN cell lines (Supplementary Figure 6B)
compared to control cells. Co-transfection of these cells with the miRNAs and their
inhibitors was able to restore ZEB2 expression to almost normal levels.
We also validated miRNA-TYMS interactions in CAKI-1, 786-O and ACHN
cells. Overexpression of any of the three miRNAs resulted in significant reduction in
TYMS expression, at the mRNA level, in CAKI-1 (Supplementary Figure 7A-C), 786-
O (Supplementary Figure 7D) and ACHN cells (Supplementary Figure 7E). The
most significant drop in the level of TYMS was seen with miR-192. Transfection with
either miR-194 or miR-215 caused less reduction of TYMS levels, although still
statistically significant.
Similarly, MDM2 expression was significantly decreased after miR-192, miR-
194, or miR-215 overexpression in ACHN (Supplementary Figure 8A-C), CAKI-1 and
Page 17 of 66 Carcinogenesis
123456789101112131415161718192021222324252627282930313233343536373839404142434445464748495051525354555657585960
by guest on October 15, 2016
http://carcin.oxfordjournals.org/D
ownloaded from
For Peer Review
18
786-O cells (Supplementary Figure 8D-E). It should be noted, however, that the degree
of target suppression was variable among the different miRNAs in different cell lines.
This can be due to a number of factors including the number of recognition sites (miRNA
response elements) in each target and other cell-specific factors.
We also then examined the effects of miR-192, miR-194 and miR-215 on ZEB2,
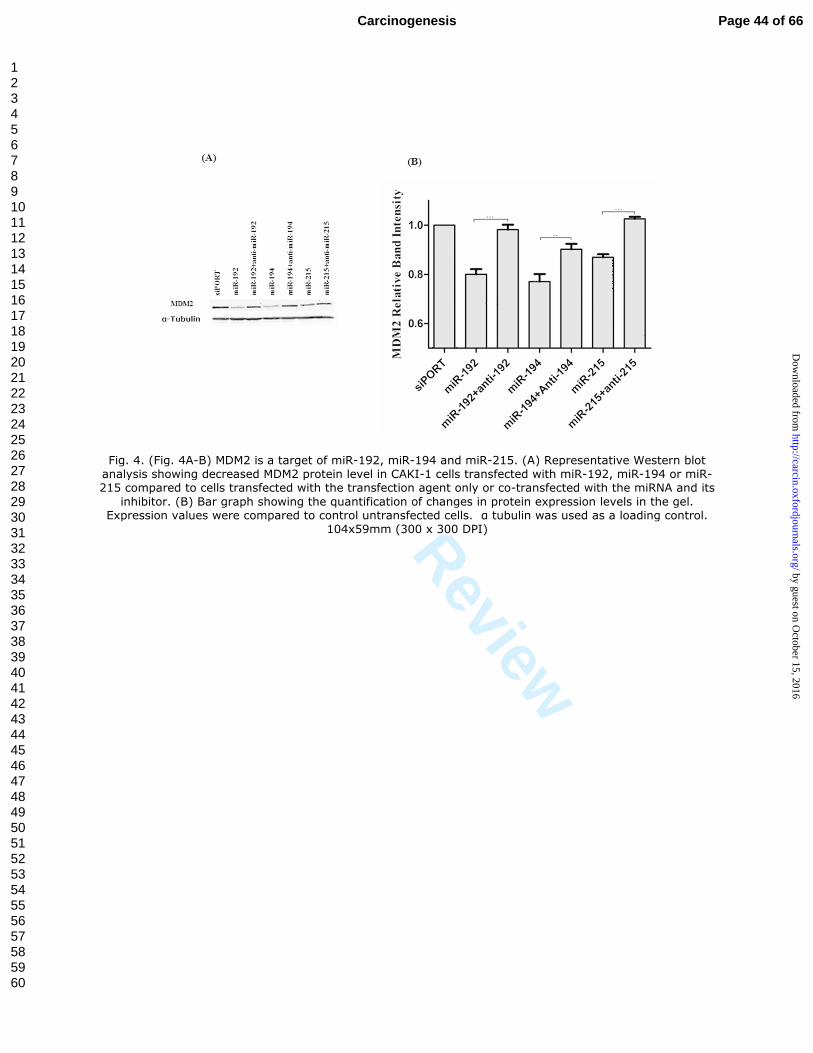
MDM2 and TYMS expression at the protein level. MDM2 protein expression was
significantly reduced when CAKI-1 cells were transfected with miR-192, miR-194, or
miR-215 (p < 0.0001, p = 0.0015 and p < 0.0001, respectively). This effect was largely
overcome when co-transfecting the cells with each of these miRNA and its inhibitor
(Figure 4A-B). The protein expression of TYMS was similarly significantly decreased in
cells transfected with miR-192, miR-194 or miR-215 compared to control cells (p =
0.0320, p = 0.0052, and p = 0.0070, respectively). Protein expression levels were
partially restored in cells co-transfected with the miRNA and its inhibitor
(Supplementary figure 9). Our results also show that overexpression of miR-192, miR-
194, or miR-215 significantly reduced ZEB2 protein expression in CAKI-1 cells
compared to control cells, and that expression levels can be partially restored when cells
are co-transfected with each of these miRNAs and its inhibitor (Supplementary Figure
10).
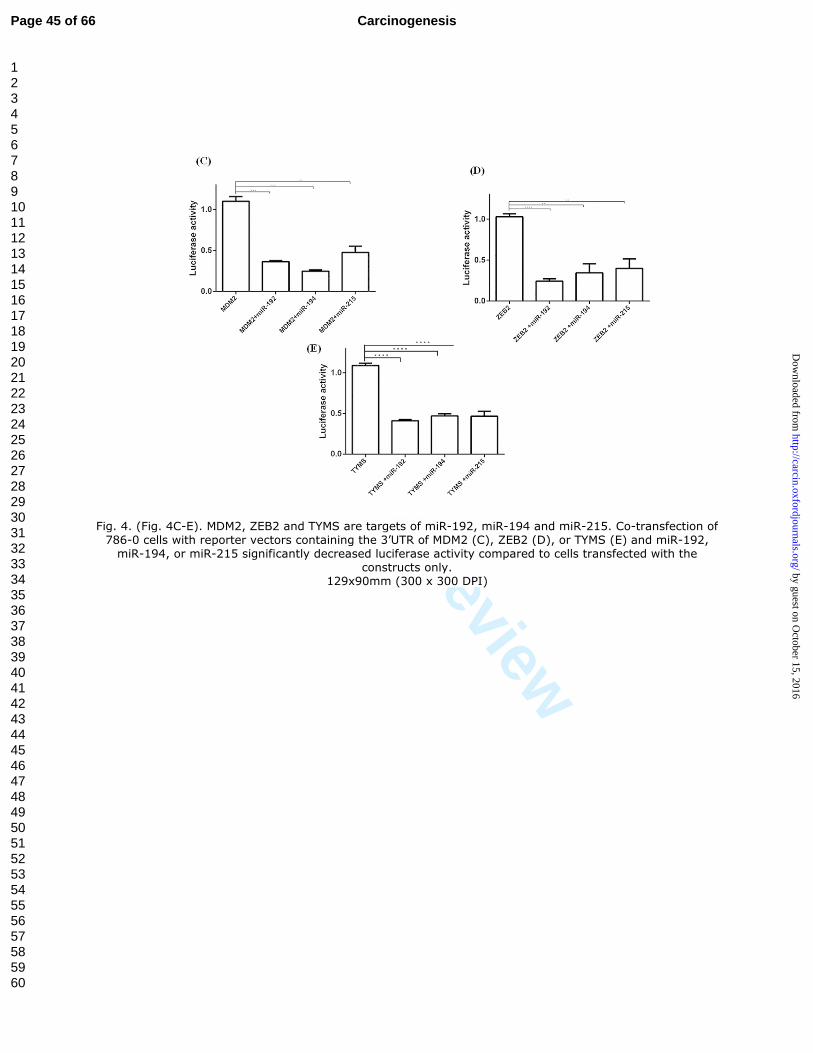
In the second approach, we further validated these miRNA-target interactions by
measuring the change of fluorescence signal of a luciferase vector containing the 3’UTR
of the target upon miRNA transfection. This system provides more evidence about a
Page 18 of 66Carcinogenesis
123456789101112131415161718192021222324252627282930313233343536373839404142434445464748495051525354555657585960
by guest on October 15, 2016
http://carcin.oxfordjournals.org/D
ownloaded from
For Peer Review
19
“direct” interaction between the miRNA and its target. The 786-0 cell line was
transfected with either the Luciferase reporter plasmids containing the 3’UTR of TYMS,
MDM2 or ZEB2, or co-transfected with the plasmids and the miRNA (miR-192, miR-
194, or miR-215). Luciferase activity decreased significantly in cells co-transfected with
plasmids of the target and the targeting miRNA, compared to cells transfected with target
plasmid only (Figure 4C-E).
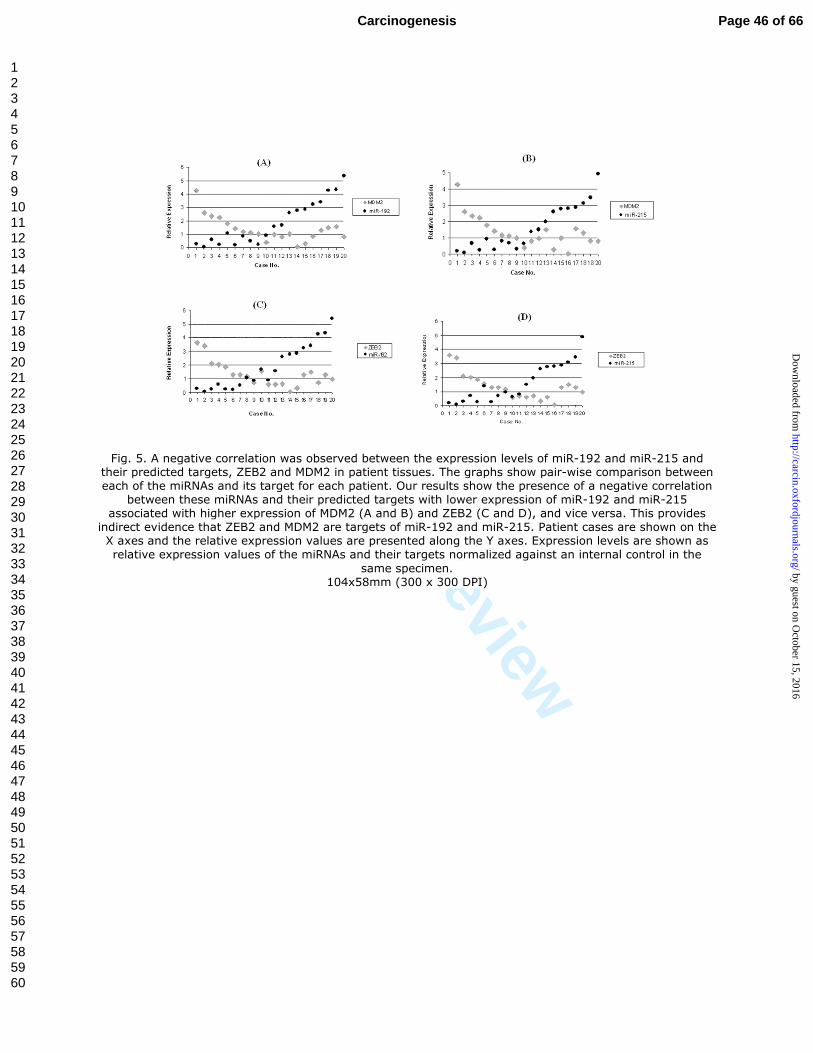
The third approach was to examine the presence of negative correlation between
miR-192, miR-194 and miR-215 and their predicted targets, MDM2, ZEB2 and TYMS
by qRT-PCR in vivo in patient tissues. We examined the expression levels of the three
miRNAs and their targets on 20 fresh frozen primary ccRCC tissues. As shown in Figure
5, we observed a negative correlation between these three miRNAs and their targets, with
lower expression levels of the miRNA associated with higher expression of its target in
the same patient, and vice versa. This provides indirect evidence that MDM2, ZEB2 and
TYMS are targets of miR-192, miR-194 and miR-215 in vivo.
An interesting observation was the high degree of overlap between targets of all
three miRNAs. This was predicted by target prediction algorithms and experimentally
validated. We further confirmed this overlap be performing sequence alignment of these
miRNAs and the 3'UTR of their predicted targets (MDM2, ZEB2 and TYMS) using the
European Molecular Biology Open Software Suite
(http://www.ebi.ac.uk/Tools/psa/emboss_needle/nucleotide.html). Interestingly, miR-192
and miR-215 not only shared the same seed sequence, but also their mature sequences are
Page 19 of 66 Carcinogenesis
123456789101112131415161718192021222324252627282930313233343536373839404142434445464748495051525354555657585960
by guest on October 15, 2016
http://carcin.oxfordjournals.org/D
ownloaded from
For Peer Review
20
almost identical. They only differ in two nucleotides (the 1st and the 20
th nucleotides). In
addition, miR-194 showed partial complementarity with both miRNAs (data not shown).
Also, all three miRNAs show partial complementarity with the 3’UTR of the three
targets. We further validated the target predictions using an independent algorithm (the
online microRNA prediction tool utilizing the PITA algorithm based on sequence
analysis, http://132.77.150.113/pubs/mir07/mir07_prediction.html), as a shown in
Supplementary Table 4.
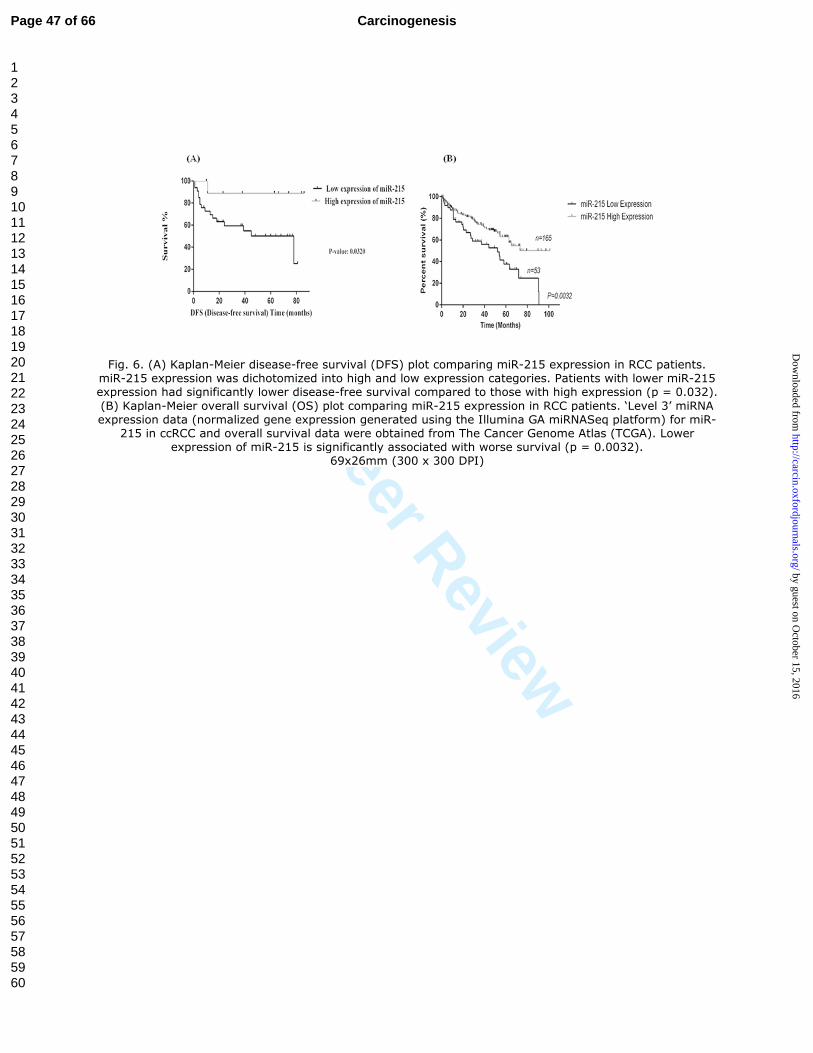
miR-215 as a prognostic marker for renal cell carcinoma
As miR-215 was significantly differentially expressed between primary and
metastatic ccRCC [17], we hypothesized that this miRNA can serve as a potential
prognostic marker. We examined the expression of miR-215 with the "gold standard"
qRT-PCR using miRNA-specific probes in 61 formalin-fixed paraffin-embedded tissues
of primary ccRCC. Kaplan-Meier survival curve (Figure 6A) showed that lower
expression of miR-215 was associated with significantly decreased disease-free survival
time (Patients with lower miR-215 expression = 26.4 months vs. patients with higher
miR-215 expression = 49.2 months, p=0.0320).
We further validated these data in silico on an independent dataset of 218 primary
ccRCC cases with available overall survival data from The Cancer Genome Atlas and
observed lower expression of miR-215 to be associated with significantly worse survival (
p = 0.0032) (Figure 6B).
Page 20 of 66Carcinogenesis
123456789101112131415161718192021222324252627282930313233343536373839404142434445464748495051525354555657585960
by guest on October 15, 2016
http://carcin.oxfordjournals.org/D
ownloaded from
For Peer Review
21
miR-192, miR-194 and miR-215 are conserved among species
We used the University of California Santa Cruise (UCSC) Genome Browser for
sequence comparison of miR-192, miR-194 and miR-215 among species. Our analysis
shows the high conservation of these three miRNAs among 28 species (Supplementary
Figure 11). Conservation among species indicates that these miRNAs may have vital
functions that are maintained during evolution.
Page 21 of 66 Carcinogenesis
123456789101112131415161718192021222324252627282930313233343536373839404142434445464748495051525354555657585960
by guest on October 15, 2016
http://carcin.oxfordjournals.org/D
ownloaded from
For Peer Review
22
Discussion
In our previous work, we identified a miRNA signature of metastatic ccRCC.
miR-192, miR-194 and miR-215 were significantly differentially expressed in metastatic,
compared to primary ccRCC. In the current study, we provide evidence that these three
miRNAs can be involved in RCC progression and that miR-215 is a potential prognostic
marker for ccRCC. We also identified and validated three of their target genes; ZEB2,
MDM2 and TYMS.
miR-192, miR-194 and miR-215 are highly enriched in the normal kidney [18],
indicating that they play a role in kidney development and differentiation. In our previous
work, we reported that these three miRNAs are significantly downregulated in primary
ccRCC compared to normal kidney tissue [27]. These three miRNAs are further
downregulated in metastatic ccRCC [17]. Taken together, this step-wise downregulation
indicates their involvement in controlling tumor-suppressor pathways. This is also
supported by the fact that these three miRNAs are present in two clusters. Members of
the same cluster are usually co-expressed and co-regulated. The miR-215 / miR-194-1
cluster is located within the common fragile site FRA1H (1q41~q42.1) which is deleted
in many cancers [28]. 1q41 was reported to be associated with breast and esophageal
cancer metastasis. The downregulation of these three miRNAs was also reported in other
cancers including nephroblastoma, myeloma, colon, and gastric cancers [20;21].
Our results show that the main effect of these three miRNAs is on tumor
migration and invasion. Little effect was shown on tumor proliferation, although this was
Page 22 of 66Carcinogenesis
123456789101112131415161718192021222324252627282930313233343536373839404142434445464748495051525354555657585960
by guest on October 15, 2016
http://carcin.oxfordjournals.org/D
ownloaded from
For Peer Review
23
not statistically significant. This is not unprecedented. Recent literature showing that the
key contribution of some of these miRNAs is on tumor invasion and migration abilities,
which are essential features for metastasis and EMT [29;30]. Moreover, our results
should be interpreted with caution as it might be cell or tissue type specific. Others have
also shown more significant effect on cell proliferation in other cell types”.
Our in silico analysis showed that miR-192, miR-194 and miR-215 can target
ZEB2, MDM2 and TYMS. MDM2 is a key inhibitor of p53. It activates HIF-1α and
VEGF activity (23). MDM2 overexpression is reported to be associated with metastasis
in many cancers. Its overexpression decreases E-cadherin levels with subsequent increase
in cell motility in breast carcinoma (24). It was also reported to increase cell motility and
invasiveness in RCC (25). TYMS is essential for DNA synthesis and its inhibition is
reported to block DNA replication and repair (26). TYMS SNP variations are associated
with increased risk of RCC (27). TYMS upregulation was reported in RCC and correlates
with tumor progression (28). It is also a target of the 5-fluorouracil (5-FU) used in
advanced RCC. It was also shown to have a prognostic significance in bladder cancer.
SIP1/ZEB2 represses E-cadherin and it was shown to be involved in epithelial to
mesenchymal transition (EMT) which is a key process in tumor progression. ZEB2 can
mediate the HIF-1 repression effect of E-cadherin in RCC.
We experimentally validated our in silico predictions using independent
approaches. These results, however, should be interpreted with caution, due to the
possibility of indirect targeting and off-target effects. The luciferase system can provide
Page 23 of 66 Carcinogenesis
123456789101112131415161718192021222324252627282930313233343536373839404142434445464748495051525354555657585960
by guest on October 15, 2016
http://carcin.oxfordjournals.org/D
ownloaded from
For Peer Review
24
more evidence of direct miRNA-target interactions. Finally, we provide in vivo evidence
by documenting the negative correlation between the expression of these three miRNAs
and these targets in ccRCC patients' tissues. Our findings are also consistent with recent
reports showing that miR-192 and miR-215 can target TYMS in colon cancer [31].
MDM2 is also a target of these miRNAs in myeloma [31].
Interestingly, these miRNAs occur in two clusters. Members of the same cluster
can have coordinated effects. They may target the same molecule (convergent targeting)
or may hit several molecules in the same or related biological pathways (divergent
targeting), as demonstrated in recent reports [32;33]. The remarkable target overlap can
be explained by the fact that miR-192 and miR-215 have similar seed sequence which is
highly important for miRNA target interaction. It should be also noted that 3’
supplementary sites can enhance the seed pairing. Pairing to the 3׳ region includes mainly
the nucleotides 13-16. Furthermore, this 3׳ pairing can also compensate for nucleotide
mismatch in the seed region [34]. miRNAs were reported to target not only the 3׳UTR
but also 5׳UTR, coding regions, promoters and gene termini. Our results are not
unprecedented; Senanayake et al identified ACVR2B to be a common target for miR-
192, miR-194 and miR-215 in renal childhood neoplasms [35].
The involvement of these miRNAs in tumor progression is not surprising and is
supported by previous reports. miR-192, miR-194 and miR-215 are induced by p53 and
also they were reported to be p53 positive regulators [20;21]. Kim et al. demonstrated
that p53 can regulate epithelial-mesenchymal transition through targeting ZEB2 by miR-
Page 24 of 66Carcinogenesis
123456789101112131415161718192021222324252627282930313233343536373839404142434445464748495051525354555657585960
by guest on October 15, 2016
http://carcin.oxfordjournals.org/D
ownloaded from
For Peer Review
25
192 family. Also, Krishnamachary et al. showed that E-cadherin repression by HIF-1 can
be mediated by ZEB2 in RCC [36]. Also, MDM2 overexpression correlates with tumor
progression and metastasis in different cancers, including RCC [37-41].
Our findings can also have therapeutic implications. TYMS is a target of the 5-FU
anticancer agents which is now being considered in combination therapies for advanced
RCC. Recently, using RCC xenograft model, 5-FU was shown to enhance the Sorafenib
and Sunitinib antitumor effect [42]. Recently, MDM2 is being investigated as a potential
new therapeutic target in colon cancer [43]. Also, Vastsyayan et al demonstrated that
MDM2 inhibitor (Nutlin-3) can enhance the effect of Sorafenib in RCC [44].
The fact that one miRNA can hit multiple targets attracted the attention to the
miRNAs as promising therapies in cancer. The different strategies for using miRNA
therapy were recently reviewed including miRNA replacement using adeno-associated
viral vectors and synthetic miRNA precursors in hepatocellular carcinoma and prostate
cancer respectively [45] . Also, targeting miRNAs using synthetic molecules can be of
therapeutic interest.
In conclusion, we showed that miR-192, miR-194 and miR-215 have tumor
suppressor effects on RCC by reducing the cellular migration and invasion abilities. We
identified potential mechanisms through which these three miRNAs can negatively affect
these biological processes by targeting key molecules involved in metastasis. These three
miRNAs can have hundreds of targets and a global analysis of the overall spectrum of
Page 25 of 66 Carcinogenesis
123456789101112131415161718192021222324252627282930313233343536373839404142434445464748495051525354555657585960
by guest on October 15, 2016
http://carcin.oxfordjournals.org/D
ownloaded from
For Peer Review
26
changes of miRNAs would be more suitable. However, due to limited resources we did a
targeted approach to select the targets that are of clinical significance that was shown in
other cancers. This however does not exclude the presence of other significant targets that
are yet to be identified and validated. This is a net effect of miRNAs and there might be a
number of underlined, direct and indirect, and sometimes being even opposing target
effects. Also, we demonstrated that miR-215 can be potential prognostic marker in RCC.
Our results can be a step forward towards developing a new therapeutic target in RCC.
Page 26 of 66Carcinogenesis
123456789101112131415161718192021222324252627282930313233343536373839404142434445464748495051525354555657585960
by guest on October 15, 2016
http://carcin.oxfordjournals.org/D
ownloaded from

For Peer Review
27
Supplementary Material
Supplementary figures 1, 2, 3, 4, 5, 6, 7, 8, 9, 10 & 11 and Supplementary tables 1, 2, 3 &
4 can be found at http://carcin.oxfordjournals.org/
Funding
This work was supported by grants from the Canadian Institute of Health Research
(CIHR grant # 119606), Canadian Cancer Society (CCS grant # 20185), and the Kidney
Foundation of Canada.
Conflict of Interest
The authors declared no conflict of interest
Page 27 of 66 Carcinogenesis
123456789101112131415161718192021222324252627282930313233343536373839404142434445464748495051525354555657585960
by guest on October 15, 2016
http://carcin.oxfordjournals.org/D
ownloaded from
For Peer Review
28
Reference List
1. Chow, W.H.et al., (2010) Epidemiology and risk factors for kidney cancer.
Nat.Rev.Urol., 7, 245-257.
2. Falebita, O.A.et al., (2009) Rising incidence of renal cell carcinoma in Ireland.
Int.Urol.Nephrol., 41, 7-12.
3. Chaffer, C.L.et al., (3-25-2011) A perspective on cancer cell metastasis. Science,
331, 1559-1564.
4. Zhang, R.et al., (2009) Small but influential: the role of microRNAs on gene
regulatory network and 3'UTR evolution. J.Genet.Genomics, 36, 1-6.
5. Sotiropoulou, G.et al., (2009) Emerging roles of microRNAs as molecular switches
in the integrated circuit of the cancer cell. RNA., 15, 1443-1461.
6. White, N.M.et al., (2011) Metastamirs: a stepping stone towards improved cancer
management. Nat.Rev.Clin.Oncol., 8, 75-84.
7. Jung, M.et al., (2009) MicroRNA profiling of clear cell renal cell cancer identifies a
robust signature to define renal malignancy. J.Cell Mol.Med., 13, 3918-3928.
8. White, N.M.et al., (2011) miRNA profiling for clear cell renal cell carcinoma:
biomarker discovery and identification of potential controls and consequences of
miRNA dysregulation. J.Urol., 186, 1077-1083.
9. Chow, T.F.et al., (2010) The miR-17-92 cluster is over expressed in and has an
oncogenic effect on renal cell carcinoma. J.Urol., 183, 743-751.
10. Lichner, Z.et al., (2012) Pleiotropic action of renal cell carcinoma-dysregulated
miRNAs on hypoxia-related signaling pathways. Am.J.Pathol., 180, 1675-1687.
11. Redova, M.et al., (2-11-2011) MicroRNAs and their target gene networks in renal
cell carcinoma. Biochem.Biophys.Res.Commun., 405, 153-156.
12. White, N.M.et al., (2010) MicroRNAs: exploring a new dimension in the
pathogenesis of kidney cancer. BMC.Med., 8, 65.
13. Metias, S.M.et al., (2009) MicroRNAs in clinical oncology: at the crossroads
between promises and problems. J.Clin.Pathol., 62, 771-776.
14. White, N.M.et al., (2011) Translating molecular signatures of renal cell carcinoma
into clinical practice. J.Urol., 186, 9-11.
Page 28 of 66Carcinogenesis
123456789101112131415161718192021222324252627282930313233343536373839404142434445464748495051525354555657585960
by guest on October 15, 2016
http://carcin.oxfordjournals.org/D
ownloaded from
For Peer Review
29
15. Heinzelmann, J.et al., (2011) Specific miRNA signatures are associated with
metastasis and poor prognosis in clear cell renal cell carcinoma. World J.Urol., 29,
367-373.
16. Khella, H.W.et al., (2012) Exploring the role of miRNAs in renal cell carcinoma
progression and metastasis through bioinformatic and experimental analyses.
Tumour.Biol., 33, 131-140.
17. White, N.M.et al., (11-22-2011) miRNA profiling in metastatic renal cell carcinoma
reveals a tumour-suppressor effect for miR-215. Br.J.Cancer, 105, 1741-1749.
18. Sun, Y.et al., (2004) Development of a micro-array to detect human and mouse
microRNAs and characterization of expression in human organs. Nucleic Acids
Res., 32, e188.
19. Saal, S.et al., (2009) MicroRNAs and the kidney: coming of age.
Curr.Opin.Nephrol.Hypertens., 18, 317-323.
20. Braun, C.J.et al., (12-15-2008) p53-Responsive micrornas 192 and 215 are capable
of inducing cell cycle arrest. Cancer Res., 68, 10094-10104.
21. Pichiorri, F.et al., (10-19-2010) Downregulation of p53-inducible microRNAs 192,
194, and 215 impairs the p53/MDM2 autoregulatory loop in multiple myeloma
development. Cancer Cell, 18, 367-381.
22. Dong, P.et al., (2011) MicroRNA-194 inhibits epithelial to mesenchymal transition
of endometrial cancer cells by targeting oncogene BMI-1. Mol.Cancer, 10, 99.
23. Wotschofsky, Z.et al., (10-15-2011) Reference genes for the relative quantification
of microRNAs in renal cell carcinomas and their metastases. Anal.Biochem., 417,
233-241.
24. White, N.M.et al., (4-13-2010) Three dysregulated miRNAs control kallikrein 10
expression and cell proliferation in ovarian cancer. Br.J.Cancer, 102, 1244-1253.
25. White, N.M.et al., (2010) Dysregulation of kallikrein-related peptidases in renal cell
carcinoma: potential targets of miRNAs. Biol.Chem., 391, 411-423.
26. Camp, R.L.et al., (11-1-2004) X-tile: a new bio-informatics tool for biomarker
assessment and outcome-based cut-point optimization. Clin.Cancer Res., 10, 7252-
7259.
27. White, N.M.et al., (2011) miRNA profiling for clear cell renal cell carcinoma:
biomarker discovery and identification of potential controls and consequences of
miRNA dysregulation. J.Urol., 186, 1077-1083.
Page 29 of 66 Carcinogenesis
123456789101112131415161718192021222324252627282930313233343536373839404142434445464748495051525354555657585960
by guest on October 15, 2016
http://carcin.oxfordjournals.org/D
ownloaded from
For Peer Review
30
28. Curatolo, A.et al., (2007) Molecular characterization of the human common fragile
site FRA1H. Genes Chromosomes.Cancer, 46, 487-493.
29. Le, X.F.et al., (2012) Modulation of MicroRNA-194 and cell migration by HER2-
targeting trastuzumab in breast cancer. PLoS.One., 7, e41170.
30. Meng, Z.et al., (2010) miR-194 is a marker of hepatic epithelial cells and
suppresses metastasis of liver cancer cells in mice. Hepatology, 52, 2148-2157.
31. Boni, V.et al., (2010) miR-192/miR-215 influence 5-fluorouracil resistance through
cell cycle-mediated mechanisms complementary to its post-transcriptional
thymidilate synthase regulation. Mol.Cancer Ther., 9, 2265-2275.
32. Wang, J.et al., (2011) Regulatory coordination of clustered microRNAs based on
microRNA-transcription factor regulatory network. BMC.Syst.Biol., 5, 199.
33. Yuan, X.et al., (2009) Clustered microRNAs' coordination in regulating protein-
protein interaction network. BMC.Syst.Biol., 3, 65.
34. Bartel, D.P.et al., (1-23-2009) MicroRNAs: target recognition and regulatory
functions. Cell, 136, 215-233.
35. Senanayake, U.et al., (2012) miR-192, miR-194, miR-215, miR-200c and miR-141
are downregulated and their common target ACVR2B is strongly expressed in renal
childhood neoplasms. Carcinogenesis, 33, 1014-1021.
36. Krishnamachary, B.et al., (3-1-2006) Hypoxia-inducible factor-1-dependent
repression of E-cadherin in von Hippel-Lindau tumor suppressor-null renal cell
carcinoma mediated by TCF3, ZFHX1A, and ZFHX1B. Cancer Res., 66, 2725-
2731.
37. Bahnassy, A.A.et al., (2012) Aberrant expression of cell cycle regulatory genes
predicts overall and disease free survival in malignant pleural mesothelioma
patients. Exp.Mol.Pathol., 93, 154-161.
38. Haitel, A.et al., (2000) mdm2 expression as a prognostic indicator in clear cell renal
cell carcinoma: comparison with p53 overexpression and clinicopathological
parameters. Clin.Cancer Res., 6, 1840-1844.
39. Hirata, H.et al., (7-15-2007) MDM2 SNP309 polymorphism as risk factor for
susceptibility and poor prognosis in renal cell carcinoma. Clin.Cancer Res., 13,
4123-4129.
40. Noon, A.P.et al., (2-15-2010) p53 and MDM2 in renal cell carcinoma: biomarkers
for disease progression and future therapeutic targets?. Cancer, 116, 780-790.
Page 30 of 66Carcinogenesis
123456789101112131415161718192021222324252627282930313233343536373839404142434445464748495051525354555657585960
by guest on October 15, 2016
http://carcin.oxfordjournals.org/D
ownloaded from
For Peer Review
31
41. Noon, A.P.et al., (2012) Combined p53 and MDM2 biomarker analysis shows a
unique pattern of expression associated with poor prognosis in patients with renal
cell carcinoma undergoing radical nephrectomy. BJU.Int., 109, 1250-1257.
42. Miyake, M.et al., (2012) 5-fluorouracil enhances the antitumor effect of sorafenib
and sunitinib in a xenograft model of human renal cell carcinoma. Oncol.Lett., 3,
1195-1202.
43. Hav, M.et al., (2011) MDM2 gene amplification and protein expressions in colon
carcinoma: is targeting MDM2 a new therapeutic option?. Virchows Arch., 458,
197-203.
44. Vatsyayan, R.et al., (10-17-2011) Nutlin-3 enhances sorafenib efficacy in renal cell
carcinoma. Mol.Carcinog..
45. Gandellini, P.et al., (2011) MicroRNAs as new therapeutic targets and tools in
cancer. Expert.Opin.Ther.Targets., 15, 265-279.
Page 31 of 66 Carcinogenesis
123456789101112131415161718192021222324252627282930313233343536373839404142434445464748495051525354555657585960
by guest on October 15, 2016
http://carcin.oxfordjournals.org/D
ownloaded from
For Peer Review
32
Figure Legends
Fig. 1. Overexpression of miR-192, miR-194, or miR-215 has negative effect on
cellular migration. (A) Representative photomicrographs showing the effect of miR-192
expression on the migration rate of the 786-O RCC cell line. The top row shows the cells
at the time of wounding (0 h), and the bottom row shows cellular migration after 9 hours.
Overexpression of miR-192 led to significant reduction in the rate of cell migration, with
incomplete wound closure after 9h, compared to controls. This was restored when co-
transfecting miR-192 and its inhibitor. (B) Representative bar graph showing the effect of
miR-192 on cell migration. Comparable results were obtained for miR-194 (C), and miR-
215 (D).
Fig. 2. miR-192, miR-194 and miR-215 have negative effect on cellular invasion. (A)
Representative photomicrographs showing the effect of miR-194 on cell migration in
786-O RCC cell line by comparing the number of cells invaded through the matrigel
inserts to the number of cells invaded through the control inserts. Control inserts are
shown in the top panel and matrigel inserts in the lower panel. miR-194 transfection
resulted in significant reduction of cell invasion ability compared to untransfected cells
and cells transfected with transfection agent only, scrambled miRNA (negative control),
and anti-miR-194. Partial restoration of cell invasion was obtained when co-transfection
with miR-194 and its inhibitor. (B) A representative bar graph showing the effect of miR-
194 on cell invasion. Comparable results were obtained for miR-192 (C) and miR-215
(D).
Page 32 of 66Carcinogenesis
123456789101112131415161718192021222324252627282930313233343536373839404142434445464748495051525354555657585960
by guest on October 15, 2016
http://carcin.oxfordjournals.org/D
ownloaded from
For Peer Review
33
Fig. 3. miR-192, miR-194 and miR-215 can target ZEB2. Representative bar graphs
showing that ZEB2 expression was significantly decreased, at the mRNA level, in 786-O
cells, upon transfection of miR-192 (A), miR-194 (B), and miR-215 (C). These effects
were partially restored upon the co-transfection of the miRNA and its inhibitor.
Expressions are shown as relative expression values compared to control untrasnfected
cells to the far left. NC; negative control of scrambled miRNA sequences.
Fig. 4. (Fig. 4A-B) MDM2 is a target of miR-192, miR-194 and miR-215. (A)
Representative Western blot analysis showing decreased MDM2 protein level in CAKI-1
cells transfected with miR-192, miR-194 or miR-215 compared to cells transfected with
the transfection agent only or co-transfected with the miRNA and its inhibitor. (B) Bar
graph showing the quantification of changes in protein expression levels in the gel.
Expression values were compared to control untransfected cells. α tubulin was used as a
loading control. (Fig. 4C-E). MDM2, ZEB2 and TYMS are targets of miR-192, miR-
194 and miR-215. Co-transfection of 786-0 cells with reporter vectors containing the
3’UTR of MDM2 (C), ZEB2 (D), or TYMS (E) and miR-192, miR-194, or miR-215
significantly decreased luciferase activity compared to cells transfected with the
constructs only.
Fig. 5. A negative correlation was observed between the expression levels of miR-192
and miR-215 and their predicted targets, ZEB2 and MDM2 in patient tissues. The
graphs show pair-wise comparison between each of the miRNAs and its target for each
patient. Our results show the presence of a negative correlation between these miRNAs
Page 33 of 66 Carcinogenesis
123456789101112131415161718192021222324252627282930313233343536373839404142434445464748495051525354555657585960
by guest on October 15, 2016
http://carcin.oxfordjournals.org/D
ownloaded from
For Peer Review
34
and their predicted targets with lower expression of miR-192 and miR-215 associated
with higher expression of MDM2 (A and B) and ZEB2 (C and D), and vice versa. This
provides indirect evidence that ZEB2 and MDM2 are targets of miR-192 and miR-215.
Patient cases are shown on the X axes and the relative expression values are presented
along the Y axes. Expression levels are shown as relative expression values of the
miRNAs and their targets normalized against an internal control in the same specimen.
Fig. 6. (A) Kaplan-Meier disease-free survival (DFS) plot comparing miR-215
expression in RCC patients. miR-215 expression was dichotomized into high and low
expression categories. Patients with lower miR-215 expression had significantly lower
disease-free survival compared to those with high expression (p = 0.032). (B) Kaplan-
Meier overall survival (OS) plot comparing miR-215 expression in RCC patients.
‘Level 3’ miRNA expression data (normalized gene expression generated using the
Illumina GA miRNASeq platform) for miR-215 in ccRCC and overall survival data were
obtained from The Cancer Genome Atlas (TCGA). Lower expression of miR-215 is
significantly associated with worse survival (p = 0.0032).
Supplementary Fig. 1. The 786-O, ACHN and CAKI-1 kidney cancer cell lines have
low endogenous expression levels of miR-192, miR-194 and miR-215. The expression
levels of miR-192, miR-194 and miR-215 in 786-O, ACHN and CAKI-1 RCC cell lines
were measured by qRT-PCR. Expression values are shown as relative expression
compared to a pool of patient primary ccRCC tumor tissues. All three cell lines have very
low endogenous expression levels of miR-192, miR-194 and miR-215.
Page 34 of 66Carcinogenesis
123456789101112131415161718192021222324252627282930313233343536373839404142434445464748495051525354555657585960
by guest on October 15, 2016
http://carcin.oxfordjournals.org/D
ownloaded from
For Peer Review
35
Supplementary Fig. 2. Confirmation of successful transfection of miR-194 in CAKI-
1 cells. A time-course experiment showing a significant increase in miR-194 expression
(measured by qRT-PCR) after transfection. Higher expression levels were maintained for
3 days.
Supplementary Fig. 3. miR-192, miR-194 and miR-215 have negative effect on
cellular invasion. A representative bar graph showing the effect of these three miRNAs
in the ACHN cells. Cells transfected with either of miR-192, miR-194, or miR-215
showed significantly decreased cellular invasion compared to the control cells. This
effect was partially restored by co-transfection of the miRNA and its inhibitor.
Supplementary Fig. 4. miR-192, miR-194 and miR-215 overexpression have
insignificant effect on cellular proliferation. ACHN cells were transfected with miR-
192, miR-194, or miR-215. This resulted in a slight insignificant reduction in the rate of
cell proliferation, compared to controls.
Supplementary Fig. 5. 786-O, ACHN and CAKI-1 cells have high endogenous
expression levels of MDM2, ZEB2 and TYMS. The endogenous expression levels of
MDM2, ZEB2 and TYMS in 786-O, ACHN and CAKI-1 RCC cell lines was measured
using qRT-PCR. All three cell lines have high endogenous expression levels of MDM2,
ZEB2 and TYMS. Expression is shown as arbitrary units normalized against endogenous
control. P = a pool of primary ccRCC tissues; M = pool of metastatic ccRCC tissues
Page 35 of 66 Carcinogenesis
123456789101112131415161718192021222324252627282930313233343536373839404142434445464748495051525354555657585960
by guest on October 15, 2016
http://carcin.oxfordjournals.org/D
ownloaded from
For Peer Review
36
Supplementary Fig. 6. miR-192, miR-194 and miR-215 can target ZEB2. (A)
Representative bar graphs showing that ZEB2 expression was significantly decreased, at
the mRNA level, in CAKI-1 cells, upon transfection of miR-194. (B) A representative
graph showing the ability of miR-192 overexpression to reduce ZEB2 expression in
ACHN kidney cancer cells. These effects were partially restored upon the co-transfection
of the miRNA and its inhibitor. Expressions are shown as relative expression values
compared to control untrasnfected cells to the far left. NC; negative control of scrambled
miRNA sequences.
Supplementary Fig. 7. miR-192, miR-194 and miR-215 can target TYMS at the
mRNA level. (A-C) Representative graphs showing that TYMS expression was
decreased in CAKI-1 cells upon overexpression of each of these miRNAs. (D) A
representative graph showing a significant reduction of TYMS in 786-O cells upon miR-
194 overexpression. (E) A representative graph in ACHN kidney cancer cells showing
the ability of miR-192 to significantly reduce TYMS mRNA expression. These effects
were partially restored upon the con-transfection of the miRNA and its inhibitor.
Expressions are shown as relative expression values compared to control cells to the far
left. NC; negative control of scrambled miRNA sequences.
Supplementary Fig. 8. miR-192, miR-194 and miR-215 can target MDM2 at the
mRNA level. (A-C) MDM2 expression was decreased in ACHN cells upon
Page 36 of 66Carcinogenesis
123456789101112131415161718192021222324252627282930313233343536373839404142434445464748495051525354555657585960
by guest on October 15, 2016
http://carcin.oxfordjournals.org/D
ownloaded from
For Peer Review
37
overexpression of each of the three miRNAs. (D) A representative graph in CAKI-1 cells
showing the ability of miR-194 to reduce MDM2 expression. (E) A representative graph
in 786-O cells showing that miR-215 overexpression resulted in significant reduction of
MDM2 expression. Expressions are shown as relative expression values compared to
control cells to the far left.
Supplementary Fig. 9. TYMS is a target of miR-192, miR-194 and miR-215. (A)
Representative Western blot analysis showing decreased TYMS protein level in CAKI-1
cells transfected with miR-192, miR-194 or miR-215 compared to cells transfected with
the transfection agent only or co-transfected with the corresponding miRNA and its
inhibitor. (B) Bar graph showing the quantification of changes in protein expression
levels in the gel. Expression values were compared to control untransfected cells.
Supplementary Fig. 10. ZEB2 is a target of miR-192, miR-194 and miR-215. (A)
Representative Western blot analysis showing decreased ZEB2 protein level in CAKI-1
cells transfected with miR-192, miR-194 or miR-215 compared to cells transfected with
the transfection agent only. Proteins levels were partially restored when co-transfecting
the cells with the miRNA and its inhibitor. (B) Bar graph showing the quantification of
changes in protein expression levels in the gel. Expression values were compared to
control untransfected cells.
Page 37 of 66 Carcinogenesis
123456789101112131415161718192021222324252627282930313233343536373839404142434445464748495051525354555657585960
by guest on October 15, 2016
http://carcin.oxfordjournals.org/D
ownloaded from

For Peer Review
38
Supplementary Fig. 11 (A-B). miR-192, miR-194 and miR-215 are highly conserved
among different species. Data were analyzed according to the University of California
Santa Cruz Human Genome browser.
Page 38 of 66Carcinogenesis
123456789101112131415161718192021222324252627282930313233343536373839404142434445464748495051525354555657585960
by guest on October 15, 2016
http://carcin.oxfordjournals.org/D
ownloaded from
For Peer Review
Fig. 1. Overexpression of miR-192, miR-194, or miR-215 has negative effect on cellular migration. (A) Representative photomicrographs showing the effect of miR-192 expression on the migration rate of the 786-O RCC cell line. The top row shows the cells at the time of wounding (0 h), and the bottom row shows
cellular migration after 9 hours. Overexpression of miR-192 led to significant reduction in the rate of cell migration, with incomplete wound closure after 9h, compared to controls. This was restored when co-
transfecting miR-192 and its inhibitor. 182x76mm (300 x 300 DPI)
Page 39 of 66 Carcinogenesis
123456789101112131415161718192021222324252627282930313233343536373839404142434445464748495051525354555657585960
by guest on October 15, 2016
http://carcin.oxfordjournals.org/D
ownloaded from
For Peer Review
Fig. 1. Overexpression of miR-192, miR-194, or miR-215 has negative effect on cellular migration.(B) Representative bar graph showing the effect of miR-192 on cell migration. Comparable results were
obtained for miR-194 (C), and miR-215 (D).
65x22mm (300 x 300 DPI)
Page 40 of 66Carcinogenesis
123456789101112131415161718192021222324252627282930313233343536373839404142434445464748495051525354555657585960
by guest on October 15, 2016
http://carcin.oxfordjournals.org/D
ownloaded from
For Peer Review
Fig. 2. miR-192, miR-194 and miR-215 have negative effect on cellular invasion. (A) Representative photomicrographs showing the effect of miR-194 on cell migration in 786-O RCC cell line by comparing the number of cells invaded through the matrigel inserts to the number of cells invaded through the control
inserts. Control inserts are shown in the top panel and matrigel inserts in the lower panel. miR-194 transfection resulted in significant reduction of cell invasion ability compared to untransfected cells and cells transfected with transfection agent only, scrambled miRNA (negative control), and anti-miR-194. Partial
restoration of cell invasion was obtained when co-transfection with miR-194 and its inhibitor. 182x78mm (300 x 300 DPI)
Page 41 of 66 Carcinogenesis
123456789101112131415161718192021222324252627282930313233343536373839404142434445464748495051525354555657585960
by guest on October 15, 2016
http://carcin.oxfordjournals.org/D
ownloaded from
For Peer Review
Fig. 2. miR-192, miR-194 and miR-215 have negative effect on cellular invasion. (B) A representative bar graph showing the effect of miR-194 on cell invasion. Comparable results were obtained for miR-192 (C)
and miR-215 (D).
65x22mm (300 x 300 DPI)
Page 42 of 66Carcinogenesis
123456789101112131415161718192021222324252627282930313233343536373839404142434445464748495051525354555657585960
by guest on October 15, 2016
http://carcin.oxfordjournals.org/D
ownloaded from
For Peer Review
Fig. 3. miR-192, miR-194 and miR-215 can target ZEB2. Representative bar graphs showing that ZEB2 expression was significantly decreased, at the mRNA level, in 786-O cells, upon transfection of miR-192 (A), miR-194 (B), and miR-215 (C). These effects were partially restored upon the co-transfection of the miRNA
and its inhibitor. Expressions are shown as relative expression values compared to control untrasnfected cells to the far left. NC; negative control of scrambled miRNA sequences.
77x32mm (300 x 300 DPI)
Page 43 of 66 Carcinogenesis
123456789101112131415161718192021222324252627282930313233343536373839404142434445464748495051525354555657585960
by guest on October 15, 2016
http://carcin.oxfordjournals.org/D
ownloaded from
For Peer Review
Fig. 4. (Fig. 4A-B) MDM2 is a target of miR-192, miR-194 and miR-215. (A) Representative Western blot analysis showing decreased MDM2 protein level in CAKI-1 cells transfected with miR-192, miR-194 or miR-215 compared to cells transfected with the transfection agent only or co-transfected with the miRNA and its
inhibitor. (B) Bar graph showing the quantification of changes in protein expression levels in the gel. Expression values were compared to control untransfected cells. α tubulin was used as a loading control.
104x59mm (300 x 300 DPI)
Page 44 of 66Carcinogenesis
123456789101112131415161718192021222324252627282930313233343536373839404142434445464748495051525354555657585960
by guest on October 15, 2016
http://carcin.oxfordjournals.org/D
ownloaded from
For Peer Review
Fig. 4. (Fig. 4C-E). MDM2, ZEB2 and TYMS are targets of miR-192, miR-194 and miR-215. Co-transfection of 786-0 cells with reporter vectors containing the 3’UTR of MDM2 (C), ZEB2 (D), or TYMS (E) and miR-192, miR-194, or miR-215 significantly decreased luciferase activity compared to cells transfected with the
constructs only. 129x90mm (300 x 300 DPI)
Page 45 of 66 Carcinogenesis
123456789101112131415161718192021222324252627282930313233343536373839404142434445464748495051525354555657585960
by guest on October 15, 2016
http://carcin.oxfordjournals.org/D
ownloaded from
For Peer Review
Fig. 5. A negative correlation was observed between the expression levels of miR-192 and miR-215 and their predicted targets, ZEB2 and MDM2 in patient tissues. The graphs show pair-wise comparison between each of the miRNAs and its target for each patient. Our results show the presence of a negative correlation
between these miRNAs and their predicted targets with lower expression of miR-192 and miR-215 associated with higher expression of MDM2 (A and B) and ZEB2 (C and D), and vice versa. This provides
indirect evidence that ZEB2 and MDM2 are targets of miR-192 and miR-215. Patient cases are shown on the X axes and the relative expression values are presented along the Y axes. Expression levels are shown as relative expression values of the miRNAs and their targets normalized against an internal control in the
same specimen. 104x58mm (300 x 300 DPI)
Page 46 of 66Carcinogenesis
123456789101112131415161718192021222324252627282930313233343536373839404142434445464748495051525354555657585960
by guest on October 15, 2016
http://carcin.oxfordjournals.org/D
ownloaded from
For Peer Review
Fig. 6. (A) Kaplan-Meier disease-free survival (DFS) plot comparing miR-215 expression in RCC patients. miR-215 expression was dichotomized into high and low expression categories. Patients with lower miR-215 expression had significantly lower disease-free survival compared to those with high expression (p = 0.032).
(B) Kaplan-Meier overall survival (OS) plot comparing miR-215 expression in RCC patients. ‘Level 3’ miRNA expression data (normalized gene expression generated using the Illumina GA miRNASeq platform) for miR-
215 in ccRCC and overall survival data were obtained from The Cancer Genome Atlas (TCGA). Lower expression of miR-215 is significantly associated with worse survival (p = 0.0032).
69x26mm (300 x 300 DPI)
Page 47 of 66 Carcinogenesis
123456789101112131415161718192021222324252627282930313233343536373839404142434445464748495051525354555657585960
by guest on October 15, 2016
http://carcin.oxfordjournals.org/D
ownloaded from
For Peer Review
Supplementary Fig. 1. The 786-O, ACHN and CAKI-1 kidney cancer cell lines have low endogenous expression levels of miR-192, miR-194 and miR-215. The expression levels of miR-192, miR-194 and miR-215 in 786-O, ACHN and CAKI-1 RCC cell lines were measured by qRT-PCR. Expression values are shown as
relative expression compared to a pool of patient primary ccRCC tumor tissues. All three cell lines have very low endogenous expression levels of miR-192, miR-194 and miR-215.
106x61mm (300 x 300 DPI)
Page 48 of 66Carcinogenesis
123456789101112131415161718192021222324252627282930313233343536373839404142434445464748495051525354555657585960
by guest on October 15, 2016
http://carcin.oxfordjournals.org/D
ownloaded from
For Peer Review
Supplementary Fig. 2. Confirmation of successful transfection of miR-194 in CAKI-1 cells. A time-course experiment showing a significant increase in miR-194 expression (measured by qRT-PCR) after transfection.
Higher expression levels were maintained for 3 days.
156x132mm (300 x 300 DPI)
Page 49 of 66 Carcinogenesis
123456789101112131415161718192021222324252627282930313233343536373839404142434445464748495051525354555657585960
by guest on October 15, 2016
http://carcin.oxfordjournals.org/D
ownloaded from
For Peer Review
Supplementary Fig. 3. miR-192, miR-194 and miR-215 have negative effect on cellular invasion. A representative bar graph showing the effect of these three miRNAs in the ACHN cells. Cells transfected with either of miR-192, miR-194, or miR-215 showed significantly decreased cellular invasion compared to the
control cells. This effect was partially restored by co-transfection of the miRNA and its inhibitor. 165x150mm (300 x 300 DPI)
Page 50 of 66Carcinogenesis
123456789101112131415161718192021222324252627282930313233343536373839404142434445464748495051525354555657585960
by guest on October 15, 2016
http://carcin.oxfordjournals.org/D
ownloaded from
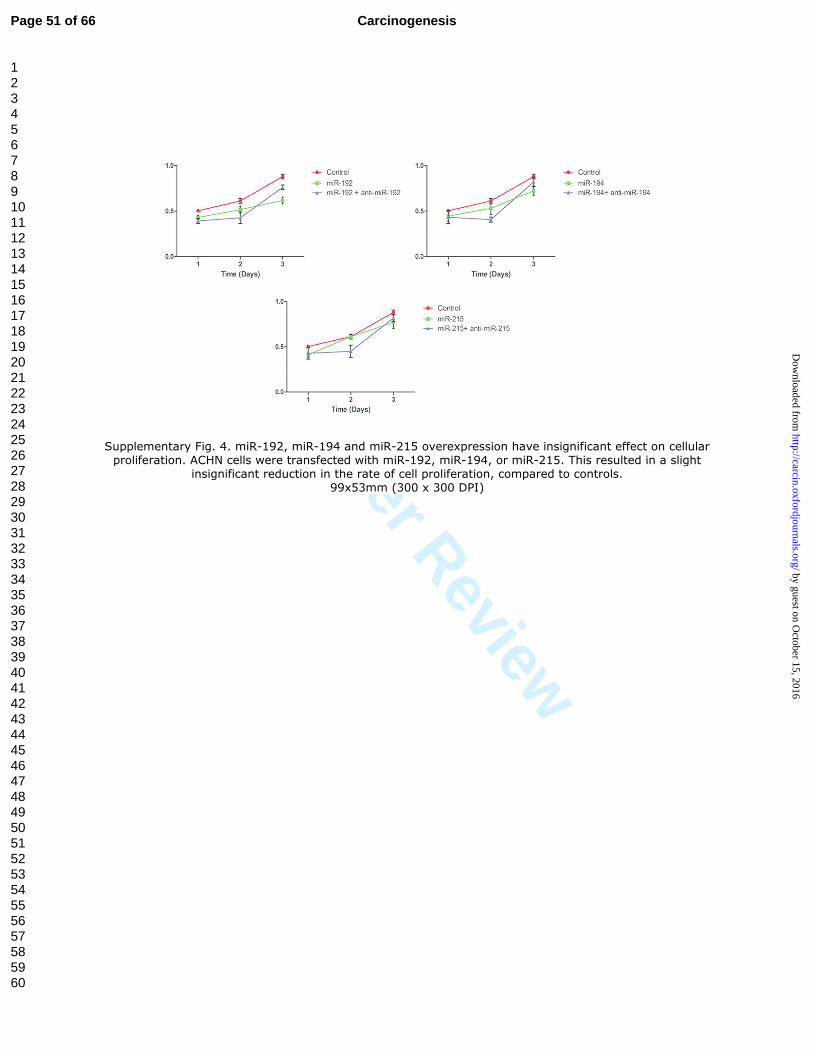
For Peer Review
Supplementary Fig. 4. miR-192, miR-194 and miR-215 overexpression have insignificant effect on cellular proliferation. ACHN cells were transfected with miR-192, miR-194, or miR-215. This resulted in a slight
insignificant reduction in the rate of cell proliferation, compared to controls. 99x53mm (300 x 300 DPI)
Page 51 of 66 Carcinogenesis
123456789101112131415161718192021222324252627282930313233343536373839404142434445464748495051525354555657585960
by guest on October 15, 2016
http://carcin.oxfordjournals.org/D
ownloaded from
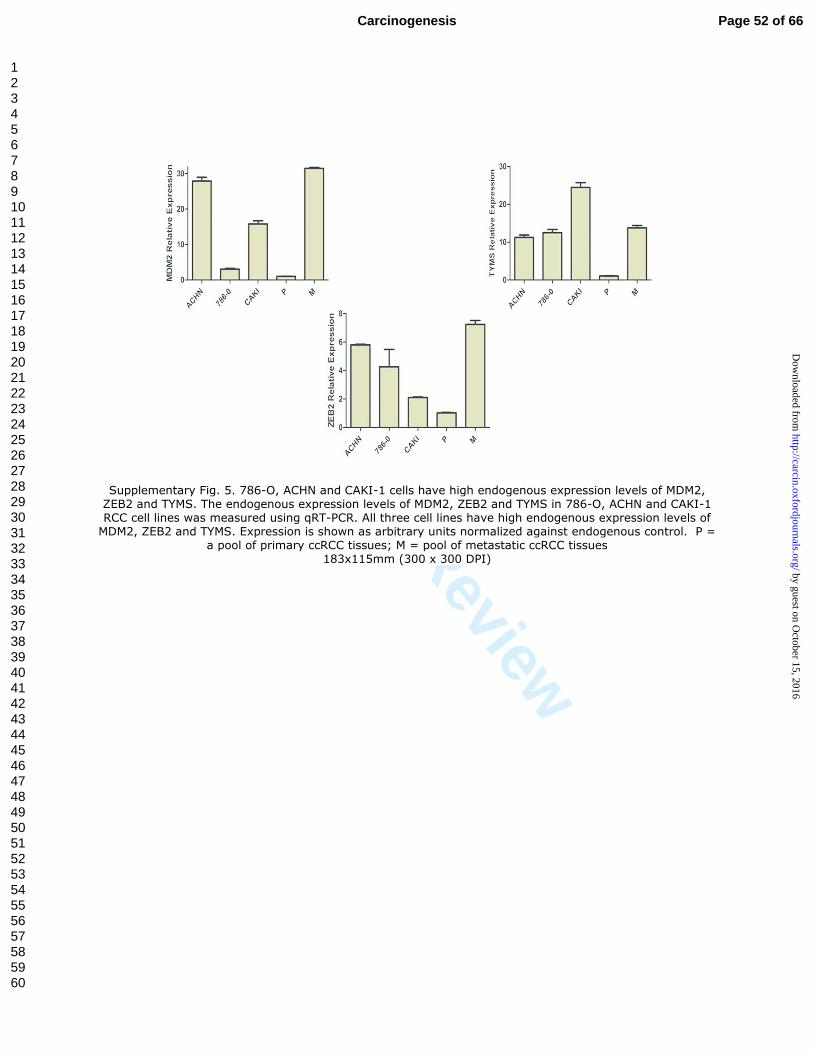
For Peer Review
Supplementary Fig. 5. 786-O, ACHN and CAKI-1 cells have high endogenous expression levels of MDM2, ZEB2 and TYMS. The endogenous expression levels of MDM2, ZEB2 and TYMS in 786-O, ACHN and CAKI-1 RCC cell lines was measured using qRT-PCR. All three cell lines have high endogenous expression levels of MDM2, ZEB2 and TYMS. Expression is shown as arbitrary units normalized against endogenous control. P =
a pool of primary ccRCC tissues; M = pool of metastatic ccRCC tissues 183x115mm (300 x 300 DPI)
Page 52 of 66Carcinogenesis
123456789101112131415161718192021222324252627282930313233343536373839404142434445464748495051525354555657585960
by guest on October 15, 2016
http://carcin.oxfordjournals.org/D
ownloaded from
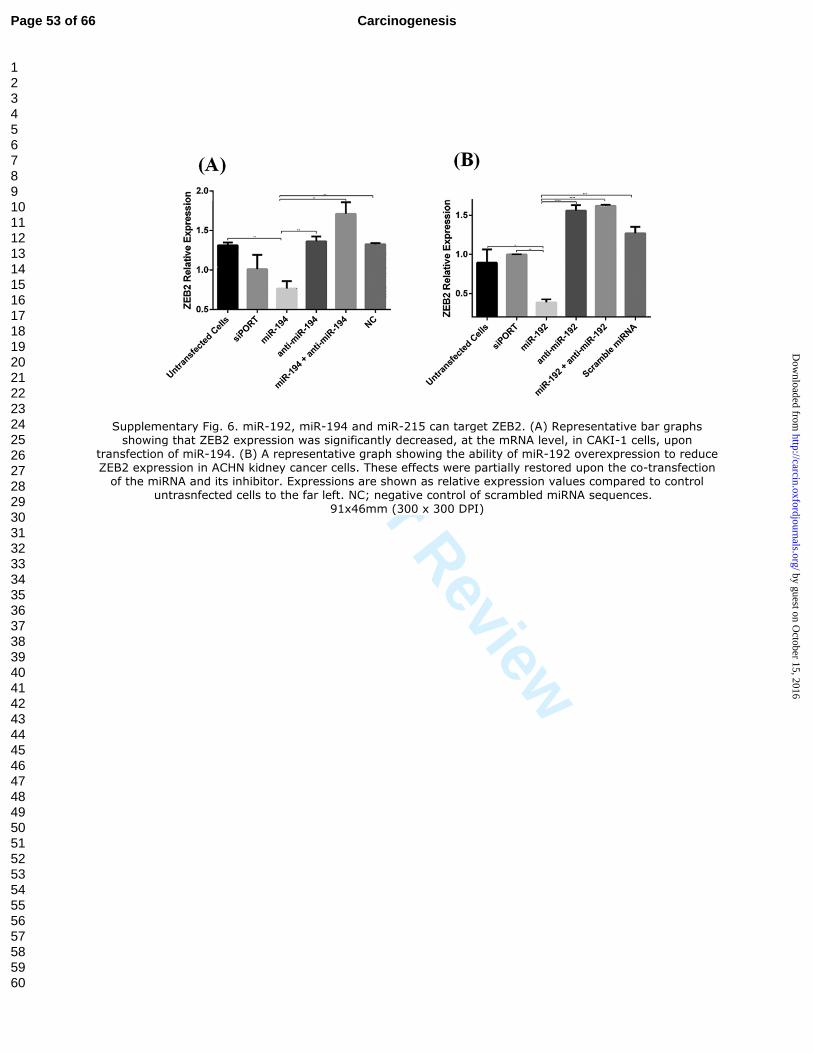
For Peer Review
Supplementary Fig. 6. miR-192, miR-194 and miR-215 can target ZEB2. (A) Representative bar graphs showing that ZEB2 expression was significantly decreased, at the mRNA level, in CAKI-1 cells, upon
transfection of miR-194. (B) A representative graph showing the ability of miR-192 overexpression to reduce ZEB2 expression in ACHN kidney cancer cells. These effects were partially restored upon the co-transfection of the miRNA and its inhibitor. Expressions are shown as relative expression values compared to control
untrasnfected cells to the far left. NC; negative control of scrambled miRNA sequences. 91x46mm (300 x 300 DPI)
Page 53 of 66 Carcinogenesis
123456789101112131415161718192021222324252627282930313233343536373839404142434445464748495051525354555657585960
by guest on October 15, 2016
http://carcin.oxfordjournals.org/D
ownloaded from
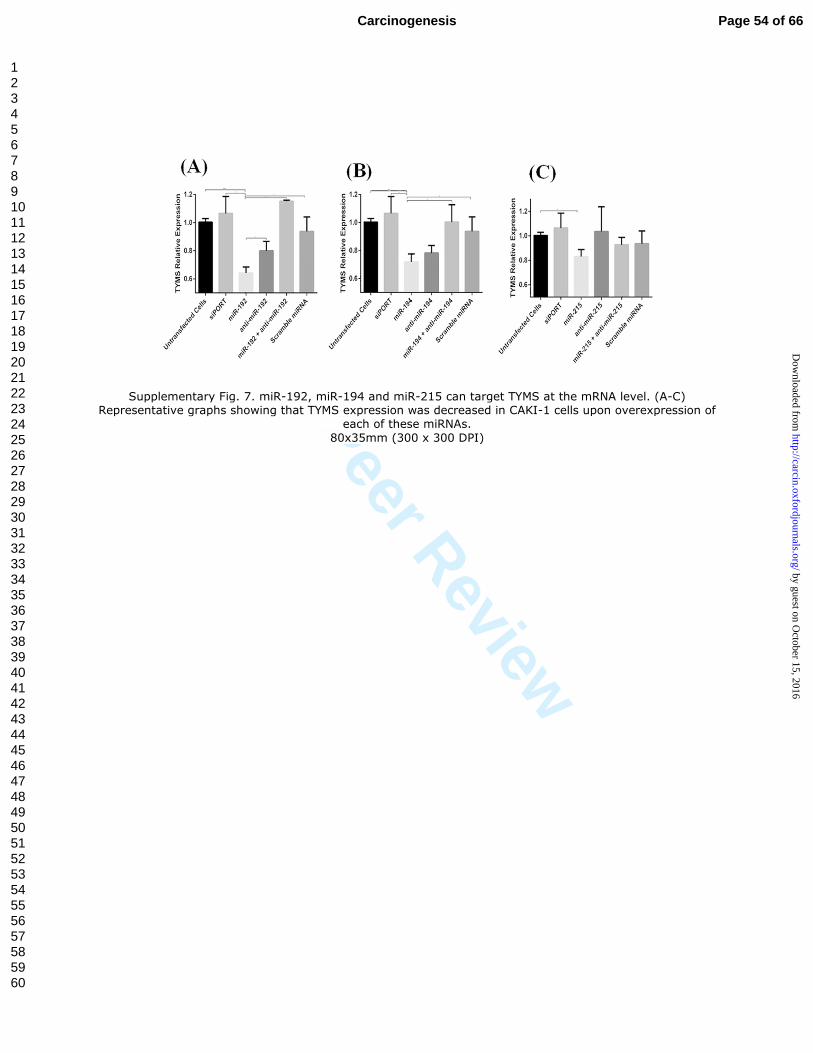
For Peer Review
Supplementary Fig. 7. miR-192, miR-194 and miR-215 can target TYMS at the mRNA level. (A-C) Representative graphs showing that TYMS expression was decreased in CAKI-1 cells upon overexpression of
each of these miRNAs.
80x35mm (300 x 300 DPI)
Page 54 of 66Carcinogenesis
123456789101112131415161718192021222324252627282930313233343536373839404142434445464748495051525354555657585960
by guest on October 15, 2016
http://carcin.oxfordjournals.org/D
ownloaded from
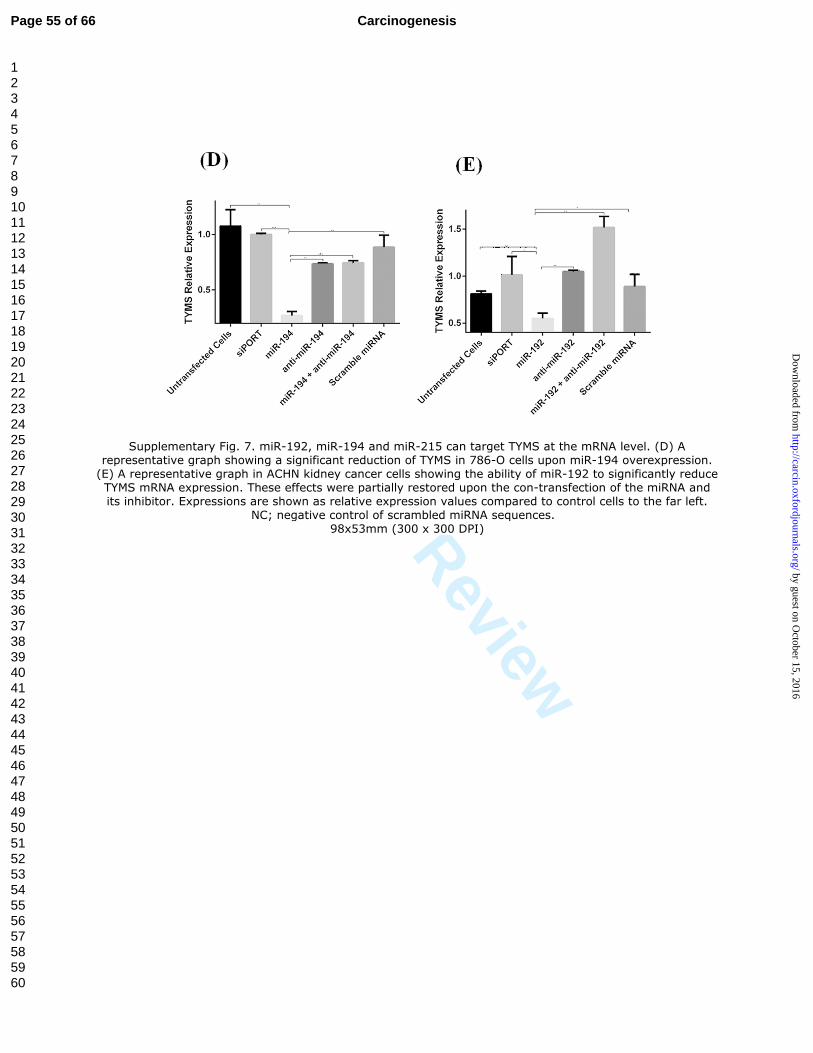
For Peer Review
Supplementary Fig. 7. miR-192, miR-194 and miR-215 can target TYMS at the mRNA level. (D) A representative graph showing a significant reduction of TYMS in 786-O cells upon miR-194 overexpression. (E) A representative graph in ACHN kidney cancer cells showing the ability of miR-192 to significantly reduce TYMS mRNA expression. These effects were partially restored upon the con-transfection of the miRNA and its inhibitor. Expressions are shown as relative expression values compared to control cells to the far left.
NC; negative control of scrambled miRNA sequences. 98x53mm (300 x 300 DPI)
Page 55 of 66 Carcinogenesis
123456789101112131415161718192021222324252627282930313233343536373839404142434445464748495051525354555657585960
by guest on October 15, 2016
http://carcin.oxfordjournals.org/D
ownloaded from
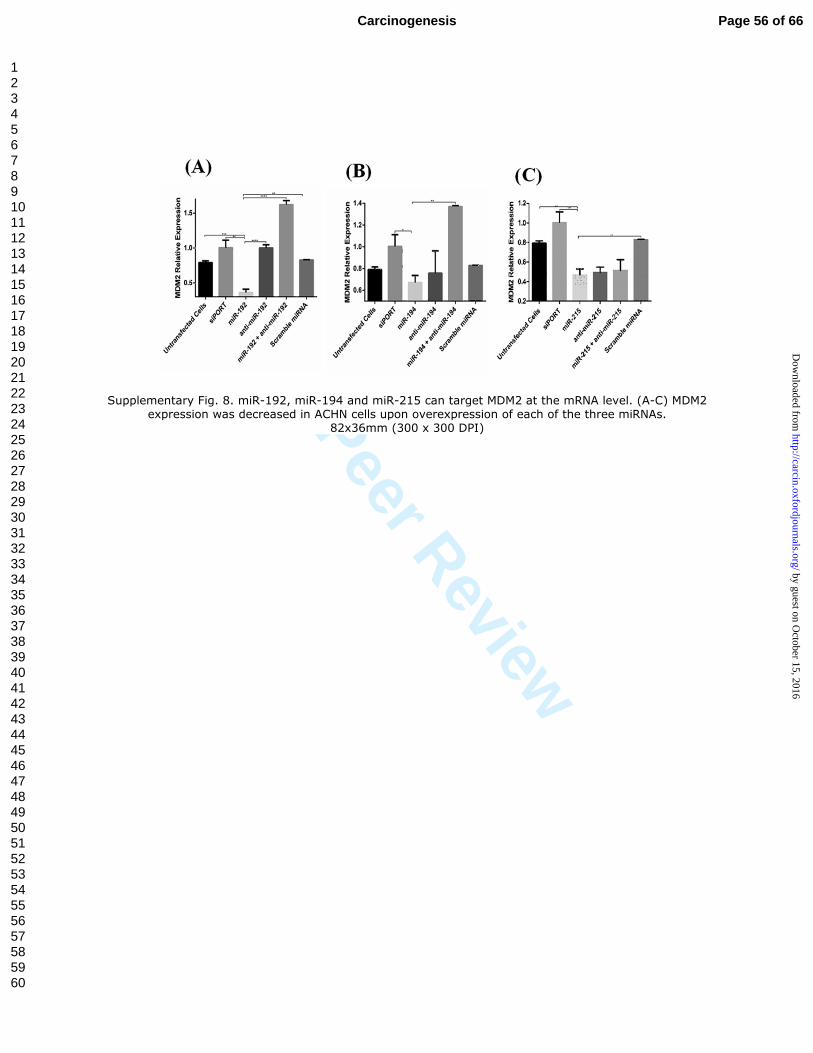
For Peer Review
Supplementary Fig. 8. miR-192, miR-194 and miR-215 can target MDM2 at the mRNA level. (A-C) MDM2 expression was decreased in ACHN cells upon overexpression of each of the three miRNAs.
82x36mm (300 x 300 DPI)
Page 56 of 66Carcinogenesis
123456789101112131415161718192021222324252627282930313233343536373839404142434445464748495051525354555657585960
by guest on October 15, 2016
http://carcin.oxfordjournals.org/D
ownloaded from
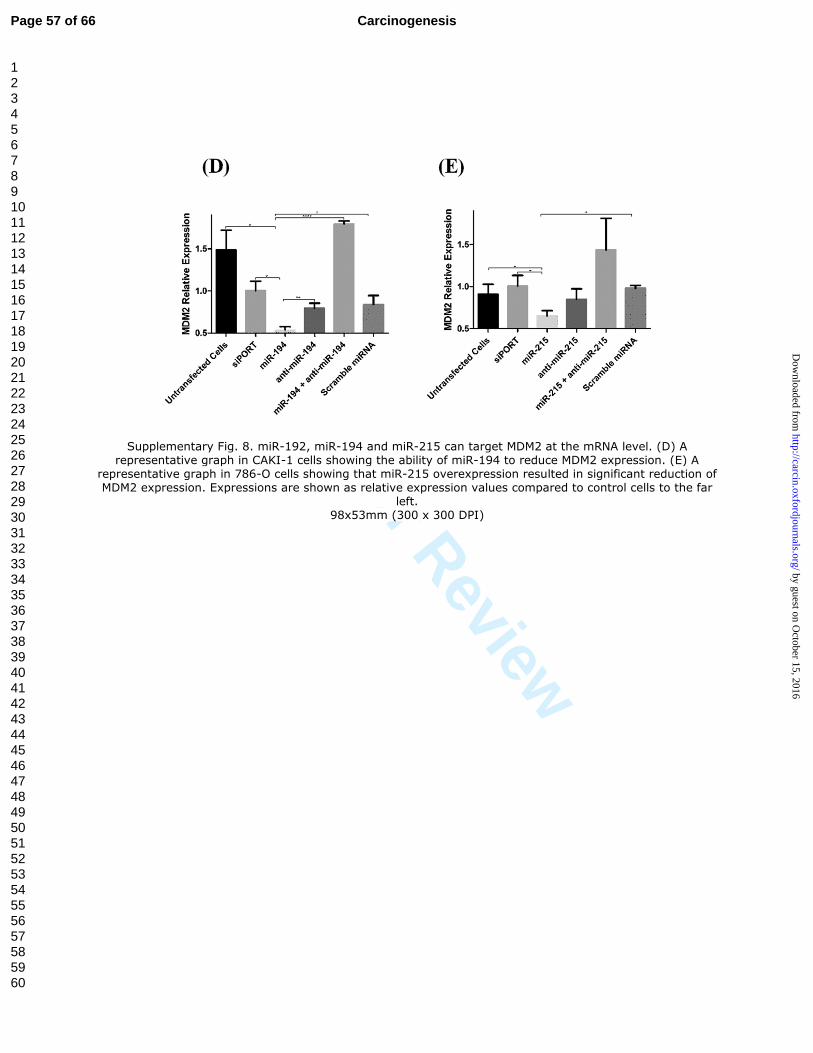
For Peer Review
Supplementary Fig. 8. miR-192, miR-194 and miR-215 can target MDM2 at the mRNA level. (D) A representative graph in CAKI-1 cells showing the ability of miR-194 to reduce MDM2 expression. (E) A
representative graph in 786-O cells showing that miR-215 overexpression resulted in significant reduction of MDM2 expression. Expressions are shown as relative expression values compared to control cells to the far
left. 98x53mm (300 x 300 DPI)
Page 57 of 66 Carcinogenesis
123456789101112131415161718192021222324252627282930313233343536373839404142434445464748495051525354555657585960
by guest on October 15, 2016
http://carcin.oxfordjournals.org/D
ownloaded from
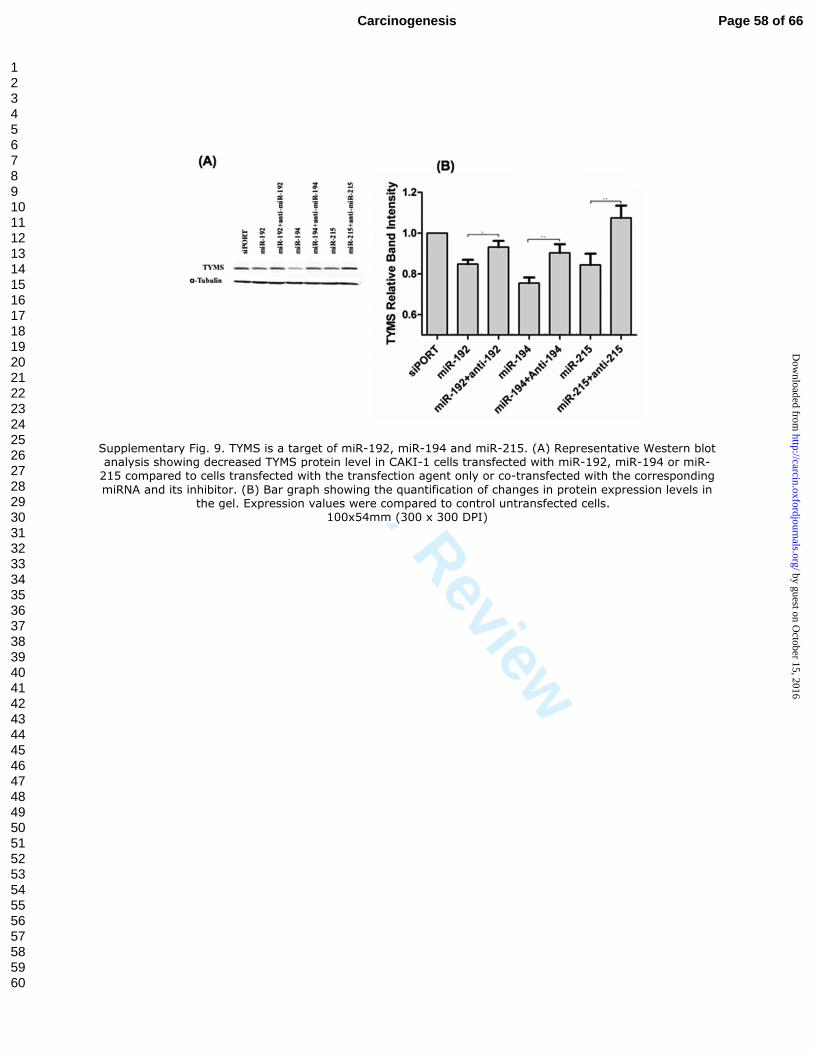
For Peer Review
Supplementary Fig. 9. TYMS is a target of miR-192, miR-194 and miR-215. (A) Representative Western blot analysis showing decreased TYMS protein level in CAKI-1 cells transfected with miR-192, miR-194 or miR-215 compared to cells transfected with the transfection agent only or co-transfected with the corresponding
miRNA and its inhibitor. (B) Bar graph showing the quantification of changes in protein expression levels in the gel. Expression values were compared to control untransfected cells.
100x54mm (300 x 300 DPI)
Page 58 of 66Carcinogenesis
123456789101112131415161718192021222324252627282930313233343536373839404142434445464748495051525354555657585960
by guest on October 15, 2016
http://carcin.oxfordjournals.org/D
ownloaded from
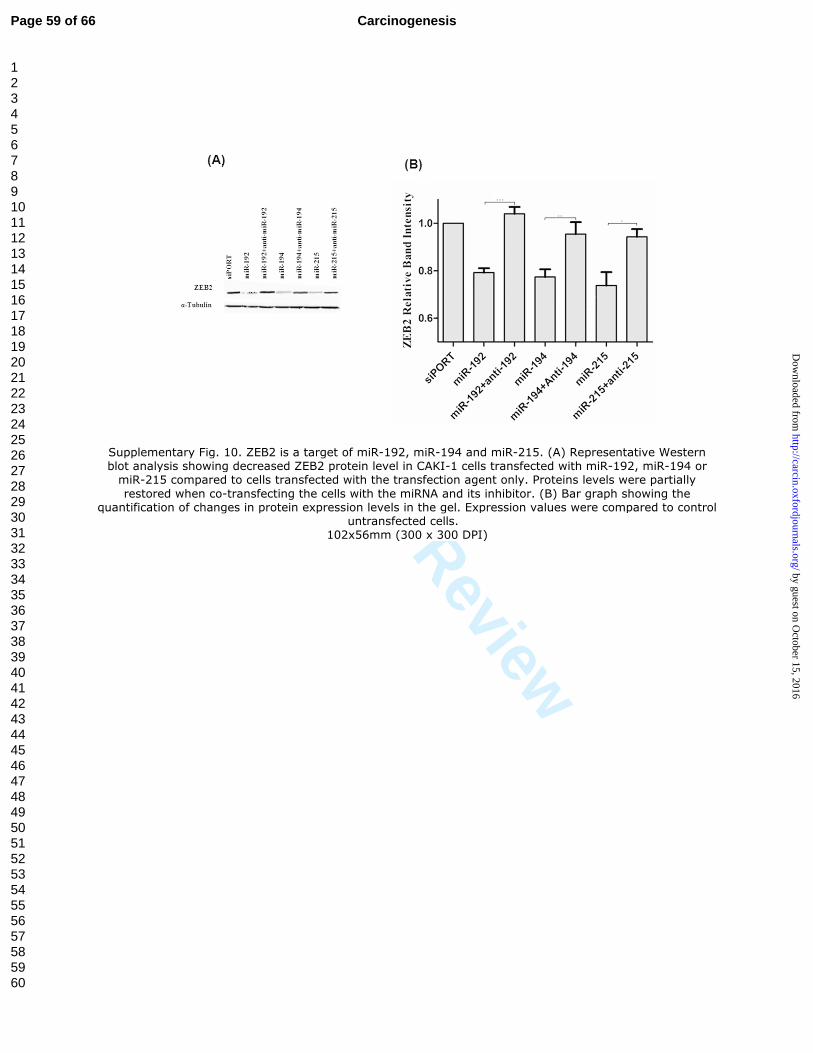
For Peer Review
Supplementary Fig. 10. ZEB2 is a target of miR-192, miR-194 and miR-215. (A) Representative Western blot analysis showing decreased ZEB2 protein level in CAKI-1 cells transfected with miR-192, miR-194 or miR-215 compared to cells transfected with the transfection agent only. Proteins levels were partially
restored when co-transfecting the cells with the miRNA and its inhibitor. (B) Bar graph showing the quantification of changes in protein expression levels in the gel. Expression values were compared to control
untransfected cells. 102x56mm (300 x 300 DPI)
Page 59 of 66 Carcinogenesis
123456789101112131415161718192021222324252627282930313233343536373839404142434445464748495051525354555657585960
by guest on October 15, 2016
http://carcin.oxfordjournals.org/D
ownloaded from
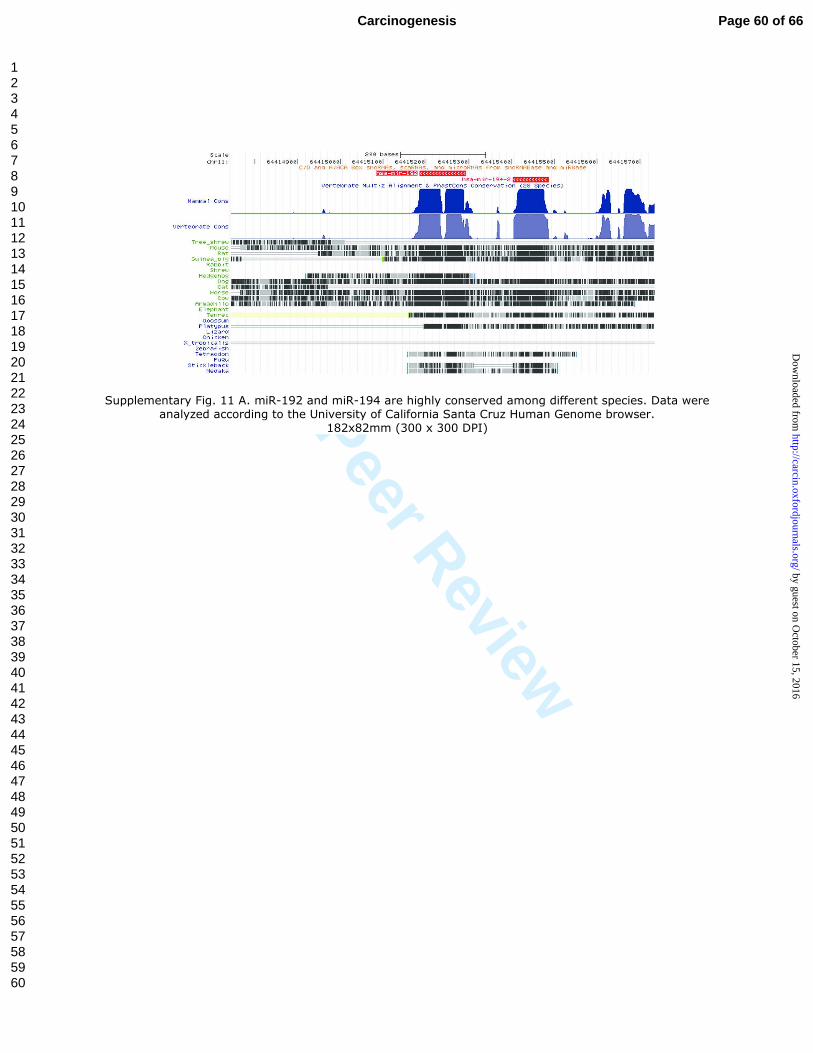
For Peer Review
Supplementary Fig. 11 A. miR-192 and miR-194 are highly conserved among different species. Data were analyzed according to the University of California Santa Cruz Human Genome browser.
182x82mm (300 x 300 DPI)
Page 60 of 66Carcinogenesis
123456789101112131415161718192021222324252627282930313233343536373839404142434445464748495051525354555657585960
by guest on October 15, 2016
http://carcin.oxfordjournals.org/D
ownloaded from
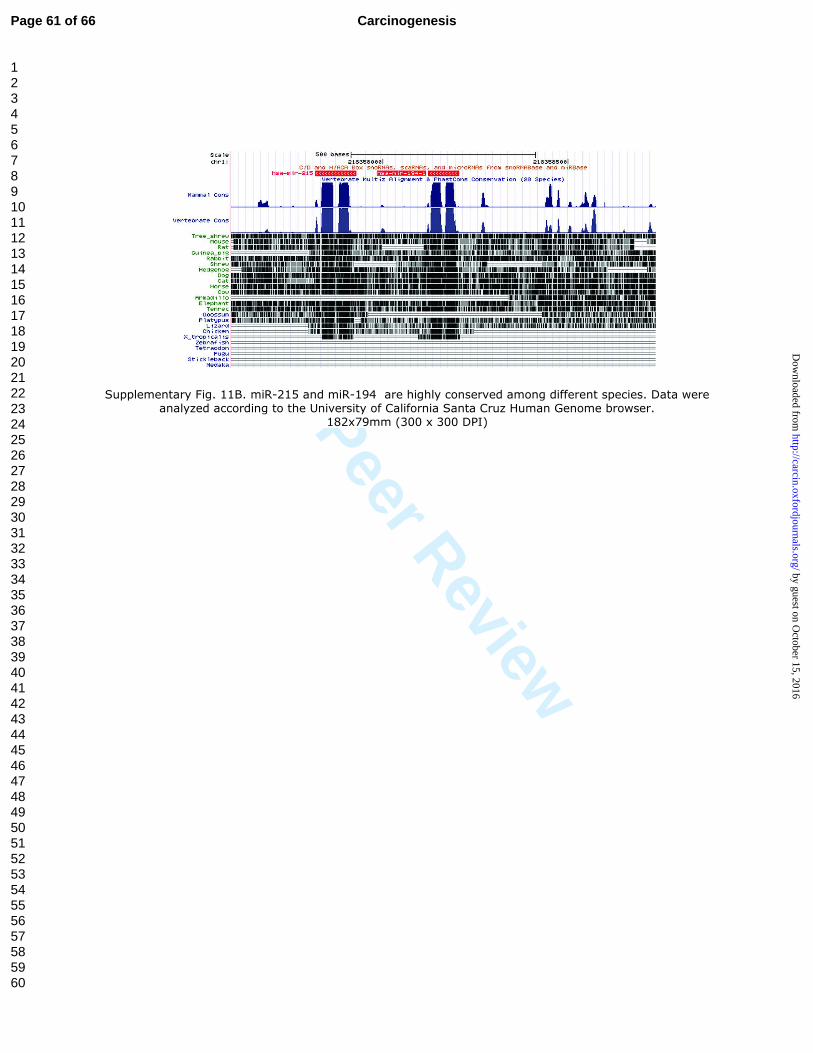
For Peer Review
Supplementary Fig. 11B. miR-215 and miR-194 are highly conserved among different species. Data were analyzed according to the University of California Santa Cruz Human Genome browser.
182x79mm (300 x 300 DPI)
Page 61 of 66 Carcinogenesis
123456789101112131415161718192021222324252627282930313233343536373839404142434445464748495051525354555657585960
by guest on October 15, 2016
http://carcin.oxfordjournals.org/D
ownloaded from
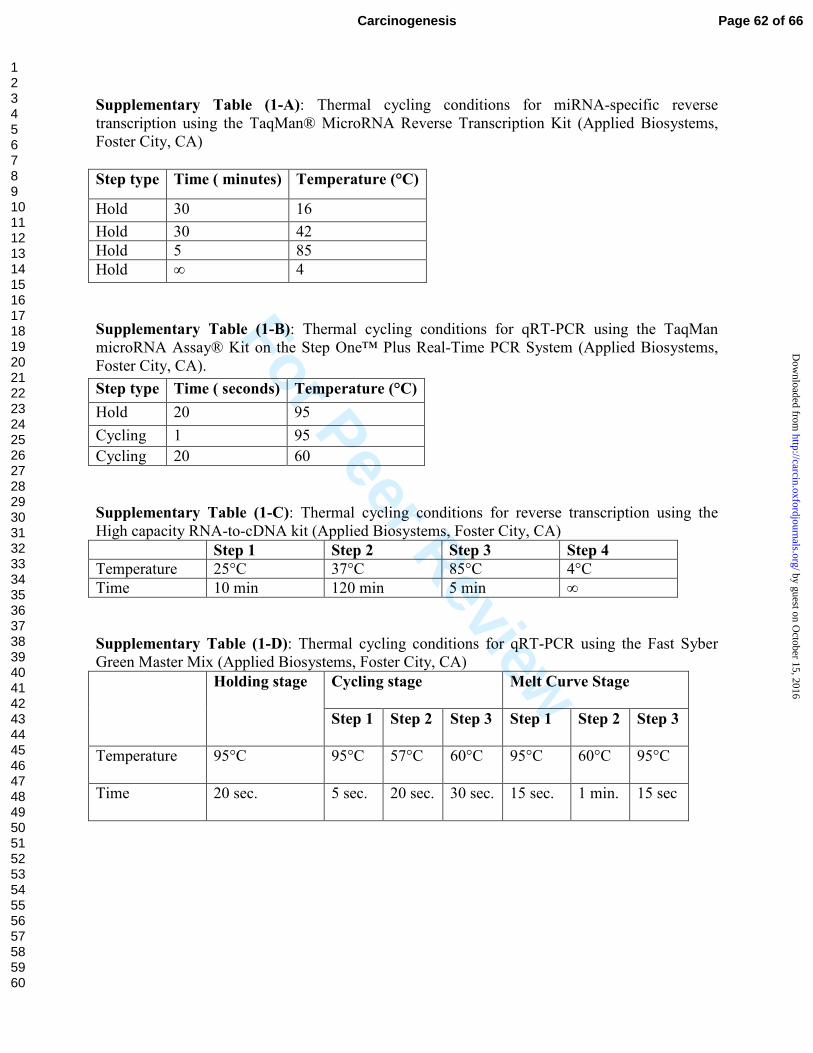
For Peer Review
Supplementary Table (1-A): Thermal cycling conditions for miRNA-specific reverse
transcription using the TaqMan® MicroRNA Reverse Transcription Kit (Applied Biosystems,
Foster City, CA)
Step type Time ( minutes) Temperature (°C)
Hold 30 16
Hold 30 42
Hold 5 85
Hold ∞ 4
Supplementary Table (1-B): Thermal cycling conditions for qRT-PCR using the TaqMan
microRNA Assay® Kit on the Step One™ Plus Real-Time PCR System (Applied Biosystems,
Foster City, CA).
Supplementary Table (1-C): Thermal cycling conditions for reverse transcription using the
High capacity RNA-to-cDNA kit (Applied Biosystems, Foster City, CA)
Step 1 Step 2 Step 3 Step 4
Temperature 25°C 37°C 85°C 4°C
Time 10 min 120 min 5 min ∞
Supplementary Table (1-D): Thermal cycling conditions for qRT-PCR using the Fast Syber
Green Master Mix (Applied Biosystems, Foster City, CA)
Holding stage Cycling stage Melt Curve Stage
Step 1 Step 2 Step 3 Step 1 Step 2 Step 3
Temperature 95°C 95°C 57°C 60°C 95°C 60°C 95°C
Time 20 sec. 5 sec. 20 sec. 30 sec. 15 sec. 1 min. 15 sec
Step type Time ( seconds) Temperature (°C)
Hold 20 95
Cycling 1 95
Cycling 20 60
Page 62 of 66Carcinogenesis
123456789101112131415161718192021222324252627282930313233343536373839404142434445464748495051525354555657585960
by guest on October 15, 2016
http://carcin.oxfordjournals.org/D
ownloaded from
For Peer Review
Supplementary Table (2): The Primer Sequences
Target Forward-Primer Reverse-Primer
ZEB2 5’-TCTCCCATTCTGGTTCCTACA-3’ 5’-TTCTCATTCGGCCATTTACAG-3’
TYMS 5’-ACACTTTGGGAGATGCACATA-3’ 5’-AATAGTTGGATGCGGATTGTA-3’
MDM2 5’-GCCTGGCTCTGTGTGTAATAAG-3’ 5’-TGAGAGTTCTTGTCCTTCTTCACTAA-3’
PPIA 5’-ATGCTGGCCCCAACACAA-3’ 5’-CCCTCTTTCACCTTGCCAAA-3’
HPRT1 5’-TTGCTGACCTGCTGGATTAC-3’ 5’-TCTCCACCAATTACTTTTATGTCC-3’
Page 63 of 66 Carcinogenesis
123456789101112131415161718192021222324252627282930313233343536373839404142434445464748495051525354555657585960
by guest on October 15, 2016
http://carcin.oxfordjournals.org/D
ownloaded from
For Peer Review
Supplementary Table (3): miR-192, miR-194 and miR-215 target pathways and key
molecules involved in tumor progression
Pathway miRNA Gene Name
Renal Cell Carcinoma miR-192 ARNT2
miR-215 RAP1B
miR-194 HIF1A, MAPK1, RAC1, PAK2, RAP1B,
AKT2, CRK
VEGF signaling pathway miR-192 NFAT5
miR-215 NFAT5
miR-194 MAPK1, RAC1, AKT2, PRKCB1, NFAT5
TGF-Beta signaling Pathway miR-192 ACVR2A, NOG, ACVR2B, BMPR2, ZEB2
miR-215 ACVR2A, BMPR2, ACVR2B, ZEB2
miR-194 ID4, SMURF1, ZFYVE9, ACVR1, GDF6,
MAPK1, THBS1, PPP2R2C, ACVR2B
BMPR1B, BMPR2, ZEB2
Bladder Cancer miR-192 RB1, DAPK2
miR-215 RB1
miR-194 E2F3, FGFR3, MAPK1, THBS1
MAPK signaling pathway miR-192 MAP3K1, MEF2C, STK4, MAP2K4, FGF7
miR-215 FGFR1, MAP3K7, RAP1B
miR-194 STMN1, ATF2, MEF2C, DUSP9, FGFR3,
MAPK1, RAC1, PAK2, RAP1B, AKT2,
DUSP10, PRKCB1, PDGFA, MAP4K4,
MAP3K3, CRK, PDGFA
P53 signaling pathway miR-192 IGF1, ZMAT3, CYCS, MDM2
miR-215 IGF1, MDM2
miR-194 THBS1, MDM2
Non-small cell lung cancer miR-192 STK4, RB1
miR-215 RB1
miR-194 E2F3, MAPK1, AKT2, PRKCB1
Cell communication miR-192 COL5A1, DSG3, KRT38, GJA7
miR-215 COL5A1
miR-194 THBS1, GJB1, GJB7, COL4A4
Prostate Cancer miR-192 RB1, CREB5, TCF7
miR-215 RB1, FGFR1, CREB5, IGF1, TCF7
miR-194 CDKN1B, E2F3, IGF1R, FOXO1, MAPK1,
AKT2, PDGFA
Cell Cycle miR-192 RB1
miR-215 RB1, MCM3
miR-194 CDKN1B, E2F3, CDC14A
Cell adhesion molecules
(CAMs)
miR-192 ALCAM, MPZ
miR-215 ALCAM, CNTNAP1
miR-194 NRCAM, CDH2, SDC4, CNTNAP2,
ITGA9, CADM1
Page 64 of 66Carcinogenesis
123456789101112131415161718192021222324252627282930313233343536373839404142434445464748495051525354555657585960
by guest on October 15, 2016
http://carcin.oxfordjournals.org/D
ownloaded from
For Peer Review
Colorectal cancer miR-192 FZD9, TCF7, CYCS
miR-215 TCF7
miR-194 FZD5, IGF1R, MAPK1, RAC1, AKT2,
FZD6
Small cell lung cancer miR-192 RB1, CYCS, BIRC4
miR-215 RB1
miR-194 CDKN1B, E2F3, AKT2, COL4A4
Wnt signaling pathway miR-192 FZD9, CTNNBIP1, NFAT5, TCF7
miR-215 MAP3K7,CTNNBIP1, NFAT5, TCF7
miR-194 FZD5, CAMK2G, DAAM1, PPP2R2C,
RAC1, CHD8, PRKCB1, NFAT5, FZD6,
FZD4, PRICKLE2
Pancreatic cancer miR-192 RB1
miR-215 RB1
miR-194 E2F3, MAPK1, RAC1, AKT2
mTOR signaling pathway miR-192 RICTOR, IGF1
miR-215 RICTOR, IGF1
miR-194 HIF1A, RPS6, RHEB, MAPK1, AKT2
Folate Biosynthesis miR-192 DDX50, TYMS
miR-215 DDX50, TYMS
miR-194 TYMS
Focal adhesion miR-192 COL5A1, CAV1, IGF1, BIRC4
miR-215 DIAPH1, COL5A1, RAP1B, MYLK, IGF1
miR-194 TLN2, IGF1R, ITGA9, MAPK1, THBS1,
RAC1, PAK2, RAP1B, AKT2, ARHGAP5,
PRKCB1, ITGB6, PDGFA, CRK, COL4A4
Tight Junction miR-194 RAB13, RAB3B, VAPA, PPP2R2C, CASK,
AKT2, TJAP1, PRKCB1, MYH10
Adherens junction miR-192 TCF7
miR-215 FGFR1, MAP3K7, IQGAP1, TCF7
miR-194 IGF1R, MAPK1, RAC1, IQGAP1
DNA Replication miR-192 TYMS
miR-215 MCM3, TYMS
miR-194 TYMS
Cytokine-cytokine receptor
interaction
miR-192 LEPR, ACVR2A, ACVR2B, BMPR2
miR-215 ACVR2A, BMPR2, ACVR2B
miR-194 IL6ST, TNFSF11, ACVR1, IL10, ACVR2B,
LIF, BMPR2
Apoptosis miR-192 CYCS, BIRC4
miR-194 AKT2, PRKAR1A
Page 65 of 66 Carcinogenesis
123456789101112131415161718192021222324252627282930313233343536373839404142434445464748495051525354555657585960
by guest on October 15, 2016
http://carcin.oxfordjournals.org/D
ownloaded from
For Peer Review
Supplementary Table (4): miR-192, miR-194 and miR-215 are predicted to target the
3'UTR of TYMS, MDM2 and ZEB2 based on sequence analysis using the PITA
Algorithm.
Gene miRNA Position Seed
TYMS hsa-miR-192 215 8:1:0
TYMS hsa-miR-215 215 8:1:0
TYMS hsa-miR-194 261 8:1:1
MDM2 hsa-miR-192 370 8:1:1
MDM2 hsa-miR-215 370 8:1:1
MDM2 hsa-miR-194 511 8:1:0
ZEB2 hsa-miR-192 989 8:1:0
ZEB2 hsa-miR-215 989 8:1:0
ZEB2 hsa-miR-194 78 8:1:1
Page 66 of 66Carcinogenesis
123456789101112131415161718192021222324252627282930313233343536373839404142434445464748495051525354555657585960
by guest on October 15, 2016
http://carcin.oxfordjournals.org/D
ownloaded from


