Embed Size (px)
Citation preview
MME 208 PHASE DIAGRAMSTernary Phase Diagrams
TERNARY PHASE DIAGRAMSTernary systems are those having three components. It is not possible todescribe the composition of a ternary alloy with a single number orfraction, as was done with binary alloys, but the statement of twoindependent values is sufficient. For example, the composition of an Fe-Cr-Ni alloy.
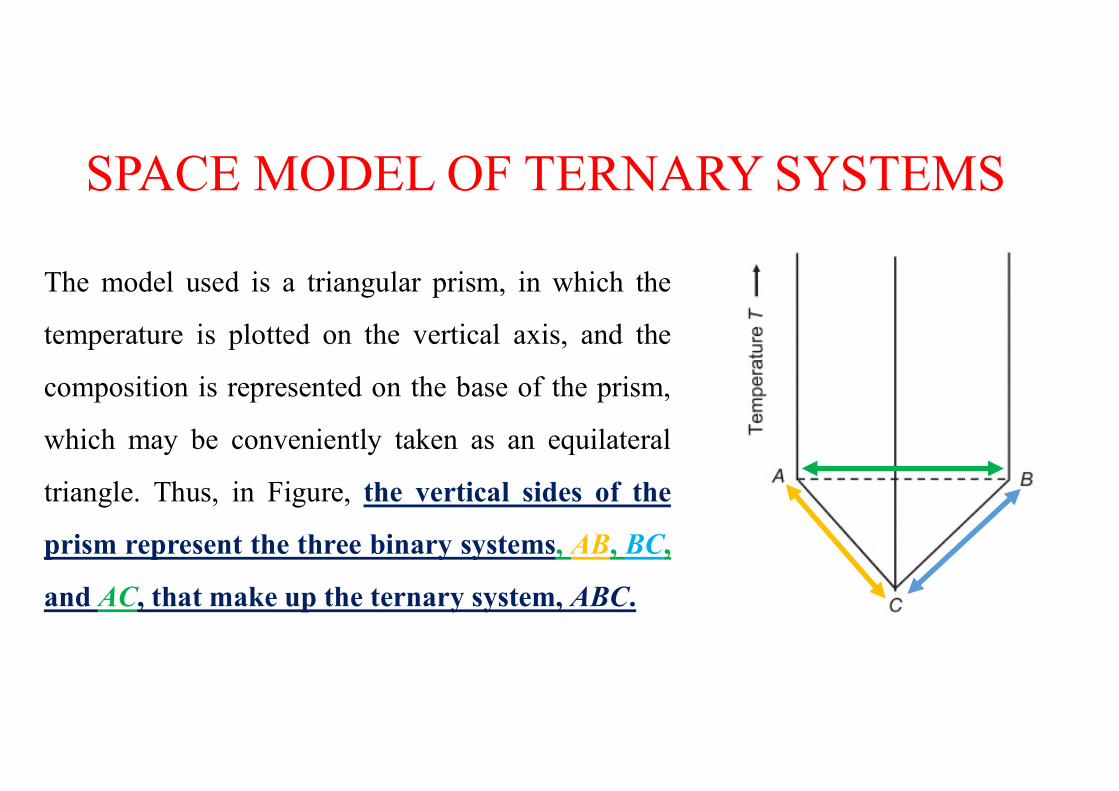
SPACE MODEL OF TERNARY SYSTEMSThe model used is a triangular prism, in which thetemperature is plotted on the vertical axis, and thecomposition is represented on the base of the prism,which may be conveniently taken as an equilateraltriangle. Thus, in Figure, the vertical sides of theprism represent the three binary systems, AB, BC,and AC, that make up the ternary system, ABC.
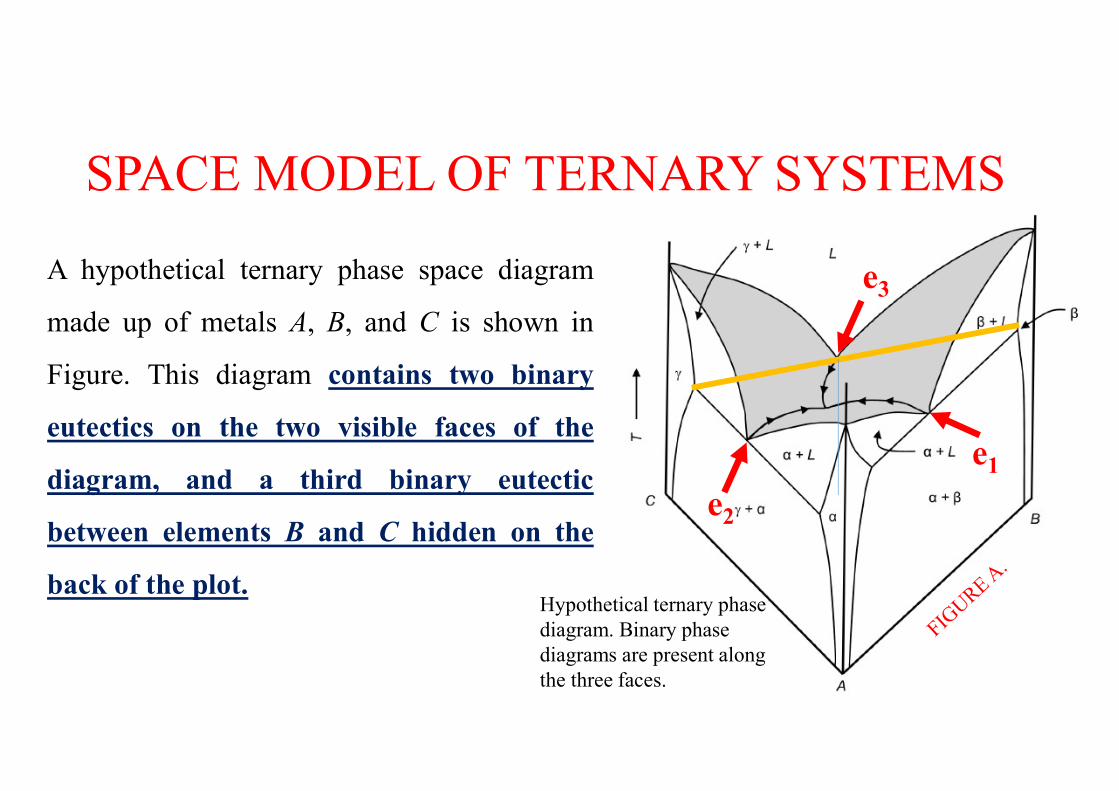
A hypothetical ternary phase space diagrammade up of metals A, B, and C is shown inFigure. This diagram contains two binaryeutectics on the two visible faces of thediagram, and a third binary eutecticbetween elements B and C hidden on theback of the plot.
SPACE MODEL OF TERNARY SYSTEMS
e2e1
e3
Hypothetical ternary phase diagram. Binary phase diagrams are present along the three faces.
SPACE MODEL OF TERNARY SYSTEMS
e1e2
e3
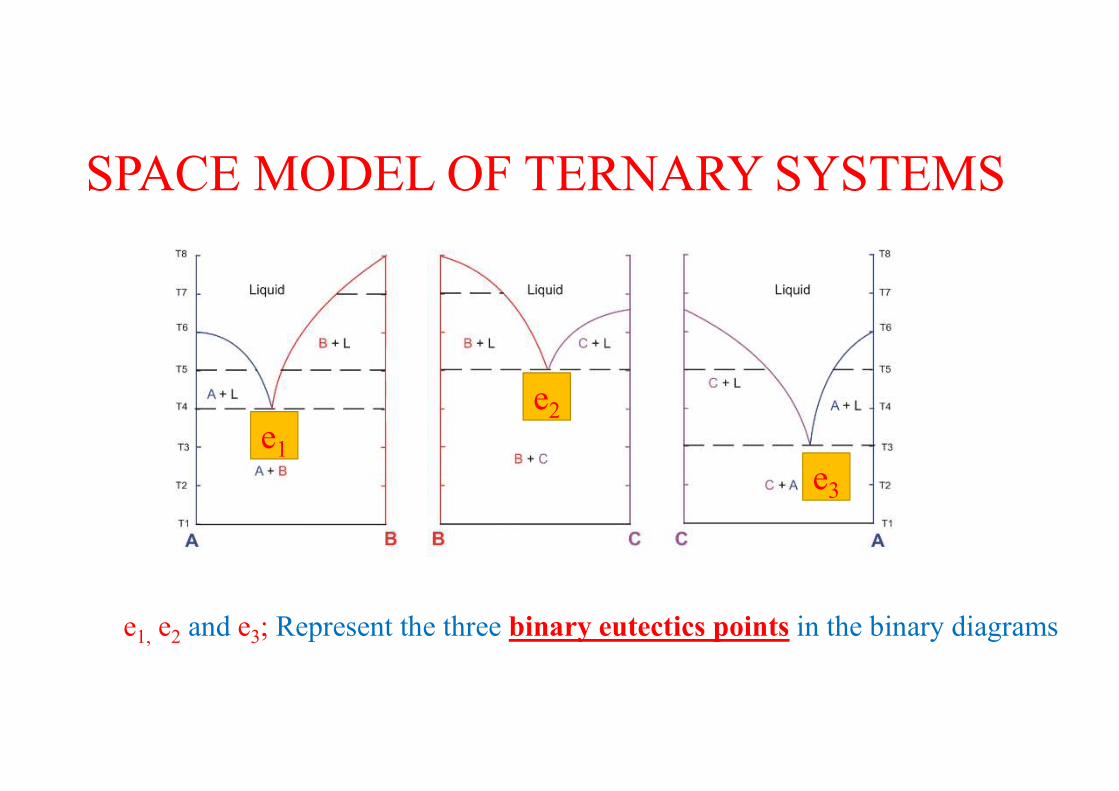
e1, e2 and e3; Represent the three binary eutectics points in the binary diagrams
SPACE MODEL OF TERNARY SYSTEMS
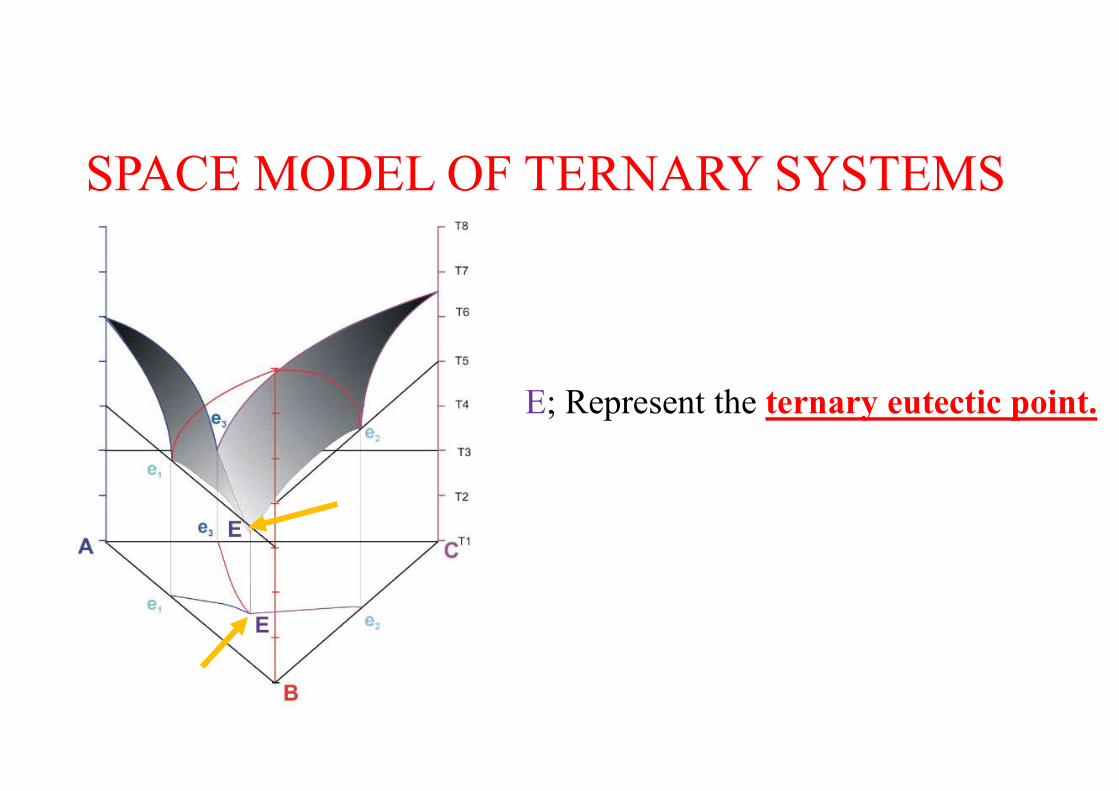
E; Represent the ternary eutectic point.
It is difficult to use the 3-D ternary plot, the information from thediagrams can be plotted in two dimensions by any of several methods,including the liquidus plot, the isothermal plot, and a vertical sectioncalled an isopleth.
SPACE MODEL OF TERNARY SYSTEMS
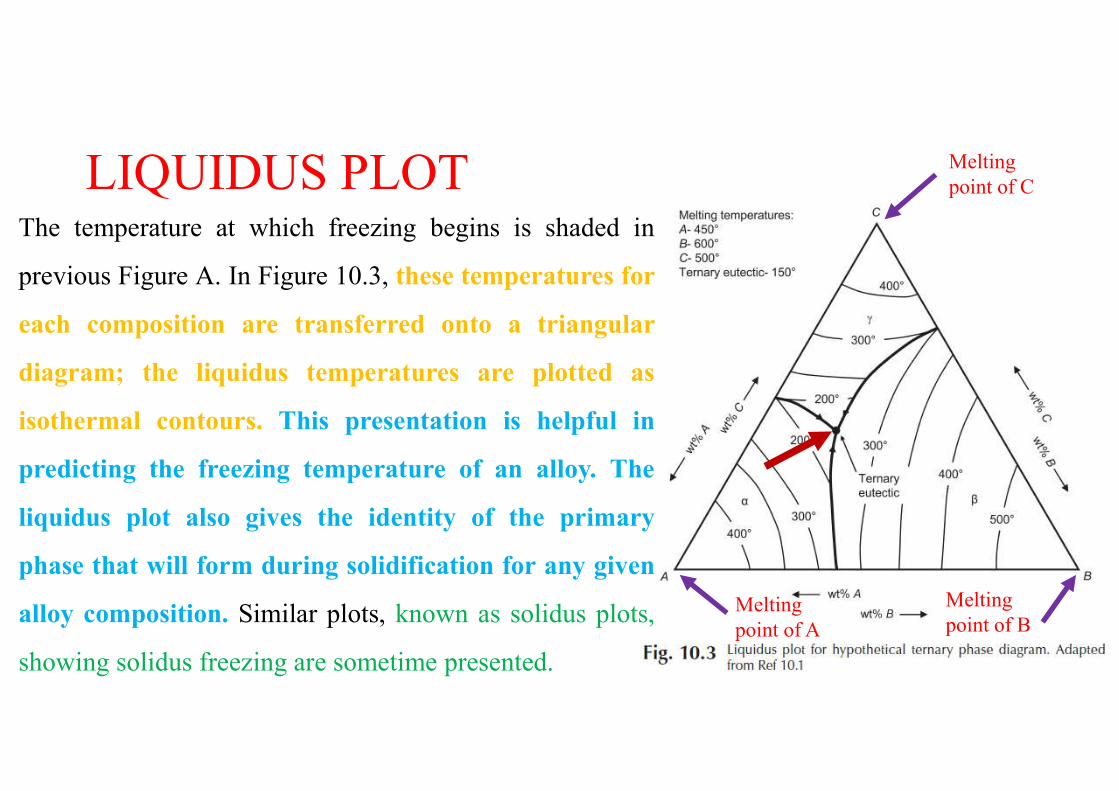
LIQUIDUS PLOTThe temperature at which freezing begins is shaded inprevious Figure A. In Figure 10.3, these temperatures foreach composition are transferred onto a triangulardiagram; the liquidus temperatures are plotted asisothermal contours. This presentation is helpful inpredicting the freezing temperature of an alloy. Theliquidus plot also gives the identity of the primaryphase that will form during solidification for any givenalloy composition. Similar plots, known as solidus plots,showing solidus freezing are sometime presented.
Melting point of C
Melting point of BMelting
point of A
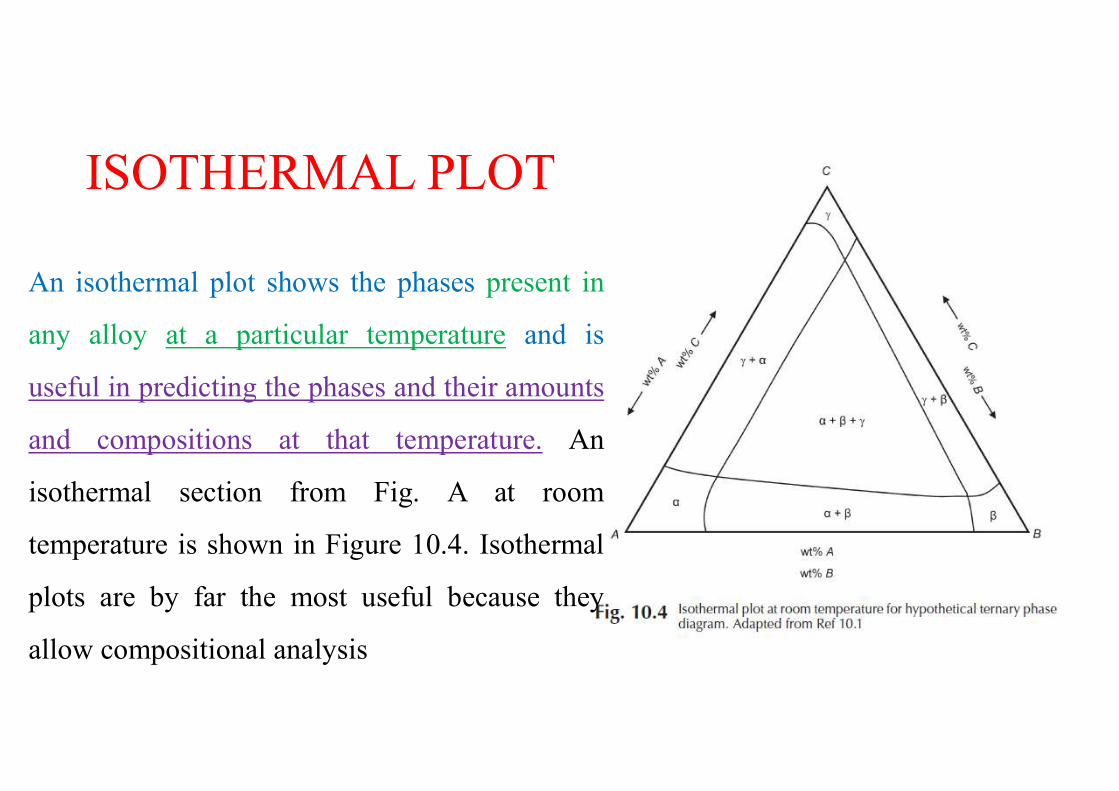
ISOTHERMAL PLOTAn isothermal plot shows the phases present inany alloy at a particular temperature and isuseful in predicting the phases and their amountsand compositions at that temperature. Anisothermal section from Fig. A at roomtemperature is shown in Figure 10.4. Isothermalplots are by far the most useful because theyallow compositional analysis
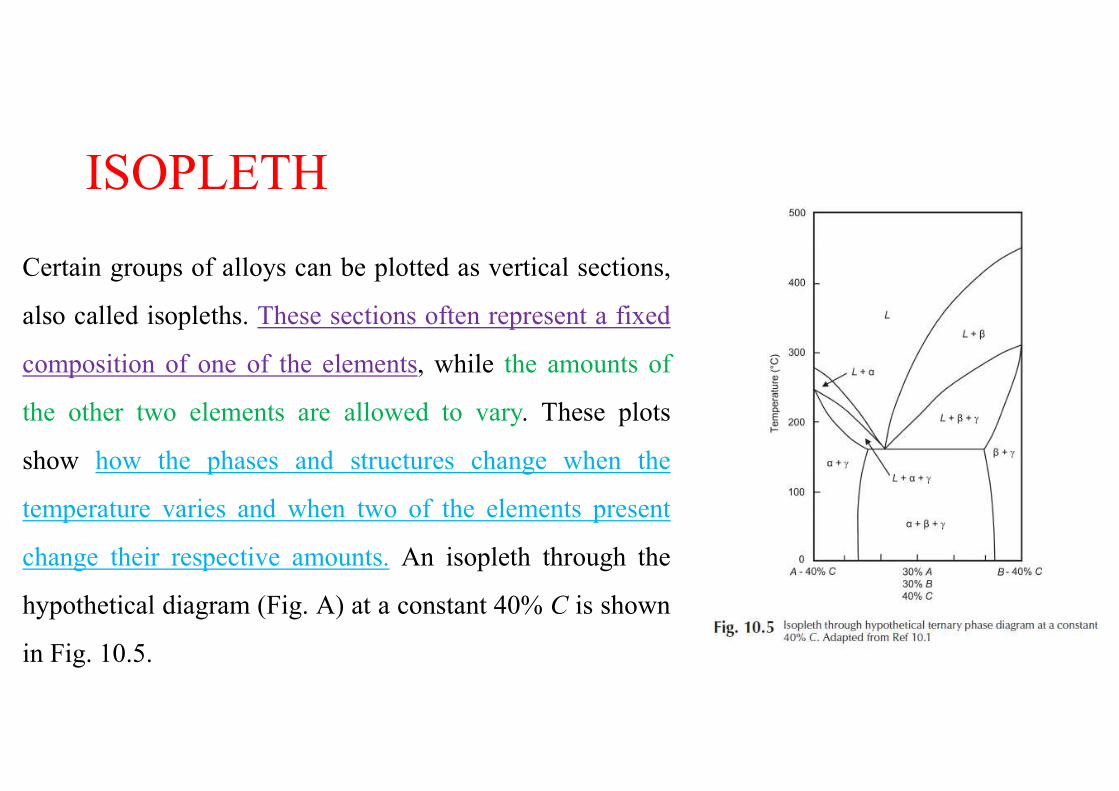
ISOPLETHCertain groups of alloys can be plotted as vertical sections,also called isopleths. These sections often represent a fixedcomposition of one of the elements, while the amounts ofthe other two elements are allowed to vary. These plotsshow how the phases and structures change when thetemperature varies and when two of the elements presentchange their respective amounts. An isopleth through thehypothetical diagram (Fig. A) at a constant 40% C is shownin Fig. 10.5.
SINGLE-PHASE BOUNDARY AND ZEROPHASE FRACTION LINESTwo-dimensional (2-D) sections of any multicomponent phase diagram,whether it is an isotherm or an isopleth, can be read by focusing on twolines that refer to one particular phase.1. Single Phase Boundary Lines (SPB)2. Zero Phase Fraction Lines (ZPF)
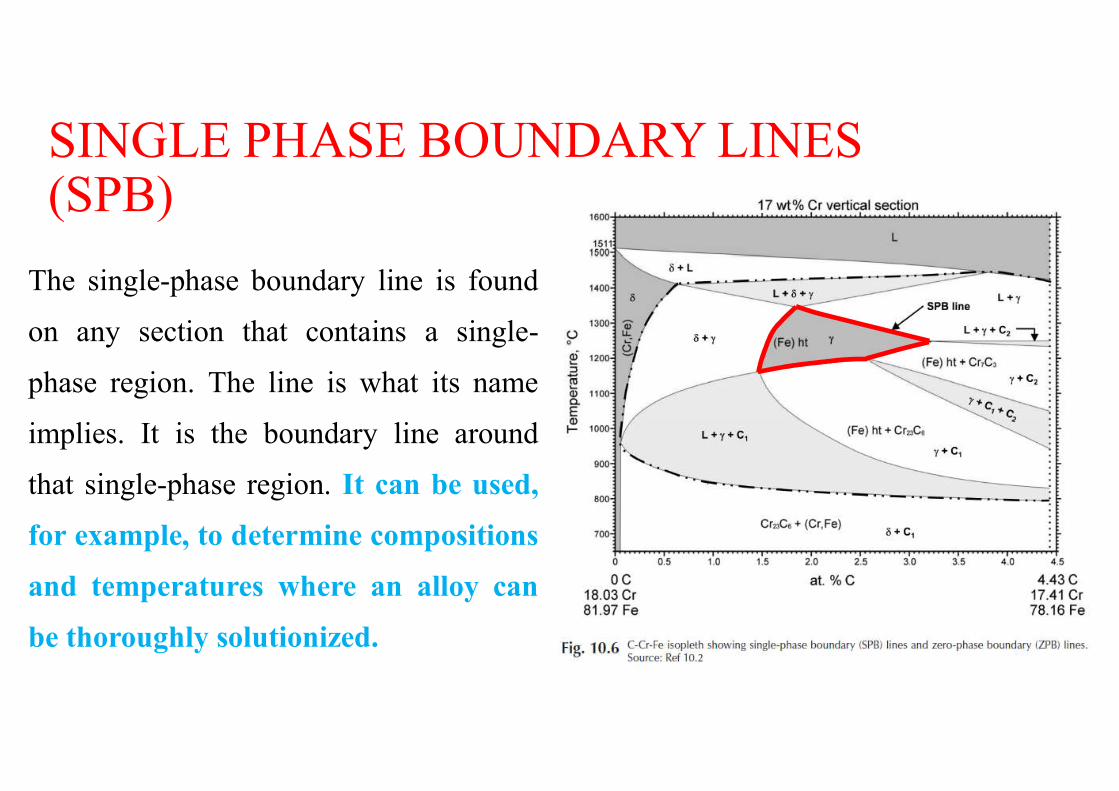
SINGLE PHASE BOUNDARY LINES(SPB)The single-phase boundary line is foundon any section that contains a single-phase region. The line is what its nameimplies. It is the boundary line aroundthat single-phase region. It can be used,for example, to determine compositionsand temperatures where an alloy canbe thoroughly solutionized.
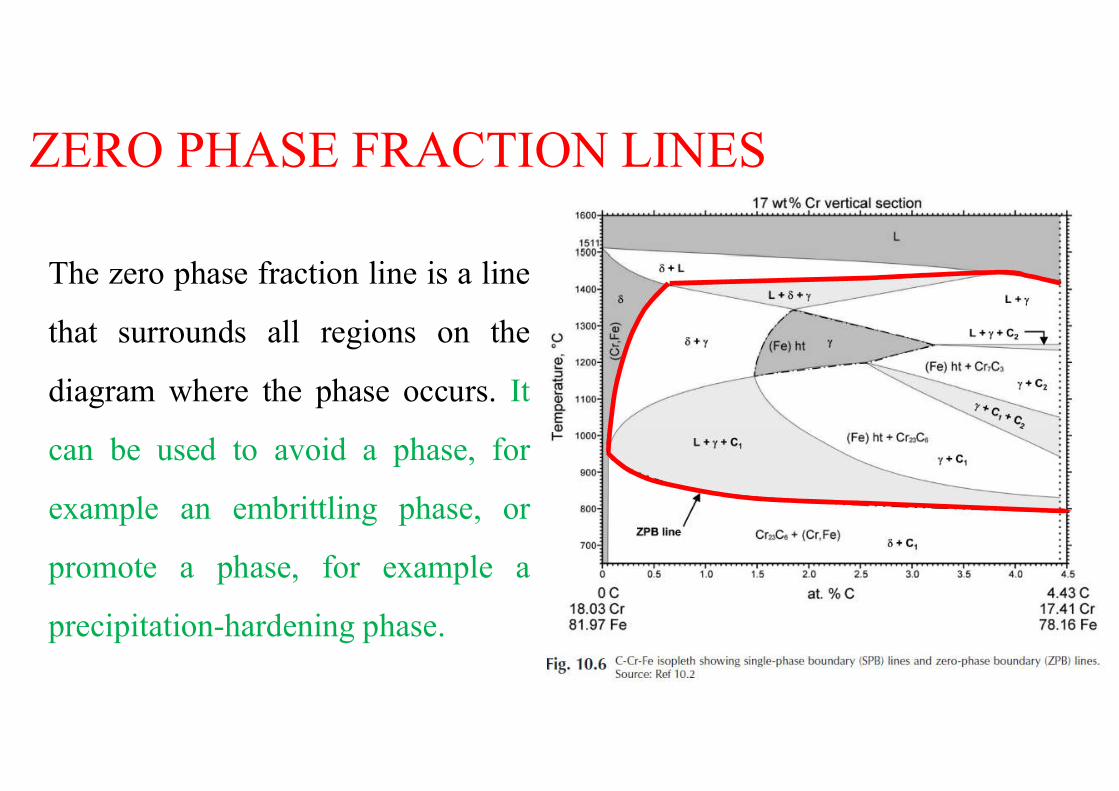
ZERO PHASE FRACTION LINESThe zero phase fraction line is a linethat surrounds all regions on thediagram where the phase occurs. Itcan be used to avoid a phase, forexample an embrittling phase, orpromote a phase, for example aprecipitation-hardening phase.
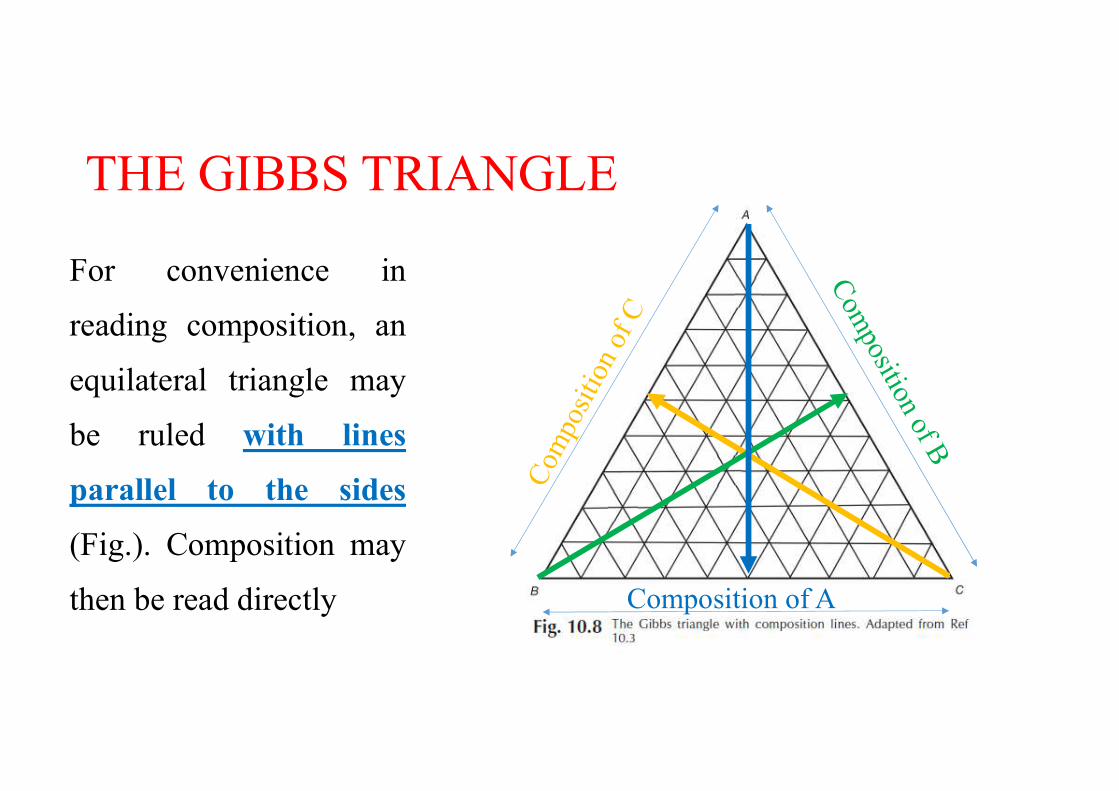
THE GIBBS TRIANGLEFor convenience inreading composition, anequilateral triangle maybe ruled with linesparallel to the sides(Fig.). Composition maythen be read directly Composition of A
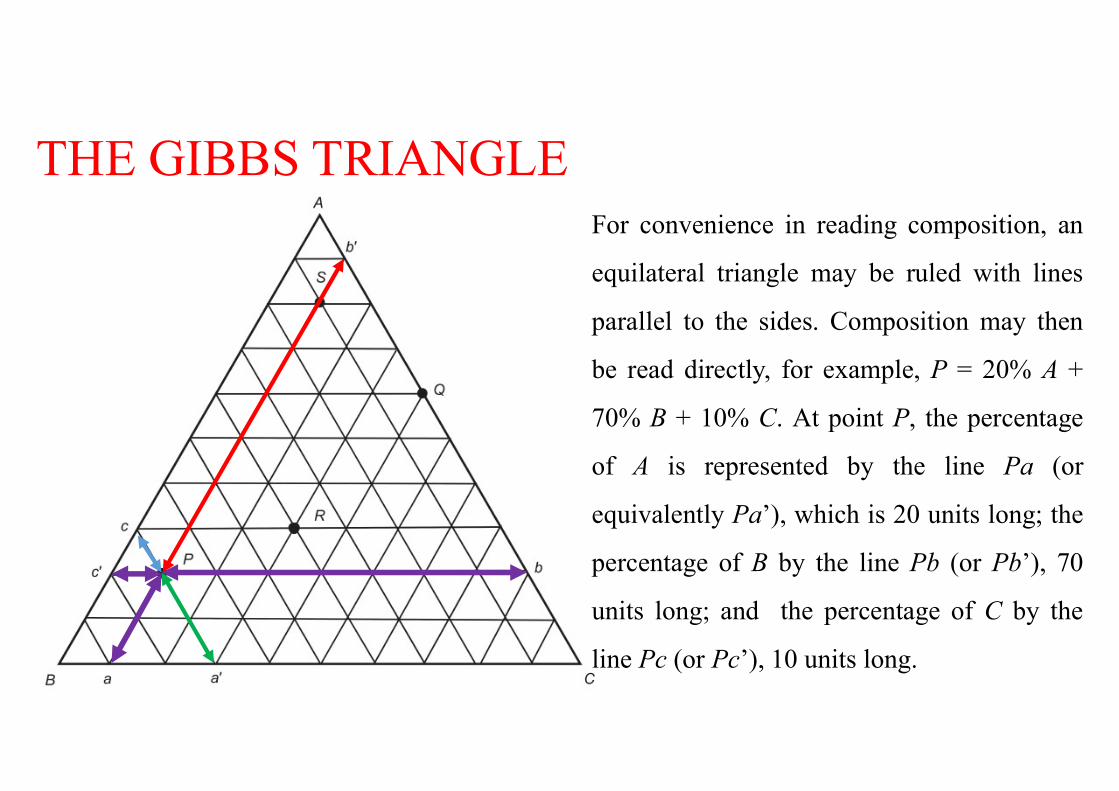
THE GIBBS TRIANGLEFor convenience in reading composition, anequilateral triangle may be ruled with linesparallel to the sides. Composition may thenbe read directly, for example, P = 20% A +70% B + 10% C. At point P, the percentageof A is represented by the line Pa (orequivalently Pa’), which is 20 units long; thepercentage of B by the line Pb (or Pb’), 70units long; and the percentage of C by theline Pc (or Pc’), 10 units long.
C % B %
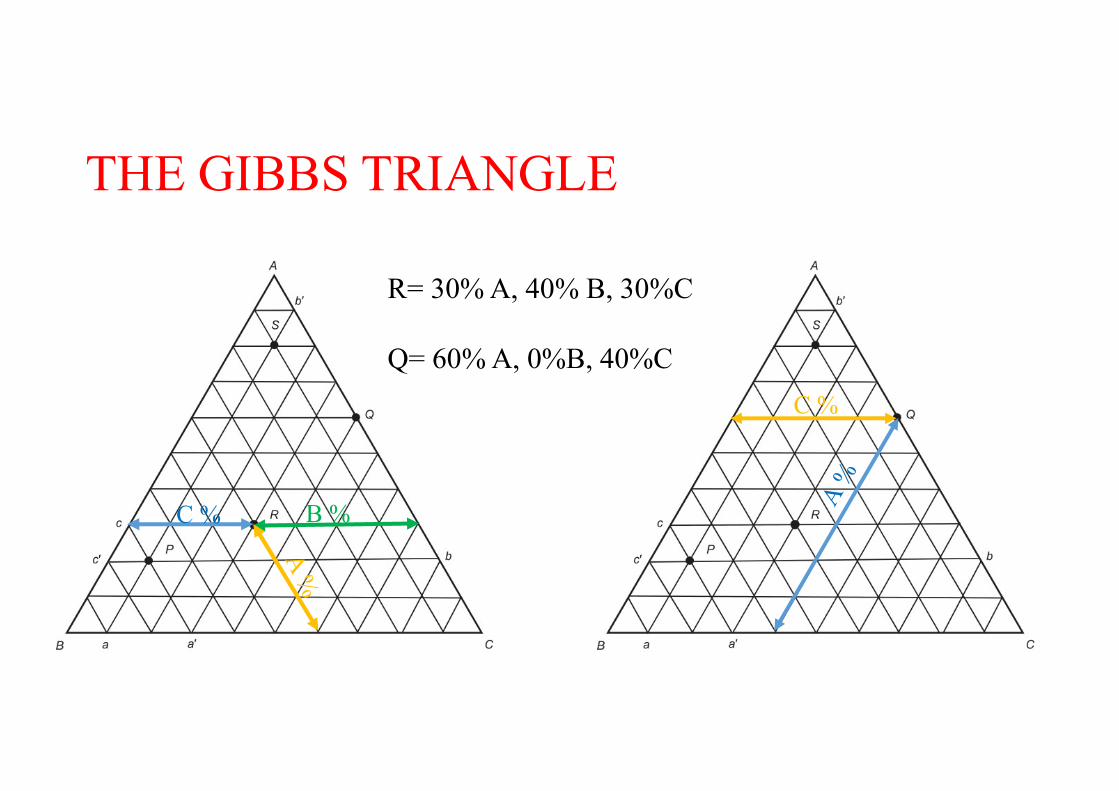
R= 30% A, 40% B, 30%CQ= 60% A, 0%B, 40%C
C %
THE GIBBS TRIANGLE
If any two ternary alloys are mixed together, tie lines can be shown. Thecomposition of the mixture will lie on a straight line joining the originaltwo compositions. This is true regardless of the proportions of the twoalloys in the mixture. Conversely, if an alloy decomposes into twofractions of differing composition, the compositions of the two portionswill lie on opposite ends of a straight line passing through the originalcomposition point.
TIE LINES
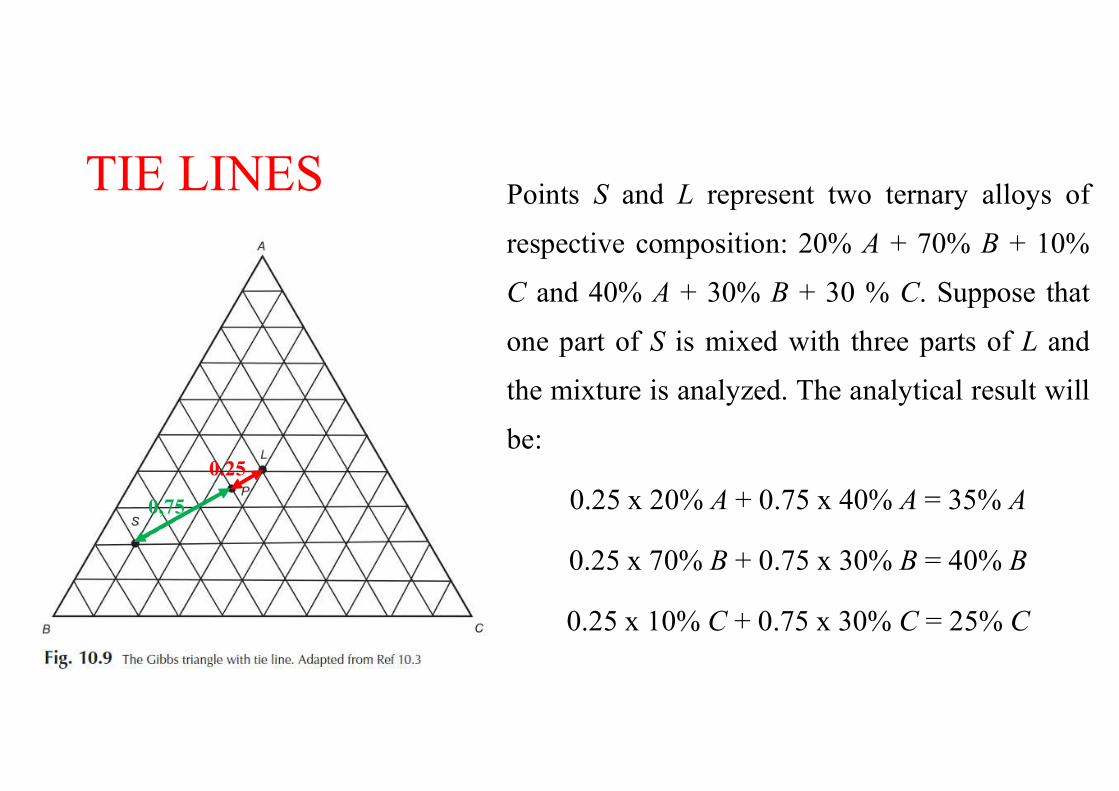
Points S and L represent two ternary alloys ofrespective composition: 20% A + 70% B + 10%C and 40% A + 30% B + 30 % C. Suppose thatone part of S is mixed with three parts of L andthe mixture is analyzed. The analytical result willbe:
0.25 x 20% A + 0.75 x 40% A = 35% A0.25 x 70% B + 0.75 x 30% B = 40% B0.25 x 10% C + 0.75 x 30% C = 25% C
TIE LINES
0,750.25
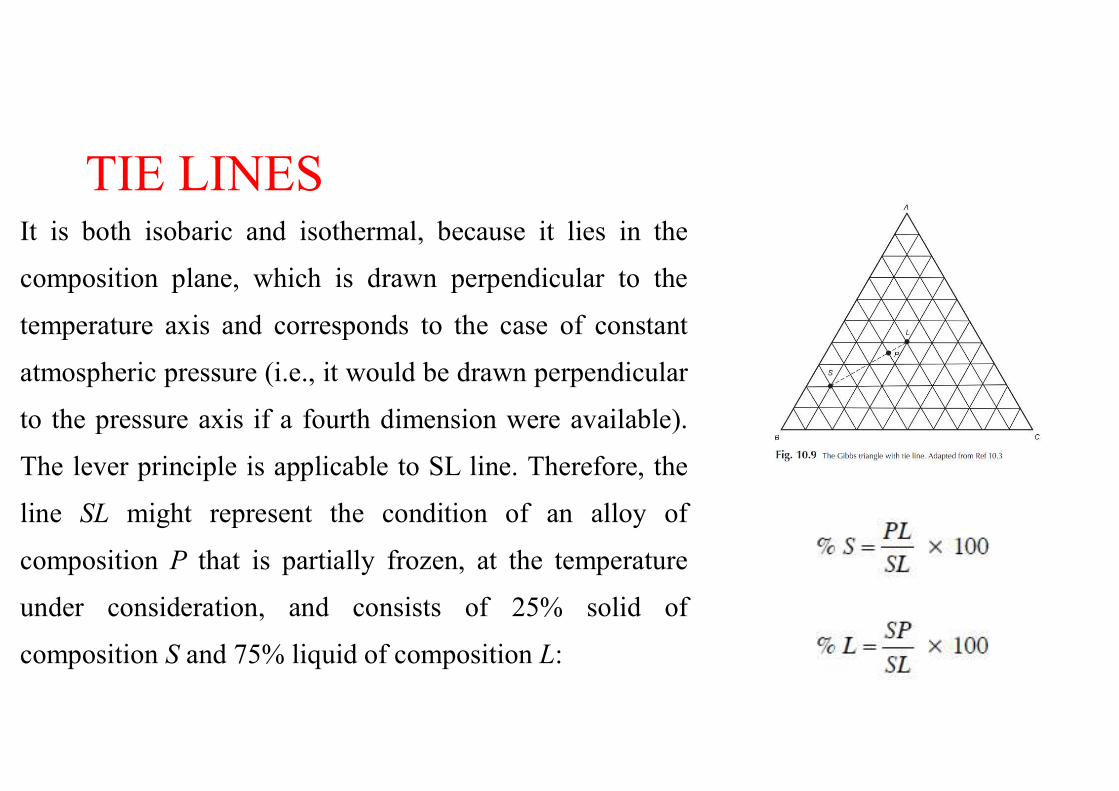
It is both isobaric and isothermal, because it lies in thecomposition plane, which is drawn perpendicular to thetemperature axis and corresponds to the case of constantatmospheric pressure (i.e., it would be drawn perpendicularto the pressure axis if a fourth dimension were available).The lever principle is applicable to SL line. Therefore, theline SL might represent the condition of an alloy ofcomposition P that is partially frozen, at the temperatureunder consideration, and consists of 25% solid ofcomposition S and 75% liquid of composition L:
TIE LINES
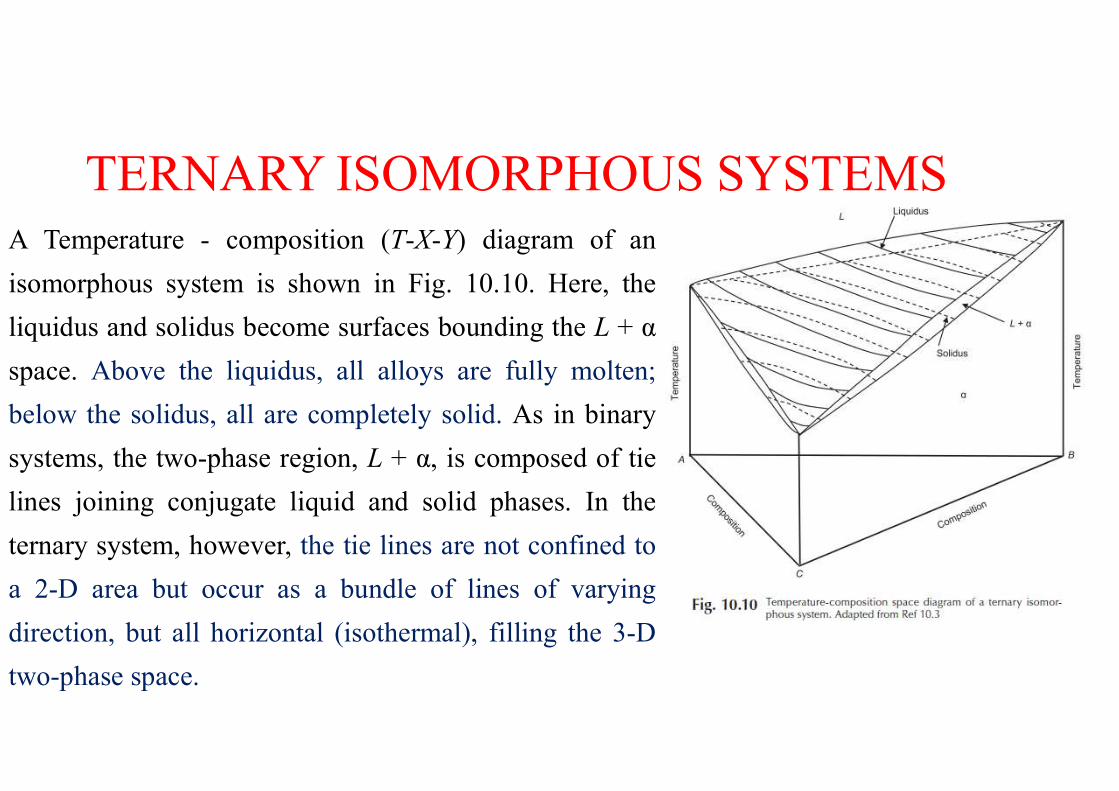
TERNARY ISOMORPHOUS SYSTEMSA Temperature - composition (T-X-Y) diagram of anisomorphous system is shown in Fig. 10.10. Here, theliquidus and solidus become surfaces bounding the L + αspace. Above the liquidus, all alloys are fully molten;below the solidus, all are completely solid. As in binarysystems, the two-phase region, L + α, is composed of tielines joining conjugate liquid and solid phases. In theternary system, however, the tie lines are not confined toa 2-D area but occur as a bundle of lines of varyingdirection, but all horizontal (isothermal), filling the 3-Dtwo-phase space.
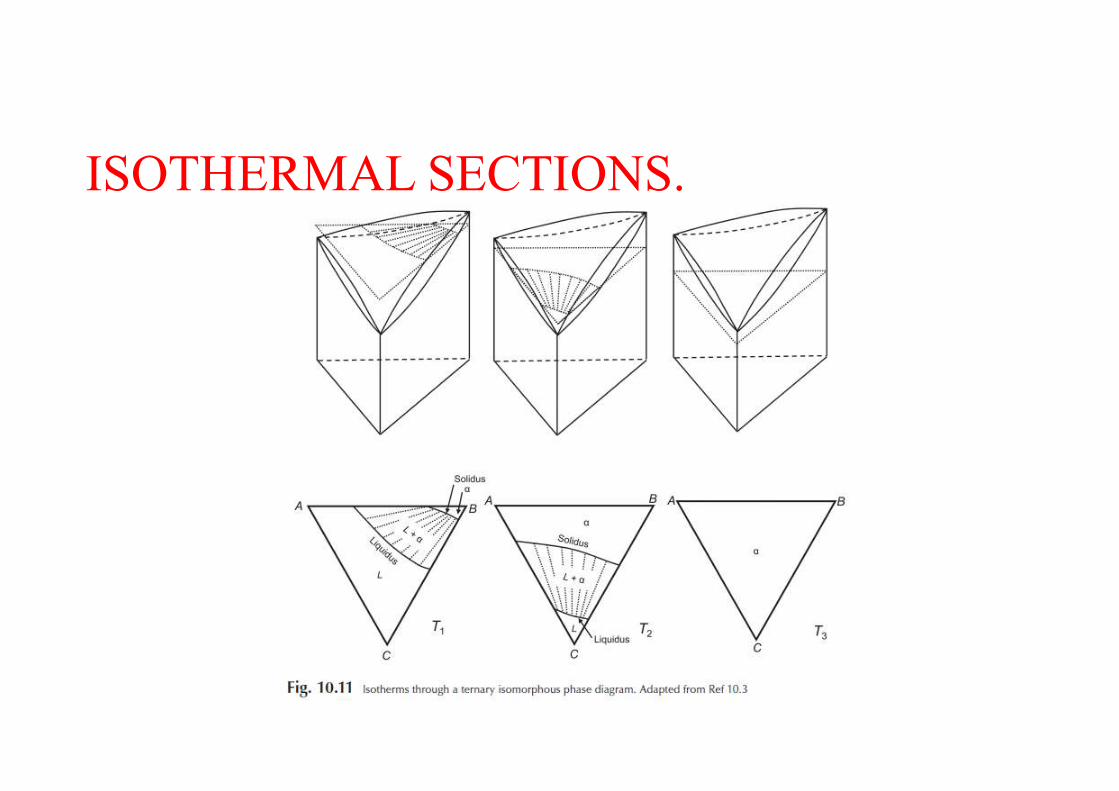
ISOTHERMAL SECTIONS.
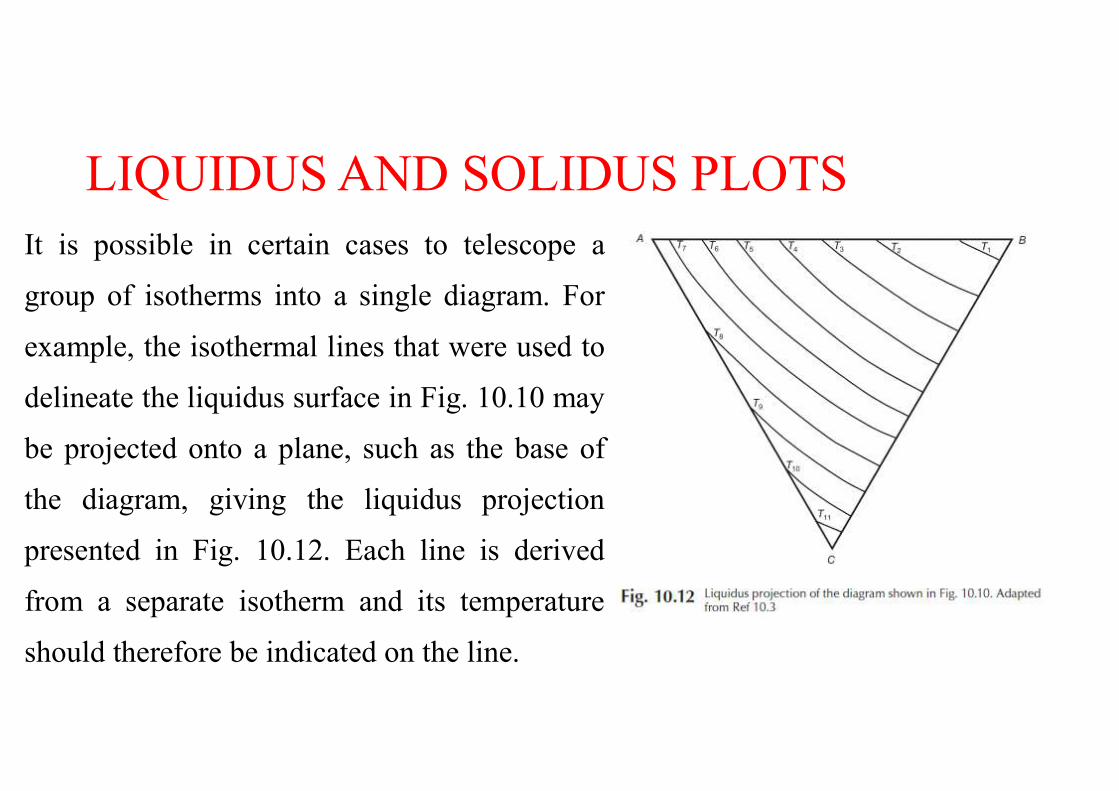
LIQUIDUS AND SOLIDUS PLOTS It is possible in certain cases to telescope agroup of isotherms into a single diagram. Forexample, the isothermal lines that were used todelineate the liquidus surface in Fig. 10.10 maybe projected onto a plane, such as the base ofthe diagram, giving the liquidus projectionpresented in Fig. 10.12. Each line is derivedfrom a separate isotherm and its temperatureshould therefore be indicated on the line.
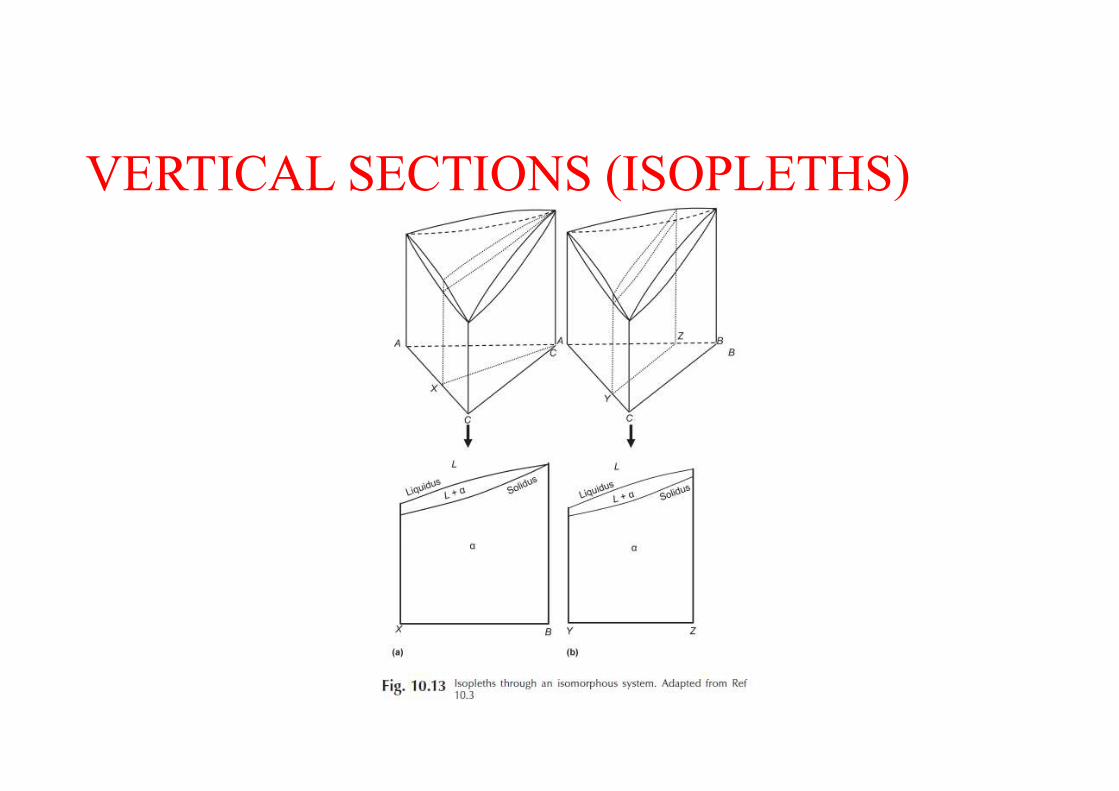
VERTICAL SECTIONS (ISOPLETHS)
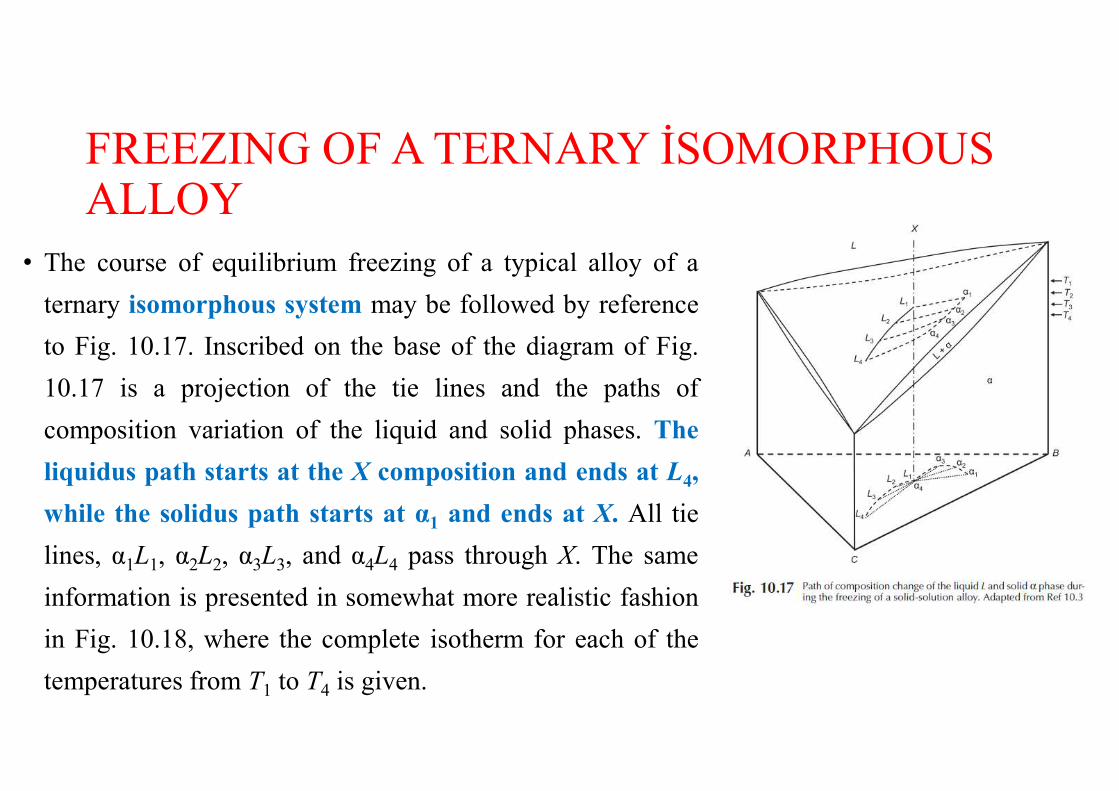
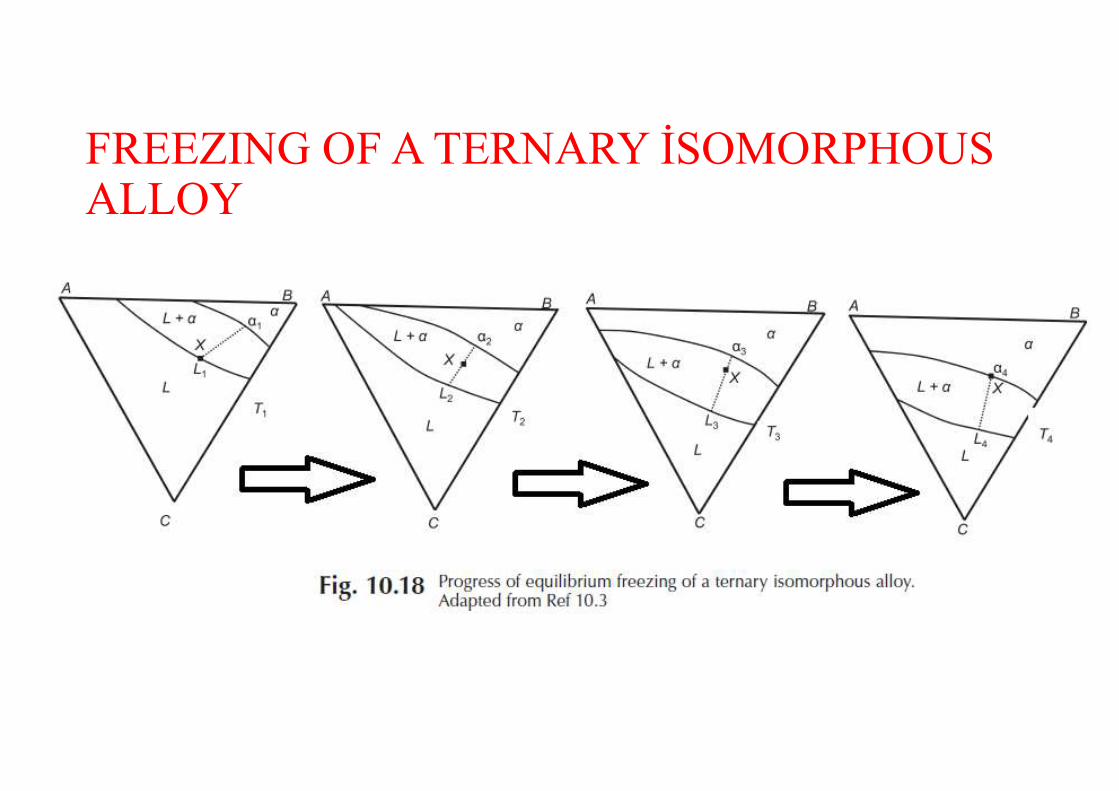
• The course of equilibrium freezing of a typical alloy of aternary isomorphous system may be followed by referenceto Fig. 10.17. Inscribed on the base of the diagram of Fig.10.17 is a projection of the tie lines and the paths ofcomposition variation of the liquid and solid phases. Theliquidus path starts at the X composition and ends at L4,while the solidus path starts at α1 and ends at X. All tielines, α1L1, α2L2, α3L3, and α4L4 pass through X. The sameinformation is presented in somewhat more realistic fashionin Fig. 10.18, where the complete isotherm for each of thetemperatures from T1 to T4 is given.
FREEZING OF A TERNARY İSOMORPHOUS ALLOY
FREEZING OF A TERNARY İSOMORPHOUS ALLOY
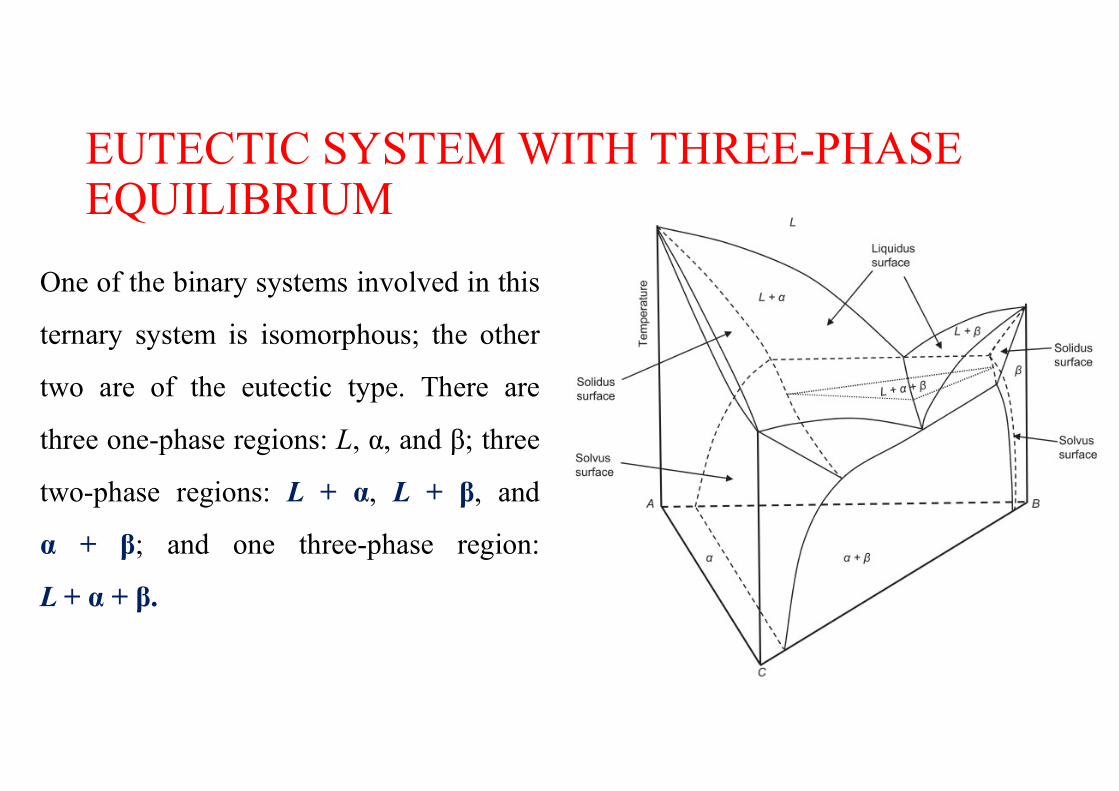
EUTECTIC SYSTEM WITH THREE-PHASE EQUILIBRIUMOne of the binary systems involved in thisternary system is isomorphous; the othertwo are of the eutectic type. There arethree one-phase regions: L, α, and β; threetwo-phase regions: L + α, L + β, andα + β; and one three-phase region:L + α + β.
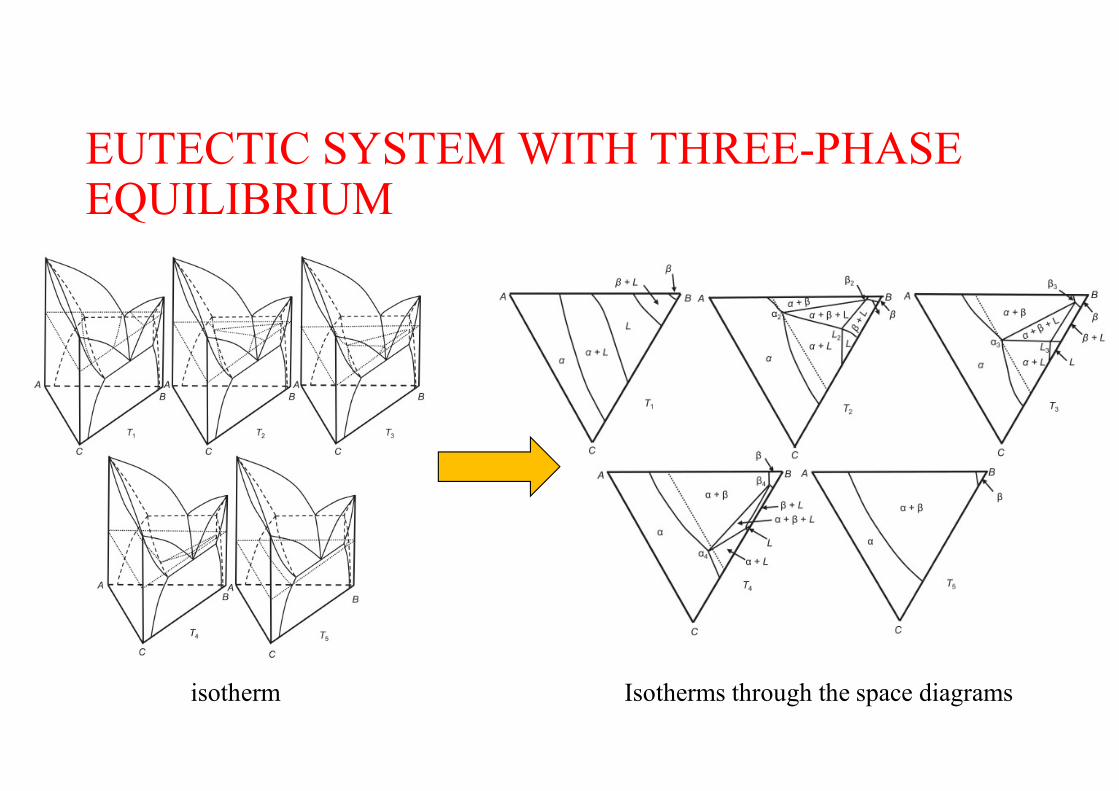
EUTECTIC SYSTEM WITH THREE-PHASE EQUILIBRIUM
isotherm Isotherms through the space diagrams
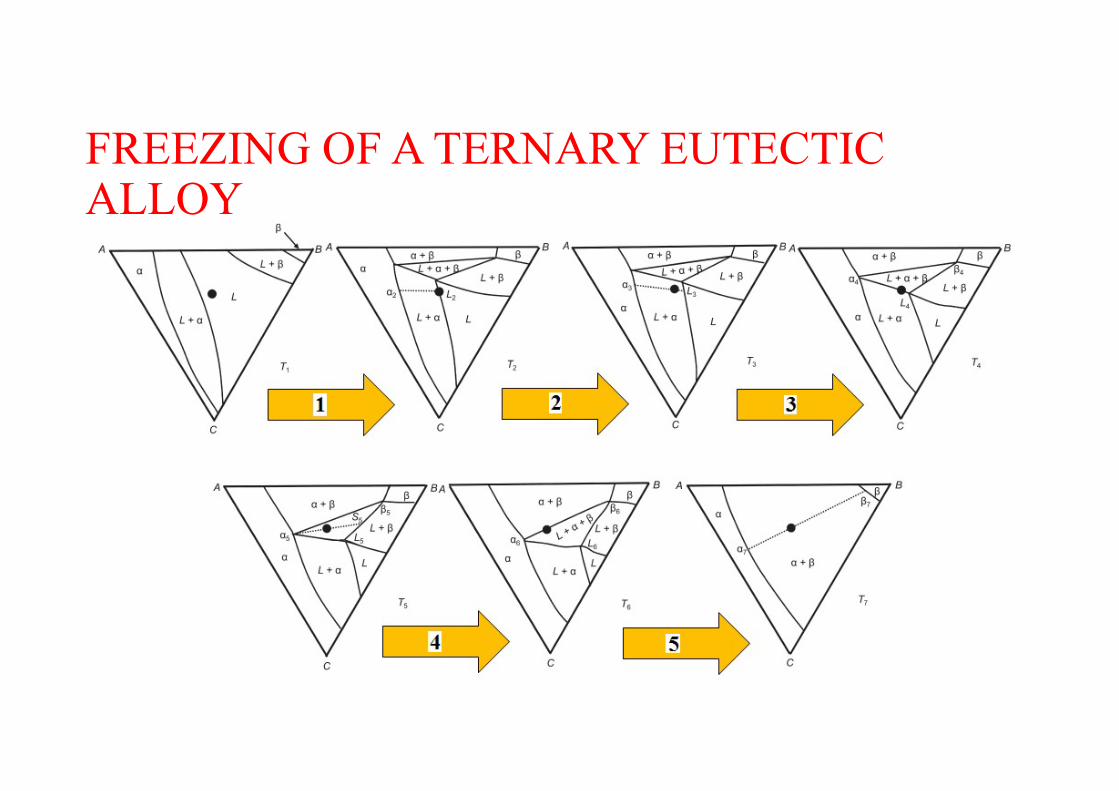
FREEZING OF A TERNARY EUTECTIC ALLOY
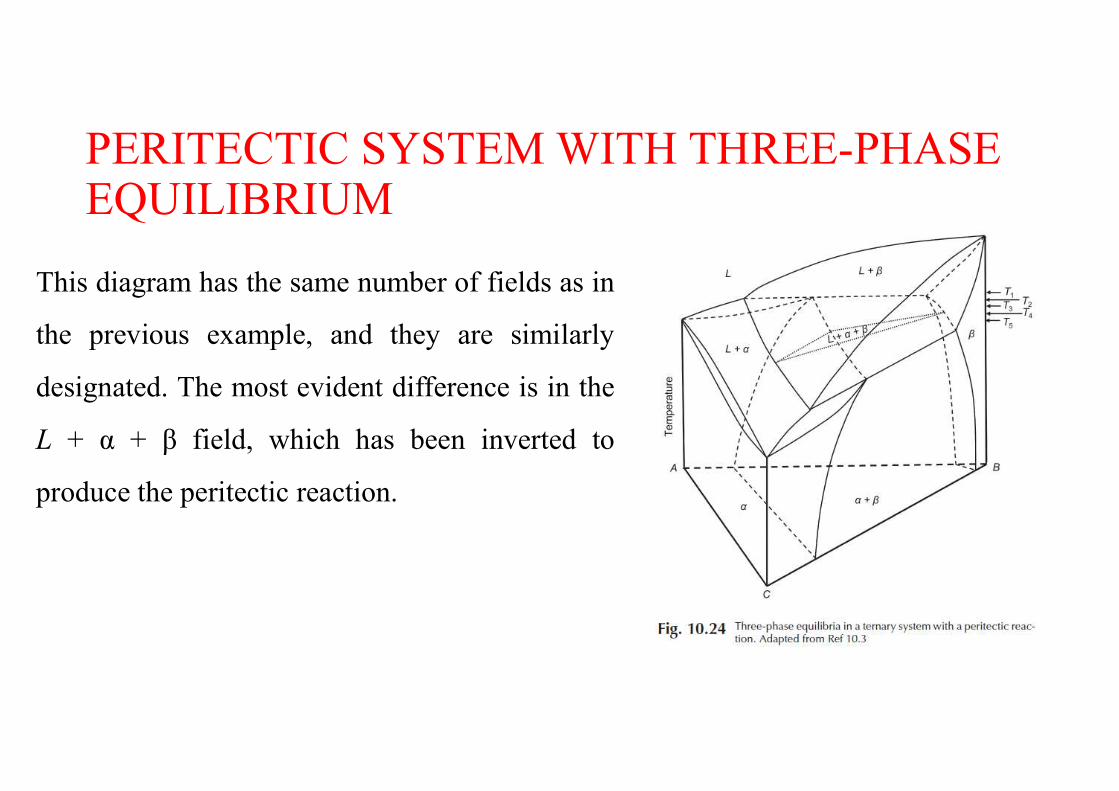
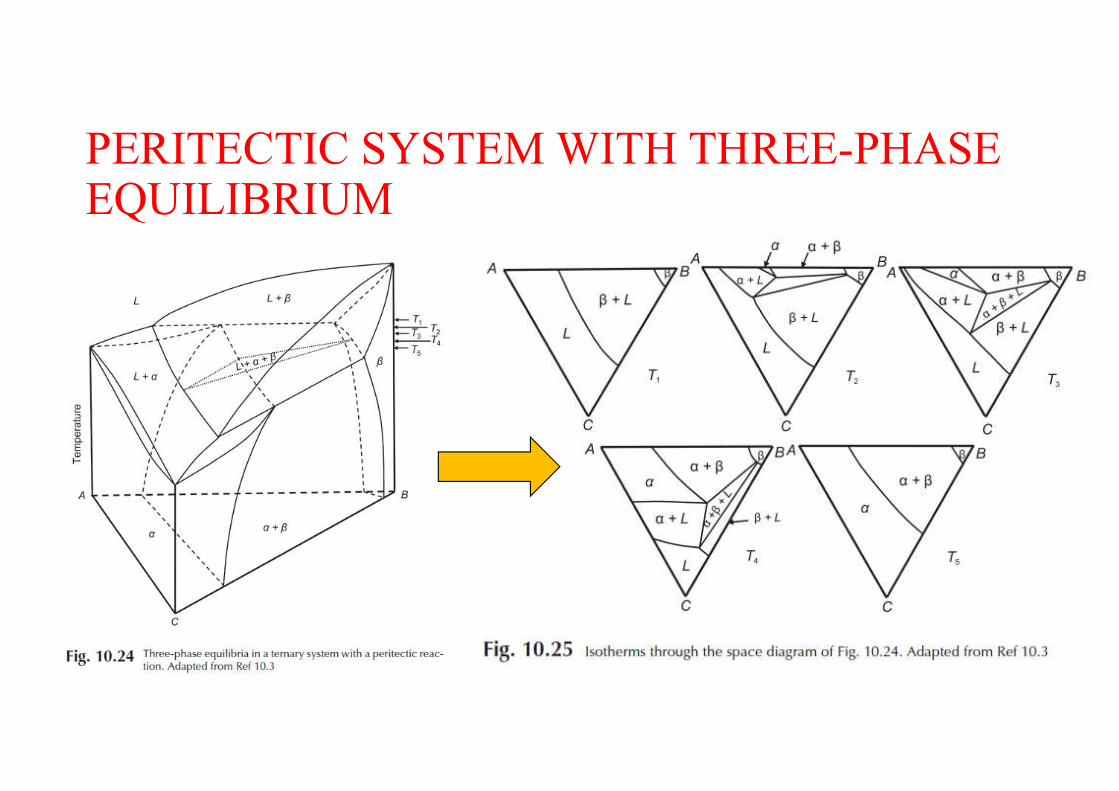
PERITECTIC SYSTEM WITH THREE-PHASE EQUILIBRIUMThis diagram has the same number of fields as inthe previous example, and they are similarlydesignated. The most evident difference is in theL + α + β field, which has been inverted toproduce the peritectic reaction.
PERITECTIC SYSTEM WITH THREE-PHASE EQUILIBRIUM
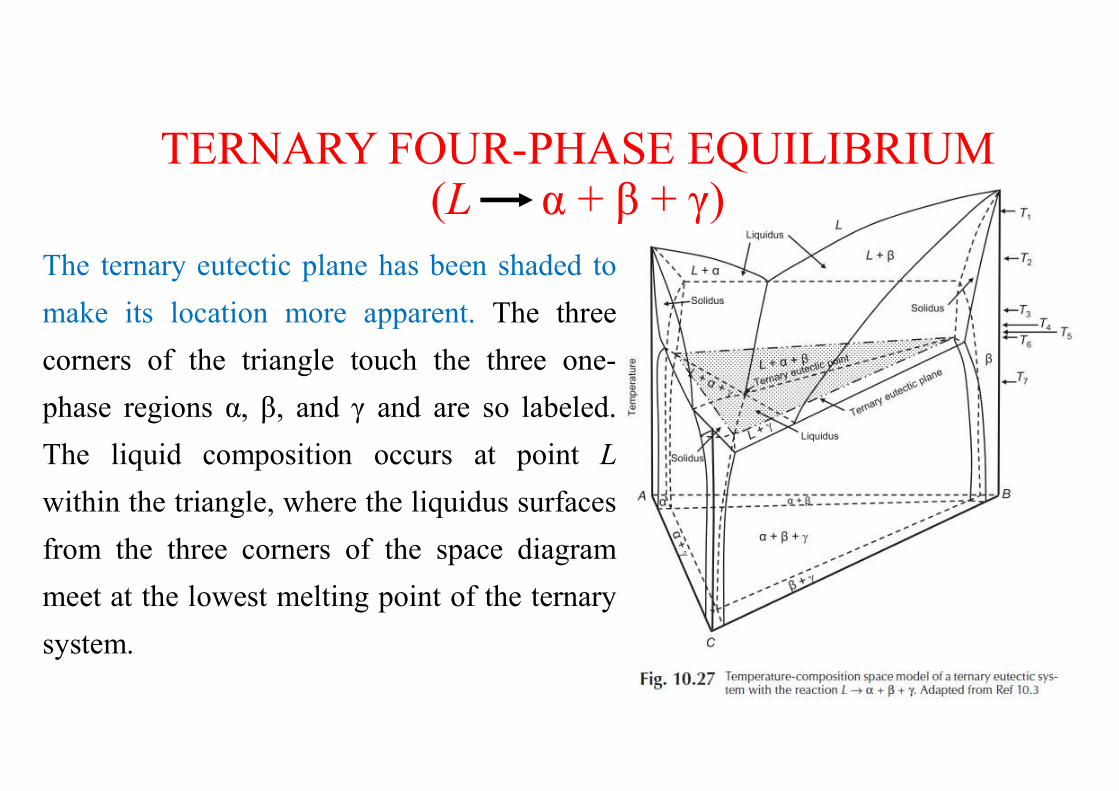
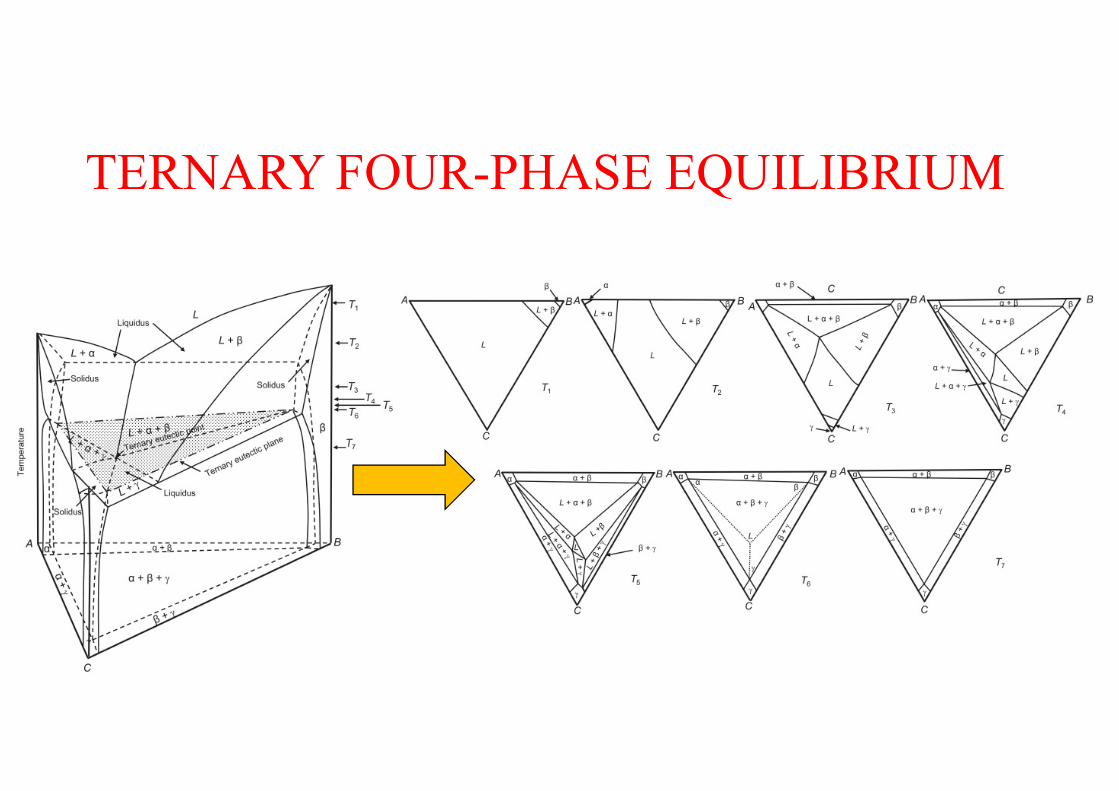
TERNARY FOUR-PHASE EQUILIBRIUM (L α + β + γ)The ternary eutectic plane has been shaded tomake its location more apparent. The threecorners of the triangle touch the three one-phase regions α, β, and γ and are so labeled.The liquid composition occurs at point Lwithin the triangle, where the liquidus surfacesfrom the three corners of the space diagrammeet at the lowest melting point of the ternarysystem.
TERNARY FOUR-PHASE EQUILIBRIUM
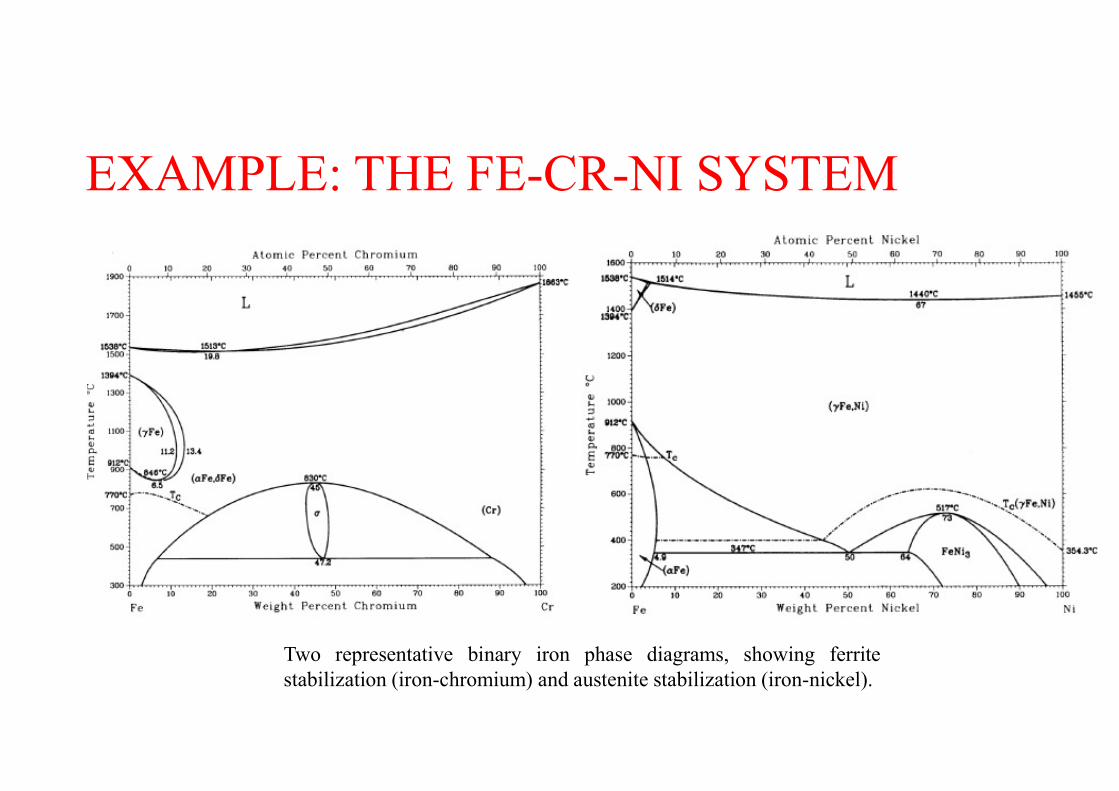
EXAMPLE: THE FE-CR-NI SYSTEM
Two representative binary iron phase diagrams, showing ferritestabilization (iron-chromium) and austenite stabilization (iron-nickel).
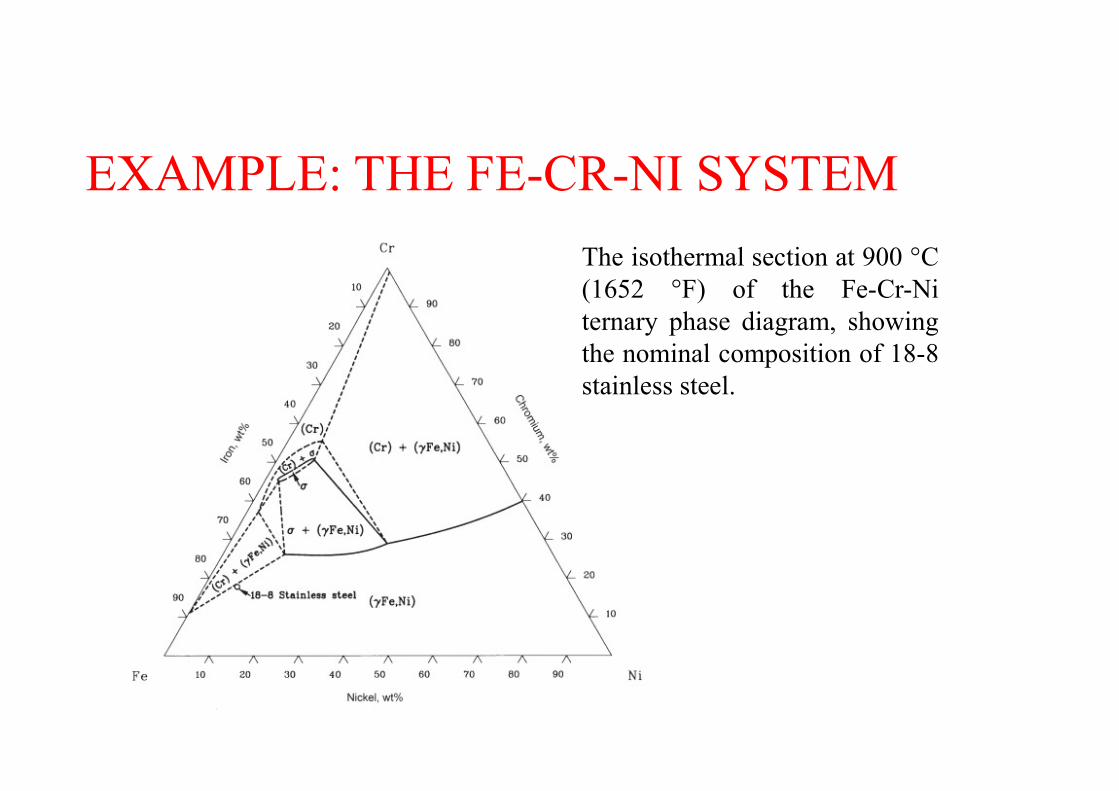
EXAMPLE: THE FE-CR-NI SYSTEMThe isothermal section at 900 °C(1652 °F) of the Fe-Cr-Niternary phase diagram, showingthe nominal composition of 18-8stainless steel.


