Embed Size (px)
Citation preview

Model 600A20
Echo® Monitoring Software
Installation and Operating Manual
For assistance with the operation of this product,
contact the PCB Piezotronics, Inc.
Toll-free: 800-959-446424-hour SensorLine: 716-684-0001
Fax: 716-684-3823E-mail: [email protected]
Web: www.imi-sensors.com
The information contained in this document supersedes all similar information that
may be found elsewhere in this manual. Service – Due to the sophisticated nature of the sensors and associated instrumentation provided by PCB Piezotronics, user servicing or repair is not recommended and, if attempted, may void the factory warranty. Routine maintenance, such as the cleaning of electrical connectors, housings, and mounting surfaces with solutions and techniques that will not harm the physical material of construction, is acceptable. Caution should be observed to ensure that liquids are not permitted to migrate into devices that are not hermetically sealed. Such devices should only be wiped with a dampened cloth and never submerged or have liquids poured upon them. Repair – In the event that equipment becomes damaged or ceases to operate, arrangements should be made to return the equipment to PCB Piezotronics for repair. User servicing or repair is not recommended and, if attempted, may void the factory warranty. Calibration – Routine calibration of sensors and associated instrumentation is recommended as this helps build confidence in measurement accuracy and acquired data. Equipment calibration cycles are typically established by the users own quality regimen. When in doubt about a calibration cycle, a good “rule of thumb” is to recalibrate on an annual basis. It is
also good practice to recalibrate after exposure to any severe temperature extreme, shock, load, or other environmental influence, or prior to any critical test. PCB Piezotronics maintains an ISO- 9001 certified metrology laboratory and offers calibration services, which are accredited by A2LA to ISO/IEC 17025, with full traceability to SI through N.I.S.T. In addition to the normally supplied calibration, special testing is also available, such as: sensitivity at elevated or cryogenic temperatures, phase response, extended high or low frequency response, extended range, leak testing, hydrostatic pressure testing, and others. For information on standard recalibration services or special testing, contact your local PCB Piezotronics distributor, sales representative, or factory customer service representative. Returning Equipment – Following these procedures will ensure that your returned materials are handled in the most expedient manner. Before returning any equipment to PCB Piezotronics, contact your local distributor, sales representative, or factory customer service representative to obtain a Return Warranty, Service, Repair, and Return Policies and Instructions Materials Authorization (RMA) Number. This RMA number should be clearly marked on the outside of all package(s) and on the packing
Service, Repair, and Return
Policies and Instructions

list(s) accompanying the shipment. A detailed account of the nature of the problem(s) being experienced with the equipment should also be included inside the package(s) containing any returned materials. A Purchase Order, included with the returned materials, will expedite the turn-around of serviced equipment. It is recommended to include authorization on the Purchase Order for PCB to proceed with any repairs, as long as they do not exceed 50% of the replacement cost of the returned item(s). PCB will provide a price quotation or replacement recommendation for any item whose repair costs would exceed 50% of replacement cost, or any item that is not economically feasible to repair. For routine calibration services, the Purchase Order should include authorization to proceed and return at current pricing, which can be obtained from a factory customer service representative. Contact Information – International customers should direct all inquiries to their local distributor or sales office. A
complete list of distributors and offices can be found at www.pcb.com. Customers within the United States may contact their local sales representative or a factory customer service representative. A complete list of sales representatives can be found at www.pcb.com. Toll-free telephone numbers for a factory customer service representative, in the division responsible for this product, can be found on the title page at the front of this manual. Our ship to address and general contact numbers are: PCB Piezotronics, Inc. 3425 Walden Ave. Depew, NY14043 USA Toll-free: (800) 828-8840 24-hour SensorLineSM: (716) 684-0001 Website: www.pcb.com
E-mail: [email protected]
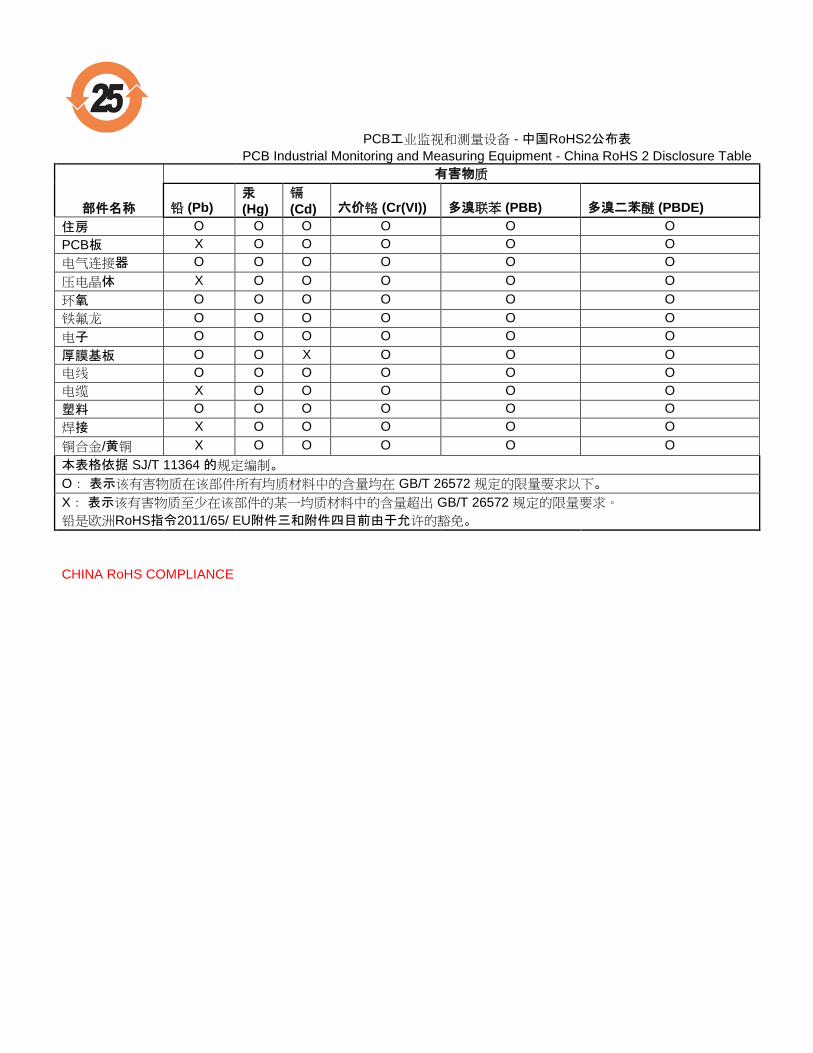
PCB工业监视和测量设备 - 中国RoHS2公布表
PCB Industrial Monitoring and Measuring Equipment - China RoHS 2 Disclosure Table
部件名称
有害物质
铅 (Pb) 汞
(Hg)
镉
(Cd) 六价铬 (Cr(VI)) 多溴联苯 (PBB) 多溴二苯醚 (PBDE)
住房 O O O O O O
PCB板 X O O O O O
电气连接器 O O O O O O
压电晶体 X O O O O O
环氧 O O O O O O
铁氟龙 O O O O O O
电子 O O O O O O
厚膜基板 O O X O O O
电线 O O O O O O
电缆 X O O O O O
塑料 O O O O O O
焊接 X O O O O O
铜合金/黄铜 X O O O O O
本表格依据 SJ/T 11364 的规定编制。
O: 表示该有害物质在该部件所有均质材料中的含量均在 GB/T 26572 规定的限量要求以下。
X: 表示该有害物质至少在该部件的某一均质材料中的含量超出 GB/T 26572 规定的限量要求。
铅是欧洲RoHS指令2011/65/ EU附件三和附件四目前由于允许的豁免。
CHINA RoHS COMPLIANCE
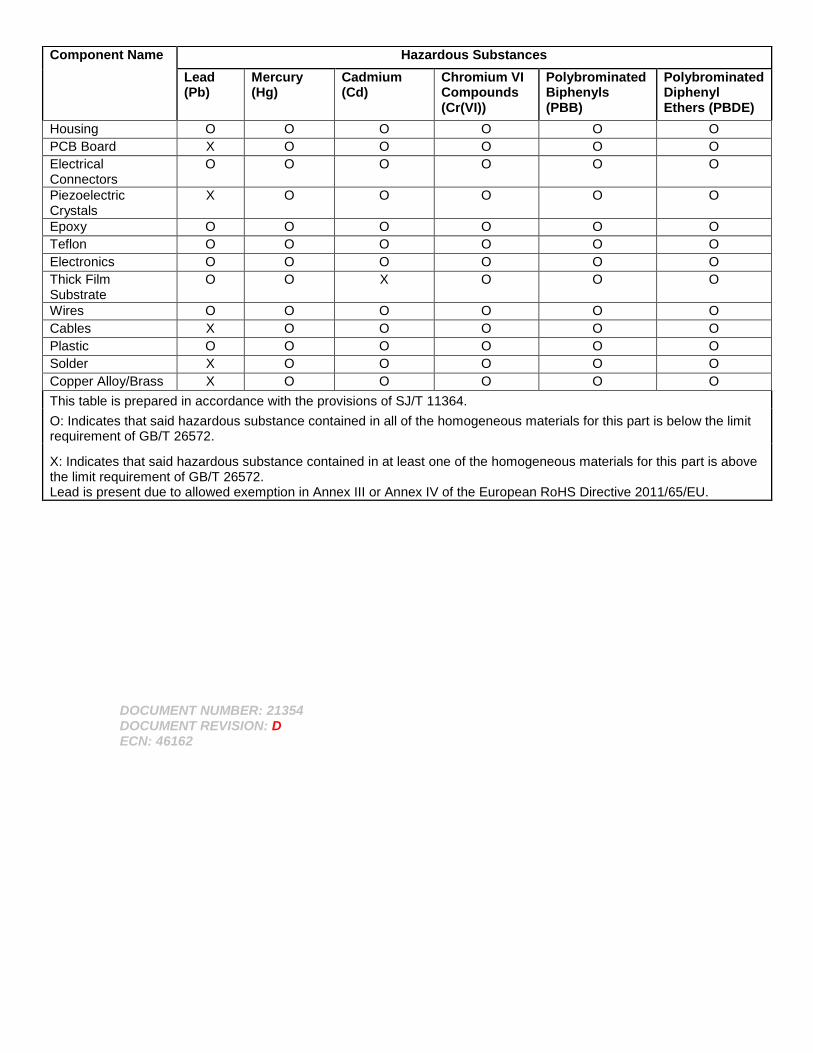
DOCUMENT NUMBER: 21354 DOCUMENT REVISION: D ECN: 46162
Component Name Hazardous Substances
Lead (Pb)
Mercury (Hg)
Cadmium (Cd)
Chromium VI Compounds (Cr(VI))
Polybrominated Biphenyls (PBB)
Polybrominated Diphenyl Ethers (PBDE)
Housing O O O O O O
PCB Board X O O O O O
Electrical Connectors
O O O O O O
Piezoelectric Crystals
X O O O O O
Epoxy O O O O O O
Teflon O O O O O O
Electronics O O O O O O
Thick Film Substrate
O O X O O O
Wires O O O O O O
Cables X O O O O O
Plastic O O O O O O
Solder X O O O O O
Copper Alloy/Brass X O O O O O
This table is prepared in accordance with the provisions of SJ/T 11364.
O: Indicates that said hazardous substance contained in all of the homogeneous materials for this part is below the limit requirement of GB/T 26572.
X: Indicates that said hazardous substance contained in at least one of the homogeneous materials for this part is above the limit requirement of GB/T 26572. Lead is present due to allowed exemption in Annex III or Annex IV of the European RoHS Directive 2011/65/EU.

Echo® Monitoring Software User’s Manual
Models 600A20, Manual #64448, Rev. NR, ECO 45504 v4.0.0 9-24-2015
1
Echo® Monitoring Software User’s
Manual
Echo® Monitoring Software User’s Manual
Models 600A20, Manual #64448, Rev. NR, ECO 45504 v4.0.0 9-24-2015
2
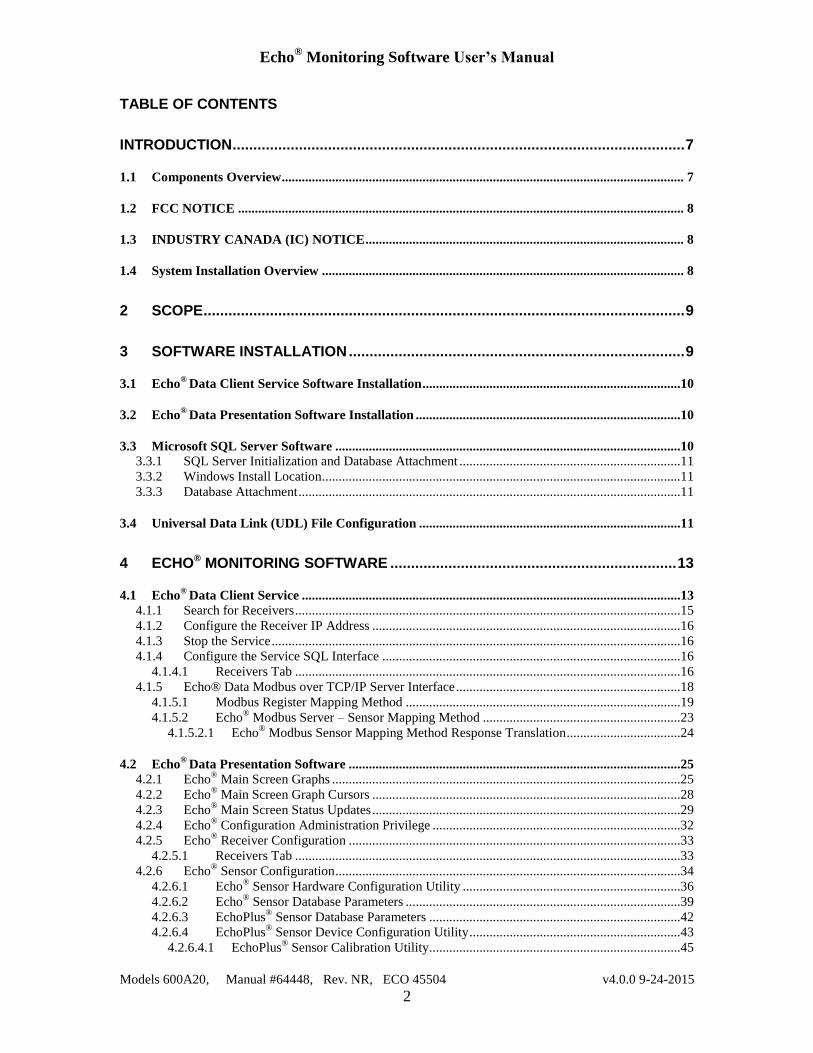
TABLE OF CONTENTS
INTRODUCTION ............................................................................................................. 7
1.1 Components Overview ........................................................................................................................ 7
1.2 FCC NOTICE ..................................................................................................................................... 8
1.3 INDUSTRY CANADA (IC) NOTICE ............................................................................................... 8
1.4 System Installation Overview ............................................................................................................ 8
2 SCOPE .................................................................................................................... 9
3 SOFTWARE INSTALLATION ................................................................................. 9
3.1 Echo®
Data Client Service Software Installation .............................................................................10
3.2 Echo®
Data Presentation Software Installation ...............................................................................10
3.3 Microsoft SQL Server Software .......................................................................................................10 3.3.1 SQL Server Initialization and Database Attachment ..................................................................11 3.3.2 Windows Install Location...........................................................................................................11 3.3.3 Database Attachment ..................................................................................................................11
3.4 Universal Data Link (UDL) File Configuration ..............................................................................11
4 ECHO® MONITORING SOFTWARE ..................................................................... 13
4.1 Echo®
Data Client Service .................................................................................................................13 4.1.1 Search for Receivers ...................................................................................................................15 4.1.2 Configure the Receiver IP Address ............................................................................................16 4.1.3 Stop the Service ..........................................................................................................................16 4.1.4 Configure the Service SQL Interface .........................................................................................16
4.1.4.1 Receivers Tab ...................................................................................................................16 4.1.5 Echo® Data Modbus over TCP/IP Server Interface ...................................................................18
4.1.5.1 Modbus Register Mapping Method ..................................................................................19 4.1.5.2 Echo
® Modbus Server – Sensor Mapping Method ...........................................................23
4.1.5.2.1 Echo® Modbus Sensor Mapping Method Response Translation ..................................24
4.2 Echo®
Data Presentation Software ...................................................................................................25 4.2.1 Echo
® Main Screen Graphs ........................................................................................................25
4.2.2 Echo® Main Screen Graph Cursors ............................................................................................28
4.2.3 Echo® Main Screen Status Updates ............................................................................................29
4.2.4 Echo® Configuration Administration Privilege ..........................................................................32
4.2.5 Echo® Receiver Configuration ...................................................................................................33
4.2.5.1 Receivers Tab ...................................................................................................................33 4.2.6 Echo
® Sensor Configuration .......................................................................................................34
4.2.6.1 Echo® Sensor Hardware Configuration Utility .................................................................36
4.2.6.2 Echo® Sensor Database Parameters ..................................................................................39
4.2.6.3 EchoPlus® Sensor Database Parameters ...........................................................................42
4.2.6.4 EchoPlus® Sensor Device Configuration Utility ...............................................................43
4.2.6.4.1 EchoPlus® Sensor Calibration Utility...........................................................................45
Echo® Monitoring Software User’s Manual
Models 600A20, Manual #64448, Rev. NR, ECO 45504 v4.0.0 9-24-2015
3
4.2.7 Importing Echo® Sensor Configurations from Excel .................................................................47
4.2.8 Echo® Sensor Data Display Preferences.....................................................................................50
4.2.9 Determining Echo® Alarm Levels ..............................................................................................55
4.2.9.1 Echo® Alarm Generation Utility .......................................................................................55
4.2.9.1.1 Alarm Generation Tab ..................................................................................................55 4.2.9.1.2 Customizing the Sensor List ........................................................................................59 4.2.9.1.3 Alarm Generation - Selected Channel Data Tab ..........................................................62 4.2.9.1.4 Alarm Generation - Selected Channel Alarms Tab ......................................................63
4.2.9.2 Echo® Alarm Templates ...................................................................................................64
4.2.9.3 Echo® Alarm Email Notifications .....................................................................................65
4.2.10 Sensor Transmission Reliability Utility .................................................................................68 4.2.11 Export Sensor Data ................................................................................................................71 4.2.12 Other Main Screen Functions ................................................................................................72
4.2.12.1 Receiver Connection Parameters ......................................................................................72 4.2.12.2 Setting the Receiver IP Address........................................................................................74 4.2.12.3 Live Data Screen ...............................................................................................................76 4.2.12.4 Accessing other functions and screens ..............................................................................78
4.2.12.4.1 Historical Data Screen ................................................................................................78 4.2.12.4.1.1 Maintaining Transmission Records .....................................................................79 4.2.12.4.1.2 Saving Transmission Records to a File ...............................................................81 4.2.12.4.1.3 Print Transmission Records ................................................................................81 4.2.12.4.1.4 Transfer Transmission Records to a Replacement Sensor ..................................81 4.2.12.4.1.5 Trend Plot Display Screen...................................................................................82
4.2.12.4.2 Sensor Status Screen ...................................................................................................86 4.2.13 System Level Alarm & Status Screens ..................................................................................88
4.2.13.1 System Alarm Screen ........................................................................................................89 4.2.13.1.1 Channel Alarm Dialog Screen ....................................................................................90 4.2.13.1.2 Alarm Status Screen Reports ......................................................................................92
4.2.13.2 System Sensor Status Screen ............................................................................................93 4.2.13.3 Echo System Overview Screen .........................................................................................94
4.2.14 Database Merge Utility ..........................................................................................................95 4.2.14.1 Compare Sensor Definitions .............................................................................................96 4.2.14.2 New Transmission Update ................................................................................................97
5 MICROSOFT SQL SERVER 2005 EXPRESS INSTALLATION ............................ 98
5.1 Database Attachment Instructions for Microsoft SQL Server 2005 Express .............................106
6 CREATE A FILE DSN ODBC CONNECTION ..................................................... 113
6.1 Create an EchoUser account in the EchoSQLData database .......................................................113
6.2 Part 2 – create a File DSN ODBC file on the client PC ................................................................124
Table of Figures Figure 1 – Universal Data Link (UDL) File Definition Utility ........................................ 12 Figure 2 – Universal Data Link – SQL Database connection success .............................. 12 Figure 3 – PCB Echo
® Data Service selected in the Services window ............................ 14
Figure 4 –PCB Echo® Notify utility icon in the notification tray ..................................... 14
Figure 5 – PCB Echo® Notify Window ............................................................................ 14
Figure 6 – PCB Echo® Data Service Status Window Menu options ................................ 15
Figure 7 – PCB Echo® Receiver Discovery Tool Window .............................................. 16
Echo® Monitoring Software User’s Manual
Models 600A20, Manual #64448, Rev. NR, ECO 45504 v4.0.0 9-24-2015
4
Figure 8 – PCB Echo® Receiver Configuration Window ................................................. 17
Figure 9 – PCB Echo® Data Service Configuration for Modbus ..................................... 18
Figure 10 –Modbus Register Assignment Screen ............................................................. 20 Figure 11 –Modbus Register Assignment Screen – Filtered ............................................ 21
Figure 12 –Restarting the PCB Echo®
Data Monitor Service ........................................... 22 Figure 13 –Modbus Configuration Screen – Sensor Mapping Method ............................ 23 Figure 14 –Modbus Sensor Mapping Method Request/Response Diagram ..................... 24 Figure 15 –Modbus Sensor Mapping Method Response Translation Table..................... 24 Figure 16 - PCB Echo
® Data Presentation Main Screen – Link graph scaling & cursors 25
Figure 17 - PCB Echo®
Data Presentation Main Screen .................................................. 26 Figure 18 - PCB Echo
® Data Presentation Main Screen Zoom ........................................ 26
Figure 19 - PCB Echo®
Data Presentation Main Screen with enlarged graph ................. 27 Figure 20 - PCB Echo
® Data Presentation Main Screen Menu bar Zoom options .......... 27
Figure 21 - PCB Echo®
Data Presentation Main Screen Show Cursor option enabled .... 28 Figure 22 - PCB Echo
® Data Presentation Main Screen with tracking cursors................ 29
Figure 23 – PCB Echo®
Data Display Preferences Screen ............................................... 30 Figure 24 – Context Help window when cursor is on the Sensor Tree ............................ 30
Figure 25 – PCB Echo®
Main Screen showing status indications .................................... 31 Figure 26 – Main Screen Sensor Tree Short Cut Menu .................................................... 31 Figure 27 – Administration Log in Dialog window.......................................................... 32
Figure 28 – Echo® Monitoring Receiver Configuration Menu Option ............................ 33
Figure 29 – Echo® Monitoring Sensor Configuration Menu Option ................................ 34
Figure 30 – Echo® add sensor dialog ................................................................................ 34
Figure 31 – 670A01 Echo® Sensor Parameter Editor Screen ........................................... 35
Figure 32 – Echo® Connection Menu item ....................................................................... 36
Figure 33 – Echo® Configuration Utility .......................................................................... 37
Figure 34 – Echo® Configuration Utility Connected ........................................................ 38
Figure 35 – Echo® Wizard Sensor Parameter Editor ........................................................ 39
Figure 36 – Set alarm values from a template .................................................................. 40
Figure 37 – Echo® Database Update Complete Dialog .................................................... 41
Figure 38 – Echo® Plus Sensor Parameter Editor ............................................................. 42
Figure 39 – EchoPlus®
Configuration Utility ................................................................... 44 Figure 40 – EchoPlus
® Configuration Utility Connected ................................................. 44
Figure 41 – EchoPlus®
Configuration Utility Update....................................................... 45 Figure 42 – EchoPlus
® Configuration Utility Menu Options ........................................... 45
Figure 43 – EchoPlus®
Configuration Utility Calibration Factor Calculator ................... 46 Figure 44 – Import Echo
® Sensor Definitions from an Excel Spreadsheet ...................... 47
Figure 45 – Import Echo® Alarm Templates from an Excel Spreadsheet ........................ 47
Figure 46 – Echo® Import Sensor Definitions from Excel Dialog screen ........................ 48
Figure 47 – Echo® Import Alarm Templates from Excel Dialog screen .......................... 48
Figure 48 – Echo® Add Alarm Templates Dialog ............................................................ 49
Figure 49 – Echo® Plus Sensor Parameter Editor ............................................................. 49
Figure 50 – Echo® Main Screen Menu options – Data Display Preferences .................... 50
Figure 51 – Echo® Data Display Preferences Screen ....................................................... 50
Figure 52 – Echo® Data Display Preferences Screen before change ................................ 51
Figure 53 – Echo® Data Display Preferences Screen after change ................................... 52
Echo® Monitoring Software User’s Manual
Models 600A20, Manual #64448, Rev. NR, ECO 45504 v4.0.0 9-24-2015
5
Figure 54 – Echo® Data Display Preferences Screen Refresh Tab items ......................... 53
Figure 55 – Echo® Alarm Generation Screen ................................................................... 55
Figure 56 – Echo® Alarm Generation Screen with multiple sensors selected .................. 56
Figure 57 – Echo® Alarm Generation Utility, Edit data set. ............................................. 57
Figure 58 – Echo® Alarm Generation Utility, Edit Averaged Data dialog ....................... 57
Figure 59 – Echo Alarm Utility, Post edit operation ........................................................ 58 Figure 60 – Echo Alarm Utility, Alarm Set Example ....................................................... 58 Figure 61 – Echo Alarm Utility, Alarm Type Setting ...................................................... 59 Figure 62 – Echo Alarm Utility menu bar items............................................................... 59
Figure 63 – Echo Alarm Utility, Set Alarms Action ........................................................ 59 Figure 64 – Echo Alarm Utility, Custom Sensor Query ................................................... 60 Figure 65 – Echo Alarm Utility, modified sensor list ....................................................... 61 Figure 66 – Echo Alarm Utility, Selected Channel Data tab ............................................ 62
Figure 67 – Echo Alarm Utility, Selected Channel Alarm Tab ........................................ 63 Figure 68 – Echo Alarm Utility, Create a New Template ................................................ 64
Figure 69 – Echo® Main Screen Menu Options – Edit Alarm Templates ........................ 64
Figure 70 – Echo® Edit Alarm Templates Screen ............................................................ 65
Figure 71 –Editing Alarm Templates Example ................................................................ 65 Figure 72 – Echo
® Main Screen Menu Options – Alarm Email Notifications ................. 66
Figure 73 – Echo® Alarm Email Notification configuration screen ................................. 66
Figure 74 – Echo® Sensor Transmission Reliability Utility – Selected Sensor Tab ........ 68
Figure 75 – Echo® Sensor Transmission Reliability Utility – Reliability tab icons ......... 69
Figure 76 – Echo® Sensor Transmission Reliability Utility – Associated Junction Box
Channels Tab .................................................................................................................... 70 Figure 77 – Echo
® Sensor Transmission Reliability Utility – Reliability Overview Tab 70
Figure 78 – Echo® Sensor Data Export Utility Screen ..................................................... 71
Figure 79 – Echo® Receiver Connections ......................................................................... 72
Figure 80 – Echo® Receiver Connections ......................................................................... 72
Figure 81 – Echo® Receiver Utility Menu Items .............................................................. 73
Figure 82 – Echo® Receiver Discovery Utility ................................................................. 73
Figure 83 – Echo® Receiver IP determination using the serial port ................................. 74
Figure 84 – Echo® Receiver IP Address Utility Select ..................................................... 74
Figure 85 – Echo® Receiver IP Address Configuration Utility – Dynamic Example ...... 75
Figure 86 – Echo® Receiver IP Address Configuration Utility – Static Example ............ 76
Figure 87 – Echo® Receiver Live data screen .................................................................. 76
Figure 88 – Echo® Receiver Client Screen with a Receiver Connection ......................... 77
Figure 89 – Echo® Receiver Client Screen Log File Controls ......................................... 77
Figure 90 – Main Screen Sensor Tree Short Cut Menu to other Screens and Functions . 78
Figure 91 – Echo® Historical Sensor Data Screen ............................................................ 79
Figure 92 – Echo® Historical Sensor Data Screen Menu bar ........................................... 79
Figure 93 – Echo® Sensor Transmission Maintenance Screen ......................................... 80
Figure 94 – Echo® Transfer data to a replacement sensor Screen .................................... 82
Figure 95 – Echo® Sensor Data Trend Screen .................................................................. 82
Figure 96 – Echo® Sensor Data Trend Screen Data Selection Fields ............................... 83
Figure 97 – Echo® Sensor Data Trend Screen Graph Tools ............................................. 84
Figure 98 – Echo® Sensor Data Trend Screen Menu bar options ..................................... 84
Echo® Monitoring Software User’s Manual
Models 600A20, Manual #64448, Rev. NR, ECO 45504 v4.0.0 9-24-2015
6
Figure 99 – Echo® Change Alarm Level Dialog Screen ................................................... 85
Figure 100 – Echo® Change Alarm Confirmation ............................................................ 85
Figure 101 – Echo® Data Deletion utility screen .............................................................. 86
Figure 102 – Echo® Sensor Status Screen - Replace Battery ........................................... 87
Figure 103 – Echo® Sensor Status Screen - Replace Battery Soon .................................. 87
Figure 104 – Echo® Sensor Status Screen Menu Bar Options.......................................... 88
Figure 105 – Echo® System View Options ....................................................................... 88
Figure 106 – Echo® Alarm Status Screen – Summary Tab .............................................. 89
Figure 107 – Echo® Alarm Status Screen – Detail Tab .................................................... 90
Figure 108 – Echo® Channel Alarm Dialog ..................................................................... 91
Figure 109 – Echo® Channel Alarm Dialog Menu Bar Items ......................................... 92
Figure 110 – Echo® Alarm Status Screen Menu Bar ........................................................ 92
Figure 111 – Echo® Last Measurement Report Preview Screen ...................................... 93
Figure 112 – Echo® System View – Sensor Status Screen ............................................... 93
Figure 113 – Echo® System View – Echo System Overview Screen ............................... 94
Figure 114 – Echo® System View – Echo System Overview Screen information ........... 95
Figure 115 – Echo® Main Screen – Tools menu option ................................................... 95
Figure 116 – Echo® Database Merge Utility .................................................................... 96
Figure 117 – Echo® Database Merge Utility – Sensor definition mismatch dialog ......... 96
Figure 118 – Echo® Database Merge Utility – Transmission Update Dialog .................. 97
Figure 119 – Echo® Database Merge Utility – Confirmation Dialog ............................... 97
Figure 120 Microsoft License Agreement ........................................................................ 98
Figure 121 Microsoft SQL Component Installer Dialog .................................................. 99 Figure 122 Microsoft Component Installer Success Dialog ............................................. 99 Figure 123 Microsoft SQL Server Installer Dialog ........................................................ 100
Figure 124 Microsoft SQL Server Installer Success Dialog ........................................... 100
Figure 125 Microsoft SQL Server Registration Dialog .................................................. 101 Figure 126 Microsoft SQL Server Feature Selection Dialog .......................................... 101 Figure 127 Microsoft SQL Server Authentication Mode Selection Dialog ................... 102
Figure 128 Microsoft SQL Server User Account Setup Dialog ..................................... 103 Figure 129 Microsoft SQL Server Usage Report Selection Dialog ................................ 103
Figure 130 Microsoft SQL Server Ready to Install Dialog ............................................ 104 Figure 131 Microsoft SQL Server Installation Progress Dialog ..................................... 104
Figure 132 Microsoft SQL Server Installation Failure Dialog ....................................... 105 Figure 133 Microsoft SQL Server Installation Complete Dialog ................................... 106 Figure 134 Launch Microsoft SQL Server ..................................................................... 106 Figure 135 – SQL Server Connection Dialog ................................................................. 106 Figure 136 – SQL Server Database Attachment Dialog ................................................. 107
Figure 137 – SQL Server Database File Attachment Screen .......................................... 108 Figure 138 – SQL Server Surface Area Configuration Utility Main Screen .................. 109
Figure 139 – SQL Server Surface Area Configuration Utility Admin Assignment Rights
......................................................................................................................................... 109 Figure 140 – SQL Server Echo Database Selection ....................................................... 110 Figure 141 – SQL Server Attachment Screen with Echo Database selected .................. 111 Figure 142 – SQL Server with Echo Database Attached ................................................ 112
Echo® Monitoring Software User’s Manual
Models 600A20, Manual #64448, Rev. NR, ECO 45504 v4.0.0 9-24-2015
7
1 Introduction The Echo
® Wireless Vibration System is used for unattended predictive maintenance and
condition monitoring of plant equipment. Echo®
Wireless Vibration Sensors and
EchoPlus®
Wireless Junction Boxes activate automatically on a user defined schedule to
capture and transmit vibration data wirelessly to one or more Echo®
Receivers. The
receivers, in turn, are connected by a wired Ethernet network to the Echo®
Data Client
Service Software running on a server or PC collecting and saving the transmissions to an
SQL database (model 600A20). The Echo®
Data Client Service also has a Modbus
interface The SQL interface is not required if only the Modbus function is to be used. If
the SQL interface is active the vibration data are stored in the database and compared
against alarm values. Machinery status is displayed in an alarm panel, and alarm
notifications sent via email if desired. The data can be viewed, reported, and trended
using the Echo®
Data Presentation Software.
This manual is intended to assist users with the installation of the Echo® Monitoring
Software package that includes model 600A20 Echo® Data Client Service Software and
Echo® Presentation Software. Specific instructions for System Installation, Echo
®
Wireless Vibration Sensors, EchoPlus®
Wireless Junction Boxes, and Echo®
Receivers
can be found in their respective manuals.
1.1 Components Overview
The Echo® Wireless Vibration
System consists of the following components;
Single channel Echo® Wireless Vibration Sensors
8-channel EchoPlus® Wireless Junction Box
Echo® Receiver (Echo Sensor Data server-Ethernet Interface)
MS Windows Based PC or Laptop with
o Windows 7 Operating System
o Model 600A20 Echo®
Monitoring Software
Echo®
Data Client Service Software (runs as Windows Service)
with an SQL interface and a Modbus interface.
Echo®
Data Presentation Software
o Microsoft SQL Server 2005 or 2008 Database software
Echo®
Database (EchoSQLData.mdf)

Echo® Monitoring Software User’s Manual
Models 600A20, Manual #64448, Rev. NR, ECO 45504 v4.0.0 9-24-2015
8
1.2 FCC NOTICE
FCC ID: ZOC-IMI673A01
This device complies with part 15 of the FCC Rules. Operation is subject to the following
two conditions: (1) This device may not cause harmful interference, and (2) this device
must accept any interference received, including interference that may cause undesired
operation.
Changes or modifications not expressly approved by the party responsible for compliance
could void the user's authority to operate the equipment.
This equipment has been tested and found to comply with the limits for a Class A digital
device, pursuant to part 15 of the FCC Rules. These limits are designed to provide
reasonable protection against harmful interference when the equipment is operated in a
commercial environment. This equipment generates, uses, and can radiate radio
frequency energy and, if not installed and used in accordance with the instruction manual,
may cause harmful interference to radio communications. Operation of this equipment in
a residential area is likely to cause harmful interference in which case the user will be
required to correct the interference at his own expense.
1.3 INDUSTRY CANADA (IC) NOTICE
IC: 9732A-IMI673A01
Operation is subject to the following two conditions: (1) this device may not cause
interference, and (2) this device must accept any interference, including interference that
may cause undesired operation of the device.
1.4 System Installation Overview
The typical system installation will be integrated into a company’s industrial LAN to
ensure the receiver and PC’s can communicate freely over Ethernet. This configuration
would consist of:
Echo® Wireless Vibration
Sensor(s) and/or EchoPlus
® Wireless Junction Box(s)
Echo® Receiver(s).
Dedicated PC or Server running 24/7 with a TCP/IP Ethernet interface to host the
SQL database and Echo®
Data Client Service Software with SQL and/or Modbus
interfaces.
Echo®
Data Presentation Software - required to configure sensors and also to view
SQL data if the SQL interface is enabled.
End-user PC(s) to host additional instances of the Echo®
Data Presentation
Software (optional and only applicable if the SQL interface is enabled).
Echo® Monitoring Software User’s Manual
Models 600A20, Manual #64448, Rev. NR, ECO 45504 v4.0.0 9-24-2015
9
The PC and the receiver(s) can be configured to acquire their IP addresses dynamically
from the host network’s DHCP server and would be connected as any other device on the
network with an Ethernet cable, (Note: the Echo® Receiver is not a wireless Ethernet
device). The receiver can also be set up to have a fixed IP address which often times is
preferred since knowledge of the receiver’s IP address is required by the software. A
fixed IP address eliminates dynamic address expiration issues.
Echo®
RF data transmissions are received by the Echo® Receiver and sent (Ethernet-
TCP/IP) to the Echo®
Data Client Service Software component of the Echo®
Monitoring
Software which runs as a service on the PC. For installations where the SQL interface is
enabled, the sensor transmissions are saved in an SQL database running either on the
same PC or a configured SQL server on the network. This data can be viewed on the
acquisition PC or remotely using the Echo®
Data Presentation Software component of the
Echo®
Monitoring Software. Data can also be exported or sent in response to a request
(e.g. Modbus) to other industrial monitoring applications. For additional information on
exporting data, contact IMI Sensors.
NOTE: The Echo®
system can also be set up as an isolated private LAN consisting of the
PC and the receiver, both of which would be configured with fixed IP addresses and be
connected using a crossover Ethernet cable. Echo®
Sensor transmissions would be saved
in the SQL database (also on the PC) and viewed using the Echo®
Data Presentation
Software.
2 Scope This document describes the Echo
® Monitoring Software installation and its use. It is
assumed that the user is familiar with the hardware components of the system.
3 Software Installation There are two software components required for a typical installation; Echo
® Monitoring
Software and Microsoft SQL Server software. Microsoft SQL Server 2005 Express
software is bundled with the Echo®
Monitoring Software for easy access or can be
downloaded separately from Microsoft. Alternatively, if the end-user already has
Microsoft SQL Server installed then the Echo® database can simply be attached to it.
Note: The SQL component is not required if only the Modbus interface software is to be
used.
The Echo®
Monitoring Software is composed of two separate applications; Echo®
Data
Client Service Software and the Echo®
Data Presentation Software. These programs are
described below.
NOTE: You will need administrative rights to load the software and will most likely
require the help of your IT department.
Echo® Monitoring Software User’s Manual
Models 600A20, Manual #64448, Rev. NR, ECO 45504 v4.0.0 9-24-2015
10
3.1 Echo® Data Client Service Software Installation
The service software should be installed on a server or dedicated PC that runs
continuously (i.e. 24/7). The service has SQL and Modbus interfaces (model 600A20
software).
To install the Echo®
Service Software, run the setup.exe file located on CD 1 (of 2) for
the 600A20 software. If auto run is enabled the installation process will begin
automatically. The CDs with the service also contain the SQL Express installers for 32
and 64 bit operating systems.
The default directory is C:\PCB\Echo and should be used if possible. This installer
installs the Echo Service and a Utility (PCBEchoNotify.exe) that runs in the notification
tray to provide status and configuration information for the Echo Data Client Service.
After this installation completes an additional utility runs to configure the client software
as a service and to update the windows registry. This software should typically be
installed on only one PC.
3.2 Echo® Data Presentation Software Installation
To install the Echo®
Data Presentation software, run the setup.exe located on CD 2 (of 2)
of the 600A20 software and follow the instructions. If auto run is enabled the installation
process will begin automatically. The default directory is C:\PCB\Echo and should be
used if possible; however, if it is changed, it MUST match the directory that the Echo®
Service Software is installed in. This software may be installed on many PC’s.
3.3 Microsoft SQL Server Software
The Echo®
Monitoring Software requires the installation of a compatible SQL Server
application installed either locally (i.e. on the same PC) or available over a network
connection if the all features of the Data Presentation Software are to be used. Microsoft
SQL Server 20xx Express is a freely downloadable and distributable version of Microsoft
SQL Server 20xx that satisfies this requirement. See section 5 for Microsoft SQL Server
2005 Express installation instructions. Microsoft SQL Server 2008 Express installation is
similar. Subsequent references to SQL Server in this document refer to either SQL Server
2005 or 2008.
Echo® Monitoring Software User’s Manual
Models 600A20, Manual #64448, Rev. NR, ECO 45504 v4.0.0 9-24-2015
11
3.3.1 SQL Server Initialization and Database Attachment
After the Echo®
Data Client Service, Echo®
Monitoring Software and the SQL database
engine are installed there are two important steps required to connect the these
applications, if the SQL interface is used, so the sensor data can be stored and retrieved
from the database;
The Echo®
Sensor Database supplied with the software must be ‘attached’ to the
database server.
The Universal Data Link (UDL) file must be configured to link the software
queries to the database server.
3.3.2 Windows Install Location
Prior to Attaching’ the database you should copy the Echo database files;
C:\PCB\Echo\Database\ EchoSQLData.mdf
C:\PCB\Echo\Database\ EchoSQLData.ldf
to the SQL server data directory;
Win 7 64-bit - C:\Program Files(x86)\Microsoft SQL Server\MSSQL.1\
MSSQL\Data
Win XP Win 7 32-bit - C:\Program Files\Microsoft SQL Server\MSSQL.1\
MSSQL\Data
3.3.3 Database Attachment
Once the Echo database files are copied to the appropriate SQL application directory then
the database must be attached to the SQL server. If you are not familiar with this process
refer to section 5.1 for instructions.
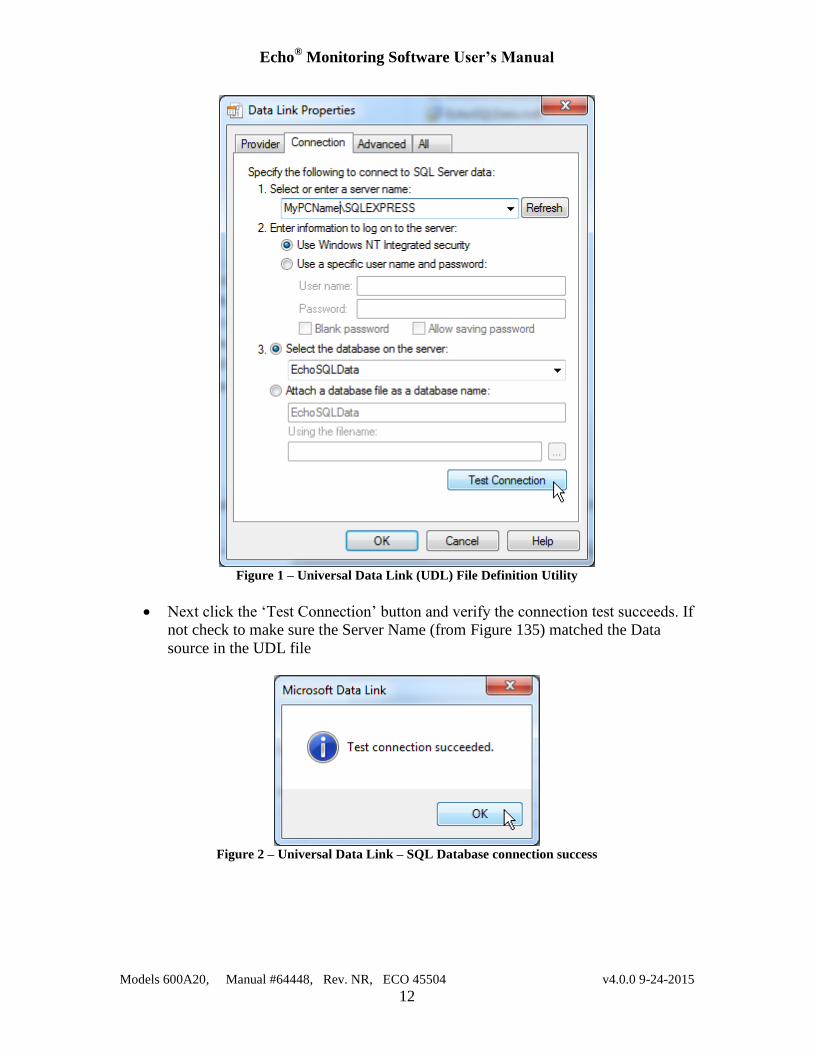
3.4 Universal Data Link (UDL) File Configuration
The next requirement is to link the Echo® Monitoring applications to the database engine.
This is done by configuring Universal Data Link (UDL) file. To do this;
Locate the file; C:\PCB\Echo\Database\ EchoDataSQL.udl
Double click on it or open with OLE DB Core Services. The dialog in Figure 1
will appear
Enter <Your PC Name>\SQLEXPRESS as the data source and make sure items 2
& 3 are as shown. Note: If you have a standard version of SQL Server 2005 then
do not add ‘\SQLEXPRESS’ to the data source name.
Echo® Monitoring Software User’s Manual
Models 600A20, Manual #64448, Rev. NR, ECO 45504 v4.0.0 9-24-2015
12
Figure 1 – Universal Data Link (UDL) File Definition Utility
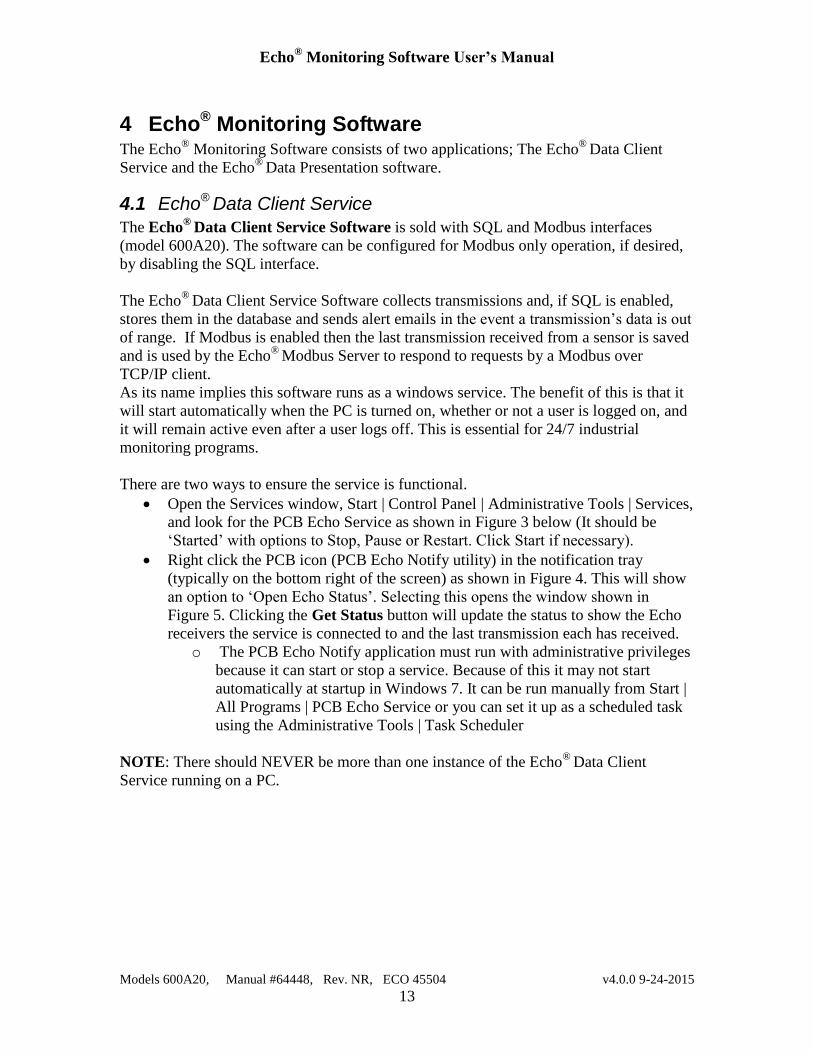
Next click the ‘Test Connection’ button and verify the connection test succeeds. If
not check to make sure the Server Name (from Figure 135) matched the Data
source in the UDL file
Figure 2 – Universal Data Link – SQL Database connection success
Echo® Monitoring Software User’s Manual
Models 600A20, Manual #64448, Rev. NR, ECO 45504 v4.0.0 9-24-2015
13
4 Echo® Monitoring Software
The Echo® Monitoring Software consists of two applications; The Echo
® Data Client
Service and the Echo®
Data Presentation software.
4.1 Echo® Data Client Service
The Echo®
Data Client Service Software is sold with SQL and Modbus interfaces
(model 600A20). The software can be configured for Modbus only operation, if desired,
by disabling the SQL interface.
The Echo®
Data Client Service Software collects transmissions and, if SQL is enabled,
stores them in the database and sends alert emails in the event a transmission’s data is out
of range. If Modbus is enabled then the last transmission received from a sensor is saved
and is used by the Echo®
Modbus Server to respond to requests by a Modbus over
TCP/IP client.
As its name implies this software runs as a windows service. The benefit of this is that it
will start automatically when the PC is turned on, whether or not a user is logged on, and
it will remain active even after a user logs off. This is essential for 24/7 industrial
monitoring programs.
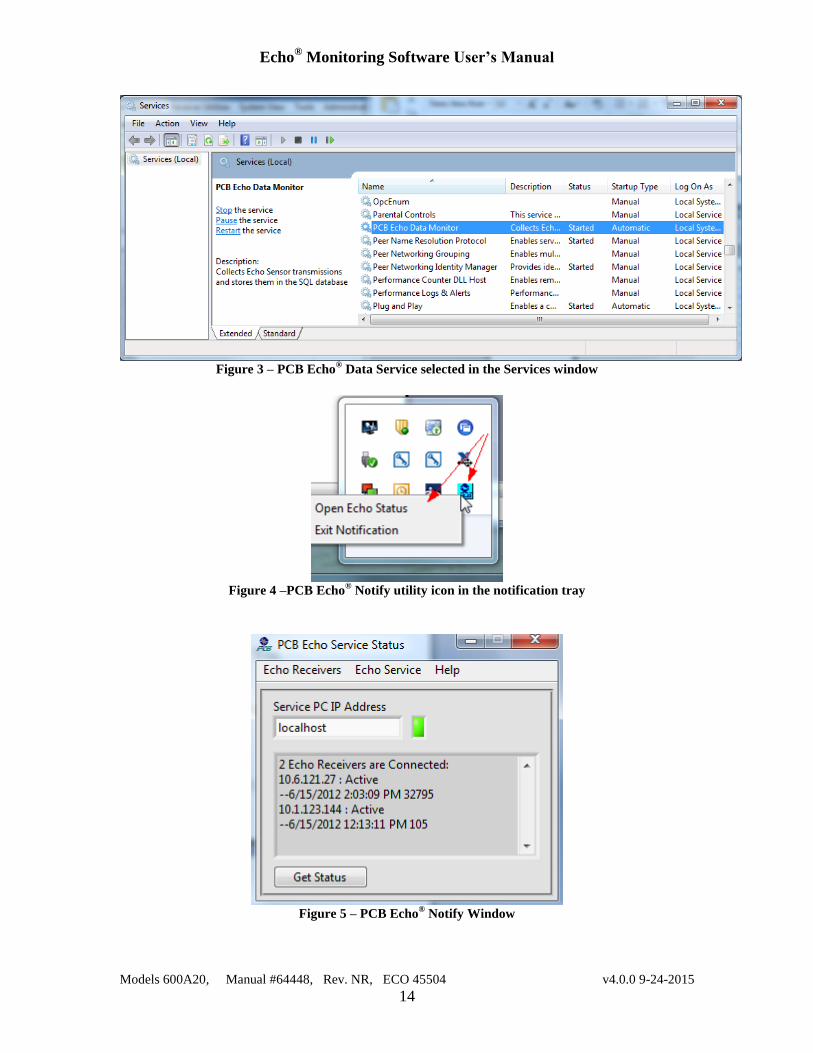
There are two ways to ensure the service is functional.
Open the Services window, Start | Control Panel | Administrative Tools | Services,
and look for the PCB Echo Service as shown in Figure 3 below (It should be
‘Started’ with options to Stop, Pause or Restart. Click Start if necessary).
Right click the PCB icon (PCB Echo Notify utility) in the notification tray
(typically on the bottom right of the screen) as shown in Figure 4. This will show
an option to ‘Open Echo Status’. Selecting this opens the window shown in
Figure 5. Clicking the Get Status button will update the status to show the Echo
receivers the service is connected to and the last transmission each has received.
o The PCB Echo Notify application must run with administrative privileges
because it can start or stop a service. Because of this it may not start
automatically at startup in Windows 7. It can be run manually from Start |
All Programs | PCB Echo Service or you can set it up as a scheduled task
using the Administrative Tools | Task Scheduler
NOTE: There should NEVER be more than one instance of the Echo®
Data Client
Service running on a PC.
Echo® Monitoring Software User’s Manual
Models 600A20, Manual #64448, Rev. NR, ECO 45504 v4.0.0 9-24-2015
14
Figure 3 – PCB Echo
® Data Service selected in the Services window
Figure 4 –PCB Echo
® Notify utility icon in the notification tray
Figure 5 – PCB Echo
® Notify Window
Echo® Monitoring Software User’s Manual
Models 600A20, Manual #64448, Rev. NR, ECO 45504 v4.0.0 9-24-2015
15
The Echo®
Notify Utility provides control and status of the Echo®
Data Client Service
that runs continuously in the background collecting and storing Echo®
sensor
transmissions. This program should launch silently when a user logs on to the PC since a
shortcut to it is placed in the startup directory when it is installed. However, if this fails to
happen for some reason run: Start | All Programs | PCB Echo Service | PCB Echo Notify
(PCBEchoNotify.exe in the install directory).
This utility’s functions are accessed from the menu bar and the Get Status button. The
service being queried for status can be on the same pc as this utility (localhost) or on a
remote PC. To access a remote PC enter its IP address in the ‘Service PC IP Address’
field and ensure the firewall has an exception entered for utility to get through to the
remote PC.
NOTE: Only the Get Status and Find functions will work for remote PC access. You
must be on the same PC as the service to configure, start or stop it.
Status is ascertained by activating the Get Status button. This sends a query to the
service to which it responds with;
The receivers it is tasked to monitor.
The status of the connection to those receivers.
The last transmission received from each receiver.
The last transmission indication shows the date and time that the transmission was
received and may also contain “->DB” and/or “->MB”. DB indicates the transmission
was from a sensor registered for that receiver and was stored in the SQL database. MB
indicates the Modbus interface is enabled and it was entered in the Modbus response file.
An example of a status response is shown in Figure 5 above.
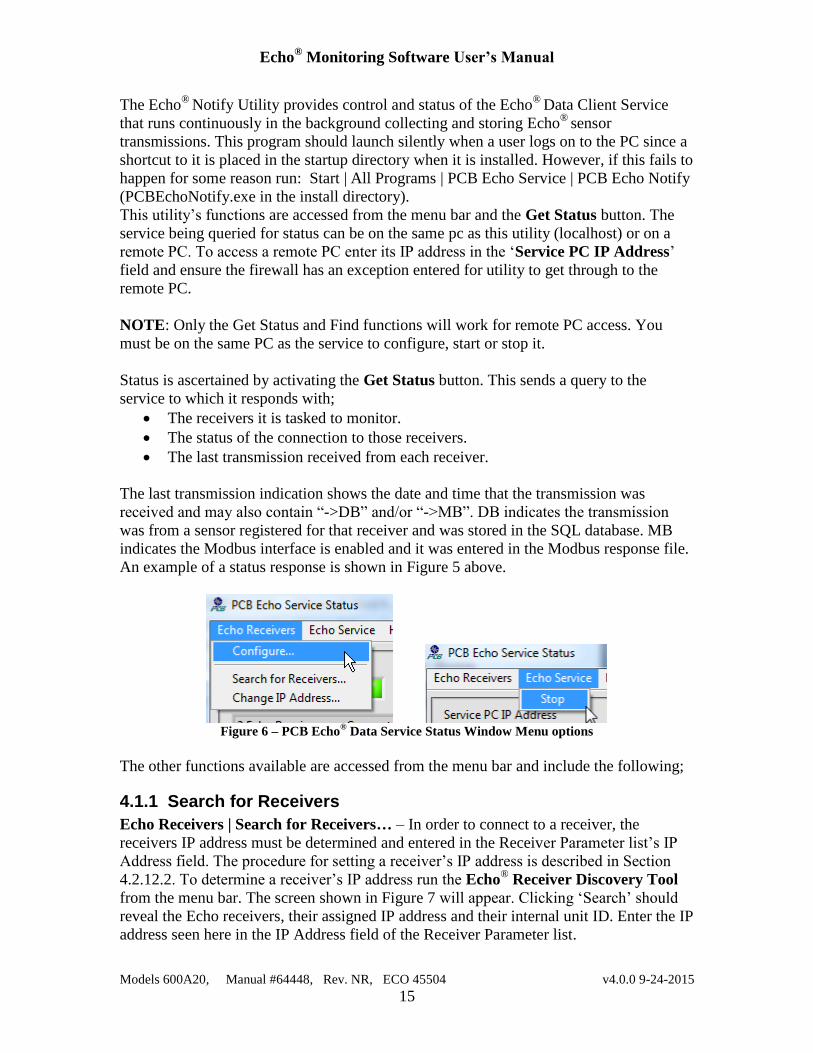
Figure 6 – PCB Echo
® Data Service Status Window Menu options
The other functions available are accessed from the menu bar and include the following;
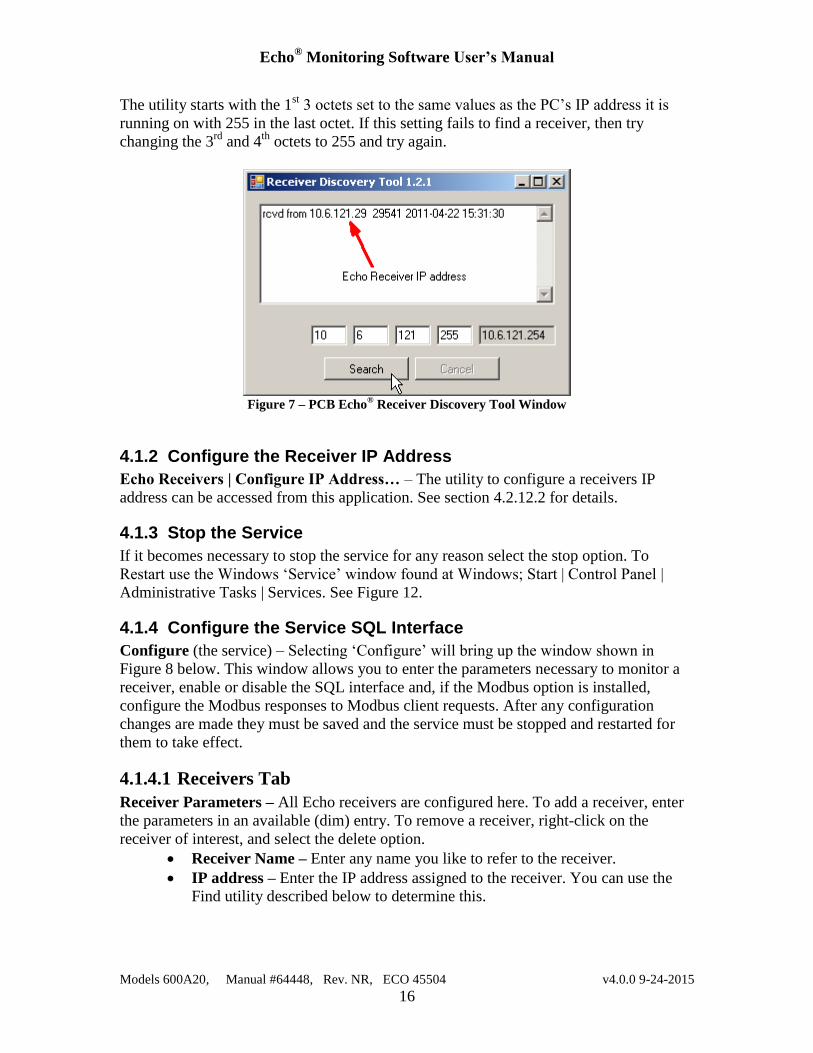
4.1.1 Search for Receivers
Echo Receivers | Search for Receivers… – In order to connect to a receiver, the
receivers IP address must be determined and entered in the Receiver Parameter list’s IP
Address field. The procedure for setting a receiver’s IP address is described in Section
4.2.12.2. To determine a receiver’s IP address run the Echo® Receiver Discovery Tool
from the menu bar. The screen shown in Figure 7 will appear. Clicking ‘Search’ should
reveal the Echo receivers, their assigned IP address and their internal unit ID. Enter the IP
address seen here in the IP Address field of the Receiver Parameter list.
Echo® Monitoring Software User’s Manual
Models 600A20, Manual #64448, Rev. NR, ECO 45504 v4.0.0 9-24-2015
16
The utility starts with the 1st 3 octets set to the same values as the PC’s IP address it is
running on with 255 in the last octet. If this setting fails to find a receiver, then try
changing the 3rd
and 4th
octets to 255 and try again.
Figure 7 – PCB Echo
® Receiver Discovery Tool Window
4.1.2 Configure the Receiver IP Address
Echo Receivers | Configure IP Address… – The utility to configure a receivers IP
address can be accessed from this application. See section 4.2.12.2 for details.
4.1.3 Stop the Service
If it becomes necessary to stop the service for any reason select the stop option. To
Restart use the Windows ‘Service’ window found at Windows; Start | Control Panel |
Administrative Tasks | Services. See Figure 12.
4.1.4 Configure the Service SQL Interface
Configure (the service) – Selecting ‘Configure’ will bring up the window shown in
Figure 8 below. This window allows you to enter the parameters necessary to monitor a
receiver, enable or disable the SQL interface and, if the Modbus option is installed,
configure the Modbus responses to Modbus client requests. After any configuration
changes are made they must be saved and the service must be stopped and restarted for
them to take effect.
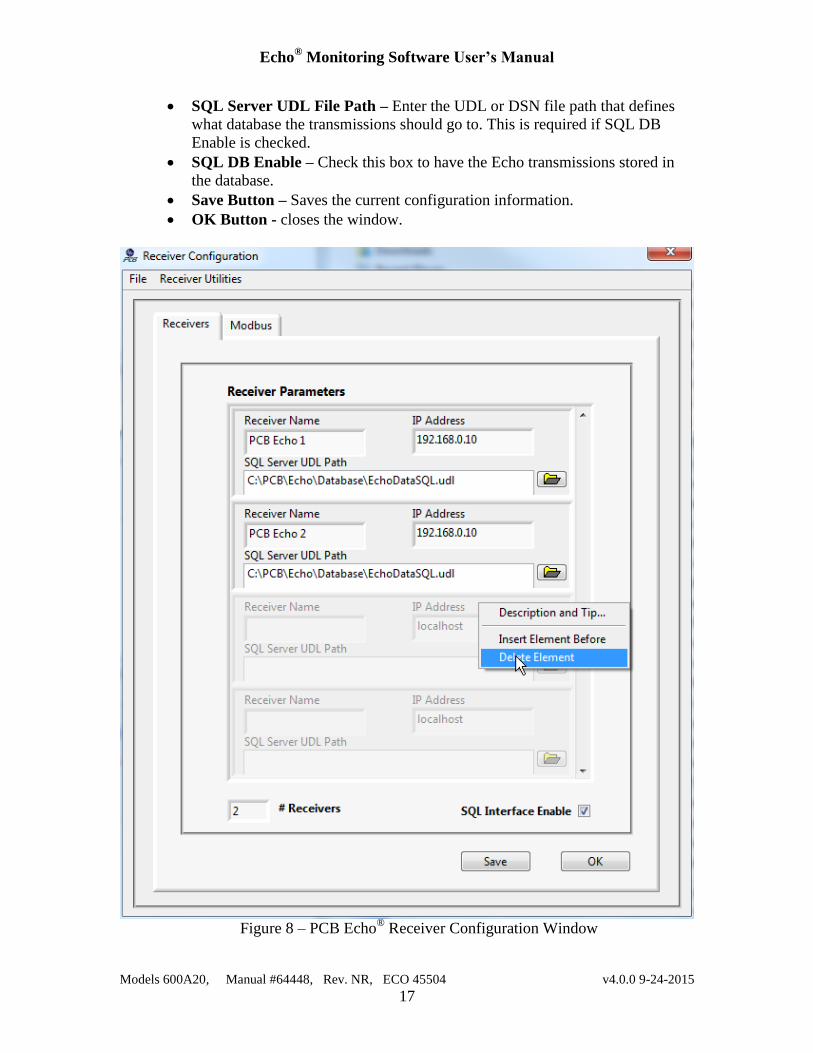
4.1.4.1 Receivers Tab
Receiver Parameters – All Echo receivers are configured here. To add a receiver, enter
the parameters in an available (dim) entry. To remove a receiver, right-click on the
receiver of interest, and select the delete option.
Receiver Name – Enter any name you like to refer to the receiver.
IP address – Enter the IP address assigned to the receiver. You can use the
Find utility described below to determine this.
Echo® Monitoring Software User’s Manual
Models 600A20, Manual #64448, Rev. NR, ECO 45504 v4.0.0 9-24-2015
17
SQL Server UDL File Path – Enter the UDL or DSN file path that defines
what database the transmissions should go to. This is required if SQL DB
Enable is checked.
SQL DB Enable – Check this box to have the Echo transmissions stored in
the database.
Save Button – Saves the current configuration information.
OK Button - closes the window.
Figure 8 – PCB Echo
® Receiver Configuration Window
Echo® Monitoring Software User’s Manual
Models 600A20, Manual #64448, Rev. NR, ECO 45504 v4.0.0 9-24-2015
18
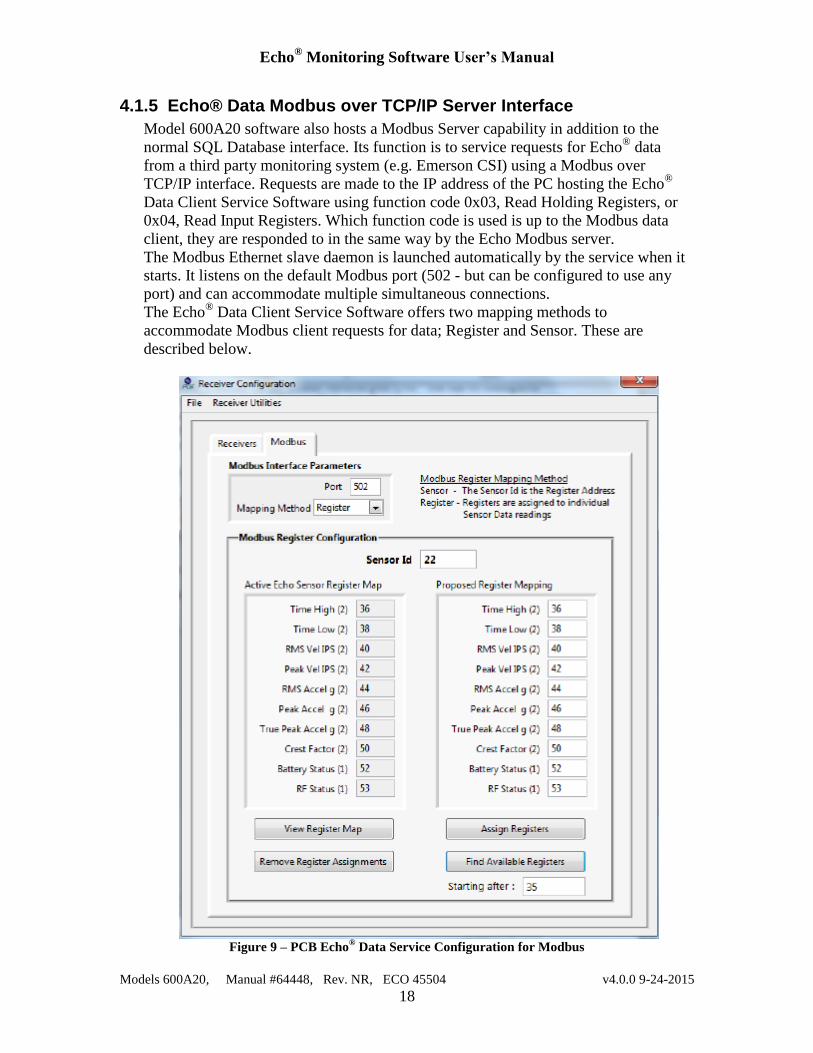
4.1.5 Echo® Data Modbus over TCP/IP Server Interface
Model 600A20 software also hosts a Modbus Server capability in addition to the
normal SQL Database interface. Its function is to service requests for Echo®
data
from a third party monitoring system (e.g. Emerson CSI) using a Modbus over
TCP/IP interface. Requests are made to the IP address of the PC hosting the Echo®
Data Client Service Software using function code 0x03, Read Holding Registers, or
0x04, Read Input Registers. Which function code is used is up to the Modbus data
client, they are responded to in the same way by the Echo Modbus server.
The Modbus Ethernet slave daemon is launched automatically by the service when it
starts. It listens on the default Modbus port (502 - but can be configured to use any
port) and can accommodate multiple simultaneous connections.
The Echo® Data Client Service Software offers two mapping methods to
accommodate Modbus client requests for data; Register and Sensor. These are
described below.
Figure 9 – PCB Echo
® Data Service Configuration for Modbus

Echo® Monitoring Software User’s Manual
Models 600A20, Manual #64448, Rev. NR, ECO 45504 v4.0.0 9-24-2015
19
4.1.5.1 Modbus Register Mapping Method
The Register mapping method implements a traditional Modbus interface where data for
a specific measurement is returned in a register or register pair. For Echo® Data a
measurement is data for a single sensor and can be one of the following;
RMS Velocity (IPS)
Peak Velocity (IPS)
RMS Acceleration (g’s)
Peak Acceleration (g’s)
True Peak Acceleration (g’s)
Crest Factor
Additionally, there are 3 status items available; Battery Status, RF Status and the time the
measurement was taken.
Measurement data is sent in response to Function code 0x03, Read Holding Registers, or
Function code 0x04, Read Input Registers requests. All measurement data items are held
in two register pairs (32 bits total) which need to be cast as IEEE single precision floating
point numbers in the Modbus client software that receives the request response. For
example, if the reading was 1.0 and the registers assigned to it are 5 & 6 it will be
returned in 2 16-bit registers as 0x3F80 & 0x0000 where 0x3F80 is in the low address
register (5) and 0x0000 is in the next higher address register (6).
The RF and Battery Status values (strength) are each returned in 1 16-bit register with a
value between 0-3 where 3 is best.
The Time of acquisition is a 64-bit double precision value that represents the number of
seconds since midnight January 1, 1904 GMT. This is returned in 4 16-bit registers as
two measurement values time high and time low, each of which is 32 bits.
When the Register Mapping Method is used every measurement value of every sensor
configured in the system must have Modbus registers assigned to it if its data is to be
requested by the Modbus client software. The Echo software makes the register
assignment process simple. The control descriptions below Refer to Figure 9 when
‘Register’ is selected as the mapping mode. In Sensor mode, described later, none of
these controls are relevant and are disabled.
Sensor Id – Enter the Id of the sensor whose data is being assigned to registers. When an
Id is entered the software will search to see if the sensor already has registers assigned. If
so the values will appear on the left side of the screen under the ‘Active Echo Sensor
Register Map’. If no registers are assigned yet then the values will be 0. 0 is an invalid
register assignment and will never be used.
Find Available Registers button – If no registers are assigned, or you want to change a
sensors current assignment, then you can activate the ‘Find Available Registers’ button.
This button, used in conjunction with the ‘Starting After’ control causes the software to
search for available registers after the register number in the starting after control.
Echo® Monitoring Software User’s Manual
Models 600A20, Manual #64448, Rev. NR, ECO 45504 v4.0.0 9-24-2015
20
Alternatively, you can enter the register values by hand. In any event, after each data item
has a register assigned activate the ‘Assign Registers’ button to record them for the
Modbus server to use.
Assign Registers button – Activation of this button causes the register values in the
‘Proposed Register Mapping’ section to be assigned to the selected sensor.
Remove Register Assignments button – Activation of this button causes the register
values currently reserved for the selected sensor, shown in the ‘Active Echo Sensor
Register Map’ section to be cleared.
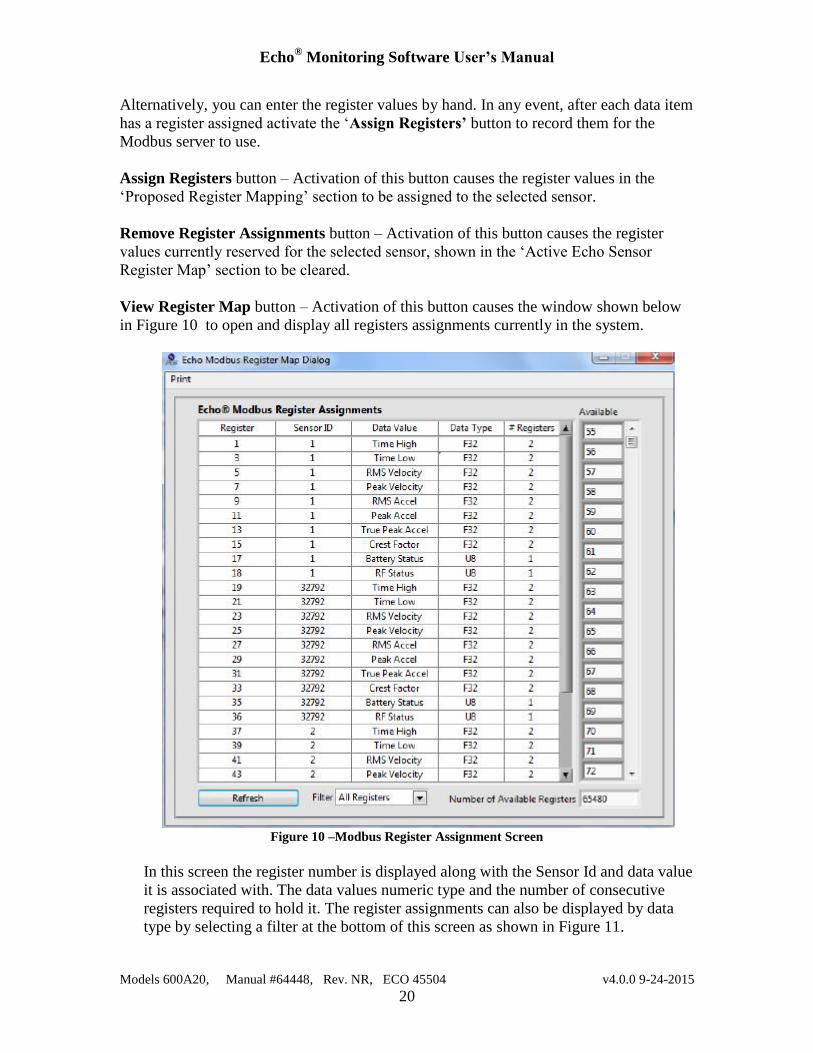
View Register Map button – Activation of this button causes the window shown below
in Figure 10 to open and display all registers assignments currently in the system.
Figure 10 –Modbus Register Assignment Screen
In this screen the register number is displayed along with the Sensor Id and data value
it is associated with. The data values numeric type and the number of consecutive
registers required to hold it. The register assignments can also be displayed by data
type by selecting a filter at the bottom of this screen as shown in Figure 11.
Echo® Monitoring Software User’s Manual
Models 600A20, Manual #64448, Rev. NR, ECO 45504 v4.0.0 9-24-2015
21
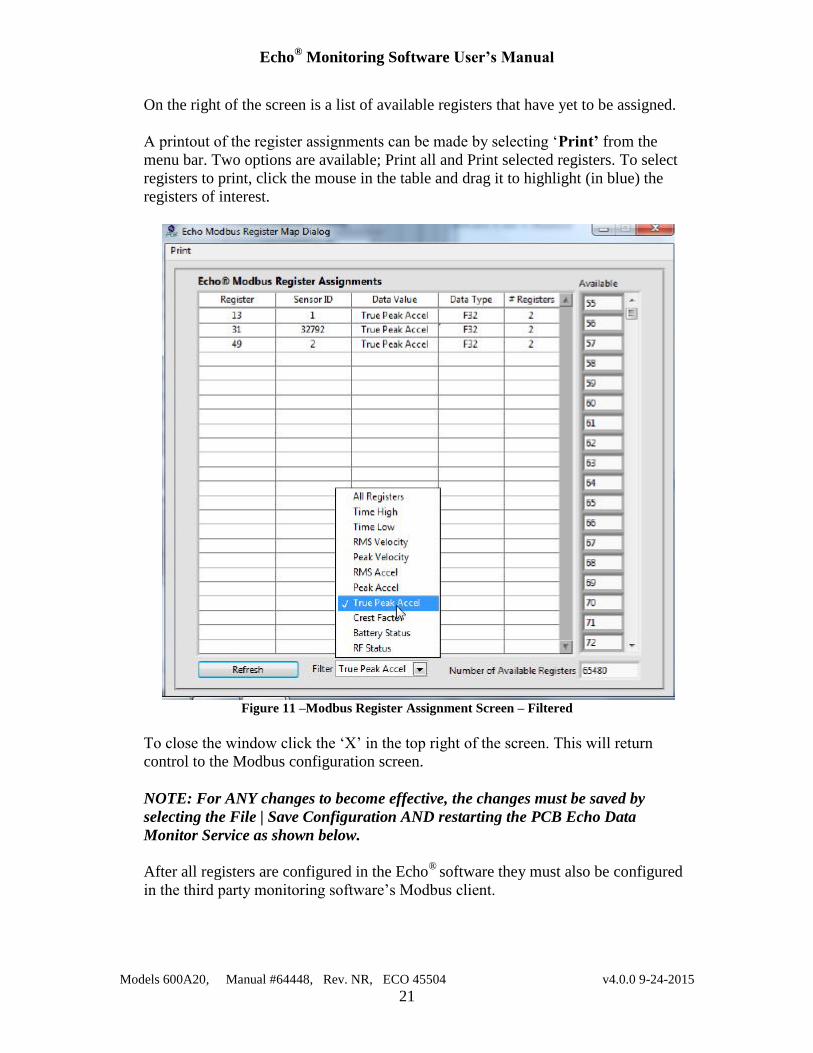
On the right of the screen is a list of available registers that have yet to be assigned.
A printout of the register assignments can be made by selecting ‘Print’ from the
menu bar. Two options are available; Print all and Print selected registers. To select
registers to print, click the mouse in the table and drag it to highlight (in blue) the
registers of interest.
Figure 11 –Modbus Register Assignment Screen – Filtered
To close the window click the ‘X’ in the top right of the screen. This will return
control to the Modbus configuration screen.
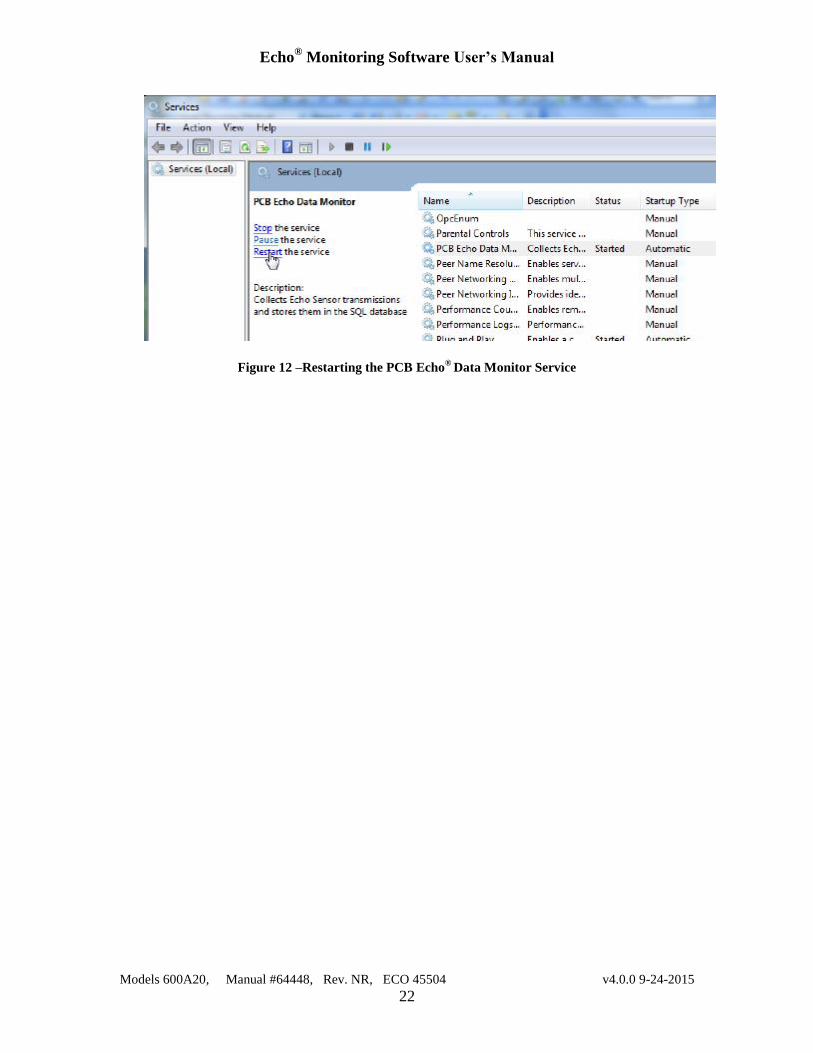
NOTE: For ANY changes to become effective, the changes must be saved by
selecting the File | Save Configuration AND restarting the PCB Echo Data
Monitor Service as shown below.
After all registers are configured in the Echo®
software they must also be configured
in the third party monitoring software’s Modbus client.
Echo® Monitoring Software User’s Manual
Models 600A20, Manual #64448, Rev. NR, ECO 45504 v4.0.0 9-24-2015
22
Figure 12 –Restarting the PCB Echo®
Data Monitor Service
Echo® Monitoring Software User’s Manual
Models 600A20, Manual #64448, Rev. NR, ECO 45504 v4.0.0 9-24-2015
23
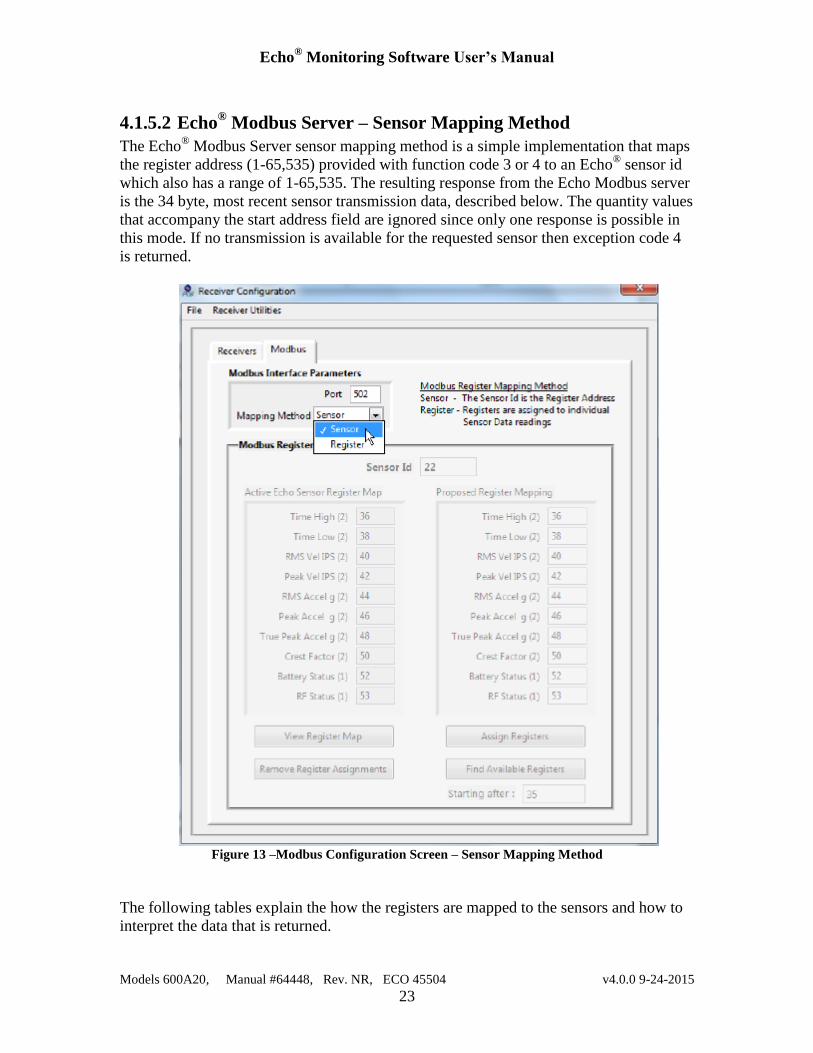
4.1.5.2 Echo® Modbus Server – Sensor Mapping Method
The Echo® Modbus Server sensor mapping method is a simple implementation that maps
the register address (1-65,535) provided with function code 3 or 4 to an Echo®
sensor id
which also has a range of 1-65,535. The resulting response from the Echo Modbus server
is the 34 byte, most recent sensor transmission data, described below. The quantity values
that accompany the start address field are ignored since only one response is possible in
this mode. If no transmission is available for the requested sensor then exception code 4
is returned.
Figure 13 –Modbus Configuration Screen – Sensor Mapping Method
The following tables explain the how the registers are mapped to the sensors and how to
interpret the data that is returned.
Echo® Monitoring Software User’s Manual
Models 600A20, Manual #64448, Rev. NR, ECO 45504 v4.0.0 9-24-2015
24
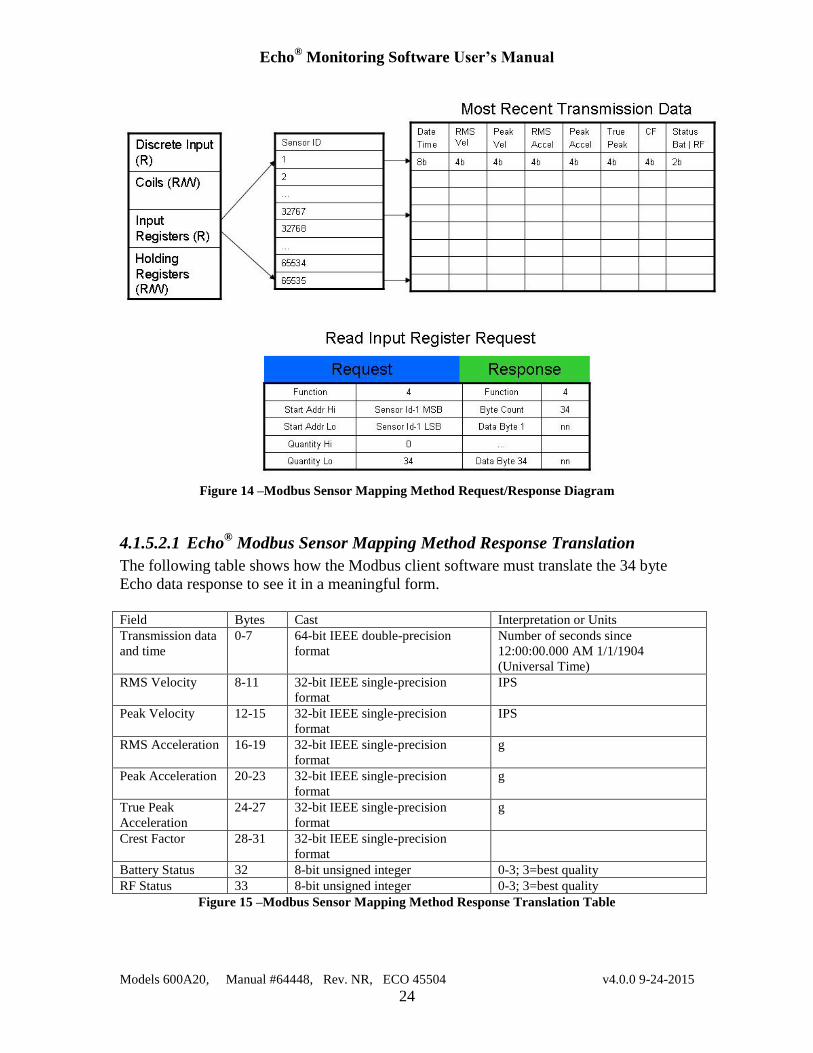
Figure 14 –Modbus Sensor Mapping Method Request/Response Diagram
4.1.5.2.1 Echo® Modbus Sensor Mapping Method Response Translation
The following table shows how the Modbus client software must translate the 34 byte
Echo data response to see it in a meaningful form.
Field Bytes Cast Interpretation or Units
Transmission data
and time
0-7 64-bit IEEE double-precision
format
Number of seconds since
12:00:00.000 AM 1/1/1904
(Universal Time)
RMS Velocity 8-11 32-bit IEEE single-precision
format
IPS
Peak Velocity 12-15 32-bit IEEE single-precision
format
IPS
RMS Acceleration 16-19 32-bit IEEE single-precision
format
g
Peak Acceleration 20-23 32-bit IEEE single-precision
format
g
True Peak
Acceleration
24-27 32-bit IEEE single-precision
format
g
Crest Factor 28-31 32-bit IEEE single-precision
format
Battery Status 32 8-bit unsigned integer 0-3; 3=best quality
RF Status 33 8-bit unsigned integer 0-3; 3=best quality
Figure 15 –Modbus Sensor Mapping Method Response Translation Table

Echo® Monitoring Software User’s Manual
Models 600A20, Manual #64448, Rev. NR, ECO 45504 v4.0.0 9-24-2015
25
4.2 Echo® Data Presentation Software
The Echo®
Data Presentation software is run by selecting Start | All Programs | PCB
Echo Monitoring Software | Echo Data Presentation. Or running the Echo Monitoring.exe
program located in the C:\PCB\Echo directory. This application is only applicable if the
Echo®
Data Service was configured for SQL Database operations since it presents the
data and determines status based on information stored in the database.
The Echo Data Presentation Software is used to view:
Trend data collected from the receivers
Status of the machines they are monitoring.
Status of the sensors
When the Echo®
Data Presentation software is run the screen shown in Figure 17 will
appear. This screen can be resized by dragging the bottom right corner in or out. On the
left is a list of sensors in a tree structure, organized by Plant | Group | Machine and
Sensor Location (these terms are user configurable) from values entered in the sensors
channel definition.
4.2.1 Echo® Main Screen Graphs
Clicking on a sensor in the left panel will cause its data, for each data type, to be
displayed in the graphs located on the right panel. These graphs display trend data along
with their associated critical and warning alarm levels. The screen can be used to view 6
graphs, one for each data type, or it can be used to zoom in on a particular data types.
When all six graphs are displayed their data can be scaled simultaneously by using the
scale tool of the True Peak Acceleration graph in the bottom left of the screen. To enable
or disable this feature check or uncheck the menu bar item Display | Main Screen
Graphs | Link Graph Scales to True Peak Accel.
Figure 16 - PCB Echo
® Data Presentation Main Screen – Link graph scaling & cursors
When enabled the True Peak Acceleration graph label will be blue, when disabled the
label will be black. Additionally, the cursors on all other graphs can be moved by moving
the True Peak Acceleration graph cursor when this feature is enabled.
Echo® Monitoring Software User’s Manual
Models 600A20, Manual #64448, Rev. NR, ECO 45504 v4.0.0 9-24-2015
26
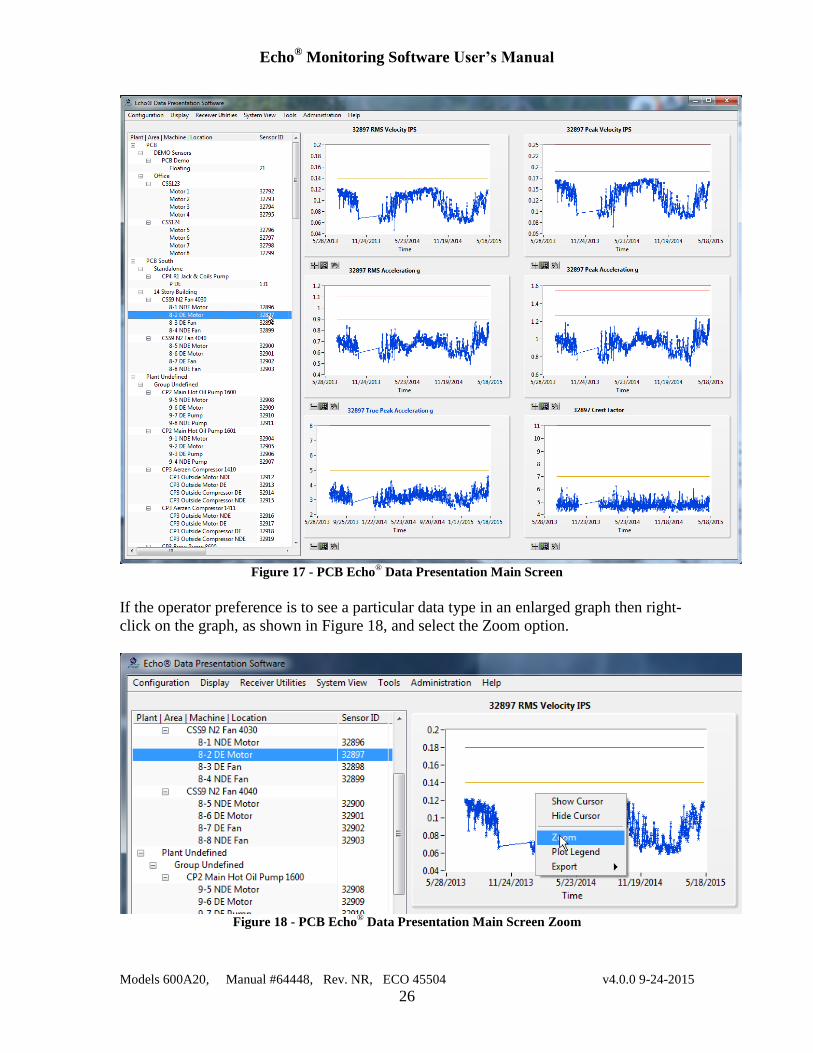
Figure 17 - PCB Echo
® Data Presentation Main Screen
If the operator preference is to see a particular data type in an enlarged graph then right-
click on the graph, as shown in Figure 18, and select the Zoom option.
Figure 18 - PCB Echo
® Data Presentation Main Screen Zoom
Echo® Monitoring Software User’s Manual
Models 600A20, Manual #64448, Rev. NR, ECO 45504 v4.0.0 9-24-2015
27
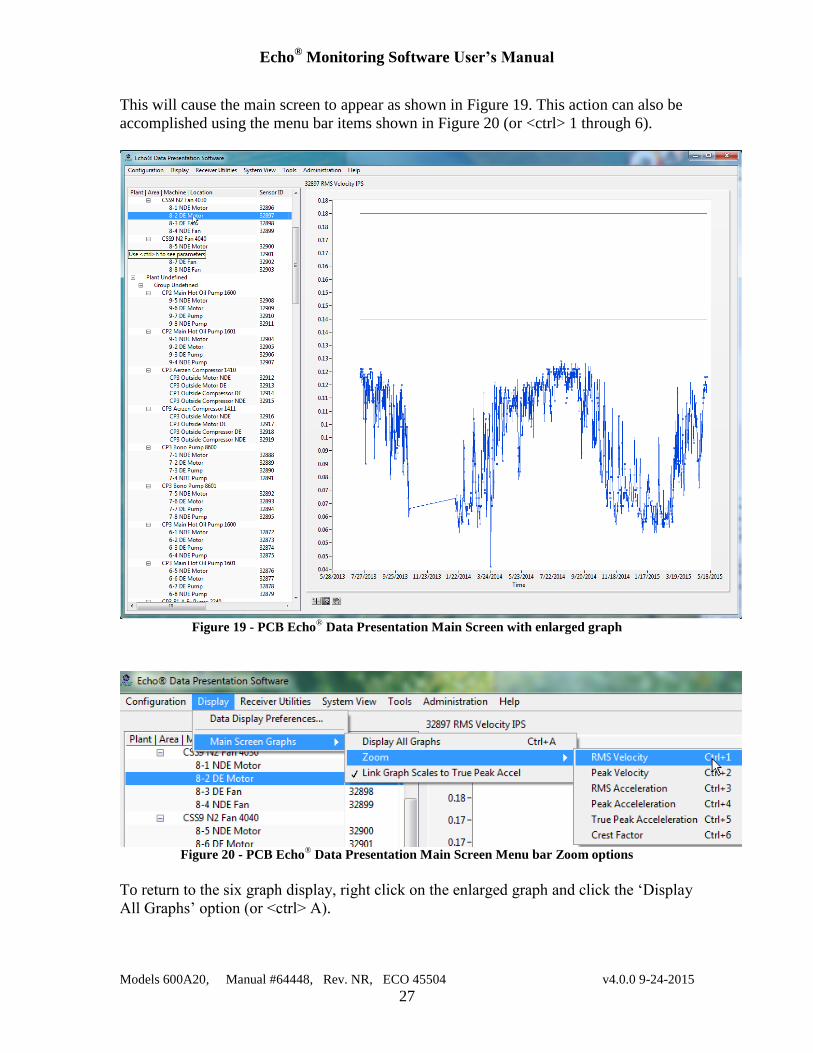
This will cause the main screen to appear as shown in Figure 19. This action can also be
accomplished using the menu bar items shown in Figure 20 (or <ctrl> 1 through 6).
Figure 19 - PCB Echo
® Data Presentation Main Screen with enlarged graph
Figure 20 - PCB Echo
® Data Presentation Main Screen Menu bar Zoom options
To return to the six graph display, right click on the enlarged graph and click the ‘Display
All Graphs’ option (or <ctrl> A).
Echo® Monitoring Software User’s Manual
Models 600A20, Manual #64448, Rev. NR, ECO 45504 v4.0.0 9-24-2015
28
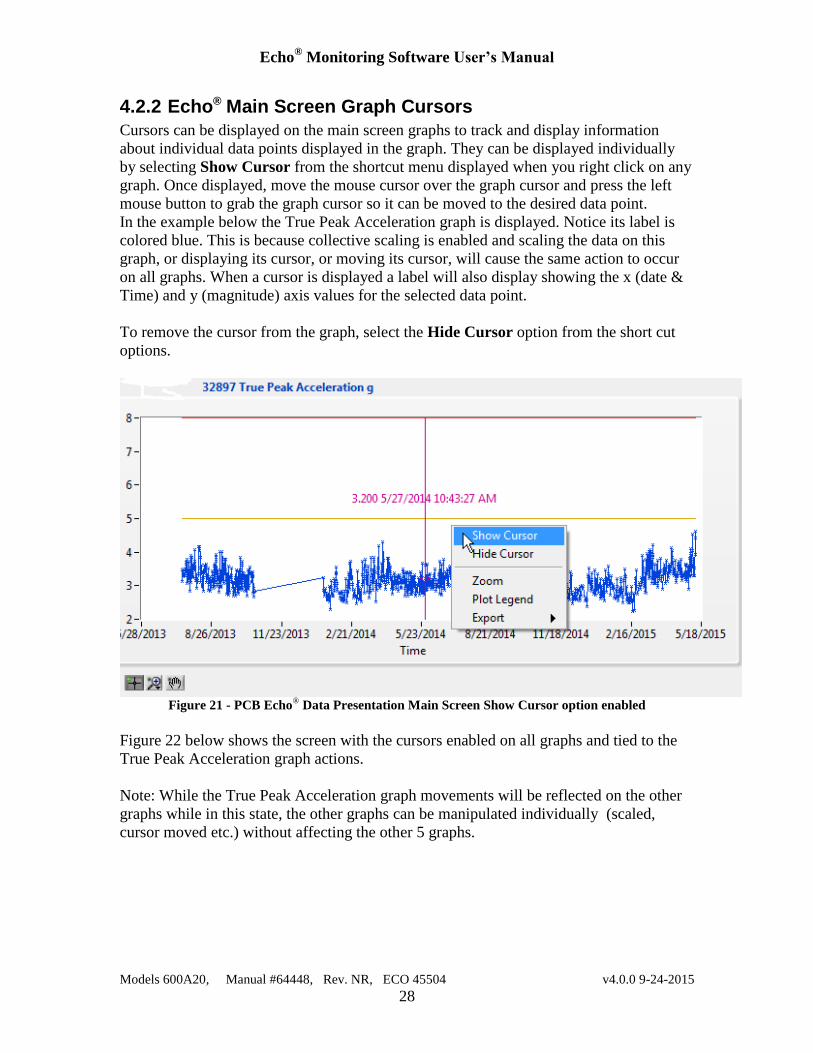
4.2.2 Echo® Main Screen Graph Cursors
Cursors can be displayed on the main screen graphs to track and display information
about individual data points displayed in the graph. They can be displayed individually
by selecting Show Cursor from the shortcut menu displayed when you right click on any
graph. Once displayed, move the mouse cursor over the graph cursor and press the left
mouse button to grab the graph cursor so it can be moved to the desired data point.
In the example below the True Peak Acceleration graph is displayed. Notice its label is
colored blue. This is because collective scaling is enabled and scaling the data on this
graph, or displaying its cursor, or moving its cursor, will cause the same action to occur
on all graphs. When a cursor is displayed a label will also display showing the x (date &
Time) and y (magnitude) axis values for the selected data point.
To remove the cursor from the graph, select the Hide Cursor option from the short cut
options.
Figure 21 - PCB Echo
® Data Presentation Main Screen Show Cursor option enabled
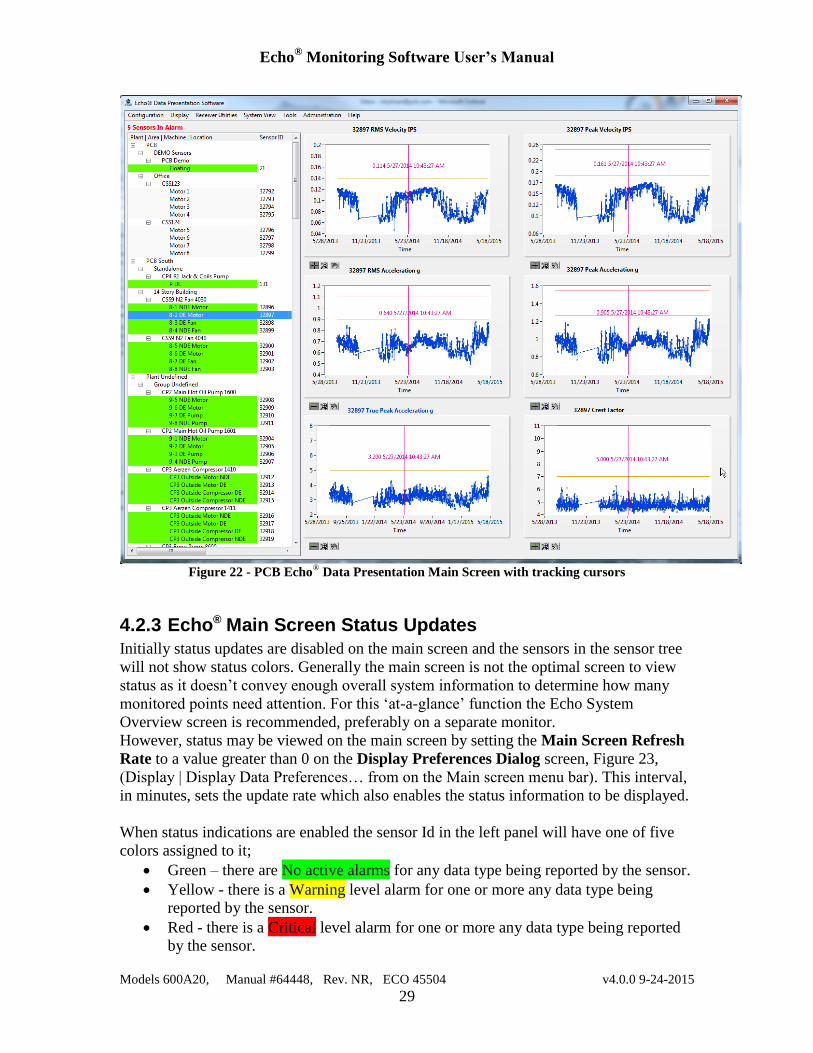
Figure 22 below shows the screen with the cursors enabled on all graphs and tied to the
True Peak Acceleration graph actions.
Note: While the True Peak Acceleration graph movements will be reflected on the other
graphs while in this state, the other graphs can be manipulated individually (scaled,
cursor moved etc.) without affecting the other 5 graphs.
Echo® Monitoring Software User’s Manual
Models 600A20, Manual #64448, Rev. NR, ECO 45504 v4.0.0 9-24-2015
29
Figure 22 - PCB Echo
® Data Presentation Main Screen with tracking cursors
4.2.3 Echo® Main Screen Status Updates
Initially status updates are disabled on the main screen and the sensors in the sensor tree
will not show status colors. Generally the main screen is not the optimal screen to view
status as it doesn’t convey enough overall system information to determine how many
monitored points need attention. For this ‘at-a-glance’ function the Echo System
Overview screen is recommended, preferably on a separate monitor.
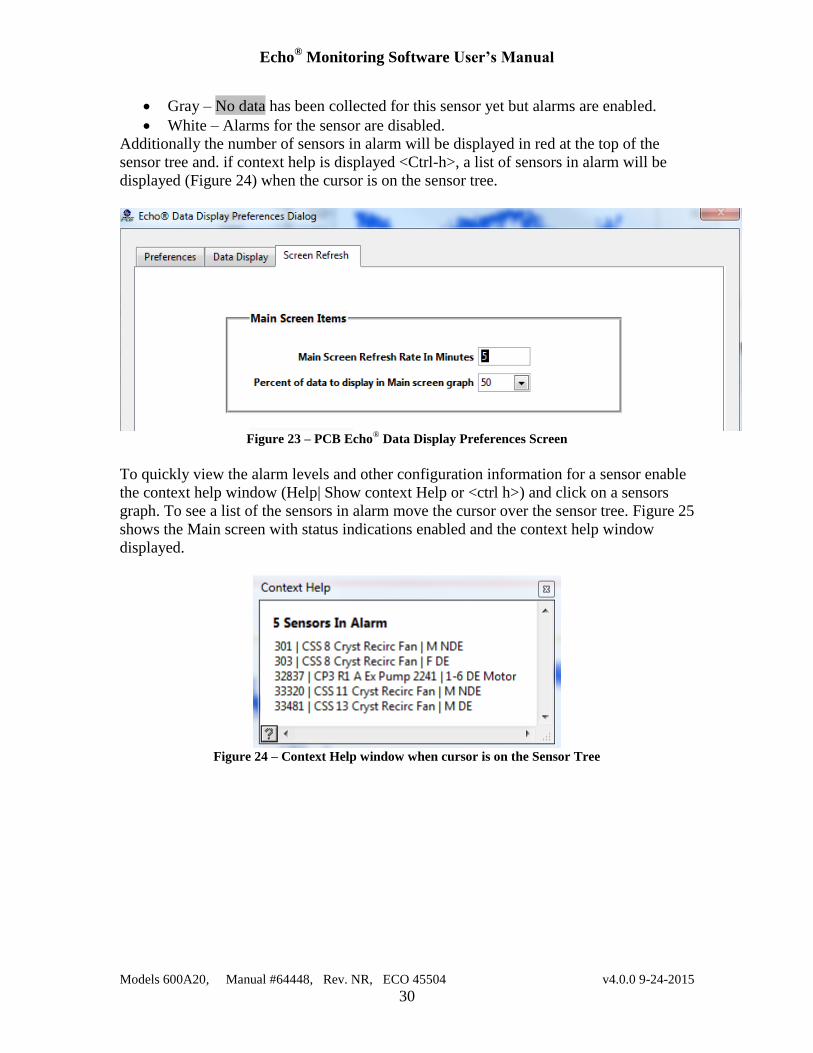
However, status may be viewed on the main screen by setting the Main Screen Refresh
Rate to a value greater than 0 on the Display Preferences Dialog screen, Figure 23,
(Display | Display Data Preferences… from on the Main screen menu bar). This interval,
in minutes, sets the update rate which also enables the status information to be displayed.
When status indications are enabled the sensor Id in the left panel will have one of five
colors assigned to it;
Green – there are No active alarms for any data type being reported by the sensor.
Yellow - there is a Warning level alarm for one or more any data type being
reported by the sensor.
Red - there is a Critical level alarm for one or more any data type being reported
by the sensor.
Echo® Monitoring Software User’s Manual
Models 600A20, Manual #64448, Rev. NR, ECO 45504 v4.0.0 9-24-2015
30
Gray – No data has been collected for this sensor yet but alarms are enabled.
White – Alarms for the sensor are disabled.
Additionally the number of sensors in alarm will be displayed in red at the top of the
sensor tree and. if context help is displayed <Ctrl-h>, a list of sensors in alarm will be
displayed (Figure 24) when the cursor is on the sensor tree.
Figure 23 – PCB Echo
® Data Display Preferences Screen
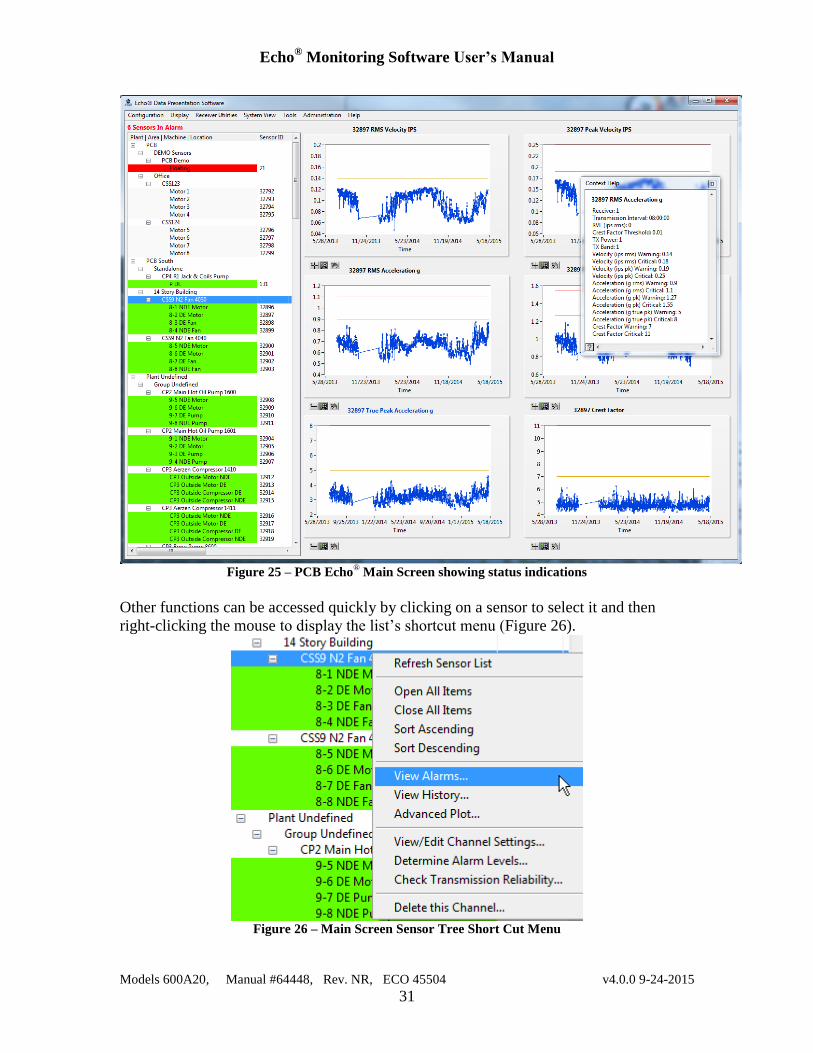
To quickly view the alarm levels and other configuration information for a sensor enable
the context help window (Help| Show context Help or <ctrl h>) and click on a sensors
graph. To see a list of the sensors in alarm move the cursor over the sensor tree. Figure 25
shows the Main screen with status indications enabled and the context help window
displayed.
Figure 24 – Context Help window when cursor is on the Sensor Tree
Echo® Monitoring Software User’s Manual
Models 600A20, Manual #64448, Rev. NR, ECO 45504 v4.0.0 9-24-2015
31
Figure 25 – PCB Echo
® Main Screen showing status indications
Other functions can be accessed quickly by clicking on a sensor to select it and then
right-clicking the mouse to display the list’s shortcut menu (Figure 26).
Figure 26 – Main Screen Sensor Tree Short Cut Menu
Echo® Monitoring Software User’s Manual
Models 600A20, Manual #64448, Rev. NR, ECO 45504 v4.0.0 9-24-2015
32
From this short cut list you can;
Refresh the sensor list to see if and changes have occurred.
Sort the tree or a section of the tree in ascending or descending order.
View the Alarm screen for the selected sensor (Figure 108).
View the History screen for the selected sensor (Figure 91).
Display the Advanced Plot window to better view the data (Figure 95).
View or Edit the sensors parameters (Figure 35). (Editing them requires the user
to be logged in Administration | Login…)
Run the Alarm Level utility for the selected channel.
Run the Transmission Reliability Utility for the selected channel.
Delete the selected channel (This function also requires the user to be logged in)
It is recommended that the sensors be configured and added to the database, prior to the
receiver connection so that their transmissions will be logged in the database.
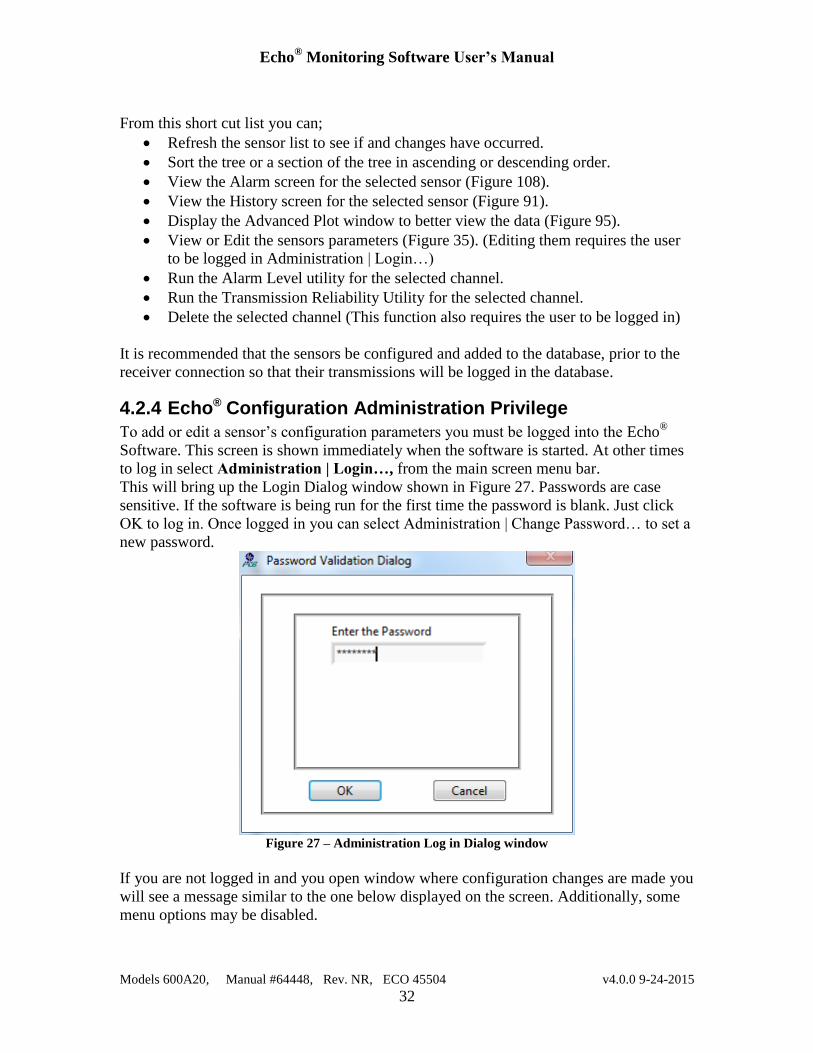
4.2.4 Echo® Configuration Administration Privilege
To add or edit a sensor’s configuration parameters you must be logged into the Echo®
Software. This screen is shown immediately when the software is started. At other times
to log in select Administration | Login…, from the main screen menu bar.
This will bring up the Login Dialog window shown in Figure 27. Passwords are case
sensitive. If the software is being run for the first time the password is blank. Just click
OK to log in. Once logged in you can select Administration | Change Password… to set a
new password.
Figure 27 – Administration Log in Dialog window
If you are not logged in and you open window where configuration changes are made you
will see a message similar to the one below displayed on the screen. Additionally, some
menu options may be disabled.
Echo® Monitoring Software User’s Manual
Models 600A20, Manual #64448, Rev. NR, ECO 45504 v4.0.0 9-24-2015
33
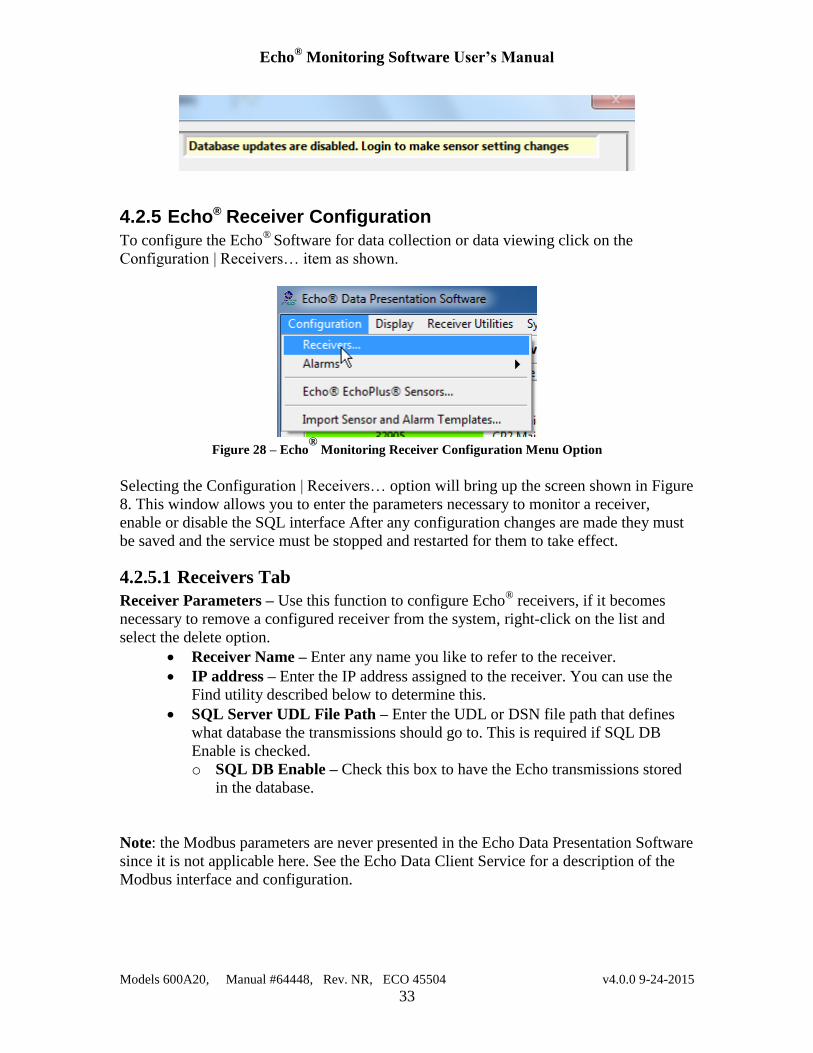
4.2.5 Echo® Receiver Configuration
To configure the Echo®
Software for data collection or data viewing click on the
Configuration | Receivers… item as shown.
Figure 28 – Echo
® Monitoring Receiver Configuration Menu Option
Selecting the Configuration | Receivers… option will bring up the screen shown in Figure
8. This window allows you to enter the parameters necessary to monitor a receiver,
enable or disable the SQL interface After any configuration changes are made they must
be saved and the service must be stopped and restarted for them to take effect.
4.2.5.1 Receivers Tab
Receiver Parameters – Use this function to configure Echo® receivers, if it becomes
necessary to remove a configured receiver from the system, right-click on the list and
select the delete option.
Receiver Name – Enter any name you like to refer to the receiver.
IP address – Enter the IP address assigned to the receiver. You can use the
Find utility described below to determine this.
SQL Server UDL File Path – Enter the UDL or DSN file path that defines
what database the transmissions should go to. This is required if SQL DB
Enable is checked.
o SQL DB Enable – Check this box to have the Echo transmissions stored
in the database.
Note: the Modbus parameters are never presented in the Echo Data Presentation Software
since it is not applicable here. See the Echo Data Client Service for a description of the
Modbus interface and configuration.
Echo® Monitoring Software User’s Manual
Models 600A20, Manual #64448, Rev. NR, ECO 45504 v4.0.0 9-24-2015
34
4.2.6 Echo® Sensor Configuration
It is important that the sensors be configured properly so they:
Send data at the appropriate interval and within the proper frequency band.
Get registered in the database allowing data received from them to be stored.
Can be referenced in terms that make more sense than the ID number they are
manufactured with.
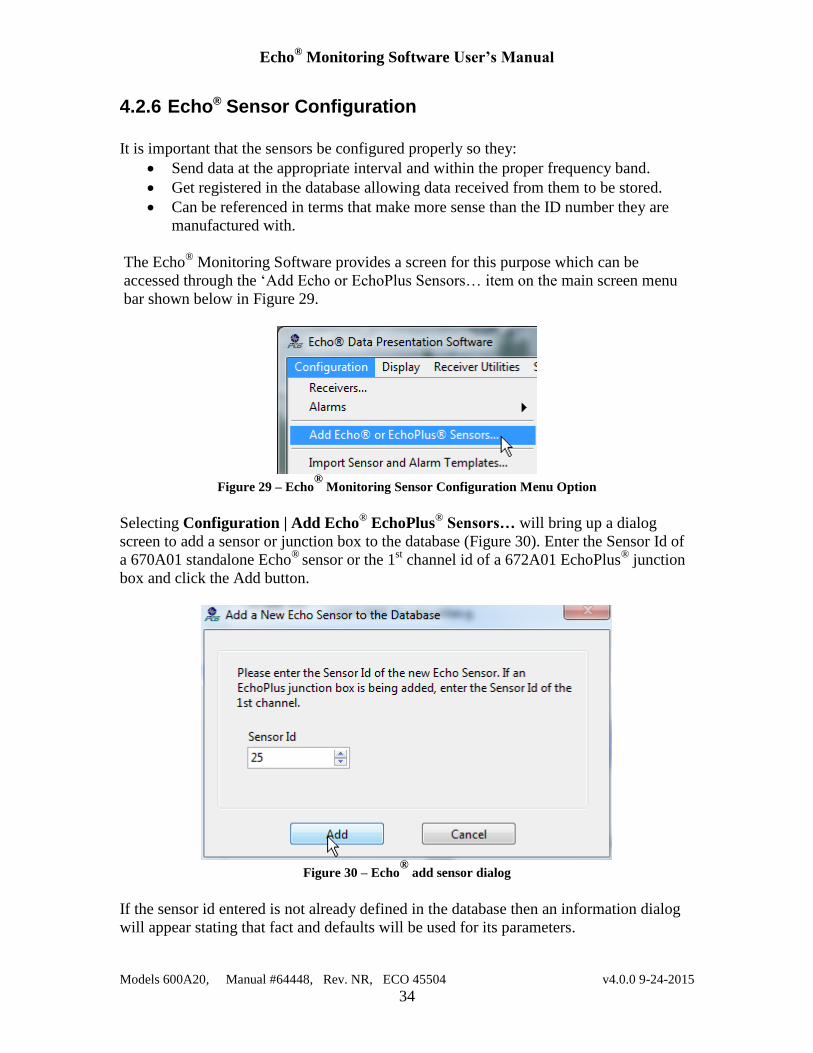
The Echo® Monitoring Software provides a screen for this purpose which can be
accessed through the ‘Add Echo or EchoPlus Sensors… item on the main screen menu
bar shown below in Figure 29.
Figure 29 – Echo
® Monitoring Sensor Configuration Menu Option
Selecting Configuration | Add Echo® EchoPlus
® Sensors… will bring up a dialog
screen to add a sensor or junction box to the database (Figure 30). Enter the Sensor Id of
a 670A01 standalone Echo®
sensor or the 1st channel id of a 672A01 EchoPlus
® junction
box and click the Add button.
Figure 30 – Echo
® add sensor dialog
If the sensor id entered is not already defined in the database then an information dialog
will appear stating that fact and defaults will be used for its parameters.
Echo® Monitoring Software User’s Manual
Models 600A20, Manual #64448, Rev. NR, ECO 45504 v4.0.0 9-24-2015
35
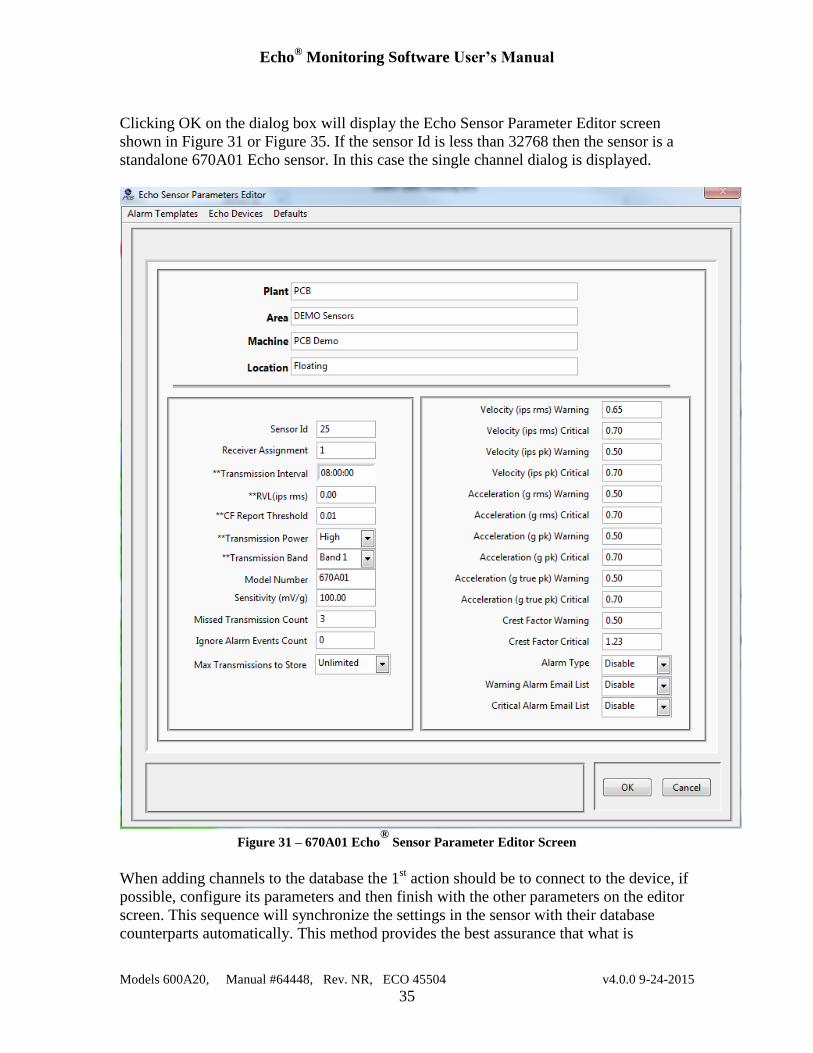
Clicking OK on the dialog box will display the Echo Sensor Parameter Editor screen
shown in Figure 31 or Figure 35. If the sensor Id is less than 32768 then the sensor is a
standalone 670A01 Echo sensor. In this case the single channel dialog is displayed.
Figure 31 – 670A01 Echo
® Sensor Parameter Editor Screen
When adding channels to the database the 1st action should be to connect to the device, if
possible, configure its parameters and then finish with the other parameters on the editor
screen. This sequence will synchronize the settings in the sensor with their database
counterparts automatically. This method provides the best assurance that what is
Echo® Monitoring Software User’s Manual
Models 600A20, Manual #64448, Rev. NR, ECO 45504 v4.0.0 9-24-2015
36
subsequently seen in a sensors database fields accurately reflects the actual sensor
configuration. However, if it is not convenient to connect to the sensor then, at a
minimum, you must set up the data base fields manually so the sensors transmissions will
be recorded.
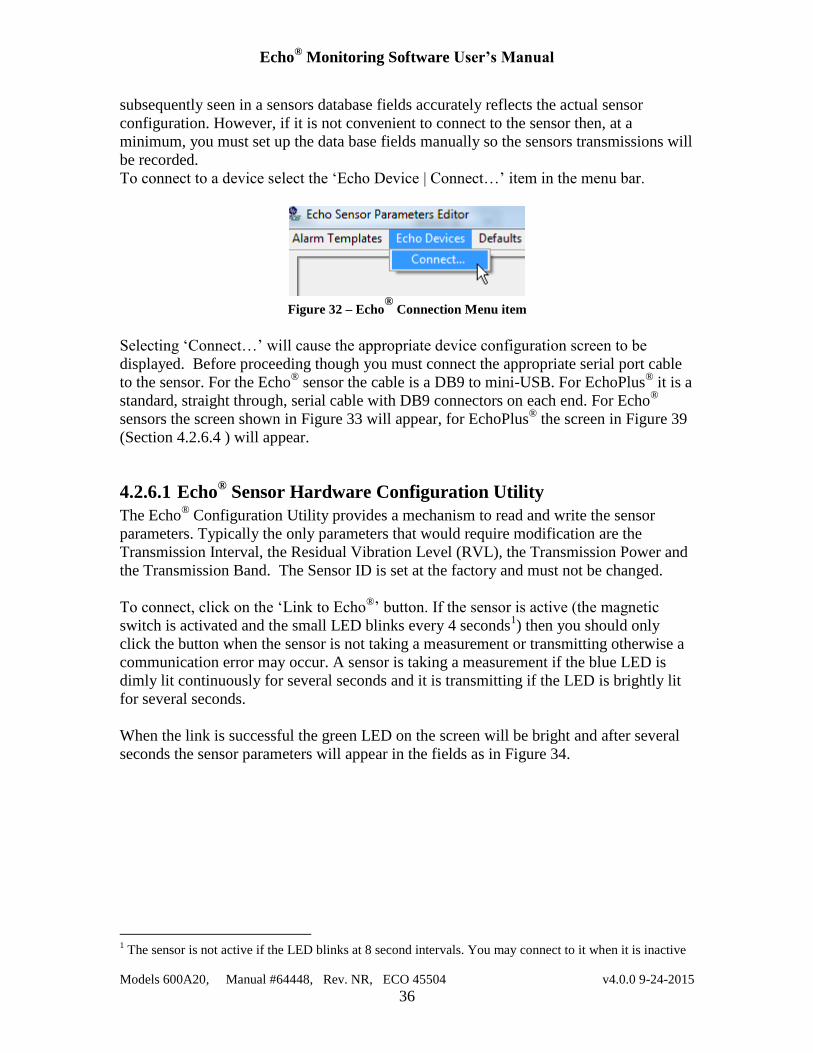
To connect to a device select the ‘Echo Device | Connect…’ item in the menu bar.
Figure 32 – Echo
® Connection Menu item
Selecting ‘Connect…’ will cause the appropriate device configuration screen to be
displayed. Before proceeding though you must connect the appropriate serial port cable
to the sensor. For the Echo® sensor the cable is a DB9 to mini-USB. For EchoPlus
® it is a
standard, straight through, serial cable with DB9 connectors on each end. For Echo®
sensors the screen shown in Figure 33 will appear, for EchoPlus® the screen in Figure 39
(Section 4.2.6.4 ) will appear.
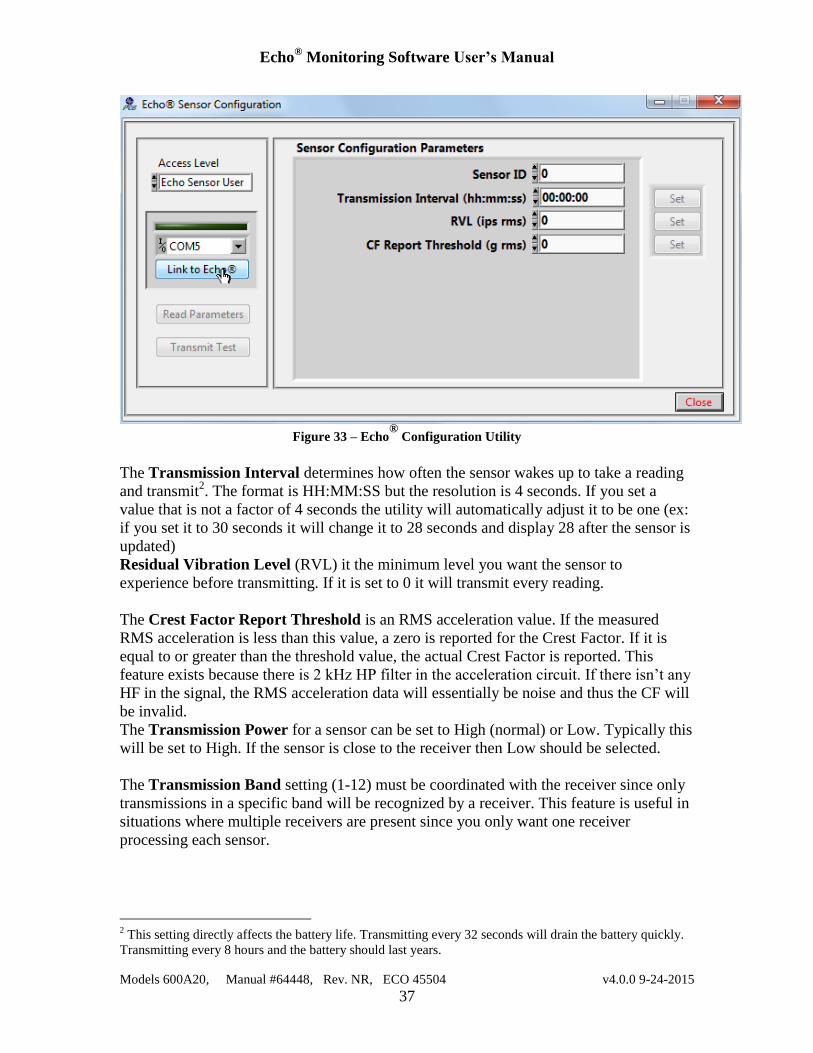
4.2.6.1 Echo® Sensor Hardware Configuration Utility
The Echo® Configuration Utility provides a mechanism to read and write the sensor
parameters. Typically the only parameters that would require modification are the
Transmission Interval, the Residual Vibration Level (RVL), the Transmission Power and
the Transmission Band. The Sensor ID is set at the factory and must not be changed.
To connect, click on the ‘Link to Echo®’ button. If the sensor is active (the magnetic
switch is activated and the small LED blinks every 4 seconds1) then you should only
click the button when the sensor is not taking a measurement or transmitting otherwise a
communication error may occur. A sensor is taking a measurement if the blue LED is
dimly lit continuously for several seconds and it is transmitting if the LED is brightly lit
for several seconds.
When the link is successful the green LED on the screen will be bright and after several
seconds the sensor parameters will appear in the fields as in Figure 34.
1 The sensor is not active if the LED blinks at 8 second intervals. You may connect to it when it is inactive
Echo® Monitoring Software User’s Manual
Models 600A20, Manual #64448, Rev. NR, ECO 45504 v4.0.0 9-24-2015
37
Figure 33 – Echo
® Configuration Utility
The Transmission Interval determines how often the sensor wakes up to take a reading
and transmit2. The format is HH:MM:SS but the resolution is 4 seconds. If you set a
value that is not a factor of 4 seconds the utility will automatically adjust it to be one (ex:
if you set it to 30 seconds it will change it to 28 seconds and display 28 after the sensor is
updated)
Residual Vibration Level (RVL) it the minimum level you want the sensor to
experience before transmitting. If it is set to 0 it will transmit every reading.
The Crest Factor Report Threshold is an RMS acceleration value. If the measured
RMS acceleration is less than this value, a zero is reported for the Crest Factor. If it is
equal to or greater than the threshold value, the actual Crest Factor is reported. This
feature exists because there is 2 kHz HP filter in the acceleration circuit. If there isn’t any
HF in the signal, the RMS acceleration data will essentially be noise and thus the CF will
be invalid.
The Transmission Power for a sensor can be set to High (normal) or Low. Typically this
will be set to High. If the sensor is close to the receiver then Low should be selected.
The Transmission Band setting (1-12) must be coordinated with the receiver since only
transmissions in a specific band will be recognized by a receiver. This feature is useful in
situations where multiple receivers are present since you only want one receiver
processing each sensor.
2 This setting directly affects the battery life. Transmitting every 32 seconds will drain the battery quickly.
Transmitting every 8 hours and the battery should last years.
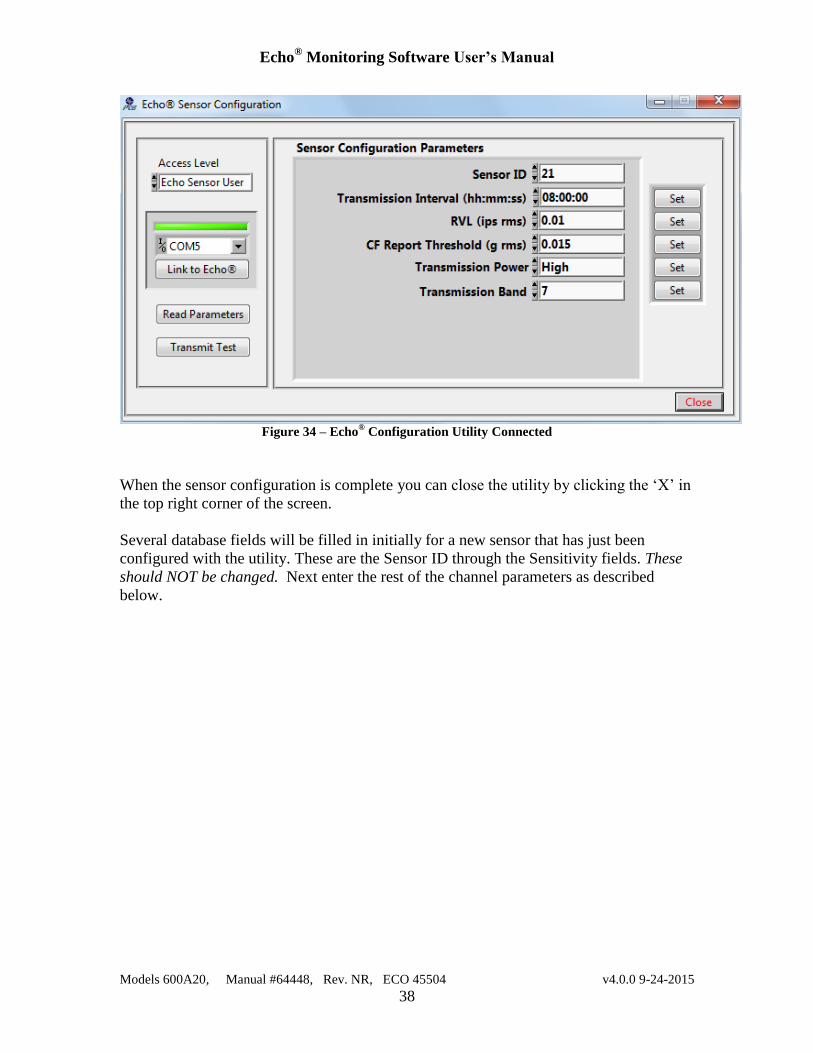
Echo® Monitoring Software User’s Manual
Models 600A20, Manual #64448, Rev. NR, ECO 45504 v4.0.0 9-24-2015
38
Figure 34 – Echo
® Configuration Utility Connected
When the sensor configuration is complete you can close the utility by clicking the ‘X’ in
the top right corner of the screen.
Several database fields will be filled in initially for a new sensor that has just been
configured with the utility. These are the Sensor ID through the Sensitivity fields. These
should NOT be changed. Next enter the rest of the channel parameters as described
below.
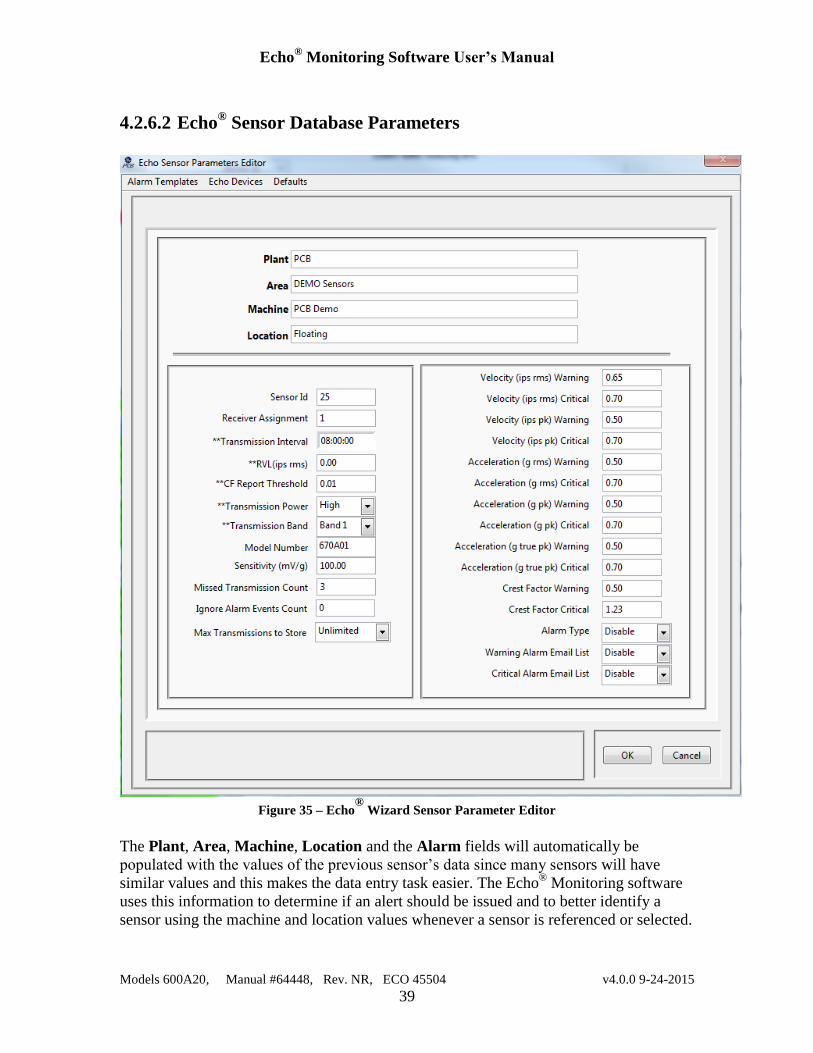
Echo® Monitoring Software User’s Manual
Models 600A20, Manual #64448, Rev. NR, ECO 45504 v4.0.0 9-24-2015
39
4.2.6.2 Echo® Sensor Database Parameters
Figure 35 – Echo
® Wizard Sensor Parameter Editor
The Plant, Area, Machine, Location and the Alarm fields will automatically be
populated with the values of the previous sensor’s data since many sensors will have
similar values and this makes the data entry task easier. The Echo® Monitoring software
uses this information to determine if an alert should be issued and to better identify a
sensor using the machine and location values whenever a sensor is referenced or selected.
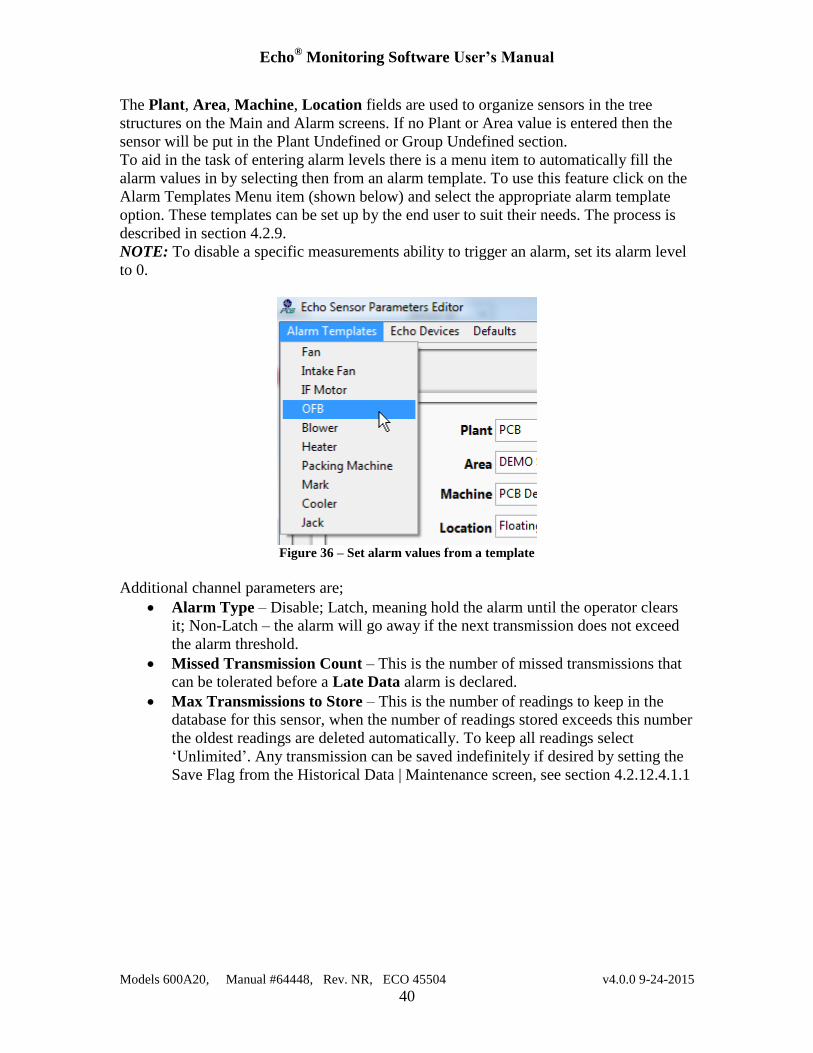
Echo® Monitoring Software User’s Manual
Models 600A20, Manual #64448, Rev. NR, ECO 45504 v4.0.0 9-24-2015
40
The Plant, Area, Machine, Location fields are used to organize sensors in the tree
structures on the Main and Alarm screens. If no Plant or Area value is entered then the
sensor will be put in the Plant Undefined or Group Undefined section.
To aid in the task of entering alarm levels there is a menu item to automatically fill the
alarm values in by selecting then from an alarm template. To use this feature click on the
Alarm Templates Menu item (shown below) and select the appropriate alarm template
option. These templates can be set up by the end user to suit their needs. The process is
described in section 4.2.9.
NOTE: To disable a specific measurements ability to trigger an alarm, set its alarm level
to 0.
Figure 36 – Set alarm values from a template
Additional channel parameters are;
Alarm Type – Disable; Latch, meaning hold the alarm until the operator clears
it; Non-Latch – the alarm will go away if the next transmission does not exceed
the alarm threshold.
Missed Transmission Count – This is the number of missed transmissions that
can be tolerated before a Late Data alarm is declared.
Max Transmissions to Store – This is the number of readings to keep in the
database for this sensor, when the number of readings stored exceeds this number
the oldest readings are deleted automatically. To keep all readings select
‘Unlimited’. Any transmission can be saved indefinitely if desired by setting the
Save Flag from the Historical Data | Maintenance screen, see section 4.2.12.4.1.1
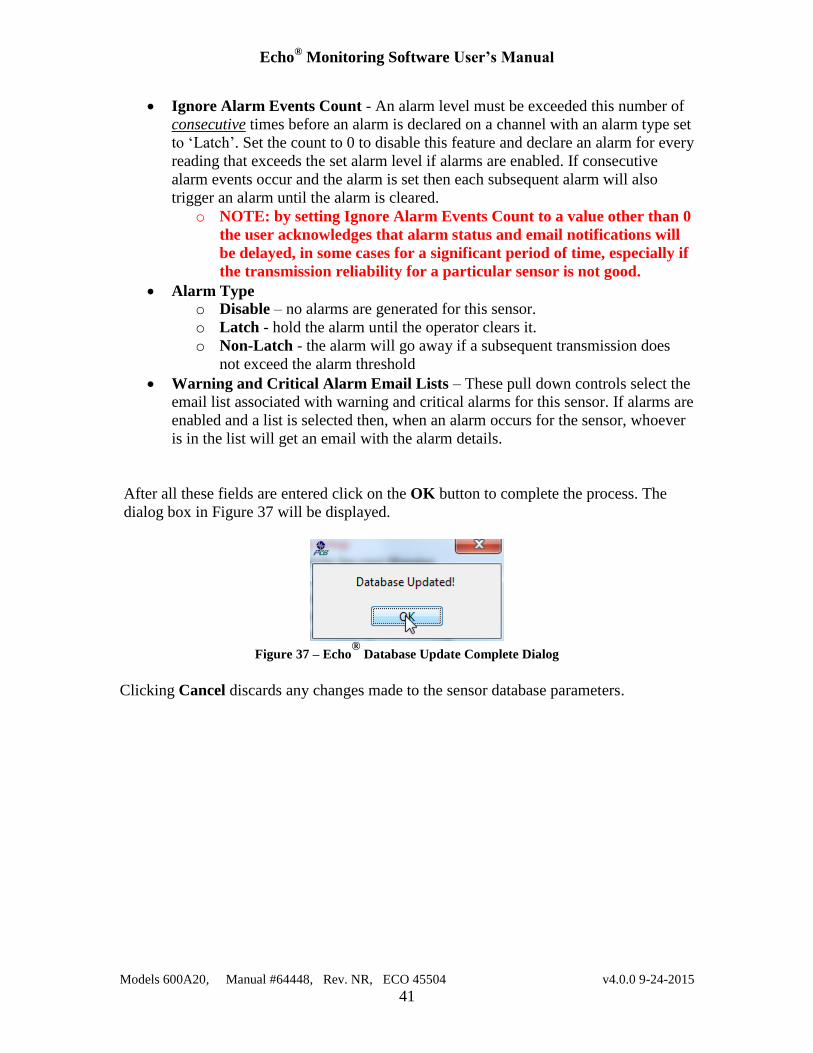
Echo® Monitoring Software User’s Manual
Models 600A20, Manual #64448, Rev. NR, ECO 45504 v4.0.0 9-24-2015
41
Ignore Alarm Events Count - An alarm level must be exceeded this number of
consecutive times before an alarm is declared on a channel with an alarm type set
to ‘Latch’. Set the count to 0 to disable this feature and declare an alarm for every
reading that exceeds the set alarm level if alarms are enabled. If consecutive
alarm events occur and the alarm is set then each subsequent alarm will also
trigger an alarm until the alarm is cleared.
o NOTE: by setting Ignore Alarm Events Count to a value other than 0
the user acknowledges that alarm status and email notifications will
be delayed, in some cases for a significant period of time, especially if
the transmission reliability for a particular sensor is not good.
Alarm Type o Disable – no alarms are generated for this sensor.
o Latch - hold the alarm until the operator clears it.
o Non-Latch - the alarm will go away if a subsequent transmission does
not exceed the alarm threshold
Warning and Critical Alarm Email Lists – These pull down controls select the
email list associated with warning and critical alarms for this sensor. If alarms are
enabled and a list is selected then, when an alarm occurs for the sensor, whoever
is in the list will get an email with the alarm details.
After all these fields are entered click on the OK button to complete the process. The
dialog box in Figure 37 will be displayed.
Figure 37 – Echo
® Database Update Complete Dialog
Clicking Cancel discards any changes made to the sensor database parameters.
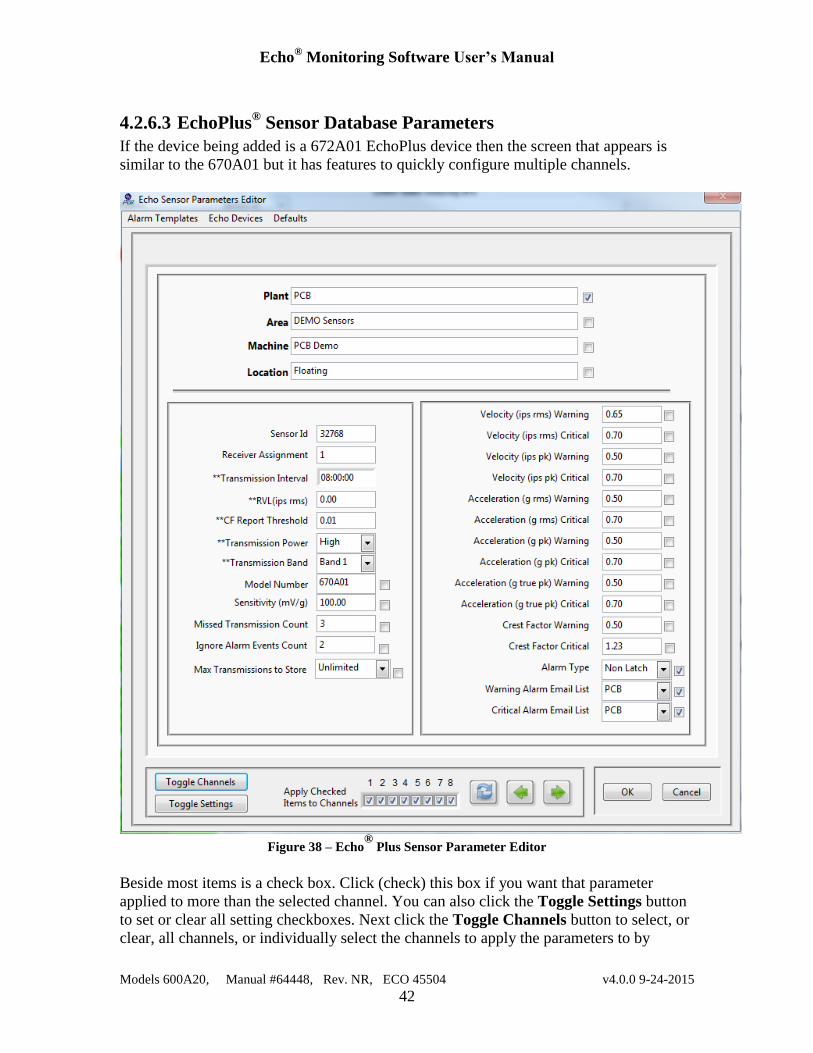
Echo® Monitoring Software User’s Manual
Models 600A20, Manual #64448, Rev. NR, ECO 45504 v4.0.0 9-24-2015
42
4.2.6.3 EchoPlus® Sensor Database Parameters
If the device being added is a 672A01 EchoPlus device then the screen that appears is
similar to the 670A01 but it has features to quickly configure multiple channels.
Figure 38 – Echo
® Plus Sensor Parameter Editor
Beside most items is a check box. Click (check) this box if you want that parameter
applied to more than the selected channel. You can also click the Toggle Settings button
to set or clear all setting checkboxes. Next click the Toggle Channels button to select, or
clear, all channels, or individually select the channels to apply the parameters to by

Echo® Monitoring Software User’s Manual
Models 600A20, Manual #64448, Rev. NR, ECO 45504 v4.0.0 9-24-2015
43
clicking the channel check boxes at the bottom of the screen. When the parameters are set
and the check boxes are checked click on the Update button to apply the settings.
Note: the Update button only appears when more than 1 channel is selected.
To cycle through the channels click the left or right arrow buttons. These navigate
through the channels and display the channels parameters.
When all parameters are set appropriately click OK to apply them to the table.
Alternately, to cancel and changes, click the Cancel button.
To save the changes made to the channels in the database click the Write to Database
button.
The menu bar has two quick setting items to set the alarms for the displayed channel from
the alarm templates and to set the parameters to their default values.
Note: The Sensor ID for junction boxes is always in groups of 8 starting with the id
32768. The editor will make sure this convention is followed. The 1st channel will always
be set to an 8 channel multiple and next 7 will increment from it. Additionally, the
Transmission Power and Transmission Band values apply to all channels in the
junction box. Whenever they are changed, that settings will be applied to all channels no
matter which channel of the junction box is displayed when they are changed.
4.2.6.4 EchoPlus® Sensor Device Configuration Utility
The EchoPlus® Device Configuration Utility provides a mechanism to read and write the
sensor parameters for all of the channels in an EchoPlus® junction box. These values are
saved on and used by the hardware itself. It is similar to the Echo® Configuration Utility
except it works with multiple channels and provides a calibration capability to fine tune
the data transmitted for the sensors connected to it which, unlike the single channel
670A01, can have different sensitivity sensors connected to it. As with the Echo®
Sensors, the only parameters that would require modification are the Transmission
Interval, the Residual Vibration Level (RVL) and the Crest Factor Threshold. The
Calibration utility available on the menu bar should be used to change the channel gain
for acceleration and velocity. The Sensor ID is set at the factory and must not be changed.
See section 4.2.6.1 for a detailed description of these parameters.
To connect, click on the ‘Link to EchoPlus®’ button as shown in Figure 39 below. If the
junction box is not transmitting this connection will cause all 8 blue LEDS in the box to
light and stay lit until the cable is disconnected. When in this state the box will not
transmit data.
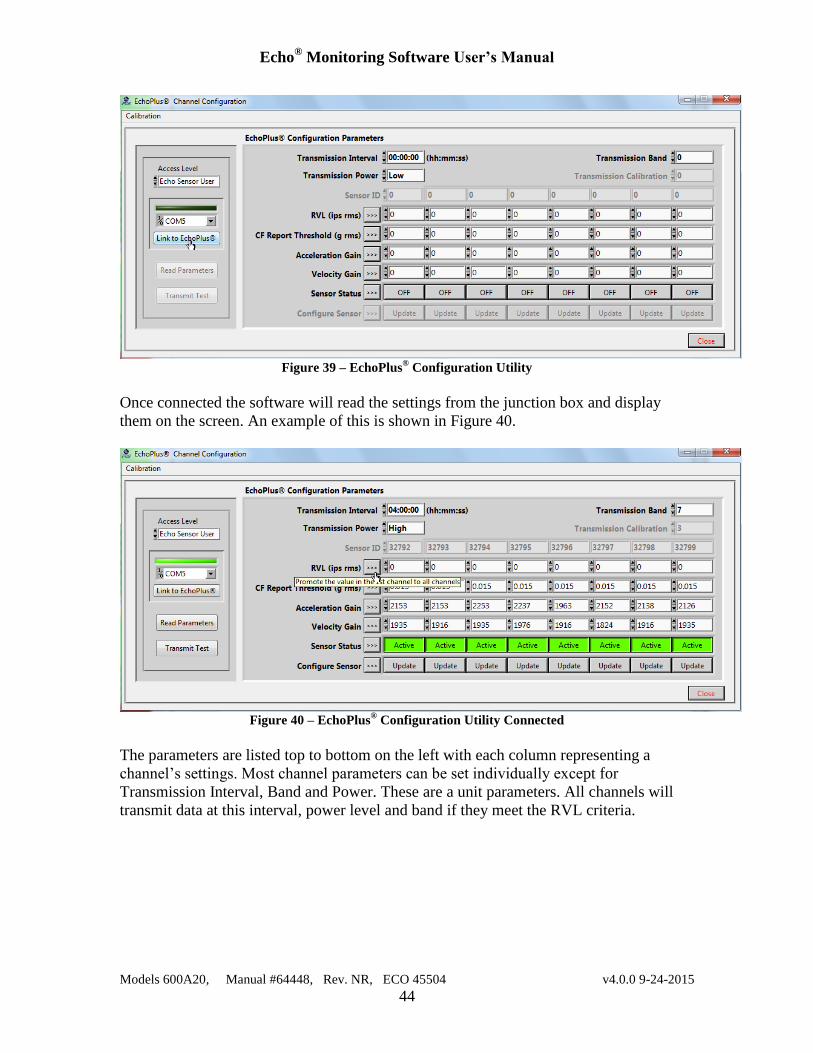
Echo® Monitoring Software User’s Manual
Models 600A20, Manual #64448, Rev. NR, ECO 45504 v4.0.0 9-24-2015
44
Figure 39 – EchoPlus
® Configuration Utility
Once connected the software will read the settings from the junction box and display
them on the screen. An example of this is shown in Figure 40.
Figure 40 – EchoPlus
® Configuration Utility Connected
The parameters are listed top to bottom on the left with each column representing a
channel’s settings. Most channel parameters can be set individually except for
Transmission Interval, Band and Power. These are a unit parameters. All channels will
transmit data at this interval, power level and band if they meet the RVL criteria.
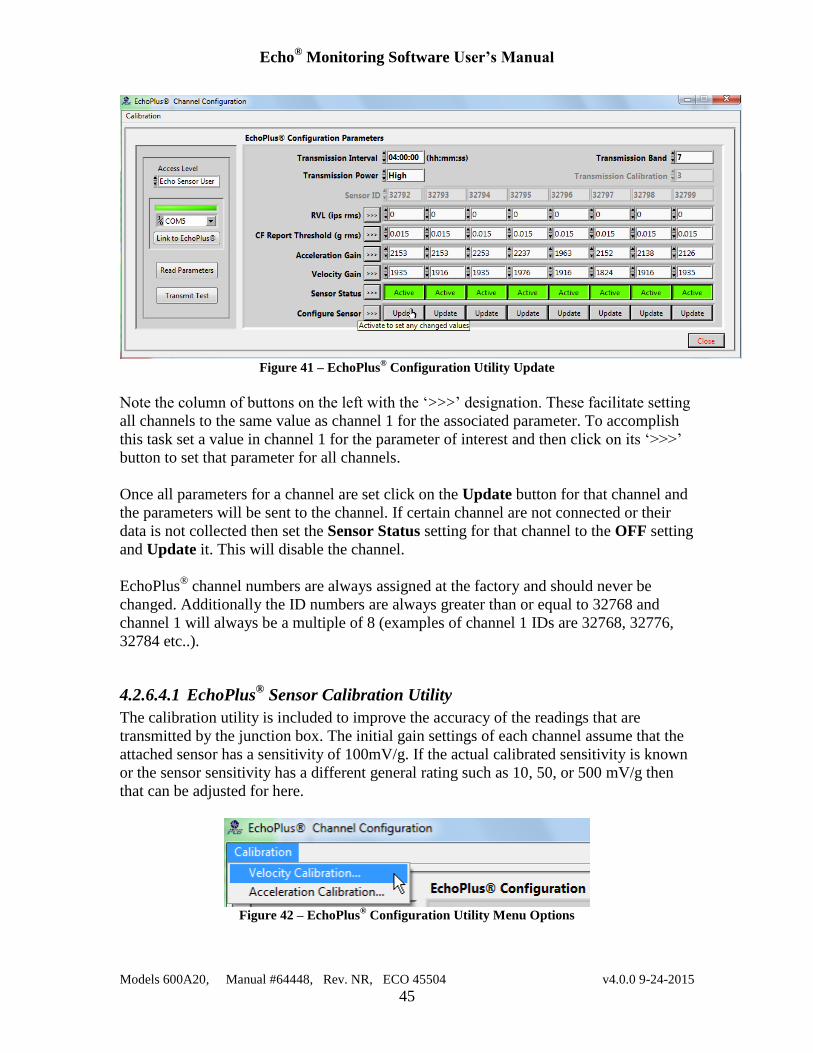
Echo® Monitoring Software User’s Manual
Models 600A20, Manual #64448, Rev. NR, ECO 45504 v4.0.0 9-24-2015
45
Figure 41 – EchoPlus
® Configuration Utility Update
Note the column of buttons on the left with the ‘>>>’ designation. These facilitate setting
all channels to the same value as channel 1 for the associated parameter. To accomplish
this task set a value in channel 1 for the parameter of interest and then click on its ‘>>>’
button to set that parameter for all channels.
Once all parameters for a channel are set click on the Update button for that channel and
the parameters will be sent to the channel. If certain channel are not connected or their
data is not collected then set the Sensor Status setting for that channel to the OFF setting
and Update it. This will disable the channel.
EchoPlus® channel numbers are always assigned at the factory and should never be
changed. Additionally the ID numbers are always greater than or equal to 32768 and
channel 1 will always be a multiple of 8 (examples of channel 1 IDs are 32768, 32776,
32784 etc..).
4.2.6.4.1 EchoPlus® Sensor Calibration Utility
The calibration utility is included to improve the accuracy of the readings that are
transmitted by the junction box. The initial gain settings of each channel assume that the
attached sensor has a sensitivity of 100mV/g. If the actual calibrated sensitivity is known
or the sensor sensitivity has a different general rating such as 10, 50, or 500 mV/g then
that can be adjusted for here.
Figure 42 – EchoPlus
® Configuration Utility Menu Options
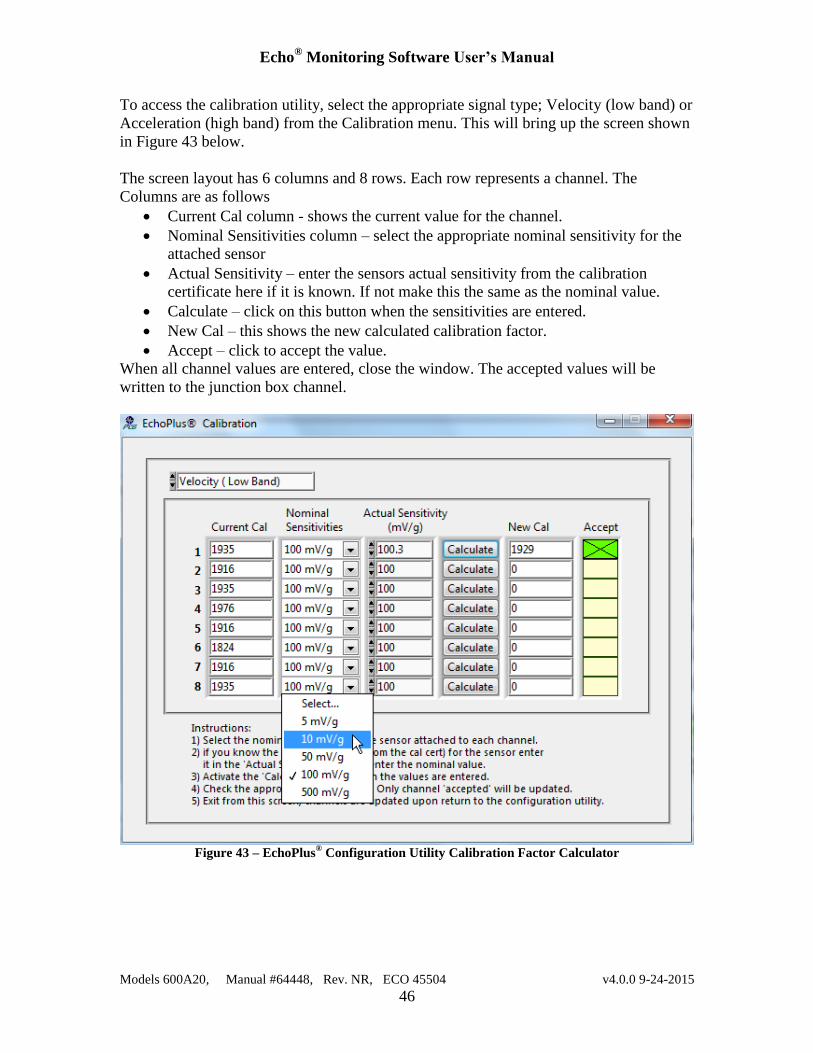
Echo® Monitoring Software User’s Manual
Models 600A20, Manual #64448, Rev. NR, ECO 45504 v4.0.0 9-24-2015
46
To access the calibration utility, select the appropriate signal type; Velocity (low band) or
Acceleration (high band) from the Calibration menu. This will bring up the screen shown
in Figure 43 below.
The screen layout has 6 columns and 8 rows. Each row represents a channel. The
Columns are as follows
Current Cal column - shows the current value for the channel.
Nominal Sensitivities column – select the appropriate nominal sensitivity for the
attached sensor
Actual Sensitivity – enter the sensors actual sensitivity from the calibration
certificate here if it is known. If not make this the same as the nominal value.
Calculate – click on this button when the sensitivities are entered.
New Cal – this shows the new calculated calibration factor.
Accept – click to accept the value.
When all channel values are entered, close the window. The accepted values will be
written to the junction box channel.
Figure 43 – EchoPlus
® Configuration Utility Calibration Factor Calculator
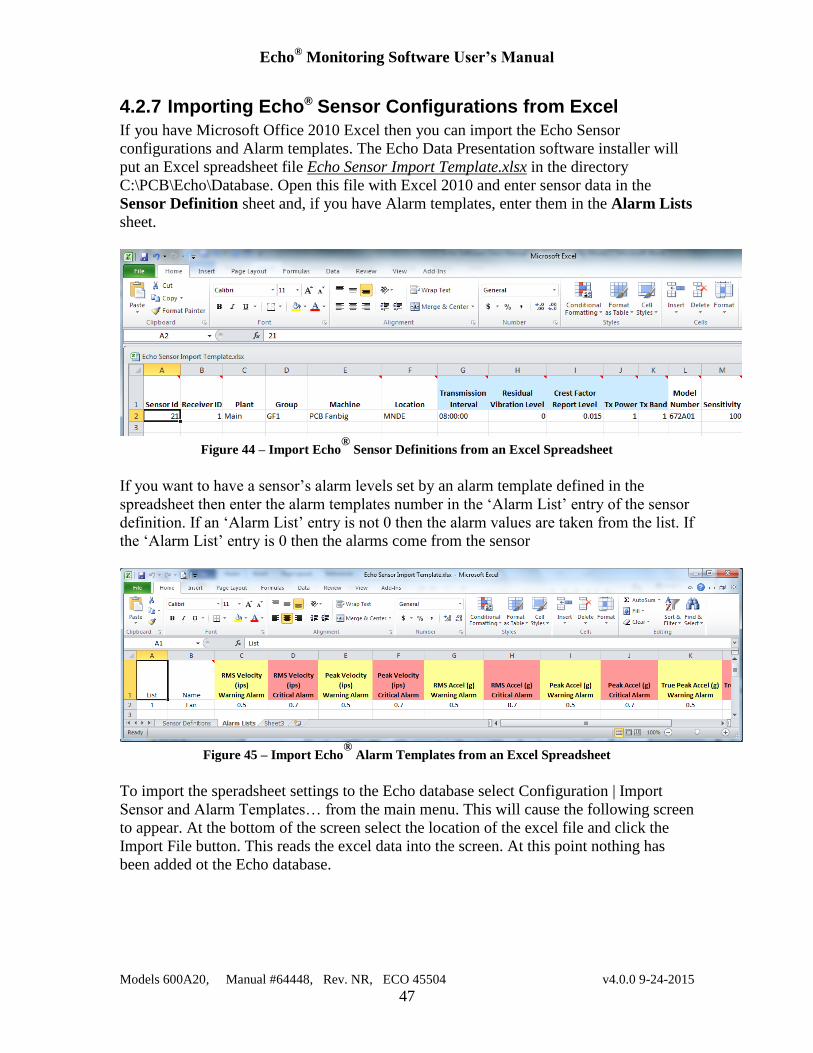
Echo® Monitoring Software User’s Manual
Models 600A20, Manual #64448, Rev. NR, ECO 45504 v4.0.0 9-24-2015
47
4.2.7 Importing Echo® Sensor Configurations from Excel
If you have Microsoft Office 2010 Excel then you can import the Echo Sensor
configurations and Alarm templates. The Echo Data Presentation software installer will
put an Excel spreadsheet file Echo Sensor Import Template.xlsx in the directory
C:\PCB\Echo\Database. Open this file with Excel 2010 and enter sensor data in the
Sensor Definition sheet and, if you have Alarm templates, enter them in the Alarm Lists
sheet.
Figure 44 – Import Echo
® Sensor Definitions from an Excel Spreadsheet
If you want to have a sensor’s alarm levels set by an alarm template defined in the
spreadsheet then enter the alarm templates number in the ‘Alarm List’ entry of the sensor
definition. If an ‘Alarm List’ entry is not 0 then the alarm values are taken from the list. If
the ‘Alarm List’ entry is 0 then the alarms come from the sensor
Figure 45 – Import Echo
® Alarm Templates from an Excel Spreadsheet
To import the speradsheet settings to the Echo database select Configuration | Import
Sensor and Alarm Templates… from the main menu. This will cause the following screen
to appear. At the bottom of the screen select the location of the excel file and click the
Import File button. This reads the excel data into the screen. At this point nothing has
been added ot the Echo database.
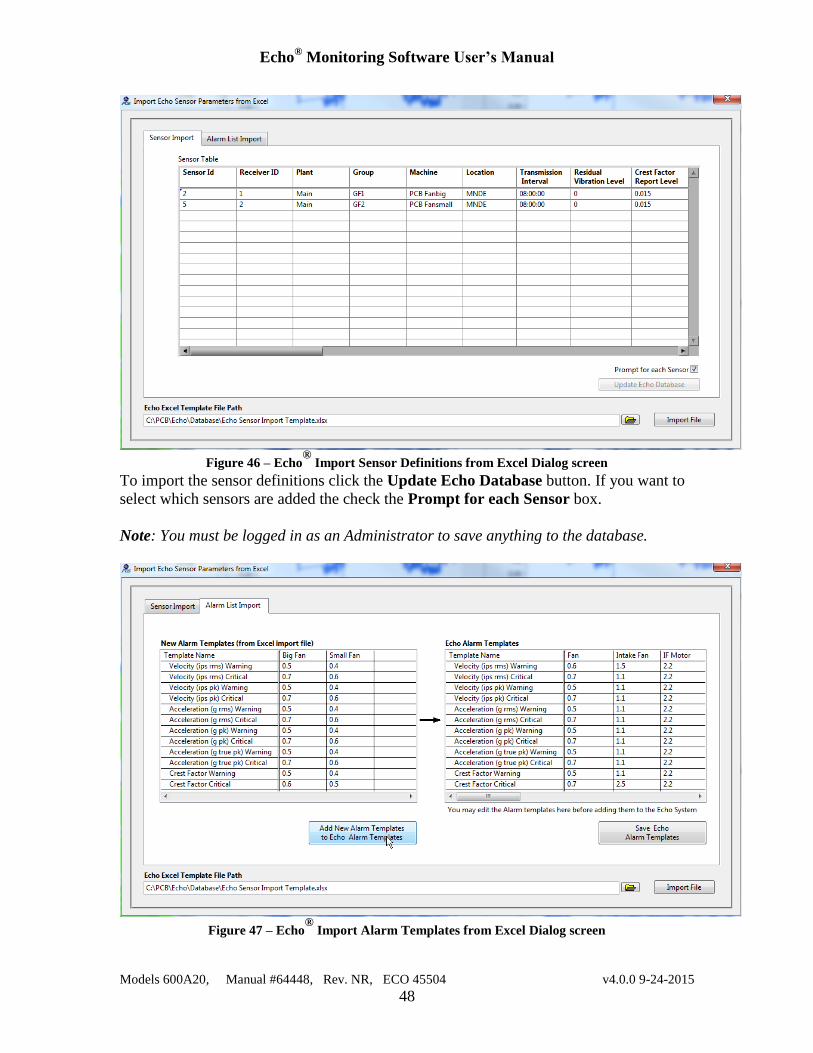
Echo® Monitoring Software User’s Manual
Models 600A20, Manual #64448, Rev. NR, ECO 45504 v4.0.0 9-24-2015
48
Figure 46 – Echo
® Import Sensor Definitions from Excel Dialog screen
To import the sensor definitions click the Update Echo Database button. If you want to
select which sensors are added the check the Prompt for each Sensor box.
Note: You must be logged in as an Administrator to save anything to the database.
Figure 47 – Echo
® Import Alarm Templates from Excel Dialog screen
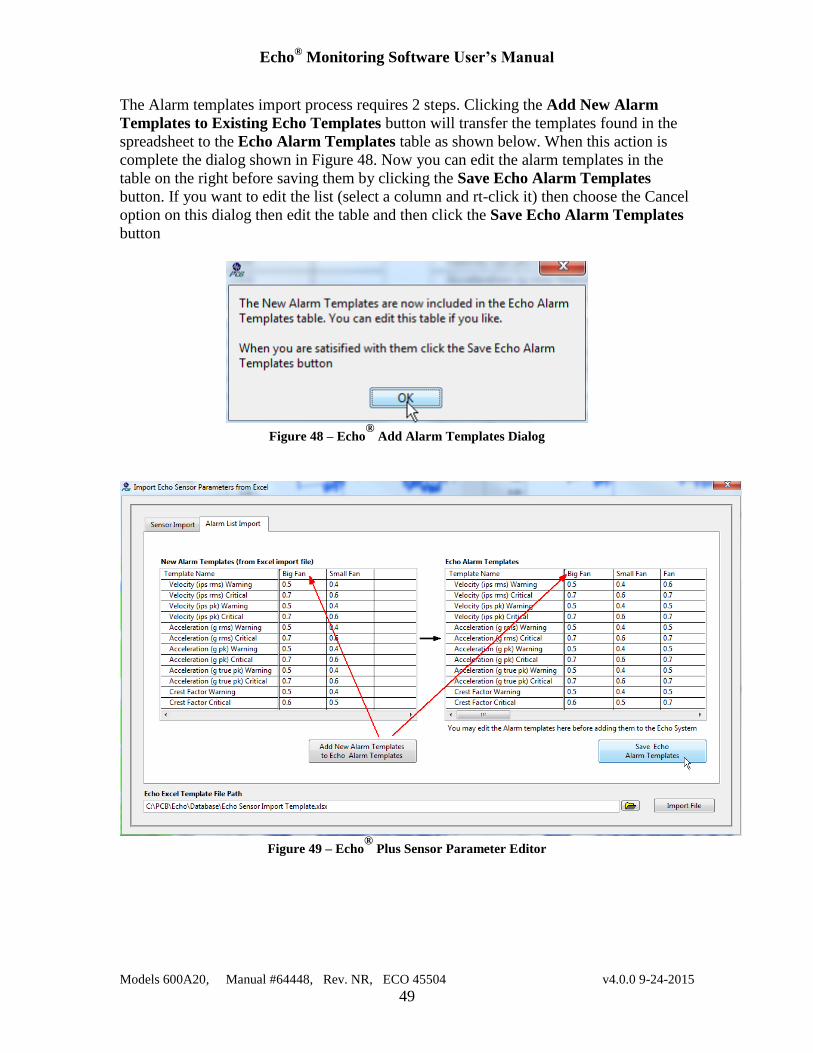
Echo® Monitoring Software User’s Manual
Models 600A20, Manual #64448, Rev. NR, ECO 45504 v4.0.0 9-24-2015
49
The Alarm templates import process requires 2 steps. Clicking the Add New Alarm
Templates to Existing Echo Templates button will transfer the templates found in the
spreadsheet to the Echo Alarm Templates table as shown below. When this action is
complete the dialog shown in Figure 48. Now you can edit the alarm templates in the
table on the right before saving them by clicking the Save Echo Alarm Templates
button. If you want to edit the list (select a column and rt-click it) then choose the Cancel
option on this dialog then edit the table and then click the Save Echo Alarm Templates
button
Figure 48 – Echo
® Add Alarm Templates Dialog
Figure 49 – Echo
® Plus Sensor Parameter Editor
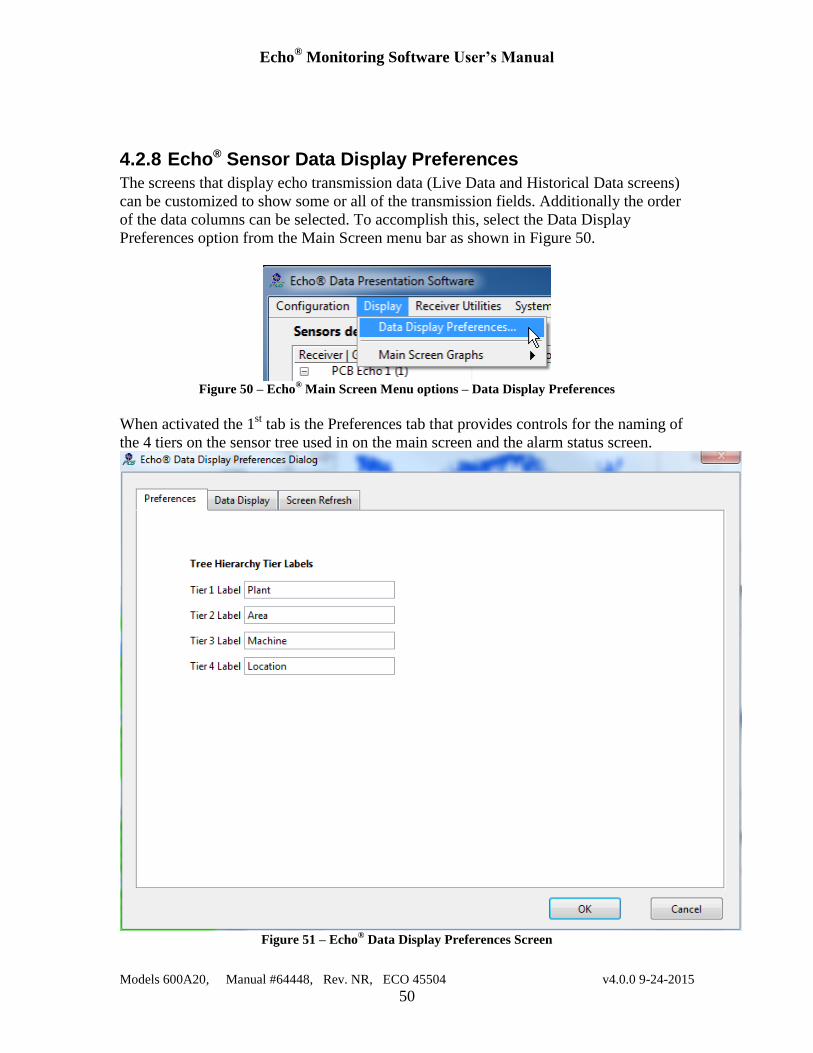
Echo® Monitoring Software User’s Manual
Models 600A20, Manual #64448, Rev. NR, ECO 45504 v4.0.0 9-24-2015
50
4.2.8 Echo® Sensor Data Display Preferences
The screens that display echo transmission data (Live Data and Historical Data screens)
can be customized to show some or all of the transmission fields. Additionally the order
of the data columns can be selected. To accomplish this, select the Data Display
Preferences option from the Main Screen menu bar as shown in Figure 50.
Figure 50 – Echo
® Main Screen Menu options – Data Display Preferences
When activated the 1st tab is the Preferences tab that provides controls for the naming of
the 4 tiers on the sensor tree used in on the main screen and the alarm status screen.
Figure 51 – Echo
® Data Display Preferences Screen
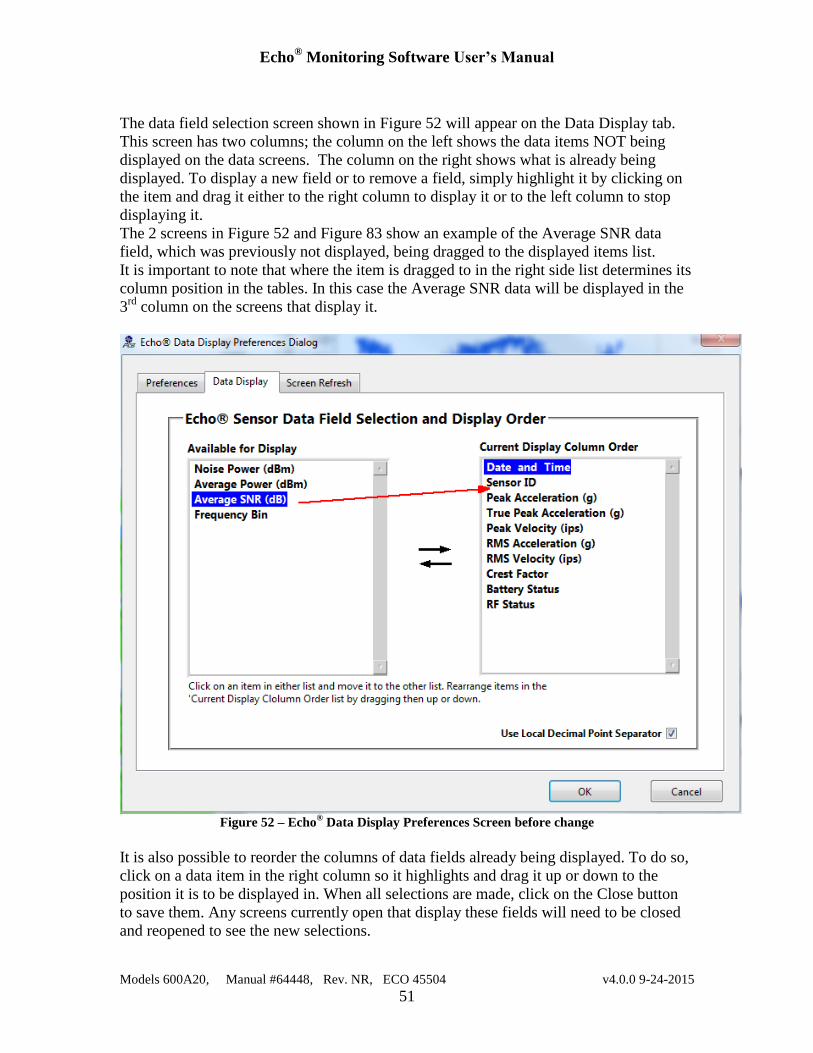
Echo® Monitoring Software User’s Manual
Models 600A20, Manual #64448, Rev. NR, ECO 45504 v4.0.0 9-24-2015
51
The data field selection screen shown in Figure 52 will appear on the Data Display tab.
This screen has two columns; the column on the left shows the data items NOT being
displayed on the data screens. The column on the right shows what is already being
displayed. To display a new field or to remove a field, simply highlight it by clicking on
the item and drag it either to the right column to display it or to the left column to stop
displaying it.
The 2 screens in Figure 52 and Figure 83 show an example of the Average SNR data
field, which was previously not displayed, being dragged to the displayed items list.
It is important to note that where the item is dragged to in the right side list determines its
column position in the tables. In this case the Average SNR data will be displayed in the
3rd
column on the screens that display it.
Figure 52 – Echo
® Data Display Preferences Screen before change
It is also possible to reorder the columns of data fields already being displayed. To do so,
click on a data item in the right column so it highlights and drag it up or down to the
position it is to be displayed in. When all selections are made, click on the Close button
to save them. Any screens currently open that display these fields will need to be closed
and reopened to see the new selections.
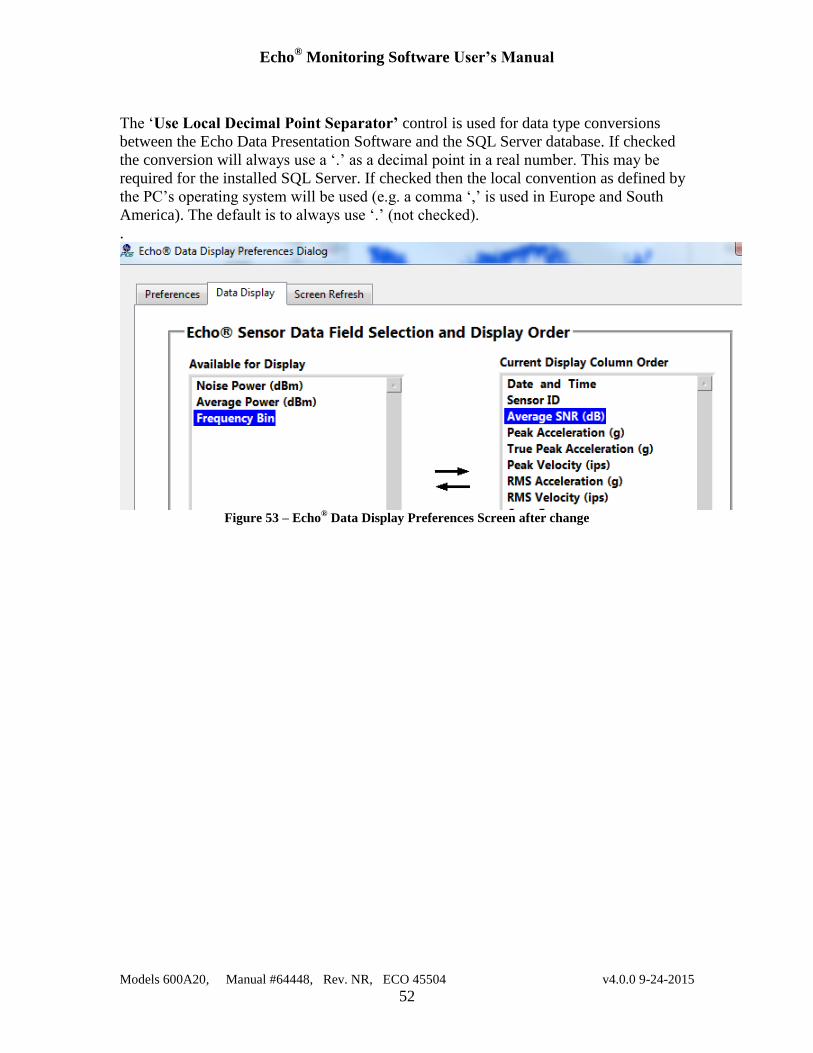
Echo® Monitoring Software User’s Manual
Models 600A20, Manual #64448, Rev. NR, ECO 45504 v4.0.0 9-24-2015
52
The ‘Use Local Decimal Point Separator’ control is used for data type conversions
between the Echo Data Presentation Software and the SQL Server database. If checked
the conversion will always use a ‘.’ as a decimal point in a real number. This may be
required for the installed SQL Server. If checked then the local convention as defined by
the PC’s operating system will be used (e.g. a comma ‘,’ is used in Europe and South
America). The default is to always use ‘.’ (not checked).
.
Figure 53 – Echo
® Data Display Preferences Screen after change
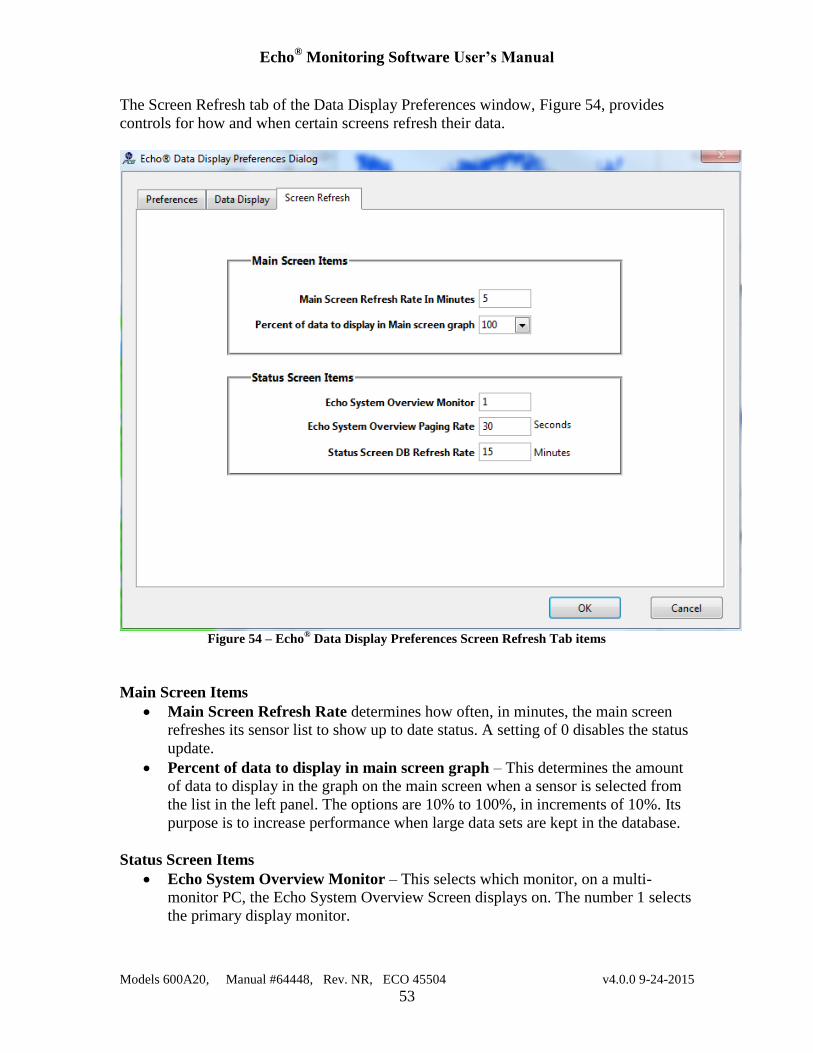
Echo® Monitoring Software User’s Manual
Models 600A20, Manual #64448, Rev. NR, ECO 45504 v4.0.0 9-24-2015
53
The Screen Refresh tab of the Data Display Preferences window, Figure 54, provides
controls for how and when certain screens refresh their data.
Figure 54 – Echo
® Data Display Preferences Screen Refresh Tab items
Main Screen Items
Main Screen Refresh Rate determines how often, in minutes, the main screen
refreshes its sensor list to show up to date status. A setting of 0 disables the status
update.
Percent of data to display in main screen graph – This determines the amount
of data to display in the graph on the main screen when a sensor is selected from
the list in the left panel. The options are 10% to 100%, in increments of 10%. Its
purpose is to increase performance when large data sets are kept in the database.
Status Screen Items
Echo System Overview Monitor – This selects which monitor, on a multi-
monitor PC, the Echo System Overview Screen displays on. The number 1 selects
the primary display monitor.

Echo® Monitoring Software User’s Manual
Models 600A20, Manual #64448, Rev. NR, ECO 45504 v4.0.0 9-24-2015
54
Echo System Overview Paging Rate – If the number of sensors exceeds the
ability of the software to show them in a single page on the Echo System
Overview Screen then the software will break up the list into pages. This is the
rate, in seconds, at which the pages change.
Status Screen DB Refresh Rate – This is the rate, in minutes, that the database is
queried to refresh the data of various status screens. These screens include the
Echo System Overview screen, the System Alarm screens and the Sensor Status
screens.
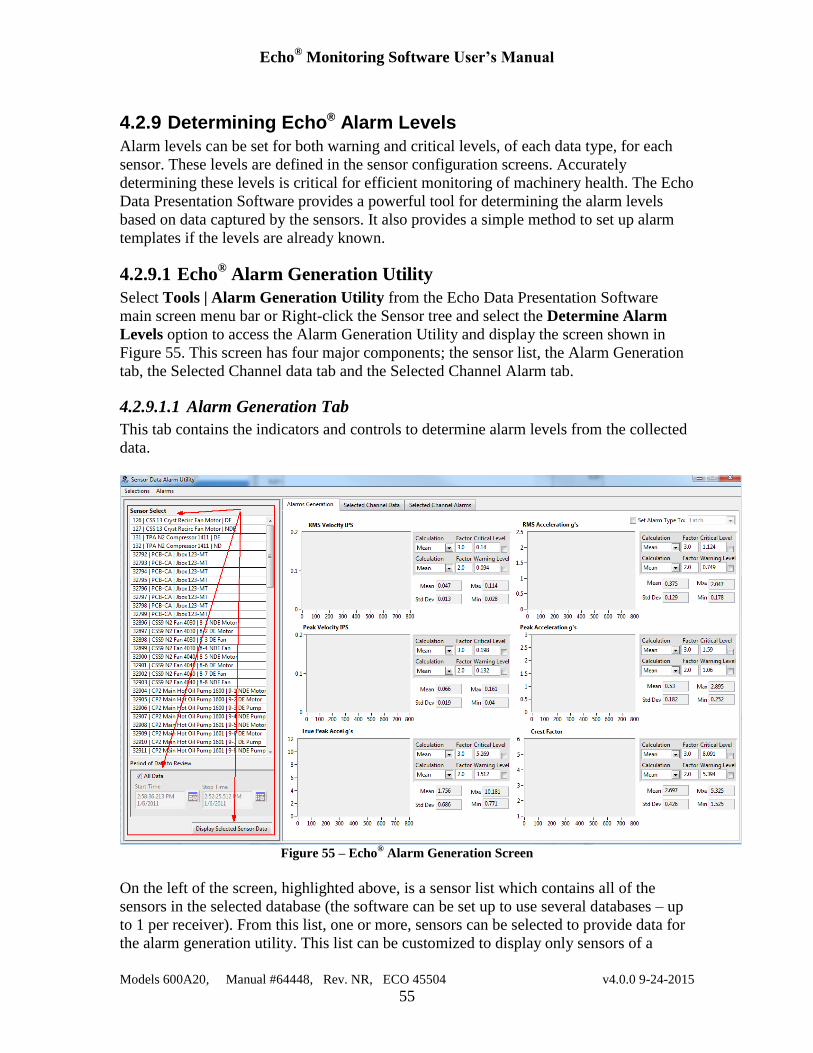
Echo® Monitoring Software User’s Manual
Models 600A20, Manual #64448, Rev. NR, ECO 45504 v4.0.0 9-24-2015
55
4.2.9 Determining Echo® Alarm Levels
Alarm levels can be set for both warning and critical levels, of each data type, for each
sensor. These levels are defined in the sensor configuration screens. Accurately
determining these levels is critical for efficient monitoring of machinery health. The Echo
Data Presentation Software provides a powerful tool for determining the alarm levels
based on data captured by the sensors. It also provides a simple method to set up alarm
templates if the levels are already known.
4.2.9.1 Echo® Alarm Generation Utility
Select Tools | Alarm Generation Utility from the Echo Data Presentation Software
main screen menu bar or Right-click the Sensor tree and select the Determine Alarm
Levels option to access the Alarm Generation Utility and display the screen shown in
Figure 55. This screen has four major components; the sensor list, the Alarm Generation
tab, the Selected Channel data tab and the Selected Channel Alarm tab.
4.2.9.1.1 Alarm Generation Tab
This tab contains the indicators and controls to determine alarm levels from the collected
data.
Figure 55 – Echo
® Alarm Generation Screen
On the left of the screen, highlighted above, is a sensor list which contains all of the
sensors in the selected database (the software can be set up to use several databases – up
to 1 per receiver). From this list, one or more, sensors can be selected to provide data for
the alarm generation utility. This list can be customized to display only sensors of a
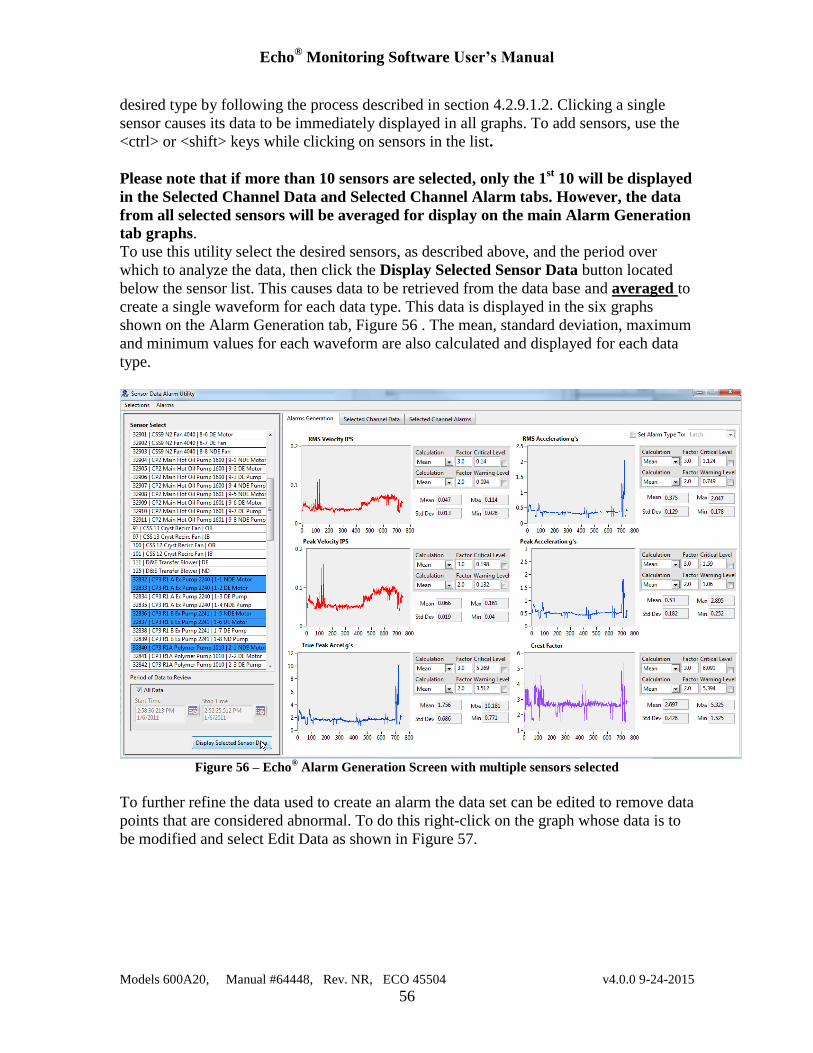
Echo® Monitoring Software User’s Manual
Models 600A20, Manual #64448, Rev. NR, ECO 45504 v4.0.0 9-24-2015
56
desired type by following the process described in section 4.2.9.1.2. Clicking a single
sensor causes its data to be immediately displayed in all graphs. To add sensors, use the
<ctrl> or <shift> keys while clicking on sensors in the list.
Please note that if more than 10 sensors are selected, only the 1st 10 will be displayed
in the Selected Channel Data and Selected Channel Alarm tabs. However, the data
from all selected sensors will be averaged for display on the main Alarm Generation
tab graphs.
To use this utility select the desired sensors, as described above, and the period over
which to analyze the data, then click the Display Selected Sensor Data button located
below the sensor list. This causes data to be retrieved from the data base and averaged to
create a single waveform for each data type. This data is displayed in the six graphs
shown on the Alarm Generation tab, Figure 56 . The mean, standard deviation, maximum
and minimum values for each waveform are also calculated and displayed for each data
type.
Figure 56 – Echo
® Alarm Generation Screen with multiple sensors selected
To further refine the data used to create an alarm the data set can be edited to remove data
points that are considered abnormal. To do this right-click on the graph whose data is to
be modified and select Edit Data as shown in Figure 57.
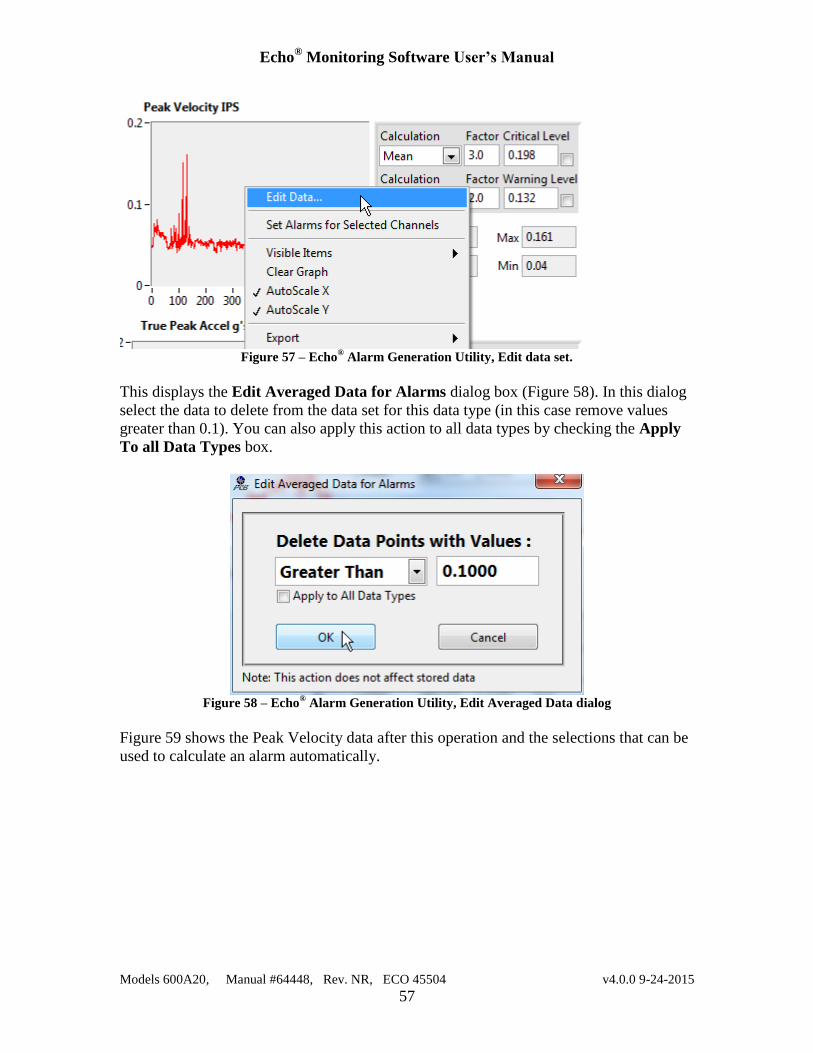
Echo® Monitoring Software User’s Manual
Models 600A20, Manual #64448, Rev. NR, ECO 45504 v4.0.0 9-24-2015
57
Figure 57 – Echo
® Alarm Generation Utility, Edit data set.
This displays the Edit Averaged Data for Alarms dialog box (Figure 58). In this dialog
select the data to delete from the data set for this data type (in this case remove values
greater than 0.1). You can also apply this action to all data types by checking the Apply
To all Data Types box.
Figure 58 – Echo
® Alarm Generation Utility, Edit Averaged Data dialog
Figure 59 shows the Peak Velocity data after this operation and the selections that can be
used to calculate an alarm automatically.
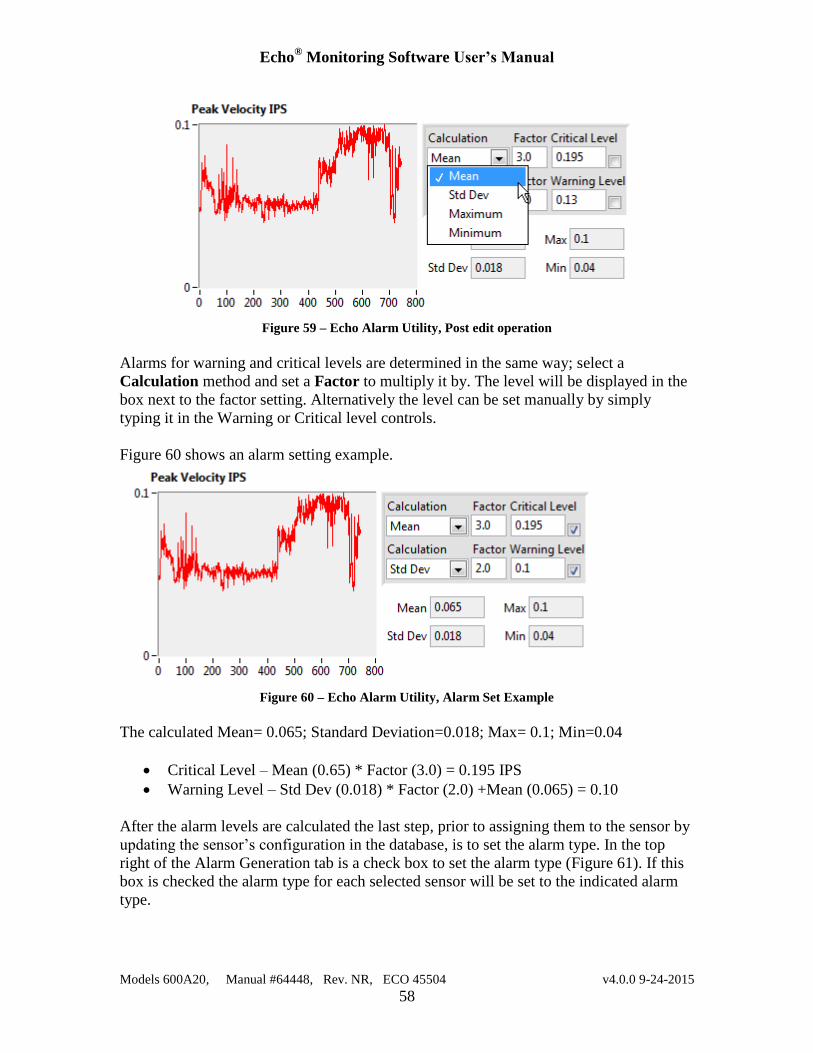
Echo® Monitoring Software User’s Manual
Models 600A20, Manual #64448, Rev. NR, ECO 45504 v4.0.0 9-24-2015
58
Figure 59 – Echo Alarm Utility, Post edit operation
Alarms for warning and critical levels are determined in the same way; select a
Calculation method and set a Factor to multiply it by. The level will be displayed in the
box next to the factor setting. Alternatively the level can be set manually by simply
typing it in the Warning or Critical level controls.
Figure 60 shows an alarm setting example.
Figure 60 – Echo Alarm Utility, Alarm Set Example
The calculated Mean= 0.065; Standard Deviation=0.018; Max= 0.1; Min=0.04
Critical Level – Mean (0.65) * Factor (3.0) = 0.195 IPS
Warning Level – Std Dev (0.018) * Factor (2.0) +Mean (0.065) = 0.10
After the alarm levels are calculated the last step, prior to assigning them to the sensor by
updating the sensor’s configuration in the database, is to set the alarm type. In the top
right of the Alarm Generation tab is a check box to set the alarm type (Figure 61). If this
box is checked the alarm type for each selected sensor will be set to the indicated alarm
type.
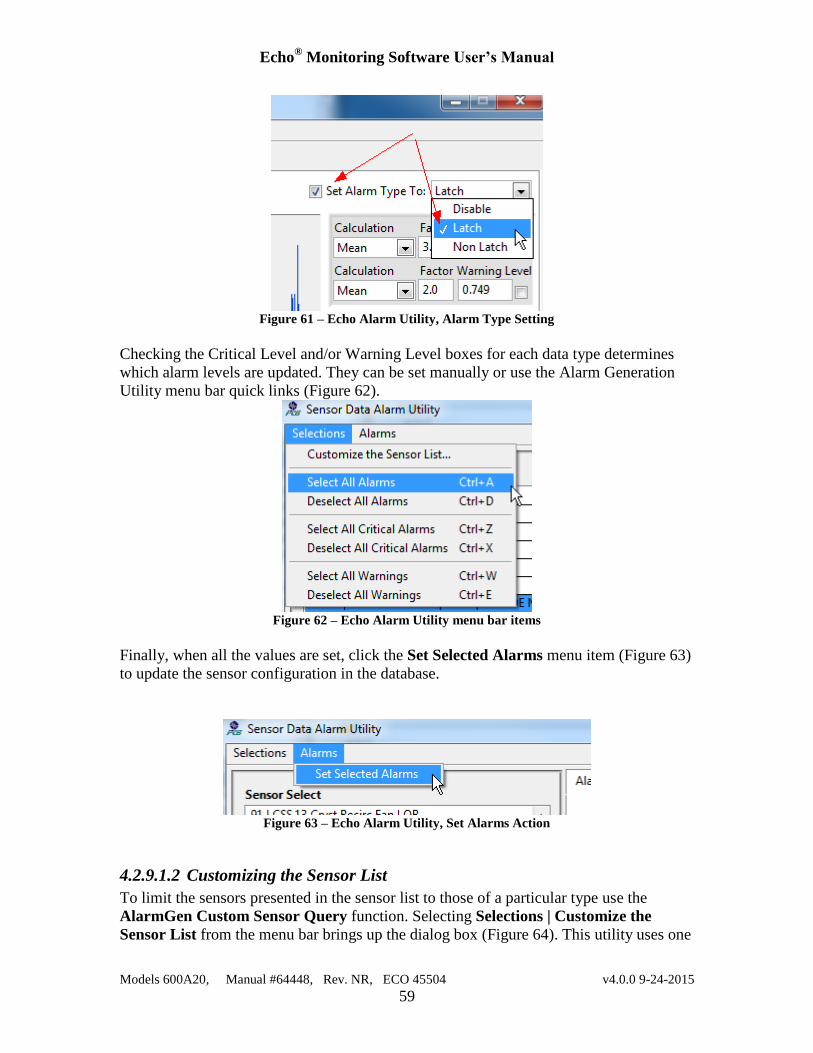
Echo® Monitoring Software User’s Manual
Models 600A20, Manual #64448, Rev. NR, ECO 45504 v4.0.0 9-24-2015
59
Figure 61 – Echo Alarm Utility, Alarm Type Setting
Checking the Critical Level and/or Warning Level boxes for each data type determines
which alarm levels are updated. They can be set manually or use the Alarm Generation
Utility menu bar quick links (Figure 62).
Figure 62 – Echo Alarm Utility menu bar items
Finally, when all the values are set, click the Set Selected Alarms menu item (Figure 63)
to update the sensor configuration in the database.
Figure 63 – Echo Alarm Utility, Set Alarms Action
4.2.9.1.2 Customizing the Sensor List
To limit the sensors presented in the sensor list to those of a particular type use the
AlarmGen Custom Sensor Query function. Selecting Selections | Customize the
Sensor List from the menu bar brings up the dialog box (Figure 64). This utility uses one
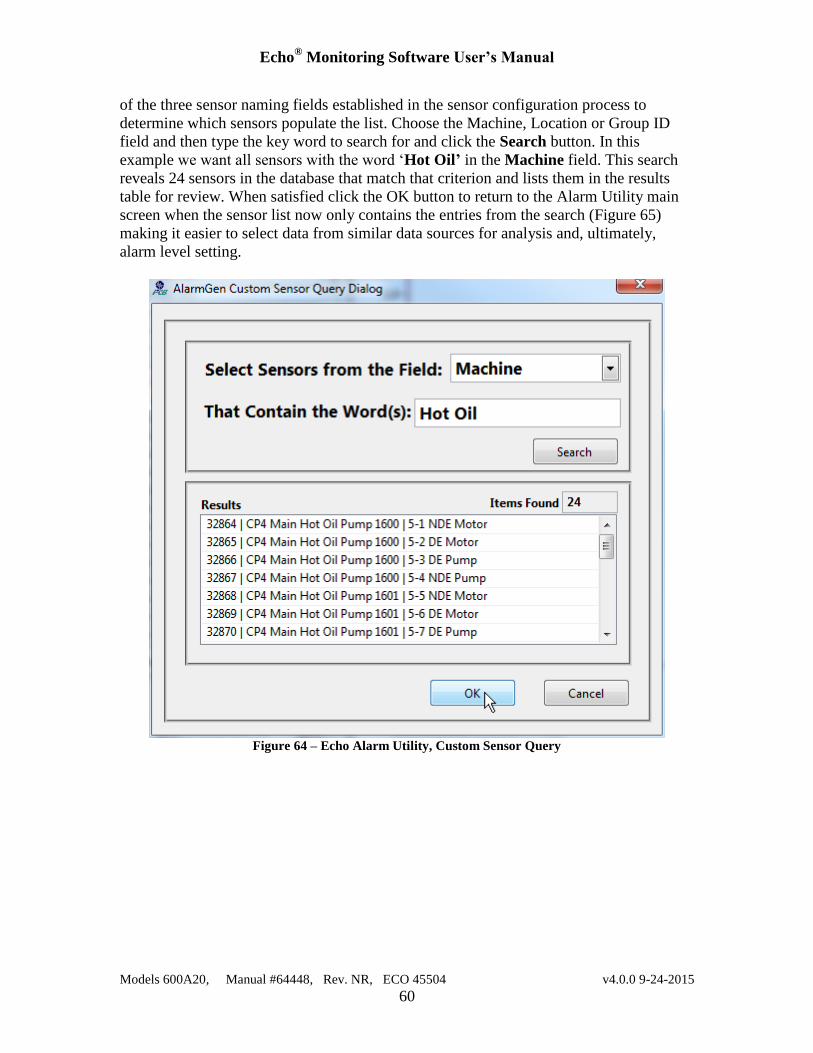
Echo® Monitoring Software User’s Manual
Models 600A20, Manual #64448, Rev. NR, ECO 45504 v4.0.0 9-24-2015
60
of the three sensor naming fields established in the sensor configuration process to
determine which sensors populate the list. Choose the Machine, Location or Group ID
field and then type the key word to search for and click the Search button. In this
example we want all sensors with the word ‘Hot Oil’ in the Machine field. This search
reveals 24 sensors in the database that match that criterion and lists them in the results
table for review. When satisfied click the OK button to return to the Alarm Utility main
screen when the sensor list now only contains the entries from the search (Figure 65)
making it easier to select data from similar data sources for analysis and, ultimately,
alarm level setting.
Figure 64 – Echo Alarm Utility, Custom Sensor Query
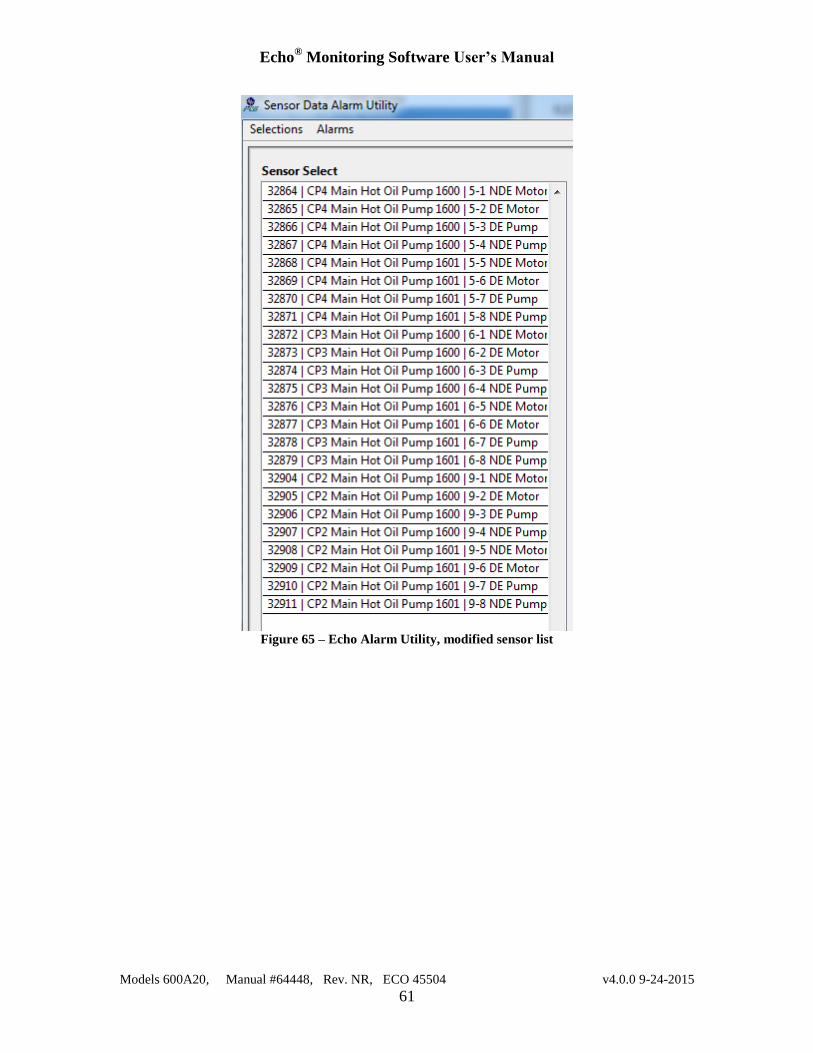
Echo® Monitoring Software User’s Manual
Models 600A20, Manual #64448, Rev. NR, ECO 45504 v4.0.0 9-24-2015
61
Figure 65 – Echo Alarm Utility, modified sensor list
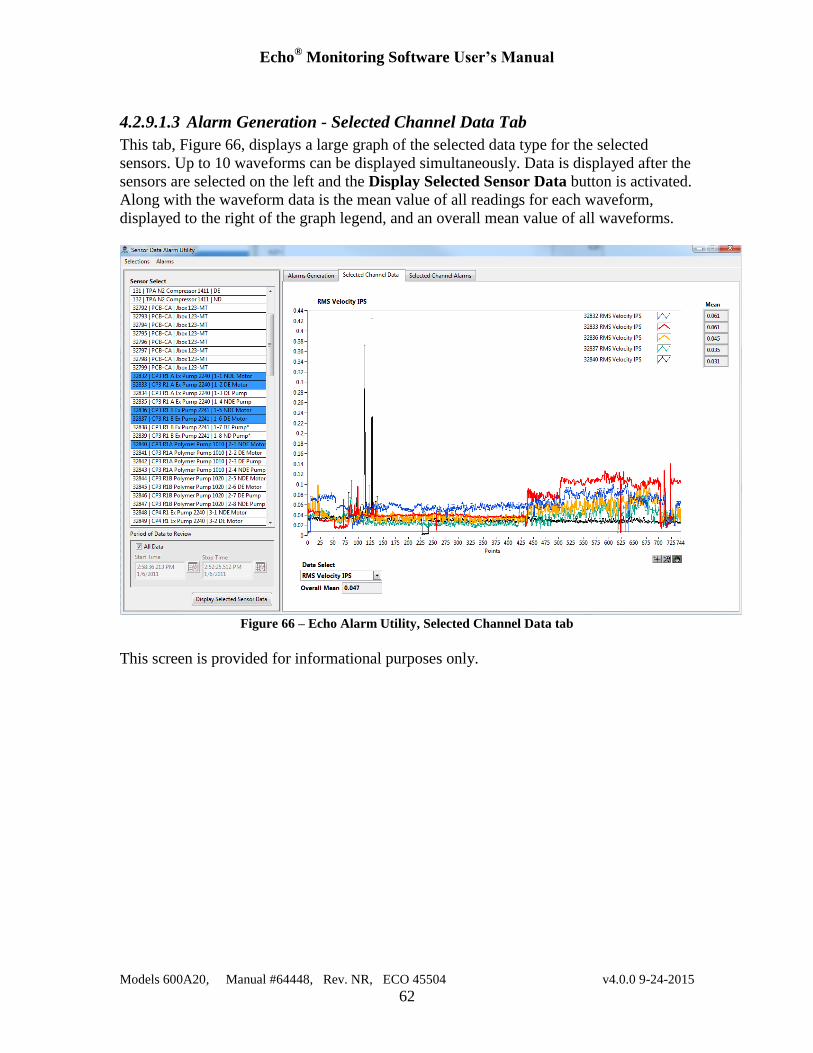
Echo® Monitoring Software User’s Manual
Models 600A20, Manual #64448, Rev. NR, ECO 45504 v4.0.0 9-24-2015
62
4.2.9.1.3 Alarm Generation - Selected Channel Data Tab
This tab, Figure 66, displays a large graph of the selected data type for the selected
sensors. Up to 10 waveforms can be displayed simultaneously. Data is displayed after the
sensors are selected on the left and the Display Selected Sensor Data button is activated.
Along with the waveform data is the mean value of all readings for each waveform,
displayed to the right of the graph legend, and an overall mean value of all waveforms.
Figure 66 – Echo Alarm Utility, Selected Channel Data tab
This screen is provided for informational purposes only.
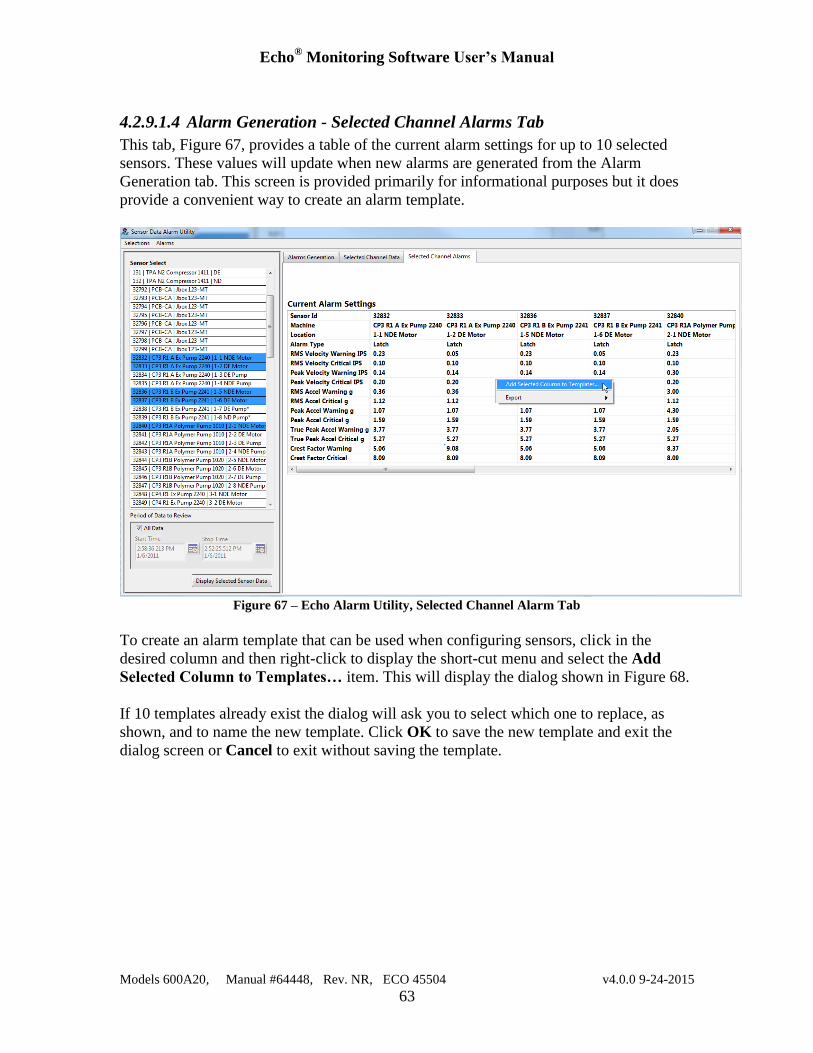
Echo® Monitoring Software User’s Manual
Models 600A20, Manual #64448, Rev. NR, ECO 45504 v4.0.0 9-24-2015
63
4.2.9.1.4 Alarm Generation - Selected Channel Alarms Tab
This tab, Figure 67, provides a table of the current alarm settings for up to 10 selected
sensors. These values will update when new alarms are generated from the Alarm
Generation tab. This screen is provided primarily for informational purposes but it does
provide a convenient way to create an alarm template.
Figure 67 – Echo Alarm Utility, Selected Channel Alarm Tab
To create an alarm template that can be used when configuring sensors, click in the
desired column and then right-click to display the short-cut menu and select the Add
Selected Column to Templates… item. This will display the dialog shown in Figure 68.
If 10 templates already exist the dialog will ask you to select which one to replace, as
shown, and to name the new template. Click OK to save the new template and exit the
dialog screen or Cancel to exit without saving the template.
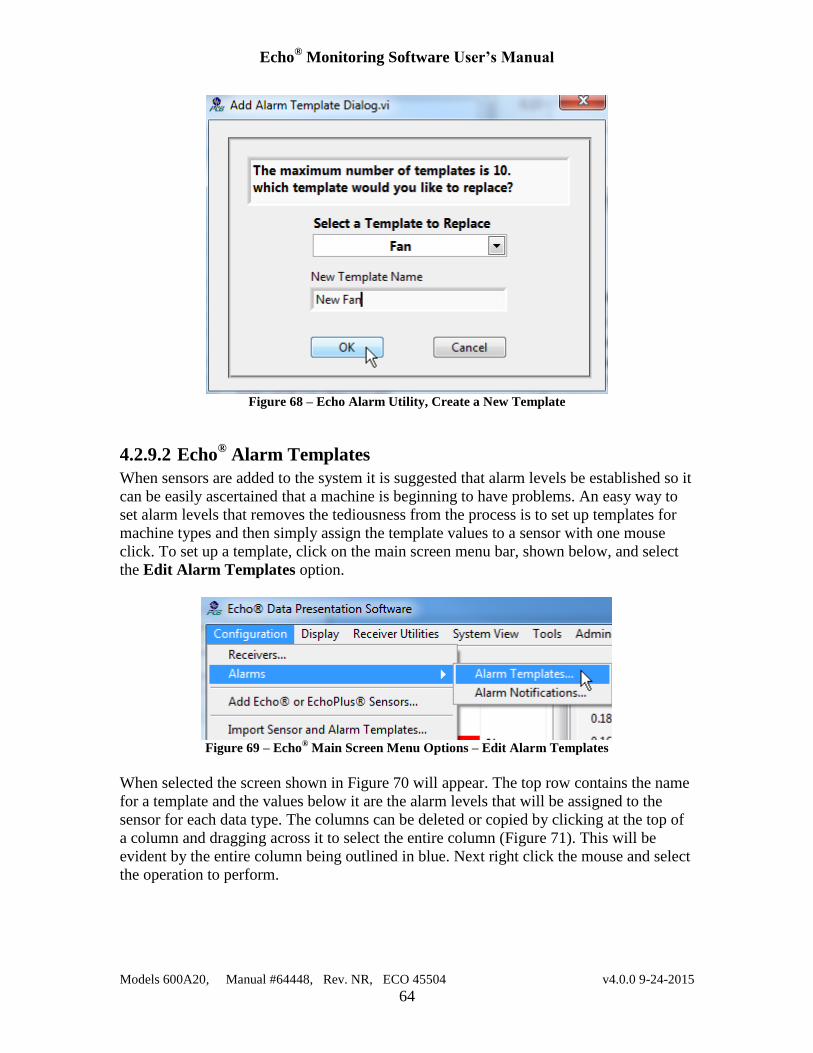
Echo® Monitoring Software User’s Manual
Models 600A20, Manual #64448, Rev. NR, ECO 45504 v4.0.0 9-24-2015
64
Figure 68 – Echo Alarm Utility, Create a New Template
4.2.9.2 Echo® Alarm Templates
When sensors are added to the system it is suggested that alarm levels be established so it
can be easily ascertained that a machine is beginning to have problems. An easy way to
set alarm levels that removes the tediousness from the process is to set up templates for
machine types and then simply assign the template values to a sensor with one mouse
click. To set up a template, click on the main screen menu bar, shown below, and select
the Edit Alarm Templates option.
Figure 69 – Echo
® Main Screen Menu Options – Edit Alarm Templates
When selected the screen shown in Figure 70 will appear. The top row contains the name
for a template and the values below it are the alarm levels that will be assigned to the
sensor for each data type. The columns can be deleted or copied by clicking at the top of
a column and dragging across it to select the entire column (Figure 71). This will be
evident by the entire column being outlined in blue. Next right click the mouse and select
the operation to perform.
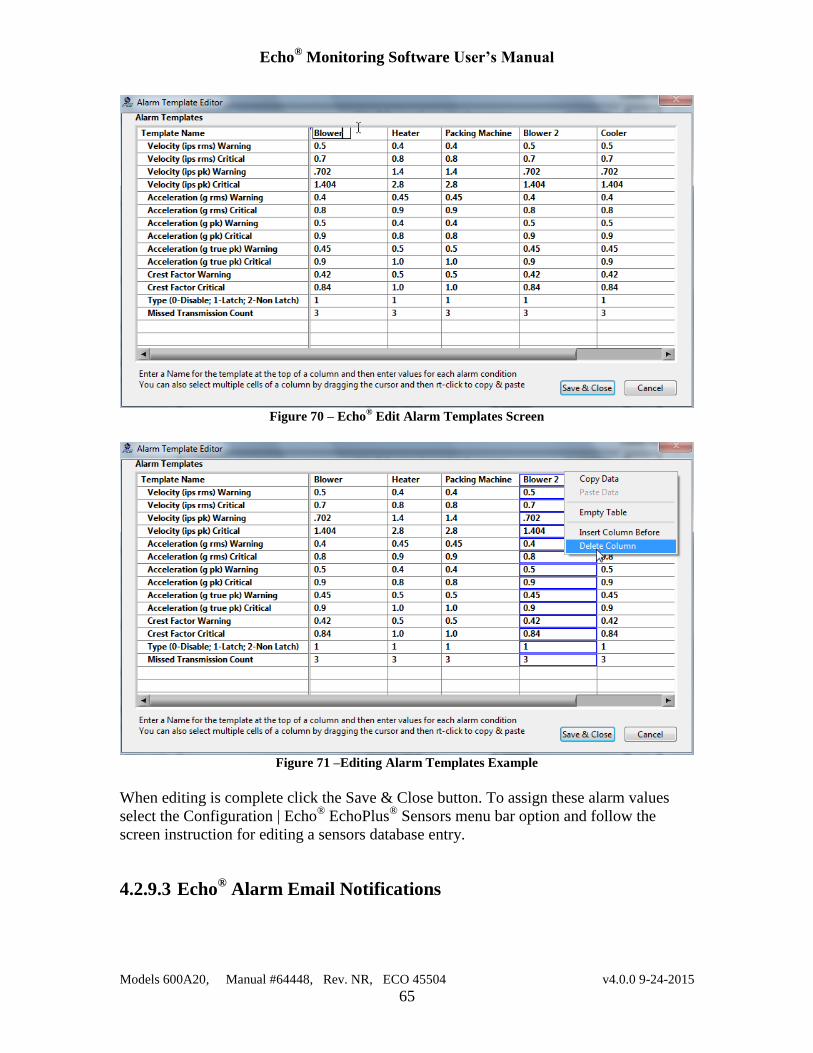
Echo® Monitoring Software User’s Manual
Models 600A20, Manual #64448, Rev. NR, ECO 45504 v4.0.0 9-24-2015
65
Figure 70 – Echo
® Edit Alarm Templates Screen
Figure 71 –Editing Alarm Templates Example
When editing is complete click the Save & Close button. To assign these alarm values
select the Configuration | Echo® EchoPlus
® Sensors menu bar option and follow the
screen instruction for editing a sensors database entry.
4.2.9.3 Echo® Alarm Email Notifications
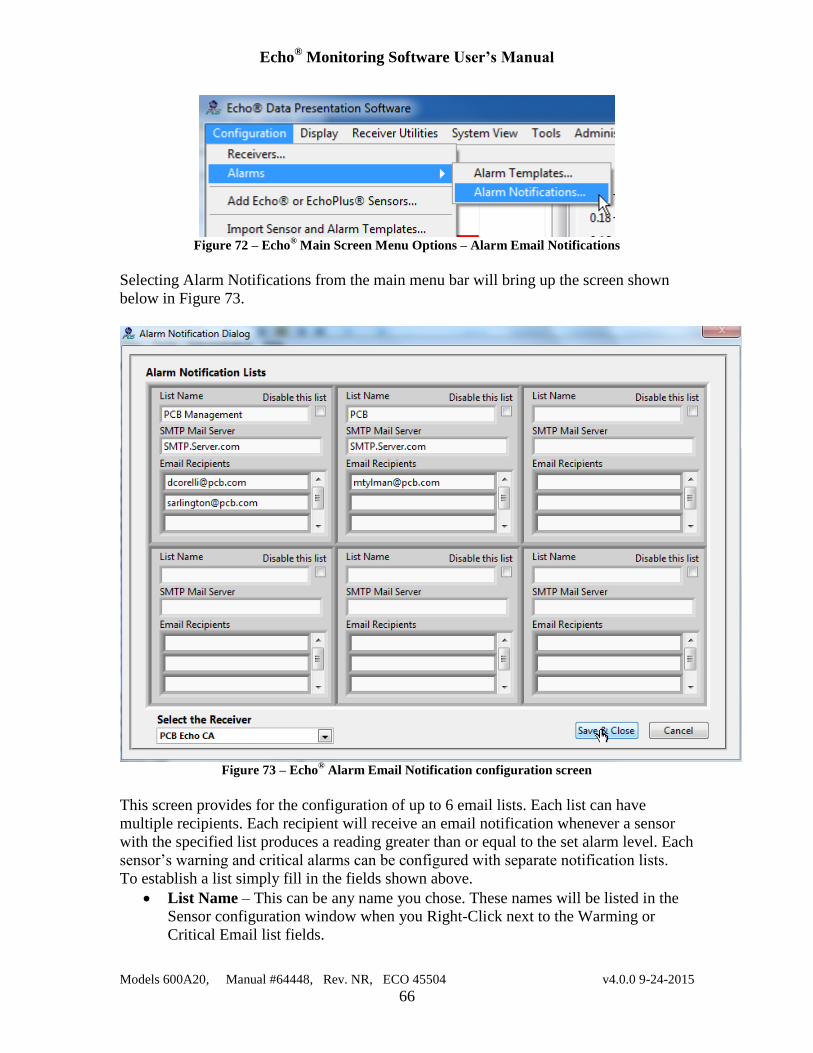
Echo® Monitoring Software User’s Manual
Models 600A20, Manual #64448, Rev. NR, ECO 45504 v4.0.0 9-24-2015
66
Figure 72 – Echo
® Main Screen Menu Options – Alarm Email Notifications
Selecting Alarm Notifications from the main menu bar will bring up the screen shown
below in Figure 73.
Figure 73 – Echo
® Alarm Email Notification configuration screen
This screen provides for the configuration of up to 6 email lists. Each list can have
multiple recipients. Each recipient will receive an email notification whenever a sensor
with the specified list produces a reading greater than or equal to the set alarm level. Each
sensor’s warning and critical alarms can be configured with separate notification lists.
To establish a list simply fill in the fields shown above.
List Name – This can be any name you chose. These names will be listed in the
Sensor configuration window when you Right-Click next to the Warming or
Critical Email list fields.

Echo® Monitoring Software User’s Manual
Models 600A20, Manual #64448, Rev. NR, ECO 45504 v4.0.0 9-24-2015
67
SMTP Mail Server – Enter the name or IP address of your companies outgoing
SMTP email server.
Email Recipients – enter the email address of people who should receive the
notifications. The first three of each list are initially shown in the window, use the
scroll bar on the right of each list to scroll down to add or see more recipients.
Disable this List – This is a quick way to disable an email notification list in the
event you know there is a problem and you do not wish to get the notifications.
This is easier than going into the sensor configuration window and removing
notifications altogether.
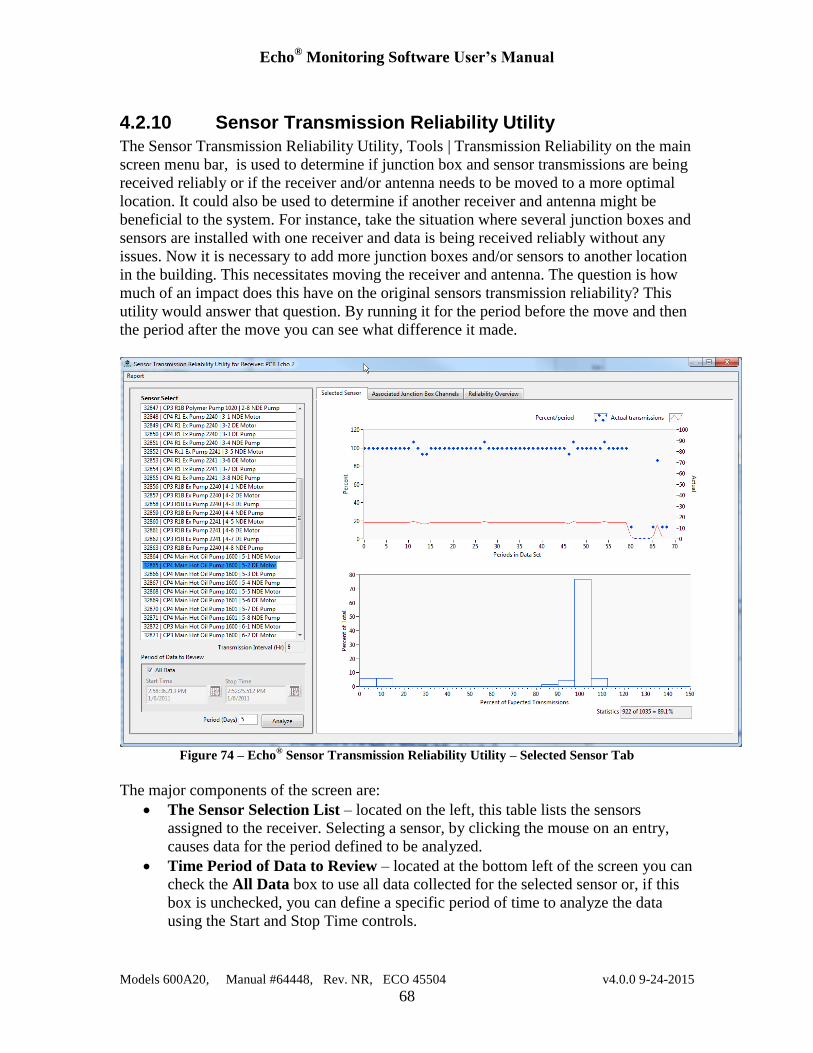
Echo® Monitoring Software User’s Manual
Models 600A20, Manual #64448, Rev. NR, ECO 45504 v4.0.0 9-24-2015
68
4.2.10 Sensor Transmission Reliability Utility
The Sensor Transmission Reliability Utility, Tools | Transmission Reliability on the main
screen menu bar, is used to determine if junction box and sensor transmissions are being
received reliably or if the receiver and/or antenna needs to be moved to a more optimal
location. It could also be used to determine if another receiver and antenna might be
beneficial to the system. For instance, take the situation where several junction boxes and
sensors are installed with one receiver and data is being received reliably without any
issues. Now it is necessary to add more junction boxes and/or sensors to another location
in the building. This necessitates moving the receiver and antenna. The question is how
much of an impact does this have on the original sensors transmission reliability? This
utility would answer that question. By running it for the period before the move and then
the period after the move you can see what difference it made.
Figure 74 – Echo
® Sensor Transmission Reliability Utility – Selected Sensor Tab
The major components of the screen are:
The Sensor Selection List – located on the left, this table lists the sensors
assigned to the receiver. Selecting a sensor, by clicking the mouse on an entry,
causes data for the period defined to be analyzed.
Time Period of Data to Review – located at the bottom left of the screen you can
check the All Data box to use all data collected for the selected sensor or, if this
box is unchecked, you can define a specific period of time to analyze the data
using the Start and Stop Time controls.

Echo® Monitoring Software User’s Manual
Models 600A20, Manual #64448, Rev. NR, ECO 45504 v4.0.0 9-24-2015
69
Period (days) – This is the period over which transmissions will be grouped to
form a single data point for analysis. For instance, if a sensor is scheduled to
transmit every 8 hours (3 times a day), and the period is set to 5 days then 15
transmissions should be found in the database for every 5 day interval in the Time
Period being analyzed to get a rating of 100% of expected transmissions for the
period. If only 5 transmissions were found then the percent of expected
transmissions for the period would be 33%. These calculations are used to plot the
actual performance in the graphs on the tab section of the screen.
Selected Sensor Tab( Figure 74) - This tab contains two graphs and an overall
statistic of how many transmissions were expected and how many were received.
o The graph on the top shows % of transmissions received for each period
(defined by Period (days)) on the left y-axis (blue diamonds) and actual
transmissions on the right y-axis over time. In the example used above a
bule diamond point of 100% equates to a red data point of 15
transmissions.
o The graph on the bottom is a histogram of how often, in groups of 10%,
that percent of transmissions was achieved. In the bottom graph shown in
Figure 74 we see that 100% of the selected sensors transmissions were
received almost 80% of the time for the period reviewed. This is excellent
since occasionally more than 100% were received, which can happen if
the power is cycled on the sensor to produce ‘extra’ transmissions. And
we see the over some periods 0% were received indicating power was
likely removed for maintenance or some other reason.
Associated Junction Box Channels Tab (Figure 76) – This tab is only displayed
if the sensor being analyzed is a juncrion box channel. This tab contains
histograms and the overall transmission statistic for all channels on the selected
sensor junction box. This is the same data that is shown for the selected sensor on
the bottom graph of the Selected Sensor tab
Reliability Overvies tab (Figure 77) – This tab shows the overall reliability of
every device assigned to the selected receiver. Each entry is an icon of either a
junction box or a standalone sensor. Below each icon is a transmission reliability
statistic for the time period analyzed. The number associated with each statistic is
the sensor ID for that sensor. For junction boxes the 1st channel of the box is used.
The color of the icon represents the reception quality at a glance in 20% steps.
Bright green= >80%; Light Green=60-80%; Light Yellow=40-60%; Dark
Yellow=20-40%; Red=<20%
Figure 75 – Echo
® Sensor Transmission Reliability Utility – Reliability tab icons
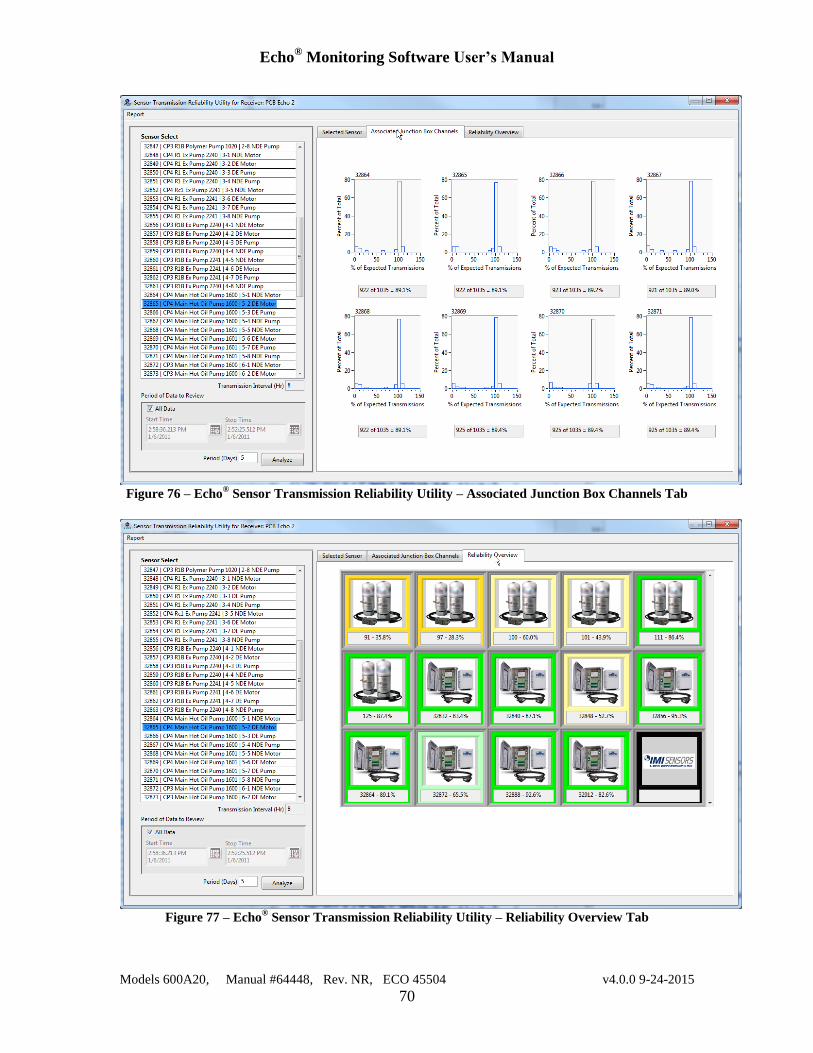
Echo® Monitoring Software User’s Manual
Models 600A20, Manual #64448, Rev. NR, ECO 45504 v4.0.0 9-24-2015
70
Figure 76 – Echo
® Sensor Transmission Reliability Utility – Associated Junction Box Channels Tab
Figure 77 – Echo
® Sensor Transmission Reliability Utility – Reliability Overview Tab
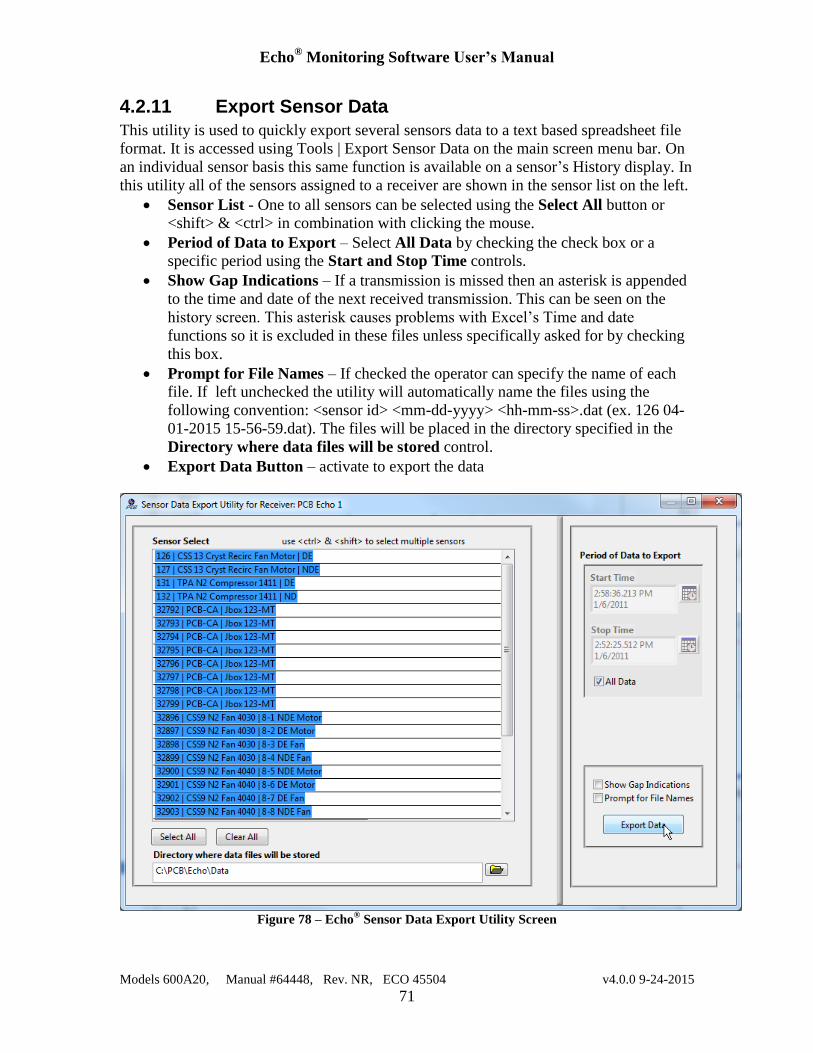
Echo® Monitoring Software User’s Manual
Models 600A20, Manual #64448, Rev. NR, ECO 45504 v4.0.0 9-24-2015
71
4.2.11 Export Sensor Data
This utility is used to quickly export several sensors data to a text based spreadsheet file
format. It is accessed using Tools | Export Sensor Data on the main screen menu bar. On
an individual sensor basis this same function is available on a sensor’s History display. In
this utility all of the sensors assigned to a receiver are shown in the sensor list on the left.
Sensor List - One to all sensors can be selected using the Select All button or
<shift> & <ctrl> in combination with clicking the mouse.
Period of Data to Export – Select All Data by checking the check box or a
specific period using the Start and Stop Time controls.
Show Gap Indications – If a transmission is missed then an asterisk is appended
to the time and date of the next received transmission. This can be seen on the
history screen. This asterisk causes problems with Excel’s Time and date
functions so it is excluded in these files unless specifically asked for by checking
this box.
Prompt for File Names – If checked the operator can specify the name of each
file. If left unchecked the utility will automatically name the files using the
following convention: <sensor id> <mm-dd-yyyy> <hh-mm-ss>.dat (ex. 126 04-
01-2015 15-56-59.dat). The files will be placed in the directory specified in the
Directory where data files will be stored control.
Export Data Button – activate to export the data
Figure 78 – Echo
® Sensor Data Export Utility Screen
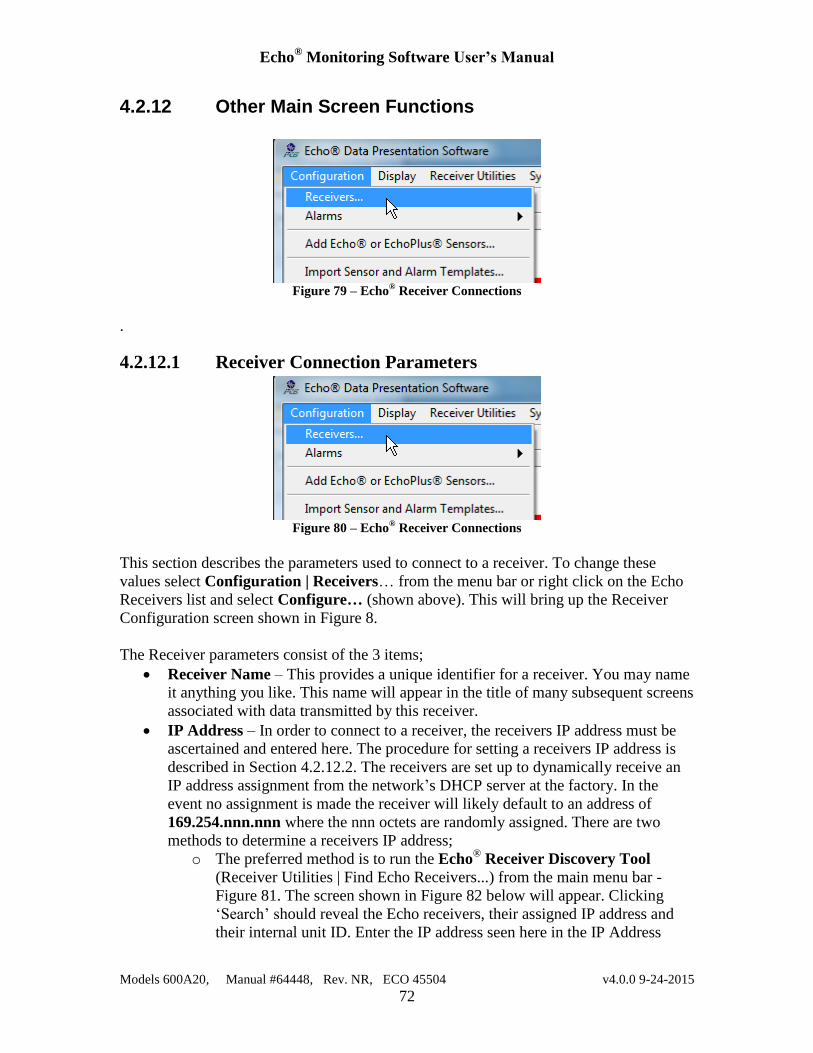
Echo® Monitoring Software User’s Manual
Models 600A20, Manual #64448, Rev. NR, ECO 45504 v4.0.0 9-24-2015
72
4.2.12 Other Main Screen Functions
Figure 79 – Echo
® Receiver Connections
.
4.2.12.1 Receiver Connection Parameters
Figure 80 – Echo
® Receiver Connections
This section describes the parameters used to connect to a receiver. To change these
values select Configuration | Receivers… from the menu bar or right click on the Echo
Receivers list and select Configure… (shown above). This will bring up the Receiver
Configuration screen shown in Figure 8.
The Receiver parameters consist of the 3 items;
Receiver Name – This provides a unique identifier for a receiver. You may name
it anything you like. This name will appear in the title of many subsequent screens
associated with data transmitted by this receiver.
IP Address – In order to connect to a receiver, the receivers IP address must be
ascertained and entered here. The procedure for setting a receivers IP address is
described in Section 4.2.12.2. The receivers are set up to dynamically receive an
IP address assignment from the network’s DHCP server at the factory. In the
event no assignment is made the receiver will likely default to an address of
169.254.nnn.nnn where the nnn octets are randomly assigned. There are two
methods to determine a receivers IP address;
o The preferred method is to run the Echo® Receiver Discovery Tool
(Receiver Utilities | Find Echo Receivers...) from the main menu bar -
Figure 81. The screen shown in Figure 82 below will appear. Clicking
‘Search’ should reveal the Echo receivers, their assigned IP address and
their internal unit ID. Enter the IP address seen here in the IP Address
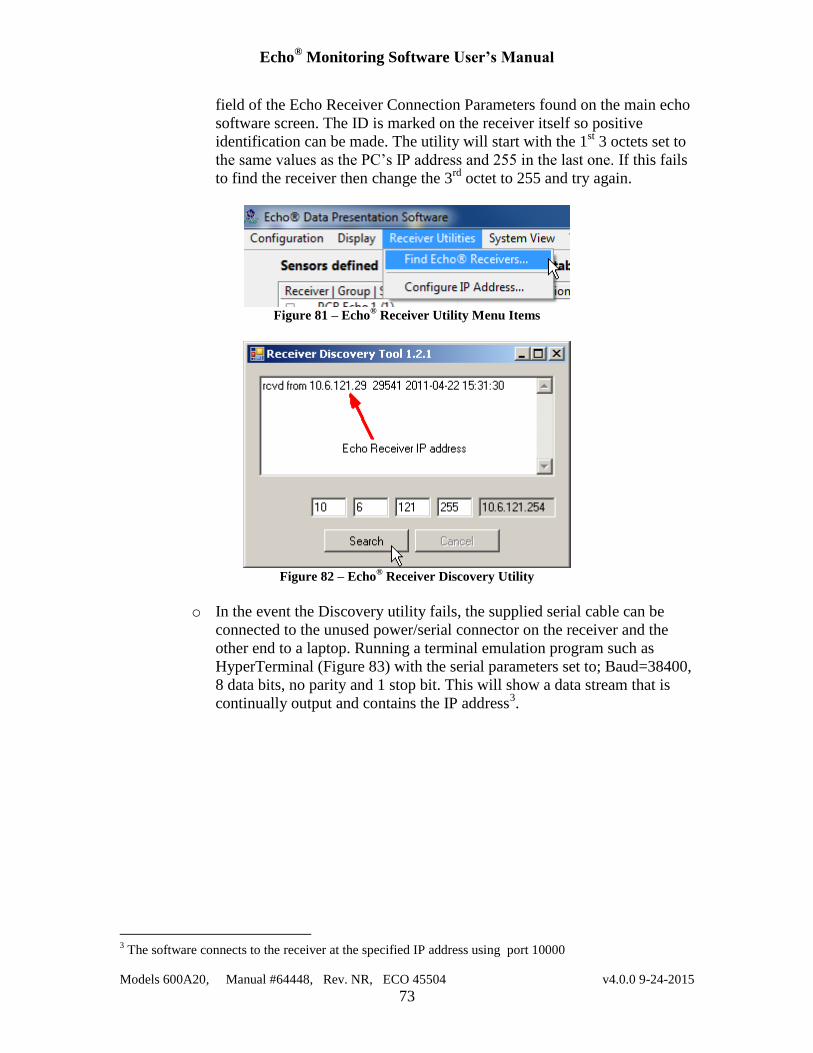
Echo® Monitoring Software User’s Manual
Models 600A20, Manual #64448, Rev. NR, ECO 45504 v4.0.0 9-24-2015
73
field of the Echo Receiver Connection Parameters found on the main echo
software screen. The ID is marked on the receiver itself so positive
identification can be made. The utility will start with the 1st 3 octets set to
the same values as the PC’s IP address and 255 in the last one. If this fails
to find the receiver then change the 3rd
octet to 255 and try again.
Figure 81 – Echo
® Receiver Utility Menu Items
Figure 82 – Echo
® Receiver Discovery Utility
o In the event the Discovery utility fails, the supplied serial cable can be
connected to the unused power/serial connector on the receiver and the
other end to a laptop. Running a terminal emulation program such as
HyperTerminal (Figure 83) with the serial parameters set to; Baud=38400,
8 data bits, no parity and 1 stop bit. This will show a data stream that is
continually output and contains the IP address3.
3 The software connects to the receiver at the specified IP address using port 10000
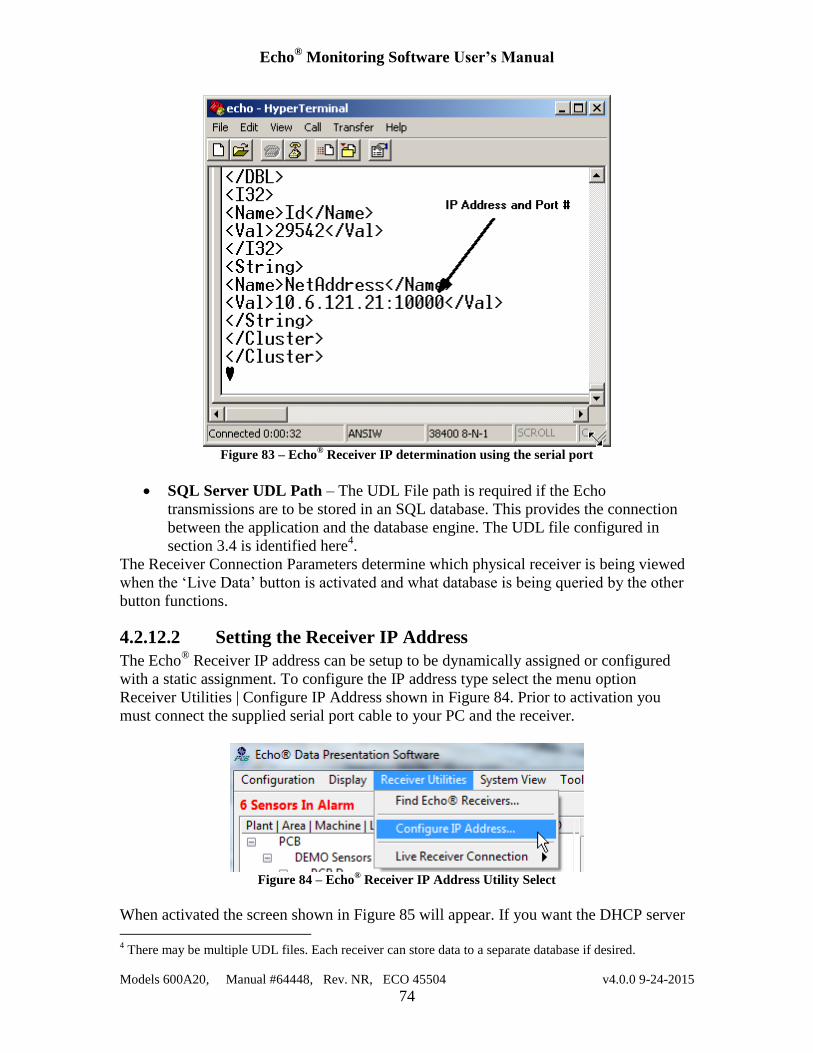
Echo® Monitoring Software User’s Manual
Models 600A20, Manual #64448, Rev. NR, ECO 45504 v4.0.0 9-24-2015
74
Figure 83 – Echo
® Receiver IP determination using the serial port
SQL Server UDL Path – The UDL File path is required if the Echo
transmissions are to be stored in an SQL database. This provides the connection
between the application and the database engine. The UDL file configured in
section 3.4 is identified here4.
The Receiver Connection Parameters determine which physical receiver is being viewed
when the ‘Live Data’ button is activated and what database is being queried by the other
button functions.
4.2.12.2 Setting the Receiver IP Address
The Echo® Receiver IP address can be setup to be dynamically assigned or configured
with a static assignment. To configure the IP address type select the menu option
Receiver Utilities | Configure IP Address shown in Figure 84. Prior to activation you
must connect the supplied serial port cable to your PC and the receiver.
Figure 84 – Echo
® Receiver IP Address Utility Select
When activated the screen shown in Figure 85 will appear. If you want the DHCP server
4 There may be multiple UDL files. Each receiver can store data to a separate database if desired.
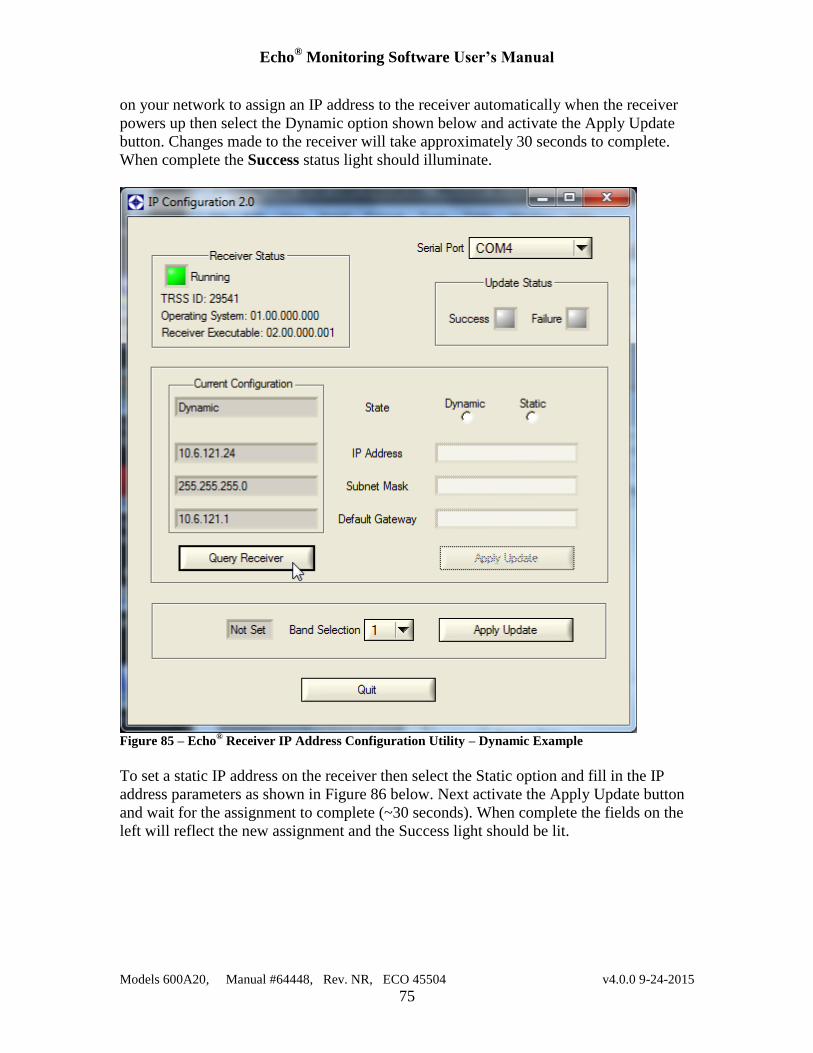
Echo® Monitoring Software User’s Manual
Models 600A20, Manual #64448, Rev. NR, ECO 45504 v4.0.0 9-24-2015
75
on your network to assign an IP address to the receiver automatically when the receiver
powers up then select the Dynamic option shown below and activate the Apply Update
button. Changes made to the receiver will take approximately 30 seconds to complete.
When complete the Success status light should illuminate.
Figure 85 – Echo
® Receiver IP Address Configuration Utility – Dynamic Example
To set a static IP address on the receiver then select the Static option and fill in the IP
address parameters as shown in Figure 86 below. Next activate the Apply Update button
and wait for the assignment to complete (~30 seconds). When complete the fields on the
left will reflect the new assignment and the Success light should be lit.
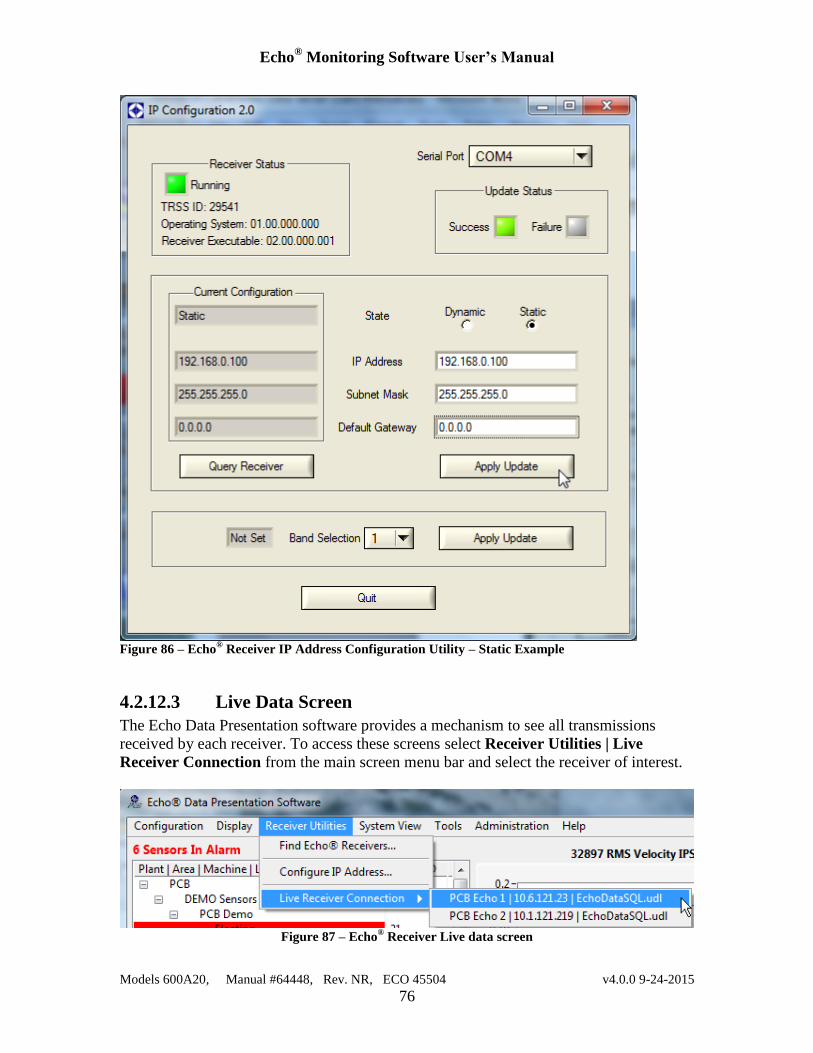
Echo® Monitoring Software User’s Manual
Models 600A20, Manual #64448, Rev. NR, ECO 45504 v4.0.0 9-24-2015
76
Figure 86 – Echo
® Receiver IP Address Configuration Utility – Static Example
4.2.12.3 Live Data Screen
The Echo Data Presentation software provides a mechanism to see all transmissions
received by each receiver. To access these screens select Receiver Utilities | Live
Receiver Connection from the main screen menu bar and select the receiver of interest.
Figure 87 – Echo
® Receiver Live data screen
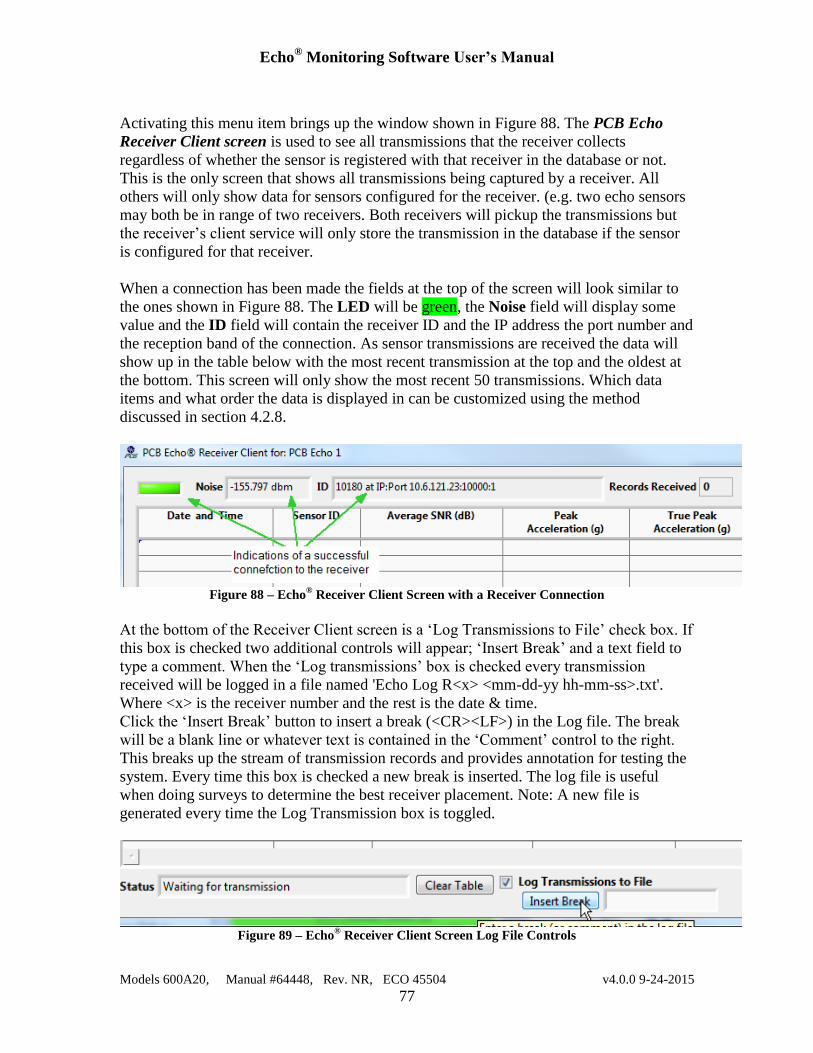
Echo® Monitoring Software User’s Manual
Models 600A20, Manual #64448, Rev. NR, ECO 45504 v4.0.0 9-24-2015
77
Activating this menu item brings up the window shown in Figure 88. The PCB Echo
Receiver Client screen is used to see all transmissions that the receiver collects
regardless of whether the sensor is registered with that receiver in the database or not.
This is the only screen that shows all transmissions being captured by a receiver. All
others will only show data for sensors configured for the receiver. (e.g. two echo sensors
may both be in range of two receivers. Both receivers will pickup the transmissions but
the receiver’s client service will only store the transmission in the database if the sensor
is configured for that receiver.
When a connection has been made the fields at the top of the screen will look similar to
the ones shown in Figure 88. The LED will be green, the Noise field will display some
value and the ID field will contain the receiver ID and the IP address the port number and
the reception band of the connection. As sensor transmissions are received the data will
show up in the table below with the most recent transmission at the top and the oldest at
the bottom. This screen will only show the most recent 50 transmissions. Which data
items and what order the data is displayed in can be customized using the method
discussed in section 4.2.8.
Figure 88 – Echo
® Receiver Client Screen with a Receiver Connection
At the bottom of the Receiver Client screen is a ‘Log Transmissions to File’ check box. If
this box is checked two additional controls will appear; ‘Insert Break’ and a text field to
type a comment. When the ‘Log transmissions’ box is checked every transmission
received will be logged in a file named 'Echo Log R<x> <mm-dd-yy hh-mm-ss>.txt'.
Where <x> is the receiver number and the rest is the date & time.
Click the ‘Insert Break’ button to insert a break (<CR><LF>) in the Log file. The break
will be a blank line or whatever text is contained in the ‘Comment’ control to the right.
This breaks up the stream of transmission records and provides annotation for testing the
system. Every time this box is checked a new break is inserted. The log file is useful
when doing surveys to determine the best receiver placement. Note: A new file is
generated every time the Log Transmission box is toggled.
Figure 89 – Echo
® Receiver Client Screen Log File Controls
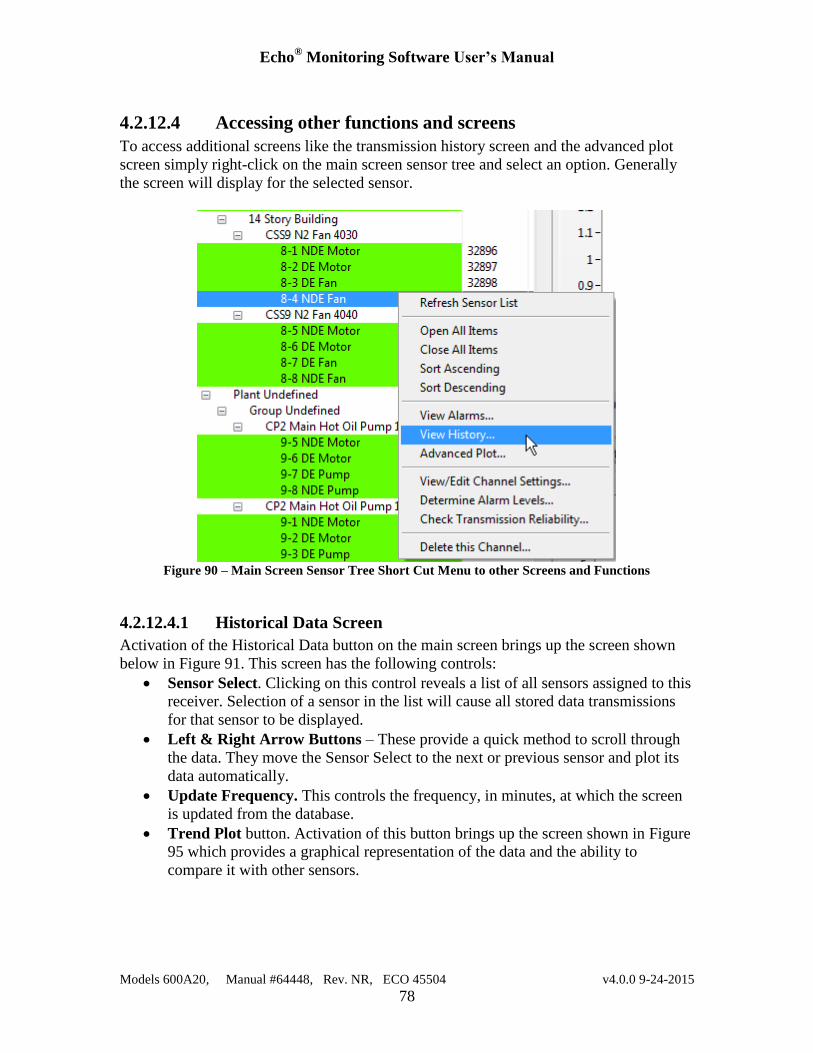
Echo® Monitoring Software User’s Manual
Models 600A20, Manual #64448, Rev. NR, ECO 45504 v4.0.0 9-24-2015
78
4.2.12.4 Accessing other functions and screens
To access additional screens like the transmission history screen and the advanced plot
screen simply right-click on the main screen sensor tree and select an option. Generally
the screen will display for the selected sensor.
Figure 90 – Main Screen Sensor Tree Short Cut Menu to other Screens and Functions
4.2.12.4.1 Historical Data Screen
Activation of the Historical Data button on the main screen brings up the screen shown
below in Figure 91. This screen has the following controls:
Sensor Select. Clicking on this control reveals a list of all sensors assigned to this
receiver. Selection of a sensor in the list will cause all stored data transmissions
for that sensor to be displayed.
Left & Right Arrow Buttons – These provide a quick method to scroll through
the data. They move the Sensor Select to the next or previous sensor and plot its
data automatically.
Update Frequency. This controls the frequency, in minutes, at which the screen
is updated from the database.
Trend Plot button. Activation of this button brings up the screen shown in Figure
95 which provides a graphical representation of the data and the ability to
compare it with other sensors.
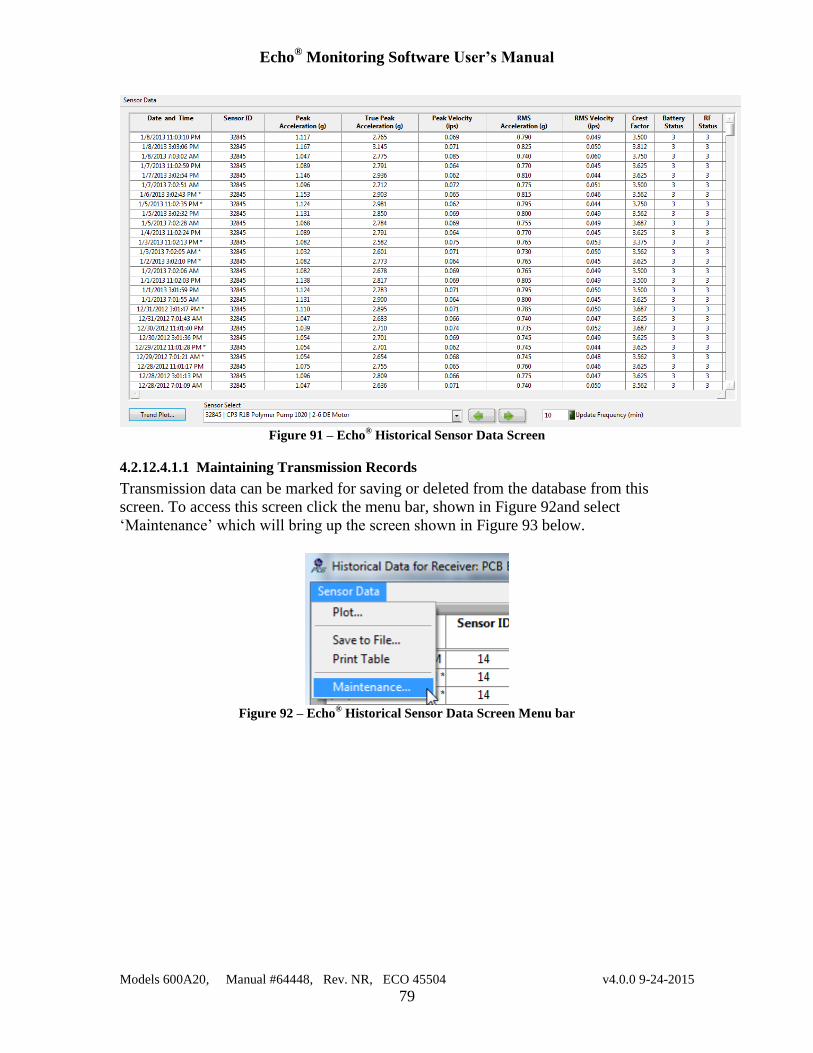
Echo® Monitoring Software User’s Manual
Models 600A20, Manual #64448, Rev. NR, ECO 45504 v4.0.0 9-24-2015
79
Figure 91 – Echo
® Historical Sensor Data Screen
4.2.12.4.1.1 Maintaining Transmission Records
Transmission data can be marked for saving or deleted from the database from this
screen. To access this screen click the menu bar, shown in Figure 92and select
‘Maintenance’ which will bring up the screen shown in Figure 93 below.
Figure 92 – Echo
® Historical Sensor Data Screen Menu bar
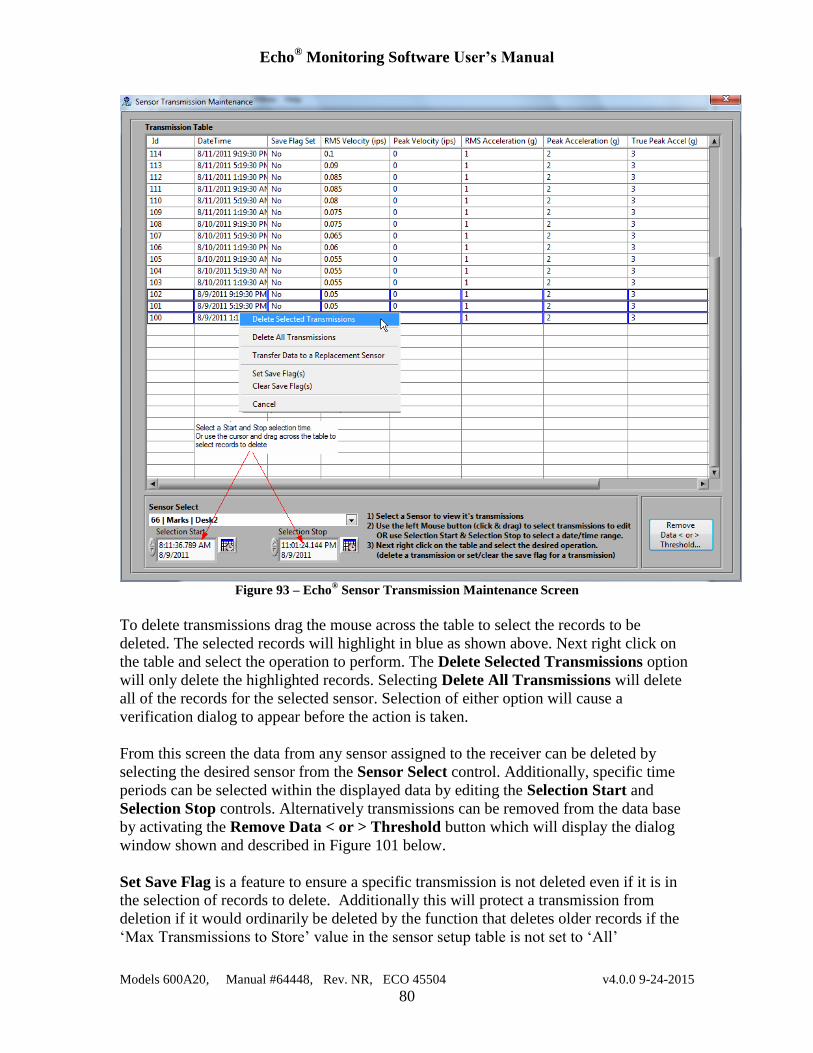
Echo® Monitoring Software User’s Manual
Models 600A20, Manual #64448, Rev. NR, ECO 45504 v4.0.0 9-24-2015
80
Figure 93 – Echo
® Sensor Transmission Maintenance Screen
To delete transmissions drag the mouse across the table to select the records to be
deleted. The selected records will highlight in blue as shown above. Next right click on
the table and select the operation to perform. The Delete Selected Transmissions option
will only delete the highlighted records. Selecting Delete All Transmissions will delete
all of the records for the selected sensor. Selection of either option will cause a
verification dialog to appear before the action is taken.
From this screen the data from any sensor assigned to the receiver can be deleted by
selecting the desired sensor from the Sensor Select control. Additionally, specific time
periods can be selected within the displayed data by editing the Selection Start and
Selection Stop controls. Alternatively transmissions can be removed from the data base
by activating the Remove Data < or > Threshold button which will display the dialog
window shown and described in Figure 101 below.
Set Save Flag is a feature to ensure a specific transmission is not deleted even if it is in
the selection of records to delete. Additionally this will protect a transmission from
deletion if it would ordinarily be deleted by the function that deletes older records if the
‘Max Transmissions to Store’ value in the sensor setup table is not set to ‘All’
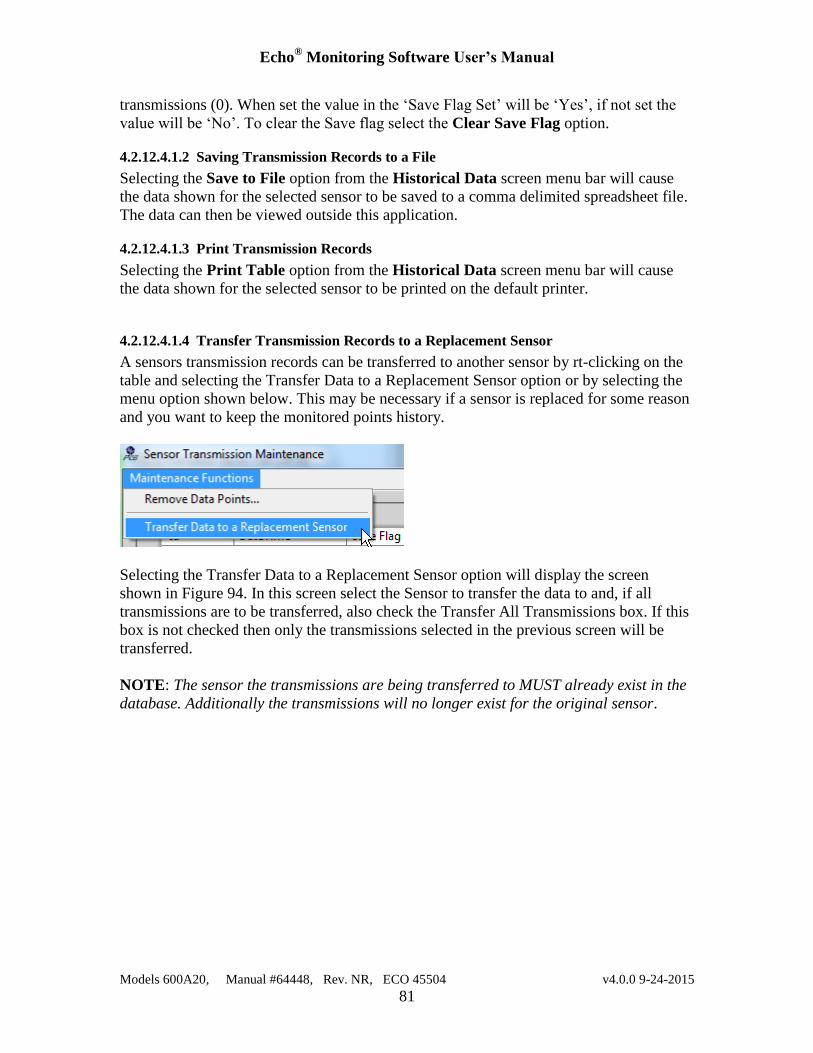
Echo® Monitoring Software User’s Manual
Models 600A20, Manual #64448, Rev. NR, ECO 45504 v4.0.0 9-24-2015
81
transmissions (0). When set the value in the ‘Save Flag Set’ will be ‘Yes’, if not set the
value will be ‘No’. To clear the Save flag select the Clear Save Flag option.
4.2.12.4.1.2 Saving Transmission Records to a File
Selecting the Save to File option from the Historical Data screen menu bar will cause
the data shown for the selected sensor to be saved to a comma delimited spreadsheet file.
The data can then be viewed outside this application.
4.2.12.4.1.3 Print Transmission Records
Selecting the Print Table option from the Historical Data screen menu bar will cause
the data shown for the selected sensor to be printed on the default printer.
4.2.12.4.1.4 Transfer Transmission Records to a Replacement Sensor
A sensors transmission records can be transferred to another sensor by rt-clicking on the
table and selecting the Transfer Data to a Replacement Sensor option or by selecting the
menu option shown below. This may be necessary if a sensor is replaced for some reason
and you want to keep the monitored points history.
Selecting the Transfer Data to a Replacement Sensor option will display the screen
shown in Figure 94. In this screen select the Sensor to transfer the data to and, if all
transmissions are to be transferred, also check the Transfer All Transmissions box. If this
box is not checked then only the transmissions selected in the previous screen will be
transferred.
NOTE: The sensor the transmissions are being transferred to MUST already exist in the
database. Additionally the transmissions will no longer exist for the original sensor.
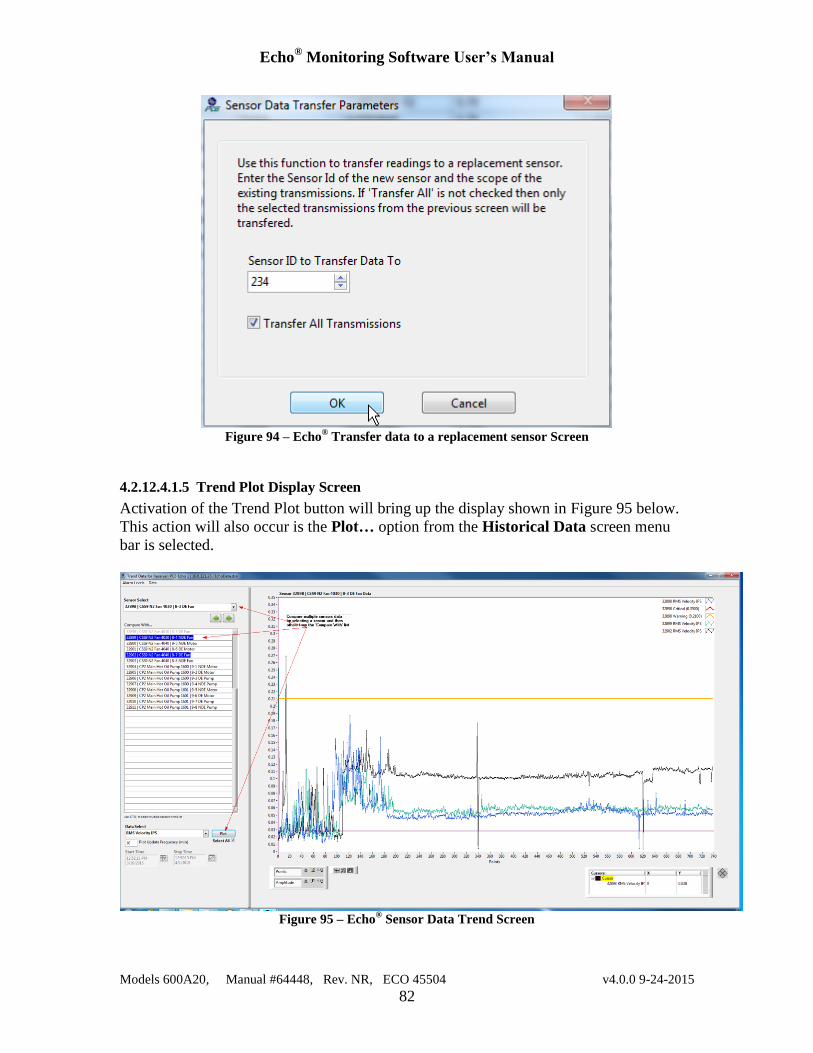
Echo® Monitoring Software User’s Manual
Models 600A20, Manual #64448, Rev. NR, ECO 45504 v4.0.0 9-24-2015
82
Figure 94 – Echo
® Transfer data to a replacement sensor Screen
4.2.12.4.1.5 Trend Plot Display Screen
Activation of the Trend Plot button will bring up the display shown in Figure 95 below.
This action will also occur is the Plot… option from the Historical Data screen menu
bar is selected.
Figure 95 – Echo
® Sensor Data Trend Screen
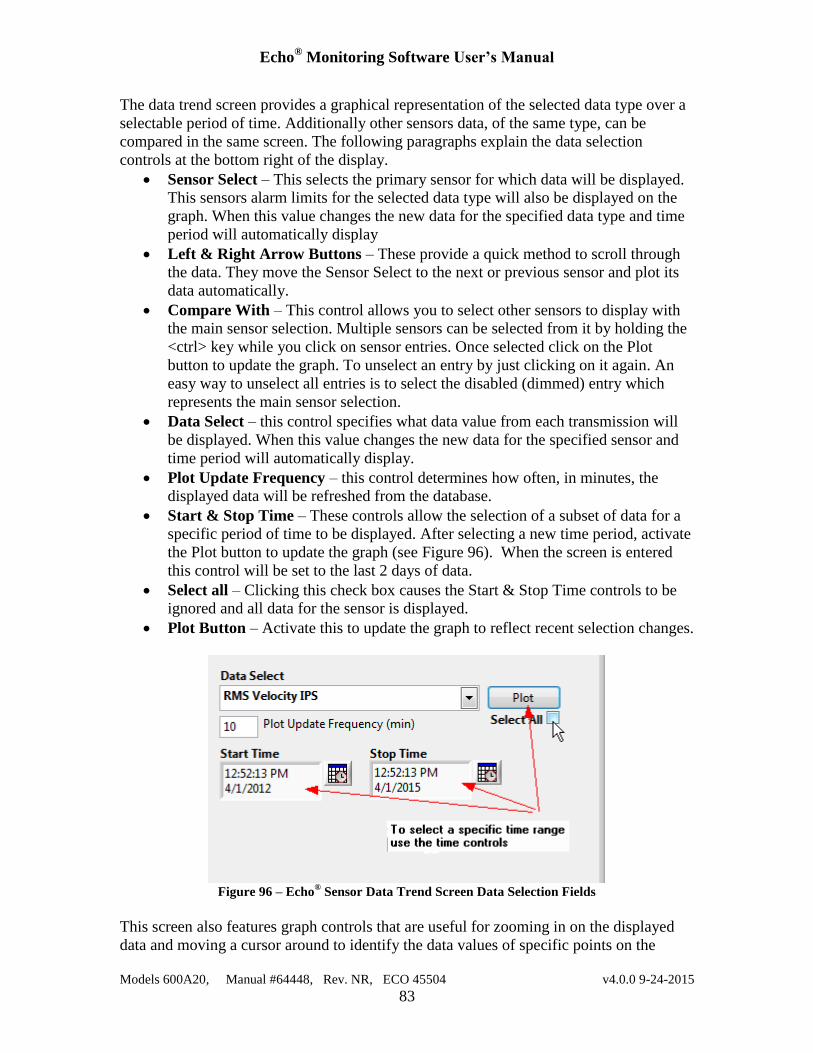
Echo® Monitoring Software User’s Manual
Models 600A20, Manual #64448, Rev. NR, ECO 45504 v4.0.0 9-24-2015
83
The data trend screen provides a graphical representation of the selected data type over a
selectable period of time. Additionally other sensors data, of the same type, can be
compared in the same screen. The following paragraphs explain the data selection
controls at the bottom right of the display.
Sensor Select – This selects the primary sensor for which data will be displayed.
This sensors alarm limits for the selected data type will also be displayed on the
graph. When this value changes the new data for the specified data type and time
period will automatically display
Left & Right Arrow Buttons – These provide a quick method to scroll through
the data. They move the Sensor Select to the next or previous sensor and plot its
data automatically.
Compare With – This control allows you to select other sensors to display with
the main sensor selection. Multiple sensors can be selected from it by holding the
<ctrl> key while you click on sensor entries. Once selected click on the Plot
button to update the graph. To unselect an entry by just clicking on it again. An
easy way to unselect all entries is to select the disabled (dimmed) entry which
represents the main sensor selection.
Data Select – this control specifies what data value from each transmission will
be displayed. When this value changes the new data for the specified sensor and
time period will automatically display.
Plot Update Frequency – this control determines how often, in minutes, the
displayed data will be refreshed from the database.
Start & Stop Time – These controls allow the selection of a subset of data for a
specific period of time to be displayed. After selecting a new time period, activate
the Plot button to update the graph (see Figure 96). When the screen is entered
this control will be set to the last 2 days of data.
Select all – Clicking this check box causes the Start & Stop Time controls to be
ignored and all data for the sensor is displayed.
Plot Button – Activate this to update the graph to reflect recent selection changes.
Figure 96 – Echo
® Sensor Data Trend Screen Data Selection Fields
This screen also features graph controls that are useful for zooming in on the displayed
data and moving a cursor around to identify the data values of specific points on the
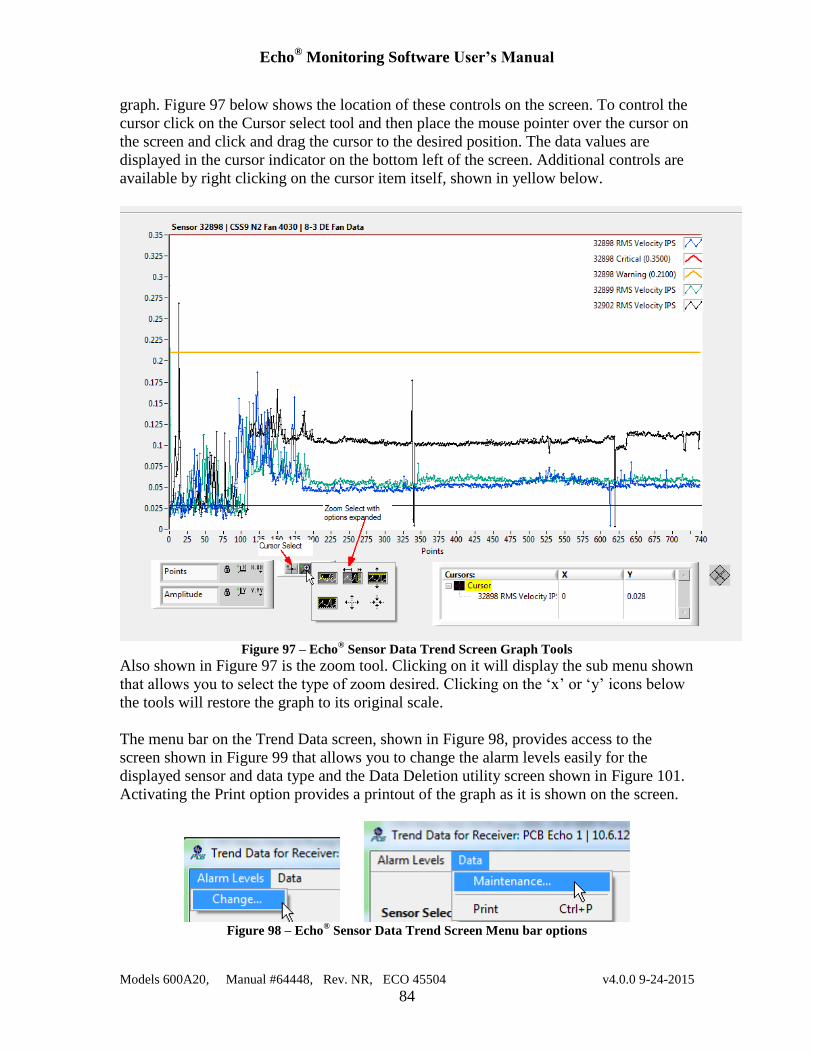
Echo® Monitoring Software User’s Manual
Models 600A20, Manual #64448, Rev. NR, ECO 45504 v4.0.0 9-24-2015
84
graph. Figure 97 below shows the location of these controls on the screen. To control the
cursor click on the Cursor select tool and then place the mouse pointer over the cursor on
the screen and click and drag the cursor to the desired position. The data values are
displayed in the cursor indicator on the bottom left of the screen. Additional controls are
available by right clicking on the cursor item itself, shown in yellow below.
Figure 97 – Echo
® Sensor Data Trend Screen Graph Tools
Also shown in Figure 97 is the zoom tool. Clicking on it will display the sub menu shown
that allows you to select the type of zoom desired. Clicking on the ‘x’ or ‘y’ icons below
the tools will restore the graph to its original scale.
The menu bar on the Trend Data screen, shown in Figure 98, provides access to the
screen shown in Figure 99 that allows you to change the alarm levels easily for the
displayed sensor and data type and the Data Deletion utility screen shown in Figure 101.
Activating the Print option provides a printout of the graph as it is shown on the screen.
Figure 98 – Echo
® Sensor Data Trend Screen Menu bar options
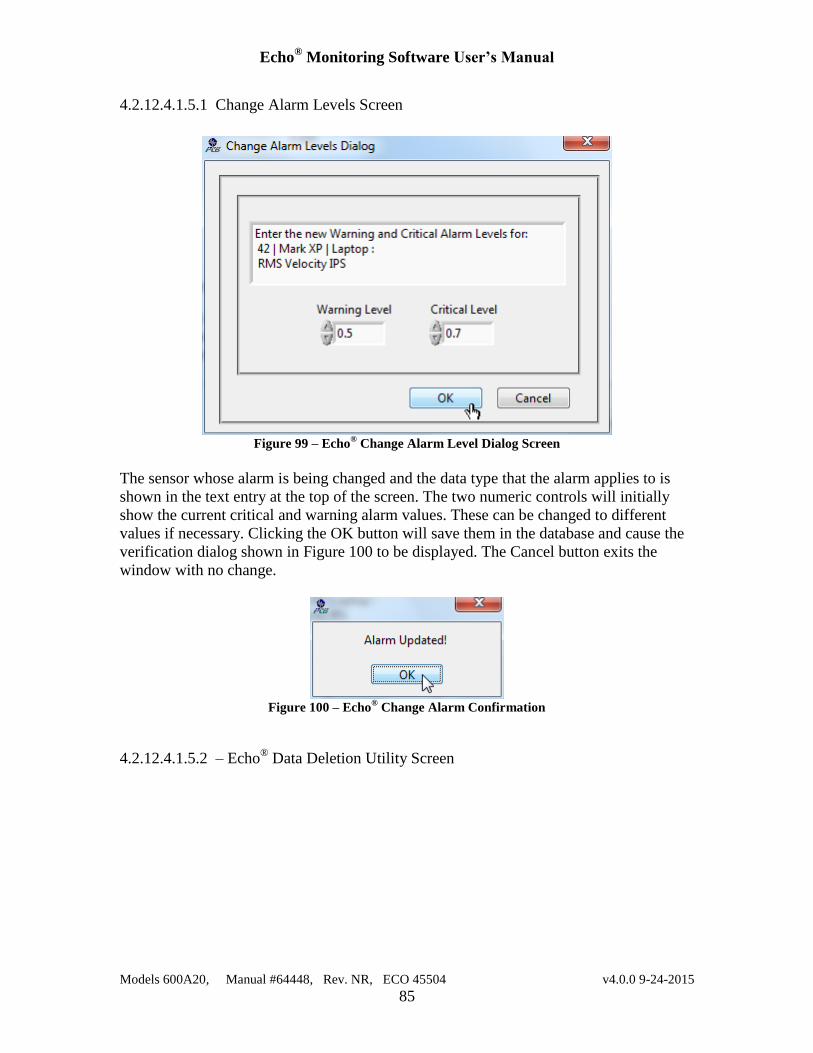
Echo® Monitoring Software User’s Manual
Models 600A20, Manual #64448, Rev. NR, ECO 45504 v4.0.0 9-24-2015
85
4.2.12.4.1.5.1 Change Alarm Levels Screen
Figure 99 – Echo
® Change Alarm Level Dialog Screen
The sensor whose alarm is being changed and the data type that the alarm applies to is
shown in the text entry at the top of the screen. The two numeric controls will initially
show the current critical and warning alarm values. These can be changed to different
values if necessary. Clicking the OK button will save them in the database and cause the
verification dialog shown in Figure 100 to be displayed. The Cancel button exits the
window with no change.
Figure 100 – Echo
® Change Alarm Confirmation
4.2.12.4.1.5.2 – Echo®
Data Deletion Utility Screen
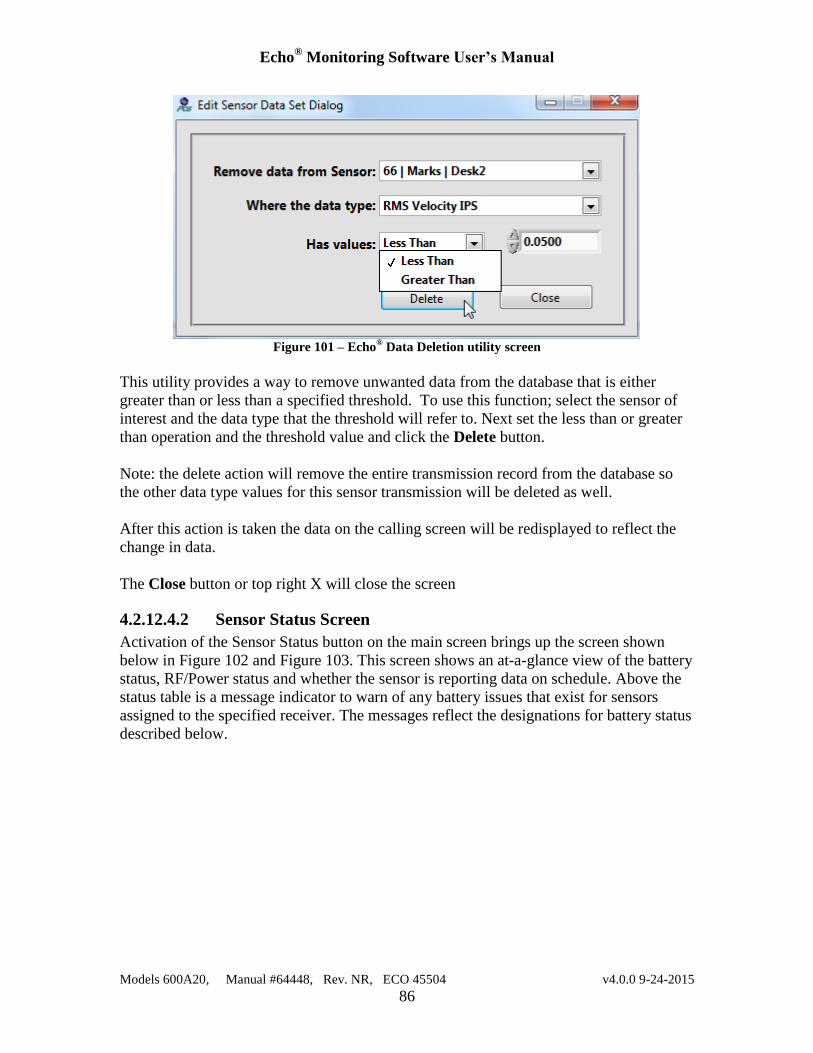
Echo® Monitoring Software User’s Manual
Models 600A20, Manual #64448, Rev. NR, ECO 45504 v4.0.0 9-24-2015
86
Figure 101 – Echo
® Data Deletion utility screen
This utility provides a way to remove unwanted data from the database that is either
greater than or less than a specified threshold. To use this function; select the sensor of
interest and the data type that the threshold will refer to. Next set the less than or greater
than operation and the threshold value and click the Delete button.
Note: the delete action will remove the entire transmission record from the database so
the other data type values for this sensor transmission will be deleted as well.
After this action is taken the data on the calling screen will be redisplayed to reflect the
change in data.
The Close button or top right X will close the screen
4.2.12.4.2 Sensor Status Screen
Activation of the Sensor Status button on the main screen brings up the screen shown
below in Figure 102 and Figure 103. This screen shows an at-a-glance view of the battery
status, RF/Power status and whether the sensor is reporting data on schedule. Above the
status table is a message indicator to warn of any battery issues that exist for sensors
assigned to the specified receiver. The messages reflect the designations for battery status
described below.
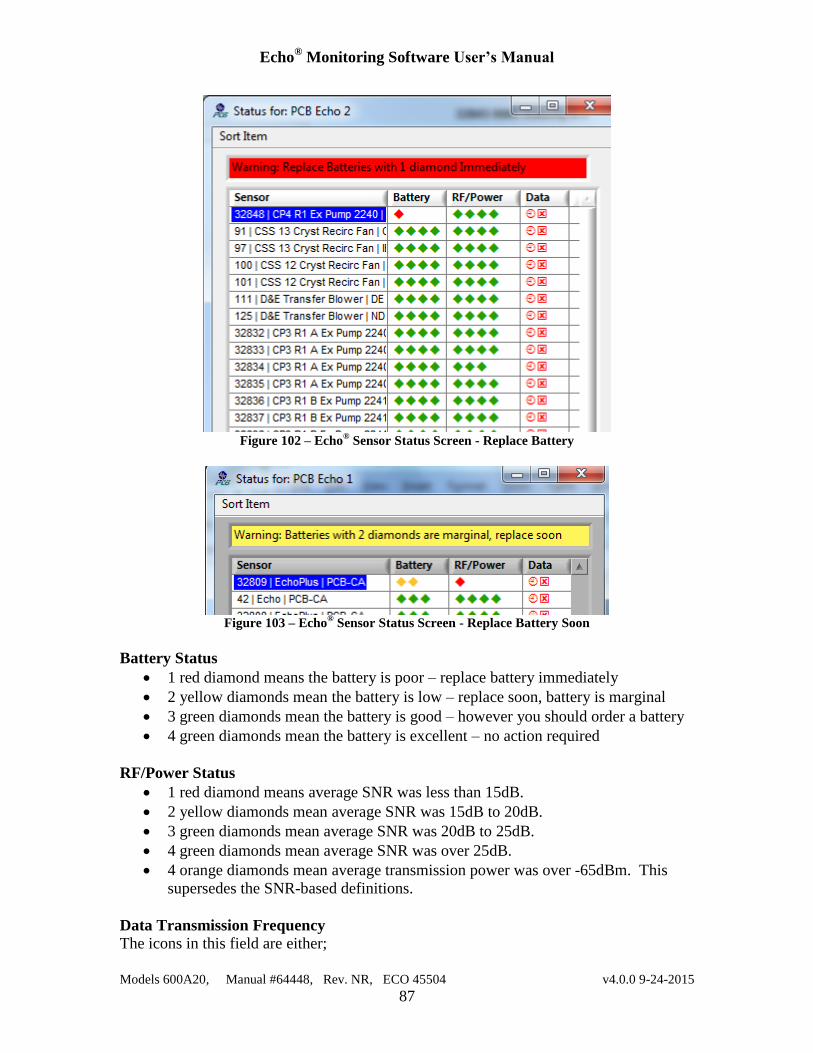
Echo® Monitoring Software User’s Manual
Models 600A20, Manual #64448, Rev. NR, ECO 45504 v4.0.0 9-24-2015
87
Figure 102 – Echo
® Sensor Status Screen - Replace Battery
Figure 103 – Echo
® Sensor Status Screen - Replace Battery Soon
Battery Status
1 red diamond means the battery is poor – replace battery immediately
2 yellow diamonds mean the battery is low – replace soon, battery is marginal
3 green diamonds mean the battery is good – however you should order a battery
4 green diamonds mean the battery is excellent – no action required
RF/Power Status
1 red diamond means average SNR was less than 15dB.
2 yellow diamonds mean average SNR was 15dB to 20dB.
3 green diamonds mean average SNR was 20dB to 25dB.
4 green diamonds mean average SNR was over 25dB.
4 orange diamonds mean average transmission power was over -65dBm. This
supersedes the SNR-based definitions.
Data Transmission Frequency
The icons in this field are either;
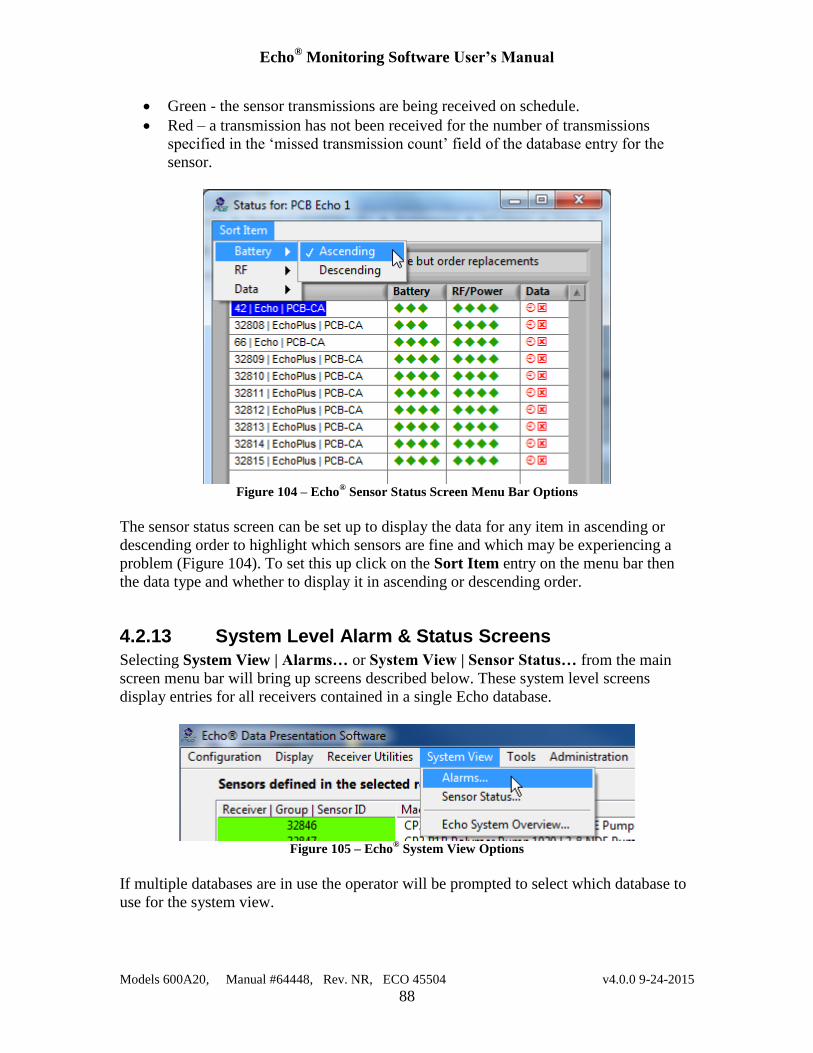
Echo® Monitoring Software User’s Manual
Models 600A20, Manual #64448, Rev. NR, ECO 45504 v4.0.0 9-24-2015
88
Green - the sensor transmissions are being received on schedule.
Red – a transmission has not been received for the number of transmissions
specified in the ‘missed transmission count’ field of the database entry for the
sensor.
Figure 104 – Echo
® Sensor Status Screen Menu Bar Options
The sensor status screen can be set up to display the data for any item in ascending or
descending order to highlight which sensors are fine and which may be experiencing a
problem (Figure 104). To set this up click on the Sort Item entry on the menu bar then
the data type and whether to display it in ascending or descending order.
4.2.13 System Level Alarm & Status Screens
Selecting System View | Alarms… or System View | Sensor Status… from the main
screen menu bar will bring up screens described below. These system level screens
display entries for all receivers contained in a single Echo database.
Figure 105 – Echo
® System View Options
If multiple databases are in use the operator will be prompted to select which database to
use for the system view.
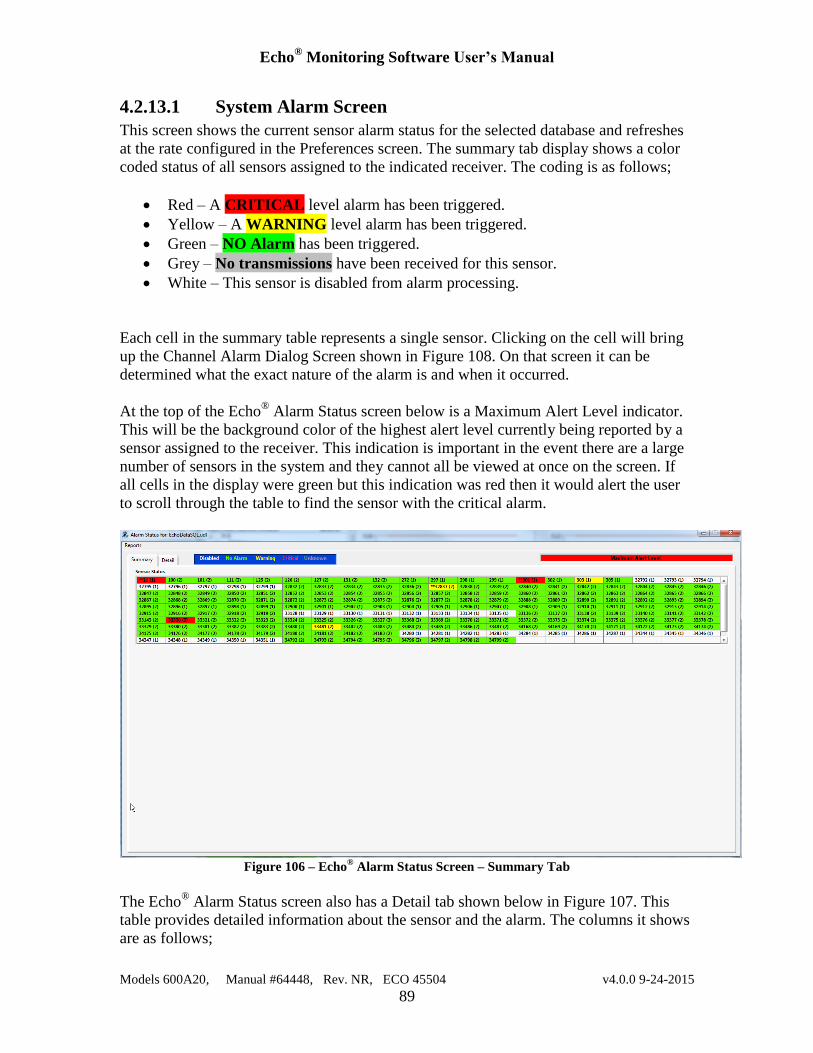
Echo® Monitoring Software User’s Manual
Models 600A20, Manual #64448, Rev. NR, ECO 45504 v4.0.0 9-24-2015
89
4.2.13.1 System Alarm Screen
This screen shows the current sensor alarm status for the selected database and refreshes
at the rate configured in the Preferences screen. The summary tab display shows a color
coded status of all sensors assigned to the indicated receiver. The coding is as follows;
Red – A CRITICAL level alarm has been triggered.
Yellow – A WARNING level alarm has been triggered.
Green – NO Alarm has been triggered.
Grey – No transmissions have been received for this sensor.
White – This sensor is disabled from alarm processing.
Each cell in the summary table represents a single sensor. Clicking on the cell will bring
up the Channel Alarm Dialog Screen shown in Figure 108. On that screen it can be
determined what the exact nature of the alarm is and when it occurred.
At the top of the Echo®
Alarm Status screen below is a Maximum Alert Level indicator.
This will be the background color of the highest alert level currently being reported by a
sensor assigned to the receiver. This indication is important in the event there are a large
number of sensors in the system and they cannot all be viewed at once on the screen. If
all cells in the display were green but this indication was red then it would alert the user
to scroll through the table to find the sensor with the critical alarm.
Figure 106 – Echo
® Alarm Status Screen – Summary Tab
The Echo® Alarm Status screen also has a Detail tab shown below in Figure 107. This
table provides detailed information about the sensor and the alarm. The columns it shows
are as follows;
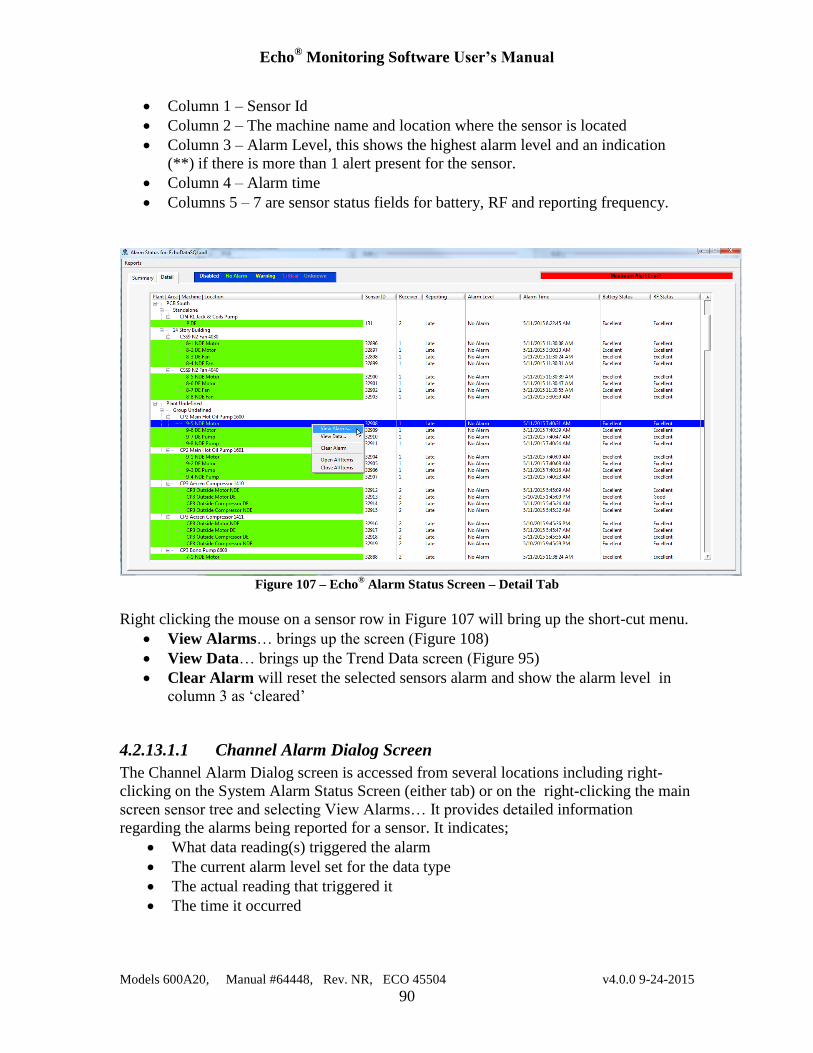
Echo® Monitoring Software User’s Manual
Models 600A20, Manual #64448, Rev. NR, ECO 45504 v4.0.0 9-24-2015
90
Column 1 – Sensor Id
Column 2 – The machine name and location where the sensor is located
Column 3 – Alarm Level, this shows the highest alarm level and an indication
(**) if there is more than 1 alert present for the sensor.
Column 4 – Alarm time
Columns 5 – 7 are sensor status fields for battery, RF and reporting frequency.
Figure 107 – Echo
® Alarm Status Screen – Detail Tab
Right clicking the mouse on a sensor row in Figure 107 will bring up the short-cut menu.
View Alarms… brings up the screen (Figure 108)
View Data… brings up the Trend Data screen (Figure 95)
Clear Alarm will reset the selected sensors alarm and show the alarm level in
column 3 as ‘cleared’
4.2.13.1.1 Channel Alarm Dialog Screen
The Channel Alarm Dialog screen is accessed from several locations including right-
clicking on the System Alarm Status Screen (either tab) or on the right-clicking the main
screen sensor tree and selecting View Alarms… It provides detailed information
regarding the alarms being reported for a sensor. It indicates;
What data reading(s) triggered the alarm
The current alarm level set for the data type
The actual reading that triggered it
The time it occurred
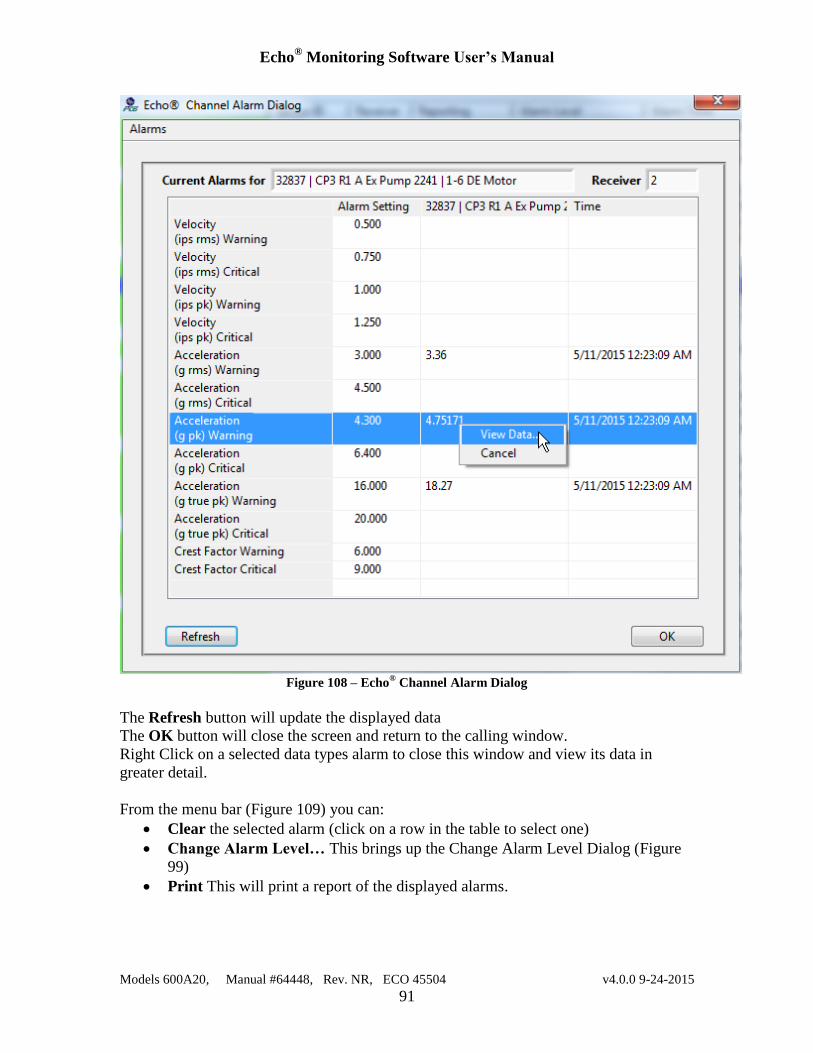
Echo® Monitoring Software User’s Manual
Models 600A20, Manual #64448, Rev. NR, ECO 45504 v4.0.0 9-24-2015
91
Figure 108 – Echo
® Channel Alarm Dialog
The Refresh button will update the displayed data
The OK button will close the screen and return to the calling window.
Right Click on a selected data types alarm to close this window and view its data in
greater detail.
From the menu bar (Figure 109) you can:
Clear the selected alarm (click on a row in the table to select one)
Change Alarm Level… This brings up the Change Alarm Level Dialog (Figure
99)
Print This will print a report of the displayed alarms.
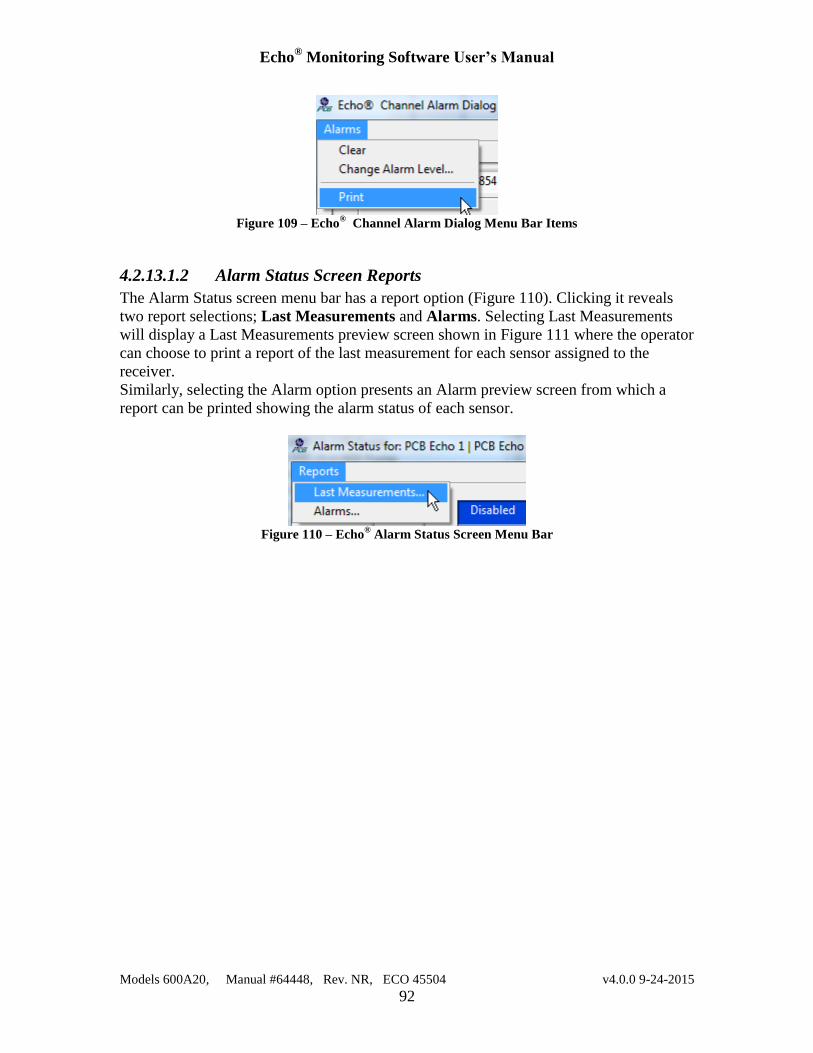
Echo® Monitoring Software User’s Manual
Models 600A20, Manual #64448, Rev. NR, ECO 45504 v4.0.0 9-24-2015
92
Figure 109 – Echo
® Channel Alarm Dialog Menu Bar Items
4.2.13.1.2 Alarm Status Screen Reports
The Alarm Status screen menu bar has a report option (Figure 110). Clicking it reveals
two report selections; Last Measurements and Alarms. Selecting Last Measurements
will display a Last Measurements preview screen shown in Figure 111 where the operator
can choose to print a report of the last measurement for each sensor assigned to the
receiver.
Similarly, selecting the Alarm option presents an Alarm preview screen from which a
report can be printed showing the alarm status of each sensor.
Figure 110 – Echo
® Alarm Status Screen Menu Bar
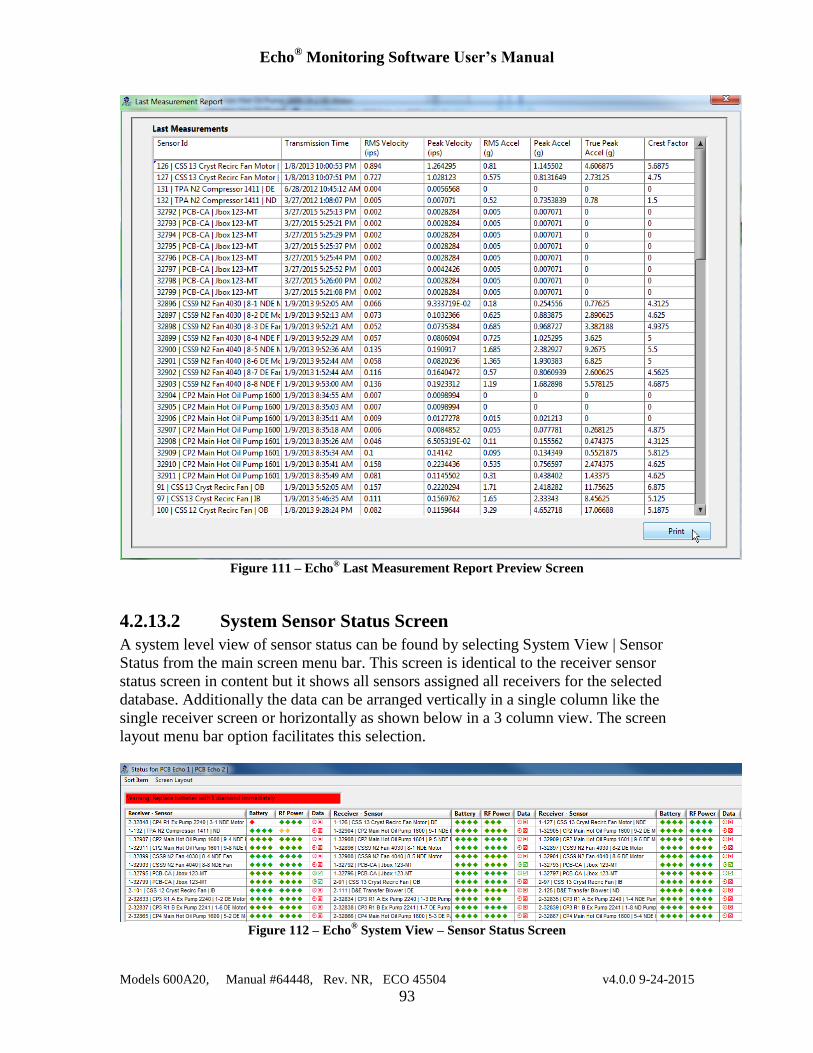
Echo® Monitoring Software User’s Manual
Models 600A20, Manual #64448, Rev. NR, ECO 45504 v4.0.0 9-24-2015
93
Figure 111 – Echo
® Last Measurement Report Preview Screen
4.2.13.2 System Sensor Status Screen
A system level view of sensor status can be found by selecting System View | Sensor
Status from the main screen menu bar. This screen is identical to the receiver sensor
status screen in content but it shows all sensors assigned all receivers for the selected
database. Additionally the data can be arranged vertically in a single column like the
single receiver screen or horizontally as shown below in a 3 column view. The screen
layout menu bar option facilitates this selection.
Figure 112 – Echo
® System View – Sensor Status Screen
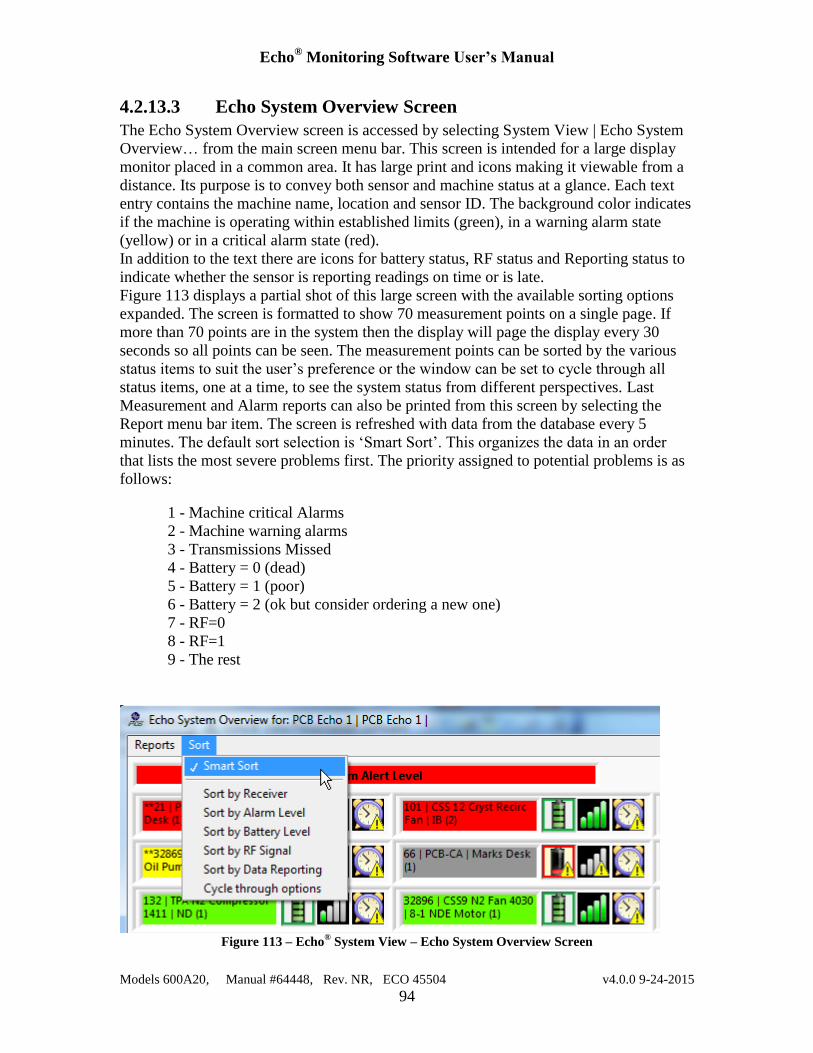
Echo® Monitoring Software User’s Manual
Models 600A20, Manual #64448, Rev. NR, ECO 45504 v4.0.0 9-24-2015
94
4.2.13.3 Echo System Overview Screen
The Echo System Overview screen is accessed by selecting System View | Echo System
Overview… from the main screen menu bar. This screen is intended for a large display
monitor placed in a common area. It has large print and icons making it viewable from a
distance. Its purpose is to convey both sensor and machine status at a glance. Each text
entry contains the machine name, location and sensor ID. The background color indicates
if the machine is operating within established limits (green), in a warning alarm state
(yellow) or in a critical alarm state (red).
In addition to the text there are icons for battery status, RF status and Reporting status to
indicate whether the sensor is reporting readings on time or is late.
Figure 113 displays a partial shot of this large screen with the available sorting options
expanded. The screen is formatted to show 70 measurement points on a single page. If
more than 70 points are in the system then the display will page the display every 30
seconds so all points can be seen. The measurement points can be sorted by the various
status items to suit the user’s preference or the window can be set to cycle through all
status items, one at a time, to see the system status from different perspectives. Last
Measurement and Alarm reports can also be printed from this screen by selecting the
Report menu bar item. The screen is refreshed with data from the database every 5
minutes. The default sort selection is ‘Smart Sort’. This organizes the data in an order
that lists the most severe problems first. The priority assigned to potential problems is as
follows:
1 - Machine critical Alarms
2 - Machine warning alarms
3 - Transmissions Missed
4 - Battery = 0 (dead)
5 - Battery = 1 (poor)
6 - Battery = 2 (ok but consider ordering a new one)
7 - RF=0
8 - RF=1
9 - The rest
Figure 113 – Echo
® System View – Echo System Overview Screen
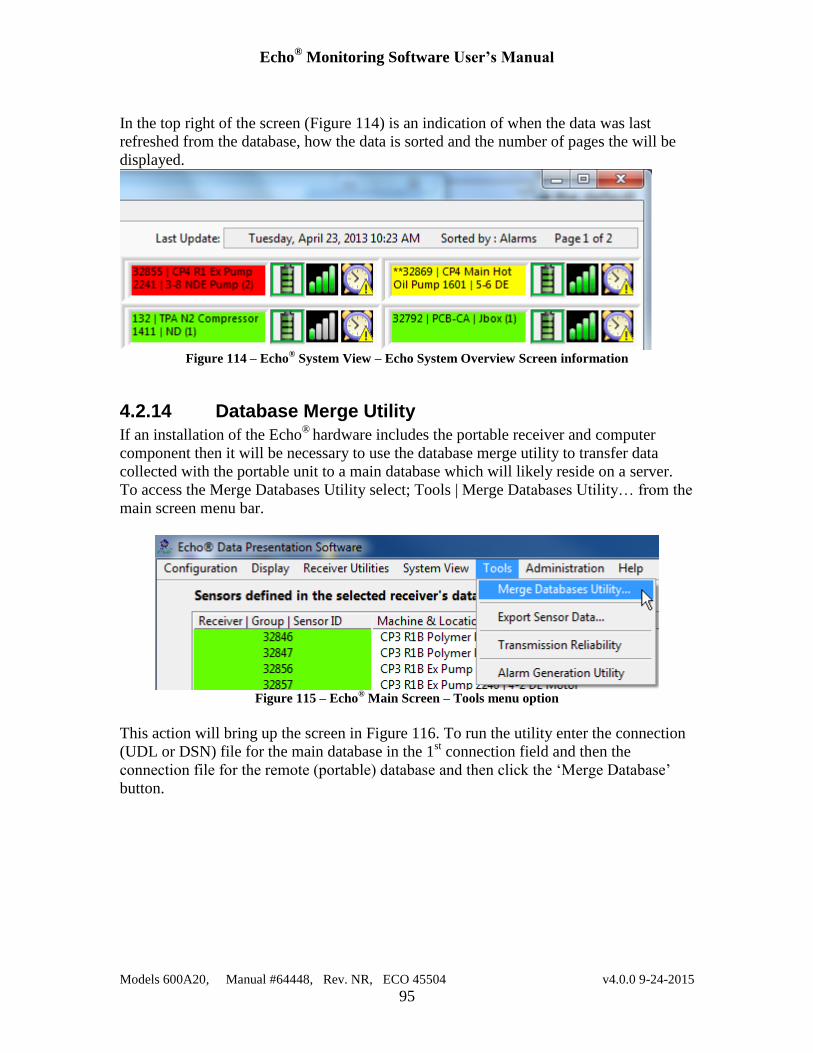
Echo® Monitoring Software User’s Manual
Models 600A20, Manual #64448, Rev. NR, ECO 45504 v4.0.0 9-24-2015
95
In the top right of the screen (Figure 114) is an indication of when the data was last
refreshed from the database, how the data is sorted and the number of pages the will be
displayed.
Figure 114 – Echo
® System View – Echo System Overview Screen information
4.2.14 Database Merge Utility
If an installation of the Echo®
hardware includes the portable receiver and computer
component then it will be necessary to use the database merge utility to transfer data
collected with the portable unit to a main database which will likely reside on a server.
To access the Merge Databases Utility select; Tools | Merge Databases Utility… from the
main screen menu bar.
Figure 115 – Echo
® Main Screen – Tools menu option
This action will bring up the screen in Figure 116. To run the utility enter the connection
(UDL or DSN) file for the main database in the 1st connection field and then the
connection file for the remote (portable) database and then click the ‘Merge Database’
button.
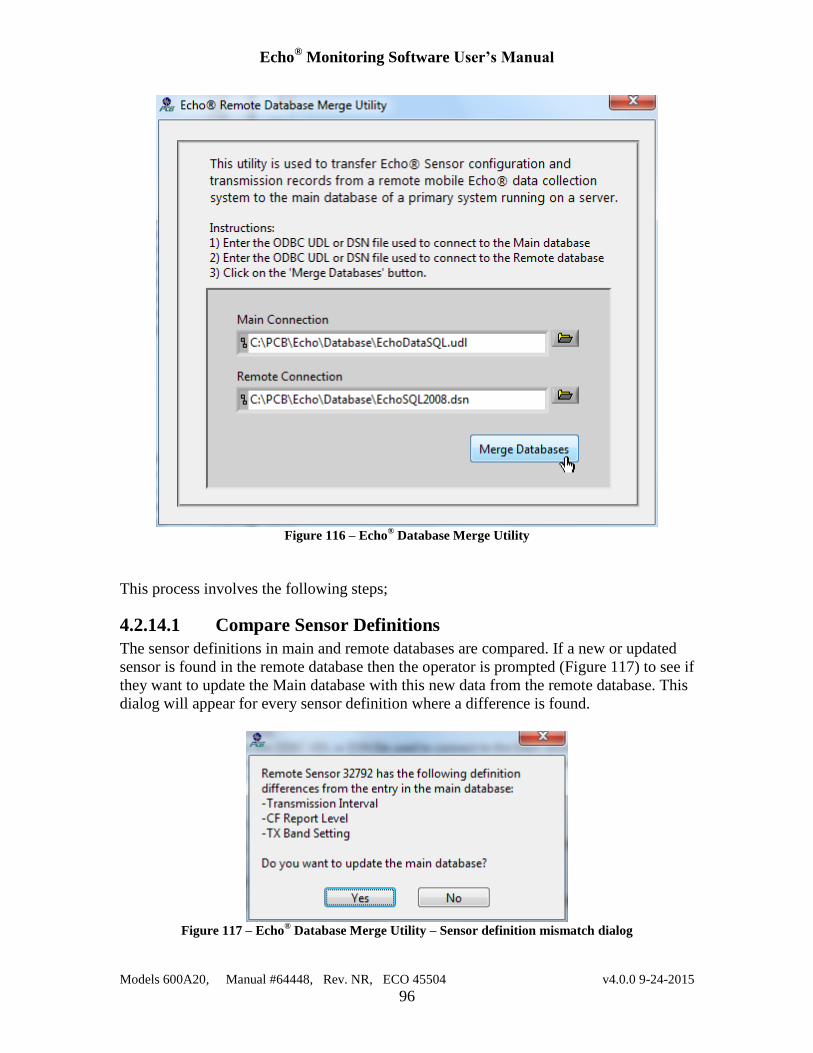
Echo® Monitoring Software User’s Manual
Models 600A20, Manual #64448, Rev. NR, ECO 45504 v4.0.0 9-24-2015
96
Figure 116 – Echo
® Database Merge Utility
This process involves the following steps;
4.2.14.1 Compare Sensor Definitions
The sensor definitions in main and remote databases are compared. If a new or updated
sensor is found in the remote database then the operator is prompted (Figure 117) to see if
they want to update the Main database with this new data from the remote database. This
dialog will appear for every sensor definition where a difference is found.
Figure 117 – Echo
® Database Merge Utility – Sensor definition mismatch dialog
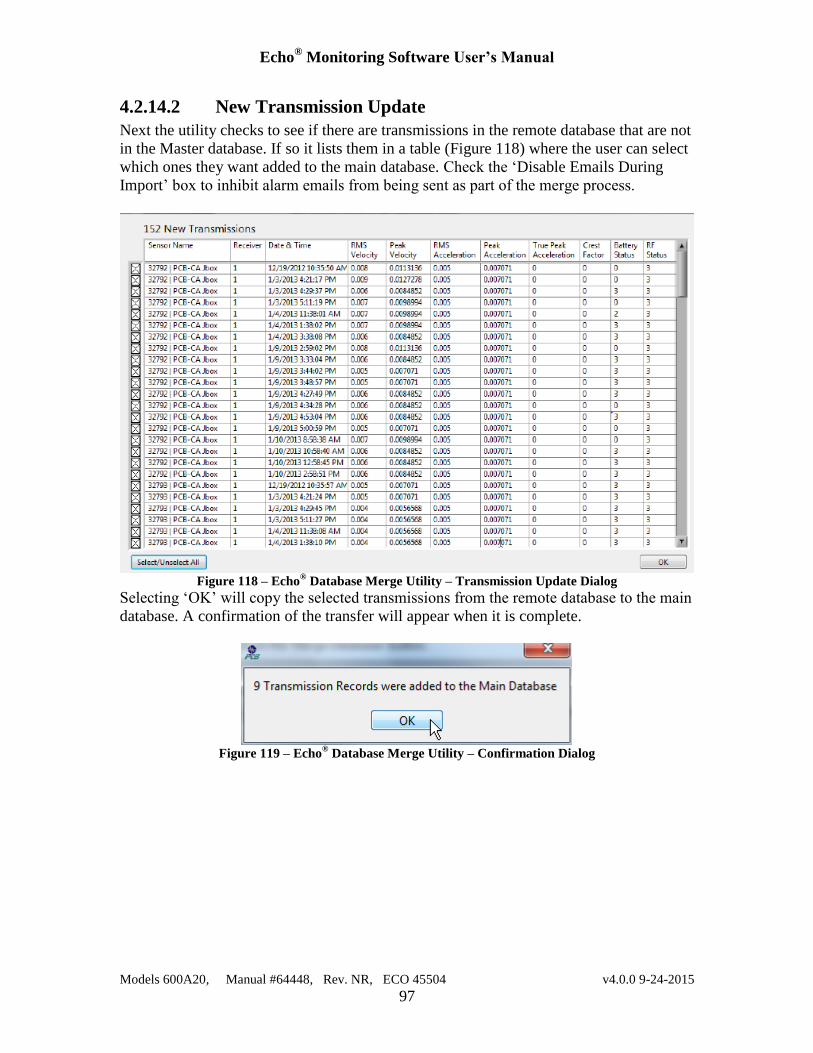
Echo® Monitoring Software User’s Manual
Models 600A20, Manual #64448, Rev. NR, ECO 45504 v4.0.0 9-24-2015
97
4.2.14.2 New Transmission Update
Next the utility checks to see if there are transmissions in the remote database that are not
in the Master database. If so it lists them in a table (Figure 118) where the user can select
which ones they want added to the main database. Check the ‘Disable Emails During
Import’ box to inhibit alarm emails from being sent as part of the merge process.
Figure 118 – Echo
® Database Merge Utility – Transmission Update Dialog
Selecting ‘OK’ will copy the selected transmissions from the remote database to the main
database. A confirmation of the transfer will appear when it is complete.
Figure 119 – Echo
® Database Merge Utility – Confirmation Dialog
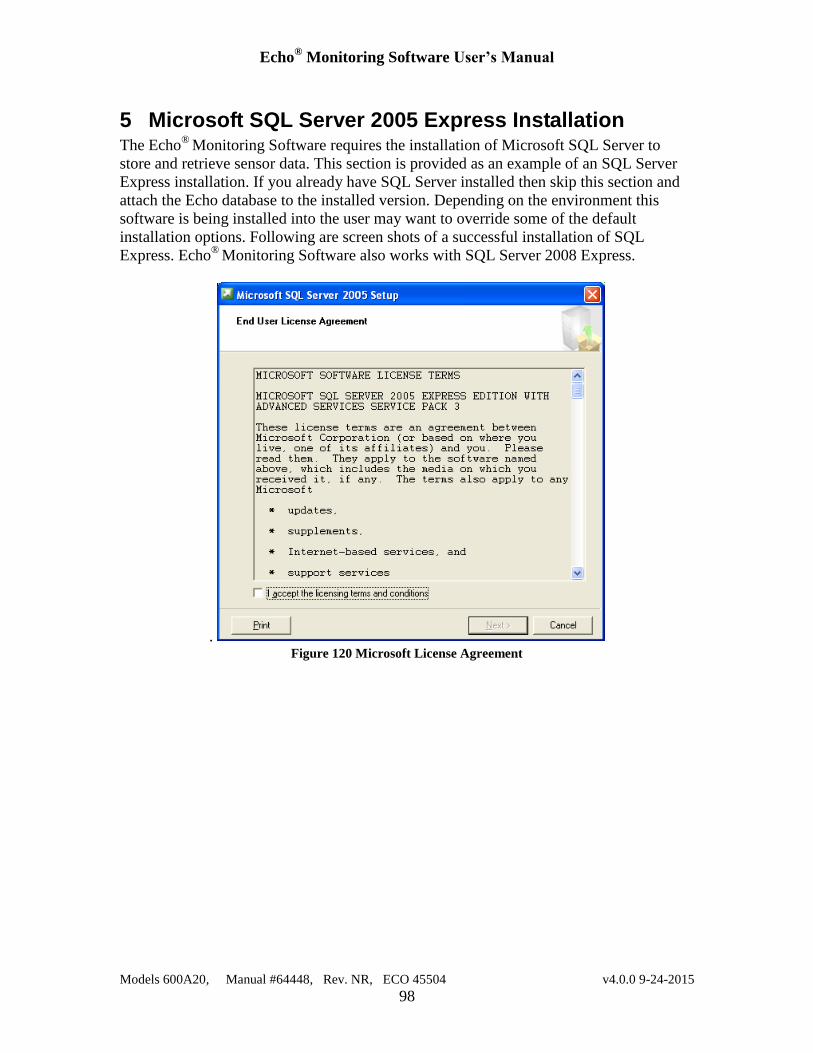
Echo® Monitoring Software User’s Manual
Models 600A20, Manual #64448, Rev. NR, ECO 45504 v4.0.0 9-24-2015
98
5 Microsoft SQL Server 2005 Express Installation The Echo
® Monitoring Software requires the installation of Microsoft SQL Server to
store and retrieve sensor data. This section is provided as an example of an SQL Server
Express installation. If you already have SQL Server installed then skip this section and
attach the Echo database to the installed version. Depending on the environment this
software is being installed into the user may want to override some of the default
installation options. Following are screen shots of a successful installation of SQL
Express. Echo®
Monitoring Software also works with SQL Server 2008 Express.
. Figure 120 Microsoft License Agreement
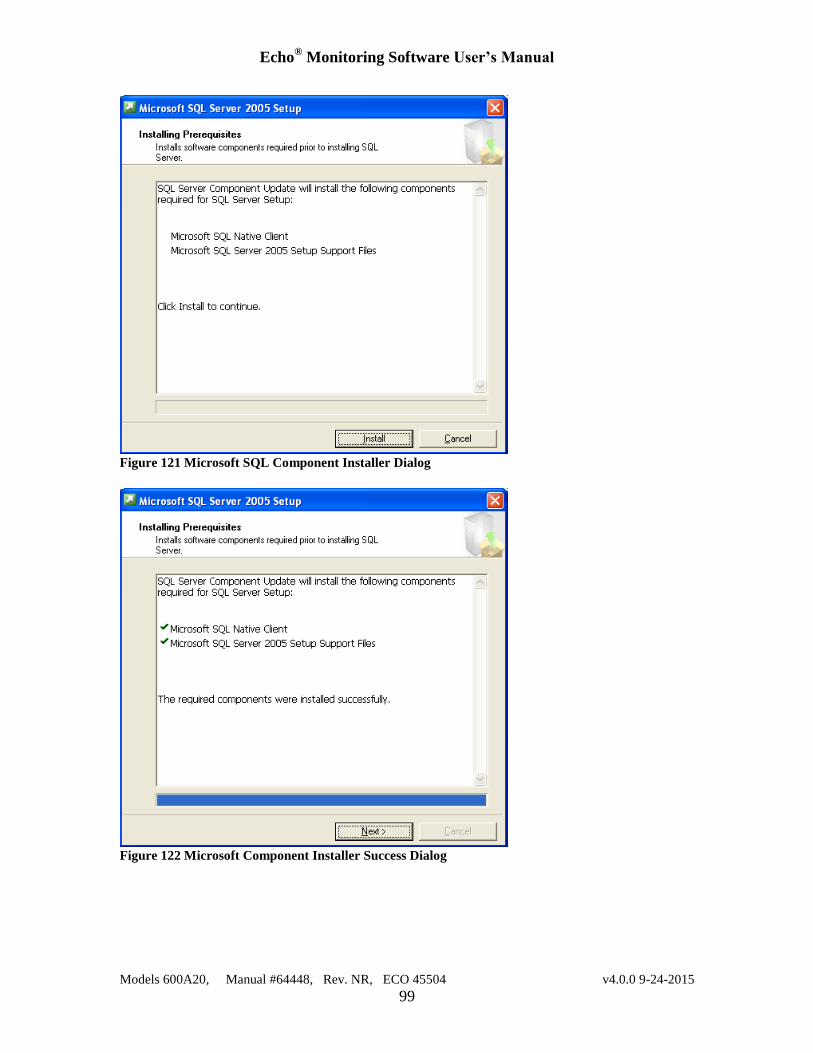
Echo® Monitoring Software User’s Manual
Models 600A20, Manual #64448, Rev. NR, ECO 45504 v4.0.0 9-24-2015
99
Figure 121 Microsoft SQL Component Installer Dialog
Figure 122 Microsoft Component Installer Success Dialog
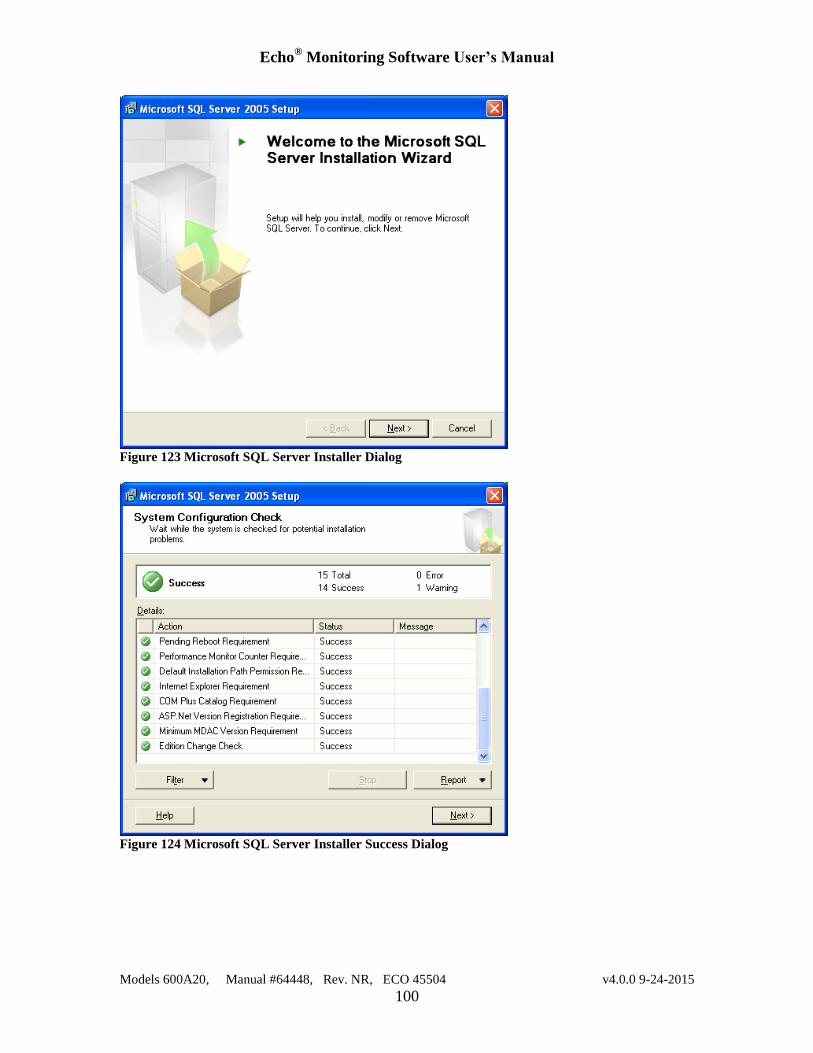
Echo® Monitoring Software User’s Manual
Models 600A20, Manual #64448, Rev. NR, ECO 45504 v4.0.0 9-24-2015
100
Figure 123 Microsoft SQL Server Installer Dialog
Figure 124 Microsoft SQL Server Installer Success Dialog
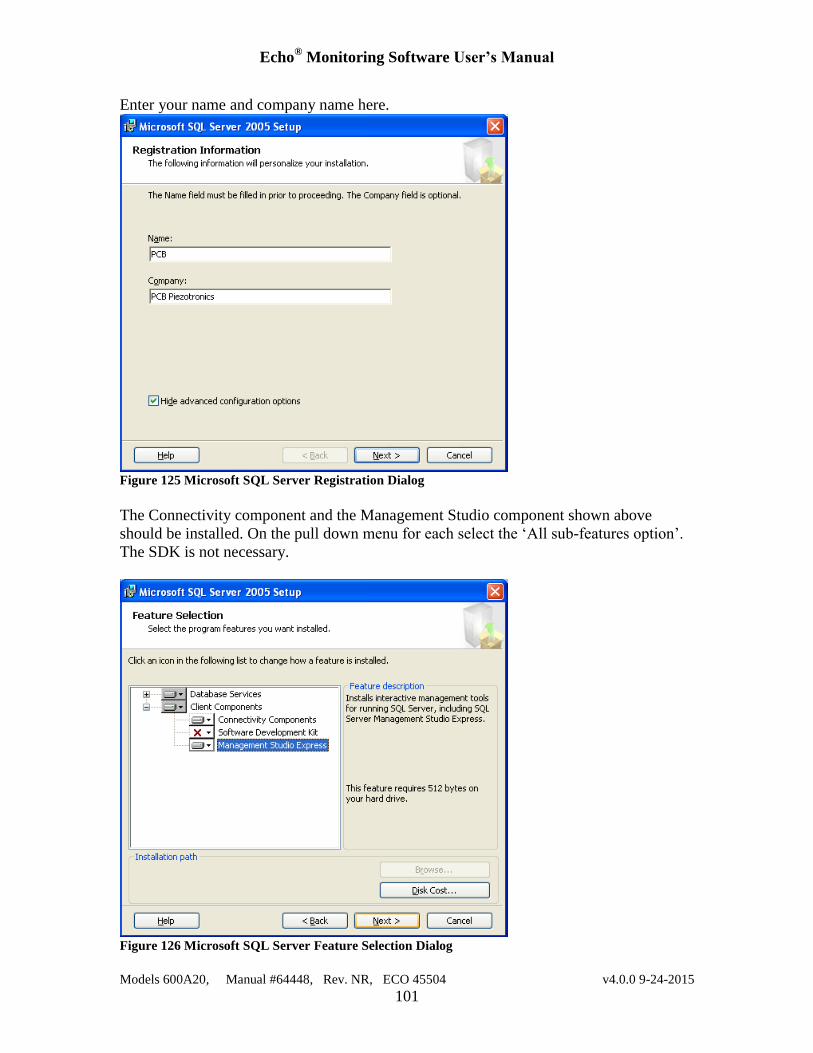
Echo® Monitoring Software User’s Manual
Models 600A20, Manual #64448, Rev. NR, ECO 45504 v4.0.0 9-24-2015
101
Enter your name and company name here.
Figure 125 Microsoft SQL Server Registration Dialog
The Connectivity component and the Management Studio component shown above
should be installed. On the pull down menu for each select the ‘All sub-features option’.
The SDK is not necessary.
Figure 126 Microsoft SQL Server Feature Selection Dialog
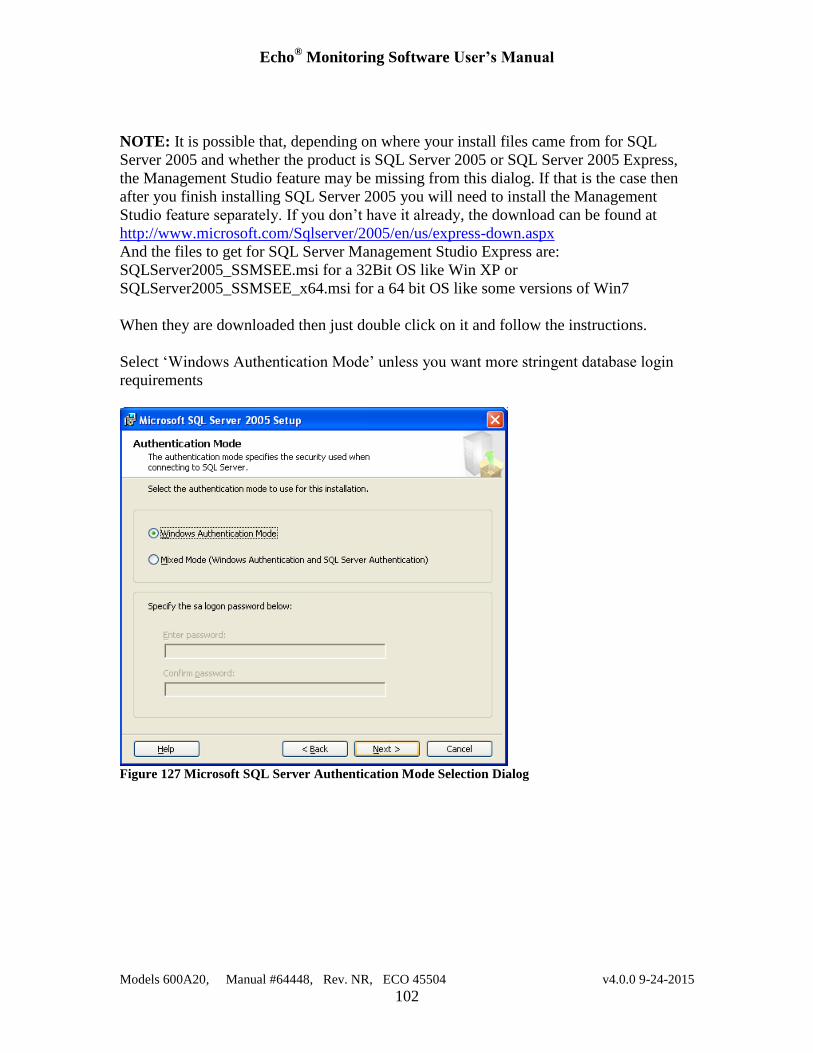
Echo® Monitoring Software User’s Manual
Models 600A20, Manual #64448, Rev. NR, ECO 45504 v4.0.0 9-24-2015
102
NOTE: It is possible that, depending on where your install files came from for SQL
Server 2005 and whether the product is SQL Server 2005 or SQL Server 2005 Express,
the Management Studio feature may be missing from this dialog. If that is the case then
after you finish installing SQL Server 2005 you will need to install the Management
Studio feature separately. If you don’t have it already, the download can be found at
http://www.microsoft.com/Sqlserver/2005/en/us/express-down.aspx
And the files to get for SQL Server Management Studio Express are:
SQLServer2005_SSMSEE.msi for a 32Bit OS like Win XP or
SQLServer2005_SSMSEE_x64.msi for a 64 bit OS like some versions of Win7
When they are downloaded then just double click on it and follow the instructions.
Select ‘Windows Authentication Mode’ unless you want more stringent database login
requirements
Figure 127 Microsoft SQL Server Authentication Mode Selection Dialog
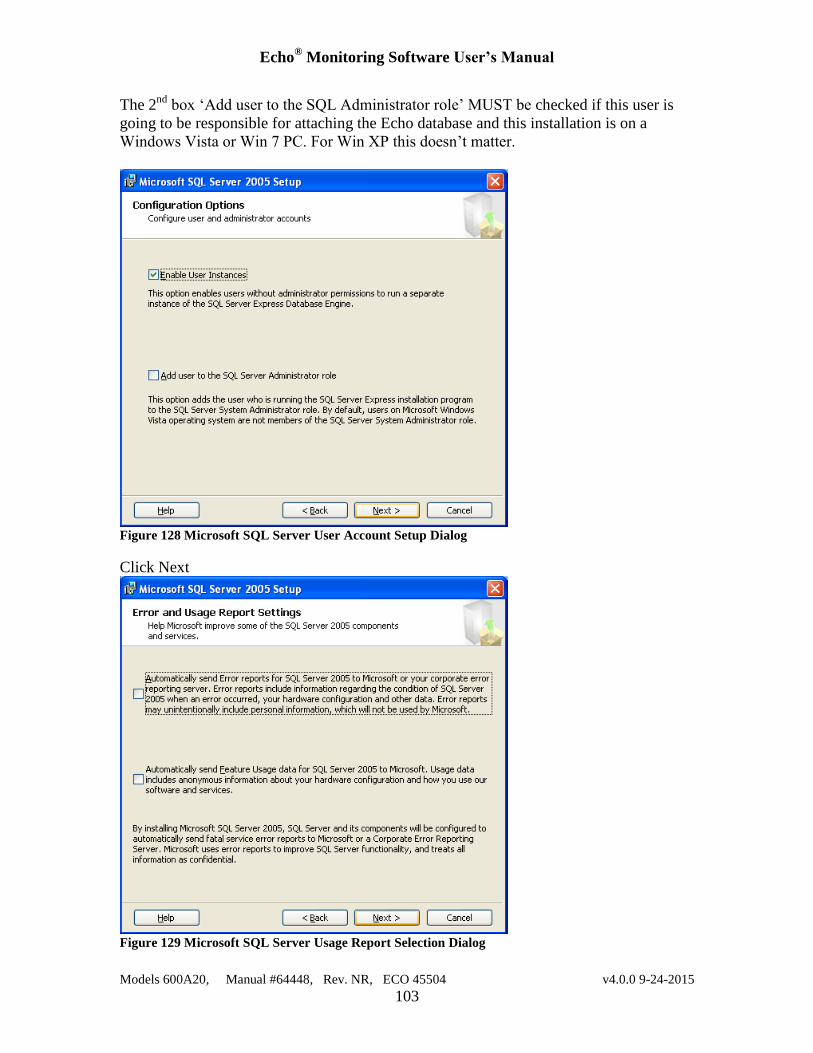
Echo® Monitoring Software User’s Manual
Models 600A20, Manual #64448, Rev. NR, ECO 45504 v4.0.0 9-24-2015
103
The 2nd
box ‘Add user to the SQL Administrator role’ MUST be checked if this user is
going to be responsible for attaching the Echo database and this installation is on a
Windows Vista or Win 7 PC. For Win XP this doesn’t matter.
Figure 128 Microsoft SQL Server User Account Setup Dialog
Click Next
Figure 129 Microsoft SQL Server Usage Report Selection Dialog
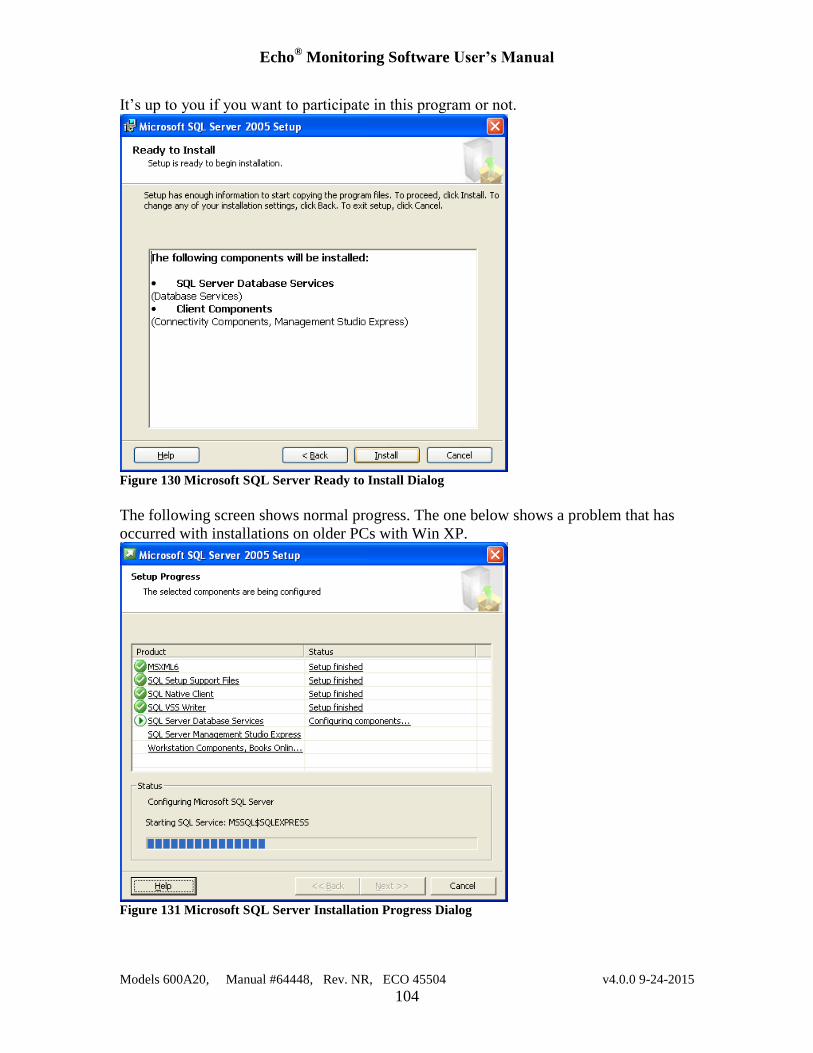
Echo® Monitoring Software User’s Manual
Models 600A20, Manual #64448, Rev. NR, ECO 45504 v4.0.0 9-24-2015
104
It’s up to you if you want to participate in this program or not.
Figure 130 Microsoft SQL Server Ready to Install Dialog
The following screen shows normal progress. The one below shows a problem that has
occurred with installations on older PCs with Win XP.
Figure 131 Microsoft SQL Server Installation Progress Dialog
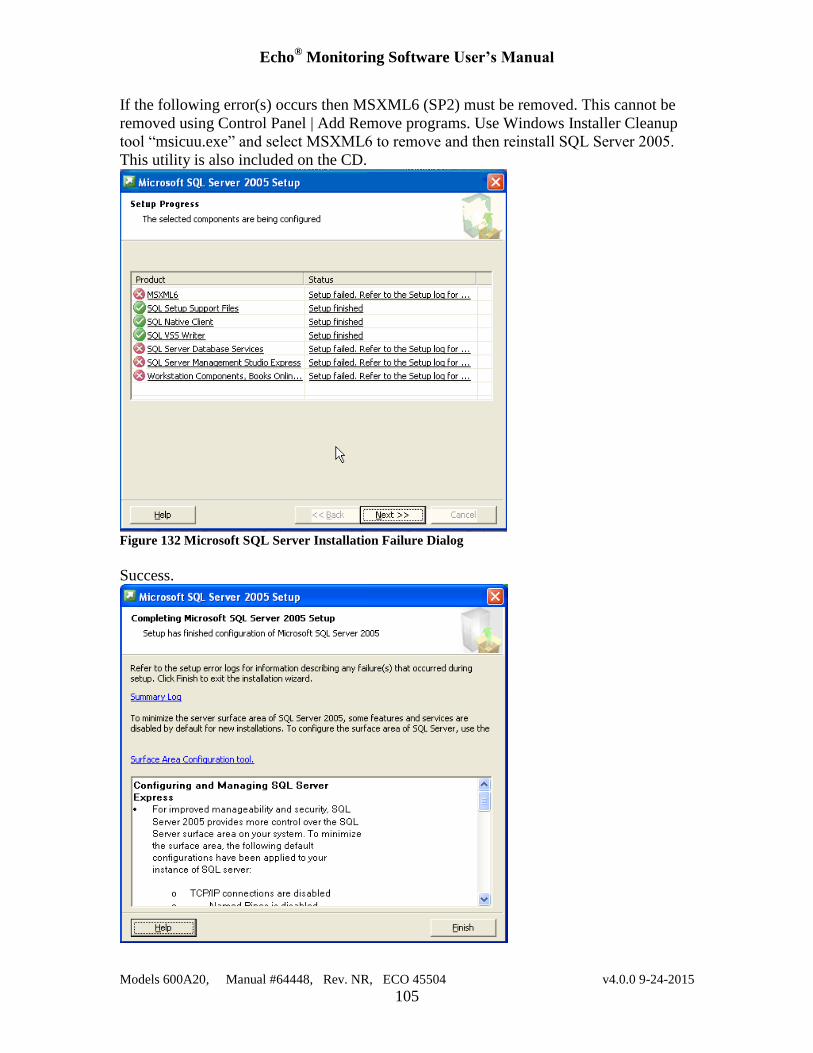
Echo® Monitoring Software User’s Manual
Models 600A20, Manual #64448, Rev. NR, ECO 45504 v4.0.0 9-24-2015
105
If the following error(s) occurs then MSXML6 (SP2) must be removed. This cannot be
removed using Control Panel | Add Remove programs. Use Windows Installer Cleanup
tool “msicuu.exe” and select MSXML6 to remove and then reinstall SQL Server 2005.
This utility is also included on the CD.
Figure 132 Microsoft SQL Server Installation Failure Dialog
Success.
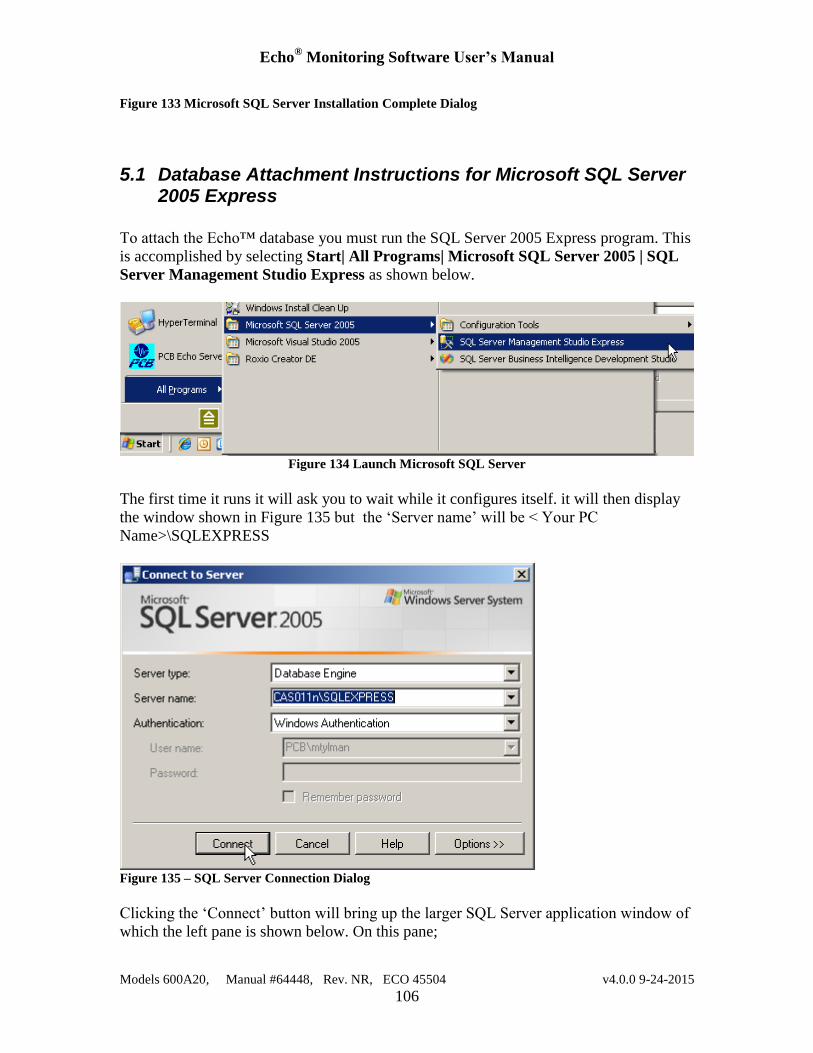
Echo® Monitoring Software User’s Manual
Models 600A20, Manual #64448, Rev. NR, ECO 45504 v4.0.0 9-24-2015
106
Figure 133 Microsoft SQL Server Installation Complete Dialog
5.1 Database Attachment Instructions for Microsoft SQL Server 2005 Express
To attach the Echo™ database you must run the SQL Server 2005 Express program. This
is accomplished by selecting Start| All Programs| Microsoft SQL Server 2005 | SQL
Server Management Studio Express as shown below.
Figure 134 Launch Microsoft SQL Server
The first time it runs it will ask you to wait while it configures itself. it will then display
the window shown in Figure 135 but the ‘Server name’ will be < Your PC
Name>\SQLEXPRESS
Figure 135 – SQL Server Connection Dialog
Clicking the ‘Connect’ button will bring up the larger SQL Server application window of
which the left pane is shown below. On this pane;
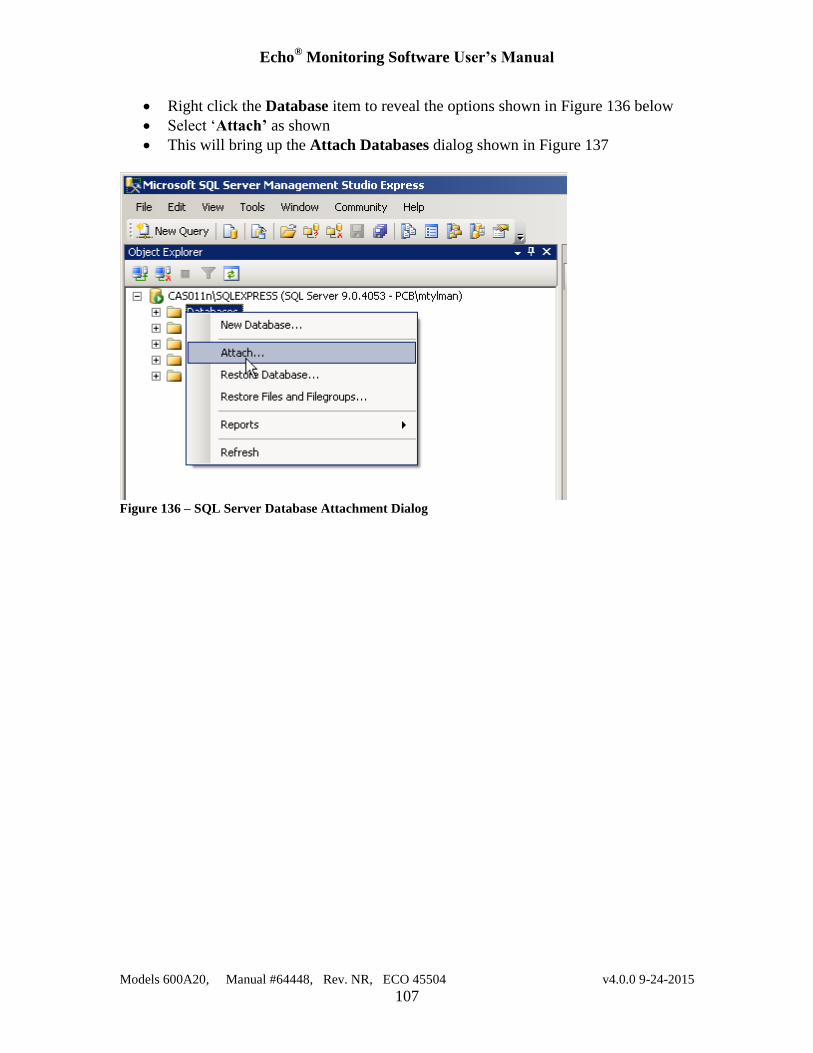
Echo® Monitoring Software User’s Manual
Models 600A20, Manual #64448, Rev. NR, ECO 45504 v4.0.0 9-24-2015
107
Right click the Database item to reveal the options shown in Figure 136 below
Select ‘Attach’ as shown
This will bring up the Attach Databases dialog shown in Figure 137
Figure 136 – SQL Server Database Attachment Dialog
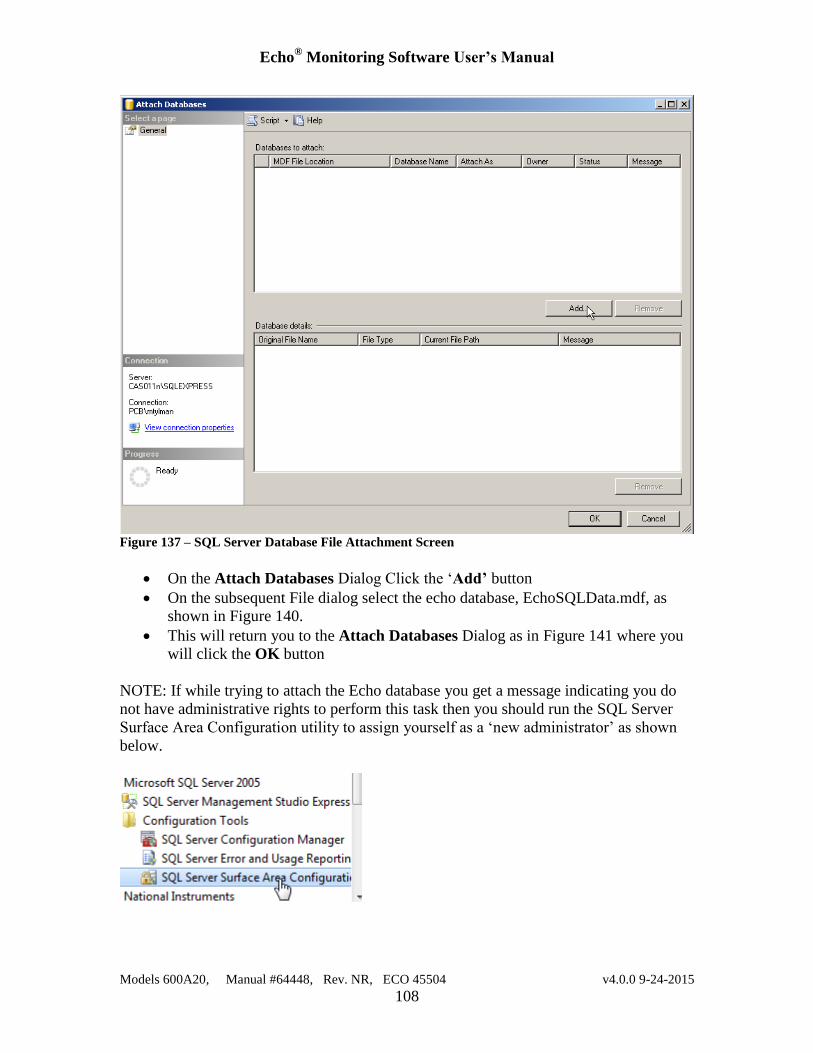
Echo® Monitoring Software User’s Manual
Models 600A20, Manual #64448, Rev. NR, ECO 45504 v4.0.0 9-24-2015
108
Figure 137 – SQL Server Database File Attachment Screen
On the Attach Databases Dialog Click the ‘Add’ button
On the subsequent File dialog select the echo database, EchoSQLData.mdf, as
shown in Figure 140.
This will return you to the Attach Databases Dialog as in Figure 141 where you
will click the OK button
NOTE: If while trying to attach the Echo database you get a message indicating you do
not have administrative rights to perform this task then you should run the SQL Server
Surface Area Configuration utility to assign yourself as a ‘new administrator’ as shown
below.
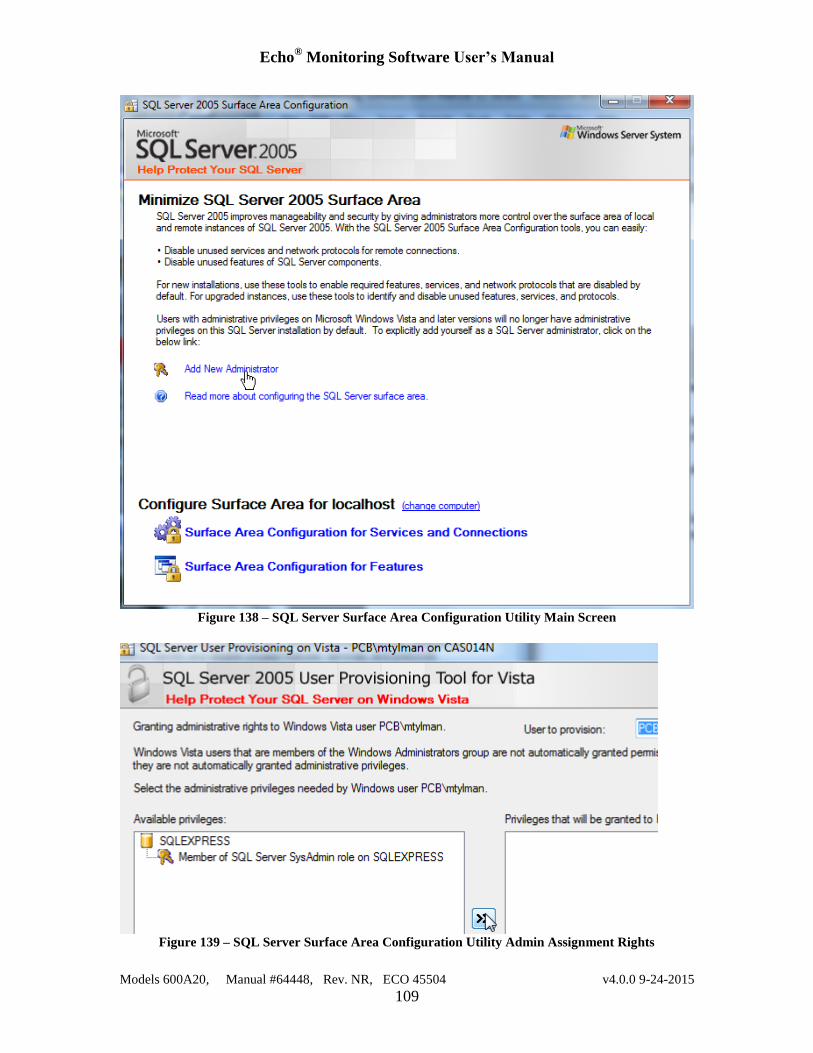
Echo® Monitoring Software User’s Manual
Models 600A20, Manual #64448, Rev. NR, ECO 45504 v4.0.0 9-24-2015
109
Figure 138 – SQL Server Surface Area Configuration Utility Main Screen
Figure 139 – SQL Server Surface Area Configuration Utility Admin Assignment Rights
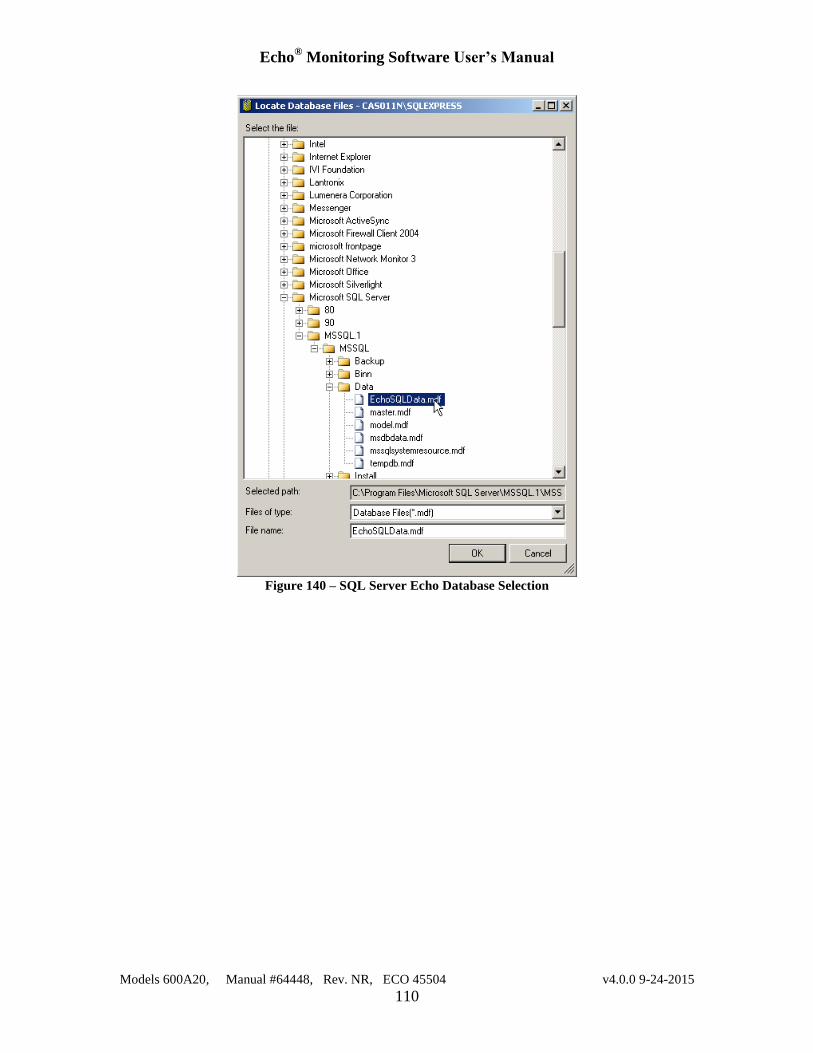
Echo® Monitoring Software User’s Manual
Models 600A20, Manual #64448, Rev. NR, ECO 45504 v4.0.0 9-24-2015
110
Figure 140 – SQL Server Echo Database Selection
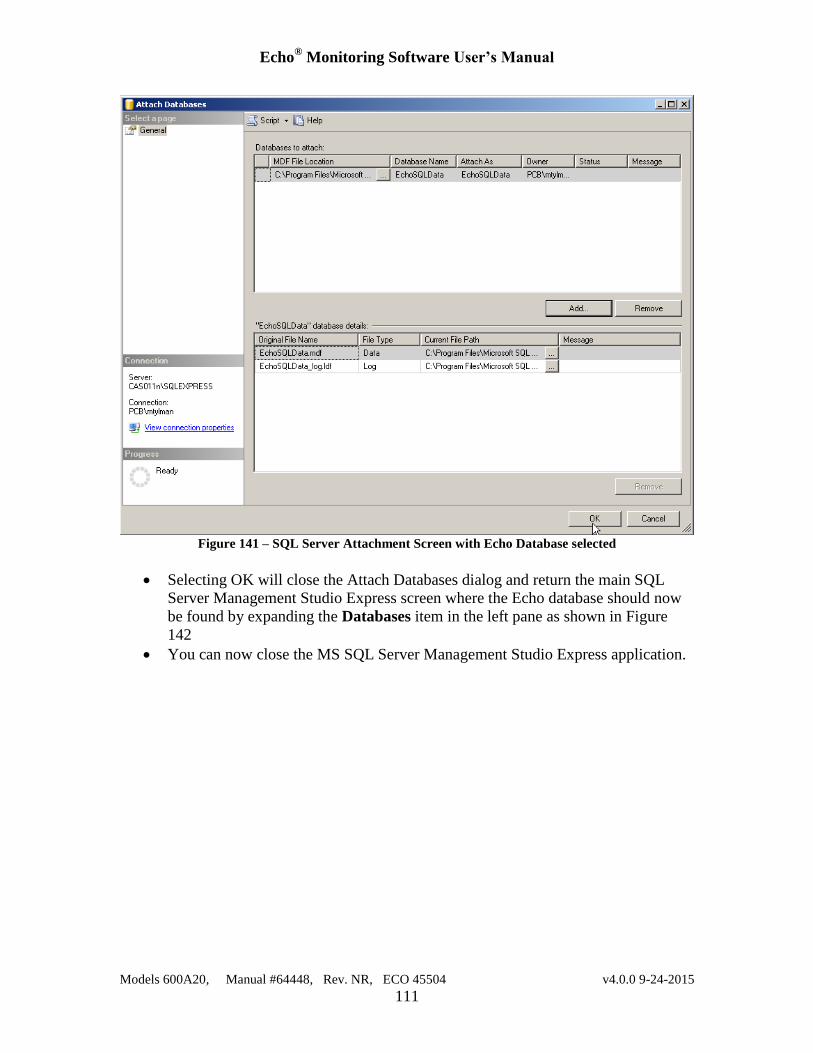
Echo® Monitoring Software User’s Manual
Models 600A20, Manual #64448, Rev. NR, ECO 45504 v4.0.0 9-24-2015
111
Figure 141 – SQL Server Attachment Screen with Echo Database selected
Selecting OK will close the Attach Databases dialog and return the main SQL
Server Management Studio Express screen where the Echo database should now
be found by expanding the Databases item in the left pane as shown in Figure
142
You can now close the MS SQL Server Management Studio Express application.
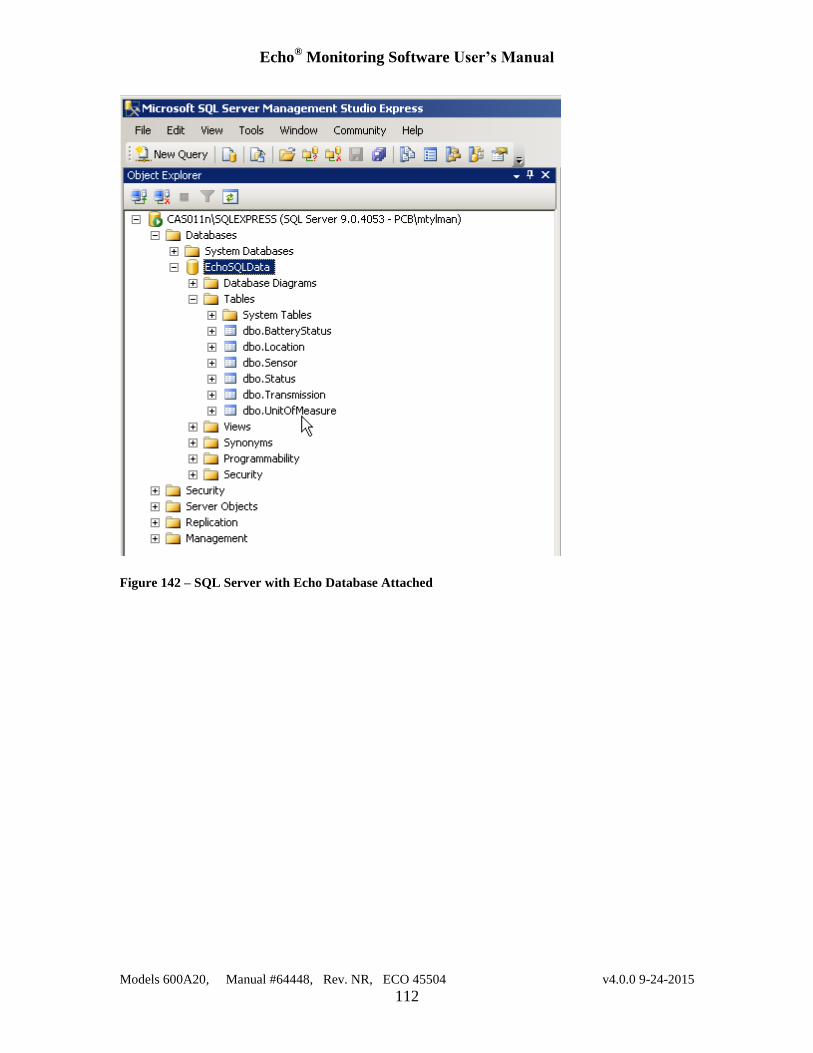
Echo® Monitoring Software User’s Manual
Models 600A20, Manual #64448, Rev. NR, ECO 45504 v4.0.0 9-24-2015
112
Figure 142 – SQL Server with Echo Database Attached
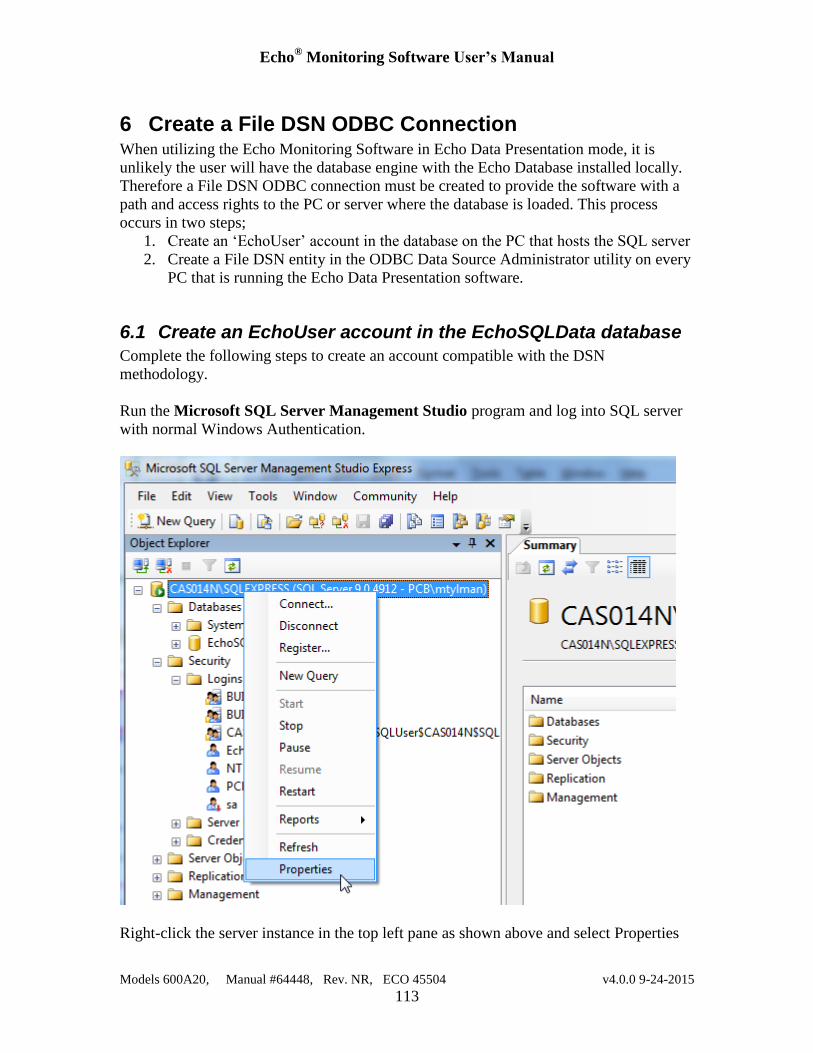
Echo® Monitoring Software User’s Manual
Models 600A20, Manual #64448, Rev. NR, ECO 45504 v4.0.0 9-24-2015
113
6 Create a File DSN ODBC Connection When utilizing the Echo Monitoring Software in Echo Data Presentation mode, it is
unlikely the user will have the database engine with the Echo Database installed locally.
Therefore a File DSN ODBC connection must be created to provide the software with a
path and access rights to the PC or server where the database is loaded. This process
occurs in two steps;
1. Create an ‘EchoUser’ account in the database on the PC that hosts the SQL server
2. Create a File DSN entity in the ODBC Data Source Administrator utility on every
PC that is running the Echo Data Presentation software.
6.1 Create an EchoUser account in the EchoSQLData database
Complete the following steps to create an account compatible with the DSN
methodology.
Run the Microsoft SQL Server Management Studio program and log into SQL server
with normal Windows Authentication.
Right-click the server instance in the top left pane as shown above and select Properties
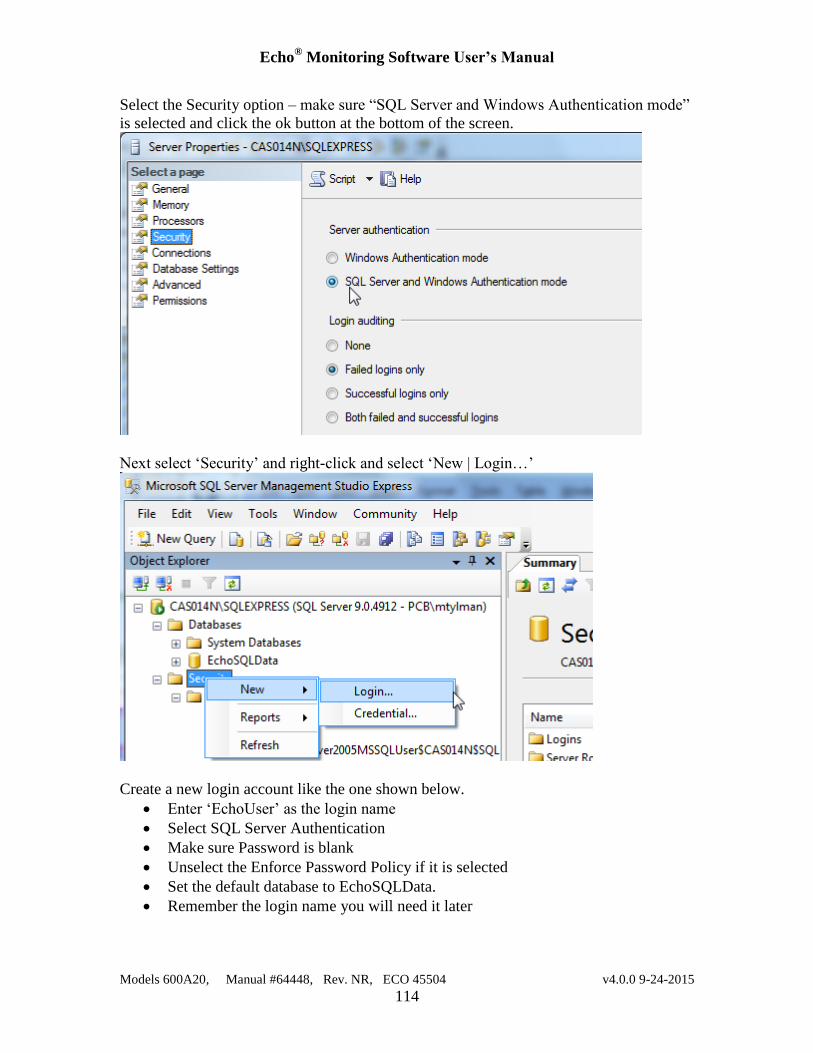
Echo® Monitoring Software User’s Manual
Models 600A20, Manual #64448, Rev. NR, ECO 45504 v4.0.0 9-24-2015
114
Select the Security option – make sure “SQL Server and Windows Authentication mode”
is selected and click the ok button at the bottom of the screen.
Next select ‘Security’ and right-click and select ‘New | Login…’
Create a new login account like the one shown below.
Enter ‘EchoUser’ as the login name
Select SQL Server Authentication
Make sure Password is blank
Unselect the Enforce Password Policy if it is selected
Set the default database to EchoSQLData.
Remember the login name you will need it later
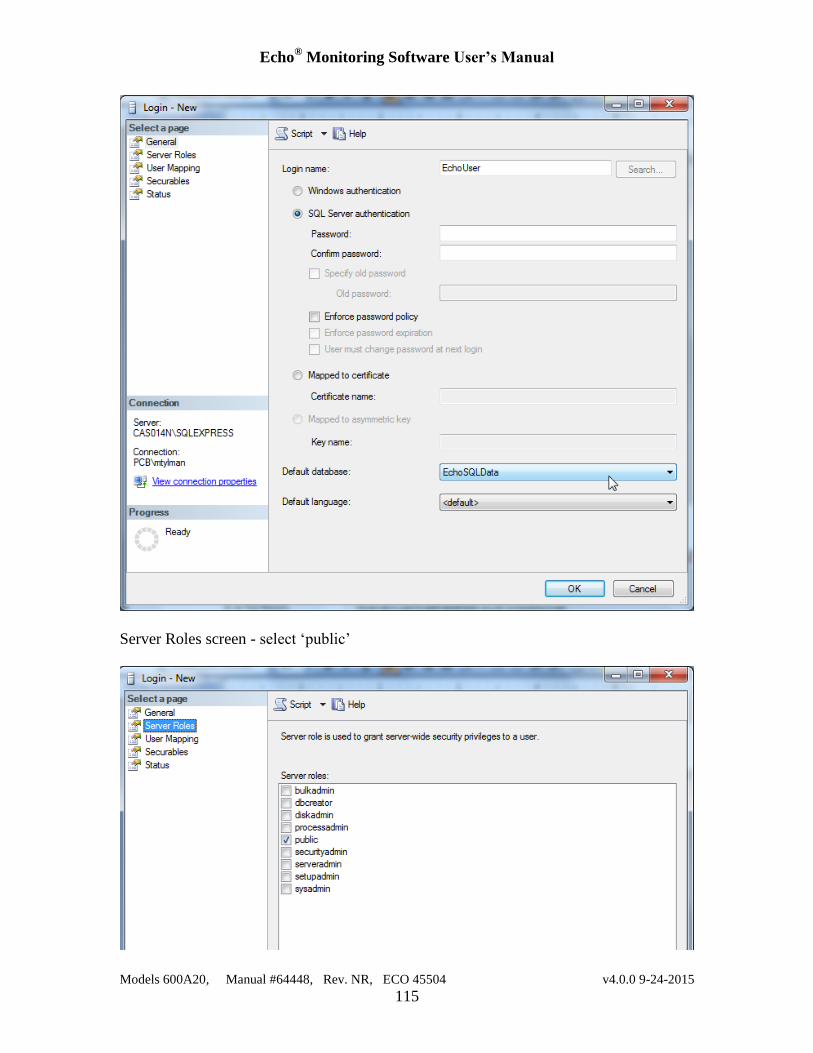
Echo® Monitoring Software User’s Manual
Models 600A20, Manual #64448, Rev. NR, ECO 45504 v4.0.0 9-24-2015
115
Server Roles screen - select ‘public’
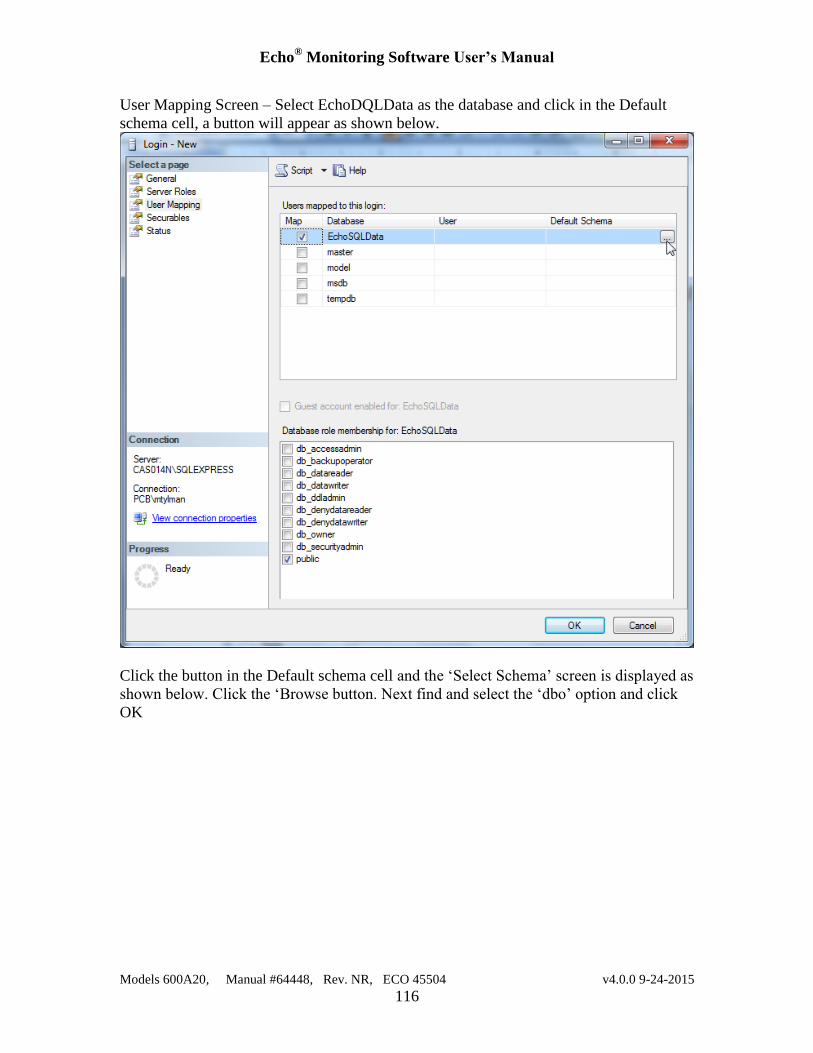
Echo® Monitoring Software User’s Manual
Models 600A20, Manual #64448, Rev. NR, ECO 45504 v4.0.0 9-24-2015
116
User Mapping Screen – Select EchoDQLData as the database and click in the Default
schema cell, a button will appear as shown below.
Click the button in the Default schema cell and the ‘Select Schema’ screen is displayed as
shown below. Click the ‘Browse button. Next find and select the ‘dbo’ option and click
OK
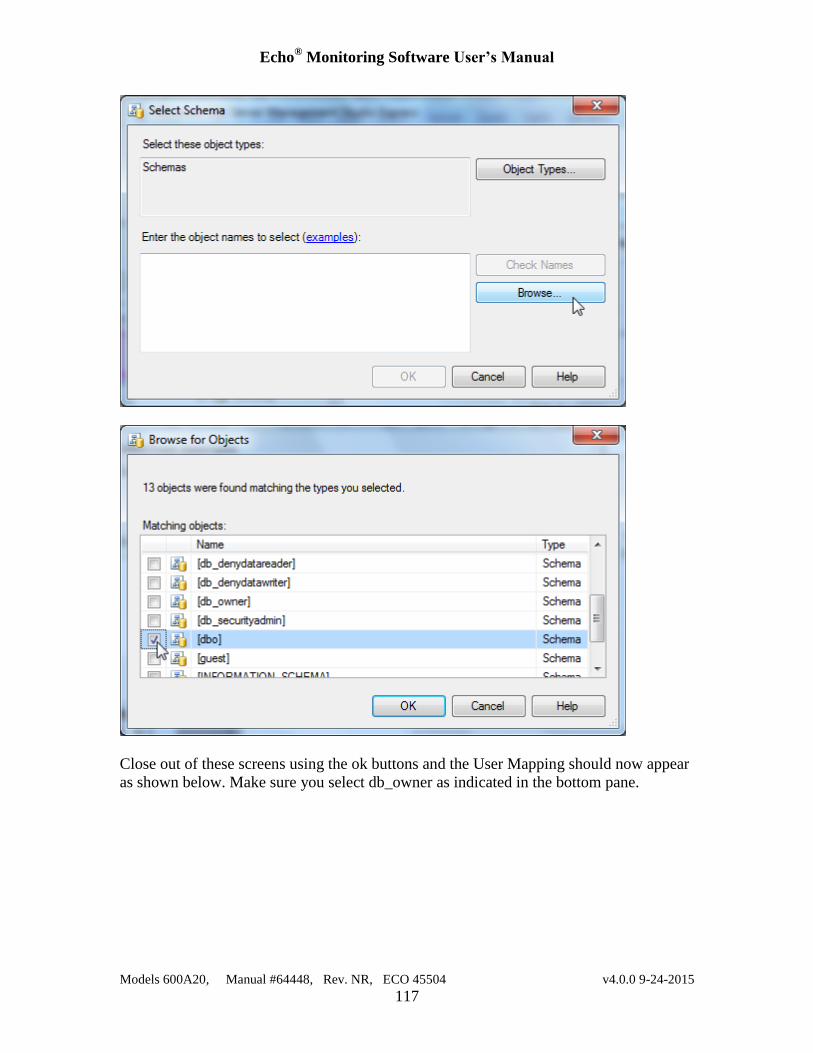
Echo® Monitoring Software User’s Manual
Models 600A20, Manual #64448, Rev. NR, ECO 45504 v4.0.0 9-24-2015
117
Close out of these screens using the ok buttons and the User Mapping should now appear
as shown below. Make sure you select db_owner as indicated in the bottom pane.
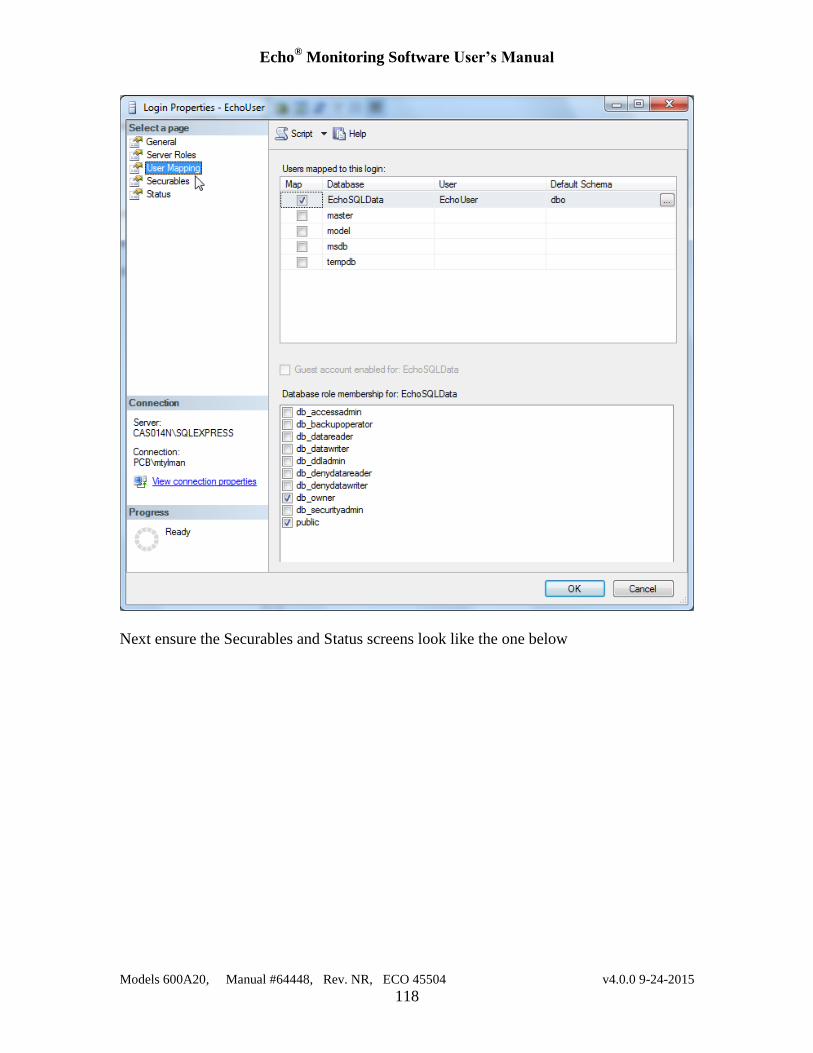
Echo® Monitoring Software User’s Manual
Models 600A20, Manual #64448, Rev. NR, ECO 45504 v4.0.0 9-24-2015
118
Next ensure the Securables and Status screens look like the one below
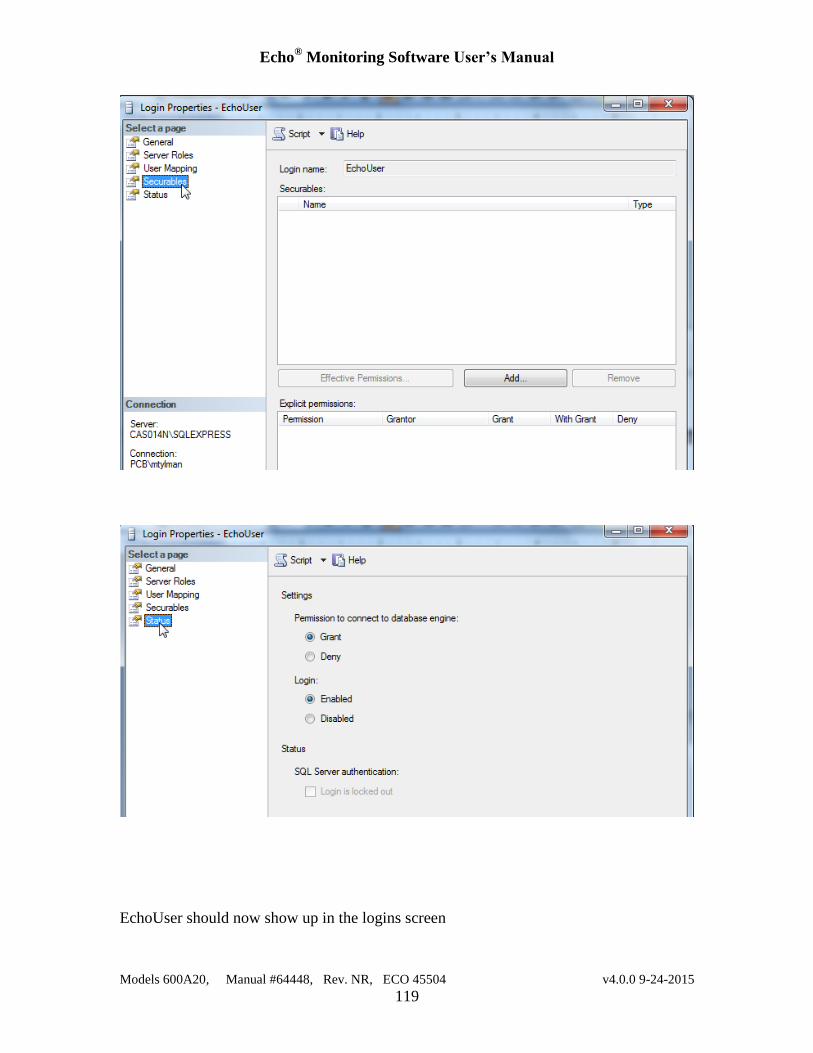
Echo® Monitoring Software User’s Manual
Models 600A20, Manual #64448, Rev. NR, ECO 45504 v4.0.0 9-24-2015
119
EchoUser should now show up in the logins screen
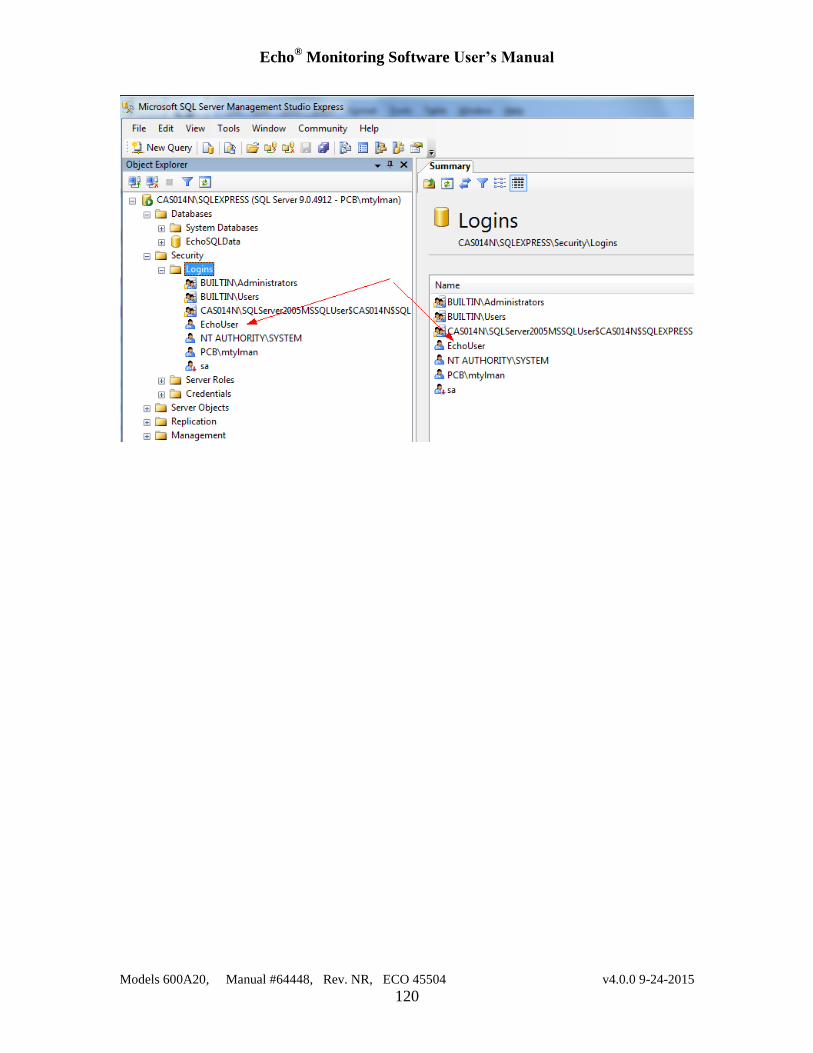
Echo® Monitoring Software User’s Manual
Models 600A20, Manual #64448, Rev. NR, ECO 45504 v4.0.0 9-24-2015
120
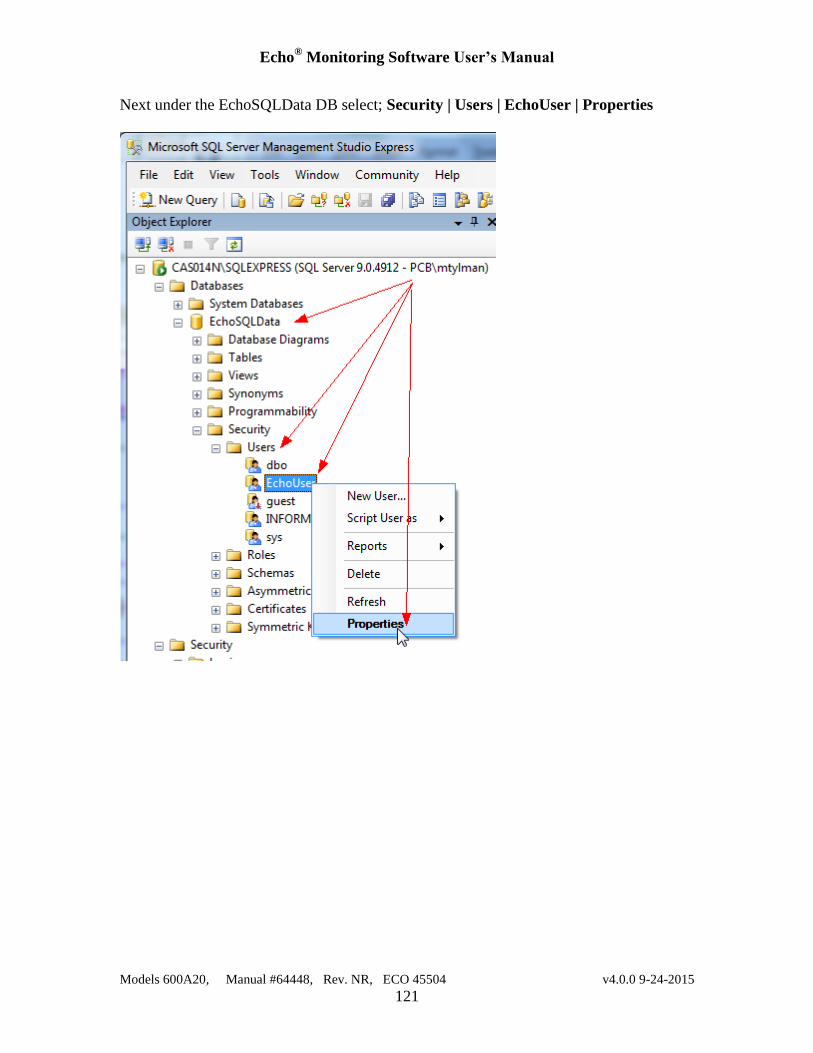
Echo® Monitoring Software User’s Manual
Models 600A20, Manual #64448, Rev. NR, ECO 45504 v4.0.0 9-24-2015
121
Next under the EchoSQLData DB select; Security | Users | EchoUser | Properties
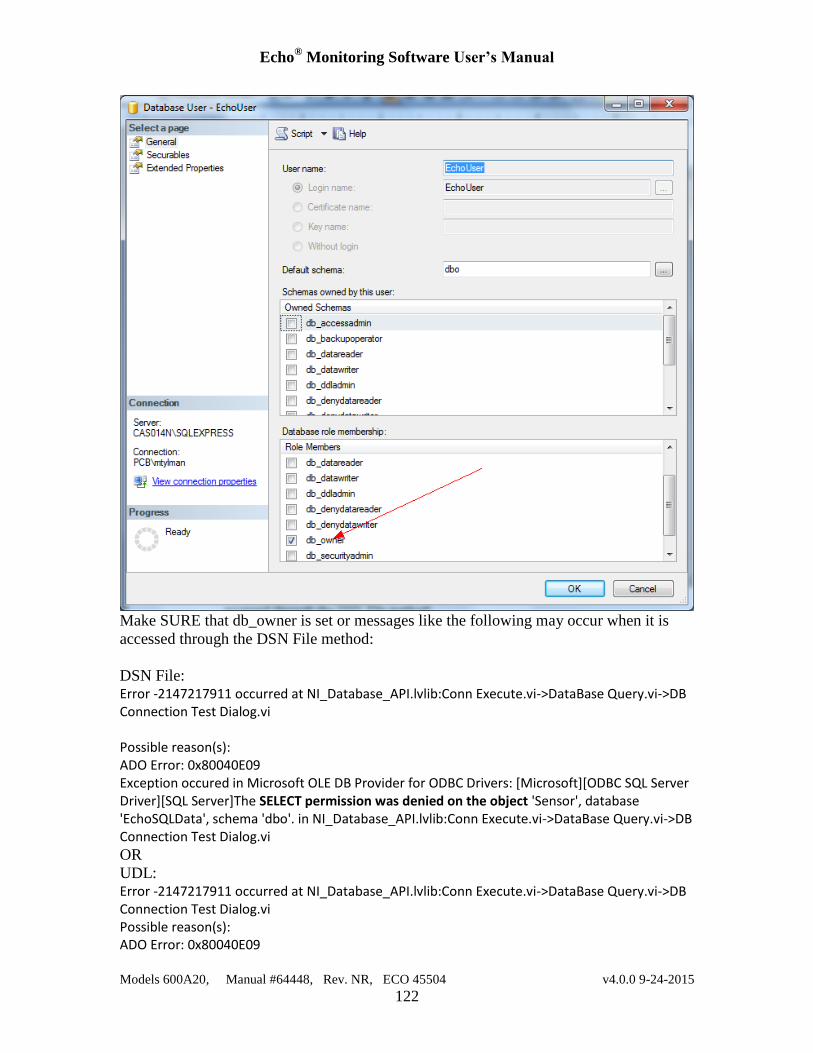
Echo® Monitoring Software User’s Manual
Models 600A20, Manual #64448, Rev. NR, ECO 45504 v4.0.0 9-24-2015
122
Make SURE that db_owner is set or messages like the following may occur when it is
accessed through the DSN File method:
DSN File: Error -2147217911 occurred at NI_Database_API.lvlib:Conn Execute.vi->DataBase Query.vi->DB Connection Test Dialog.vi Possible reason(s): ADO Error: 0x80040E09 Exception occured in Microsoft OLE DB Provider for ODBC Drivers: [Microsoft][ODBC SQL Server Driver][SQL Server]The SELECT permission was denied on the object 'Sensor', database 'EchoSQLData', schema 'dbo'. in NI_Database_API.lvlib:Conn Execute.vi->DataBase Query.vi->DB Connection Test Dialog.vi
OR
UDL: Error -2147217911 occurred at NI_Database_API.lvlib:Conn Execute.vi->DataBase Query.vi->DB Connection Test Dialog.vi Possible reason(s): ADO Error: 0x80040E09

Echo® Monitoring Software User’s Manual
Models 600A20, Manual #64448, Rev. NR, ECO 45504 v4.0.0 9-24-2015
123
Exception occured in Microsoft SQL Native Client: The SELECT permission was denied on the object 'Sensor', database 'EchoSQLData', schema 'dbo'. in NI_Database_API.lvlib:Conn Execute.vi->DataBase Query.vi->DB Connection Test Dialog.vi
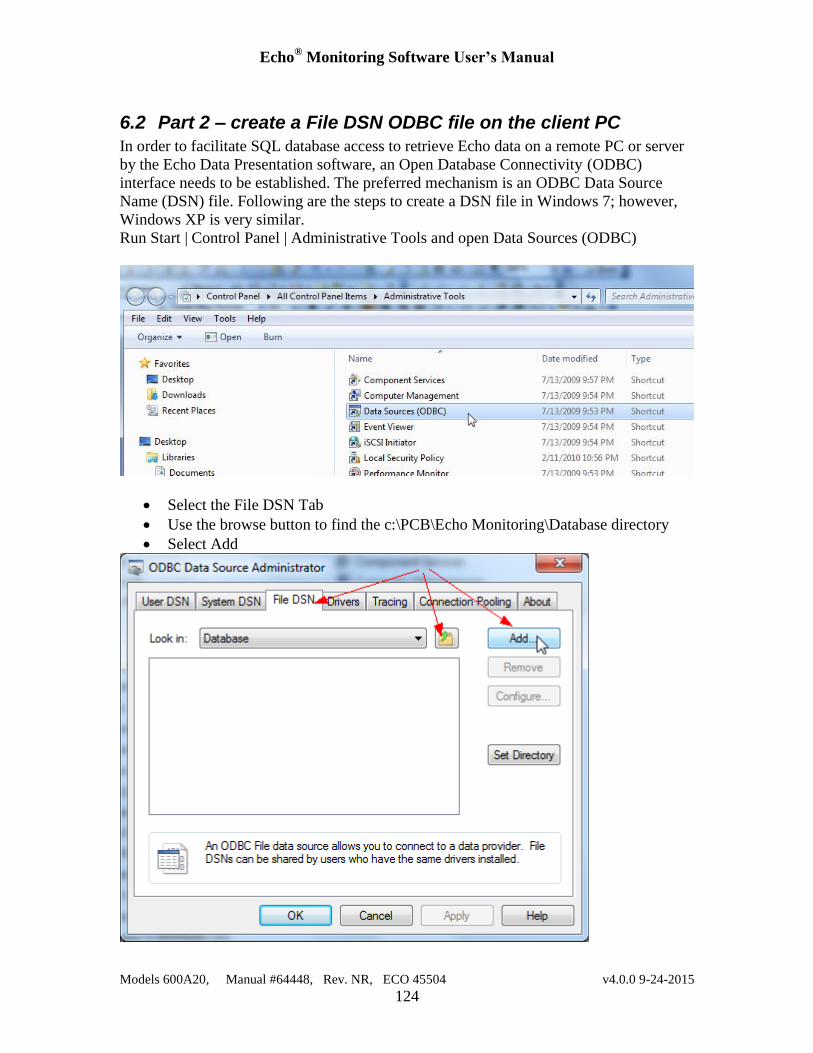
Echo® Monitoring Software User’s Manual
Models 600A20, Manual #64448, Rev. NR, ECO 45504 v4.0.0 9-24-2015
124
6.2 Part 2 – create a File DSN ODBC file on the client PC
In order to facilitate SQL database access to retrieve Echo data on a remote PC or server
by the Echo Data Presentation software, an Open Database Connectivity (ODBC)
interface needs to be established. The preferred mechanism is an ODBC Data Source
Name (DSN) file. Following are the steps to create a DSN file in Windows 7; however,
Windows XP is very similar.
Run Start | Control Panel | Administrative Tools and open Data Sources (ODBC)
Select the File DSN Tab
Use the browse button to find the c:\PCB\Echo Monitoring\Database directory
Select Add
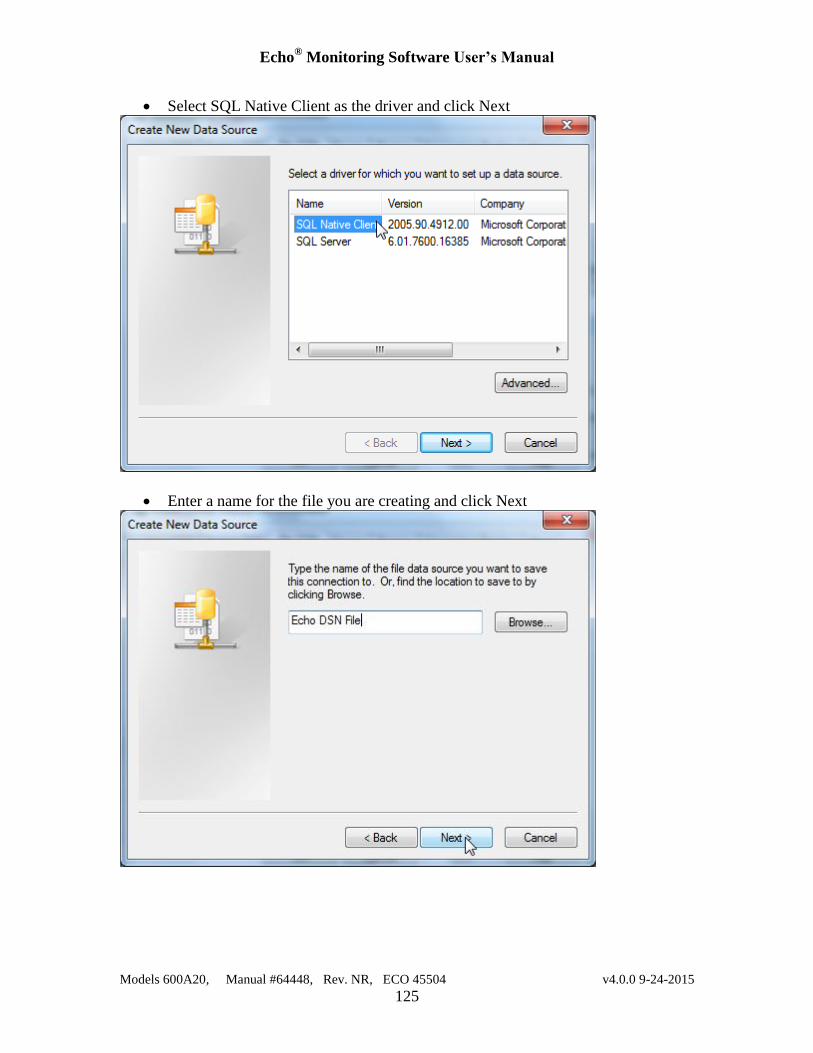
Echo® Monitoring Software User’s Manual
Models 600A20, Manual #64448, Rev. NR, ECO 45504 v4.0.0 9-24-2015
125
Select SQL Native Client as the driver and click Next
Enter a name for the file you are creating and click Next
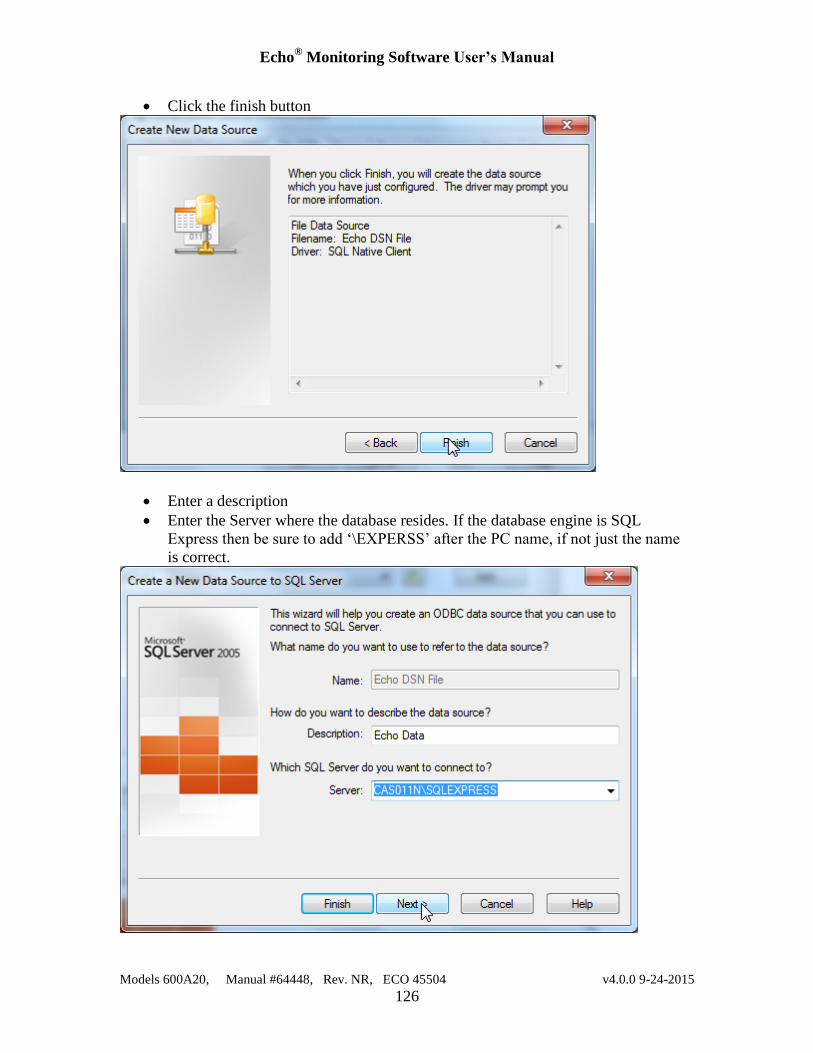
Echo® Monitoring Software User’s Manual
Models 600A20, Manual #64448, Rev. NR, ECO 45504 v4.0.0 9-24-2015
126
Click the finish button
Enter a description
Enter the Server where the database resides. If the database engine is SQL
Express then be sure to add ‘\EXPERSS’ after the PC name, if not just the name
is correct.
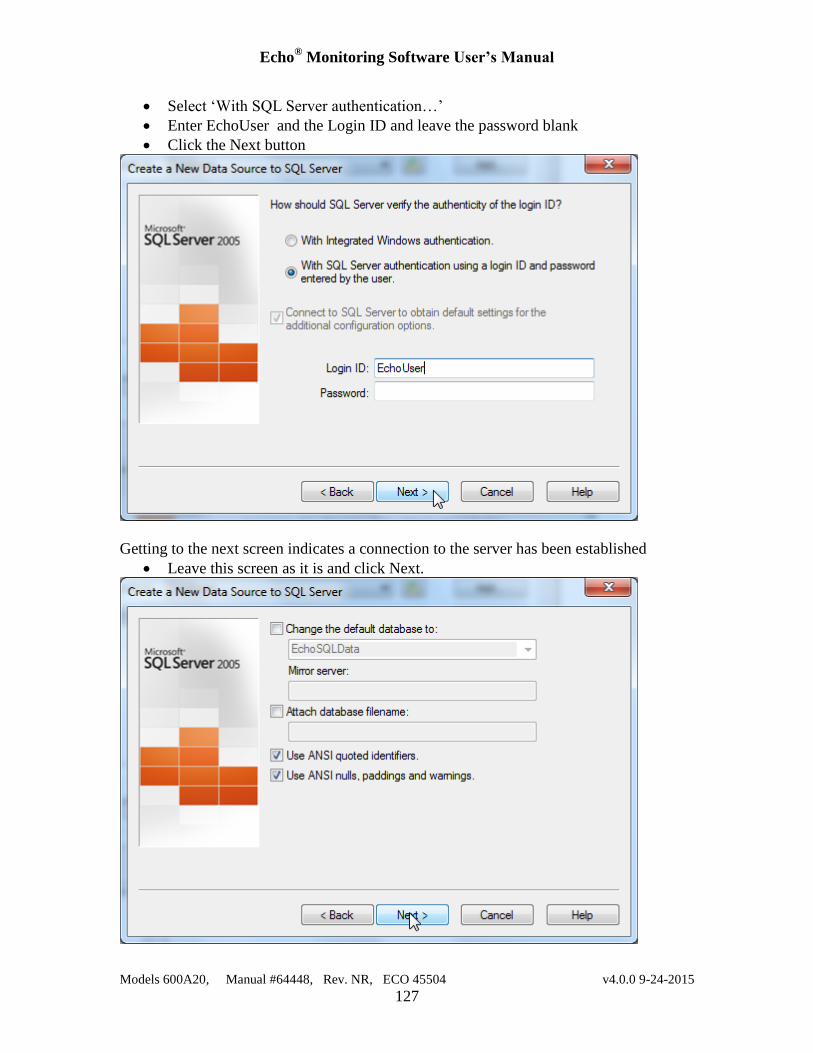
Echo® Monitoring Software User’s Manual
Models 600A20, Manual #64448, Rev. NR, ECO 45504 v4.0.0 9-24-2015
127
Select ‘With SQL Server authentication…’
Enter EchoUser and the Login ID and leave the password blank
Click the Next button
Getting to the next screen indicates a connection to the server has been established
Leave this screen as it is and click Next.
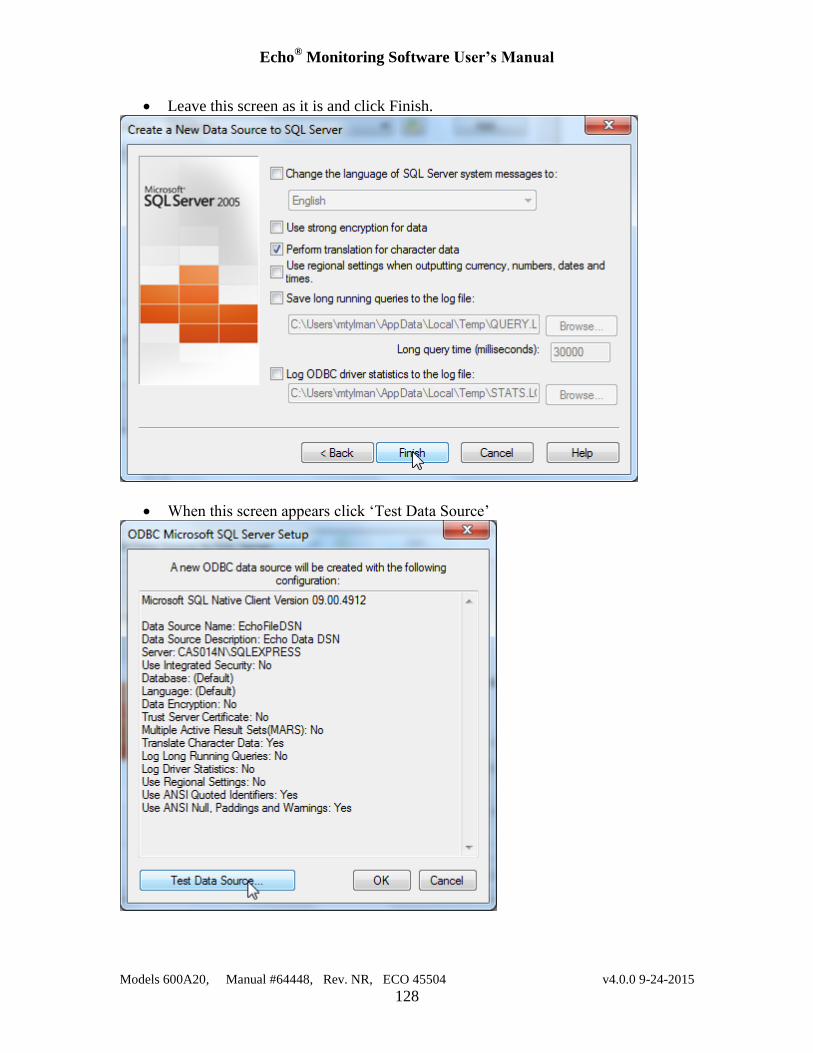
Echo® Monitoring Software User’s Manual
Models 600A20, Manual #64448, Rev. NR, ECO 45504 v4.0.0 9-24-2015
128
Leave this screen as it is and click Finish.
When this screen appears click ‘Test Data Source’
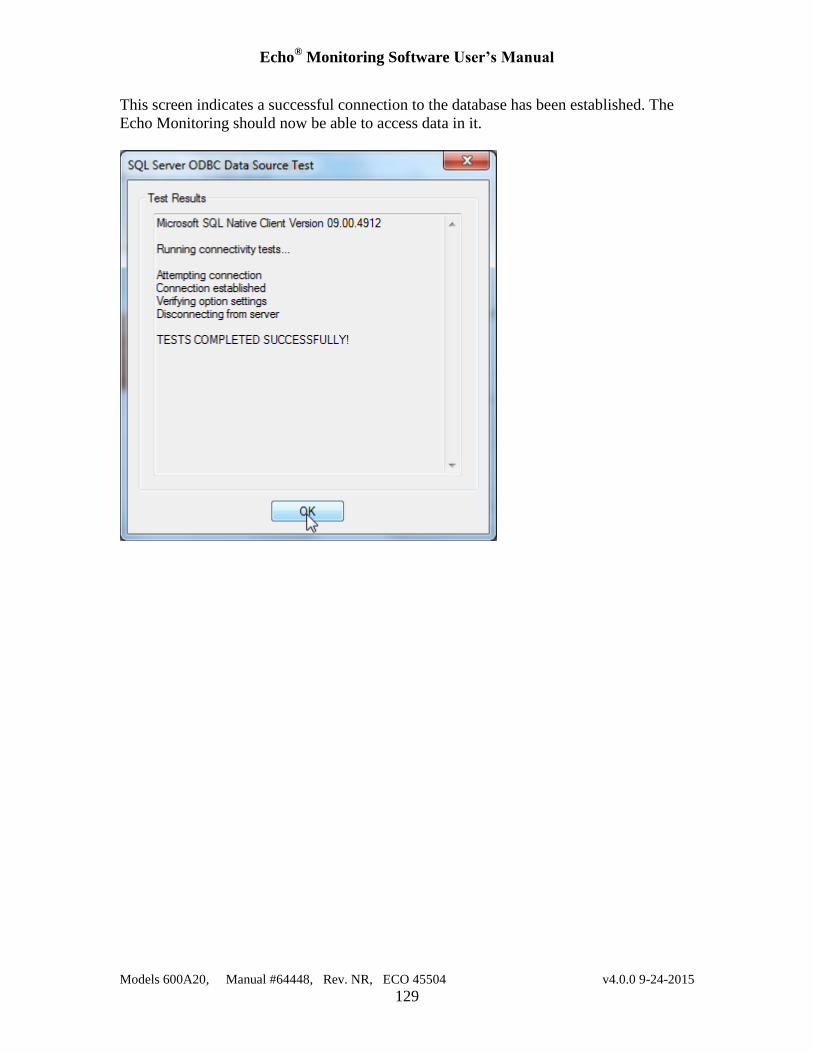
Echo® Monitoring Software User’s Manual
Models 600A20, Manual #64448, Rev. NR, ECO 45504 v4.0.0 9-24-2015
129
This screen indicates a successful connection to the database has been established. The
Echo Monitoring should now be able to access data in it.