Embed Size (px)
Citation preview

Modeling and Flow Simulation of Polytetrafluoroethylene (PTFE) Paste Extrusion.
by
PRAMOD DHANAJI PATIL
Bachelor of Engineering (Chem. Eng.), Shivaji University, 1998 Master of Applied Sciences (Chem. Eng.), Indian Institute of Science, 2002
A THESIS SUBMITTED IN PARTIAL FULFILLMENT OF THE
REQUIREMENTS FOR THE DEGREE OF
DOCTOR OF PHILOSOPHY
in
THE FACULTY OF GRADUATE STUDIES
(Chemical and Biological Engineering)
THE UNIVERSITY OF BRITISH COLUMBIA
January 2007
© Pramod Dhanaji Patil, 2007

Abstract
Constitutive rheological equations are proposed for the paste extrusion of
polytetrafluoroethylene (PTFE) that take into account the continuous change of the
microstructure during flow, essentially through fibril formation. The mechanism of
fibrillation is captured through a microscopic model for a structural parameter, , that is
the percentage of fibrillated domains in the paste. This model essentially represents a
balance of fibrillated and unfibrillated domains through a first order kinetic differential
equation. The rate of fibril formation is assumed to be a function of the strain rate and a
flow type parameter, which describes the relative strength of straining and rotation in
mixed type flows. The proposed constitutive equation consists of a shear-thinning and a
shear-thickening terms, the relative contribution of the two being a function of £,.
To improve the physics of the constitutive equation and in order to develop a truly
predictive flow model, another constitutive equation is proposed which consist of a
viscous (shear-thinning) and an elastic (strain-hardening) term. A modified Mooney-
Rivlin model is used to model the elastic behavior of the paste. The viscous and elastic
parameters are determined by using shear and extensional rheometrical data on the paste.
Finite element simulations using the proposed constitutive relations predict accurately the
variation of the extrusion pressure with the apparent shear rate and die geometrical
parameters.
An approximate analytical mathematical model for polytetrafluoroethylene (PTFE)
paste extrusion through annular dies is also developed. This model takes into account the
elastic-plastic and viscous nature of the material in its non-melt state due to the formation
of fibrils and presence of lubricant. The radial flow hypothesis (RFH) has been used to
describe the flow kinematics of PTFE paste in the conical annular section of the die. The
validity of this hypothesis is demonstrated by performing numerical simulations using the
developed shear thinning and shear thickening model. Model predictions are presented
for various cases and are found to be consistent with experimental results of macroscopic
pressure drop measurements in rod and tube extrusion.

Table of Contents
Abstract ii
Table of Contents iii
List of Tables vi
List of Figures vii
Acknowledgements xiii
Dedication xiv
1 Properties and Processing of Polytetrafluoroethylene (PTFE) Paste 1
1.1. Introduction 1 1.2. Synthesis of PTFE 2 1.3. Chemical and physical properties of PTFE 2 1.4. PTFE fine powder resin processing and application 6 1.5. Mathematical modeling of PTFE paste flow 9 1.6. Bibliography 13
2 Paste Extrusion: General Review 15
2.1. Introduction 15 2.2. Paste flow and extrusion 16
2.2.1. Paste formulation 16 2.2.2. Preforming 17 2.2.3. Phase migration and extrusion 18 2.2.4. Sintering 19 2.2.5. Mechanism of PTFE paste flow 20
2.3. Experimental observations 21 2.3.1. PTFE paste extrusion 21 2.3.2. Effect of geometrical characteristics of die on the extrusion pressure 22
2.4. Constitutive equations proposed to predict pressure drop in capillary die flow .....25 2.5. Numerical simulation studies of paste flow 30 2.6. Bibliography 32
3 Scope of Work 35
3.1. Introduction 35 3.2. Thesis objectives 35 3.3. Thesis organization 36 3.4. Bibliography 38

4 Constitutive Modeling and Flow Simulation of Polytetrafluoroethylene
(PTFE) Paste Extrusion 39
4.1. Introduction 39 4.2. Theoretical modeling and numerical method 42
4.2.1. Governing equations 42 4.2.1.1 Constitutive equation 42 4.2.1.2 Flow type parameter^ 45
4.2.2. Boundary conditions 46 4.2.2.1 Slip boundary condition 47
4.2.3. Finite element method 49 4.3. Results and discussion 52
4.3.1. Effect of die entrance angle 54 4.3.2. Effect of apparent shear rate 57 4.3.3. Effect of die reduction ratio 58 4.3.4. Effect of die length-to-diameter ratio 59 4.3.5. Structural parameter 61
4.4. Conclusions 64 4.5. Bibliography 66
5 Viscoelastic Modeling and Flow Simulation of Polytetrafluoroethylene
(PTFE) Paste Extrusion 68
5.1. Introduction 68 5.2. Theoretical modeling and numerical method 69
5.2.1. Governing equations .....69 5.2.1.1 Constitutive equation 69 5.2.1.2 Parameter Estimation 73 5.2.1.3 Structural parameter 78
5.2.2. Boundary conditions 79 5.2.3. Finite element method 79
5.2.3.1 Particle tracking 81 5.2.3.2 Incorporating computed stresses into flow solution 82
5.3. Results and discussion 84 5.3.1. Structural parameter 86 5.3.2. Effect of die entrance angle 89 5.3.3. Effect of apparent shear rate 91 5.3.4. Effect of die reduction ratio 93 5.3.5. Effect of die length-to-diameter ratio 94
5.4. Conclusions 96 5.5. Bibliography 98

6 An Analytical Flow Model for Polytetrafluoroethylene Paste Through
Annular Dies 101
6.1. Introduction 101 6.2. Validation of radial flow 103
6.2.1. Cylindrical dies 106 6.2.2. Annular die with varying diameter mandrel pin 108 6.2.3. Annular die with axisymmetric cylindrical mandrel pin 110
6.3. Mathematical Model 112 6.3.1. Annular die without die land (L/Da = 0) 112 6.3.2. Annular die with die land (L/Da?i 0) 117
6.4. Model predictions and comparison with experiments 118 6.5. Conclusions 123 6.6. Bibliography 124
7 Conclusions, Recommendations and Contribution to the Knowledge 126
7.1. Introduction 126 7.2. Conclusions 126 7.3. Contribution to knowledge 128 7.4. Recommendations for future work 129 7.5. Bibliography 130

List of Tables
Table 4.1 Physical properties of the Isopar® M lubricant used in the slip velocity measurements 48
Table 4.2 Parameters for the shear-thinning and the shear-thickening terms of Eq.(4.3) ; 55
Table 5.1 Physical properties of PTFE fine powder resin studied in this work as
provided by the supplier 73
Table 5.2 Parameters for the shear-thinning terms of Eq. (4.3) (F104 HMW) 75
Table 5.3 Material parameters for PTFE samples subjected to different Hencky strain rate 76
Table 6.1 Values of material constants and coefficient of friction needed in Eq. (6.22) to predict the extrusion pressure for paste slow in cylindrical and annular dies 119

List of Figures
Figure 1.1 Schematic diagram of a chain segment of PTFE molecule 3
Figure 1.2 Partial phase diagram of PTFE (Sperati, 1989)..., 5
Figure 1.3 Schematic diagram of (a) the preforming unit and (b) Instron capillary rheometer used for paste extrusion 7
Figure 1.4 Tube extrusion equipment of PTFE fine powder (Daikin technical bulletin) 8
Figure 1.5 A typical tube extrusion dies for the PTFE fine powder (Daikin technical bulletin) \ 9
Figure 1.6 SEM micrographs of PTFE paste at various stages of the paste extrusion process (a) before processing (nearly no fibrillation), (b) during processing (partially fibrillated sample with small ^), and (c) after processing (nearly fully fibrillated sample with larger t,) (Patil et al. 2006) 10
Figure 2.1 Typical start up of pressure transient obtained in PTFE paste extrusion [Ochoa, 2006] 22
Figure 2.2 The effect of lubricant (ISOPAR® G) concentration on the steady-state extrusion pressure for resin 3 (PTFE resin). Solid lines are model predictions [Ariawan et al., (2002)] 23
Figure 2.3 The effect of reduction ratio on the steady-state extrusion pressure for different PTFE resins. Solid lines are model predictions [Ariawan et al., (2002)] 24
Figure 2.4 The effect of die UD a ratio on the steady state extrusion pressure at different reduction ratios for resin 3 (PTFE resin). Solid lines are model predictions [Ariawan et al., (2002)] 24
Figure 2.5 The effect of die entrance angle on the steady-state extrusion pressure at different extrusion rates for resin 3 (PTFE resin). Solid lines are model predictions [Ariawan et al., (2002)]. Also dotted line shown is the prediction using Benbow-Bridgwater equation (1993) 25
Figure 4.1 A conical entry die used in the paste extrusion of PTFE: The left half illustrates the extrusion of PTFE particles and the gradual structure formation through particle fibrillation, whereas the shaded area depicts the axisymmetric domain used in the simulations 40

Figure 4.2 Flow fields corresponding to different values of flow type parameters, v|/ 45
Figure 4.3 The apparent flow curves of PTFE paste extruded through three dies having the same L/D ratio and different diameter 49
Figure 4.4 Mooney plot based on the experimental data of Figure 4.4 prepared to calculate the slip velocity. The shear stress values that correspond to individual lines at various shear stress values are also shown 50
Figure 4.5 The slip velocity, V s , as a function of the wall shear stress, <rw for a PTFE paste used in this work. A linear slip model seems adequate to capture the experimental results 50
Figure 4.6 Geometrical domain used for simulations with enlarged section of the rounded corner shown on the right side 51
Figure 4.7 Radial velocity profiles at various axial locations for conical die with entrance angle of 90° 52
Figure 4.8 Simulated surface plots of flow type parameter, vy inside the conical die with die entrance 2a = 60° 53
Figure 4.9 The effect of die entrance angle on the extrusion pressure: Comparison between experimental and simulation results 54
Figure 4.10 The effect of die entrance angle on the cross-sectional average structural parameter at the exit, £,exjt, (from simulations) and the tensile strength of dried extrudates (from experiments) 56
Figure 4.11 The effect of apparent shear rate on the extrusion pressure of PTFE paste extrusion: Comparison between experimental and simulation results 57
Figure 4.12 The effect of apparent shear rate on the cross-sectional average structural parameter at the exit, ^ e x i t , (from simulations) and the tensile strength of dried extrudates (from experiments) 58
Figure 4.13 The effect of the die reduction ratio, RR, on the extrusion pressure: comparison between experimental and simulation results 59
Figure 4.14 The effect of die reduction ratio on the average structural parameter at the exit, £,exjt, (from simulations) and the tensile strength of dried extrudates (from experiments) 60

Figure 4.15 The effect of length-to-diameter ratio (L/D) on the extrusion pressure: Comparison between experimental and simulation results 60
Figure 4.16 The effect of die L / D ratio on average structural parameter at the exit, ^ e x i l , (from simulations) and the tensile strength of dried extrudates (from experiments) 61
Figure 4.17 Axial profiles of structural parameter at various radial locations for a conical die having an entrance angle of 60° 62
Figure 4.18 Axial profiles of structural parameter along the centerline of a conical die having an entrance angle of 60° for various apparent shear rates indicated in the figure 63
Figure 4.19 Axial profiles of structural parameter along the centerline of conical dies having various entrance angles 64
Figure 5.1 Plot of viscosity vs stress obtained from controlled stress experiments for two different gap sizes 74
Figure 5.2 Corrected viscosity vs. shear rate obtained from Eq. (5.13 and 5.14) and solid line shows the curve fitting by using Carreau model 74
Figure 5.3 Uniaxial extension of F104 HMW samples stretched at different Hencky strain rates (lines show the fits of Eq. (5.12)) 76
Figure 5.4 Uniaxial extension of F104 LMW samples stretched at different Hencky strain rates, (lines show the fits of Eq. (5.12)) 77
Figure 5.5 Uniaxial extension of F301 samples stretched at different Hencky strain rates, (lines show the fits of Eq. (5.12)) 77
Figure 5.6 Uniaxial extension of F303 samples stretched at different Hencky strain rates, (lines show the fits of Eq. (5.12)) 78
Figure 5.7 Comparison between vortex intensities obtained in current work and those obtained by Olley et al. (1999), for axisymmetric flow of LDPE through a 4:1 abrupt contraction 84
Figure 5.8 Radial velocity profiles at various axial locations for conical die having an entrance angle of 90°. Thick and thin lines denote the velocity profiles from viscoelastic and STT model respectively 85

Figure 5.9 Radial velocity profiles at various axial locations inside the die land for a.conical die having an entrance angle of 90°. Thick and thin lines denote the velocity profiles from viscoelastic and STT model respectively 86
Figure 5.10 Axial profiles of structural parameter at various radial locations for a conical die having an entrance angle of 60°: thin and thick lines show the structural parameter values from STT and viscoelastic models respectively 87
Figure 5.11 Axial profiles of structural parameter along the centerline of a conical die having an entrance angle of 60° for various apparent shear rates indicated in the figure: thin and thick lines show the structural parameter values from STT and viscoelastic models respectively.... ..: 88
Figure 5.12 Axial profiles of structural parameter along the centerline of conical dies having various entrance angles: thin and thick lines show the structural parameter values from STT and viscoelastic models respectively 89
Figure 5.13 The effect of die entrance angle on the extrusion pressure: Comparison between experimental results, predictions from STT and Viscoelastic model 90
Figure 5.14 The effect of die entrance angle on the cross-sectional average structural parameter at the exit, £,exit, (from Viscoelastic and STT simulations) and the tensile strength of dried extrudates (from experiments) 92
Figure 5.15 The effect of apparent shear rate on the extrusion pressure of PTFE paste extrusion: Comparison between experimental and simulation results from viscoelastic and STT model 93
Figure 5.16 The effect of apparent shear rate on the cross-sectional average structural parameter at the exit, 2,exjt, (from viscoelastic and STT simulations) and the tensile strength of dried extrudates (from experiments) 93
Figure 5.17 The effect of the die reduction ratio, RR, on the extrusion pressure: comparison between experimental and simulation results from viscoelastic and STT model 94

Figure 5.18 The effect of die reduction ratio on the average structural parameter at the exit, ^ e x i t , (from STT and viscoelastic simulations) and the tensile strength of dried extrudates (from experiments) 95
Figure 5.19 The effect of length-to-diameter ratio (L/D) on the extrusion pressure: Comparison between experimental and simulation results from viscoelastic and STT model (Patil et al., 2006) 95
Figure 5.20 The effect of die L / D ratio on average structural parameter at the exit, <|exit, (from viscoelastic and STT simulations) and the tensile strength of dried extrudates (from experiments) 96
Figure 6.1 Schematic illustration of the "radial flow" hypothesis. The hypothesis assumes the existence of a virtual surface of radius r as measured from the die apex, on which all paste particles moving towards the apex have the same velocity: (a) cylindrical die for rod extrusion and (b) annular die with inside cylinder of varying diameter (mandrel pin) for tube extrusion, and (c) annular die with inside cylinder of constant diameter (mandrel pin) for tube extrusion 104
Figure 6.2 Velocity profiles along the spherical surfaces at radius r = 5.8 x 10 -3
m (a), 1.16 x 10~2 m (b), and 1.54 x 10 -2 m (c) for cylindrical die (0 = 0 corresponds to the centerline). In our model, there is only one radial velocity component, which is computed in a cylindrical coordinate system 105
Figure 6.3 Percentage variation of velocity normalized by the centerline velocity, from the centerline of the die to the die wall plotted with die entrance angle. The three surfaces are defined by the cylindrical radius R= 1.5xl0~3 m (a), 3xl0~3 m (b) and 4x l0" 3 m (c) 107
Figure 6.4 Velocity profiles along the spherical surfaces at radius r = 5.8 x 10~3
m (a), 1.16 x 10~2 m (b), and 1.54 x 10~2 m (c) for an annular die with inside cylinder of varying diameter (0 = 15° corresponds to the outside wall, 0 = 0 ° does not exist due to the presence of the internal mandrel pin) 109
Figure 6.5 Percentage variation of velocity from the wall of the varying diameter mandrel pin to the die wall normalized by the velocity at the wall of the varying diameter cylinder, plotted with die entrance angle at three different spherical locations (a), (b) and (c) defined in Figure 6.3 109

Figure 6.6 Velocity profiles along the spherical surfaces at radius r = 5.8 x 10 3
m (a), 1.16 x 10~2 m (b), and 1.54 x 10~2 m (c) for an annular die having a mandrel pin of constant diameter I l l
Figure 6.7 Percentage variation of velocity from the wall of the constant diameter mandrel pin to the die wall normalized by the velocity at the wall of the constant diameter cylinder, plotted with die entrance angle at three spherical locations (a), (b) and (c) defined in Figure 6.3 I l l
Figure 6.8 (a) Annular die with varying diameter mandrel pin with volume element and (b) its dimensions in the annular conical zone of a tapered die according to "radial flow" hypothesis 113
Figure 6.9 Force balance on volume element in the die capillary zone 117
Figure 6.10 The effect of apparent shear rate on the extrusion pressure of PTFE paste for a cylindrical (rod extrusion) and an annular conical die (tube extrusion). The experimental data refer to rod extrusion using an orifice die (L/D=0), having RR=352, 2 a =60° 120
Figure 6.11 The effect of die reduction ratio on the extrusion pressure of PTFE paste for a cylindrical (rod extrusion) and an annular die (tube extrusion) 121
Figure 6.12 The effect of die entrance angle (2a) on the extrusion pressure of PTFE paste for a cylindrical (rod extrusion) and an annular die (tube extrusion) 122
Figure 6.13 The effect of apparent shear rate on the extrusion pressure of PTFE (resin B) paste for an annular die (tube extrusion) 122
Acknowledgements
A number of people have helped me with this project over the last few years, and
1 would like to take this opportunity to thank them.
Firstly, I wish to express my sincere gratitude and appreciation to my supervisor
Prof. Savvas G. Hatzikiriakos for his unflagging assistance and encouragement
throughout my research. His insight and ideas have greatly contributed to the modeling
and experimental aspects of this work.
I would also like to thank my co-supervisor, Dr. James J. Feng for his
encouragement and inputs in modeling and simulation aspects of this work. I learned a lot
from the discussion I had with him and enjoyed his enthusiastic participation during the
weekly research meetings.
Thanks to Daikin Industries Ltd for financial support and the supply of the
polymer samples.
My colleagues from RHEOLAB at UBC helped in various ways. Especially, I
wish to thank Isaias Ochoa for providing me with experimental data at times and for
having insightful discussion about the modeling and experimental analysis.
On a more personal level, I would like to thank my mother and father for their
continued support, and my sisters for their continuous encouragement during last three
years. Most of all, I thank my wife Gayatri (Shobha) who has been an unending source of
strength and motivation for success, especially during the preparation of this dissertation.
Finally, I would like to thank my dear friends, Rochish and Kiran for their
mentorship during this work. I would also like to thank the Indian community at UBC,
"UTSAV" for arranging nice cultural programs along with delicious Indian food.

To my parents

CHAPTER 1
Properties and Processing of Polytetrafluoroethylene
(PTFE) Paste
1.1 Introduction
Polytetrafluoroethylene (PTFE) is a material of great commercial value. Since its
discovery by Dr. Roy Plunkett in 1938 (Plunkett, 1941), it has "revolutionized the plastic
industry and led to various application not otherwise possible" (Plunkett, 1987).
Polytetrafluoroethylene (PTFE) was synthesized the first time by an accident, but once its
physical and chemical properties were disclosed the wide gamut of applications was
envisioned. These outstanding properties include a high melting point, exceedingly high
molecular weight and melt viscosity, and high chemical resistance due to its limited
solubility. The development of innovative fabrication processes resembling those used
with metal powders was a crucial step in the emergence of PTFE products. Processes
currently in use include coating from aqueous dispersions, compression molding and ram
extrusion of granular powders and paste extrusion of lubricated fine powder (Mazur,
1995).
It is the last process of paste extrusion that is being studied in this work. During
the process of extrusion, PTFE paste starts as a two phase system (lubricant and solid
PTFE fine particles) and ends essentially as a solid. Structural changes are taking place
during flow and thus rheological changes are significant. Therefore, in order to
understand the process of paste extrusion, the rheological changes that occur during
extrusion should be first understood. In particular, the following questions should be
considered; the relationship between the microstructure of the PTFE paste and the
rheological changes that take place during extrusion; the relationship between the
microstructure formation (fibrillation) and the final mechanical properties of the
extrudate; the influence of the lubricant concentration on the rheological properties; the
influence of the physical properties of the lubricant on various stages of the process; the
effects of the geometric characteristics of the extrusion die used on the overall process as

well as on the mechanical properties of the final extrudates. These questions consist also
the scope of the present work and they are discussed in more detail in chapter 3.
This chapter presents a general overview of the main object of this work, namely
polytetrafluoroethylene (PTFE). The chemistry of PTFE and its various physical
properties are discussed. An overview of the various applications of PTFE is also
presented. Emphasis is placed on the mathematical modeling of industrial processes of
PTFE and in particular on the paste extrusion process.
1.2 Synthesis of PTFE
Two different methods of polymerization are common for production of different
types of PTFE. Both of them are carried out in an aqueous medium involving an initiator,
a surfactant, other additives and agitation brought to high temperature and pressure. The
main differences are the amount of surfactant added to the polymerization reactor and the
shear rate applied during the reaction. The first procedure is known as suspension
polymerization. This is the route to produce granular resins which are processed as
molding powder. The second technique of polymerization is called emulsion or
dispersion polymerization. By this way dispersion and fine powder PTFE products are
manufactured. The details about these polymerization techniques can be found elsewhere
(Ebnesajjad, 2000; Gangal, 1994). Although the two procedures result in the same high
molecular weight PTFE polymer, the products are distinctly different. The granular
product can be molded in various forms. However, the resin obtained from aqueous
dispersion polymerization cannot be molded, but has to be fabricated by dispersion
coating, in the case of the concentrated dispersion, or by paste extrusion in the case of
fine powder resin (Blanchet, 1997; Ebnesajjad, 2000).
1.3 Chemical and physical properties of PTFE
Fluoropolymer or perfluoropolymer are the names given to designate those
polymers whose molecules are mainly consisting of carbon (C) and fluorine (F) atoms.
Those names let us distinguish them from other polymers that are just partially
fluorinated. An example of a linear fluoropolymer is polytetrafluoroethylene (PTFE).
PTFE, with chemical formula [(-CF2-CF2-)N], can be compared with polyethylene [(-CH2-

CH2-)n] where all the hydrogen atoms have been substituted by fluorine atoms. Of course,
polyethylene and PTFE are prepared in totally different ways.
The basic properties of fluoropolymers arise from the atomic structure of fluorine
and carbon and their covalent bonding in specific chemical structures. Figure 1.1 depicts
the straight chain molecular configuration of PTFE. The fluorine atoms, in cyan color, are
placed helically around the carbon backbone (in grey color) providing a protective shield
from virtually any chemical attack thus imparting chemical inertness and stability to the
molecule (Gangal, 1994; Ebnesajjad, 2000). The helical conformation of the fluorine
atoms assures that the hysteric repulsion is minimized. The two types of covalent bonds
present in the PTFE molecule, C-F and C-C, are extremely strong (Cottrell, 1958;
Sheppard and Sharts, 1969) causing PTFE to have excellent mechanical strength and
resistance to heat.
The fluorine shield is also responsible for the low surface energy (18 dynes/cm)
causing PTFE to have a low coefficient of friction on steel (0.05-0.8 static) and non-stick
properties (Gangal, 1994). PTFE, with its thermal and chemical stability, makes an
excellent electrical insulator.
Figure 1.1: Schematic diagram of a chain segment of PTFE molecule.
The slippery PTFE can not be dissolved in any solvent, acid, or base and upon
melting forms a stiff clear gel without flow. Consequently, its molecular weight cannot

be determined by conventional techniques. In practice, the number average molecular
weight (Mn) is usually estimated from the standard specific gravity (SSG) of the polymer.
Higher SSG implies greater crystallinity and hence, lower molecular weight (Gangal,
1994; DuPont, 2001; Suwa, 1973). Due to the linearity of PTFE molecules, the
crystallinity of a virgin PTFE resin may be as high as 92-98% (Gangal, 1989). As a
result, the SSG of PTFE is high for a polymer, typically ranging from 2.1 to 2.3.
Following the standard procedure for measuring SSG (ASTM D4895), the number
average molecular weight can be determined from
Equation 1.1 is applied to 100% homopolymer resins with SSG >2.18 (DuPont technical
information, 2001). The calculated molecular weights for PTFE with SSG <2.18 are
quite large (probably unrealistic), due to the asymptotic behavior of Equation 1.1 in this
range.
The number average molecular weight of a 100% homopolymer has also been
correlated to the second heat of recrystallization (AH C). The second heat of
recrystallization is obtained by melting and crystallizing a sample of PTFE twice by
Differential Scanning Calorimetry (DSC) (DuPont technical information, 2001). It was
found that
M n = 2.1 x 10'°(A//C)~516 [1.2]
where AH C is in cal/g. The applicable cooling rate is 4-32°C/min, over which the heat of
second crystallization remained constant for a given polymer. Typically, Mn is in the 106
to 107 range (Gangal, 1994). Comparison of PTFE molecular weight, regardless of
whether or not the resins contain other comonomers, can be made by considering the
resin melt creep viscosity instead. The melt creep viscosity, as detailed in US Patent
3,819,594 (Holmes et al., 1974), is higher for a higher molecular weight PTFE resin
(DuPont, 2001).
The melting point of virgin PTFE (first melting temperature) is 342°C (Sperati,
1989), which is high for a thermoplastic polymer. The second melting temperature is
327°C (Ebnesajjad, 2000), which is the value often reported in the literature. It means that
a previous melted PTFE does not recover the original crystallinity back making the resin
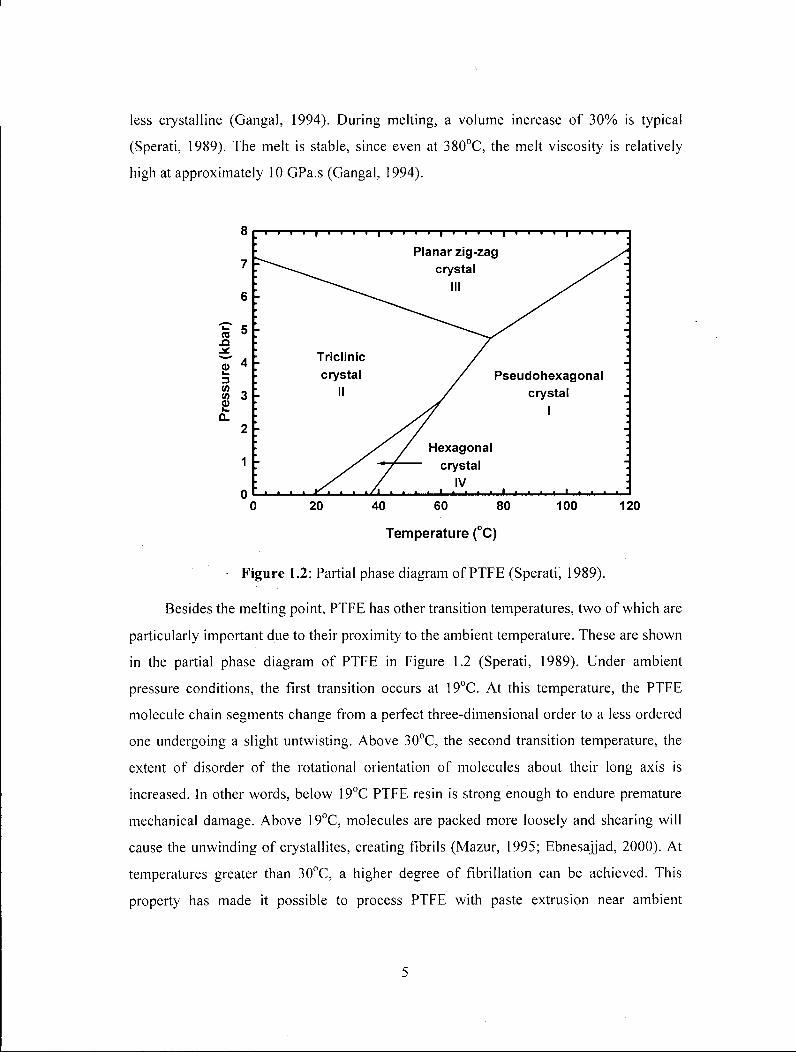
less crystalline (Gangal, 1994). During melting, a volume increase of 30% is typical
(Sperati, 1989). The melt is stable, since even at 380°C, the melt viscosity is relatively
high at approximately 10 GPa.s (Gangal, 1994).
8
7
6
-Q
• 4 L_ 3 if) _ w 3 E a.
2
1
0 0 20 40 60 80 100 120
Temperature (°C)
- Figure 1.2: Partial phase diagram of PTFE (Sperati, 1989).
Besides the melting point, PTFE has other transition temperatures, two of which are
particularly important due to their proximity to the ambient temperature. These are shown
in the partial phase diagram of PTFE in Figure 1.2 (Sperati, 1989). Under ambient
pressure conditions, the first transition occurs at 19°C. At this temperature, the PTFE
molecule chain segments change from a perfect three-dimensional order to a less ordered
one undergoing a slight untwisting. Above 30°C, the second transition temperature, the
extent of disorder of the rotational orientation of molecules about their long axis is
increased. In other words, below 19°C PTFE resin is strong enough to endure premature
mechanical damage. Above 19°C, molecules are packed more loosely and shearing will
cause the unwinding of crystallites, creating fibrils (Mazur, 1995; Ebnesajjad, 2000). At
temperatures greater than 30°C, a higher degree of fibrillation can be achieved. This
property has made it possible to process PTFE with paste extrusion near ambient

temperature, producing a mechanically strong extrudate as these fibrils are formed and
oriented in the flow direction (Ebnesajjad, 2000).
1.4 PTFE fine powder resin processing and applications
The process of PTFE paste extrusion is generally carried out in four steps: paste
preparation, preforming, paste extrusion and sintering (Daikin technical bulletin). Paste is
essentially a suspension of solid particles in a liquid phase. In PTFE paste preparation,
fine powder resin of individual particle diameters of approximately 0.2 |um is first mixed
with a lubricating liquid (lube) in a desired mass proportion at a temperature lower than
19°C to form a paste. A typical lube concentration varies from 16 to 25 wt. % (DuPont,
1994). Lubricant includes those from the ISOPAR® series. Mixing is carried out below
the PTFE transition temperature to ensure that the resin is not damaged prior to extrusion.
The mixing container is then placed in a horizontal roll mixer that rotates at 15 rpm for
approximately 1-2 hours. The resulting mixture (paste) is aged at room temperature for
24 hours before extrusion experiments in order to allow uniform wetting of the resin
particles by the lubricant.
Preforming is normally done before extrusion using a capillary rheometer with a
blank die as shown in Figure 1.3(a). The purpose of preforming is to remove air from the
material and compact the resin to achieve the maximum amount of material for extrusion.
The paste inside the preforming unit is compressed by means of a piston at a pressure of
2 MPa over a period of 30 s to produce a cylindrical preformed billet that is free of air
voids (Ariawan et al., 2001; Ochoa, 2006). It has been shown that the preforming
pressure and duration significantly affect the quality of preform as it influences liquid
migration and density. The effect of physical properties of lubricant such as viscosity and
surface tension on processing behavior of the PTFE paste has been studied by Ochoa
(2006). The improvement in preforming quality was found with an increase in lubricant
viscosity and with improvement in the wettability characteristics of the lubricant with
PTFE (Ochoa and Hatzikiriakos, 2004; Ochoa, 2006). It was also found that a lubricant
with higher viscosity produces a more uniform preform as liquid migration is minimal. In
addition lubricant with increasing wettability (low surface tension) with PTFE produces
better mixture/pastes.

Sintered PTFE
Capillary Rheometer Load Cell
Preforming Unit (Aluminum Pipe)
Capillary Rheometer Test Frame
Steel Plug
Electrical Heaters
Die entrance (contraction) zone
Die capillary zone
Tapered Capillary Die
(a) (b)
Figure 1.3: Schematic diagram of (a) the preforming unit and (b) Instron capillary rheometer used for paste extrusion.
The next step involves the extrusion of the preform using a ram extruder at a
temperature slightly higher than 30°C (Ebnesajjad, 2000) as shown in Figure 1.3(b).
During this step PTFE paste is extruded to obtain its final shape. The physical properties
of lubricant were found to play a significant role in the extrusion of PTFE pastes (Ochoa
and Hatzikiriakos, 2005; Ochoa, 2006). Increasing the wettability of lubricant with PTFE
and decreasing the lubricant viscosity causes a reduction in the extrusion pressure and an
increase in the tensile strength of the extrudates. Raman spectroscopy has been used on
the extrudate to describe quantitatively the degree of fibril orientation in the extrudates
(Ariawan, 2002; Ariawan et al., 2002b). The effects of extrusion conditions such as
extrusion temperature and speed, on the steady-state extrusion pressure have been
reported by Ariawan et al., (2002a). The effect of die design have been studied through
the dependence of extrusion pressure on die reduction ratio, die entrance angle and die
L/Da ratio (Ariawan, 2002; Ariawan et al., 2002a; Ochoa, 2006).

The last step is the evaporation of the lube by passing the extrudate through an
oven. This is followed by sintering at temperature above the melting point of PTFE, for
processes such as wire coating and tube fabrication. To analyze the mechanical properties
of the extrudate, dried extrudates are tested for their tensile strength according to ASTM
D1710-96. The thermal properties of the extrudate are determined using a DSC according
to ASTM D3418-82.
Typical extrusion processes include tube extrusion, wire coating and calendaring.
For tube extrusion, the basic equipment is illustrated in Figure 1.4. The extruder consists
of a cylinder, a ram, a driving mechanism (hydraulic or screw type), a die and a mandrel.
The cylinders generally used in extruders range from 50-200 mm in diameter, and from
500-1800 mm in length. A typical schematic of a tube extrudate die appears in Figure 1.5.
Figure 1.4: Tube extrusion equipment of PTFE fine powder (Daikin technical bulletin).

Tube extrusion die
"Die: T«np. (50-60*0) (122*-140sF) eater (50-60*0 (122-140»F)
R,R.= Dc- Cylindar Inside diameter Dm: MarwJral outside ciiatneter cto: Di® orifice inside dbamotof dp: Cora pin outs ids dumeter
do - dp'
Figure 1.5: A typical tube extrusion die for the PTFE fine powder (Daikin technical bulletin).
1.5 Mathematical modeling of PTFE paste flow
The paste is a mixture of solid particles and liquid lubricant and the deformation
of a paste can be accompanied by motion of the liquid component of the paste relative to
the solid (Sherwood, 2002). In addition, creation of fibrils between PTFE particles during
PTFE paste flow makes the flow mechanism different from that of the pastes of other
materials. During the extrusion process, compacted resin particles entering the die conical
zone are highly compressed due to reduction in the flow cross-sectional area. As the
particles are squeezed against each other under the application of pressure, PTFE
crystallites across the interface in neighbouring particles begin to mechanically interlock.
This results into the interconnection of adjacent particles through the formation of fibrils.
Scanning Electron Microscope (SEM) analysis has shown that fibrils are created
in the conical zone of the die where flow is extensional (Mazur, 1995; Ariawan, 2002;
Ariawan et al., 2002b). Simple shearing action of loosely compacted paste at a relatively
low pressure does not result in a practically useful extent of fibrillation. Figure 1.6 shows
typical SEM micrographs of the paste before, during and after the extrusion. Figure 1.6a
shows the absence of fibrils in the unprocessed paste, where PTFE particles essentially
retain their spherical identity. Figure 1.6b shows the existence of fibrils as the paste flows

downstream in the conical die zone. At the exit of the die and depending on its
geometrical characteristics, the paste might become nearly fully fibrillated (Figure 1,6c).
It is these submicron-diameter fibrils between polymer particles that essentially give the
dimensional stability and strength to the final extruded product.
(c) ^ , < ^ < 1
Figure 1.6: SEM micrographs of PTFE paste at various stages of the paste extrusion process (a) before processing (nearly no fibrillation), (b) during processing (partially
fibrillated sample with small E, ), and (c) after processing (nearly fully fibrillated sample with larger £,) (Patil et al. 2006a).
Mathematically, the flow of PTFE paste is treated by using the "radial flow
hypothesis" (Snelling and Lontz, 1960; Ariawan, 2002) which states that paste particles

at the same radial distance from the apex of the die conical zone move towards the die
apex at the same velocity. However, this approach is only empirical arising from
experimental evidence. The 1-D model proposed by Ariawan et al., (2002b), assuming
paste as an elasto-viscoplastic material through contribution from strain hardening and
viscous resistance, was able to predict the steady state extrusion pressure reasonably well.
However, this model assumes a velocity profile which makes it only empirical in nature.
In addition, fibril formation is not taken into account i.e. structure formation
(Ariawan, 2002; Ariawan et al., 2002b; Benbow and Bridgwater, 1993; Horrobin and
Nedderman, 1998). Fibril formation during PTFE paste flow has to be considered as an
important parameter in modeling the paste flow dynamics, and it is the main focus of the
present study. Furthermore, experiments have shown that the degree of fibrillation
depends on the operating parameters as well as design characteristics of the die (Ariawan,
2002; Ariawan et al., 2002a; Ariawan et al., 2002b; Ochoa and Hatzikiriakos, 2004).
Numerous works have been done in modeling paste flow in general using various
approaches. For example, Kolenda et al., (2003) have solved the solid and liquid
conservation equation separately for flow of ceramic paste using a Lagrangian frame of
reference. Burbidge and Bridgwater (1995) have also modeled the flow of ceramic paste
based on the "radial flow hypothesis" in paste flow dynamics but their model always
overpredicted the measured stress magnitude. Therefore, a more complete model is
required to predict the extrusion of PTFE paste. A rational approach seems to be; first to
formulate an approximate rheological constitutive equation that takes into account the
structure formation in paste flow through fibrillation; then to use this equation to simulate
the paste extrusion process; and finally compare the calculated with the experimental
extrusion pressure as a function of operating and die geometrical characteristics.
In this work, new constitutive equations are formulated for PTFE paste flow. The
rate-induced microstructural changes during PTFE paste processing, essentially consist of
change of paste from a liquidlike to a solidlike state. This is incorporated in the
constitutive model by introducing the concept of structural parameter, , that represents
the mass fraction of the paste which is fibrillated. A kinetic model for the structural
parameter, , is proposed to describe the evolution of with flow. Steady shear and
extensional rheological experiments are performed on PTFE paste in order to determine
the parameters of the rheological model. Finite element flow simulations are performed
and the results are compared with experimental results in order to check the validity and
usefulness of the proposed rheological constitutive equation. In addition, flow
simulations are used to predict the extrusion pressure as a function of the operating and
die geometrical characterictics and to explore the relationship between the tensile
strength of the extrudate and the degree of fibrillation. To model the process of tube
extrusion, an approximate analytical model is also proposed and validated through
comparison with experiemental results.

1.6 Bibliography
Ariawan, A. B., S. Ebnesajjad and S.G. Hatzikiriakos, Preforming Behavior of PTFE Pastes, Powder Technology 121, 249-258 (2001).
Ariawan, A. B., Ebnesajjad, S. and Hatzikiriakos, S. G. Paste extrusion of polytetrafluoroethylene (PTFE) fine powder resins. Can. Chem. Eng. J., 80, 1153-1165 (2002a).
Ariawan, A.B., Ebnesajjad, S. and Hatzikiriakos, S. G. Properties of polytetrafluoroethylen (PTFE) paste extrudate. Polym. Eng. Sci., 42, 1247-1253 (2002b).
Ariawan, A. B. Paste Extrusion of Polytetrafluoroethylene Fine Powder resins, The University of British Columbia. Dept. of Chemical and Biological Engineering. Thesis Ph. D., 2002.
Benbow, J. J., and J. Bridgwater, Paste Flow and Extrusion, Oxford University Press, Oxford, 1993.
Blanchet, T.A., Polytetrafluoroethylene, Handbook of Thermoplastics, Marcel Dekker, NY, 1997.
Burbidge, A. S., J. Bridgwater, and Z. Saracevic, Liquid Migration in Paste Extrusion, Chem. Eng. Res. Design, 73, 810-816 (1995).
Cottrell, T. L., The strength of chemical bonds, 2 n d ed., Butterworths, Washington, D. C., 1958.
Daikin Industries Ltd., Daikin PTFE fine powder, Technical Bulletin, 2003.
DuPont Fluoroproducts, Teflon® PTFE Fluoropolymer Resin - Processing Guide for Fine Powder Resins, Technical Bulletin, Wilmington, Delaware, 1994.
DuPont Fluoroproducts, Molecular weight of PTFE, Technical Bulletin, Wilmington, Delaware, 2001.
Ebnesajjad Sina, Fluoroplastics, Vol 1 Non-Melt Processible Fluoroplastics, Plastic Design Library. William Andrew Corp, NY, 2000.
Gangal, S. V., Polytetrafluoroethylene, Homopolymers of Tetrafluoroethylene, in Encyclopedia of Polymer Science and Engineering, 2 n d ed., John Wiley & Sons, New York, 1989, 577-600.
Gangal, S. V., Polytetrafluoroethylene, in Encyclopedia of Chemical Technology, 4 t h ed., John Wiley & Sons, New York, 621-644,1994.

Holmes, D. A., Fasig, E. W., Plunkett, R. J., US Patent 3,819,594, assigned to DuPont de Nemours and Company, June 1974.
Horrobin, D. J., and R. M. Nedderman, Die Entry Pressure Drops in Paste Extrusion, Chem. Eng. Sci., 53, 3215-3225 (1998).
Kolenda, F., Retana, P., Racineux, G. and Poitou, A., Identification of rheological parameters by the squeezing test, Powder Technology, 130, 56-62 (2003).
Mazur, S., Paste Extrusion of Poly(tetrafluoroehtylene) Fine Powders in Polymer Powder technology,441-481, Narks, M., Rosenzweig, N., Ed. John Wiley & Sons, 1995.
Patil, P. D., J. J. Feng, and S. G. Hatzikiriakos, Constitutive modeling and flow simulation of polytetrafluoroethylene (PTFE) paste extrusion, J. Non-Newt. Fluid Mech. 139, 44-53 (2006a).
Ochoa, I., Hatzikiriakos, S. G. Polytetrafluoroethylene {PTFE) paste performing: Viscosity and surface tension effects. Powder Technology, 146(1-2), 73-83 (2004).
Ochoa, I., Hatzikiriakos, S. G. Paste extrusion of polytetrafluoroethylene (PTFE): Surface tension and viscosity effects, Powder Technology (2005), 153(2), 108-118.
Ochoa, I., Paste Extrusion of Polytetrafluoroethylene Fine Powder resins: The effect of the processing aid physical properties, Ph.D., The University of British Columbia. Dept. of Chemical and Biological Engineering. Thesis Ph. D., 2006.
Sheppard, W.A., Sharts, C. M., Organic Fluorine Chemistry, W. A. Benjamin, Inc., New York, 1969.
Sherwood, J. D., Liquid-solid relative motion during squeeze flow of pastes, J. Non-Newt. Fluid Mech., 104, 1-32 (2002).
Snelling, G. R., and J. F. Lontz, Mechanism of Lubricant-Extrusion of Teflon® TFE-Tetrafluoroethylene Resins, J. Appl. Polym. Sci. Ill, 257-265 (1960).
Sperati, C. A., Physical Constants of Fluoropolymers, Polymer Handbook, John Wiley and Sons, NY, 1989.
Suwa, T., M. Takehisa and S. Machi, Melting and Crystallization Behavior of Poly(tetrafluoroethylene): New Method for Molecular Weight Measurement of Poly(tetrafluoroethylene) using a Differential Scanning Calorimetry, J of Appl. Polymer Sci., 17, 3253-3257 (1973).

CHAPTER 2
Paste Extrusion: General Review
2.1 Introduction
Paste extrusion is a widely used process in different industries such as chemical,
food and pharmaceutical. Less common products but not less important includes ceramic
components, catalyst supports, bricks, and many others. The increasing demand of these
products has attracted the attention of researchers around the world and increased the
interest to study the paste extrusion process. Many complicated structures, such as thin-
walled honeycomb catalytic supports, rely on the uniformity of the extrudate to provide
certain "high performance" properties.
Ram extrusion has made possible the characterization of the rheological
properties of pastes when other techniques cannot be used. Among the most important
factors to be considered in ram extrusion of pastes are paste formulations, paste
densification, extrusion rate and die geometry. All these factors together will allow a
complete understanding of paste extrusion for the designing of the optimum processing
conditions for a given extruded product.
So far, most of the work on paste extrusion has been done with alumina pastes
due to its importance in the catalyst and electronics industry. However, PTFE prepared
by emulsion polymerization finds paste extrusion as a good alternative for product
manufacturing. Thanks to paste extrusion it is possible to process thin hoses, thick tubes
(liners), wire insulation and unsintered tapes of PTFE. PTFE paste extrusion is still under
study and several topics need further development.
In this chapter, literature related to the subject of PTFE rheology and its relation
to the process of paste extrusion is reviewed. Discussion is subdivided into paste flow
and extrusion and into modelling of paste flow. In addition, some definitions used in
other chapters are introduced. The principles of operation of the equipment used to study
the rheology of PTFE paste extrudates are also included.

2.2 Paste flow and extrusion
2.2.1 Paste formulation
In simple terms, paste is a suspension of solid particles in liquid phase, the
relative amounts being such that the resulting material can be moulded readily (Benbow
and Bridgwater, 1993). However, this definition is not definitive and other definitions are
made depending on the perceived mechanical response (Khan, 2001). For example,
sometimes is indicated that the composition of the paste is that to render a material soft
and plastic, but the object so formed should be able to retain its shape to allow any further
processing.
PTFE fine powder resins are extremely sensitive to pressure and shear, so much
so that they are shipped in specially constructed drums, which are designed to minimize
compaction and shearing. Shearing would cause a phenomenon called fibrillation that
may lead to the formation of lumps, which cannot be broken up easily in order to produce
a uniform paste [DuPont, Processing Guide for Fine Powder Resins (1994); Daikin
Industries Fluoroplastic, Product Information Guide for TFE Fine Powder resins (1997)].
As already discussed fine powder PTFE is processed by paste extrusion. PTFE
resin is combined with a minimal quantity of lubricant (an inert liquid hydrocarbon) and
then extruded at a modest temperature (typically 30-35°C) into preforms of various
shapes and dimensions with substantial mechanical integrity (Mazur, 1995). The liquid
phase serves the purpose of lubrication between the solid particles and also prevents solid
particles from mechanical damage. The lubricant also plays the role of filling the voids
between particles. This way the paste becomes resistant to compressive load, without
increasing inter-particle contact area. Also, the adhesive forces between particles are
reduced since the interfacial tension of polymer-lubricant is much less than that of
polymer-air. This allows particles to rearrange more easily in response to mechanical
force without deformation. Due to this, the particles will also remain isotropic in nature
after compression, which is not the case for dry powder.
The amount of the lubricant and its properties critically affect the extrusion
process and, hence, the quality of the final product. The concentration of the processing
aid in the mixture depends on the type of the product, equipment design and the desired

extrusion pressure. Its content should be as low as possible but not so low that the
extrusion pressure would be excessively high. The range of lubricant content was found
to be between 15 and 25% of the total weight of the compound and corresponds typically
to volume fraction between 0.34 and 0.45 (Mazur, 1995; Ebnesajjad 2000). As the
amount of liquid added to the powder increases above a critical value, the pressure
required to extrude the mixture falls dramatically (Benbow et al., 1998; Ariawan, 2002).
For a typical commercial fine powder, a 2% increase in lubricant causes a 40% decrease
in extrusion pressure (Daikin technical bulletin). As more liquid is added, the material
soon becomes too soft to retain its shape. On the other hand, if an inadequate amount of
lubricant is used, the extrudate tends to be rough and irregular (Mazur, 1995).
Regarding the properties of the processing aid, any difference in density and/or
viscosity implies different rheological properties. The viscosity of the lubricant has a
great effect on the quality of the paste. For example, the use of a more viscous liquid as a
lubricant results in a less uniform mixture (Ochoa and Hatzikiriakos, 2004).
Consequently the paste would not extrude into a continuous body, but many microcracks
would be developed during the drying process after extrusion (Ebnesajjad, 2000). In
addition, the extrusion pressure will exhibit higher values when a processing aid with
high viscosity is used (Benbow, 1998; Ochoa and Hatzikiriakos, 2005). Ideally, the
lubricant should have a lower surface tension than the critical surface tension of PTFE.
That increases the wettability of the lubricant with the resin particles (Ebnesajjad, 2000;
Ochoa and Hatzikiriakos, 2005). The extrusion aid must be easily removable from the
extrudate without leaving a residue, which could alter the colour of the final product.
Other requirements of lubricants include high purity, low odour, low polar components,
high auto-ignition temperature, and low skin irritation.
2.2.2 Preforming
Another aspect related to paste extrusion is preforming. During this step, the paste
is placed in a cylindrical billet and by means of a piston the pressure is gradually
increased to remove the air from the voids that will render a final product mechanically
weak. In this way a cylindrical rod that is fed into the extruder's barrel is formed. In
PTFE paste processing, the preforming stage is carried out at room temperature although

it is not temperature sensitive (Mazur, 1995). However, the application of stress
introduces another problem since it may cause the liquid component of a paste to move
through the solid matrix in the radial and axial directions causing a liquid maldistribution
throughout the paste (Yu, 1999). The extent of the preforming pressure and its duration
significantly affect the quality of the preform. In fact, to produce a preform of uniform
density the magnitude of the pressure depends on the molecular weight (standard specific
gravity) of the resin (Ariawan, 2002). Lack of adequate pressure will result in a preform
of non-uniform density which will extrude unsteadily, resulting in an unacceptable final
product. During preforming, the applied pressure compacts the particles making those
ones adjacent to the wall of the preforming unit undergo plastic deformation that results
in a smooth film of deformed powder surrounding the preform. Because of this layer, the
rest of the resin particles remain spherical even after high pressure preforming (Mazur,
1995).
2.2.3 Phase migration and extrusion
Phase migration is a phenomenon that occurs not only during preforming but also
during extrusion (Yu, 1999). It is determined by relative motion of the liquid through the
voids between the solid-phase particles. This migration eventually results in non-uniform
distribution of lubricant in the mixture. This effect is enhanced with time, especially in
the presence of high extrusion pressure. As the paste becomes drier, the extrusion
pressure rises and the liquid loss increases consequentially. Eventually high frictional
forces may occur due to direct contact between particles and particles, and between
particles and containing walls (Benbow et al., 1998; Blackburn, 1993).
The packing characteristics of the paste depend on the particle size, shape and size
distribution and there is a direct correlation between the permeability of a consolidated
paste and its porosity (Rough, 2002). Thus, since the solid and liquid phases, move at
significantly different rates under application of a pressure gradient, some of the liquid
escapes from the paste. If the permeability through the packed particles is high and the
liquid viscosity is low, conditions for the liquid to move forward faster than the solid will
be promoted. The result will be that the paste becomes effectively drier, the extrusion

pressure rises, and the process can be halted in extreme cases (Benbow and Bridgwater,
1993).
After extrusion, the extrudates can exhibit surface fracture depending on the
processing conditions. Benbow and Bridgwater (1993) reported the effect of die shape,
operating conditions, and paste formulation on surface defects of final products. Domanti
and Bridgwater (2000) studied extensively the effect of die land length, extrusion rate,
die entry angle, extrusion ratio and water content on the surface fracture in the extrusion
a-alumina paste mixed with Bentonite clay and carbohydrates. To reduce the severity of
the extrudate distorsion, several options are available such as decreasing the extrusion
rate, increasing the lubricant concentration in the paste mixture, using extrusion dies with
long length to diameter ratio and small entrance angle (Benbow et al., 1987; Benbow and
Bridgwater, 1993), altering the viscosity and yield properties of the liquid phase, and by
blending fine and coarse powders in order to decrease the average pore size (Blackburn
and Bohm, 1993). These alternatives have advantages and disadvantages or even they
may not work at all for all kind of pastes. As far as PTFE paste processing is concerned,
there is an optimum value for the entrance angle and length to diameter ratio of the die as
well as lubricant and viscosity concentration (Ariawan, 2002; Ochoa and Hatzikiriakos,
2005; Ochoa 2006).
A very interesting phenomenon that occurs during PTFE paste extrusion is
fibrillation. It is the formation of fibrils that interconnect the various particles together
and these essentially give dimensional stability to the final product (Figure 1.7 b,c).
Lewis and Winchester (1953) first reported that fibrillation occurs during paste flow
through the contraction area of the die. Later, Ariawan (2002) found the same through
SEM analysis of paste in the die entry region. Mazur (1995) explained this phenomenon
by making reference to particles that reorganize themselves to pass through the die during
the initial stage of extrusion. After passing that region, particles are deformed due the
shear/extensional stresses, resulting in the formation of fibrils which contribute to the
mechanical strength of the extrudates.

2.2.4 Sintering
Sintering is the process during which a granular material, such as polymer powder
of PTFE, is heated to a temperature near its melting point (Hooper, 2000). In this process
the particles of the loose powder or pressed compact material weld together to form an
interconnected solid (Mackenzie and Shuttleworth, 1949). As a result, the density of the
compact changes. The coalescence of contacting polymer particles is important to
provide the final product with suitable and improved mechanical properties. Previous
studies of sintering revealed that the surface tension was the driving force for this
phenomenon to occur. However, more recent reports have shown that the degree of
sintering is governed by the particle size, viscosity, interfacial tension, molecular
architecture and molecular weight distribution (Hooper, 2000). In PTFE paste processing,
the elastic phenomena dominate the sintering process (Mazur, 1995). During PTFE
sintering, the net volume of the material changes but the changes in linear dimensions are
highly anisotropic. During the heating cycle, the sample contracts in the axial direction
and expands in the radial direction making a net shrinkage of about 4% (Mazur, 1995). In
fact, axial contraction is the resultant of a contraction and expansion occurring
simultaneously. Apparently, the axial contraction is driven by molecular orientation while
the expansion is the response to release the stress accumulating during the former
(Mazur, 1995). The resultant sintered extrudate exhibit higher tensile strength than the
unsintered sample as an example of the improvement in the mechanical properties
(Ochoa and Hatzikiriakos, 2005).
2.2.5 Mechanism of PTFE paste flow
The flow mechanism associated with PTFE paste extrusion differs significantly
from polymer melt flow. It is because, microscopically, solid state PTFE molecules are
confined in their crystallite and spherulite configurations, while in polymer melt,
molecules are randomly positioned, not conformed to a specific shape and are
significantly more mobile. In a number of ways, the process of PTFE paste extrusion is
similar to ceramic paste processing (Benbow and Bridgwater, 1993) and the pastes used
in pharmaceutical applications: see, for example, Rough et al., (2000), Burbidge et al.

(1995), and Yu et al. (1999). However, since fibrillation is involved in the mechanism of
PTFE paste flow, the resulting extrudate is relatively stronger.
To determine the morphological changes that take place during the course of
PTFE paste extrusion, SEM analysis has been performed on the PTFE paste before and
after preforming, as well as after extrusion as shown in Figure 1.6. After extrusion the
rheology of the material is quite different as the PTFE particles are interconnected with
fibrils mostly oriented in the direction of flow.
2.3 Experimental Observations
2.3.1 PTFE paste extrusion
As compared to the various applications of PTFE paste, little work has been done
to understand the theoretical aspects of PTFE paste flow. Therefore, relevant literature
should be drawn from work on paste extrusion of other materials such as: ceramics,
alumina-based materials, food, and other polymers although the operating and design
parameters are different from those applied to PTFE paste extrusion.
Figure 2.1 represents a typical start up pressure transient response obtained during
a PTFE paste extrusion by means of a capillary rheometer (Ariawan, 2002; Ochoa, 2006).
Three operating zones can be seen. The maximum in the extrusion pressure obtained in
zone I, is essentially due to the finite compressibility and the yield stress that causes
jamming of the paste in the barrel. Until this point is reached, the paste flows in the die at
very low speed. The paste is being compressed in the barrel and as a result the pressure
increases gradually. During this compression period, the paste is in a state of jamming,
which is defined as the conversion of a liquid system into a solid by imposed stress (Haw,
2004). This essentially means that there is a number of immobile clusters of particles in
the upstream to the die entrance direction that are responsible of the jamming (Breedveld,
2003; Manoharan and Elsesser, 2003). Collapse of these immobile clusters of particles
initiate the flow and this happens once the yield pressure is reached (Haw, 2004).
Zone II is taken to be the steady state part of the extrusion process. The recorded
average pressure in this zone is reported as the extrusion pressure. Finally in zone III, the
pressure gradually increases due to the fact that the final part of the preform becomes
drier due to liquid migration. The network of PTFE particles plays the role of an

apparently immobile screen. The net result of this is that the lubricant is moving slightly
faster than the assembly of the particles and therefore causes the last part of the preform
to become drier (lower lubricant concentration) and therefore to be extruded at a higher
pressure (Ochoa and Hatzikiriakos, 2004).
3 (/> in 0) JL. QL c o 35 •5 HI
Distance in the barrel
Figure 2.1: Typical start up of pressure transient obtained in PTFE paste extrusion [Ochoa, 2006].
2.3.2 Effect of geometrical characteristics of die on the extrusion pressure
Lewis and Winchester (1953) have studied the effect of extrusion pressure,
temperature, and die design on the process of PTFE paste extrusion. They reported that
fibrillation occurs during the paste flow through a conical die. Later, Ariawan (2002)
found the same through SEM analysis of paste in the die entry region. Mazur (1995)
explained this phenomenon by making reference to particles that reorganize themselves
to pass through the die during the initial stage of extrusion. As paste advances further in
the conical die, particles are deformed due to shear and extensional stresses, resulting in
the formation of fibrils which contribute to the final mechanical strength of the headings.
Ariawan et al., (2002a) have performed detailed experiments to show the effect of
volumetric flow rate, die entrance angle and the die reduction ratio on the extrusion
pressure of PTFE (Figures 2.2-2.5).

o.
u
c o </>
100
90
80
70 F-
60
50
40
30
20
10
0 20
Resin 3 + ISOPAR G, 35°C R = 352:1, a = 45°, L/D, = 0
30 40
16 wt .% ISOPAR G i 18 wt .% ISOPAR G 22 wt .% ISOPAR G -
J_
50 60 70 80
Volumetric Flow Rate (mm /s)
Figure 2.2: The effect of lubricant (ISOPAR® G) concentration on the steady-state extrusion pressure for resin 3 (PTFE resin). Solid lines are model predictions [Ariawan et
al., (2002)].
Figure 2.2 shows the effect of volumetric flow rate on the extrusion pressure for
three different lubricant concentrations for a PTFE resin. The authors have concluded that
a lower lubricant concentration result into a higher extrusion pressure that may cause
fibril breakage. On the other hand, a higher lubricant concentration results into a wet and
weak extrudate. The steady-state extrusion pressure generally increases with increase of
the extrusion rate (volumetric flow rate).
Figures 2.3 and 2.4 show that the extrusion pressure increases with increase in the
reduction ratio and L/D ratios of the die respectively. This is due to increased levels of
strain hardening and frictional losses, respectively. Figure 2.5 represents the dependence
of the extrusion pressure on die entrance angle. The extrusion pressure initially decreases
and subsequently increases with increase of the die entrance angle.

Figure 2.3: The effect of reduction ratio on the steady-state extrusion pressure for different PTFE resins. Solid lines are model predictions [Ariawan et al., (2002)].
Die L/D„ Ratio
Figure 2.4: The effect of die L/D a ratio on the steady state extrusion pressure at different reduction ratios for resin 3 (PTFE resin). Solid lines are model predictions [Ariawan et
al., (2002)].

65
60
55
I 50
s 45 p D 40
1 35
b 30
s s 2b
20
15
10
Resin 3 + 18wt.% ISOPAR G, 35°C R = 352:1, L/D =0
75.4 m m 3 / s Benbow-Bridgwater (1 9 9 3 ) :
10 20 30
Entrance Angle, a
40 50
Figure 2.5: The effect of die entrance angle on the steady-state extrusion pressure at different extrusion rates for resin 3 (PTFE resin). Solid lines are model predictions
[Ariawan et al., (2002)]. Also dotted line shown is the prediction using the Benbow-Bridgwater equation (1993).
2.4 Constitutive equations proposed to predict pressure drop in capillary die flow
Snelling and Lontz Mode l. Snelling and Lontz (1960) have assumed steady state
flow through an orifice die (L/D = 0) of conical entry angle 2a, and used the following
rheological model to predict the pressure drop:
• Cy" +rj dy dt
[2.1]
where r is the shear stress, y is the strain and C,rj, m and n are constants. By also
utilizing the "radial flow hypothesis", they derived the following relationship for the total
pressure drop
AP • 4 C
3(h + 1) 3 In £o_
D +
Arj 3 m
12gsin3 a n{\ - cos a)D3 [2.2]

where C, n, r/, and m are constants to be evaluated experimentally, (DJD>) 2 is the
reduction ratio and Q is the volumetric flow rate. The authors have modeled the problem
by considering a constitutive equation that includes a strain hardening term (elastic term)
and a shear thinning term (viscous resistance). Eq. 2.2 addresses the dependence of
extrusion pressure on the flow rate, die dimensions, and lubricant concentrations.
Additionally, by following the redistribution of pigmented paste within the die during
extrusion, the authors have managed to experimentally determine the velocity field in the
die entry region. As discussed above the authors have used the "radial flow" hypothesis
which assumes that the paste particles at the same radial distance from the virtual apex of
the conical zone of the die move towards the die apex at the same velocity. Thus, the
velocity of a point on a spherical surface at distance r from the apex is [Snelling et. al
Doraiswamy Mode l. Doraiswamy et al. (1991) have proposed a non-linear rheological
model for concentrated paste. This model considers the elastic, viscous, and yielding
behavior of the material by introducing a recoverable strain term, y . In addition, this
model has the advantage of using data easily accessible by means of a parallel plate
rheometer. Thus, they have suggested the following constitutive equation for a material
that exhibits yield stress:
(I960)]:
dr dt 2tt{\ - cos a)r
[2.3]
T = Gy Y \< v. [2.4]
Y 1= Y c [2.5]
Y l< Yc [2.6]
dt Y 1= Yc < Y [2.7]

where G is the elastic modulus, yc is the critical strain value at yielding, y is the
recoverable strain tensor, and K and n are power law constants. Note that the viscosity,
evaluated as the term in brackets in Eq. 2.5, approaches a Newtonian viscosity at low
shear rates and a power law viscosity at high shear rates.
Benbow and Bridgwater Model (1993). Simple equations for paste flow through dies of
various entry angles, cross sectional shapes and L/D ratios have been proposed
analytically by the authors. Particularly, for a steady state flow through a capillary die of
entry angle 2a, and performing separated force balances on the entry region of the die
and on the actual die land, the following relationship for the total pressure drop was
derived:
AP = 2(g0 + £ ,V m + xq cot cc)ln £ o D
P , V n ' D v D o ;
cot a
4L D (xo + P j V n ) [2.8]
where <r0, £ m, r0, fit and n are parameters to be determined experimentally and V and
D0 are the mean paste velocity and barrel diameter, respectively. The first term accounts
for the change in cross sectional area in the conical entry (extensional and shear term),
while the second term accounts for pressure drop in the die land {shear term). The
rheological model used to obtain equation (2.8) was:
a = cr, + a • V [2.9]
Zhensa et al. (2003) model . The mathematical model proposed in this work was for the
extrusion of water-oxide pastes in the production of a-Fe203 catalysts. This model had
enabled the authors to determine the thickness of the adsorption-solvation shell on solid-
phase particles and also the concentration of the components of the dispersion
(continuous) phase as a function of time. The authors have proposed the following
expression for the extrusion pressure as a function of the average extrudate flow velocity:

[2.10]
where a0, cp, k , n, and a are unknown parameters. a0 is the yield stress at the molding
channel inlet, q> is velocity development factor, and k, n are power law constants. The
parameter ' a ' is a function of the diameter of a molding channel and decreases with
increasing channel diameter. The authors have fitted these five parameters by using the
random search method.
Coussot et al. (2003 ) have proposed a simple thixotropic model to predict the steady and
transient behaviour of the paste. The empirical model proposed by Coussot et al. (2003)
was used to capture the thixotropic behaviour of the paste by Roussel et al. (2004). The
model parameters were estimated by fitting the experimental data obtained from
controlled stress rheometer. The authors have concluded that the model could
qualitatively predict the steady state and a transient velocity profile measured by NMR
for a bentonite suspension is a coaxial cylinder geometry. The authors have proposed the
following relation for the stress:
where r | 0 , n , 0 and a are four material parameters and X is the structure parameter.
The weaknesses of the thixotropic model proposed by these authors were that this model
is incapable of predicting the characteristics of the start-up flow correctly; moreover a
larger number of empirical parameters would be required to achieve more accurate
predictions.
The Ariawan Model (2002 ). Using the "radial flow" hypothesis proposed by Snelling and
Lontz (1960), Ariawan et al. (2002a) have proposed a one-dimensional mathematical
model to describe the effect of operating parameters and die design parameters on the
extrusion pressure of PTFE paste. This model considers the paste as an elasto-viscoplastic
material that exhibits both strain hardening and viscous resistance effects during flow.
Ariawan et al. (2002a) have used the following constitutive equation:
Tl = T l 0 ( l + r ) [2.11]
[2.12]

<Te-°r=CY'L*+VY\ n max m [2.13]
where errand ar are the principal stresses in 0 and r directions respectively and ^ and
y are the maximum values of the strain and strain rate, respectively.
The extrusion pressure in the conical zone was found to be:
i], n, m and/are material constants that have to be determined experimentally.
This model was found to describe adequately most experimental observations. For
example, the continuous lines in Figures 2.2-2.5 represent fits to experimental results.
Overall it was found that this model can describe quantitatively and qualitatively the
effects of die entrance angle, reduction ratio, length-to-diameter ratio of the die, and
PTFE properties on the extrusion pressure. However, it assumes the velocity distribution
by using the "radial flow" hypothesis.
From the above discussion it is evident that a model capable of predicting the
velocity profile for paste flow needs to be formulated. To this respect, the following
difficulties have to be overcome:
1. The flow profile of the PTFE paste inside the conical die is 2-D and it should be fully
calculated by a flow model.
2. The assumption of the "radial flow" hypothesis is empirical in nature and therefore, its
validity should be checked.
3. Experimental analysis has shown that the degree of fibrillation depends on the
operating parameters as well as geometrical characteristics of the die. Thus, a complete
model should also consider the mechanism of fibrillation.
4. The rheological parameters of the chosen constitutive equation should be determined
by fitting the data obtained from rheological testing.
P J = CT extrusion rb
[2.14]
where crra is the stress at the die exit, R is the reduction ratio, defined as (Db/Da)2, and C,

2.5 Numerical simulation studies of paste flow
While there are numerous reports available on the experimental and theoretical studies of
paste flow, there is none that refers to the case of PTFE paste. Below some of the
numerical simulations studies most relevant to paste flow are discussed.
Adams, M. J. et al. (1997 ) have reported a finite element analysis of the sqeeze flow of
elasto-viscoplastic paste materials placed in between two circular horizontal plates. The
model was based upon the assumptions that linear elastic deformations occurs prior to
yielding and that the yield surface is strain rate hardening as defined by an associated
viscoplastic flow rule. The authors have assumed that the elastic and viscoplastic strain
rates are additive i.e.:
e ^ + e ? [2.15]
where s^1 and iv? are the elastic and viscoplastic components of the strain rate tensor
respectively. The authors have formulated and used the following constitutive relation:
where y v p is the viscoplastic shear strain rate and t o is the shear yield stress. The
viscoplastic material parameters were determined by using capillary measurements (shear
flow). The finite element analysis was carried out using the code ABAQUS (Hibbit,
Karlsson and Sorenson, USA, version 5.4). The prediction of the displacement field and
the normal force with gap was reported to be in reasonable agreement with the
experimental measurements.
Horrobin et al. (1998 ) have described paste flow by using an elastic-plastic finite element
method to calculate load in the paste extrusion. The numerical results were compared
with the first term in the Benbow-Bridgwater (1993) equation. They have used the
ABAQUS finite element package, version 5.5 for their numerical simulations. The elastic
response of the material is modeled using Hooke's law and Von Mise's yield criterion.
The authors have concluded that viscoplastic materials, displaying rate dependence can
be modeled by using lubricated Bingham or Herschel-Buckley fluids.
Ozkan et al. (1999 ) performed a rheological analysis of ceramic pastes (alumina paste).
The flow behavior of the paste is approximated by an elasto-viscoplastic constitutive
T = T + O [2.16]

model and implemented by using an established finite element code, ABAQUS (Hibbitt,
Karlson and Sorensen, Inc., version 5.4). The Herschel-Buckley model was used in shear
and uniaxial deformation form to describe the material as a combination of elastic, plastic
and viscous properties. A coulombic friction boundary condition was implemented at the
contact between paste and platen. The authors have reported reasonably good agreement
between the experimental measurement and the finite element simulations. The authors
have also studied the flow profile of the paste for lubricated and unlubricated boundary
conditions.
Domanti et al. (2002 ) have devised some theoretical criteria for predicting the onset of
surface fracture in ram extrusion, using the elastic-plastic finite element method. The
availability of the literature on the numerical study of polymer paste flow by using finite
element simulation is very limited. This could be because of the complexity in simulating
the polymer paste flow.
In the present study, finite element simulations are performed by using proposed
constitutive models. The gradual change of PTFE paste from a liquid-like (before
processing) phase to a solid-like phase is modeled through shear thinning and strain-
hardening term premultiplied by functions of the structural parameter, , that represents
the percentage of the domains which are fibrillated. The mechanism of fibrillation which
transforms paste from shear-thinning fluid to strain-hardening fluid is modeled through a
kinetic model for the structural parameter, t, . The parameters used in the model are
obtained from rheological experiments. Unlike the previous models reported in this
chapter, this model is a rather complete model, which considers the effect of fibrillation
on rheology and processing of PTFE paste. The details of the proposed consitutive
models and simulations performed in the present work are discussed in later chapters of
this thesis.

2.6 Bibliography
Adams, M. J., I. Aydin, B. J. Briscoe, and S. K. Sinha, A Finite Element Analysis of the Squeeze Flow of an Elasto-Viscoplastic Paste Material, J. Non-Newt. Fluid Mech., 71, 41-57 (1997).
Ariawan, A. B., Ebnesajjad, S. and Hatzikiriakos, S. G. Paste extrusion of polytetrafluoroethylene (PTFE) fine powder resins. Can. Chem. Eng. J., 80, 1153-1165 (2002a).
Ariawan, A. B. Paste Extrusion of Polytetrafluoroethylene Fine Powder resins, The University of British Columbia. Dept. of Chemical and Biological Engineering. Thesis Ph. D., 2002.
Benbow, J. J., Oxley, E. W., and Bridgwater, J. The extrusion mechanics of pastes-The influence of paste formulation on extrusion parameters. Chem. Eng. Sci., 42 (9), 2151-2162, (1987).
Benbow, J. J., and J. Bridgwater, Paste Flow and Extrusion, Oxford University Press, Oxford, 1993.
Benbow, J. J., Blackburn, S., and Mills, H., The effects of liquid-phase rheology on the extrusion behaviour of paste. Journal of Material Science, 33, 5827-5833 (1998).
Blackburn, S., Bohm, H., The influence of powder packing on paste extrusion behaviour. TransIChemE, Vol 71, Part A, 250-256 (1993).
Breedveld V., and D. J. Pine. Microrheology as a tool for high-throughput screening. Journal of Materials Science, 38, 4461-4470 (2003).
Burbidge, A. S., J. Bridgwater, and Z. Saracevic, Liquid Migration in Paste Extrusion, Chem. Eng. Res. Design, 73, 810-816 (1995).
Coussot, P., Nguyen, Q. D., Huyuh, H. T., Bonn, D., Viscosity bifurcation in thixotropic, yielding fluids, J. Rheol., 46, 573-589 (2002).
Domanti, A. T. J., Bridgwater J., Surface fracture in axisymmetric paste extrusion. Trans IChemE, Vol 78, Part A, 68-78 (2000).
Domanti, A. T. J., Horrobin, D. J., and Bridgwater, J., An investigation of fracture criteria for predicting surface fracture in paste extrusion, Int. J. Mech. Sci., 44, 1381-1410(2002).
Doraiswamy, D., A. N. Munumdar, I. Tsao, A. N. Beris, S. C. Danforth, and A. B. Metzner, The Cox-Merz Rule Extended: A Rheological Model for Concentrated Suspensions and Other Materials with a Yield Stress, J. Rheol., 35, 647-685 (1991).

DuPont Fluoroproducts, Teflon® PTFE Fluoropolymer Resin - Processing Guide for Fine Powder Resins, Technical Bulletin, Wilmington, Delaware, 1994.
Ebnesajjad Sina, Fluoroplastics, Vol 1 Non-Melt Processible Fluoroplastics, Plastic Desgin Library. William Andrew Corp, NY, 2000.
Haw M. D., Jamming, Two-fluid behaviour, and self-filtration in concentrated particulate suspension. Phys Rev Letters, 92 (18) 18506 (2004).
Hooper, R., Macosko, C. W., Derby, J. J. Assessing a flow-based finite element model for the sintering of viscoelasticparticles. Chem. Eng. Sci., 55, 733-746, (2000).
Horrobin, D. J., and R. M. Nedderman, Die Entry Pressure Drops in Paste Extrusion, Chem. Eng. Sci., 53, 3215-3225 (1998).
Khan, A. U., Briscoe, B. J., Luckham, P. F., Evaluation of slip in capillary extrusion of ceramic pastes. Journal of the European Ceramic Society, 21 (2001), 483-491.
Lewis, E. E., and C. M. Winchester, Rheology of Lubricated Polytetrafluoroethylene Compositions - Equipment and Operating Variables, Ind. Eng. Chem., 45, 1123-1 127, (1953).
Mackenzie, J. K., and Shuttleworth, R., A phenomenological theory of sintering, Proc. Phys. Soc. B 62, 833-852 (1949).
Manoharan, V. N., M.T. Elsesser, and D J Pine, Dense Packing and Symmetry in Small Clusters of Microspheres. Science, 301, 483-487 (2003).
Mazur, S., Paste Extrusion of Poly(tetrafluoroehtylene) Fine Powders in Polymer Powder technology,441-481, Narks, M., Rosenzweig, N., Ed. John Wiley & Sons, 1995.
Ochoa, I., Hatzikiriakos, S. G. Polytetrafluoroethylene {PTFE) paste performing: Viscosity and surface tension effects. Powder Technology, 146( 1 -2), 73-83 (2004).
Ochoa, I., Hatzikiriakos, S. G. Paste extrusion of polytetrafluoroethylene (PTFE): Surface tension and viscosity effects.. Powder Technology (2005), 153(2), 108-118.
Ochoa, I., Paste Extrusion of Polytetrafluoroethylene Fine Powder resins: The effect of the processing aid physical properties, Ph.D., The University of British Columbia. Dept. of Chemical and Biological Engineering. Thesis Ph. D., 2006.
Ozkan, N., Oysu, C., Briscoe, B. J., and Aydin Ismail., Rheological Analysis of Ceramic Pastes, Journal of the European Ceramic Society, 19, 2883-2891 (1999).
Rough, S.L., Bridgwater, J. & Wilson, D.I., Effects of liquid phase migration on extrusion of microcrystalline cellulose pastes, Intl. J. Pharm., 204, 117-126 (2000).

Roussel, N., Roy, R. L., Coussot, P., Thixotropic modeling at local and macroscopic scales. J. Non-Newt. Fluid Mech., I l l , 85-95 (2004).
Snelling, G. R., and J. F. Lontz, Mechanism of Lubricant-Extrusion of Teflon® TFE-Tetrafluoroethylene Resins, J. Appl. Polym. Sci. Ill, 257-265 (1960).
Yu, A. B., Bridgwater, J., Burbidge, A. S., Saracevic, Z. Liquid maldistribution in particle paste extrusion. Powder Technology, 103 (1999), 103-109.
Zhensa, A. V., Kol'tsova, E. M., Petropavlovskii, I. A., Kostyuchenko, V. V. and Fillippin, V. A., Mathematical Modeling of Extrusion of Water-Oxide Pastes in the Production of a -Fe203 Catalysts, Theoretical Foundation of Chemical Engineering, 37(2), 197-203 (2003).

CHAPTER 3
Scope of Work
3.1 Introduction
Due to its outstanding properties, PTFE has become a technologically important
material and as such has found a wide variety of applications ranging from wire
insulation to body part replacement. It is undeniable that the processing techniques by
means of which PTFE is manufactured have been improved since their introduction,
although there are still several issues to be understood in order to further optimize them;
the microstructural formation during the PTFE paste processing is one important issue.
Being a thermoplastic, the first idea is to attempt to melt process PTFE as a
commodity polymer. However, due to its high melting point and high viscosity such
techniques are almost impossible. The second possibility is to treat PTFE as paste.
Techniques for pastes are known for other materials such as ceramic pastes and food
stuffs (Chevalier, 1997; Steffe, 1996; Rough, 2000). Since the PTFE manufacturing
process facilitates the production of powders, it is not surprising that PTFE is processed
using techniques such as sintering, pressing and paste extrusion. While paste extrusion
has been studied for other materials to great extent, it is only recently that PTFE paste
extrusion has been a subject of scientific studies (Ariawan, 2002; Huang, 2005; Ochoa,
2006). Mathematically, previous work on the development of constitutive equations to
model the flow of polymer melts is of limited relevance to the PTFE paste system. This is
because both solid and liquid phases are present in PTFE pastes, with the solid particles
being fibrillated during extrusion.
The present work intends to contribute to our understanding of several modeling
aspects of PTFE paste rheology and its role in extrusion. The various objectives of this
work are discussed in detail in this chapter.
3.2 Thesis Objectives
This project is mostly devoted to the modeling and simulation aspects of PTFE
paste flow. An effort has been made to understand the relation between microstructure
formation and its effect on the rheology and processing of PTFE paste.

The objectives of this work can be summarized as follows:
1. To measure the rheological properties of PTFE paste using parallel plate rheometer.
2. To perform the capillary extrusion experiments in order to analyse the slip behavior
of the PTFE paste.
3. To develop a constitutive model to predict the rheological behavior of the paste. The
constitutive model should be capable of predicting the gradual structural changes that
occur during the PTFE paste flow.
4. To develop a model which can describe the mechanism of fibrillation with
consideration of creation and breakage of fibrils during flow.
5. To perform numerical simulations using finite element method in order to predict the
flow behavior of the PTFE paste during extrusion.
6. To compare the dependence of the extrusion pressure on die design parameters and
processing conditions with experimental observations.
7. To propose an approximate 1-D analytical model which can predict the processing
behavior of PTFE paste in tube extrusion similar to that developed by Ariawan et al.,
(2002).
3.3 Thesis Organization
Chapter 1 of the thesis discusses basic information related to tetrafluoroethylene
(TFE) polymerization techniques as well as the basic physical and chemical properties of
PTFE. The industrial processes relevant to PTFE are also discussed with particular
emphasis to fine powder PTFE processes. This chapter is also devoted to addressing the
microstructure formation and its effect on the rheology of PTFE paste. Complexity in
mathematical modeling of PTFE paste flow is also demonstrated.
Chapter 2 presents the literature related to paste extrusion. The study about the
processing behaviour of pastes using experimental observations and modeling is
discussed. Chapter 3 includes the objectives of the present work, as well as describes the
organization of the thesis.
In chapter 4 the viscous constitutive model as a function of fibrillation is proposed
to predict the processing behavior of PTFE paste. A kinetic model for structural
parameter is proposed which models the mechanism of fibrillation. Capillary extrusion
experiments used to determine the slip behavior of PTFE paste is discussed. The
predictions from the finite element simulations are compared with the experimental
observations. This chapter is based on a journal paper that has already been published
(Patil, P. D., Feng, J. J., and Hatzikiriakos, S. G., "Constitutive modeling and flow
simulations of PTFE paste extrusion," J. of Non-Newtonian Fluid Mech., 139, 44-53,
2006) Chapter 5 presents a constituve model where the PTFE paste is treated as a
viscoelastic material. The same model for the evolution of the structural parameter is
used as reported in chapter 4. The details of the numerical scheme used for the
viscoelastic simulations using the finite element method are reported. The results from
two different models are compared with each other and also with experimental
observations. The hypothesis of a higher degree of fibrillation leads to a higher tensile
strength of the extrudate is explored in this section. This chapter is based on a journal
paper which has been submitted (Patil, P. D., Ochoa, I., Feng, J. J., and Hatzikiriakos, S.
G., "Viscoelastic modeling and flow simulations of PTFE paste extrusion," J. Rheol.
2006) Chapter 6 focuses on the derivation of an analytical model for PTFE paste
extrusion through annular dies. Model predictions are presented for various cases and are
compared with experimental results of macroscopic pressure drop measurements in rod
and tube extrusion. This chapter is based on a journal paper that has been accepted for
publication (Patil, P. D., Feng, J. J., and Hatzikiriakos, S. G., "An approximate flow
model for polytetrafluoethylene paste through annular dies," accepted in AIChE J.,
2006).
Finally, the conclusions and contributions to knowledge are discussed in Chapter
7. A general summary of the most significant modelling aspects resulted from this work
and some recommendations for future work are presented here.
3.4 Bibliography Ariawan, A. B., Ebnesajjad, S. and Hatzikiriakos, S. G. Paste extrusion of
polytetrafluoroethylene (PTFE) fine powder resins. Can. Chem. Eng. J., 80, 1153-1165 (2002).
Patil, P. D., J. J. Feng, and S. G. Hatzikiriakos, Constitutive modeling and flow simulation of polytetrafluoroethylene (PTFE) paste extrusion, J. Non-Newt. Fluid Mech., 139, 44-53 (2006a).
Patil, P. D., J. J. Feng, and S. G. Hatzikiriakos, An analytical flow model for polytetrafluoroethylene paste through annular dies, accepted in AIChE J. (2006b).
Patil, P. D., J. J. Feng, and S. G. Hatzikiriakos, Viscoelastic modeling and flow simulation of polytetrafluoroethylene (PTFE) paste extrusion, manuscript under preparation (2006c).

CHAPTER 4
Constitutive Modeling and Flow Simulation of
Polytetrafluoroethylene (PTFE) Paste Extrusion1
4.1 Introduction
Owing to its high melting point and melt viscosity, it becomes almost impossible to melt-
process polytetrafluoroethylene (PTFE) (Blanchet, 1997; Ebnesajjad, 2000; Sperati,
1989; and Ochoa and Hatzikiriakos, 2004). Instead, techniques involving cold processing,
paste extrusion and sintering have to be employed. In PTFE paste extrusion that is of
interest to the present work, fine powder of the PTFE resin (primary particle diameter of
approximately 0.20 ^m) is first mixed thoroughly with a lubricating liquid to form a
paste. The paste is consequently extruded through a conical die at a low temperature,
typically 35 °C. A schematic diagram of the die used to process the PTFE paste is shown
in Figure 4.1. It consists of two parts: (i) the die entry, the region where mixed shear and
extensional deformation occurs; and (ii) the die land that is a capillary of constant cross
section attached at the bottom of a conical section of the die. The die is attached at the
bottom of a capillary rheometer. Due to the presence of the lubricant, slippage of the
paste at the solid boundaries of the die is possible and the flow is rather complicated.
The conical die entry shown in Figure 4.1 is defined by the entry angle (2 a), an
important parameter in paste extrusion; the reduction ratio, RR, defined as the ratio of the
initial to the final cross-sectional area of the conical entry, D ^ / D 2 ; and the length-to-
diameter ratio, L / D . During the PTFE paste extrusion through such a die, complex
structural changes occur in the polymer paste that significantly influence its rheology.
These structural changes have been determined by scanning electron microscopy (SEM)
analysis (Mazur, 1995; Ebnesajjad, 2000), as already shown in Figure 1.6 which depicts
typical SEM micrographs of the paste before, during and after the extrusion. The most
remarkable feature is the formation of fibrils between neighboring polymer particles.
' A version of this chapter has been published. Patil, P. D., Feng, J. J., and Hatzikiriakos, S. G. (2006) Constitutive Modeling and Flow Simulation of Polytetrafluoroethylene (PTFE) Paste Extrusion, J. of Non-Newtonian Fluid Mech. 139: 44-53.

Db
Figure 4.1: A conical entry die used in the paste extrusion of PTFE: The left half illustrates the extrusion of PTFE particles and the gradual structure formation through
particle fibrillation, whereas the shaded area depicts the axisymmetric domain used in the simulations.
This is due to the mechanical interlocking of crystallites of neighboring particles which
unwind as the particles enter the converging conical die (extensional flow) (Ebnesajjad,
2000; Mazur, 1995; Ariawan et al., 2001; Ariawan, 2002; Ariawan et al., 2002a). Figure
1.6a shows the absence of fibrils in the unprocessed paste, where PTFE particles
essentially retain their spherical identity. Figure 1.6b shows the existence of fibrils as the
paste flows downstream in the conical die zone. At the exit of the die and depending on
the geometrical characteristics of the die, the paste might become nearly fully fibrillated
(Figure 1.6c). It is these submicron-diameter fibrils between polymer particles that
essentially give the dimensional stability and strength to the final extruded product.
The experimental dependence of extrusion pressure on reduction ratio (RR),
entrance angle (2 a ) and die land L / D ratio of conical dies has been studied for several
types of PTFE and lubricants (Ochoa and Hatzikiriakos, 2004; Ariawan, 2002; Ariawan
et al., 2002b). A somewhat unexpected observation is that the extrusion pressure varies
non-monotonically with the entrance angle of the conical die; 2a , and it achieves a
minimum for an intermediate entrance angle, 2a « 30°. It has also been recognized that
the rheological behavior of PTFE pastes is strongly dependent on the number of fibrils
formed between PTFE particles during the extrusion. This implies that the rheology of
the paste continuously changes and this complicates the flow modeling. The formation of
fibrils has not been given any consideration in previous models (Ariawan, 2002; Ariawan
et al., 2002b; Benbow and Bridgwater, 1993; Horrobin and Nedderman, 1998), and it is
the main focus of the present study. Furthermore, experiments have shown that the
degree of fibrillation depends on the operating parameters as well as design
characteristics of the die (Ochoa and Hatzikiriakos, 2004; Ariawan et al., 2002a; Ariawan
et al., 2002b). Therefore, a rational approach seems to be to first formulate an
approximate rheological constitutive equation that takes into account the structure
formation through fibrillation; and then to use this equation to simulate the paste
extrusion process and compare the calculated with the experimental extrusion pressure, as
a function of operating and die geometrical characteristics.
In this paper, first a constitutive equation is proposed based on the concept of a
structural parameter, 2,. This parameter represents the mass fraction of the PTFE paste
that is fibrillated and takes values of 0 and 1 for the unfibrillated and fully fibrillated
cases respectively. The evolution of the structural parameter is described by a first-order
kinetic differential equation, which is developed based on concepts borrowed from
network theory of polymeric liquids (Bird et al., 1987; Jeyaseelan and Giacomin, 1995;
Liu et al., 1984). Similar concepts have been adopted in studies of the rheology of filled

polymers and dilute polymer solutions (Hatzikiriakos and Vlassopoulos, 1996; Leonov,
1990). The constitutive equation is subsequently used to simulate the flow of paste
through the conical die depicted in Figure 4.1. The finite-element results are compared
with the experimental results as a check on the validity and usefulness of the rheological
constitutive equation. In addition, the flow simulation is used to predict the extrusion
pressure as a function of the operating and die geometrical characteristics and to explore
the relationship between the tensile strength of the extrudate and the degree of
fibrillation. In this last task, the average structural parameter at the exit, ^ e x i t , is related
with the experimental tensile strength for a range of the operating and die geometrical
parameters.
4.2 Theoretical Modeling and Numerical Method
4.2.1 Governing Equations
The steady state mass and momentum conservation equations coupled with the
rheological constitutive model are solved to simulate the flow of the PTFE paste. The
axisymmetric r-z domain (Figure 4.1) has been used to perform the simulations. The
velocity field v is subject to the incompressibility constraint, (small volume changes due
to fibril formation that involve phase change are assumed to be small):
V • V = 0 . [4.1]
Due to the high viscosity of the paste, the inertial terms in the momentum equation are
neglected:
V p - V • T = 0 , [4.2]
where p is the pressure and T is the stress tensor, which depends on the structural
parameter, , through a constitutive equation developed below.
4.2.1.1 Constitutive Equation
The rheology of the PTFE paste depends on the formation and evolution of a network of
fibrils connecting PTFE polymer particles during the extrusion. To model this complex
flow behavior, a rheological constitutive equation is proposed which explicitly accounts

for the evolution of fibrils. Prior work has modeled flow induced structure formation in
concentrated suspensions, polymer solutions and filled polymers as a combination of
shear-thinning behavior at low shear rates and shear-thickening behavior at high shear
rates (Jeyaseelan and Giacomin, 1995; Dunlap and Leal, 1987). A similar concept has
been adopted in the present study to model the PTFE paste flow behavior. The rheology
of the paste continuously changes as it flows through the conical sections. It starts as a
two phase fluid-like system, an oversaturated suspension (Figure 1.6a) and it ends as a
highly fibrillated solid-like system. While the paste initially behaves as a shear-thinning
fluid, after the appearance of fibrils in its structure, it behaves more and more as a shear-
thickening fluid. Thus, it is assumed that the stress tensor consists of two contributions
coming from the unfibrillated and fibrillated domains of the paste, represented
respectively by a shear-thinning and a shear-thickening viscous stress. The relative
significance of the two contributions should depend on the structural parameter, .
Recall that the structural parameter,^ is the mass fraction of the paste that is fibrillated,
and takes values between 0 and 1.
Thus, the total viscous stress can be written in the following form:
-c = ( i - O ^ i i t + tn 2 y , [4.3]
where y is the rate of strain tensor, and rj, and r|2 are the shear-thinning and shear-
thickening viscosities that are expressed by a Carreau model (Bird et al., 1987):
"Hi ^ ^ - ^ M M I , ) 2 ) ^ 2 .
where i = 1 refers to shear-thinning (n, < 1) and i = 2 refers to shear-thickening (n 2 >1).
The values of parameters r | M , r | o i , ri; and ?^are discussed and reported in the following
section.
The creation of fibrils has been attributed to the unwinding of mechanically
locked crystallites due to the extensional nature of the flow in the conical region of the
die (Ebnesajjad, 2000; Mazur, 1995). The extensional flow also causes elongation of
newly formed fibrils which might also break depending on the total local Hencky strain.
Therefore, both creation and breakage are possible. A kinetic model is proposed for the
structural parameter, which is a balance of the fibrillated and unfibrillated domains of the
paste and whose dynamics are controlled by the rates of creation and breakage:

v • V£, = f - g , [4.4]
where f and g denote the rate of creation and elimination of fibrillated domains in the
paste. These functions are given by: •N
f(y,vj/) = a y V y , ^
= J
where a and p are dimensionless rate constants for fibril creation and breakage, both
assumed to be 1 in our simulations; \j/ is the flow type parameter; and y is the magnitude
of the strain rate tensor. The flow type parameter, y , indicates the relative strength of
straining and rotation in a mixed flow (Fuller et al., 1980; Fuller and Leal, 1980; Dealy
and Wissbrun, 1990). Its magnitude ranges from -1 to 1 depending on the flow type as
shown in Figure 4.2. Since fibrils are mainly created due to elongation and never due to
rotation, \\i is taken to vary only between 0 and 1. Negative values of are reset to 0.
While the function f involves the formation of fibrils as unwinding of crystallites
of neighboring particles, the function g represents their breakage. This is not to be taken
as disappearance of the circular fibrils (see Figures 1.6b, 1.6c) and reformation of perfect
spherical particles. Broken fibrils do not contribute significantly to the overall pressure
drop and to structural strength of the extrudate.
A final remark for the parameter is as follows: It represents the percentage of
the domains of the system that are fibrillated, and as such should take values between 0
and 1. This can be fixed by limiting the ratio of a/p < l(note that both parameters have
been assigned the value of 1). For example at steady-state conditions, Eq. (4.4) results
= a-Jy , which essentially limits ^ to less than 1. Analytical solutions for one-
dimensional axisymmetric flows where the velocity profile can be taken approximately
known (fully developed) can be derived for Eq. (4) and these show that is always less
than 1. It should be noted that £, can take the value of 1 in pure elongational flow, where
\|/ becomes 1.

Pure Elongation v|/ = 1.0 Shear and elongation = 0.5
Pure Shear \\i = 0.0 Pure Rotation \\i = -1.0
Figure 4.2: Flow fields corresponding to different values of flow type parameters, \\i.
4.2.1.2 Flow type parameter, \|/
The concept of the flow type parameter, v|/, has been used to account for the dependence
of the structural parameter on the relative amount of straining and rotation in the flow
field. As an example, a linear planar flow has a velocity field V = T • X , where T is
the velocity gradient tensor (Fuller et al., 1980; Fuller and Leal, 1980; Dealy and
Wissbrun, 1990): r o r w o r = y [4.6]
The flow of primary interest in our study is the strong flow for which 0 < v|/ < 1. Thus, for
a planar flow, the largest eigenvalue of the velocity gradient tensor has the form of y-Jy
(Fuller et al., 1980; Fuller and Leal, 1980; Dealy and Wissbrun, 1990). On the other hand
the flow parameter vj/ can also be written as:
|D | - |W I [4.7] |D| + |W|
where D and W denote the deformation and vorticity tensor respectively. In the case of
a axisymmetric flow, the velocity gradient tensor has a different form than Eq. (4.6), and
its the largest eigenvalue is no longer equal to y^Jy . Nevertheless, we can still define \\>
according to Eq. (4.7) and therefore, it retains the significance of a flow type parameter.
It appears reasonable to use such a i|/ in our kinetic Eq. (4.5). The magnitude of D and W
in cylindrical coordinate can be written as follows:
9v j 1 f du 3v dz) 2\dz dr
1 1 V 2 V 3z dr J
The flow type parameter controls the magnitude of structural parameter inside the flow
domain with the maximum amount of fibrillation to occur at the center and much less at
the die wall. This also ensures that the fibril creation and evolution mainly takes place
inside the conical section; very little changes in fibril structure occur inside the die land
where the flow becomes pure shear. This picture is supported by experimental evidence.
This was confirmed by performing experiments with L/D ratios 0 and 20 (Ochoa and
Hatzikiriakos, 2004; Ariawan et al., 2002a; Ariawan et al., 2002b). Therefore
phenomenologically, the modeling concepts incorporated into our flow model agree well
with the experimental observations. The agreement between the measured and calculated
extrusion pressure, and the relationship between the structural parameter and the
dimensional strength of extrudate remain to be seen.
4.2.2 Boundary Conditions
The boundary conditions used in the simulations are listed below.

(i) Inlet boundary conditions (z = 0): The numerical fully developed velocity profile for
a shear-thinning Carreau fluid model has been imposed at the inlet with V r = 0 . The
no-fibrillation boundary condition is also assumed: E, = 0
(ii) Outlet boundary conditions: The normal stress boundary condition and zero radial
velocity are imposed:
n • ( - pi + x)n = - p 0 ; vr =0 .
(iii) Slip boundary condition at the die wall: The Navier slip condition has been used at
the die wall, which relates slip velocity with the wall shear stress, C7W :
V s = C c t w .
where C = 1.92 m/M Pa s. This value of C has been calculated from experimental data
which will be discussed in the next subsection.
(iv) The axisymmetric boundary condition is used at r = 0:
v r = 0 , dv z/dr = 0.
In capillary flow, the shear stress at the wall, a w , can be determined by correcting
for the pressure losses associated with the end effects by using the Bagley correction
(Macosko, 1994; Snelling and Lontz, 1960):
4.2.2.1 Slip Boundary Condition
No experimental data on the slip velocity of polymer pastes was available, and thus it was
decided to perform a series of capillary extrusion experiments to determine the relation
between slip velocity and wall stress using the Mooney analysis technique (Mooney,
1931). The paste was prepared using a high molecular weight PTFE resin (F-104) mixed
with 18 wt. % ISOPAR® M as the lubricant; these are the same as those used by Ochoa
and Hatzikiriakos (Ochoa and Hatzikiriakos, 2004). The physical properties of
isoparaffinic lubricant (ISOPAR® M) are listed in Table 4.1.
In capillary flow, the shear stress at the wall, <rw , can be determined by correcting
for the pressure losses associated with the end effects by using the Bagley correction
(Dealy and Wissbrun, 1990; Macosko, 1994):

= 4 ( L / A D + e ) - 1 4 8 1
where Ap is the total pressure drop over the capillary, L is the length and D is the
diameter of the capillary, and "e" is the Bagley end correction in terms of an equivalent
length associated with the end correction.
Table 4.1: Physical properties of the Isopar M lubricant used in the slip velocity measurements.
Property Isopar® M
Density, g/cm3
25°C 0.79
Surface Tension, dynes/cm 25°C 26.6
Vapour Pressure, mmHg, 38°C 3.1
Viscosity, mPa-s 25°C 2.70
a (g2 s"1 cm"5) 608.8
The equivalent length can be determined either by extrapolating the Ap versus the L /D
ratio curves to L / D = 0 or by performing experiments with a die having L / D = 0
(Mooney, 1931). The latter approach has been followed here to find the corrected
pressure drop and therefore the wall shear stress. The apparent shear rate, y A , is
determined from 8V / D , where V is the average fluid velocity of the fluid, which is
equal to the velocity of the piston in capillary extrusion.
To determine the slip velocity, capillary dies having the same length to diameter
( L / D ) ratios are used. Figure 4.3 depicts the apparent flow curves of the paste for the
same L/D ratio and different die land diameters. The analysis proposed by Mooney for
fully developed, incompressible, isothermal, and laminar flow in circular tubes with a slip
velocity of Vs at the wall yields:
• / x 8 v s YA = Y A , S O w ) + - p - S M

where yA s is the apparent shear rate corrected for the slip, solely a function of ctw . Thus,
a plot of the apparent shear rate, y A , versus 1/D at constant a w values should result
straight lines with slopes equal to 8v s provided that the Mooney analysis is correct.
1
aT Q-
0.1 b ui ID Q)
W 0.01 ro CD .C CO :> 0.001
100 1000 10000 1
Apparent Shear Rate, yA (s )
Figure 4.3: The apparent flow curves of PTFE paste extruded through three dies having the same L/D ratio and different diameter.
This is done in Figure 4.4. The individual data points do not fall on perfect straight lines,
which might be due to experimental error. In spite of this, and since an approximate
expression for the slip velocity is needed, the slopes of best fit straight lines passing
through those points in Figure 4.4 were calculated in order to determine the slip velocity
as a function of g w . The plot of slip velocity, v s , versus a w results a straight line with
slope equal to 1.92 m/M Pa s as shown in Figure 4.5. This relation has been used in the
simulations reported in the present study as a slip boundary condition at the die wall.
PTFE resin (F104 HMW) 2a = 90° L/D = 20
o - o
- • — RR=56(DC = 0.127 cm) O - RR = 156 (Dc = 0.076 cm)
• RR = 352 (Dc = 0.051 cm)

1/D (m"1)
Figure 4.4: Mooney plot based on the experimental data of Figure 4.3 prepared to calculate the slip velocity. The shear stress values that correspond to individual lines at
various shear stress values are also shown.
0.06 0.08 0.10 0.12 0.14 0.16 0.1 J
Wall Shear Stress, ctw (M Pa)
0.20
Figure 4.5: The slip velocity, V s , as a function of the wall shear stress, crw for a PTFE paste used in this work. A linear slip model seems adequate to capture the experimental
results.

4.2.3 Finite Element Method
The equations of motion coupled with the proposed constitutive and structural
parameter models were solved using the Galerkin finite element method. All simulations
reported in this paper were performed by using the commercial finite element code
FEMLAB 3.1. As the problem considered here is axisymmetric, two-dimensional meshes
are used on the computational domain. These unstructured meshes comprise triangular
elements of widely varying sizes, small and large elements being employed in regions
where the rates of strain were large and small, respectively. The smallest elements are
required near the die corners, especially the re-entrant corner. The total numbers of
elements used are in the range of 3,000 to 10,000. The corners are also rounded slightly
to avoid geometrical singularity, and the local element size is chosen to be smaller than
the fillet radius at the corner. The fillet radius is a small proportion of the capillary radius,
and so the solution obtained from the analysis is expected to be close to the solution for a
die with perfectly sharp corners. Using meshes of the form shown in Figure 4.6, the
solutions were found to be insensitive to the number of mesh elements.
outlet
Figure 4.6: Geometrical domain used for simulations with enlarged section of the rounded corner shown on the right side.
Inlet
Axisymmetri B.C.
\

The simulations are carried out for various die design parameters: the die
reduction ratio, (RR = D j ; /D 2 ) , the die land length to diameter ratio (L/D) and die
entrance angle ( 2 a ) . Simulations are also carried out for different inlet flow rates that
correspond to various apparent shear rate values, y A . The run time of the simulations is
in the range of 200 - 1000 seconds on Intel Pentium IV 2.8 GHz with 1 GB RAM
machines.
4.3 Results and discussion
In this section, the simulation results are reported and compared with the experimental
findings of Ochoa and Hatzikiriakos (2004) for pastes prepared by mixing a high
molecular weight PTFE (F-104) with 18 wt. % Isopar®. To gain a better understanding of
the structure of PTFE paste flow, typical velocity profiles at various axial location inside
the conical die (2a=90 and L/D=20) are plotted in Figure 4.7.
U) £ o o <u >
0.225
0.200
0.175, 0.050.
0.025
0.000
- 2a = 9 0 ° L /D = 2 0
z = 0 R = 4.76E-3 m z = 2E-3 R = 2.74E-3 m z = 4E-3 R = 7.54E-4 m z = 5E-3 R = 2.54E-4 m z = 7E-3 R = 2.54E-4 m z = 8E-3 R = 2.54E-4 m z = 9E-3 R = 2.54E-4 m
0.0 0.2 0.4 0.6 0.8 1.0
D i m e n s i o n l e s s R a d i a l D i s t a n c e (m)
R (mm) = 4.76
.74
0.75
z (mm) = o
1.2
Figure 4.7: Radial velocity profiles at various axial locations for conical die with entrance angle of 90°.
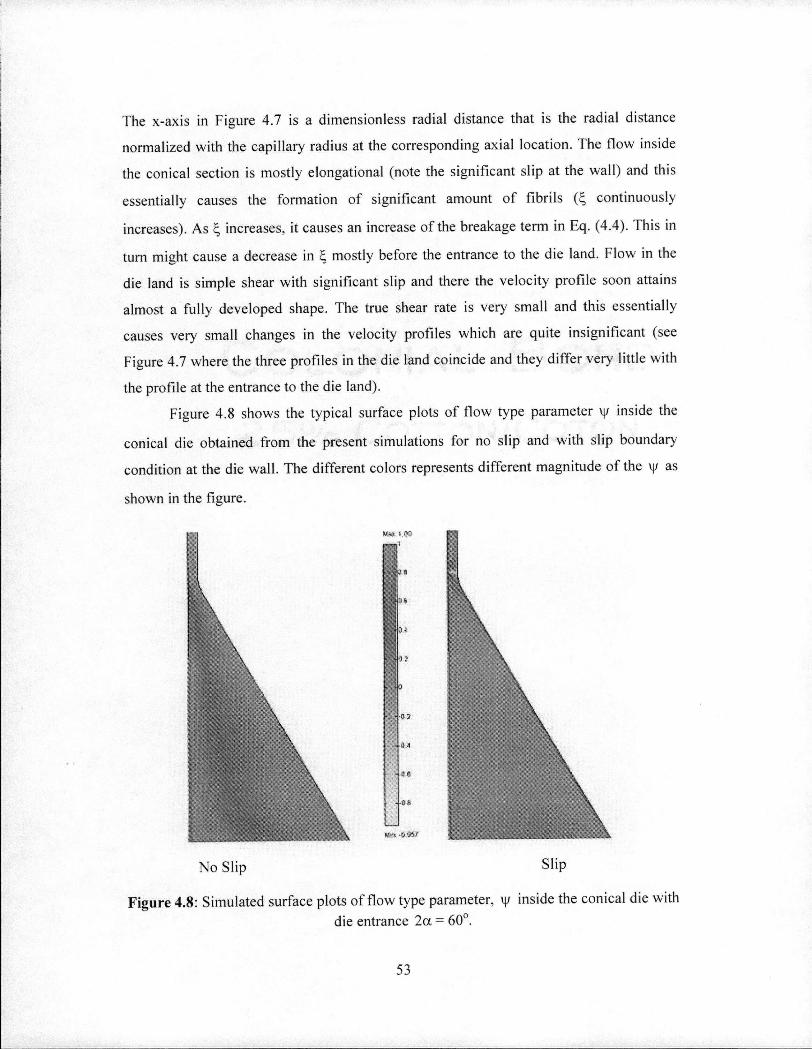
The x-axis in Figure 4.7 is a dimensionless radial distance that is the radial distance
normalized with the capillary radius at the corresponding axial location. The flow inside
the conical section is mostly elongational (note the significant slip at the wall) and this
essentially causes the formation of significant amount of fibrils continuously
increases). As 4 increases, it causes an increase of the breakage term in Eq. (4.4). This in
turn might cause a decrease in \ mostly before the entrance to the die land. Flow in the
die land is simple shear with significant slip and there the velocity profile soon attains
almost a fully developed shape. The true shear rate is very small and this essentially
causes very small changes in the velocity profiles which are quite insignificant (see
Figure 4.7 where the three profiles in the die land coincide and they differ very little with
the profile at the entrance to the die land).
Figure 4.8 shows the typical surface plots of flow type parameter / inside the
conical die obtained from the present simulations for no slip and with slip boundary
condition at the die wall. The different colors represents different magnitude of the v|/ as
shown in the figure.
w«t: t.rn
No Slip slip
Figure 4.8: Simulated surface plots of flow type parameter, inside the conical die with die entrance 2a = 60°.

The effect of the entrance angle on the evolution of fibrils has also been explored.
As will be seen later, the non-monotonic variation of the extrusion pressure with entrance
angle has been captured with the present model. All the experiments reported in this
section are for a high molecular weight PTFE (F104) resin mixed with 18 wt. % of
ISOPAR® M as lubricant (Ochoa and Hatzikiriakos, 2004).
4.3.1 Effect of Die Entrance Angle
Simulations were performed for conical dies with RR = 352 , L/D = 20 and
various entrance angles in the range of 8° < 2a < 90°. The simulated dependence of the
extrusion pressure on die entrance angle is shown in Figure 4.9. The agreement between
the predicted extrusion pressure and that obtained from the experimental analysis is very
good.
Entrance Angle (2a)
Figure 4.9: The effect of die entrance angle on the extrusion pressure: Comparison between experimental and simulation results.
The parameters of Eq. (4.3) namely, r)„, r | o i , r|; and A.,., are determined by a trial and
error method until the best fit to the experimental data results. At first simulations were
performed using parameter values chosen arbitrarily. Then depending on the difference

between the calculated and experimental values new values were chosen. This is repeated
till the best agreement between simulations and experimental values is obtained. The
values of the parameters are reported in Table 4.2.
Table 4.2: Parameters for the shear-thinning and the shear-thickening terms of Eq. (4.3).
parameters Shear-thinning Shear-thickening
r| „ (Pa s) 0 0
r| 0 (Pa s) 4000 1600
X (s"1) 0.3 1
n 0.5 1.3
It can be seen that the initial decrease in the extrusion pressure with entrance
angle is similar to the trend seen in capillary extrusion of polymer melts and other
viscous liquids. This trend can be predicted by using the lubrication approximation
assumption (Horrobin and Nedderman, 1998). However, lubrication approximation is
only valid for small entrance angles and use of this for larger entrance angles continues to
predict decrease of the extrusion pressure monotonically. In fact, the extrusion pressure
of PTFE increases significantly with increase of entrance angle beyond a certain critical
value 2a « 30° . Such a behaviour is commonly observed in the extrusion of elastic
solids (for example, see Horrobin and Nedderman (Horrobin and Nedderman, 1998) and
the references therein). At very small entrance angle PTFE paste behaves mostly as a
shear-thinning fluid with little fibrillation (small value of ) and this is captured by the
present model. The flow type parameter,;)/, for small entrance angle is also close to zero
and that ensures that the dominant contribution to the stress tensor comes from the shear-
thinning part. As the entrance angle increases, the flow becomes more extensional and
this has an impact on v|/ and subsequently on E, , with both dramatically increasing.
The paste now becomes more solidlike and this can be modelled by the shear-
thickening term included in the constitutive rheological model of Eq. (4.3). The dominant

contribution at high entrance angles comes from the shear-thickening term which causes
the significant increase in the extrusion pressure. It should be mentioned that our primary
focus in modelling the PTFE paste extrusion process was to predict correctly this trend,
that is the non-monotonic variation of extrusion pressure with entrance angle. Such an
observation was initially countertuitive and mainly comes from the gradual change of the
nature of the material from liquidlike to solidlike one.
Figure 4.10 depicts the variation of the average structural parameter at the exit,
4exit' the entrance angle. It can be seen that the model predicts an increase in the
degree of fibrillation with an increase of the entrance angle. This increase in the degree of
fibrillation can now be related to the tensile strength of the extrudates, as more fibrils are
expected to increase the dimensional stability of the extrudates (Ochoa and Hatzikiriakos,
2004).
20 40 60
Entrance angle (2a)
80 100
CL-
OT
c a> -*—' V)
0) '</) c aj
Figure 4.10: The effect of die entrance angle on the cross-sectional average structural parameter at the exit, , (from simulations) and the tensile strength of dried extrudates
(from experiments).
Figure 4.10 also plots the effect of the entrance angle on the tensile strengths of dried
extrudates reported by Ochoa and Hatzikiriakos (2004). It can be seen that the tensile
strength goes through a minimum with increase of the entrance angle. The initial decrease

of tensile strength with entrance angle is certainly countertuitive and not predicted by the
model in terms of 4e x i t • It might be related to the initial decrease of the extrusion pressure
with entrance angle. A higher pressure can mechanically lock crystallites of particle more
tightly and this facilitates fibrillation. In our model the mechanism of fibrillation does not
depend on local pressure and therefore such effects can not be predicted.
4.3.2 Effect of apparent shear rate
Simulations were performed for various apparent shear rate values for a conical die
having an entrance angle 2a - 30° and L /D = 20. The dependence of the extrusion
pressure on apparent shear rate, y A (s32Q/7iD3) is shown in Figure 4.11, where the
agreement between the experimental and simulation results is excellent.
Figure 4.11: The effect of apparent shear rate on the extrusion pressure of PTFE paste extrusion: Comparison between experimental and simulation results.
It is noted again that the same parameters have been used for all comparisons with
experimental results. The evolution of the structural parameter with apparent shear rate
contributes to the monotonic increase of the extrusion pressure. Figure 4.12 plots the

average structural parameter at the exit ^ e x j t , as a function of the apparent shear rate, y A .
The simulation predicts a very small increase in fibrillation with increase in apparent
shear rate, and this effect saturates quickly with increase in the apparent shear rate. An
increase in y A causes an increase in the structural parameter , and this in turn increases
the rate of fibril breakage which results in slower increase of £, at higher apparent shear
rate. The experimental data of tensile strength show essentially no effect of the apparent
shear rate on the tensile strength of the extruded paste (Figure 4.12).
o.ie RR j= 352:1, L/D = 20, 2a = 30° T = 35°C 0.16
0.14
0 .12
• Tensile Strength (experimetal) Structural parameter (simulation)
10
TO CL
•tt 0.10 X <D |u_P 0.08
0.06
0.04
0.02
O) 1= 0) tn 0) '</) c (U
0.00 1000 2000 3000 4000 5000 6000 7000 8000 9000
•1 Apparent Shear Rate, yA (s )
Figure 4.12: The effect of apparent shear rate on the cross-sectional average structural parameter at the exit, ^ e x i t , (from simulations) and the tensile strength of dried extrudates
(from experiments).
4.3.3 Effect of Die Reduction Ratio
Simulations were performed for dies having L /D = 20, 2a = 60° and various reduction
ratios in the range of 56 < RR < 352 . Figure 4.13 depicts the effect of die reduction ratio
on the extrusion pressure of the pastes. The agreement between the simulated and
experimental dependence of extrusion pressure on die reduction ratio is again good. The
extrusion pressure increases with the increase in the reduction ratio in a nonlinear
fashion, which is captured by the simulated results. Figure 4.14 shows that the structural

parameter at the die exit ^ e x i t increases with the reduction ratio. Experimental data show
that the tensile strength also increases with the reduction ratio initially, but reaches a
maximum at RR = 156.
Reduction Ratio
Figure 4.13: The effect of the die reduction ratio, RR, on the extrusion pressure: comparison between experimental and simulation results.
4.3.4 Effect of die length-to-diameter ratio
Simulations were performed for dies with RR = 352, 2a = 90° and several L/D ratios in
the range of 0 to 40 at the apparent shear rate of 5869 s 1 . Figure 4.15 plots the effect of
the length-to-diameter ratio of the die, L/D, on the extrusion pressure of paste. The
agreement between the simulated and experimental dependence of extrusion pressure on
the L/D ratio is excellent. The extrusion pressure increases linearly with increase of the
L/D ratio. Note that most of the resistance to flow is due to the conical zone.
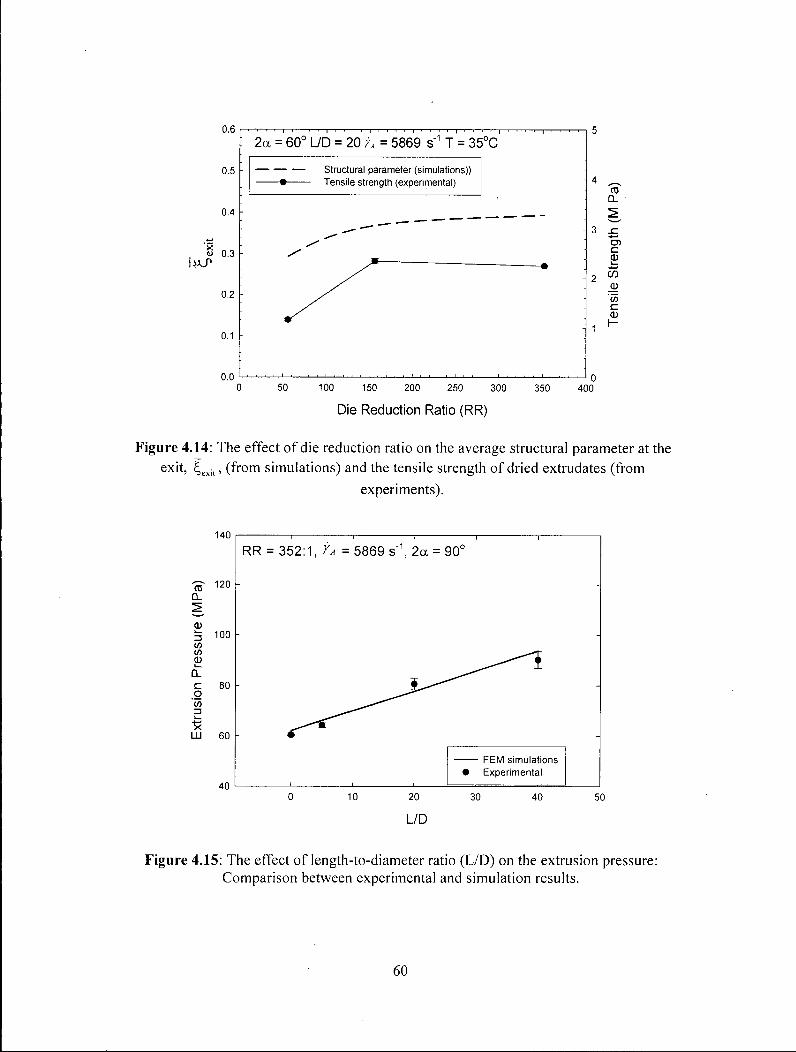
0.5
0.4
0.1
0.0
2a = 60° L/D = 20 r A = 5869 s"1 T = 35°C
, S 0.3
0 . 2 -
Structural parameter (simulations)) • Tensile strength (experimental).
50 100 150 200 250 300
Die Reduction Ratio (RR)
350 400
ro Q.
05 C d) W 0) w c CD
Figure 4.14: The effect of die reduction ratio on the average structural parameter at the exit, £,exjt, (from simulations) and the tensile strength of dried extrudates (from
experiments).
140
TO CL
C o 1— •R LLI
RR = 352:1, 7a = 5869 s"1, 2a = 90°
120 -
100
80
60
40
FEM simulations • Experimental
10 20
L/D
30 40 50
Figure 4.15: The effect of length-to-diameter ratio (L/D) on the extrusion pressure: Comparison between experimental and simulation results.

The pressure needed to extrude the polymer through the conical zone is about 60 MPa
compared to an extra of about 25 MPa needed to extrude it through the straight section of
L/D = 40 of the capillary die. The simulation results also predict an initial increase in
the magnitude of S,exit with increase in L/D ratio as shown in Figure 4.16. This effect
saturates for L / D > 10 . A similar trend is shown by the variation of the tensile strength
with L/D ratio (Ochoa and Hatzikiriakos, 2004).
2.0
Structural Parameter (simulations) Tensile strength (experimental)
1.5
S 1.0 |WJ>
2a = 90°, RR = 352:1, r A = 5869 s"1 T = 35°C
0.5
3 «
- 2 O) c a) i CO C
1 ,<»
0.0 10 20
L/D
30 40 50
Figure 4.16: The effect of die L /D ratio on average structural parameter at the exit, exit > ( f r o m simulations) and the tensile strength of dried extrudates (from experiments).
4.3.5 Structural Parameter
The structural parameter is a quantitative measure of the degree of fibrillation in
the sample during extrusion. Local axial variations of the structural parameter at various
radial locations for a die having an entrance angle of 60° are shown in Figure 4.17.
Similar trends have been seen for other conical dies having other entrance angles. The
structural parameter, , increases from 0 at the entrance of the conical die and reaches a
maximum before entering the die land. It can also be seen that once t, relaxes to a
constant level, it remains constant throughout the die land section.
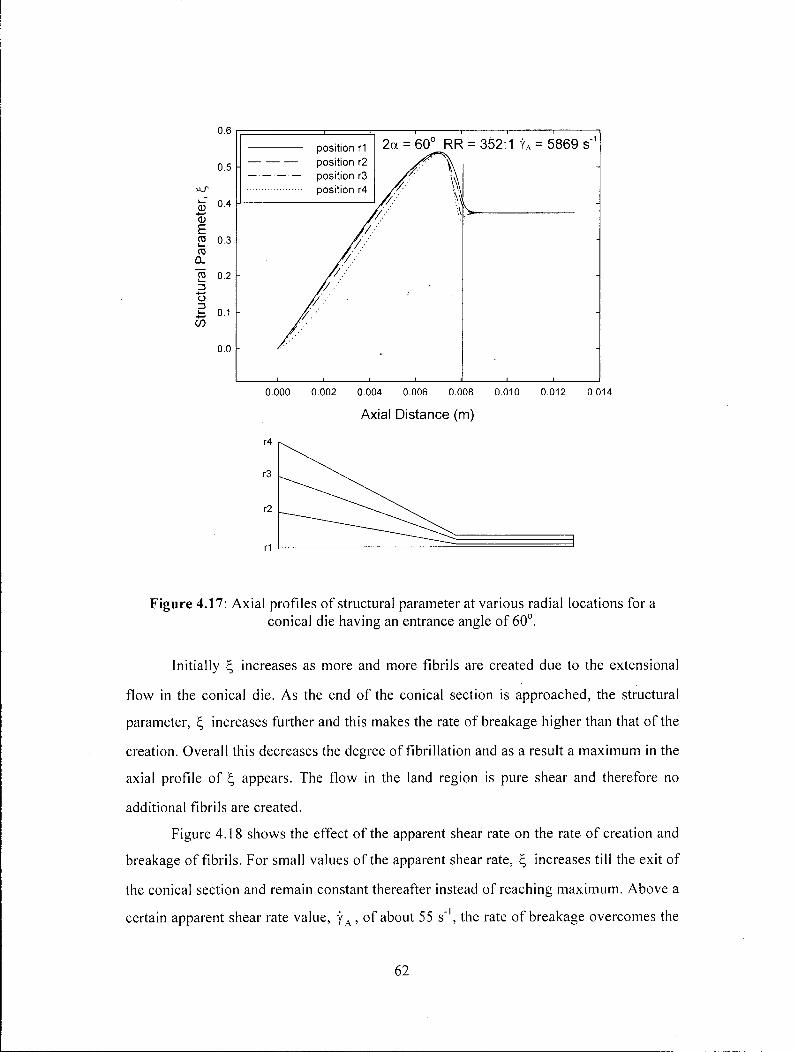
Axial Distance (m)
Figure 4.17: Axial profiles of structural parameter at various radial locations for a conical die having an entrance angle of 60°.
Initially £, increases as more and more fibrils are created due to the extensional
flow in the conical die. As the end of the conical section is approached, the structural
parameter, E, increases further and this makes the rate of breakage higher than that of the
creation. Overall this decreases the degree of fibrillation and as a result a maximum in the
axial profile of appears. The flow in the land region is pure shear and therefore no
additional fibrils are created.
Figure 4.18 shows the effect of the apparent shear rate on the rate of creation and
breakage of fibrils. For small values of the apparent shear rate, increases till the exit of
the conical section and remain constant thereafter instead of reaching maximum. Above a
certain apparent shear rate value, y A , of about 55 s"1, the rate of breakage overcomes the

rate of creation near the exit of the conical section, resulting the maximum in the axial
profile of ^ •
0) "55 E ro k_
CL 15 o i— C/5
0.000 0.002 0.004 0.006 0.008
Axial Distance (m)
0.010 0.012 0.014
center l ine
Figure 4.18: Axial profiles of structural parameter along the centerline of a conical die having an entrance angle of 60° for various apparent shear rates indicated in the figure.
Figure 4.19 shows the variation of structural parameter with axial distance along
the centerline of dies having various entrance angles. The increase in the maximum value
of structural parameter with entrance angle shows the increase in the degree of
fibrillation. The increase in the structural parameter, , with entrance angle is because of
the increase in the elongational rate. The simulation results show that the creation of
fibrils takes place inside the conical region with very little change in fibrillation in the die
land region. This is quite similar to the experimental observation by Ariawan et al.
(Ariawan, 2002; Ariawan et al., 2002b), and Ochoa and Hatzikiriakos (2004).

1.2
1.0
JJLT 0 8
a5 E ro 0.6 nj CL 2 0.4
o 2 0.2 C/)
0.0
0.00 0.02 0.04 0.06 0.08
Axial distance (m)
Figure 4.19: Axial profiles of structural parameter along the centerline of conical dies having various entrance angles.
4.4 Conclusions
In this work, finite element simulations of PTFE paste extrusion are presented in
order to predict the dependence of extrusion pressure on apparent shear rate, die
reduction ratio, die L/D ratio and die entrance angle. The rheological constitutive
equation proposed, with the total stress comprising a shear-thinning term and a shear-
thickening term, is capable of capturing the main features of the process as previously
documented by experiments (Ochoa and Hatzikiriakos, 2004; Ariawan, 2002; Ariawan et-
al., 2002b).
The PTFE paste has been treated as a shear-thinning fluid before the occurrence
of fibrillation. The fibrils gradually turn the paste to exhibit more shear-thickening
behaviour. Change in the nature of the paste from a fluidlike behaviour to a solidlike one,
is implemented by the introduction of a microscopic structural parameter, E, . An
evolution equation has been developed for based on the kinetic network theories
(Jeyaseelan and Giacomin, 1995; Liu etal., 2984; Hatzikiriakos and Vlassopoulos, 1996).
RR = 352:1 along the center line YA = 5869 s"1 2a = 8°
2a = 15° 2a = 30° 2a = 60° 2a = 90°
I i \ II ' li

The phenomena of fibril formation, evolution and breakage have been captured through
this kinetic model.
Simulation results were found to be in agreement with the experimental findings
reported by Ochoa and Hatzikiriakos (Ochoa and Hatzikiriakos, 2004). Based on this
agreement it can be concluded that the proposed constitutive equation is suitable for
modeling the behaviour of the paste. In addition, the structural parameter, E,, was related
to the tensile strength of the pastes. The predicted effects of the die geometrical
parameter and operating condition on the E, are generally in agreement with the observed
ones on the tensile strength.

4.5 Bibliography
Ariawan, A. B., S. Ebnesajjad and S.G. Hatzikiriakos, Preforming Behavior of PTFE Pastes, Powder Technology 121, 249-258 (2001).
Ariawan, A. B., Ebnesajjad, S. and Hatzikiriakos, S. G. Paste extrusion of polytetrafluoroethylene (PTFE) fine powder resins. Can. Chem. Eng. J., 80, 1153-1165 (2002a).
Ariawan, A.B., Ebnesajjad, S. and Hatzikiriakos, S. G. Properties of polytetrafluoroethylen (PTFE) paste extrudate. Polym. Eng. Sci., 42, 1247-1253 (2002b).
Ariawan, A. B. Paste Extrusion of Polytetrafluoroethylene Fine Powder resins, The University of British Columbia. Dept. of Chemical and Biological Engineering. Thesis Ph. D., 2002.
Benbow, J. J., and J. Bridgwater, Paste Flow and Extrusion, Oxford University Press, Oxford, 1993.
Bird, R. B., O. Hassager, and R. C. Armstrong, Dynamics of Polymer Liquids. Vol. 1, 2 n d
ed., John Wiley & Sons, Inc., New York, 1987.
Bird, R. B., O. Hassager, R. C. Armstrong, and C. F. Curtiss, Dynamics of Polymeric Liquids Vol. 2, Kinetic theory, John Wiley & Sons Inc., New York, 1987.
Blanchet, T.A., Polytetrafluoroethylene, Handbook of Thermoplastics, Marcel Dekker, NY, 1997.
Dealy, J. M., and K. F. Wissbrun, Melt Rheology and its Role in Plastics Processing -Theory and Applications, Van Nostrand Reinhold, New York, 1990.
Dunlap P. N., and L. G. Leal, Dilute polystyrene solutions in extensional flows birefringence and flow modification, J. Non-Newt. Fluid Mech. 23, 5-48 (1987).
Ebnesajjad Sina, Fluoroplastics, Vol 1 Non-Melt Processible Fluoroplastics, Plastic Desgin Library. William Andrew Corp, NY, 2000.
Fuller, G. G., Rallison, J. M., Schmidt, R. L. and Leal, L. G., The measurements of velocity gradients in laminar flow by homodyne light-scattering spectroscopy, J. Fluid. Mech. 100(3), 555-575 (1980).
Fuller, G. G., and Leal, L. G., Flow birefringence of dilute polymer solutions in two-dimensional flows, Rheol. Acta 19, 580-600 (1980).
Hatzikiriakos S. G., and D. Vlassopoulos, Brownian dynamics simulations of shear-thickening in dilute polymer solutions, Rheo. Acta 35, 274 - 287 (1996).

;
Horrobin, D. J., and R. M. Nedderman, Die Entry Pressure Drops in Paste Extrusion, Chem. Eng. Sci. 53, 3215-3225 (1998).
Jeyaseelan R. J., and A. J. Giacomin, Structural network theory for a filled polymer melt in large amplitude oscillatory shear, Polymer Gels and Networks 3, 1 17-133 (1995).
Laun, H. M., R. Bung, S. Hess, W. Loose, O. Hess, and P. Linder, Rheological and small angle neutron scattering investigation of shear induced particle structures of concentrated polymer dispersions submitted to plane Poiseulle and Couette flow, J. Rheol. 36(4) (1992) 743-787.
Leonov, A. I., On the rheology of filled polymers, J. Rheol. 34(7), 1039-1068 (1990).
Liu, T. Y., D. S. Soong, and M. C. Williams, Transient and steady rheology of polydisperse entangled melts: Predictions of a kinetic network model and data comparisons, J. Polym. Sci.: PI. Phys. Ed. 22, 1561-1587 (1984).
Macosko, C. S., Rheology principles, measurements, and applications, VCH publishers, Inc., New York, 244-247 (1994).
Mazur, S., Paste Extrusion of Poly(tetrafluoroehtylene) Fine Powders in Polymer Powder technology,441-481, Narks, M., Rosenzweig, N., Ed. John Wiley & Sons, 1995.
Mooney, M., Explicit Formulas for Slip and Fluidity, J. Rheol. 2, 210-222 (1931).
Ochoa, I., Hatzikiriakos, S. G. Polytetrafluoroethylene (PTFE) paste performing: Viscosity and surface tension effects. Powder Technology 146(1-2), 73-83 (2004).
Ochoa, I., Hatzikiriakos, S. G. Paste extrusion of polytetrafluoroethylene (PTFE): Surface tension and viscosity effects.. Powder Technology 153(2), 108-118 (2005).
Ochoa, I., Paste Extrusion of Polytetrafluoroethylene Fine Powder resins: The effect of the processing aid physical properties, Ph.D., The University of British Columbia. Dept. of Chemical and Biological Engineering: Thesis Ph. D., 2006.
Patil, P. D., J. J. Feng, and S. G. Hatzikiriakos, Constitutive modeling and flow simulation of polytetrafluoroethylene (PTFE) paste extrusion, J. Non-Newt. Fluid Mech. 139, 44-53 (2006a).
Sperati, C. A., Physical Constants of Fluoropolymers, Polymer Handbook, John Wiley and Sons, NY, 1989.

CHAPTER 5
Viscoelastic Modeling and Flow Simulation of
Polytetrafluoroethylene (PTFE) Paste Extrusion 2
5.1 Introduction
In the previous chapter an ad hoc constitutive equation was developed that
accounts for the increasing fibrillation through a shear-thickening viscosity. This
approach has two weaknesses: (i) the rheological consequence of fibrillation should be
elastic strain-hardening, not shear-thickening, and (ii) the parameters are treated as
adjustable to a large extent, and cannot be directly related to measured properties of the
paste. The present study aims to remove both shortcomings.
First, a viscoelastic constitutive equation based on the concept of a structural
parameter, E, is proposed. This parameter represents the mass fraction of the PTFE
material that is fibrillated and takes values of 0 and 1 for the unfibrillated and fully
fibrillated cases, respectively. The evolution of the structural parameter is described by a
first-order kinetic differential equation, which is developed based on concepts borrowed
from network theory of polymeric liquids (Bird et al., 1987; Jeyaseelan and Giacomin,
1995; Liu et al., 1984). The total stress tensor consists of a viscous part modeled by using
the shear-thinning Carreau model, and an elastic part by a modified Moony-Rivlin model.
The latter is borrowed from hyperelastic modeling of rubbers (Mooney, 1940; Rivlin,
1948a; Rivlin, 1948b; Amin et al., 2006; Selvadurai and Yu, 2006).
The model parameters in the constitutive equation are determined from
rheological measurements on the pastes with parallel-plate and extension rheometers. The
viscoelastic constitutive equation is subsequently used to simulate the flow of paste
through the conical die depicted in Figure 4.1. The finite-element results are compared
with the experimental results. In addition, the flow simulation is used to predict the
extrusion pressure as a function of the operating and die geometrical characteristics and
2 A version of this chapter will be submitted for publication. Patil, P. D., Feng, J. J., and Hatzikiriakos, S. G. (2006) Viscoelastic Modeling and Flow Simulations of Polytetrafluoroethylene (PTFE) Paste Extrusion.
to explore the relationship between the tensile strength of the extrudate and the degree of
fibrillation. In this last task, the average structural parameter at the exit, ^ e x i t , is
correlated with the experimental tensile strength for a range of the operating and die
geometrical parameters.
5.2 Theoretical model ing and numerical method
5.2.1 Governing Equations
The steady state mass and momentum conservation equations coupled with the
rheological constitutive model are solved to simulate the flow of the PTFE paste. The
axisymmetric r-z domain (Figure 4.1) has been used to perform the simulations. The
velocity field v is subject to the incompressibility constraint (volume changes due to
fibril formation are assumed to be small):
V • V = 0. [5.1]
Due to the high viscosity of the paste, the inertial terms in the momentum equation are
neglected:
V p - V - T = 0 , [5.2]
where p is the pressure and T is the stress tensor, which depends on the structural
parameter, , through a viscoelastic constitutive equation discussed below.
5.2.1.1 Constitutive Equation
The rheology of the PTFE paste depends on the formation and evolution of a network of
fibrils connecting PTFE polymer particles during the extrusion. To model this complex
flow behavior, a constitutive equation is proposed which explicitly accounts for the
evolution of fibrils. Prior work has modeled flow-induced structure formation in
concentrated suspensions, polymer solutions and filled polymers as a combination of
shear-thinning behavior at low shear rates and strain-hardening behavior at high shear
rates (Jeyaseelan and Giacomin, 1995; Dunlap and Leal, 1987). A similar concept has
been adopted in the present chapter. While the paste initially behaves as a shear-thinning
fluid, after the appearance of fibrils in its structure, it behaves more and more as a strain-

hardening fluid. Thus, it is assumed that the stress tensor consists of two contributions
coming from the unfibrillated and fibrillated domains of the paste, represented
respectively by a shear-thinning viscous stress and a strain-hardening elastic stress. The
relative significance of the two contributions depends on the structural parameter,
(Patil et al., 2006), the mass fraction of the paste of the system that is fibrillated:
T = 0 - ^ ) r l iY + [5.3]
where y is the rate of strain tensor, and r|, is a shear-thinning viscosity that is expressed
by a Carreau model (Jeyaseelan and Giacomin, 1995):
7, - Vo\L 1 + \ a \ Y ) J • [5.4]
The term Te denotes the elastic stress due to the fibrillated domains. The strain-
hardening behavior of fibrillated PTFE paste is well captured through the elastic stress
term in the present model. This is superior to the model proposed by Patil et al. (2006),
where fibrillation was modeled by a shear-thickening model.
To model the elastic stress xE , a hyperelastic model is used (Mooney, 1940;
Rivlin, 1948a; Rivlin, 1948b; Amin et al., 2006; Selvadurai and Yu, 2006). When a solid
body is subjected to a large deformation, the relationship of positions in deformed and
undeformed configurations is described by a deformation gradient tensor F whose eigen
values A,, X2 , and X3 are the stretching ratios in the principal directions. The Mooney-
Rivlin equation relates the Cauchy stress tensor t e to the Cauchy-Green strain tensor
B = F F t by:
ai, si2
where the strain energy density function, W , is a function of the strain invariants (Rivlin,
1948a; Rivlin, 1948b).
W = W ( I , , I 2 , I 3 ) [5.7]
/, = tr B
I 2=\{trBf-tr{BB)
/ 3 = detB

Since PTFE paste can be assumed to be incompressible, the value of / 3 is taken to be
unity. Thus, in a strain-invariant based incompressible hyperelasticity model, the
description of W as a function of /, and / 2 forms the basis of the approach.
Alternatively, on the basis of the Valanis-Landel hypothesis (Valanis and Landel, 1967),
W can also be expressed directly as a function of the three principal stretches, namely,
A.,, X 2, and A,3. To capture the rate dependent response of hyperplastic materials, W
should also depend on the strain rate y (Selvadurai and Yu, 2006):
W = W(y,I ],I 2), [5.7]
In the present study, we use the following form of the strain energy function:
W(I„I 2) = C,(I i-3)+C2 l n f r / y j / , - 3 ) " +C3 ln(y/y Jl, - 3)m + C,(l 2-3). [5.8]
where C,, C2, C3, C4, n, and m are material parameters, and y c is a threshold strain-
rate below which rate-dependence is absent (C 2 = C 3 = 0 for y < y c ) . Eq. (5.8) embodies
ideas from both Selvadurai and Yu (2006) and Amin et al. (2006). The power-law terms
come from Amin et al. (2006). The C2 term, with C2>0, predicts the hardening feature
observed at higher srain levels (Yamashita and Kawabata, 1992; Amin et al., 2006).
Similarly, the C3 term, with C3<0, accounts for the initial stiffness encountered in elastic
materials (Amin et al., 2002). The log-factors that incorporate rate-dependence are
borrowed from Selvadurai and Yu (2006).
Let us consider the predictions of Eq. (5.8) in steady uniaxial elongation, with
principal stretch ratio in the loading direction,' and compression in the other two
directions, with X 2 - = X~ V 2 owing to isotropy and incompressibility. Now the
deformation gradient tensor, F, and Cauchy-Green deformation tensor, B, can be written
as:

F =
X, 0
0 0
0
0 B
^ 0 0
0 ± 0 A,
0 0
'1 J I
[5.9]
i J
and the strain invariants as:
/ 2= — + 2X l A,
[5.10]
where A., = L / L 0 , L 0 is the original length of the sample and L is the length of the
deformed sample. Using Eqs (5.5) and Eq. (5.8), the expression for elongational stress
component xE M can be written as (Kawabata and Kawai, 1977; Amin et al., 2006):
x = 2 X. vdW 1 dW^
"i y Kdl, \,dl 2j [5.11]
Using Eq. (5.8), Eq. (5.11) can be written as:
C,+C 2 ln(y/yc) x = 2 f 1
V
2 12 + - 3 +
+ C3 ln(y/yc) • + A - 3 + -£± K [5.12]
By measuring the elongational stress at different elongational strain and strain rates, the
parameters C,, C 2 , C 3 , C4, m, n and yc can be determined by fitting the data to Eq.
(5.12).
5.2.1.2 Parameter Estimation
To obtain the values of the viscous parameters r |o l , n, and a , , steady shear
experiments were performed using a stress-controlled rheometer equipped with parallel
plates (C-VOR Bohlin). The samples were prepared using various PTFE resins (listed in
Table 5.1) and lubricant (Isopar® M). The physical properties of various PTFE resins and

isoparaffinic lubricant (ISOPAR® M) are listed in Table 5.1 and Table 4.1 respectively.
The paste was first compacted and shaped into discs before loaded onto the rheometer.
Sand paper was glued onto the plates to suppress slippage. The experiments were done at
two different gap sizes of 1.0 mm and 2.1 mm at room temperature with the stress value
ranging from 100 to 4000 Pa.
Table 5.1: Physical properties of PTFE fine powder resin studied in this work as provided by the supplier.
Resin Type Particle
Diameter (fim)
Specific Gravity
F104 HMW Homopolymer 400-650 2.17-2.20 F104 LMW Homopolymer 400-650 2.16-2.18
F301 Modified 400-650 2.15-2.18 F303 Modified 400-700 2.14-2.16
Figure 5.1 plots the viscosity versus stress for two different gap sizes. By using
sand paper, no slip occurs at low shear stress values. However, at higher stress values
significant slip was observed. Assuming that the slip velocity depends only on the shear
stress ct„, , Yoshimura and Prud'Homme (1998) suggested the following relation for
correcting the strain rate and viscosity:
t > J = g | U f f - ) ' " l U < 0 . [5.13] H\~ H2
and
n f r V t 5 - 1 4 ]
where yR is the corrected shear rate, and y ttX and y t t 2 are the apparent shear rates
corresponding to gap sizes of H l and H 2 respectively. Figure 5.2 plots the corrected
viscosity as a function of the corrected shear rate. These data are used to determine the
viscous parameters in Eq. (5.4). The best-fit parameters are listed in Table 5.2, and the
corresponding viscosity function is also plotted in Figure 5.2.

107
106
105
104
103
F104 HMW
Gap size
H, = 2.1 E-3 m
101 102 103 104
Stress, a (Pa)
Figure 5.1: Plot of apparent viscosity vs stress obtained from controlled stress experiments for two different gap sizes.
107
106
0 105
10"
F104 HMW
• •
10-6 10"5 10-4 10'3 10-2 10-1 10° 101 102 103 104
Shear Rate, n (s"1)
re 5.2: Corrected viscosity vs. shear rate obtained from Eq. (5) and solid line shows the curve fitting by using Carreau model.

Table 5.2: Parameters for the shear-thinning terms of Eq. (4.3) (F104 HMW).
parameters Shear-thinning
ti 0 (Pa s) 2.73 x 10⁶
a , (s"1) 38.13
n 0.52
To determine the parameters of the proposed hypereiastic model, Eq. (5.12) can
be fitted to measured elongational properties of extruded PTFE paste (Ochoa, 2006). The
uniaxial extension experiments are performed on four different pastes with F104 HMW-
Isopar® M, F104 LMW-Isopar® M, F301-Isopar® M and F303-Isopar® M at 18 wt. % of
lubricant. The samples were prepared by extruding the pastes through a slit die (for more
details see Ochoa, 2006). The extruded samples are assumed to be fully fibrillated
Thus, subsequent measurements concern only the elastic term t e in Eq. (5.3).
The prepared rectangular samples were loaded onto the Sentmanat Extensional
Rheometer (SER) attached to a strain controlled rheometer (Sentmanat, 2003). The
samples were thus stretched at constant Hencky strain rates in the range of 0.00113 s"1 to
1.13 s"1. The fitted value of yc is found to be roughly the same for all four PTFE resins,
that is 1.36 x 10 -5 s"1. Table 5.3 lists the parameter values determined for the four pastes.
The experimental observations and predictions are plotted in Figures 5.3-5.6. Figures 5.3-
5.6 show the fitting of the transient tensile stress by Eq. (5.12) for two samples stretched
at different strain rates. For F104HMW, Eq. (5.12) fits the data reasonably well. Resin
F303 (co-polymer) displays a lower extensibility compared to the homopolymer
F104HMW and the model is not able to predict the extensional behavior well (Figure
5.6). Overall, it can be said that the model works reasonably well and is useful. These
parameters are used in the numerical simulations of PTFE paste flow by using finite
element method as discussed later in this chapter.

Table 5.3: Material parameters for PTFE samples subjected to different Hencky strain rate.
Resin c, c2 N c3 c4 M
F104 HMW
7.66 2.56 8.1x10"' -9.98 4.4 1.35x10"'
F104 LMW
1.23x10' 4.8 1.1 -1.17x10' 7.22 8.7 xlO"2
F301 8.1 1.88x10' 6.9x10"' ' - 7 . 3 3.66 5.2 xlO"2
F303 1.4 xlO"2 2.5x10' 2.6x10"' -1.41x10' 3.8x10"' 2.3x10"'
Figure 5.3: Uniaxial extension of F104 HMW samples stretched at different Hencky strain rates (lines show the fits of Eq. (5.12)).

25
20
F104 LMW 'Henky strain rate, t H (s"1)
TO Q.
b 15 10 (/> <u CO _cl> in c 0)
10
• 0.00113 o 0.0113 • 0.113 A 1.13
2 3 4
Extensional Ratio, = L/L0
Figure 5.4: Uniaxial extension of F104 LMW samples stretched at different Hencky strain rates (lines show the fits of Eq. (5.12)).
20
Q-| b <n (/) (U •4—'
CO 0) W3 C (U
F301
Henky strain rate, e„ (s"1)
15 - • 0.00113 o 0.0113 T 0.113 A 1.13
2 3 4
Extensional Ratio, = L/L0
Figure 5.5: Uniaxial extension of F301 samples stretched at different Hencky strain rates (lines show the fits of Eq. (5.12)).

10
CTJ CL
(/) Ul (1) CO o> 03 C 0)
F303 Henky strain rate, eH (s )
• 0.00113 o 0.0113 • 0.113
A 1.13
0.8 1.0 1.2 1.4 1.6 1.8 2.0
Extensional Ratio, - L/L0
Figure 5.6: Uniaxial extension of F303 samples stretched at different Hencky strain rates (lines show the fits of Eq. (5.12)).
5.2.1.3 Structural Parameter
The kinetic model for the structural parameter, E, , previously proposed by Patil et
al. (2006) is also used here. The variation of E,, the mass fraction of fibrillated paste,
along a streamlines as determined by the rates of fibril creation and breakage can be
written as:
where a and P are dimensionless rate constants, v|/ is the flow type parameter and y is
the magnitude of the strain rate tensor. The first and second term on the right hand side of
Eq. (4.4) denote the rate of creation and breakage of fibrils in the paste, respectively.
With E, = 0 at the inlet of the die, E, is subsequently bounded between 0 and 1 if a/p < 1.
In this study, both rate constants a and P have been assigned the value of 1. The
creation and evolution of fibrils is due to elongational flow (Ariawan et al., 2002a; Patil
et al., 2006), and this is reflected by making the rate of creation to depend on the flow
type parameter, vj/. This indicates the relative strength of straining and rotation in a

mixed flow (Dunlap and Leal, 1987; Fuller et al., 1980; Fuller and Leal, 1980). More
details about this model can be found in Patil etal. (2006).
5.2.2 Boundary Conditions
For the various boundary segments in the geometry shown in Figure 4.1 the following
boundary conditions are used:
(i) Inlet boundary conditions (z = 0): The fully developed velocity profile for a shear-
thinning Carreau fluid model has been imposed at the inlet with radial velocity V r = 0 .
The paste is completely unfibrillated at this point: £, = 0. Assume the paste to be in an
underformed state. In addition, the initial strain is set to zero:
F = 1 0 0 0 1 0 0 0 1
The strain of the upstream shear is neglected relative to the much stronger deformation
downstream in the die.
(ii) Outlet boundary conditions: The normal stress boundary condition and zero radial
velocity are imposed:
n • ( - pi + x)n = - p 0 ; v;. = 0 .
(iii) Slip boundary condition at the die wall: The Navier slip condition has been used at
the die wall, which relates slip velocity with the wall shear stress, <yH,:
v s = C a w ,
where C = 1.92 m/M Pa s as determined from experimental data by Patil et al. (2006).
(iv) The axisymmetric boundary condition is used at r = 0:
v r = 0 , dvjdr = 0 .
5.2.3 Finite Element Method
The equation of motion coupled with the proposed viscoelastic constitutive and structural
parameter models were solved using the commercial finite element (FE) code FEMLAB
3.2 with user-defined MATLAB routines for calculating the strain history of the material
and the viscoelastic stress tensor. As the problem considered here is axisymmetric, two-

dimensional meshes are used on the computational domain (Patil et al., 2006). These
unstructured meshes comprise triangular elements of widely varying sizes, small and
large elements being employed in regions where the rates of strain were large and small,
respectively. The smallest elements are required near the die corners, especially the re-
entrant corner. The total number of elements used are in the range of 3000 to 10000. The
corners are also rounded slightly to avoid geometrical singularity, and the local element
size is chosen to be smaller than the fillet radius at the corner. The fillet radius is a small
portion of the capillary radius, and thus the solution is expected to be slightly affected by
the corner rounding.
Finite element simulations for viscoelastic flows have been performed by many
groups (Crochet et al., 1984; Owens and Phillips, 2002), using both differential and
integral types, of constitutive equations. In particular, Olley and Coates (1997) and Olley
et al. (1999) described FE methods with 'streamline upwinding' elements for the K-BKZ
model with strain and time damping components introduced by Papanastasiou et al.
(1993). Since our constitutive model is based on the nonlinear strain tensor, time-
integration along the streamlines is essential, and an approach similar to that of Olley et
al. (1999) has been adopted.
Since the problem is time independent, the solution involves iterations among the
velocity field, the strain field, and the stress field. First, a Newtonian flow field is
generated, subject to the proper boundary conditions. This trial flow field is used in two
ways. On one hand, the kinetic equation for the structural parameter t, is solved to obtain
a distribution of throughout the simulation domain. This will be required in the
viscoelastic constitutive equations [Eq. (5.3)] for stress computation. On the other hand,
pathlines are computed based on this trial flow field to track the time history of fluid
particles along them. Elastic stress at a point is computed by tracing back the particle path
to calculate the deformation gradient tensor from which the Cauchy-Green strain
tensor B(t,t') can be calculated. These quantities with parameters listed in Table 5.3 for
resin F104 HMW are used to evaluate the elastic stress at that point as per Eq. (5.5) and
(5.8). Once these elastic stresses are computed, the total stress components are obtained
by using Eq. (5.3) and (5.4) and incorporated into the FEMLAB flow solution as a body
force [Olley et al. (1999)]; from this a new flow solution is obtained using the FEMLAB

finite element solver. This new flow solution is then used as the new trial flow field, and
the above procedure is repeated. Convergence is reached when the fractional velocity
change between successive iterations is below a certain threshold (10~5) over all nodes.
5.2.3.1 Particle Tracking
The stresses according to Eq. (5.3), (5.6) and (5.11) require the positional history
of a particle. For a steady flow this can be achieved by an incremental procedure (Luo
and Mitsoulis, 1990; Bernstein et al., 1994; Olley and Coates, 1997; and Olley et al.,
1999):
dt i2 f 2
dt
dv r dv r r(t-t') = r(t)-v rdt' + ^ - + , [5.15] \ or oz J
>2 r a.. a.. , ( , - , ' ) = + + , [5.16]
2 \ or oz J
where dt' is a step in time, and v r and v z are velocity components in the r and z
direction, respectively. After each time step, a new position is reached. The current
element is ascertained by finding an element for which certain conditions are true. If no
element is found, such as when the particle is tracked back to the inlet, the particle is
placed on the boundary of its last known element at the nearest point. Once found, the
interpolation functions for that element are used to determine the tensor elements of the
velocity gradient tensor, L(/'). The pathlines are calculated using second order time
integration as described by Olley et al. (1999). Then the deformation gradient tensor,
F(/,/'), is computed by integrating the following equation along the pathlines:
^ = [5-17] dt
using a fourth-order Runge-Kutta method. L(t') is the velocity gradient tensor
experienced by a fluid particle as it traverses the pathline. Given F at a relative time,
/ - / ' , t h e strain tensor B(t,t') is calculated using the Eq. (5.5).

L(,') =
^ 0 dr 0 ^
dr
r 0
0
av, dz
[5.18]
5.2.3.2 Incorporating computed stresses into flow solution
The stress distribution is stored in a file in a format suitable for the FEMLAB software to
read. The values of all the variables at integrations points are obtained by interpolating
variables at nodal points. The subroutine also has a code to determine which triangular
element an integration point is in, and then interpolate the nodal values to the integration
point.
The direct method is used to achieve velocity field adjustment. In this method the
updated velocities and pressures are calculated within the finite element solver
(FEMLAB) (Olley et al., 1999). In this method the body forces that are required can be
determined by comparing the equations that the CFD package solves, and the equations
that are required to be solved. The steady state solution must obey V • a = 0 (neglecting
body forces and momentum). In case of axisymmetric Newtonian flow problem the
FEMLAB software solve the equations:
l_d_ r dr
2 rji, a ^ dr
•P +•
d ( n av dz dz
dz
l_d_ r dr
V v
av r dv. — + \\
dz dr + F =0
J J
He av r av, — l + — -dz dr
\\
+ F=0
[5.19]
[5.20] J)
where p,0 =cor|0 l , where co is the relaxation parameter and r |0 l is the zero shear rate
viscosity, is the constant viscosity value provided to the code. The values of body-force
that the package must be provided with for axisymmetric flow comes from equations:
r dr
dz
<K dr
100 r
f + -dz •Mi
+ -dr rxrz -rfi,
v
av ^
dv r av7 —'- + —-dz dr
\ \
J)
dr dz J J
[5.21]
[5.22]

The value of relaxation parameter was chosen to be 3, the reason behind selecting this
value is that the convergence becomes independent of co. The aim behind using higher
viscosity value is to increase the Newtonian stresses to be of the same order of magnitude
as the obtained viscoelastic stresses (Viriyayuthakorn and Caswell, 1980).
Nodal values for all terms in the Eqs. (5.19)-(5.22) can be deduced by
differentiating the nodal values for viscoelastic stresses, structural parameter, velocity,
and velocity gradient. Along the centerline, many of the terms in the equations for body
forces become indeterminate. The limiting value assessed at a small distance away from
the centerline is used.
A map of these variables is stored in a file, so that it will be available to the
package. This allows the package to incorporate these values as body forces in the next
stake's flow solution. The resulting solution is a solution of Eq. (5.19) and (5.22) for the
current state of stresses. This solution is then used to re-compute the stresses according to
Eq. (5.3), and an iterative procedure continues until convergence.
To validate our code, the same contraction flow of LDPE as reported by Olley et
al. (1999) has been simulated. The K-BKZ model with strain damping function given by
Papanastasiou et al. (1983) is solved for simulating the flow of LDPE melt through an
abrupt 4:1 contraction. The two results are in excellent agreement. In particular, the
growth of the corner vortex size with increasing apparent shear rate was successfully
captured. This is illustrated in Figure 5.7 by plotting the vortex intensity against stress
ratio. The vortex intensity v|/ in given by:
where v|/M, is the stream function value at the wall and v|J c/ is the stream function value at
the centerline of the channel. v|/ is the stream function value at the center of the vortex.
The stress ratio S r is the ratio of normal stress to shear stress on the donwstream tube
wall of the 4:1 contraction. The difference between the two solutions is below 6.8 %.
The convergence of the simulation results with respect to number of elements was
also confirmed. When doubling the number of mesh elements from 3000 to 6000, the
difference in the velocity is below 3 % throughout the simulation domain. The run time

of the simulations was in the range of 1500 - 2500 seconds on Intel Pentium IV machines
(2.8 GHz) with 1 GB RAM.
nO
£ c 0)
-4—'
c
o > <1> >
<D DC
Stress Ratio, SR
Figure 5.7: Comparison between vortex intensities obtained in current work, and those obtained by Olley et al. (1999), for axisymmetric flow of LDPE through a 4:1 abrupt
contraction.
5.3 Results and discussion
In this section, the simulations are carried out for different flow rates and for
various die design parameters, namely the die reduction ratio, RR = Dj; / D 2 , the die land
length to diameter ratio, L / D , and die entrance angle, 2 a . The simulation results are
compared with the experimental findings reported by Ochoa and Hatzikiriakos (2004) for
pastes prepared by mixing a high molecular weight PTFE (F104HMW) with 18 wt. %
Isopar® M. Comparisons are also done with the predictions of the shear-thinning and
shear-thickening (STT) model proposed by Patil et al. (2006).
To gain a better understanding of the structure of PTFE paste flow, typical
velocity profiles at various axial locations inside the conical die (2a=90 and L/D=20) are
plotted in Figure 5.8 and 5.9. The x-axis in Figures 5.8 and 5.9 is the dimensionless radial
distance normalized by the die radius at the corresponding axial location. The flow inside

the conical section is mostly elongational (note the significant slip at the wall) and this
causes significant fibrillation (discussed below). The two velocity profiles for the two
models in the die land coincide with each other (Figure 5.9). Flow in the die land is
simple shear with significant slip and there the velocity profiles soon attain fully
developed shape. The behavior of structural parameter, E, , with operating and
geometrical parameters is discussed in the section below, followed by the comparison of
the simulations results with experimental observations.
0.04
0.03
0.02 E
/ o o <v >
0.00
2a = 90° L/D = 20 z = 0 R = 4.76E-3 m z = 2E-3 R = 2.74E-3 z = 4E-3 R = 7.54E-4 m
0.0 0.2 0.4 0.6 0.8
Dimensionless radial distance R (mm) = 4.76
z (mm) = o 2
1.0 1.2
Figure 5.8: Radial velocity profiles at various axial locations for a conical die having an entrance angle of 90°. Thick and thin lines denote the velocity profiles from
viscoelastic and STT models respectively (y A = 5869 s"').

w E
0.194
0.192
0.190
0.188
o 0.186
> 0.184
0.182
0.180 0.0 0.2 0.4 0.6 0.8 1.0
Dimensionless radial distance R (mm) = 4.76
1.2
0.25 0.25
z (mm) = o
Figure 5.9: Radial velocity profiles at various axial locations inside the die land for a conical die having an entrance angle of 90°. Thick and thin lines denote the velocity profiles from viscoelastic and STT model respectively (y A = 5869 s"1).
5.3.1 Structural Parameter
The structural parameter is a quantitative measure of the degree of fibrillation in
the sample during extrusion. Local axial variations of the structural parameter at various
radial locations for a die having an entrance angle of 60° are shown in Figure 5.10.
Similar trends have been seen for other conical dies having other entrance angles. The
structural parameter, 4 , increases from 0 at the entrance of the conical die and reaches a
maximum before entering the die land. The E, relaxes rapidly upon entering the die land
and remains constant further downstream. The viscoelastic model predicts a markedly

lower structural parameter than the STT model. This is probably a result of the
viscoelastic stresses suppressing the elongational flow in the contraction.
Axial Distance (m)
Figure. 5.10: Axial profiles of structural parameter at various radial locations for a conical die having an entrance angle of 60°: thin and thick lines show the structural
parameter values from STT and viscoelastic models respectively.
The axial profiles of the structural parameter, depicted in Figure 5.10 can be
explained as follows: initially increases as more and more fibrils are created due to the
extensional flow in the conical region of the die. As the end of the conical section is
approached the structural parameter, E, , makes the rate of breakage higher than that of the
creation. Overall, this decreases the degree of fibrillation and as a result a maximum in

the axial profile of E, appears. The flow in the land region is simple shear with significant
slip at the wall (see velocity profiles in Figure 5.9) and therefore no additional fibrils are
created. Furthermore, due to significant slip at the wall, the true shear rate is small; this
causes the breakage rate to become negligible; thus E, in the land region remains
essentially constant.
Figure 5.11 shows the effect of the apparent shear rate y A 32Q!nD]) on the
structural parameter (degree of fibrillation) predicted by the STT and viscoelastic models.
Again predicted profiles from the two models are qualitatively similar. For small values
of the apparent shear rate, E, increases till the exit of the conical section and remain
constant thereafter instead of reaching maximum. Above a certain apparent shear rate
value, y A , of about 55 s"1, the rate of breakage overcomes the rate of creation near the
exit of the conical section, resulting the maximum in the axial profile of E,.
Y A S " 1
Axial Distance (m)
Figure 5.11: Axial profiles of structural parameter along the centerline of a conical die having an entrance angle of 60° for various apparent shear rates indicated in
the figure: thin and thick lines show the structural parameter values from STT and viscoelastic models respectively.

Figure 5.12 shows the variation of structural parameter with axial distance along
the centerline of dies having various entrance angles. The comparison between the
variation of S, along the centerline from the viscoelastic simulation and from the STT
simulation is shown again. Viscoelastic simulations predict in general lower values of E,
for all entrance angles compared to those of the STT model. The increase in the structural
parameter, 2, , with increase of the entrance angle is due to the increase in the
elongational rate. The simulation results also show that the creation of fibrils takes place
inside the conical region with negligible change in fibrillation in the die land region. This
agrees with the experimental observation by Ariawan (2002), Ariawan et al. (2002a), and
Ochoa and Hatzikiriakos (2004).
1.2
1.0
CD
0) 2 0.6 CD
CL
TO 0.4
o 2 0.2 to
o.o
:RR = 352:1 along the center line • YA = 5869 s"1
• 1 1 ) 1 1 1 1
2a
I
: I 8° 15° 30° 6 0 °
8°
1 1 1 15° 30° 60° 90° f
- 1 l i
15° 30° 60° 90°
it . i — i i v^x
i i . . .
0.00 0.02 0.04 0.06 0.08
Axial distance (m)
Figure 5.12: Axial profiles of structural parameter along the centerline of conical dies having various entrance angles. Thin and thick lines show the structural parameter values
from STT and viscoelastic models respectively.
5.3.2 Effect of Die Entrance Angle
Simulations were performed for conical dies having RR = 352, L/D = 20 and various
entrance angles in the range of 8° < 2a < 90° . The simulated dependence of the
extrusion pressure on die entrance angle is shown in Figure 5.13. Figure 5.13 also shows

the comparison between the fitting from STT model (Patil et al., 2006) and the
predictions from proposed viscoelastic constitutive model. The agreement between the
predicted extrusion pressure and that obtained from the experimental analysis is overall
good. The STT model represents a better fit to the experimental data in Figure 5.13 and in
most other cases that will be presented below. However, it is noted that the parameters of
the STT model were fitted to extrusion experimental results, while the viscoelastic model
is a truly predictive one (its parameters were fitted to rheological data).
Entrance Angle, 2a
Figure 5.13: The effect of die entrance angle on the extrusion pressure: Comparison between experimental results, predictions from STT and viscoelastic model.
The initial decrease in the extrusion pressure with entrance angle in Figure 5.13 is
similar to the trend seen in capillary extrusion of polymer melts and other viscous liquids.
This trend can be predicted by using the lubrication approximation assumption (Horrobin
and Nedderman, 1998; Selvadurai and Yu, 2006). However, lubrication approximation is
only valid for small entrance angles and use of this for larger entrance angles continues to
predict decrease of the extrusion pressure monotonically. In fact, the extrusion pressure
of PTFE increases significantly with increase of entrance angle beyond a certain value

2a « 30°. Such a behaviour is commonly observed in the extrusion of elastic solids (for
example, see Horrobin and Nedderman (1998) and the references therein).
At very small entrance angles PTFE paste behaves mostly as a shear-thinning fluid
with little fibrillation (small value of ) and this is captured by the present model. The
flow type parameter, \|/, for small entrance angle is also close to zero and that ensures that
the dominant contribution to the stress tensor comes from the shear-thinning part. As the
entrance angle increases, the flow becomes more extensional and this has an impact on
\|/ and subsequently on (both dramatically increasing). The paste now becomes more
solidlike and this can be modelled by the elastic strain-hardening term included in the
constitutive rheological model of Eq. (5.3). The dominant contribution at high entrance
angles comes from the strain-hardening term, which causes the significant increase in the
extrusion pressure.
It should be mentioned that our primary focus in modelling the PTFE paste extrusion
process was to develop a truly predictive model. As already discussed above, the
comparison below between STT and viscoelastic models with experimental results, STT
model calculations are closer to experiment simply because its parameters are best fitted
to the available PTFE processing data. On the other hand, the parameters of the
viscoelastic model are all determined from independent rheological experiments and this
makes the model a truly predictive one.
Figure 5.14 depicts the variation of the average structural parameter at the exit, ^ e x j l ,
with the entrance angle. The model predicts increase of the degree of fibrillation with
increase of the entrance angle. This increase in the degree of fibrillation can now be
related to the tensile strength of the extrudates, as more fibrils are expected to increase
the dimensional stability of the extrudates (Ochoa and Hatzikiriakos, 2004). Figure 5.14
also plots the effect of the entrance angle on the tensile strengths of dried extrudates
reported by Ochoa and Hatzikiriakos (2004). The experimental tensile strength goes
through a minimum with increase of the entrance angle. This countertuitive behavior of
tensile strength with entrance angle is discussed in the previous chapter.

1.0
0.6
*
IjjlP 0 4
0.2
0.0
- 0 . 2
CO CL
a) 3 Q)
Q)
c (D
20 40 60
Entrance angle (2a)
80 100
Figure 5.14: The effect of die entrance angle on the cross-sectional average structural parameter at the exit, ^ e x i t , (from Viscoelastic and STT simulations) and the
tensile strength of dried extrudates (from experiments).
5.3.3 Effect of Apparent Shear Rate
Simulations were performed for various apparent shear rate values for a conical die
having an entrance angle 2a = 30° and L/D -20. The dependence of the extrusion
pressure on apparent shear rate, j A is shown in Figure 5.15, where the agreement
between the experimental and simulation results is very good. The viscoelastic model
predicts a higher extrusion pressure compared to that of STT model. The evolution of the
structural parameter with apparent shear rate contributes to the monotonic increase of the
extrusion pressure.
Figure 5.16 plots the average structural parameter at the exit ^ e x i t obtained from
the viscoelastic and STT models, as a function of the apparent shear rate, y A . The
simulations predict a small increase in fibrillation with increase in apparent shear rate,
and this effect saturates quickly. The experimental data of tensile strength show
essentially no effect of the apparent shear rate on the tensile strength of the extruded
paste (Figure 5.16).

70
CO Q- 60
0 CO £ 50
L/D = 20 2a = 30° RR = 352:1
•s LU
40 • Experimental: Isopar M
Viscoelastic simulations STT model
30 2000 4000 6000 8000
Apparanet Shear Rate, yA(s )
Figure 5.15: The effect of apparent shear rate on the extrusion pressure of PTFE paste extrusion: Comparison between experimental and simulation results from viscoelastic
and STT model.
0.16 RR = 352:1, LVD = 20, 2a = 30°
0.14
0.12
0.10
0.08
0.06
0.04
0.02
Tensile Strength Viscoelastic model STT model
10
0 1000 2000 3000 4000 5000 6000 7000 8000 9000
CO CL
O) c CD i CO 0) w c CD
1 Apparent Shear Rate, yA (s )
Figure 5.16: The effect of apparent shear rate on the cross-sectional average structural parameter at the exit, ^ e x i t , (from viscoelastic and STT simulations) and the tensile
strength of dried extrudates (from experiments).

5.3.4 Effect of Die Reduction Ratio
Simulations were performed for dies having L / D = 20, 2a = 60° and various reduction
ratios in the range of 56 < RR < 352. Figure 5.17 depicts the effect of die reduction ratio
on the extrusion pressure of the pastes. The agreement between the simulated and
experimental dependence of extrusion pressure on die reduction ratio is excellent. The
extrusion pressure increases with increase in the reduction ratio in a nonlinear fashion,
which is captured by the simulated results.
Reduction Ratio
Figure 5.17: The effect of the die reduction ratio, RR, on the extrusion pressure: comparison between experimental and simulation results from viscoelastic and STT
model.
Figure 5.18 shows that the tensile strength increases with the reduction ratio and
reaches a maximum at RR = 156 . The viscoelastic and STT simulations show a
continuous increase in H,exit.
5.3.5 Effect of Die Length-to-Diameter Ratio
Simulations were performed for dies with RR = 352 , 2a = 90° and several L/D ratios in
the range of 0 to 40 at the apparent shear rate of 5869 s"1. Figure 5.19 plots the effect of
the length-to-diameter ratio of the die, L/D, on the extrusion pressure of paste. The

agreement between the simulated and experimental dependence of extrusion pressure on
the L /D ratio is reasonable.
0.6
0.5
0.4
, a 0.3 IJJLP
0 . 2
0.1
0 .0
2a = 60° L/D = 20 f A = 5869 s 1
Viscoelastic model STT model
• Tensile strength
50 100 150 200 250 300 350 400
Die Reduction Ratio (RR)
D.
O) c a) s
w O) U> c 0
Figure 5.18: The effect of die reduction ratio on the average structural parameter at the exit, £,exjt, (from STT and viscoelastic simulations) and the tensile strength of dried
extrudates (from experiments).
140
ro 120 CL
c o '</> 3
100
80
LU 60
40
RR = 352:1 2a = 90° YA = 5869 s"1 I i i . i i 1 i ' i i
• Experimental: Isopar® M Viscoelastic model STT model
Experimental: Isopar® M Viscoelastic model STT model
10 20 30
L/D ratio 40 50
Figure 5.19: The effect of length-to-diameter ratio (L/D) on the extrusion pressure: Comparison between experimental and simulation results from viscoelastic and STT
model (Patil et al., 2006).
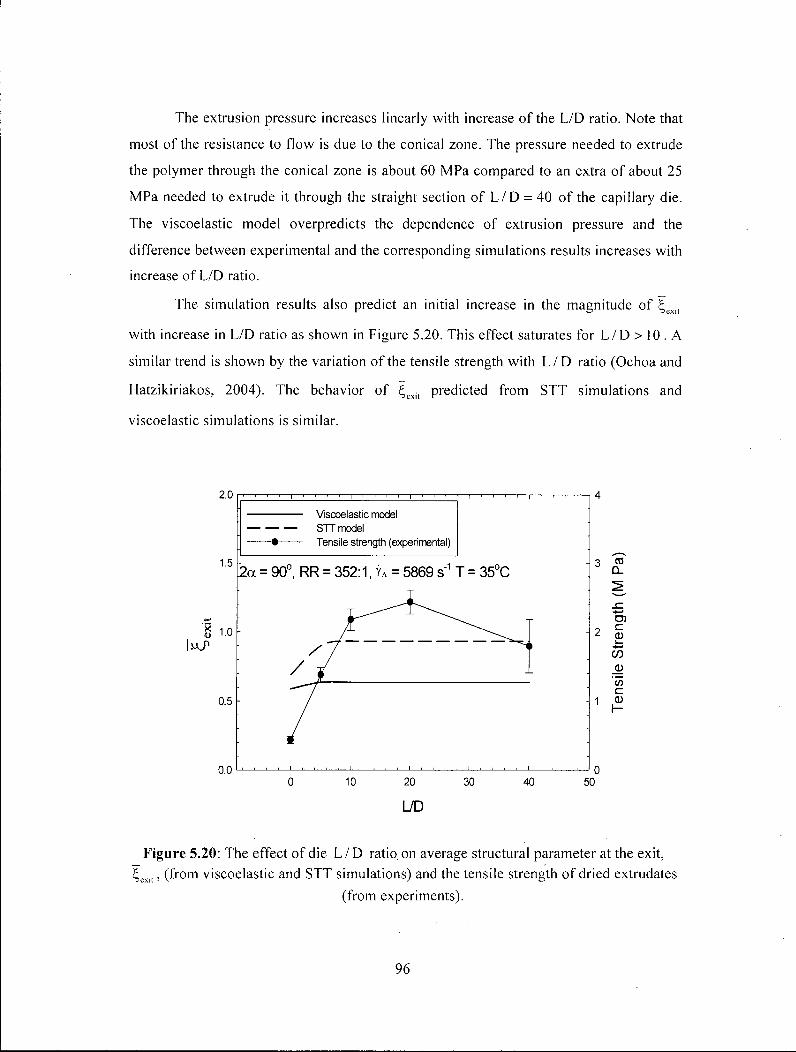
The extrusion pressure increases linearly with increase of the L/D ratio. Note that
most of the resistance to flow is due to the conical zone. The pressure needed to extrude
the polymer through the conical zone is about 60 MPa compared to an extra of about 25
MPa needed to extrude it through the straight section of L /D = 40 of the capillary die.
The viscoelastic model overpredicts the dependence of extrusion pressure and the
difference between experimental and the corresponding simulations results increases with
increase of L/D ratio.
The simulation results also predict an initial increase in the magnitude of
with increase in L/D ratio as shown in Figure 5.20. This effect saturates for L /D > 10 . A
similar trend is shown by the variation of the tensile strength with L / D ratio (Ochoa and
Hatzikiriakos, 2004). The behavior of E,exit predicted from STT simulations and
viscoelastic simulations is similar.
2.0
Viscoelastic model STT model
• Tensile strength (experimental)
1-5 -2a = 90°, RR = 352:1, YA = 5869 s"1 T = 35°C J CL
lu/1
0.5 -
CD 2 <D
C/D
'</> c 1 <D
0.0 10 20
LVD
30 40 50
Figure 5.20: The effect of die L /D ratio, on average structural parameter at the exit, E,exjt, (from viscoelastic and STT simulations) and the tensile strength of dried extrudates
(from experiments).

5.4 Conclusions
A viscoelastic rheological constitutive equation proposed for the paste extrusion
of PTFE, with the total stress comprising a shear-thinning term and a strain-hardening
term, is capable of capturing the physics of the process as previously documented by
experiments (Ochoa and Hatzikiriakos, 2004; Ariawan, 2002; Ariawan et al., 2002a;
Ochoa, 2006). The PTFE paste has been treated as a shear-thinning fluid in the absence
of fibrillation. The creation of fibrils gradually turns the paste to exhibit more strain-
hardening behaviour, and this elastic behaviour is captured through a hyperelastic
modified Mooney-Rivlin model. Change in the nature of the paste from a fluidlike (shear-
thinning) behaviour to a solidlike (strain-hardening) one, is implemented by the
introduction of a microscopic structural parameter, , that accounts for fibril formation
and breakage. Previously developed evolution equation has been used for £, based on
kinetic network theories (Patil et al., 2006; Jeyaseelan and Giacomin, 1995; Liu et al,
1984; Hatzikiriakos and Vlassopoulos, 1996).
Simulation results were found to be in excellent agreement with the experimental
findings reported by Ochoa and Hatzikiriakos (2004). Based on this agreement it can be
concluded that the proposed constitutive equation is suitable for modeling the behaviour
of the paste and captures the physics of the process. The viscoelastic model proposed in
this work is a truly predictive model and its parameters are fitted from independent
rheological experiments. Apart from prediction of the extrusion pressure, the simulation
predicts the exit structural parameter, £,exit which is related to the tensile strength of the
pastes. The predicted effects of the die geometrical parameter and operating condition on
the %exit are generally in agreement with experimental tensile strength observations.

5.5 Bibliography
Amin A. F. M. S., M. S. Alam, and Y. Okui, An improved hyperelastic relation in modeling viscoelasticity response of natural and high damping rubbers in compression: Experiments, parameter identification, and numerical verification, Mech. Mater. 34, 75-95 (2002).
Amin A. F. M. S., S. I. Wiraguna, A. R. bhuiyan, and Y. Okui, Hyperelastic model for finite element analysis of natural and high damping rubbers in compression and shear, J. of Eng. Mech. 132(1), 54-64 (2006).
Ariawan, A. B., S. Ebnesajjad and S.G. Hatzikiriakos, Preforming Behavior of PTFE Pastes, Powder Technology 121, 249-258 (2001).
Ariawan, A. B., Ebnesajjad, S. and Hatzikiriakos, S. G. Paste extrusion of polytetrafluoroethylene (PTFE) fine powder resins. Can. Chem. Eng. J., 80, 1153-1165 (2002a).
Ariawan, A.B., Ebnesajjad, S. and Hatzikiriakos, S. G. Properties of polytetrafluoroethylen (PTFE) paste extrudate. Polym. Eng. Sci., 42, 1247-1253 (2002b).
Ariawan, A. B. Paste Extrusion of Polytetrafluoroethylene Fine Powder resins, The University of British Columbia. Dept. of Chemical and Biological Engineering. Thesis Ph. D., 2002.
Bernstein, B., Feigl, K. A., Olsen, E. T., Steady flows of viscoelastic fluids in axisymmetric abrupt contraction geometry: A comparison of numerical results, J. Rheol. 38(1), 53-71 (1994).
Bird, R. B., O. Hassager, and R. C. Armstrong, Dynamics of Polymer Liquids. Vol. 1, 2 n d
ed., John Wiley & Sons, Inc., New York, 1987.
Bird, R. B., O. Hassager, R. C. Armstrong, and C. F. Curtiss, Dynamics of Polymeric Liquids Vol. 2, Kinetic theory, John Wiley & Sons Inc., New York, 1987.
Blanchet, T.A., Polytetrafluoroethylene, Handbook of Thermoplastics, Marcel Dekker, NY, 1997.
Crochet M. J., A. R. Davies, and K. Walter, Numerical Simulation of Non-Newtonian Flow, Elsevier, Amsterdam, 1984.
Dunlap P. N., and L. G. Leal, Dilute polystyrene solutions in extensional flows birefringence and flow modification, J. Non-Newt. Fluid Mech. 23, 5-48 (1987).
Ebnesajjad Sina, Fluoroplastics, Vol 1 Non-Melt Processible Fluoroplastics, Plastic Desgin Library. William Andrew Corp, NY, 2000.

Fuller, G. G., Rallison, J. M., Schmidt, R. L. and Leal, L. G., The measurements of velocity gradients in laminar flow by homodyne light-scattering spectroscopy, J. Fluid. Mech. 100(3), 555-575 (1980).
Fuller, G. G., and Leal, L. G., Flow birefringence of dilute polymer solutions in two-dimensional flows, Rheol. Acta 19, 580-600 (1980)!
Hatzikiriakos S. G., and D. Vlassopoulos, Brownian dynamics simulations of shear-thickening in dilute polymer solutions, Rheo. Acta 35, 274 - 287 (1996).
Horrobin, D. J., and R. M. Nedderman, Die Entry Pressure Drops in Paste Extrusion, Chem. Eng. Sci., 53, 3215-3225 (1998).
Jeyaseelan R. J., and A. J. Giacomin, Structural network theory for a filled polymer melt in large amplitude oscillatory shear, Polymer Gels and Networks 3, 117-133 (1995).
Kawabata, S., and Kawai, H., Strain energy density functions of rubber vulcanizates from biaxial extension, Adv. Polym. Sci. 24, 90-124 (1977).
Lambert-Diani, J., and C. Rey, New phenomenological behaviour laws for rubber and thermo plastic elastomers, Eur. J. Mech. A/solids 18, 1027-1043 (1999).
Liu, T. Y., D. S. Soong, and M. C. Williams, Transient and steady rheology of polydisperse entangled melts: Predictions of a kinetic network model and data comparisons, J. Polym. Sci.: PI. Phys. Ed. 22, 1561-1587 (1984).
Luo, X. -L., and E. Mitsoulis, A numerical study of the effect of elongational viscosity on vortex growth in contraction flows of polyethylene melts, J. Rheol. 34(3), 309-342 (1990).
Mazur, S., Paste Extrusion of Poly(tetrafluoroehtylene) Fine Powders in Polymer Powder technology,441-481, Narks, M., Rosenzweig, N., Ed. John Wiley & Sons, 1995.
Mooney, M., Explicit Formulas for Slip and Fluidity, J. Rheol. 2, 210-222 (1931).
Mooney, M.,A theory of large elastic deformation, J. Appl. Phys. 11, 582-592 (1940).
Ochoa, I., Hatzikiriakos, S. G. Polytetrafluoroethylene (PTFE) paste performing: Viscosity and surface tension effects. Powder Technology, 146(1-2), 73-83 (2004).
Ochoa, I., Paste Extrusion of Polytetrafluoroethylene Fine Powder resins: The effect of the processing aid physical properties, Ph.D., The University of British Columbia. Dept. of Chemical and Biological Engineering. Thesis Ph. D., 2006.
Olley, P., and P. D. Coates, "An approximation to the KBKZ constitutive equation," J. Non-Newt. Fluid Mech. 69, 239-254 (1997).

Olley, P., R. Spares, and P. D. Coates, A method for implementing time-integral constitutive equations in commercial CFD packages, J. Non-Newt. Fluid Mech. 86, 337-357 (1999).
Owens, R. G., and Phillips, T. N., Computational rheology, Imperial college press, London, 2002.
Papanastasiou, A. C., L. E. Scriven, and C. W. Macosko, An integral constitutive equation for mixed flows: viscoelastic characterization, J. Rheol. 27, 387-410 (1983).
Patil, P. D., J. J. Feng, and S. G. Hatzikiriakos, Constitutive modeling and flow simulation of polytetrafluoroethylene (PTFE) paste extrusion, J. Non-Newt. Fluid Mech. 139, 44-53 (2006a).
Rivl in, R. S., Large elastic deformations of isotropic materials, Philos. Trans. R. Soc. London, Ser. A 240, 459-490 (1948a).
Rivlin, R. S., "Large elastic deformations of isotropic materials IV. Further developments of the general theory," Philos. Trans. R. Soc. London, Ser. A 241, 379-397 (1948b).
Rivlin, R. S., Large elastic deformations, in Rheology, New York: Academic Press, 1956.
Selvadurai, A. P. S., and Q. Yu, Constitutive modelling of a polymeric material subjected to chemical exposure, Int. J. Plasticity 22, 1089-1122 (2006).
Sentmanat, M. L., "A novel device for characterizing polymer flows in uniaxial extension," SPE, ANTEC proceedings, 992-996 (2003).
Sperati, C. A., Physical Constants of Fluoropolymers, Polymer Handbook, John Wiley and Sons, NY, 1989.
Valanis, K. C., and R. F. Landel, The strain-energy density function of a hyperelastic material in terms of the extension ratios, Arch. Appl. Mech. 64, 136-146 (1967).
Viriayuthakorn, M., and Caswell, B., Finite element simulation of viscoelastic flow, J. Non-Newt. Fluid Mech. 6, 245-267 (1980).
Yamashita, Y., and Kawabata, S., Approximated form of the strain energy density function of carbon-black filled rubbers for industrial applications, J. Soc. Rubber Ind. (Jpn) 65(9), 517-528 (1992).
Yoshimura, A., and R. K. Prud'Homme, Wall slip corrections for coquette and parallel disk viscometers, J. Rheol. 32(1), 53-67 (1988).

CHAPTER 6
An Analytical Flow Model for Polytetrafluoroethylene Paste through Annular Dies3
6.1 Introduction
Numerous constitutive models have been developed for flows of viscoelastic
materials, such as polymer melts (Larson, 1998), solids under plastic deformations
(Hoffman and Sachs, 1953), and elastic-plastic materials that exhibit strain hardening as
in the case of metal forming or wire drawing (Davis and Dukso, 1994). Although PTFE
paste exhibits strain hardening effects (Mazur, 1995; Ebnesajjad, 2000; Ariawan et al.,
2002a), little work has been devoted to its flow modeling as an elasto-visco-plastic
material4. Even with the available equations, significant modifications may still be
necessary to improve the model predictions. The empirical equation suggested by
Benbow and Bridgwater (1993) cannot predict the effect of die entrance angle on the
extrusion pressure of PTFE paste, although it works quite well for other pasty materials
(Benbow et al., 1987; Benbow and Bridgwater, 1993). Due to its empirical nature,
modifications of any theoretical significance are also difficult to incorporate. Also the
lubrication approximation used by Benbow and Bridgwater (1993) is valid only for very
small entrance angle, which is not consistent with experimental data of PTFE paste
extrusion for larger die entrance angle used in rod extrusion (Ariawan et al., 2002a;
Dealy and Wissbrun, 1990). An improved analytical model for orifice extrusion of
viscoplastic materials has recently been proposed (Basterfield et al., 2005). Due to
structure formation (fibrillation), strain hardening effects are obtained at high contraction
angles during PTFE flow and therefore these models (Benbow and Bridgwater, 1993;
Basterfield et al., 2005) are not suitable for PTFE paste flow through cylindrical and
annular dies.
3 A version of this chapter has been accepted for publication. Patil, P. D., Feng, J. J., and Hatzikiriakos, S. G. (2006) An Analytical Flow Model for Polytetrafluoroethylene Paste Through Annular Dies, A.I.Ch.E. J. 52: 4028-4038.
The flow equation suggested by Snelling and Lontz (1960) is able to describe the
effects of die design and extrusion speed more accurately. However, it does not take into
account the frictional force, which becomes more important when tapered dies of small
entrance angle are used. Also, the analysis provided by Snelling and Lontz (1960) does
not account for the pressure drop along the capillary length of the die that follows the
entrance (contraction) region. Ariawan et al. (2002a) have proposed a visco-plastic model
to predict the dependence of extrusion pressure on die geometrical parameters for rod
extrusion. This approximate model successfully captured the non-monotonic dependence
of extrusion pressure on die entrance angle and other geometrical characteristics of the
cylindrical die. Its derivation is based on the RFH (discussed below in detail), whose
validity has been demonstrated experimentally (Ariawan et al., 2002a; Snelling and
Lontz, 1960). Although this model does not explicitly predict micromechanical details of
the extrudates, it predicts the extrusion pressure very well and therefore is very useful in
die design (Ariawan et al., 2002a). On the other hand, tube extrusion (annular flow) is an
important process from the industrial point of view, which has not been modeled in the
past.
Therefore the main objective of the present work is to generalize the model of
Ariawan et al. (2002a) to tube extrusion and to validate it using numerical simulations
and experimental data. As will be evident later, the new model is capable of predicting
the processing behavior of paste flow during tube extrusion, e.g., the extrusion pressure
as a function of shear rate and the geometrical characteristics of the die.
The organization of this chapter is as follows. First, the validity of the RFH is
examined by performing flow simulations based on the rheological constitutive model
proposed by Patil et al. (2006) Then a mathematical model is derived for the case of an
annular die based on the developments of Snelling and Lontz (1960) and Ariawan et al.
(2002a) Since the model involves the same material parameters as Ariawan et al.'s
model, these are determined from experimentally measured extrusion pressure for rod
extrusion. Model predictions of the dependence of extrusion pressure on the geometrical
characteristics of the die agree well with experimental data. Finally, a short summary of
the results concludes the chapter.
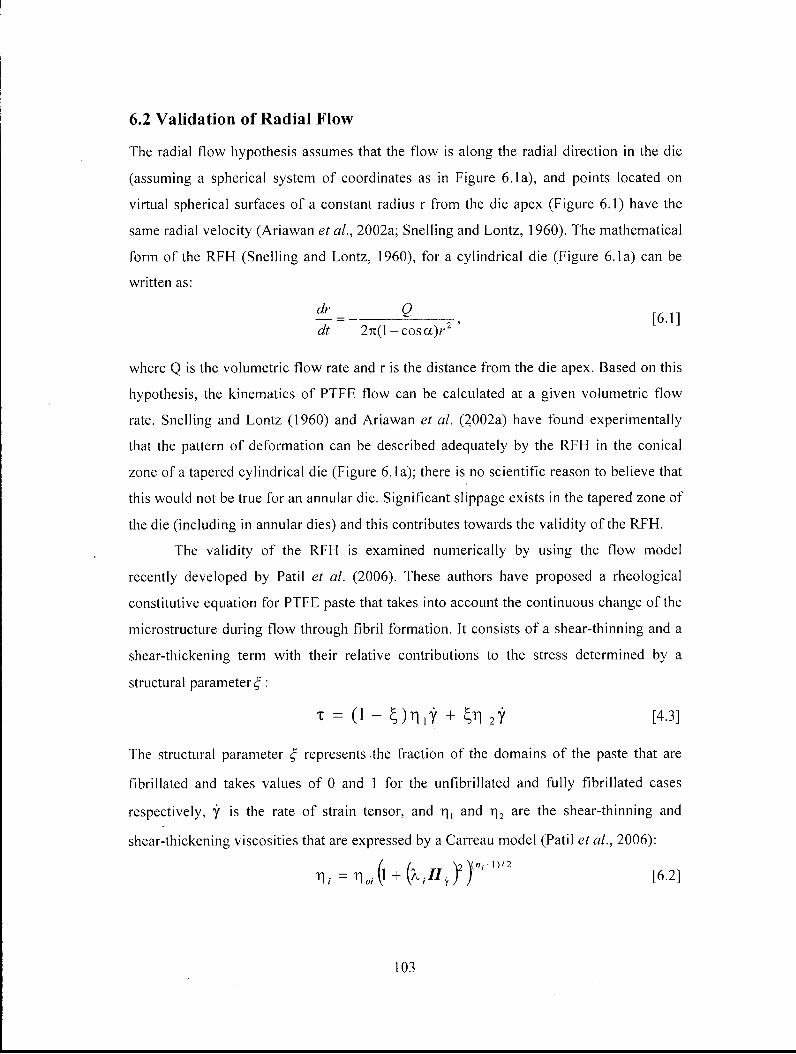
6.2 Validation of Radial Flow
The radial flow hypothesis assumes that the flow is along the radial direction in the die
(assuming a spherical system of coordinates as in Figure 6.1a), and points located on
virtual spherical surfaces of a constant radius r from the die apex (Figure 6.1) have the
same radial velocity (Ariawan et al., 2002a; Snelling and Lontz, 1960). The mathematical
form of the RFH (Snelling and Lontz, 1960), for a cylindrical die (Figure 6.1a) can be
written as:
where Q is the volumetric flow rate and r is the distance from the die apex. Based on this
hypothesis, the kinematics of PTFE flow can be calculated at a given volumetric flow
rate. Snelling and Lontz (1960) and Ariawan et al. (2002a) have found experimentally
that the pattern of deformation can be described adequately by the RFH in the conical
zone of a tapered cylindrical die (Figure 6.1a); there is no scientific reason to believe that
this would not be true for an annular die. Significant slippage exists in the tapered zone of
the die (including in annular dies) and this contributes towards the validity of the RFH.
The validity of the RFH is examined numerically by using the flow model
recently developed by Patil et al. (2006). These authors have proposed a rheological
constitutive equation for PTFE paste that takes into account the continuous change of the
microstructure during flow through fibril formation. It consists of a shear-thinning and a
shear-thickening term with their relative contributions to the stress determined by a
structural parameter £ :
The structural parameter £ represents the fraction of the domains of the paste that are
fibrillated and takes values of 0 and 1 for the unfibrillated and fully fibrillated cases
respectively, y is the rate of strain tensor, and r|, and r\2 are the shear-thinning and
shear-thickening viscosities that are expressed by a Carreau model (Patil et al., 2006):
dr dt 2tc(1 - c o s a ) r
2 2 ' [6.1]
T = (1 - S)TI,Y + ^ 2 y [4.3]
[6.2]

where i = 1 refers to shear-thinning (n, < 1) and i = 2 refers to shear-thickening ( n 2 > 1).
The values of parameters r | o i , T|; and A; are the infinite shear viscosity, the zero shear
viscosity, the viscosity and a characteristic relaxation time respectively.
h ok — DH H D,„ —H
(a) (b)
(c)
Figure 6.1: Schematic illustration of the "radial flow" hypothesis. The hypothesis assumes the existence of a virtual surface of radius r as measured from the die apex, on
which all paste particles moving towards the apex have the same velocity: (a) cylindrical die for rod extrusion and (b) annular die with inside cylinder of varying diameter
(mandrel pin) for tube extrusion, and (c) annular die with inside cylinder of constant diameter (mandrel pin) for tube extrusion.

The evolution of the structural parameter is described by a first-order kinetic
differential equation:
v-V^ = ayVy - P y S , [4.4]
where first and last term of the right hand denotes the rate of creation and breakage of
fibrillated domains in the paste, a and P are dimensionless rate constants for fibril
creation and breakage, both assumed to be 1 in our simulations; \\J is the flow type
parameter; and y is the magnitude of the strain rate tensor. The flow type parameter, v|J ,
indicates the relative strength of straining and rotation in a mixed flow (Dunlap and Leal,
1987; Fuller et al., 1980; Fuller and Leal, 1980). In the present work, finite element
simulations based on this constitutive model are used to validate the RFH inside the
conical section of the die during rod extrusion and tube extrusion (Figure 6.1). Patil et al.
(2006) have shown that predictions of this model agree very well with macroscopic
experimental data of extrusion pressure as a function of flow rate (shear rate) and
geometrical characteristics of the die.
Due to the presence of lubricant in the paste, significant slippage occurs at the die
walls. This has been determined experimentally (Patil et al., 2006) by establishing a
relationship between the slip velocity vs and the wall shear stress <7W using the Mooney
analysis, vs = C c w (Mooney, 1931). The simulations in the present study are performed
by using the parameters for a paste studied by Ochoa and Hatzikiriakos (2004) and Patil
et al. (2006), with C = 1.92 m/MPa s. All the other model parameters are listed in Table
4.2. Simulations are performed for three different cases sketched in Figure 6.1: (a)
cylindrical die, (b) annular die with an axisymmetric inside cylinder of varying diameter
that has the same apex as the outside cylindrical surface and (c) annular die with an inside
cylinder of constant diameter. The geometry is Figure 6.1(b) is convenient for
mathematical development, but that in Figure 6.1(c) is more common in applications.
6.2.1 Cylindrical dies
The simulations are first performed for cylindrical dies with entrance angles of 8°, 30°,
60° and 90° for various values of the apparent shear rate defined as, y A =32Q/7iD^,
where Q is the volumetric flow rate and Da is the capillary diameter at the exit. The inlet

and outlet diameters of the conical section are Db = 9.52 x 10 -3 m and Da = 5.08 x 10 -4 m
respectively. These are typical die dimensions used in experiments that are presented
later. To demonstrate the validity of the RFH, radial velocity profiles are plotted versus
angle 0 ( - a < 0 < a ) along the virtual peripheral surfaces at constant radial positions
from the die apex. Figure 6.2 shows representative velocity profiles at three different
radial positions from the die apex for a die entrance angle of 30°. This indicates that the
velocity variation from the centerline to die wall is generally small, and in agreement
with the RFH that implies flat velocity profiles. A small variation in the velocity profile
occurs at the inlet to the die which is considered unimportant since the contribution of
this part of the flow to the overall pressure drop is negligible.
Figure 6.2: Velocity profiles along the spherical surfaces at radius r = 5.8 x 10 3 m (a), 1.16 x 10~2 m (b), and 1.54x10~2 m (c) for cylindrical die (0 = 0 corresponds to the
centerline). In our model, there is only one radial velocity component, which is computed in a cylindrical coordinate system.
Figure 6.3 depicts the percentage variation of velocity, defined as the difference
between velocity at the centerline and the die wall normalized by the centerline velocity,
plotted against the die entrance angle at three radial locations (a), (b) and (c). The radial
positions (a), (b) and (c) are given by r = R!sina , where R and a indicates

corresponding cylindrical radius and die entrance angle (Fig. la). In Figures 6.3, 6.5 and
6.7 the same three cylindrical locations R = 1.5x10 -3 m, 3xl0~3 m and 4xl0~3 m are
used, however, corresponding radial locations (a), (b) and (c) varies with die entrance
angle. The variation of the velocity profile is only significant for (c) near the inlet for dies
of high entrance angle. This variation decreases rapidly in the downstream direction and
in fact in the middle of the die ((b) location) becomes insignificant. At position (b), the
velocity variation is 12 % for dies having an entrance angle of 90°, and 2.1 % for dies
having an entrance angle of 60°. For die entrance angles 2a < 60° (typically used in
paste extrusion) the variation is negligible and therefore the RFH applies.
80
60
o o <D > 40
4— o c o ."I 20 03 >
vO 0
0 20 40 60 80 100 120 140
Die entrance angle (2a)
Figure 6.3: Percentage variation of velocity normalized by the centerline velocity, from the centerline of the die to the die wall plotted with die entrance angle. The three surfaces are defined by the cylindrical radius R = 1.5x10 -3 m (a), 3 x 10"3 m (b) and
4xl0" 3 m (c).
To study the effect of the apparent shear rate yA and the die reduction ratio
RR = T>\/ D \ on the velocity variation along the virtual peripheral surfaces at constant r
from the die apex, simulations are performed for a cylindrical die having an entrance
angle of 2a = 30° and a reduction ratio RR = 352, for apparent shear rate values ranging

from 1875 s"1 to 8304 s"1. Near the outlet (position (a)), the percentage velocity variation
normalized by the centerline velocity is found to be 0.015 % and 0.026 % for the
apparent shear rates of y A = 1875 s"1 and y A = 8304 s"1, respectively. Similarly at position
(b), the normalized velocity variations are 0.23 % and 0.33 % for the apparent shear rates
of y A = 1875 s"1 and y A = 8304 s"1, respectively. Simulations were also performed for
various die reduction ratios ranging from 56 to 567 at the apparent shear rate of 5869 s"1.
The percentage velocity variations are 0.058 % and 0.02 % at position (a) for RR = 56
and 567 respectively. At position (b), they are 0.8 % and 0.24 %. Therefore, the RFH is
more accurate at lower flow rates and large reduction ratios.
6.2.2 Annular Die with Varying Diameter Mandrel Pin
Simulations were also performed for annular dies with an axisymmetric inside surface of
varying diameter (mandrel pin) having the same apex with the outside cylindrical surface
(Figure 6.1b). The existence of a single apex produces a die geometry that allows the
development of an analytical flow model (see section 3) in spherical coordinate (r and 0
define the entire flow field). Simulations were performed for various die entrance angles
ranging from 8° to 90° at various values of apparent shear rate, j A . This is defined as
jA =48 Q/n(D a - Dp)2(D a + Dp) where Q is the volumetric flow rate. The die and
mandrel diameters at the inlet are Db = 9.5xlO - 3 m and D m = 3 x l 0 - 3 m respectively,
and at the outlet are Da = 5.08xlO -4 m and Dp = l ^ x l O ^ m respectively (Figure 6.1b).
The coincidence of the apex requires D =Dm{D a/D h) . Figure 6.4 depicts
representative velocity profiles along the virtual peripheral surfaces at three various radial
positions from the die apex for a die entrance angle of 30° (see inset of Figure 6.4). These
are qualitatively similar to the profiles in the cylindrical dies (Figure 6.2). Small
variations in the velocity profiles are obtained only at the inlet (c) and they are
insignificant to the overall pressure drop.
Figure 6.5 shows the percentage variation of velocity normalized by the velocity
on the mandrel surface, plotted against the die entrance angle at the same radial locations.

E
o _o <D >
10 15
Angle (0)
Figure 6.4: Velocity profiles along the spherical surfaces at radius r = 5.8x10 3 m (a), 1.16x10 -2 m (b), and 1.54xl0"2 m (c) for an annular die with inside cylinder of varying
diameter (9 = 15° corresponds to the outside wall, 0 = 0 ° does not exist due to the presence of the internal mandrel pin).
40 60 80 100
Die entarnce angle (2a)
140
Figure 6.5: Percentage variation of velocity from the wall of the varying diameter mandrel pin to the die wall normalized by the velocity at the wall of the varying diameter cylinder, plotted with die entrance angle at three different spherical locations (a), (b) and
(c) defined in Figure 6.3.

The variation of velocity is significant only near the inlet (location (c)) and
increases with die entrance angle. However, variations in velocity over the lower portion
of the die that contributes significantly to the pressure drop are very small for dies having
die entrance angles up to 60° (typically used in extrusion operation). Therefore the RFH
can be used safely for dies up to entrance angles of 60°.
6.2.3 Annular Die with Axisymmetric Cylindrical Mandrel Pin
Similar simulations were performed for an annular dies with an inside cylinder of
constant diameter (mandrel pin) as depicted in Figure 6.1c. The die entrance angle ranges
from 8° to 90°. The outer diameter of inlet of the conical section of the die is Db =
9.5xl0~3 m, the outer diameter of outlet is Da = 2xl0~3 m and the diameter of the
axisymmetric constant diameter cylinder is Dp = 1.9xlO -3 m (Figure 6.1c). Although the
analytical mathematical model will be derived for an annular die having a single apex
(Figure 6.1b), it can still be used for annular dies with cylindrical mandrel pins, once the
RFH is proven for this geometry.
Figure 6.6 depicts representative velocity profiles along the virtual peripheral
surfaces at three radial positions from the die apex for a die having an entrance angle of
30° (see inset of Figure 6.6). The results are similar to those discussed before. Small
variation in the velocity profiles are obtained only at the inlet to the die. Figure 6.7 shows
the percentage variation of velocity normalized by the centerline velocity on the mandrel
surface, plotted against the die entrance angle at the three radial locations. The variation
of velocity is significant only near the inlet and only for dies having a large entrance
angle. The variation in velocity profile over most of the die is very small and increases up
to 14.8 % for a die entrance angle of 90°. This clearly indicates that the "radial flow"
hypothesis can be used safely for annular dies having an entrance angle of up to 60°.
Comparing Figures 6.5 and 6.7, it seems that the RFH applies better in annular dies
having mandrel pin of constant diameter. The RFH concept has been adopted in deriving
an analytical flow model for PTFE paste extrusion through annular dies and discussed in
the next subsection.

10-:
10";
& o _o CD > 1 0 -4
10"!
:2a = 30° RR = 352:1 YA = 5869 s"1
: Db = 9.52E-3 m Da = 2E-3 m D = 1.93E-3 m
!. n, J ' r (a) fCT f
(b)
\
—1 1
1
. 1
• •
1 1
. 1 1
. . .
.
. .
10 15
Angle (9)
20
Figure 6.6: Velocity profiles along the spherical surfaces at radius r = 5.8 x 10 3 m (a), 1.16 x 10"2 m (b), and 1.54 x 10~2 m (c) for an annular die having a mandrel pin of
constant diameter.
100
80
o 0 60 0) >
4— o c: 40 o
1 ro 5 20
1 1 1 1 1 1 1 1 1 1 1 1 1 fl . 1 1 . 1 1 • 1 1 Tube extrusion RR = 352:1 Y A = 5869 s"1
1 1 1 1
UllSlZI^? • (CJ / -
: \
(bi /[ -
• / ( b ) v l ' / /
D*R Oulk-i
I 1 1 1 1 1 1 1 1 1 1 1 1 • 1 1 1 1 1 1 1 20 40 60 80 100
Die entrance angle (2a) 120 140
Figure 6.7: Percentage variation of velocity from the wall of the constant diameter mandrel pin to the die wall normalized by the velocity at the wall of the constant diameter
cylinder, plotted with die entrance angle at three spherical locations (a), (b) and (c) defined in Figure 6.3.

6.3 Mathematical Model
Now that the validity of RFH has been established for cylindrical and annular
dies, an analytical model will be derived to describe annular flow of PTFE paste. It is
based on the RFH and generalizes the earlier model of Ariawan et al. (2002a) for annular
dies.
6.3.1 Annular Die without Die Land (L/Da = 0)
Consider first an annular die without the cylindrical die land (Figure 6.1b). Figure 6.8b
shows a volume element bounded by the spherical surfaces of radius r and (r + dr) as
measured from the virtual die apex, and by four planes at the azimuthal locations of 0,
6+ dO, (j) and + dtj). The RFH implies that this element will flow towards the die apex,
such that its bounding surfaces remain parallel to those at its previous position. Since the
element does not rotate or deviate from its straight path, this also implies that the stresses
acting on the element are purely normal stresses. In fact, these stresses are principal
stresses, with the radial direction and the directions normal to the four bounding planes as
the principal directions:
a =
0 0 a 0
II V
0 CT
a r 0 0 0 CTg 0 0 0 cta
[6.3]
It has been further assumed that a 0 = cr to simplify the mathematics. In reality, the
squeezing in the 0 and (j) direction is comparable in magnitude if not equal. The force
balance on the volume element (see Figure 6.8b) in the radial direction gives rise to an
equilibrium relation:
- Irtr 2 (cos Q - cos a) da r - 4^r(cos Q - cos a)ar dr +
4;rcrl9r(cos Q - cos a)dr + Infer 0r{sm Q + sin a)dr = 0. [6.4]
where Q = tan~ D,
V D b
\
-tan a and / is the coefficient of friction. By letting
B _ /(sin Q + sin a )
2(cosQ - cos a ) and N/ = o> - o^ and rearranging, we obtain

d°r 2 B o r =2{c 9-orXl + B)_-2N l(\ + B)^ [6.5] dr r r r
The term N/ is similar to the first normal stress difference in polymer rheology, except
that, in this case, it is for a non-viscometric flow.
- H D„
- • i h-Die
(a)
Mandre
(r+tl rjdnTX /= (r + dr)sin 0d(j)\ \
A \ /(r+dOde/V
Jr in Q' . X . / /
(b)
N.
Figure 6.8: (a) Annular die with varying diameter mandrel pin with volume element and (b) its dimensions in the annular conical zone of a tapered die according to "radial flow"
hypothesis.
In order to solve the above differential equation, a relationship describing the first
normal stress difference for the solid-liquid (paste) system in question is therefore,
required. For an ideally plastic material, Saint-Venant's theory of plastic flow gives
"N, = <jo at the incipience of yielding, where cr0 is the initial yield stress of the material
(Saint-Venant, 1870). However, for a completely plastic flow to occur within an elasto-

visco-plastic material, N] has to sufficiently exceed a 0 so as to overcome the initial yield
stress, the elastic stress and any viscous resistance that may develop during the flow
(Hoffman and Sachs, 1953; Chakrabarty, 1998).
The generalized Newton's law for viscous flow states that a = r)k and Hooke's
law of elasticity establishes the relationship a = Es, where 77 and E are the viscosity
coefficient and the Young's modulus, respectively, and eand sare the logarithmic strain
and strain rate tensors, respectively. Combining the two laws, the following stress-strain
relationship for a visco-elastic material (Hoffman and Sachs, 1953):
a = Es + rje. [6.6]
Using the above relation, the term Ge - crr adopts the form of
<Tg-<Tr= E ( £ s ~£r)+ Vifg ~ e r )> [6-7]
where sg-sr= s„ - e, and eg-sr = s„ - s, are the maximum strain ymax and the
maximum strain rate y i m x , respectively. The term maximum strain was introduced by
Ludwik (Ludwik, 1909), who realized that N/ should be a unique function of ymm •
Ludwik is also credited with the modified Hooke's law expression that takes the final
form of a power law equation
a = Ce", [6.8]
where C is Young's modulus when n = 1.
Due to the presence of both the liquid and solid phases in the PTFE paste system,
it is necessary to consider PTFE paste as an elasto-visco-plastic material. To model its
flow, the expression suggested by Snelling and Lontz (1960) is adopted, which is
essentially the Kelvin stress-strain relation Eq. (6.6), with modifications that are similarly
employed in the Ludwik power law model Eq. (6.8) for the elastic (strain hardening)
term, and the generalized power law model for the viscous resistance term. The resulting
expression for the first normal stress difference N/ is then written as follows:
V e - V , = C r m J + v y m j " • • [6.9]
A more general three-dimensional form of Eq. (6.9) can be written by considering the
general model for an elastic solid, such as that used by Rivlin (Rivlin, 1948a; Rivlin,
1956), and for a viscous fluid, in terms the invariant functions of the strain and strain rate

tensors, respectively (Macosko, 1994). However, the objective here is to derive a simple
analytical flow model to be compared with macroscopic extrusion pressure
measurements.
To account for the initial yield stress, an additional term may be included on the
right hand side of Eq. (6.9). However, this term is expected to be negligible compared to
the other terms, as indicated by the fact that the initial strength of the preform is much
weaker than that of the extrudate.
Now, it can be shown that the volume element at a distance rb from the virtual die
apex experiences a maximum strain of
ymax ~ £ e ~ £ r = ,
3 f dr
rb r
r, = -31n —. [6.10] r
The maximum strain rate can then be expressed as
y _ drmax _ , dr
The "radial flow" hypothesis for annular conical dies of single apex can be written
as:
dr Volumetric Flow rate Q [6.12] dt Area of Surface 27i(cosQ-cosa)r 2
Hence, the maximum strain rate is (see Eq. 6.11)
. 3Q ymax — ^ / „ \ 3 ' [6.13]
2;r(cosi2-cosaJr and the normal stress difference is:
( r.. N, =CT, -CT f l =C 3 In
V V r J J + T| 32
2n(cosQ-cosa ) r 3 [6.14]
Substituting the above into Eq. (6.5) yields the following expression:

2B+\
r 3 q m f 1 ^
(3 m + 2 B) 2;r(cosf2-cosa) 3m+2B
\ r J • + r2I iC, [6.15]
where the constant of integration, C, is evaluated using the boundary condition a r = a r
when r = r :
32
(31 n(r„/r))" ,.2B+l dr
r \ _ J 3m+2« [6.16] - (3m + 2B) ^ 2;r(cos Q - cos a)
The extrusion pressure can then be calculated using Eqs. (6.5) and (6.9) with r = rh, i.e.
PE. -arh=araRR" +2{l + Bic , D b
2sina 2B+1
12Qsin3a [6.17]
(3m + 2B) ^ 7t(cosn - cosa)D3h j
where crra is the stress at the die exit, RR is the reduction ratio of larger to smaller cross
section area of annular conical section inlet and outlet respectively, defined
as(D2 - D ^ ) , and C, 7, n, m, and / are material constants that have to be
determined experimentally.
When an orifice die is used, a r a may be present at the die exit due to a pulling
force during extrudate wind-up or calendering. However, crra is typically negligible and
the expression for extrusion pressure can then be simplified to
= 2(1+ 2?UC DL V 2 B
T|
2sin a J
12£>sin3 a
, 2B+1
\m
(3m + 2 B ) y 7r(cos Q - cos a ) D , 3 h RR 4 [6.18]

Numerical integration is required in Eq. (6.18). However, for a range of the die
reduction ratio of interest, the following approximation can be used with reasonable
accuracy in Eq. (6.18), allowing an analytical solution to be obtained:
where a and b are constant fitting parameters.
6.3.2 Annular Die with Die Land (L/Da * 0)
Additional pressure drop in the die land can be computed using a similar force balance.
The forces acting on a volume element in the capillary zone is shown in Figure 6.9. A
force balance on the element yields
In(rt/r)» a(jyr)b . [6.19]
(p 2a-D2
p) [pl ~ D2p) . _ {a z + dc T 2)n± -azn± - f<r r.n\Da +Dp)dz , [6.20]
b
c
Conical Zone Capillary Zone
fo r7tD dz z = o
fa ,tiD dZ < r 3
da ji(DJ - Dp)/4
z = L
o" D
Figure 6.9: Force balance on volume element in the die capillary zone.

or
da z 4 /ov {D a + Dp) = 41(D 0 + Dp )f{N i + <x2)
[Dl-D]) dz [Dl-D]) [6.21]
where Ni is the previously defined first normal stress difference, which is expected to be
significant due to the elastic nature of PTFE paste. At the end of the die conical zone
(hence, at the entrance of the die capillary zone), N/ can be calculated using Eq. (6.14)
with r = ra. Assuming N/ to be approximately constant throughout the capillary zone of
the die, the force balance becomes
d<7 *(D a+Dp)f{N Xa +az) dz [Dl-Dl) [6.22]
where
•N,=C In {R) + 7] \2Qsm3 aR 3/2
; r (cosQ-cosa) l ) b J
[6.23]
Solving Eq. (6.21) and applying the boundary condition crz = azL at z = L, yields
G = N i (g4A'-i-iD.+Dj/irt-Dl) _ j J + a t e4/(z-A)(/J„+/J„)/(/J,;-/J,2,)
where <J z1 is the stress imposed at the exit of the die, which is typically negligible or zero.
The stress present at the entrance of the die capillary zone, crzo, is obtained from Eq.
(6.23) with z = 0: )U[D-Di [6.24]
By putting 8 = 1 - Dp / Da in Eq. (24), azo can be written as:
o n = N l a ( e ^ J L " D ' - \ ) + o l L e ^ " D ' , [6.25]
The total extrusion pressure can be obtained by substituting crra = -crz0 into Eq. (6.16).
6.4 Model Predictions and Comparison with Experiments
In this section the dependence of the extrusion pressure on the apparent shear rate, the die
entrance angle ( 2 a ) , and the die reduction ratio (RR) is predicted by using the proposed
model (Eq. 6.17), for cylindrical (Figure 6.1a) and annular dies (Figure 6.1b) with no die
land section. Extrusion experiments were performed with cylindrical dies using two

PTFE fine powder resins supplied by Solvay Solexis of primary and secondary particle
diameters of 0.25 urn and 450-550 fim respectively and standard specific gravity of
2.16. The paste was prepared by mixing resins with isoparaffinic liquid as lubricant
' (Isopar® H) supplied by ExxonMobil Chemicals with properties listed in Table 4.1. The
two resins have different molecular weights and are labelled as resins A and resin B in
Table 6.1. The material parameters C, n, rj, m and/in Eq. (6.17) are evaluated by fitting a
single set of experimental data for resin A and B in a cylindrical die (see Figure 6.10)
(Ariawan et al., 2002a). The dimensions of the cylindrical die are: Db =9 .5x10 ' 3 m, Da
= 5X10"4 m and the die entrance angle was 2a = 60°. The model parameters C, n, rj, m
and/are determined by nonlinear dynamic optimization using a Gauss-Newton iterative
algorithm that minimizes the difference between model predictions of the extrusion
pressure and the measured values. The standard deviations for all these parameters were
below 5%. The fitted values of the parameters are listed in Table 6.1 for resins A and
resin B. Since these are material parameters independent of the die geometry, they can be
used in predicting extrusion pressure for cylindrical and annular dies of different
geometry, as long as the "radial flow" hypothesis is valid. Note the small value of the
friction factor, / which implies that the pressure drop in the die land is much smaller
compared to that in the conical zone. Typically the pressure drop in the die land can
account for about 5% of the total pressure drop for short dies (L/Da=5) to 30% for long
dies (L/Da=40) depending on the type of resin.
Table 6.1: Values of material constants and coefficient of friction needed in Eq. (6.22) to predict the extrusion pressure for paste slow in cylindrical and annular dies.
Resin C (MPa) n 11 (MPa.s) m f Resin A 1.14x10"' 2.28 1.25 xl0~3 1.21 U x l O " 4
Resin B 8.92 xlO"2 2.13 3.56 xlO"3 1.11 1.12x10 -4
Figure 6.10 plots the extrusion pressure for resin A and B in rod extrusion. The
solid lines indicate model prediction using parameters determined by best fitting of the
experimental data. The steady-state extrusion pressure generally increases with increase
of the apparent shear rate. Although resin A has a lower viscosity than resin B, it has a

larger elastic constant, and the strain-hardening effect leads to a higher pressure drop than
resin B. The dotted lines indicate model predictions for tube extrusion using the same
model parameters. As expected, the extrusion pressure for annular dies is higher than for
cylindrical dies under comparable conditions, owing to the presence of the additional
inside cylinder wall.
80
CD CL
^ 6 0 CD
13 C/5 V) CD i CL c o
•So 40 3
20 2000 4000 6000 8000 10000
Apparent Shear Rate, 7A (S"1)
Figure 6.10: The effect of apparent shear rate on the extrusion pressure of PTFE paste for a cylindrical (rod extrusion) and an annular conical die (tube extrusion). The
experimental data refer to rod extrusion using an orifice die (L/D=0), having RR=352, 2 a =60°.
Once the material parameters are determined, the model can be used to predict the
effects of die geometry on extrusion pressure. Figure 6.11 shows the model predictions
for the dependence of extrusion pressure on the die reduction ratio for cylindrical die and
annular die with varying diameter mandrel pin (Figure 6.1b) using the parameters for
resin A. The reduction ratio of the die is increased by decreasing the small diameter Da
for the cylindrical die, and both Da and Dp for the annular die. The nonlinear dependence
of extrusion pressure on the die reduction ratio is clearly seen.
A • Experimental (Resin A) Experimental (Resin B) Model (Resin A) Model (Resin B) Model (Resin A) Model (Resin B)
RR = 352:1 2a = 60° L/D = 0
Experimental (Resin A) Experimental (Resin B) Model (Resin A) Model (Resin B) Model (Resin A) Model (Resin B)
•
Experimental (Resin A) Experimental (Resin B) Model (Resin A) Model (Resin B) Model (Resin A) Model (Resin B)
/ Tube Extrusion .
: Ar"A Rod Extrusion
a— i
• • — • —

Reduction Ratio (RR)
Figure 6.11: The effect of die reduction ratio on the extrusion pressure of PTFE paste for a cylindrical (rod extrusion) and an annular die (tube extrusion).
Figure 6.12 depicts the model prediction for the dependence of the extrusion pressure on
the die entrance angle for cylindrical and annular dies. It can be seen that the extrusion
pressure initially decreases, and goes through a minimum until it again increases with
increase of the die entrance angle. In both cylindrical and annular dies, the minimum
extrusion pressure is required for a die with die entrance angle of around 8°. This value
depends on the value of the material parameters. To further test the validity of the
proposed mathematical model, experiments were performed using resin B in an annular
die with a cylindrical die land attached. The annular die has an exit diameter of Da =
6.48 xlCT3 m, a mandrel pin of diameter D p = 4.7xl0~3 m, a die entrance angle of 2a =
180°, a length to diameter ratio L/Da = 35, and a reduction ratio of (d 2 - D 2 ) / (D 2 - D 2 )
= 35. Details for the experimental procedure can be found in previous publications
(Ariawan et al., 2002a; Ochoa and Hatzikiriakos, 2004; Ariawan et al., 2001; Ochoa and
Hatzikiriakos, 2005). Figure 6.13 compares the measured steady-state extrusion pressure
as a function of the apparent shear rate with model predictions using the fitted values of
the various parameters listed in Table 6.1. The agreement between the two is excellent,

and indicates that our model is capable of accurate description of paste extrusion for both
cylindrical and annular dies.
CL
(U w w 0
c o '(/)
UJ
90
80
70
60
50
40
30
20
Resin A RR = 352:1 L/D = 0 7a = 5869 s"1
Rod Extrusion Tube Extrusion
20 40 60 80 100
Die entrance angle (2a) 120 140
Figure 6.12: The effect of die entrance angle (2a) on the extrusion pressure of PTFE paste for a cylindrical (rod extrusion) and an annular die (tube extrusion).
Figure 6.13: The effect of apparent shear rate on the extrusion pressure of PTFE (resin B) paste for an annular die (tube extrusion).
6.5 Conclusions
Numerical simulations were performed for conical and annular dies by using a
combined shear thinning and shear thickening rheological constitutive model proposed by
Patil et al. (2006) to study the validity of the RFH during PTFE paste flow. The
numerical results have shown that the "radial flow" hypothesis is valid for both
cylindrical dies and annular dies having a contraction angle up to 60°. Based on these
findings, a simple flow model is developed to predict the dependence of extrusion
pressure on the extrusion speed (apparent shear rate) in annular dies. The model considers
the paste as an elasto-visco-plastic material that exhibit both strain hardening and viscous
resistance effects during flow. Comparison with limited experimental data from both
cylindrical and annular dies was found to validate the usefulness of this analytical and
approximate but simple model. The model successfully predicts the dependence of
extrusion pressure on apparent shear rate for tube extrusion using model parameters
determined by fitting data for rod extrusion. The model was also used to predict the
dependence of extrusion pressure on die geometrical parameters.
A final comment relates to the limitations of the model. While the extrusion
pressure can be predicted well as a function of the operating parameters and the
geometrical characteristics of the dies, the material's structure (fraction of fibrillated
domains), is not explicitly calculated. This limitation is the subject of a future study and it
would be ideal to have an analytical model that can relate flow kinematics and structure
with the mechanical properties of the final extrudates as in the numerical flow model of
Patil et al. (2006)
6.6 Bibliography
Ariawan, A. B., S. Ebnesajjad and S.G. Hatzikiriakos, Preforming Behavior of PTFE Pastes, Powder Technology 121, 249-258 (2001).
Ariawan, A. B., Ebnesajjad, S. and Hatzikiriakos, S. G. Paste extrusion of polytetrafluoroethylene (PTFE) fine powder resins. Can. Chem. Eng. J., 80, 1153-1165 (2002a).
Basterfield, R. A., Lawrence, C. J., and Adams, M. J., On the interpretation of orifice extrusion data for visco-plastic materials, Chem. Eng. Sci. 60, 2599-2607 (2005).
Benbow, J. J., Bridgwater, J., The Influence of Formulation on Extrudate Structure and
Strength, Chem. Eng. Sci. 42, 735-766 (1987).
Benbow, J. J., Oxley, E. W., and Bridgwater, J. The extrusion mechanics of pastes-The influence of paste formulation on extrusion parameters. Chem. Eng. Sci., 42 (9), 2151-2162,(1987).
Benbow, J. J., and J. Bridgwater, Paste Flow and Extrusion, Oxford University Press, Oxford, 1993.
Chakrabarty, J., Theory of Plasticity, Singapore: McGraw-Hill Book Co., 1998.
Davis E. A., and Dukos, J., Theory of Wire Drawing, J. Appl. Mech. 11, 193-198 (1994).
Dealy, J. M., and K. F. Wissbrun, Melt Rheology and its Role in Plastics Processing -Theory and Applications, Van Nostrand Reinhold, New York, 1990.
Dunlap P. N., and L. G. Leal, Dilute polystyrene solutions in extensional flows birefringence and flow modification, J. Non-Newt. Fluid Mech. 23, 5-48 (1987).
Ebnesajjad Sina, Fluoroplastics, Vol 1 Non-Melt Processible Fluoroplastics, Plastic Desgin Library. William Andrew Corp, NY, 2000.
Fuller, G. G., Rallison, J. M., Schmidt, R. L. and Leal, L. G., The measurements of velocity gradients in laminar flow by homodyne light-scattering spectroscopy, J. Fluid. Mech. 100(3), 555-575 (1980).
Fuller, G. G., and Leal, L. G., Flow birefringence of dilute polymer solutions in two-dimensional flows, Rheol. Acta 19, 580-600 (1980).
Hoffman O, and Sachs G., Introduction to the theory of Plasticity for Engineers, New York: McGraw-Hill Company, 1953.
Larson, R., Constitutive Equations for Polymer Melts and Solutions, Boston: Butterworths, 1998.

Ludwik, P., Elemente der Technologischen Mechanik, Berlin: Springer-Verlag, 1909.
Macosko, C. S., Rheology principles, measurements, and applications, VCH publishers,
Inc., New York, 244-247 (1994).
Mazur, S., Paste Extrusion of Poly(tetrafluoroehtylene) Fine Powders in Polymer Powder technology,441-481, Narks, M., Rosenzweig, N., Ed. John Wiley & Sons, 1995.
Mooney M., Explicit Formulas for Slip and Fluidity, J. Rheol. 2, 210-222 (1931).
Ochoa, I., Hatzikiriakos, S. G. Polytetrafluoroethylene (PTFE) paste performing: Viscosity and surface tension effects. Powder Technology, 146(1-2), 73-83 (2004).
Ochoa, I., Hatzikiriakos, S. G. Paste extrusion of polytetrafluoroethylene (PTFE): Surface tension and viscosity effects.. Powder Technology (2005), 153(2), 108-118.
Patil, P. D., J. J. Feng, and S. G. Hatzikiriakos, Constitutive modeling and flow simulation of polytetrafluoroethylene (PTFE) paste extrusion, J. Non-Newt. Fluid Mech. 139, 44-53 (2006a).
Rivl in, R. S., Large elastic deformations of isotropic materials, Philos. Trans. R. Soc. London, Ser. A 240, 459-490 (1948a).
Rivlin, R. S., Large elastic deformations, in Rheology, New York: Academic Press, 1956.
Saint-Venant, B., Memoire sur I'etablissement des Equations Differentielles des Mouvements Interieurs Operes dans les Corps Solides Ductiles, Compt. Rend. Acad. Sci. Paris. 70, 473-484 (1870).
Snelling, G. R., and J. F. Lontz, Mechanism of Lubricant-Extrusion of Teflon® TFE-Tetrafluoroethylene Resins, J. Appl. Polym. Sci. Ill, 257-265 (1960).
CHAPTER 7
Conclusions, Recommendations and Contribution to the Knowledge
7.1 Introduction
In this work, a mathematical model to simulate the processing behavior of
polytetrafluoroethylene (PTFE) pastes was developed. Rheological experiments were
also performed to obtain the rheological parameters used in the constitutive modeling.
The dependence of the extrusion pressure on the operating parameters and the
geometrical characteristics of the extrusion die were studied. Mechanical properties of the
final extrudates were related to the predicted level of fibrillation observations. A simple
semi-empirical flow model was also developed to predict the dependence of extrusion
pressure on the extrusion speed (apparent shear rate) in annular dies.
7.2 Conclusions
First, a rheological constitutive equation was proposed based on the assumption
that the PTFE paste behaves as a shear-thinning fluid before the occurrence of
fibrillation. Gradual increase in fibrillation during flow turns the paste into a shear-
thickening fluid. Thus, the total stress is expressed as a function of a shear-thinning term
and a shear-thickening term premultiplied by the structural parameter, . This structural
parameter, H, , represents the mass fraction of the paste which is fibrillated. An evolution
equation has been developed for based on the kinetic network theories. This captures
the formation, evolution and breakage of fibrils. The relation between the slip velocity
and wall stress was determined by performing several capillary extrusion experiments
(Mooney, 1931). This was used as a wall boundary condition in the finite element
simulation. Finite element simulations of PTFE paste extrusion were presented in order to
predict the dependence of extrusion pressure on apparent shear rate, die reduction ratio,
die L/D ratio and die entrance angle. Simulation results were found to be in excellent
agreement with the experimental findings reported by Ochoa and Hatzikiriakos (2004).

Based on this agreement it can be concluded that the proposed constitutive equation is
suitable for modeling the flow behaviour of the paste. The average exit structural
parameter, was related to the tensile strength of the pastes. The weakness of the STT
model was that its parameters were freely fitting parameters obtained by iteratively
reducing the error between the simulated and experimental dependence of extrusion
pressure on apparent shear rate y A and geometrical characteristics of the die.
In chaper 5, a fully predictive flow model was developed where PTFE paste was
treated as a viscoelastic fluid. First the PTFE paste has been treated as a shear-thinning
fluid before the occurrence of fibrillation. The formation of fibrils gradually turn the
paste to exhibit more strain-hardening behaviour, and this elastic behaviour was captured
through a hyperelastic modified Mooney-Rivlin model. Change in the nature of the paste
from a fluidlike (shear-thinning) behaviour to a solidlike (strain-hardening) one, was
implemented by the introduction of a microscopic structural parameter, . The model
predictions were compared with the experimental results reported by Ochoa and
Hatzikiriakos (2004) as well as with the simulation results from STT model. The
viscoelastic model proposed in this work is superior to the STT model because it is fully
predictive and describes the physics of the process quite well. The predicted effects of the
die geometrical parameter and operating condition on the £,exit are generally in agreement
with the observed ones on the tensile strength.
The flow inside a conical die can be modeled by using the "radial flow"
hypothesis (RFH) (Snelling and Lontz, 1960). The validity of the RFH was confirmed by
comparing radial velocity profiles generated from RFH with that the STT model
proposed by Patil et al., (2006). The numerical results have shown that the RFH is valid
for both cylindrical dies and annular dies having a contraction angle of up to 60°. Based
on these findings, a simple flow model was developed to predict the dependence of
extrusion pressure on the extrusion speed (apparent shear rate) in annular dies. The model
considers the paste as an elasto-visco-plastic material that exhibits both strain hardening
and viscous resistance effects during flow. Comparison with limited experimental data
from both cylindrical and annular dies was found to validate the usefulness of this
analytical, approximate model which is simple to use. The model successfully predicts
the dependence of extrusion pressure on the apparent shear rate for tube extrusion using

model parameters determined by fitting data for rod extrusion. The model was also used
to predict the dependence of extrusion pressure on die geometrical parameters.
7.3 Contributions to Knowledge
Several contributions to knowledge have resulted from this research work. These
are identified as follows.
1. A simple shear-thinning and shear-thickening model was developed, able to
capture PTFE paste flow quite well. The phenomenon of fibrillation was never
considered before in the modelling of PTFE paste flow. However, the current model
captures the fibrillation mechanism and its effect on the rheology of PTFE paste during
extrusion.
2. The slip behavior of the PTFE paste in capillary dies was studied and it was
related experimentally to the wall shear stress.
3. A kinetic equation for the mechanism and dynamics of fibrillation was developed
for the first time and it was demonstrated that it describes the process well.
4. The proposed viscoelastic model in this work describes the rheological behavior
of the paste through a shear-thinning and strain-hardening term in the total stress tensor
premultiplied by . Also the model parameters used in this model are obtained from
shear and extensional rheometrical testing. The flow model developed was able to
capture the processing behavior of PTFE paste through the dependence of extrusion
pressure on operating conditions and die geometrical characteristics.
5. An approximate analytical model was developed based on the "radial flow
hypothesis" (RFH) to predict the extrusion pressure in cylindrical and annular dies.The
model considers the paste as an elasto-visco-plastic material that exhibit both strain
hardening and viscous resistance effects during flow. Comparison with limited
experimental data from both cylindrical and annular dies was found to validate the
usefulness of this analytical and approximate but simple model.
Overall this work has contributed to the understanding of modeling aspects of the
PTFE paste extrusion. Undoubtedly, more in-depth modelling still needs to be performed
in the future in order to completely unravel the complexities of the process. However,
many of the findings in this work have provided the foundation towards performing

properly the microscopic modelling of the process. The results from the present study can
be utilized in industrial applications i.e to design extrusion dies. Finally, many of the
modeling techniques employed here are novel, and can be used in other studies involving
modeling of viscoelsatic fluid influenced by the inherent microscopic structure developed
during processing.
7.4 Recommendations for Future Work
Several important aspects of PTFE paste extrusion are yet to be studied. These are
recommended below, as possible objectives for future research work.
1. In the present study it was assumed that all the PTFE particles remain spherical
during the processing. However, due to high shear and elongational flow field inside the
converging die, particles do change their shape from spherical to ellipsoidal. This needs
to be taken into account in the modelling
2. The fact that all the fibrils are oriented in the direction of flow, can be modeled by
treating single fibril as a vector and then mathematically expressing the convection and
diffusion of vectors by using the well known Fokker-Planck equation.
3. An approximate analytical model proposed in the present work to predict the
processing behavior of PTFE, can be modified by incorporating the structural parameter
in the total stress. The kinetic equation for the evolution of can also be integrated
exactly to result an analytical expression.
4. In order to make the rheological study of PTFE pastes more complete, the effects
of other variables, such as resin particle size and its distribution should be investigated in
the future. It is noted that the effect of particle size needs to be considered in the
modeling.
5. The flow of PTFE pastes through a hyperbolic die and a crosshead die for a wire
coating process are also interesting and commercially useful. The modelling study in the
present work can be extended to predict the processing behavior of PTFE through these
dies.
6. The viscoelastic model proposed in the present study is not PTFE paste specific. It
can be extended to model other fluids that show inherent microstructural development
during processing their processing.

7.5 Bibliography
Mooney, M., Explicit Formulas for Slip and Fluidity, J. Rheol. 2, 210-222 (1931).
Ochoa, I., Hatzikiriakos, S. G. Polytetrafluoroethylene (PTFE) paste performing: Viscosity and surface tension effects. Powder Technology, 146(1-2), 73-83 (2004).
Patil, P. D., J. J. Feng, and S. G. Hatzikiriakos, Constitutive modeling and flow simulation of polytetrafluoroethylene (PTFE) paste extrusion, J. Non-Newt. Fluid Mech. 139, 44-53 (2006).
Snelling, G. R., and J. F. Lontz, Mechanism of Lubricant-Extrusion of Teflon® TFE-Tetrafluoroethylene Resins, J. Appl. Polym. Sci. Ill, 257-265 (1960).


