Embed Size (px)
Citation preview

Canadian Water Resources Journal Vol. 35(4): 469–486 (2010) © 2010 Canadian Water Resources AssociationRevue canadienne des ressources hydriques © Her Majesty in Right of Canada
Marc-André Lavigne1, Miroslav Nastev2, and René Lefebvre3
1AECOMCanadaLtd.,22512ndAvenue,Whitehorse,NorthwestTerritories,Y1A5W12GeologicalSurveyofCanada,NaturalResourcesCanada,Quebec,QuebecG1K9A93Institutnationaldelarecherchescientifique,CentreEauTerreEnvironnement,QuébecG1K9A9
SubmittedApril2010;acceptedJuly2010.WrittencommentsonthispaperwillbeaccepteduntilJune2011.
Numerical Simulation of Groundwater Flow in the Chateauguay River Aquifers
Marc-André Lavigne, Miroslav Nastev, and René Lefebvre
Abstract:TheChateauguayRiverwatershed extendsovernortheasternNewYorkState (USA) andsouthwesternQuebec(Canada).Fracturedsedimentaryrocksof theSt.LawrencePlatformhost theregionalaquifers.Quaternarysedimentsofvariablethicknessofupto45moverliethebedrock.Thegeometricmeanhydraulicconductivityofthebedrockaquifersobtainedfrom548fieldmeasurementsis5.1×10-5m/swithastandarddeviationof0.7ofthelogarithms.Themodelledareaextendsfromthe foothills of the Adirondacks to the St. Lawrence River and covers 2,850 km2. The numericalgroundwaterflowmodelwasdevelopedusingthefiniteelementsimulatorFEFLOW.Themodelhas13layerswithlayerthicknessesrangingfrom5mforthetoplayerto75mforthebottomlayer.Theaveragethicknessofthenumericalmodelis655m,foratotalvolumeof1,868km3.TheSt.LawrenceRiverisconsideredasaspecifiedheadboundary;thebaseandotherlaterallimitsareconsideredasno-flowboundaries,whereasaheadandconductivity-dependentboundaryisspecifiedalongmajorstreamsandwetlands.Spatialrechargerateisappliedasaspecifiedfluxacrossthetopofthemodelandwasfixedduringcalibrationtoreducemodeluncertainty.Groundwaterwithdrawalof34Mm3/yrisassignedusingsinksformajorwellsandasauniformnegativefluxacrossthetopofthemodeltoaccountfordomesticandotherdiffuseuses.Calibrationwascarriedoutagainst153hydraulicheadmeasurements,with horizontal hydraulic conductivity and vertical anisotropy used as calibration parameters. Theregionalgroundwaterflowamountsto268Mm3/yr:12.7%iswithdrawnfordomesticpurposes;aquifercontributiontostreamsandwetlandsis176Mm3/yr,and55Mm3/yrisdischargedtotheSt.LawrenceRiver.Groundwaterflowappearstobecontrolledbythesub-horizontalbeddingplanescontributingtorelativelyhighverticalanisotropy.
Résumé :LebassinversantdelarivièreChâteauguaycouvreunepartiedunord-ouestdel’étatdeNewYork(USA)etdusud-ouestdelaprovincedeQuébec.L’aquifèrerégionalestprésentdanslesunitéssédimentaires fracturées de la Plateforme du Saint-Laurent. Des sédiments quaternaires d’épaisseurvariable,pouvantatteindre45m,recouvrentleroc.Laconductivitéhydrauliquemoyennedel’aquifèrerocheux,obtenueàpartirde548mesuresdeterrain,estde5,1×10-5m/savecunécarttypede0,7deslogarithmes.Larégionmodélisées’étenddupiedmontdesAdirondacksjusqu’aufleuveSaint-Laurentetcouvre2850km2.Lemodèled’écoulementnumériqueaétédéveloppéaveclesimulateurd’élémentsfinis

470 CanadianWaterResourcesJournal/Revuecanadiennedesressourceshydriques
©2010CanadianWaterResourcesAssociation ©HerMajestyinRightofCanada
FEFLOW.Lemodèlecomprend13couches,dontl’épaisseurvariede5mausommetà75mà labase.L’épaisseurmoyennedumodèlenumérique est de 655 m pour un volumetotal de 1898 km3. Le fleuve Saint-Laurentest considéré comme une limite à chargeconstante, la base du modèle ainsi que laplupartdes limites latérales sont considéréescomme des limites à flux nul, alors que deslimites à charge et à conductivité définiessontspécifiéeslelongdescoursd’eauxetdesmilieux humides principaux. Une rechargespatialementdistribuéeaétéappliquéeentantquefluxspécifiqueausommetdumodèleetestconsidéréefixeafinderéduirelesincertitudesdumodèle.Lesprélèvementsd’eausouterrainesontde34Mm3/aetontétéassignésàlafoisentantquepuitspourlesprélèvementsmajeursetentantquefluxnégatifappliquéausommetdu modèle pour les usages domestiques etautresusagesdiffus.Lecalagedumodèleaétébasé sur153mesuresdechargehydraulique.La conductivité hydraulique horizontaleainsi que l’anisotropie verticale sont desparamètresdecalage.L’écoulementsouterrainest de 268 Mm3/a dont 12.7% sont soutiréspourlesusagesdomestiques.Lacontributionde l’aquifère au flux des cours d’eau et auxmilieux humides est de 176 Mm3/a alorsque 55 Mm3/a alimentent directement lefleuve Saint-Laurent. L’écoulement des eauxsouterraines semble contrôlé par la présencedefracturesdelitagehorizontalescausantuneanisotropieverticaleélevée.
Introduction
The Chateauguay River watershed extends overnortheasternNewYorkState(USA)andsouthwesternQuebec (Canada). In Quebec, it is a relativelydensely populated area with more than 215,000inhabitants. Approximately 117,000 inhabitants relyongroundwaterfortheirdailyneeds;41%obtaintheirwater supply from private wells. Most of the wellsarecompletedwithinthesedimentaryrockunitsthathost the regionalaquifer. Intensiveagriculture in thecentralpartofthebasinandindustrialactivitiestothe
north threaten the groundwater resource. Recently,several bottling companies have requested a permitto commercialize groundwater, which has initiateda regional debate over the status of groundwater(DagenaisandNastev,2005;Dagenais,2010).
Previouswork in thearea includesapreliminarydefinition of the hydraulic properties of the bedrockaquifersandaninventoryofmajorgroundwaterusers(McCormack, 1981). The former Mercier Lagoonswere extensively studied over the last 30 years todefinethecontextfordensenon-aqueousphaseliquid(DNAPL)contaminationandtodetermineitsextent(Poulin,1977;ForatekInternationalInc.,1982;1984;Groupe de Recherche et Environnement et Géo-Ingénierie (GREGI), 1993; Biogénie, 1995; GolderAssociés Ltée, 1995). Various hydraulic tests wereconductedaspartofexplorationformunicipalsupplywells or bottling wells, providing useful insight onthe hydraulic properties, water levels and well yields(Envir’EauPuits,1998;2003;Tecsult,2003).
The need for increased knowledge andunderstanding of the groundwater resource forits sustainable management led the Ministère duDéveloppement durable, de l’Environnement et desParcs du Québec (MDDEP) and Natural ResourcesCanadatoinitiateajointhydrogeologicalassessmentoftheChateauguayRiverwatershed(LamontagneandNastev,2010).Thispaperdescribes themethodologyusedtodefinethehydraulicpropertiesoftheregionalaquiferunits,buildandcalibrateanumericalmodeltosimulateregionalgroundwaterflow,andestimatethecomponentsoftheglobalwaterbudget.Thenumericalmodel was intended to improve the understandingof the regional groundwater flow dynamics and toprovideapracticaltoolforsustainablemanagementontheregionalscale,whichisdiscussedinacompanionpaper (Lavigne et al., 2010). The methodology usedin thedevelopmentof thenumericalmodel involvedthe following steps: collection of existing data,conceptualizationof thegroundwaterflow,fieldworkto complete the dataset on the hydraulic properties,exchangeofdatawithsimultaneouscompanionstudies(documented in this issue), revisionof the inventoryof the major groundwater users (Rutherford, 2005),andfinally,buildingandcalibrationof thenumericalmodelusing thefinite element simulatorFEFLOW(Diersch,1998a;1998b).

©2010CanadianWaterResourcesAssociation ©HerMajestyinRightofCanada
Lavigne,Nastev,andLefebvre 471
Study Area
The study area covers 2,850 km2 extending fromthe Adirondack foothills to the St. Lawrence River(Figure1).ItincludesmostoftheChateauguayRiverwatershed, as well as the La Guerre and St. LouisRiverwatershedstothewest,andtheLaTortueRiverandl’AcadieRiverwatershedstotheeast.Thebedrocksurfaceattainsanelevationof1,200metresabovesea
level(masl)tothesouthanddecreasestoapproximately18maslontheshoreoftheSt.LawrenceRiver.Inthecentral part of the study area, Covey Hill representsthe most important morphological feature with anelevation of more than 330 masl. The ChateauguayRiveroriginatesattheLowerandUpperChateaugayLakesintheAdirondacks.Majortributariesare,fromwesttoeast,theTroutRiver,auxOutardesRiver,anddesAnglaisRiver.
Montreal
9
10
6
6
54
32
1
74 30’’o
44
30
’’o
45
00
’’o
45
30
’’o
74 00’’o
73 30’’o
Explanation :
watershedlimit
model domainboundary
Havelock Breccia1
Precambrian rocks
Paleozoic rocks
10
Lorraine Gr. (Nicolet Fm.)Trenton Gr. (Tétreauville Fm.)Trenton Gr. (St. Michel Mb.)Chazy Gr. (Laval Fm.)Beekmantown Gr. (Theresa Fm.)Beekmantown Gr. (Beauharnois Fm.)Potsdam Gr. (Cairnside Fm.)Potsdam Gr. (Covey Hill Fm.)9
8
765
2
3
4
Havelo
cfa
ult
Stockwell fault
New York
Lake
St. Louis St. Lawrence
Riv
er
Beauharnois
St. Lawrence River
La Guerre River
Covey Hill
Huntington Hill
La TortueRiver
L’AcadieRiver
Chateauguay R
iver
Chate
auguay R
iver
LowerChateauguay
Lake
UpperChateauguay
Lake
Trout R
iveraux O
utardes R
iver
St. Louis
Riv
er
desAnglais R
iver
10 5 0 10 km
model domainboundary
watershedlimit
Quebec
roads
streams
Figure 1. Study area with bedrock geology (geology after Globensky, 1987; Isachsen and Fisher, 1970).

472 CanadianWaterResourcesJournal/Revuecanadiennedesressourceshydriques
©2010CanadianWaterResourcesAssociation ©HerMajestyinRightofCanada
Geology
The stratigraphic framework and structural geologyofthestudyareaarepresentedinFigure1.ThesearebasedprimarilyonstudiesconductedbyClark(1966),Wiesnet and Clark (1967), Globensky (1987), andIsachsenandFisher(1970),andarediscussedindetailbyLavigne et al. (2010).Thebedrockconsistsof thesedimentary sequences of the Cambro-OrdovicianSt.LawrencePlatform.ThesedimentaryrocksoverlietheunevensurfaceofthePrecambrianrocks,whichisconsideredasthelowerlimitofthegroundwaterflowdomain.Atthebaseofthesedimentarysequencearethe Potsdam sandstones, overlain by Beekmantowndolostone and Ordovician Limestone. The PotsdamsandstonesconsistofthelowerCoveyHillandupperCairnside(Clark,1966;Globensky,1987).TheCoveyHillFormationiscomposedmainlyofconglomeraticsandstone. The upper Cairnside Formation consistsof homogeneous quartz sandstone. The thicknessof the Covey Hill Formation ranges from 200 to500 m,whereastheaveragethicknessoftheCairnsideFormation, estimated from exposed field sectionsand cores, is more uniform and is approximately100 m thick. The dolostones of the BeekmantownGroup consist of the lower Theresa Formation,mainly quartz sandstonegradually transforming intodolomitic sandstone, and the upper BeauharnoisFormation, which consists of massive to laminateddolostones.Theircombinedthicknessrangesfrom50to100m.TheOrdovician limestonesare foundonlyin thenortheasternpartof thestudyarea.TheLavalFormation is the predominant unit with a thicknessofapproximately100m(Globensky,1987).Thisunitischaracterizedbywideverticalandhorizontalfaciesvariations.
TheregionalsedimentaryrockaquifersareoverlainbyunconsolidatedQuaternarysediments(Tremblayet al., 2010).The thickness of these deposits can be asgreatas45malongtheChateauguayRiver.Glacialtillconstitutesthebasalunitandisubiquitousacrossthestudyarea.Inseverallocations,fluvio-glacialdepositsincisethroughthetilllayerandareindirecthydrauliccontactwiththebedrock,e.g.,Mercieresker.Atlowerelevations (<60 masl), fine lacustrine and marinesediments overlie the glacial sediments, leading toconfinedaquiferconditions.
Regional Groundwater Flow
Figure 2 illustrates a simplified conceptual model ofregionalgroundwaterflow.TheaquiferunitsconsistofPaleozoicsandstone,dolostoneandlimestoneoverlainby Quaternary sediments. The type and thicknessof the hydrostratigraphic units define the regionalgroundwater flow conditions.Water table conditionsare found under shallow till and at rock outcropslocated at higher elevations to the south. Due to itsstratigraphicposition and its extensive lateral extent,the till controls most of the recharge in the studyarea (Croteau et al., 2010). High vertical downwardgradients occur at higher elevations and in areas ofsteeptopography.Inthevicinityofthefoothills,severallakesandwetlands indicate shallowwater tablesandpotentialdischargeareas.FurtherdownstreamwithintheChateauguayvalley,theregionalgroundwaterflowbecomes progressively horizontal. The occurrence offinemarinesedimentsconfinestheflowandrestrainsthe interaction between groundwater and surfacewaters. Discharge to streams and wetlands occursthroughoccasionalwindowsofcoarsersedimentsand/orrockoutcrops.Thesimplified3Dgeologicalmodel(Tremblay et al., 2010) allows the identification ofareasofpreferentialgroundwaterdischarge.
Field observations indicate that groundwaterflow is predominantly governed by the beddingplane structure of the sedimentary rocks, whereasflow associated with primary porosity is negligible.Geophysical logs of selected wells indicate thateach lithology supports its own flow system and ischaracterizedbyadistinctverticalanisotropy(Morinet al.,2007;Nastevet al.,2008).However,drawdowndata from large-scale pumping tests yield singlepermeability type curves typical for porous media,which are analyzed conventionally using the Theismethod (Freeze and Cherry, 1979). Considering theextent of the study area as well as the relatively lowdensityofinformation,anequivalentporousmediumapproachwasdeemedrepresentativeforthenumericalgroundwater flow model. The numerical model hasto account for several site-specific features: verticalanisotropy in areas of high hydraulic gradients;weathered surficial rock strata with increasedpermeability often observed in the field (Lavigne et al.,2005);andoccasionalcoarsefluvio-glacialdeposits,whichareindirecthydrauliccontactwiththeregionalbedrockaquifers.

©2010CanadianWaterResourcesAssociation ©HerMajestyinRightofCanada
Lavigne,Nastev,andLefebvre 473
Regional Hydraulic Properties
Estimation of the regional hydraulic properties wasbasedonvarious existingdata andan extensivefieldcampaignconductedaspartofthisstudy.Thedrillers’logs database (MDDEP, 2004) contains usefulinformationonwellinstallation(depthofwell,lengthofcasing,waterlevels,stratigraphy)andwellproductivity(apparent yields and observed drawdown). However,arigorousscreeningwasfirstappliedtothesedatainordertoremovepotentiallyerroneousvalues.Atotalof500recordswasretainedforfurtherstatisticalanalysis(Lavigne et al., 2005).Transmissivity estimates wereobtained from well productivity tests using Jacob’ssolution for radial flow to a well (Kruseman and deRidder,1990).AMATLABprogramwasdevelopedtoapplytheiterativeprocedureproposedbyBradburyandRothschild(1985).
Thefieldcampaignconsistedofcarryingoutslugtests, single well pumping tests and constant headinjectiontests.Slugtestswereconductedin11bedrockwells. Water level change data were interpretedusing the Uffink (1984) and van der Kamp (1976)methodsfortheunderdampedcases;theCooperet al.(1967)andBouwerandRice(1976)methodsfortheoverdampedcases;andtheButlerandGarnett(2000)methodforthedampedcases.Constantheadinjectiontestswereconductedin12bedrockwellsover3mlongintervalsisolatedbyapackersystem.Verticalprofilesof the transmissivity were obtained by applying theThiem solution for steady-state radial flow (GodinandRouleau,2004).Finally, a totalof23 singlewellpumping tests were conducted throughout the studyarea.Thedurationofthetestsvariedfromtwohourstofivemonths,withpumping rates ranging from15to1600 L/min.Themeasureddrawdownvariedfrom
Confined aquifer
Chateauguay River
Recharge
Covey Hill
S
N
Regional gw flow
Water table / semi-confined
aquifer
Discharge
Aluvial deposits (sand)Marine sediments (silt, clay)Glacial deposits (till)Glaciofluvial sediments (sand, gravel)Sedimentary rocksStream
Figure 2. Conceptual model of regional groundwater flow.
474 CanadianWaterResourcesJournal/Revuecanadiennedesressourceshydriques
©2010CanadianWaterResourcesAssociation ©HerMajestyinRightofCanada
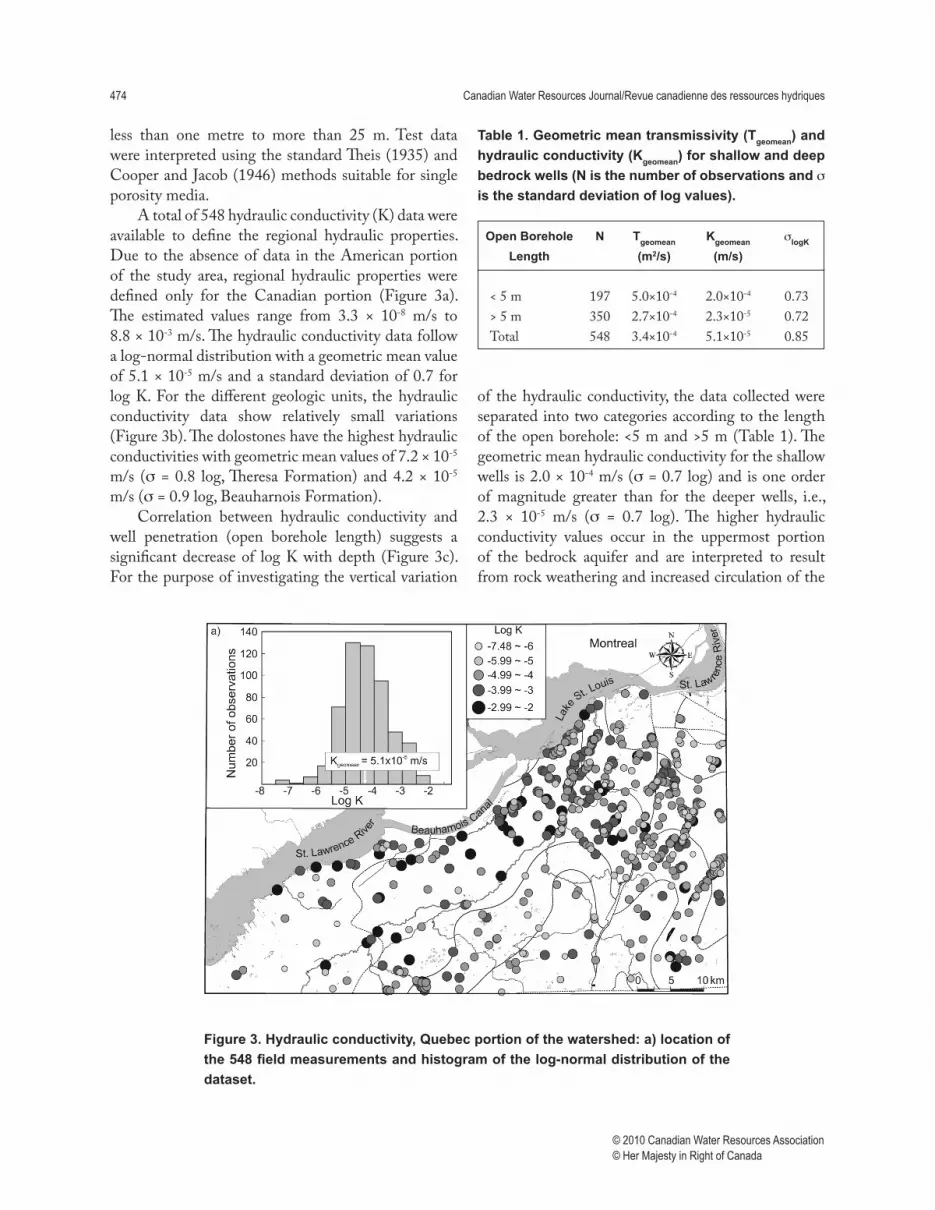
less than one metre to more than 25 m. Test datawereinterpretedusingthestandardTheis(1935)andCooperandJacob(1946)methodssuitableforsingleporositymedia.
Atotalof548hydraulicconductivity(K)datawereavailable to define the regional hydraulic properties.Duetotheabsenceofdata in theAmericanportionof the study area, regional hydraulic properties weredefined only for the Canadian portion (Figure 3a).The estimated values range from 3.3 × 10⁻⁸ m/s to8.8 × 10-3m/s.Thehydraulicconductivitydatafollowalog-normaldistributionwithageometricmeanvalueof5.1×10-5m/sandastandarddeviationof0.7forlogK.For thedifferentgeologicunits, thehydraulicconductivity data show relatively small variations(Figure3b).Thedolostoneshavethehighesthydraulicconductivitieswithgeometricmeanvaluesof7.2×10-5m/s (s =0.8 log,TheresaFormation) and4.2×10-5m/s(s=0.9log,BeauharnoisFormation).
Correlation between hydraulic conductivity andwell penetration (open borehole length) suggests asignificantdecreaseof logKwithdepth (Figure3c).Forthepurposeofinvestigatingtheverticalvariation
of thehydraulicconductivity, thedatacollectedwereseparatedintotwocategoriesaccordingtothelengthoftheopenborehole:<5mand>5m(Table1).Thegeometricmeanhydraulicconductivityfortheshallowwellsis2.0×10-4m/s(s=0.7log)andisoneorderof magnitude greater than for the deeper wells, i.e.,2.3 × 10-5 m/s (s = 0.7 log). The higher hydraulicconductivity values occur in the uppermost portionof the bedrock aquifer and are interpreted to resultfromrockweatheringandincreasedcirculationofthe
Table 1. Geometric mean transmissivity (Tgeomean) and hydraulic conductivity (Kgeomean) for shallow and deep bedrock wells (N is the number of observations and s is the standard deviation of log values).
Open BoreholeLength
N Tgeomean (m2/s)
Kgeomean (m/s)
slogK
<5m 197 5.0×10⁻⁴ 2.0×10⁻⁴ 0.73>5m 350 2.7×10⁻⁴ 2.3×10⁻⁵ 0.72Total 548 3.4×10⁻⁴ 5.1×10⁻⁵ 0.85
Figure 3. Hydraulic conductivity, Quebec portion of the watershed: a) location of the 548 field measurements and histogram of the log-normal distribution of the dataset.

©2010CanadianWaterResourcesAssociation ©HerMajestyinRightofCanada
Lavigne,Nastev,andLefebvre 475
-8
-7
-6
-5
-4
-3
-2
-1b)
Covey HillTotal Cairnside Theresa Beauharnois Laval
Min
Max
+�
Avg.
-�Log
K
n=547 n=18 n=192 n=32n=260n=45
Log K
Open
bore
hole
length
(m)
0c)
25
50
75
100
125
150-1-2-3-4-5-6-7-8
n = 547r = 0.6-� +�
Figure 3 continued. b) box plot of geometric mean values and standard distribution of Log K (K in m/s); and c) Log K against open borehole length (after Lavigne et al., 2005).

476 CanadianWaterResourcesJournal/Revuecanadiennedesressourceshydriques
©2010CanadianWaterResourcesAssociation ©HerMajestyinRightofCanada
groundwaterattheinterfacewiththeunconsolidateddeposits. An additional explanation for these resultsisthattheopenboreholelengthcanbeconsideredasabiased indicator, aswells aregenerallydrilleduntilsufficient yield is obtained. Thus, a deep well willgenerally yield a lower hydraulic conductivity valuethanashallowwellgiventhatbothwellsprovidethesameamountofwater.
Numerical Model
Model Structure
The finite element code FEFLOW v.5.1 (Diersch,1998a;1998b)wasusedtodevelopthenumericalmodelfor simulating regional groundwater flow. As shownin Figure 1, the model domain extends beyond theChateauguayRiverwatershedtoincludethewatershedsof the La Guerre River and St. Louis River to thewest,whichbothdrain into theSt.LawrenceRiver tothe north, and the Acadie River and LaTortue Riverwatershedstotheeast.Thesewatershedswereincludedin the model domain because groundwater flow wasinferredtoextendbeyondthehydrologicallimitsoftheChateauguay River watershed. The geological contactbetweensedimentaryandPrecambrianrocks isusedas
the southern model boundary which follows the flowlinestotheChateauguayRiver,thusrepresentingnoflowboundaries.TheAdirondackuplandswerenotincludedinthemodelastheyarerelativelyimperviousandmostoftheprecipitationrunsoffdirectlytosurfacewaters.
Thegeneratedfiniteelementsrange insize from100minareaswithelevatedhydraulicgradients,i.e.,in the vicinity of important wells, rivers and steeptopography, to approximately 1000 m elsewhere(Figure 4). Thirteen layers were defined to simulateregional groundwater flow. The first layer representsthe more permeable upper portion of the bedrockaquifersandthefluvio-glacialdeposits.Itwasassigneda thickness ranging from 5 to 20 m. Layers 2 to 9representthemorefracturedsedimentaryrockstrata.Layers 10 to 13 represent the deeper, less fracturedsedimentaryand/orcrystallinerocks.Layerthicknessincreases gradually with depth to 75 m for layer 12.Layer13attainsathicknessofupto400msothebaseofthemodelisflatandlocatedatanelevationof555 mbelowsealevel.Thisapproachaccuratelycapturestheregionalfeaturesofgroundwaterflowwithoutlimitingthe model depth.The model domain covers an areaof 2,850 km2 with a total volume of 1,868 km3 andan average thickness of 655 m. The model contains260,176nodes(18,584nodesperlayer),and476,788meshelements(36,676elementsperlayer).
Figure 4. Finite element numerical grid with assigned boundary conditions. Layer thicknesses are shown in the inset.

©2010CanadianWaterResourcesAssociation ©HerMajestyinRightofCanada
Lavigne,Nastev,andLefebvre 477
Flow Boundaries and Materials
Thenorthernmodel boundarywas set as a specifiedhead boundary at the elevation of the St. LawrenceRiver (Figure 4). The assigned water levels wereextracted from the Environment Canada gaugingstation network (Environment Canada, 2004) anddecreaseinelevationinawest-eastdirectionfrom46 mto15m.Animportantheaddropof17moccursatthedam locatedat thenorthernendof theBeauharnoisCanal.Inaddition,specifiedheadboundarieswereseton the eastern side along the Acadie and LaTortueRivers to simulate groundwater outflow from themodel. The remaining lateral limits, defined on thebasisofthesurfacewaterdivideandflowlines,aswellasthebaseofthemodel,wereconsideredasno-flowboundaries.Head-dependantboundarieswereusedtosimulatetheinteractionoftheaquiferwiththemajorstreamsandwetlandsinthestudyarea.Astheaquiferdrains to the surface water, the flux was constrainedto an outgoing direction only in order to avoid anyinfiltration.Theelevationsoftheriverbedsweresetto,onaverage,5mbelowthegroundsurface.
A spatially variable recharge rate was assigned asa specified flux across the top layer of the model.TherechargeratewasestimatedbyCroteauet al.(2010)andvariesspatiallyfrom0mm/yrtomorethan400mm/yr,withanannual averageof86mm/yr.Majormunicipaland industrial wells and rock quarries were simulatedas sinks.They account for 19Mm3/yr, or ~56%of thetotal groundwater withdrawal in the study area, whichis estimated at approximately 34 Mm3/yr (Rutherford,2005). The remaining 15 Mm3/yr, used mainly fordomesticandagriculturalpurposes,issimulatedasdiffusegroundwater withdrawal, i.e., a uniform withdrawal(-5 mm/yr)ratewassubtractedfromthetoplayer.
Hydraulic Conductivities
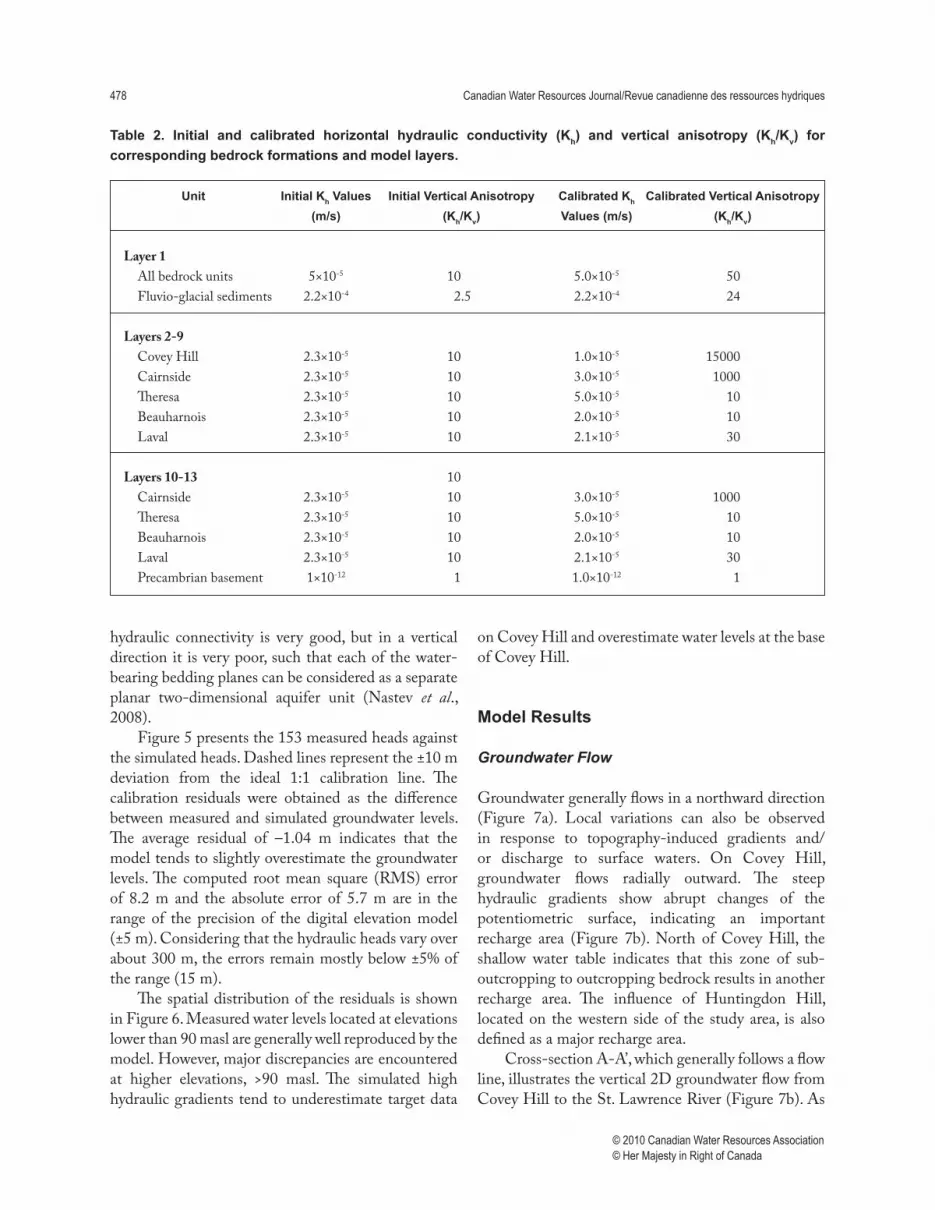
Initialvaluesofthehorizontalhydraulicconductivitywere assigned to each layer prior to the calibrationprocess. A horizontal hydraulic conductivity (Kh) of5×10-5m/swasassignedtolayer1(Table2),basedonthegeometricmeanhydraulicconductivityof thebedrockaquifersdeterminedfromthehydraulictests.Avalueof2.2×10-4m/swasassignedtothefluvio-glacial sediments (Pontlevoy et al., 2004). Lowermodel layers were assigned a horizontal hydraulic
conductivityvalueof2.3×10-5m/sequivalenttothegeometric mean value for the 349 wells with openborehole length >5 m (Table 2). A lower hydraulicconductivity value of 1 × 10-12 m/s was assumed forthemeshelementsinlayers10to13,whichrepresentthe Precambrian rocks, as suggested by Freeze andCherry (1979). All conductivities were assigned asuniforminthehorizontaldirection(i.e.,isotropic).Intheverticaldirection,aninitialanisotropy(Kh/Kv) wassetat10.Theverticalanisotropywassetto2.5forgridelements representing thefluvio-glacialdeposits.ForthePrecambrianbasement,thehorizontalandverticalhydraulicconductivitiesweresetequal.
Calibration
The numerical model was calibrated against 153measuredgroundwaterlevels.Asimpletrialanderrormethod was used under a steady state flow regime.Throughout the calibration process, the spatiallydistributed recharge rate and the imposed boundaryconditions remained constant, limiting the degreesof freedom of the model. Horizontal hydraulicconductivityandverticalanisotropywerebothusedascalibrationparameters.
ThecalibratedhorizontalhydraulicconductivitiesaregiveninTable2.Theseareveryclosetotheinitialvaluesandthegeometricmeanvaluesdiscussedearlier,suggestingthatthefielddataarerepresentativeoftheregionalhydraulicproperties.Suchcoherentbehaviourof the hydraulic conductivity at local and regionalscales contrasts with other groundwater modellingstudieswhereanup-scalingofthehydraulicpropertieswas needed in order to calibrate the regional flowmodels (Rovey and Cherkauer, 1995; Sánchez-Vilaet al., 1996; Schultze-Makuch and Cherkauer, 1998;Schultze-Makuch et al., 1999; Martinez-Landa andCarrera, 2005). However, to reproduce the observedhigh hydraulic gradients combined with relativelyshallowhydraulicheadsandrelativelyhighhorizontalhydraulic conductivities, the calibrated verticalanisotropy was increased significantly to more thanfour orders of magnitude in Covey Hill sandstone.Such high anisotropy values are consistent withobservations from previous hydrogeological studies,whichidentifiedthatthegroundwaterflowonCoveyHill is sustained mainly through sub-horizontal,laterallyextensive fractures.Therespectivehorizontal
478 CanadianWaterResourcesJournal/Revuecanadiennedesressourceshydriques
©2010CanadianWaterResourcesAssociation ©HerMajestyinRightofCanada
hydraulic connectivity is very good, but in a verticaldirectionitisverypoor,suchthateachofthewater-bearingbeddingplanescanbeconsideredasaseparateplanar two-dimensional aquifer unit (Nastev et al.,2008).
Figure5presentsthe153measuredheadsagainstthesimulatedheads.Dashedlinesrepresentthe±10 mdeviation from the ideal 1:1 calibration line. Thecalibration residuals were obtained as the differencebetweenmeasuredandsimulatedgroundwater levels.The average residual of –1.04 m indicates that themodeltendstoslightlyoverestimatethegroundwaterlevels.The computed rootmean square (RMS) errorof 8.2 m and the absolute error of 5.7 m are in therangeof theprecisionof thedigital elevationmodel(±5m).Consideringthatthehydraulicheadsvaryoverabout300m,theerrorsremainmostlybelow±5%oftherange(15m).
Thespatialdistributionoftheresiduals isshowninFigure6.Measuredwaterlevelslocatedatelevationslowerthan90maslaregenerallywellreproducedbythemodel.However,majordiscrepanciesareencounteredat higher elevations, >90 masl. The simulated highhydraulicgradientstendtounderestimatetargetdata
onCoveyHillandoverestimatewaterlevelsatthebaseofCoveyHill.
Model Results
Groundwater Flow
Groundwatergenerallyflowsinanorthwarddirection(Figure 7a). Local variations can also be observedin response to topography-induced gradients and/or discharge to surface waters. On Covey Hill,groundwater flows radially outward. The steephydraulic gradients show abrupt changes of thepotentiometric surface, indicating an importantrecharge area (Figure 7b). North of Covey Hill, theshallow water table indicates that this zone of sub-outcroppingtooutcroppingbedrockresultsinanotherrecharge area. The influence of Huntingdon Hill,locatedon thewestern sideof the studyarea, is alsodefinedasamajorrechargearea.
Cross-sectionA-A’,whichgenerallyfollowsaflowline,illustratesthevertical2DgroundwaterflowfromCoveyHilltotheSt.LawrenceRiver(Figure 7b).As
Table 2. Initial and calibrated horizontal hydraulic conductivity (Kh) and vertical anisotropy (Kh/Kv) for corresponding bedrock formations and model layers.
Unit Initial Kh Values (m/s)
Initial Vertical Anisotropy(Kh/Kv)
Calibrated Kh Values (m/s)
Calibrated Vertical Anisotropy(Kh/Kv)
Layer 1 Allbedrockunits 5×10⁻⁵ 10 5.0×10⁻⁵ 50 Fluvio-glacialsediments 2.2×10⁻⁴ 2.5 2.2×10⁻⁴ 24
Layers 2-9 CoveyHill 2.3×10⁻⁵ 10 1.0×10⁻⁵ 15000 Cairnside 2.3×10⁻⁵ 10 3.0×10⁻⁵ 1000 Theresa 2.3×10⁻⁵ 10 5.0×10⁻⁵ 10 Beauharnois 2.3×10⁻⁵ 10 2.0×10⁻⁵ 10 Laval 2.3×10⁻⁵ 10 2.1×10⁻⁵ 30
Layers 10-13 10 Cairnside 2.3×10⁻⁵ 10 3.0×10⁻⁵ 1000 Theresa 2.3×10⁻⁵ 10 5.0×10⁻⁵ 10 Beauharnois 2.3×10⁻⁵ 10 2.0×10⁻⁵ 10 Laval 2.3×10⁻⁵ 10 2.1×10⁻⁵ 30 Precambrianbasement 1×10-12 1 1.0×10⁻¹² 1

©2010CanadianWaterResourcesAssociation ©HerMajestyinRightofCanada
Lavigne,Nastev,andLefebvre 479
Figure 5. Relationship between observed and simulated heads at the 153 reference points. Solid line represents the 1:1 and dashed lines represent a deviation of ± 10 m. Inset shows a histogram of head residuals.
Figure 6. Spatial distribution of residuals, Quebec portion of the watershed.

480 CanadianWaterResourcesJournal/Revuecanadiennedesressourceshydriques
©2010CanadianWaterResourcesAssociation ©HerMajestyinRightofCanada
discussed,rechargeoccursprimarilyinthevicinityofCovey Hill where the groundwater flow direction ispredominantly vertical. Groundwater flow becomesprogressively horizontal further downstream anddischarge occurs in both the Chateauguay and St.Lawrence Rivers, as indicated by the sub-verticalequipotential lines. The cross-section supports theconceptualgroundwaterflowmodelshowninFigure 2.
Groundwater Discharge
SimulateddischargetosurfacewatersgiveninTable 3compares reasonably well with baseflows estimatedfromhistoricalhydrographrecordslocatedatthemouthofdesAnglaisandChateauguayRivers(Croteauet al.,2010).The ratios of baseflow to streamflow indicatethatapproximatelyhalfofthebaseflowstreamfluxissustainedbygroundwater fromthe regional aquifers.The remaining 50% may be attributed to perchedaquifersand/ortorapidsubsurfacedrainageofsurfacewatersthatinfiltratethegroundwithoutreachingtheregionalaquifers.
Water Budget
Figure8showsaschematiccross-sectionoftheannualglobal water budget obtained from the steady-statesimulation.Thegroundwater budget components aredetailed in Table 4. Regional groundwater flow inthe study area amounts to 268 Mm3/yr. The majorinput to groundwater flow is direct recharge, whichaccounts for 91.4% (245 Mm3/yr). The remaining8.6%(23 Mm3/yr)entersthegroundwaterflowsystemthrough induced recharge near the Chateauguay
municipalwellsandasunderflowattheBeauharnoishydroelectricdam.Thedamcreatesanupstreamlakethat causes infiltration of surface waters into theaquifers.Avolumeof176 Mm3/yr(65.7%)isdrainedto streams and wetlands. Approximately 55 Mm3/yr(20.5%)discharges to theSt.LawrenceRiver,whichisthemajordrainageboundary.Thetotalgroundwateruse (as diffuse and specified wells) represents 12.7%(34 Mm3/yr) of the annual flow. Finally, underflowleavingtheeasternpartofthemodeldomainaccountsfor3Mm3/yr(1.1%)andrepresentsthegroundwaterdrainedbytheimposedheadboundariesthatsimulatethetruncatedwatershedsofthel’AcadieandLaTortueRivers.
Conclusion
AnumericalmodelwasdevelopedtosimulateregionalgroundwaterflowintheChateauguayRiverwatershed.The model represents an important step towardsunderstanding the groundwater flow dynamics at aregional scale, and provides the necessary input forfuturegroundwatermanagementstrategieswithinthewatershed.
The regional aquifer units consist of fracturedPaleozoic sedimentary rocks with occasional fluvio-glacial sediments over top. Analysis of the hydraulicproperties suggests that groundwater flow, which iscontrolledbysub-horizontalbeddingplanes, ismoreimportant at shallow depths. The geometric meanhorizontalhydraulicconductivityfortheshallowwells,i.e.,those<5m,ishigherbyoneorderofmagnitudecomparedtothegeometricmeanhorizontalhydraulicconductivityofthedeeperwells,i.e.,those>5m.Thiscanbeattributed toagreateroccurrenceof fracturesnearthebedrocksurface.Drawdownresponsesduringpumping tests follow mainly a Theis response forsingle porosity media, indicating that the aquifersarehighlyfractured.Aporousmediumapproachwasthus applied for the construction of the numericalgroundwaterflowmodelattheregionalscale.
ThefiniteelementsimulatorFEFLOWwasusedfor the simulations.Thenumericalmodel consistsof13layers,withincreasingthicknessesfrom5to75 m.The average thickness of the model was 655 m fora total volume of 1,868 km3. Model calibration wasachieved using horizontal hydraulic conductivityvaluesthatareclosetothegeometricmeanvaluesfor
Table 3. Average streamflow and baseflow contribution obtained from hydrographs for the Chateauguay and des Anglais Rivers, and simulated aquifer discharge that should correspond to baseflow.
River Station IDAverage
StreamflowEstimated Baseflow
Simulated Discharge
Mm3/yr Mm3/yr Mm3/yr
Chateauguay 02OA054 1200 243 119desAnglais 02OA059 300 58 31

©2010CanadianWaterResourcesAssociation ©HerMajestyinRightofCanada
Lavigne,Nastev,andLefebvre 481
0 10 205 km
A’
a) Montreal
New York
Lake
St. Louis St. Lawrence
Riv
er
Beauharnois
St. Lawrence Rive
r Can
al
Chateaugua
r
yR
ive
Ch
âteaug
ua
yR
iv
er
60
70
80
50
100
150
300
250
200
150
20
550
40
30
350
400450
500
600
550500450400350
200
50
40
30
60
70
80
90
Major groundwaterwithdrawal
Drainage network
GW flow direction
Legend
Potentiometric lines
250
100
90
A
0 5 10 km
A’
125
300
125
80
6050
40
30
45
35
25
ChateauguayRiver
St. LawrenceRiver
300
250
200
150
10
0
A A’
Des AnglaisRiver
Vertical exaggeration: 25X
b)
125
Figure 7. a) Simulated potentiometric surface of the top layer, and b) cross-section representing simulated hydraulic heads.

482 CanadianWaterResourcesJournal/Revuecanadiennedesressourceshydriques
©2010CanadianWaterResourcesAssociation ©HerMajestyinRightofCanada
each aquifer unit. Spatially distributed groundwaterrecharge,estimatedbyCroteauet al. (2010),wasnotvariedduringmodelcalibrationinordertoconstrainthe variability of the model results. The only othercalibration parameter was the vertical anisotropy,which required relatively high values for calibration;one (dolostone and limestone) to more than fourorders of magnitude (Covey Hill sandstone). Suchhigh anisotropy is consistentwith observations fromearlierstudies,whichsuggestthatflowinCoveyHillsandstone occurs mainly through sub-horizontal,laterallyextensive fractures.Thenumericalmodellingresults thus corroborate the suspected poor verticalconnectivity between these planar two-dimensionalaquiferunits.
Numerical simulations were carried out undersaturatedandsteady-stateflowconditions.Theglobal
waterbudgetindicatesthatregionalgroundwaterflowwithinthestudyareaamountsto268Mm3/yr.Arealrecharge is the major input to the regional aquifersat245Mm3/yr(91.4%oftotalflow),whereasthe23Mm3/yr (8.6%) enters the aquifer via induced riverbankrecharge.Avolumeofapproximately234 Mm3/yr (87.3%) discharges to surface waters throughstreamsandwetlands,andtotheSt.LawrenceRiverastheregionaldrainagezone.Groundwaterwithdrawalfor industrial, agricultural and domestic purposesaccounts for 34 Mm3/yr (12.7%). In the companionpaperbyLavigneet al.(2010)thenumericalmodelisusedtosimulatedifferentstressandclimatescenariostoassessthesustainabilityofgroundwaterresourcesintheChateauguayRiverwatershed.
Table 4. Simulated groundwater budget.
Input Output Input Output Mm3/yr Mm3/yr (%) (%)
Recharge 245 91.4%Inducedrecharge 23 8.6%Withdrawal(specificwells) 19 7.1%Withdrawal(diffuse) 15 5.6%Dischargetointermediatestreams 176 65.7%DischargetoSt.LawrenceRiver 55 20.5%Underflow 3 1.1%Totalregionalflow 268 268 100.0% 100.0%
Figure 8. Global water budget. Budget components in Mm3/yr.

©2010CanadianWaterResourcesAssociation ©HerMajestyinRightofCanada
Lavigne,Nastev,andLefebvre 483
Acknowledgements
Thisworkwas jointlysupportedbytheMinistèreduDéveloppement durable, de l’Environnement et desParcsduQuébec,theGeologicalSurveyofCanada,andl’Institutnationaldelarecherchescientifique,CentreEauTerreEnvironnement(INRS-ETE).Theauthorsacknowledge Anne Croteau and Daniel Blanchettefrom INRS-ETE for their useful contributions anddiscussions.SupportfromaNSERCDiscoverygranttoRenéLefebvreisalsoacknowledged.
References
Biogénie. 1995. Campagne de forage dans la région de Mercier. Rapport technique préparé pour leMinistèredel’EnvironnementduQuébec,10pp..
Bouwer, H. and R. C. Rice. 1976. A slug test fordetermininghydraulicconductivityofunconfinedaquifers with completely or partially penetratingwells.Water Resources Research12(3):423-428.
Bradbury, K. R. and E. R. Rothschild. 1985. Acomputerized technique for estimating thehydraulic conductivity of aquifers from specificcapacitydata.Groundwater23(2):240-246.
Butler,J.J.Jr.andE.J.Garnett.2000.Simple procedures for analysis of slug tests in formations of high hydraulic conductivity using spreadsheet and scientific graphics software. Open-file Report 2000-40. Lawrence,Kansas:KansasGeologicalSurvey,23pp.
Clark, T. H. 1966. Chateauguay area - Chateauguay, Huntingdon, Beauharnois, Napierville, and St. Jean counties.GeologicalReport122.Quebec:QuebecDepartmentofNaturalResources,63pp.
Cooper,H.H.,J.D.Bredehoeft,andS.S.Papadopoulos.1967. Response of a finite-diameter well to aninstantaneous charge of water. Water Resources Research3(1):263-269.
Cooper, H. H. and C. E. Jacob.1946. A generalizedgraphicalmethodforevaluatingformationconstantsand summarizing well-field history. Transactions American Geophysical Union27(4):526-534.
Croteau, A., M. Nastev, and R. Lefebvre. 2010.Groundwater recharge assessment in theChateauguay River watershed. Canadian Water Resources Journal35(4):451-468.
Dagenais, M.-P. 2010. Analyse sociologique del’allocation de l’eau souterraine: L’exemple deFranklin, Québec. Canadian Water Resources Journal35(4):543-556.
Dagenais,M.-P.andM.Nastev.2005.Acasestudyofaconflictovergroundwater:Whenhydrogeologyisnotsufficient.InProceedings of the 58th Canadian Geotechnical Society and 6th Joint Groundwater Specialty Conference of the International Association of Hydrogeologists-Canadian National Chapter and Canadian Geotechnical Society, Saskatoon,Saskatchewan,September18-21,2005,8pp,CDversion.
Diersch,H.-J.G.1998a.FEFLOW Reference manual.Berlin, Germany: WASY, Institute of WaterResources Planning and System Research Ltd.,278pp.
Diersch, H.-J. G. 1998b. FEFLOW Users manual.Berlin, Germany: WASY, Institute of WaterResources Planning and System Research Ltd.,168pp.
Envir’eauPuits.1998.Étude hydrogéologique.Rapporttechnique préparé pour Les Vergers Leahy Inc.,dans lecadred’unedemanded’autorisationpourl’établissementd’uneprised’eaucommerciale surlelot15AduRang1deRusseltownduCantondeFranklin,31pp.
Envir’eauPuits.2003.Informations complémentaires au rapport hydrogéologique de Février 2002. Rapporttechnique préparé pour Les Vergers Leahy Inc.,dans lecadred’unedemanded’autorisationpourl’établissementd’uneprised’eaucommerciale surlelot15AduRang1deRusseltownduCantondeFranklin,22pp.
EnvironmentCanada.2004.Hydrometricdata-Hydat.http://www.wsc.ec.gc.ca/products/hydat/main_e.cfm?cname=hydat_e.cfm(accessedMarch2006).

484 CanadianWaterResourcesJournal/Revuecanadiennedesressourceshydriques
©2010CanadianWaterResourcesAssociation ©HerMajestyinRightofCanada
ForatekInternationalInc.1982.Étude hydrogéologique de faisabilité du captage des eaux contaminées extraites de la nappe aquif ère de Ville Mercier.Foratekrapport514,ProjetFFg81037,27pp.
Foratek International Inc. 1984. Projet MENVIQ-MERCIER. Rapport technique relatif à l ’aménagement des ouvrages de captage et d’observation de la nappe aquif ère contaminée de Ville Mercier.PréparépourleMinistèredel’EnvironnementduQuébec,16pp.
Freeze, R. A. and J. A. Cherry. 1979. Groundwater.EnglewoodCliffs,NJ:PrenticeHallInc.,604pp.
Globensky,Y.1987.Géologie des Basses-Terres du Saint-Laurent,RapportMM85-02,Québec:Ministèrede l’énergie et des ressources, Direction généraledel’explorationgéologiqueetminérale,63pp.
Godin,R.andA.Rouleau.2004.Essais perméamétriques en forage dans le socle rocheux du bassin versant de la rivière Châteauguay. Rapport technique remis auMinistèreduDéveloppentdurable,Environnementet des Parcs du Québec. Chicoutimi, Québec:Centre d’Études sur les Ressources Minérales,UniversitéduQuébecàChicoutimi,114pp.
GolderAssociésLtée.1995. Installation de trois puits d’observation dans le roc et suivi environnemental de la qualité de l ’eau souterraine près de la cellule Boliden à Ville Mercier. Montréal: Golder Associés Ltée,18pp.
Groupe de Recherche et Environnement etGéo-Ingénierie (GREGI). 1993. Aquifer decontamination for toxic organics: The case study of Ville-Mercier, Québec. Final report, Volume II.Québec:UniversitéLaval,270pp.
Isachsen, Y. W. and D. W. Fisher. 1970. Geologic map of New York, Adirondack Sheet. New YorkState Museum, Map and Chart Series 15, scale1:250000.
Kruseman,G.P.andN.A.deRidder.1990.Analysis and evaluation of pumping test data, 2nd Ed.Wageningen, The Netherlands: InternationalInstituteforLandReclamationandImprovement,375pp.
Lamontagne, C. and M. Nastev. 2010. Survolhydrogéologique de l’aquifère transfrontalier dubassinversantde la rivièreChâteauguay,Canada- États-Unis. Canadian Water Resources Journal35(4):359-376.
Lavigne,M.-A.,M.Nastev,R.Lefebvre,D.Blanchette,A.Croteau,N.Benoit,andC.Lamontagne.2005.Hydraulicpropertiesofsedimentaryrockaquifersin the Châteauguay River Watershed, Quebec,Canada. In Proceedings of the 58th Canadian Geotechnical Society and 6th Joint IAH-CNC and CGS Groundwater Specialty Conference,Saskatoon,Saskatchewan,September18-22,2005,8pp.(CDversion).
Lavigne, M.-A., M. Nastev, R. Lefebvre, and A.Croteau. 2010. Regional sustainability of theChateauguay River aquifers. Canadian Water Resources Journal 35(4): 487-502.
Martinez-Landa,L.andJ.Carrera.2005.Ananalysisof hydraulic conductivity scale effects in granite(Full-scale Engineered Barrier Experiment(FEBEX),Grimsel,Switzerland).Water Resources Research41(3):13.
McCormack, R. 1981. Étude hydrogéologique du bassin versant de la Châteauguay.E.F.-2.Québec:Ministèredel’Environnement,Directiongénéraledesinventairesetdelarecherche,175pp.
Ministère du Développement durable, del’Environnement et des Parcs du Québec(MDDEP).2004.http://www.mddep.gouv.qc.ca/eau/souterraines/sih/index.htm (accessed March2006).
Morin,R.,R.Godin,M.Nastev,andA.Rouleau.2007.Hydrogeologic controls imposed by mechanicalstratigraphy in layeredrocksof theChateauguayRiver Basin, a U.S.-Canada transborder aquifer.Journal of Geophysical Research112:B04403.

©2010CanadianWaterResourcesAssociation ©HerMajestyinRightofCanada
Lavigne,Nastev,andLefebvre 485
Nastev,M.,R.Morin,R.Godin,andA.Rouleau.2008.Developing a conceptual hydrogeological modelforPotsdamsandstonesinsouthwesternQuebec,Canada.Hydrogeology Journal16:373-388.
Pontlevoy,O.,R.Lefebvre,R.Therrien,R.Martel,M.Ouellet, and C. Lamontagne. 2004. Numericalmodellingofgroundwaterflowandmasstransportin interconnected granular and rock aquifers attheVilledeMercierDNAPLcontaminatedsite,Quebec,Canada.InProceedings of the 57th Canadian Geotechnical Society and 5th Joint Groundwater Specialty Conference of the International Association of Hydrogeologists-Canadian National Chapter and Canadian Geotechnical Society.Ed.D.Demers,D.Leahy, R. Lefebvre, S. Leroueil and R. Martel,Quebec City, Quebec, October 24-27, 2004, pp.20-27.
Poulin,M.1977.GroundwatercontaminationnearaliquidwasteLagoon,M.Sc.Thesis,UniversityofWaterloo,158pp.
Rovey, C. W. and D. S. Cherkauer. 1995. Scaledependency of hydraulic conductivitymeasurements.Ground Water33(5):769-780.
Rutherford, A. 2005. Well inventory study. Sainte-Martine, Quebec: Société de conservation etd’aménagementdubasindelarivièreChâteauguay(SCABRIC),86pp.
Sánchez-Vila, X., J. Carrera, and J. P. Girardi. 1996.Scaleeffectsintransmissivity.Journal of Hydrology183:1-22.
Schultze-Makuch, D. and D. S. Cherkauer. 1998.Variationsinhydraulicconductivitywithscaleofmeasurementduringaquifertestsinheterogeneous,porous carbonate rocks. Hydrogeology Journal 6:204-215.
Schultze-Makuch,D.,D.A.Carlson,D.S.Cherkauer,andP.Malik.1999.Scaledependencyofhydraulicconductivity in heterogeneous media. Ground Water37(6):904-919.
Tecsult.2003.Aménagement du puits de production PP-2 source Athelstan, Hinchinbrooke (Québec).Montréal:Tecsult,58pp.
Theis,C.V.1935.Therelationbetweentheloweringofthepiezometricsurfaceandtherateanddurationofdischargeofawellusinggroundwaterstorage.TransactionsAmerican Geophysical Union16:519-524.
Tremblay,T.,M.Nastev,andM.Lamothe.2010.Grid-based Hydrostratigraphic 3D Modelling of theQuaternary Sequence in the Châteauguay RiverWatershed, Quebec. Canadian Water Resources Journal35(4):pagerange.
Uffink,G.J.M.1984.Theory of the oscillating slug test.UnpublishedResearchReport.Bilthoven:NationalInstitute for Public Health and EnvironmentalHygiene,18pp.
Van der Kamp, G. 1976. Determining aquifertransmissivitybymeansofwellresponsetests:Theunderdampedcase.Water Resources Research12(1):71-77.
Wiesnet, D. R. andT. H. Clark. 1966.The bedrockstructureofCoveyHillandvicinity,northernNewYorkandsouthernQuebec.U.S. Geological Survey Professional Paper550-D:D35-D-38.


