Embed Size (px)
Citation preview

This article appeared in a journal published by Elsevier. The attachedcopy is furnished to the author for internal non-commercial researchand education use, including for instruction at the authors institution
and sharing with colleagues.
Other uses, including reproduction and distribution, or selling orlicensing copies, or posting to personal, institutional or third party
websites are prohibited.
In most cases authors are permitted to post their version of thearticle (e.g. in Word or Tex form) to their personal website orinstitutional repository. Authors requiring further information
regarding Elsevier’s archiving and manuscript policies areencouraged to visit:
http://www.elsevier.com/copyright

Author's personal copy
Molecular and Cellular Endocrinology 307 (2009) 57–67
Contents lists available at ScienceDirect
Molecular and Cellular Endocrinology
journa l homepage: www.e lsev ier .com/ locate /mce
Modeling of oscillatory bursting activity of pancreatic beta-cells under regulatedglucose stimulation
Yin Hoon Chewc, Yoke Lin Shiaa, Chew Tin Leea,∗, Fadzilah Adibah Abdul Majida, Lee Suan Chuab,Mohamad Roji Sarmidib, Ramlan Abdul Azizb
a Department of Bioprocess Engineering, Faculty of Chemical and Natural Resources Engineering, Universiti Teknologi Malaysia, 81310 Skudai, Johor, Malaysiab Chemical Engineering Pilot Plant (CEPP), Universiti Teknologi Malaysia, 81310 Skudai, Johor, Malaysiac Faculty of Science, Engineering and Technology (FSET), Perak Campus, Universiti Tunku Abdul Rahman, Jalan Universiti, Bandar Baru Barat, 31900 Kampar, Perak, Malaysia
a r t i c l e i n f o
Article history:Received 8 August 2008Received in revised form 4 November 2008Accepted 12 March 2009
Keywords:Oscillatory burstingElectrical activityPulsatile insulin secretionGlucose regulationDiabetes
a b s t r a c t
A mathematical model to describe the oscillatory bursting activity of pancreatic beta-cells is combinedwith a model of glucose regulation system in this work to study the bursting pattern under regulatedextracellular glucose stimulation. The bursting electrical activity in beta-cells is crucial for the releaseof insulin, which acts to regulate the blood glucose level. Different types of bursting pattern have beenobserved experimentally in glucose-stimulated islets both in vivo and in vitro, and the variations in thesepatterns have been linked to changes in glucose level. The combined model in this study enables us tohave a deeper understanding on the regime change of bursting pattern when glucose level changes dueto hormonal regulation, especially in the postprandial state. This is especially important as the oscilla-tory components of electrical activity play significant physiological roles in insulin secretion and somecomponents have been found to be lost in type 2 diabetic patients.
© 2009 Elsevier Ireland Ltd. All rights reserved.
1. Introduction
In the human body, blood glucose level is regulated by hormonalcontrol to bring it back to the normal range whenever there is aperturbation. This system is known as glucose homeostasis, wherecellular processes of glucose-related pathways in the whole bodyare linked together by hormones such as insulin. Insulin is secretedby the beta-cells in the pancreatic islets.
Detailed description on the physiological behavior of beta-cellsat the molecular level has been reported based on experiments con-ducted on human, mice and cultured cells (Cook, 1984; Rorsman,1997; Hughes et al., 1998). The findings described how glucose stim-ulates the secretion of insulin by beta-cells. Glucose is transportedinto beta-cells through diffusion facilitated by GLUT2 glucose trans-porters. Glucose metabolism in the cells changes the ATP/ADP ratio,causing closure of K+ channels which depolarizes the plasma mem-brane, followed by the influx of Ca2+ and finally the exocytosis ofinsulin granules due to the increase in cytosolic Ca2+ concentration.
The secretion of insulin has been found to be in oscillatory modeboth in vivo (Nunemaker et al., 2005; Pørksen, 2002) and in iso-lated islets (Gilon et al., 1993; Longo et al., 1991; Ritzel et al., 2006).Two components have been identified in the oscillations, with thefaster component having a period of tens of seconds (Bergsten,
∗ Corresponding author. Tel.: +607 5535538; fax: +607 5535538.E-mail address: [email protected] (C.T. Lee).
1995; Gilon et al., 1993; Nunemaker et al., 2005) while the slowercomponent has a period of 5–10 min (Bergsten and Hellman, 1993;Pørksen et al., 2002, 1995). Bertram et al. (2007b), in their review,presented some evidences to support their proposal that the fastoscillations are due to electrical mechanisms, predominantly feed-back of cytosolic free calcium on plasma membrane ion channels,while the slow oscillations result from metabolic oscillations, pos-sibly due to glycolysis.
Besides the two components of oscillations mentioned above,even slower rhythms have been observed. The ultradian rhythmshave a period of 50–120 min and they are usually seen in insulin-stimulating situations such as after meal ingestion (Simon etal., 1987a), during continuous enteral nutrition (Simon et al.,1987b) and during intravenous glucose infusion (Shapiro et al.,1988). According to Simon and Brandenberger (2002), the mecha-nisms generating ultradian rhythms are not fully understood yet.Some suggested that the rhythms are due to instability in theinsulin–glucose feedback loop (Sturis et al., 1991; Tolic et al., 2000)while others attributed them to the existence of an intrapancre-atic pacemaker (Chou et al., 1994). The circadian rhythms have alsobeen reported, with evidences suggesting the role of an endoge-nous circadian oscillator within pancreatic islets and the influenceof melatonin (Peschke and Peschke, 1998).
One of the earliest models to link insulin secretion to theelectrical activity of Ca2+ ions was that of Grodsky (1972). Othermathematical models have emerged throughout the years tostudy how Ca2+-driven electrical bursting interacts with glycolytic
0303-7207/$ – see front matter © 2009 Elsevier Ireland Ltd. All rights reserved.doi:10.1016/j.mce.2009.03.005

Author's personal copy
58 Y.H. Chew et al. / Molecular and Cellular Endocrinology 307 (2009) 57–67
Fig. 1. Components of the dual oscillator model and their interconnections (Bertramet al., 2007a).
oscillations to produce an oscillatory insulin secretion (Wierschemand Bertram, 2004; Bertram et al., 2004; Guigliano et al., 2000).These models attempt to understand the mechanisms behind dif-ferent types of bursting patterns such as purely fast oscillation(when glycolysis is non-oscillatory), purely slow oscillation (whereonly glycolytic oscillations occur), compound bursting (when bothfast and slow oscillations coexist) and accordion bursting. Each pat-tern was discussed in detail in Bertram et al. (2007b). Nunemakeret al. (2006) have discovered that the activity of islets could changefrom fast to slow or compound oscillations when glucose concen-tration was increased and they called this phenomenon a regimechange. A “sliding threshold” formulation has been proposed tounderstand the regime change, which depends on glucose concen-tration.
In most modeling works studying the bursting patterns ofinsulin secretion, pancreatic beta-cells are induced with stepincrease in the concentration of extracellular glucose. According toGuigliano et al. (2000), a step increase could not represent the phys-iological glucose profiles in vivo since the whole glucose-regulatingendocrine control system in a living being is not taken into account.In real, changes in the concentration of blood glucose in vivo arethe result of a complex interaction between external glucose input(e.g. meal ingestion or glucose infusion) and the endocrine insulinsecretory response, with the latter being determined by extracellu-lar glucose concentration itself. Therefore, this paper aims to studythe bursting patterns and regime change of beta-cells stimulatedby an endocrine-regulated glucose concentration to reflect real sit-uations such as the postprandial state. This is done by combining amodel describing the electrical and metabolic activity of beta-cellsto a model of whole-body glucose regulation system. The modelsare described in the following sections.
2. The models
2.1. Mathematical model of bursting activity in pancreatic islets
The ‘dual oscillator model’ (Bertram et al., 2004, 2007a) hasbeen selected in this study to describe the bursting activityin the beta-cells of pancreatic islets. The model is capable ofaccounting for the full range of time courses of electrical andmetabolic variables observed experimentally both in vivo and invitro in glucose-stimulated islets. The dual oscillator model ismade up of three components. They are the glycolytic component,the mitochondrial metabolism component and the electrical andcytosolic/endoplasmic reticulum (ER) Ca2+ component, as shown inFig. 1. All the three components are interconnected to one another.
The glycolytic component describes the glycolysis process inthe beta-cells. The main focus is on the action of phosphofructoki-nase (PFK), which converts fructose 6-phosphate (F6P) to fructose1,6-biphosphate (FBP). FBP is a substrate for glyceraldehyde 3-P
dehydrogenase (GPDH), which serves as the input to the mitochon-drial component, as shown in Fig. 1.
The mitochondrial component considers the metabolism takingplace in the mitochondria such as the role of pyruvate dehydroge-nase (PDH) in producing NADH from NAD+, the production of ATPand the potential changes of mitochondrial inner membrane. TheATP produced in the mitochondria is transported into the cytosolthrough adenine nucleotide translocator and this moves ADP intothe mitochondria. Ca2+ ions are also transported in and out of themitochondria through uniporters and Na+/Ca2+ exchangers, respec-tively. These fluxes of ATP, ADP and Ca2+ connect the mitochondrialcomponent to the electrical component of the model in Fig. 1.
The third component of the model, the electrical and calciumcompartment, describes the plasma membrane potential duringthe transportation of K+ (out of the cell) and Ca2+ (into the cell)through the membrane. The ATP concentration in this compart-ment affects the glycolytic component through its negative effecton the PFK reaction rate. The mathematical equations for the dualoscillator model are shown in Appendix A.
2.2. Mathematical model of glucose regulation system
The mathematical model used to describe the glucose regula-tion system in the present study was developed by Cobelli et al.(1982). This model was later validated and modified to consider oralglucose tolerance test input (Cobelli and Mari, 1983). Even thoughthis model has been developed more than 20 years ago, it is stillreferred to in current studies like Ward and Martin (2006). Thismodel is capable of describing human experimental data accurately.Besides, distinct insulin granule pools were included in the modeland therefore the model is capable of simulating the biphasic pat-terns of insulin secretion in humans and animals (DeFronzo et al.,1979; Curry et al., 1968). The biphasic kinetics is essential as the firstphase insulin secretion in response to glucose has been found to belost in diabetic patients (Efendic et al., 1988; Temple et al., 1992).
The Cobelli model is shown in Fig. 2. It is divided into threesubsystems. The glucose subsystem consists of one compartment,which represents the plasma and extracellular fluids. This sub-system describes the distribution and metabolism of glucose thatcause changes to the glucose concentration in the compartment.The glucose-controlled unit processes being considered in this sub-system are net hepatic glucose balance (NHGB) (the differencebetween glucose production and glucose uptake in the liver), renalexcretion of glucose, insulin-dependent glucose utilization (mainlyby muscles and adipose tissues), and insulin-independent glucoseutilization (mainly by the central nervous system and the red bloodcells).
The dynamics of glucose is regulated by two hormonal con-trollers, insulin and glucagon. The insulin subsystem has fivecompartments, which are the stored pancreatic insulin, immedi-ate releasable pancreatic insulin, liver and portal plasma insulin,plasma insulin, and insulin in the interstitial fluids (ISF). On theother hand, the glucagon subsystem only has one compartment. Thethree subsystems interact with one another through control signals,as shown by the dashed lines in Fig. 2. The differential equationsdescribing the model are given in Appendix B.
2.3. Mathematical equations to combine the models
In order to combine the dual oscillator model (Section 2.1) andthe model of glucose regulation system (Section 2.2), a relationshipbetween both models must first be identified. Since the secretionof insulin by pancreatic beta-cells is stimulated by glucose, the con-centration of plasma glucose computed from the glucose regulationmodel is used as input to the glycolytic component of the dualoscillator model, as illustrated in Fig. 3.
Author's personal copy
Y.H. Chew et al. / Molecular and Cellular Endocrinology 307 (2009) 57–67 59
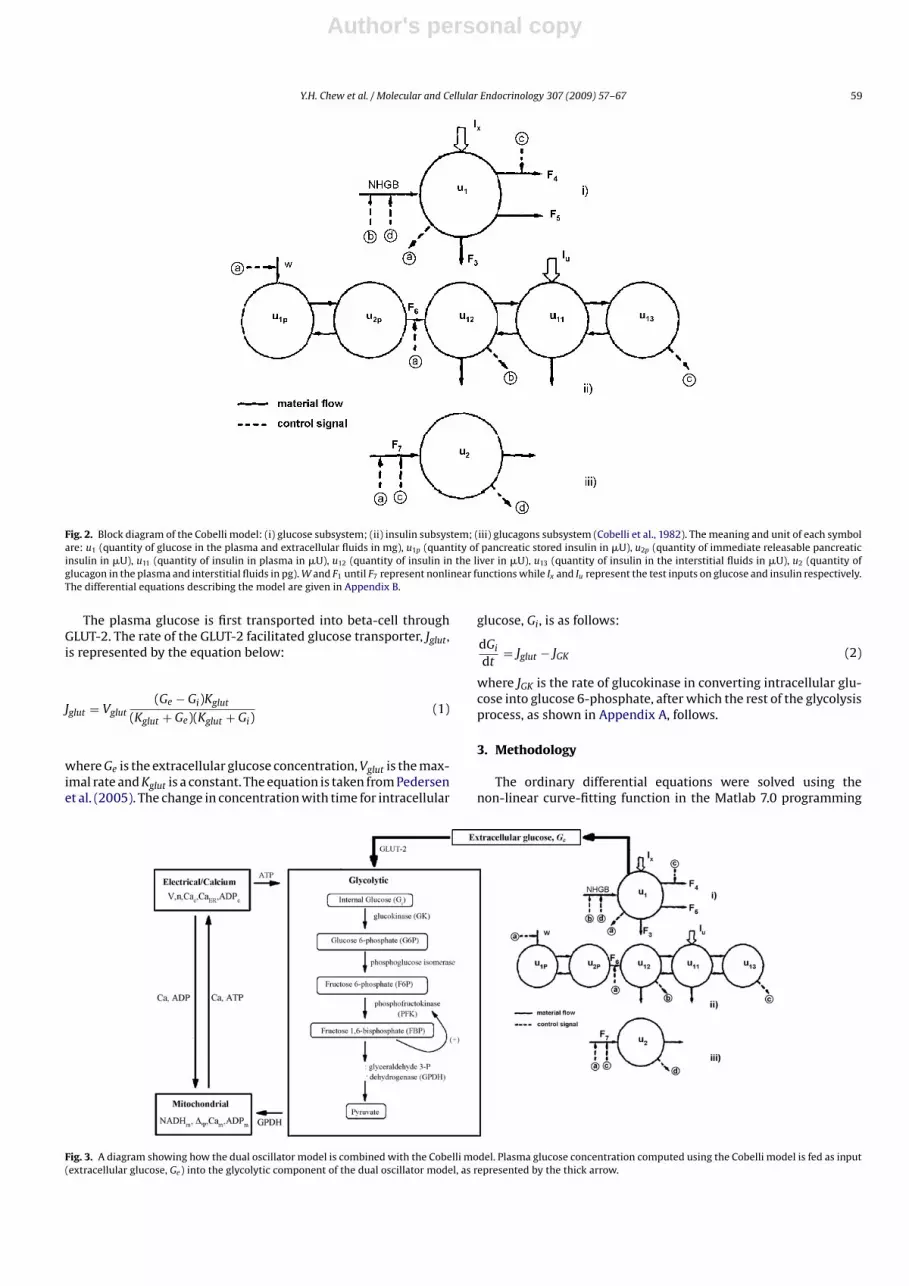
Fig. 2. Block diagram of the Cobelli model: (i) glucose subsystem; (ii) insulin subsystem; (iii) glucagons subsystem (Cobelli et al., 1982). The meaning and unit of each symbolare: u1 (quantity of glucose in the plasma and extracellular fluids in mg), u1p (quantity of pancreatic stored insulin in �U), u2p (quantity of immediate releasable pancreaticinsulin in �U), u11 (quantity of insulin in plasma in �U), u12 (quantity of insulin in the liver in �U), u13 (quantity of insulin in the interstitial fluids in �U), u2 (quantity ofglucagon in the plasma and interstitial fluids in pg). W and F1 until F7 represent nonlinear functions while Ix and Iu represent the test inputs on glucose and insulin respectively.The differential equations describing the model are given in Appendix B.
The plasma glucose is first transported into beta-cell throughGLUT-2. The rate of the GLUT-2 facilitated glucose transporter, Jglut,is represented by the equation below:
Jglut = Vglut(Ge − Gi)Kglut
(Kglut + Ge)(Kglut + Gi)(1)
where Ge is the extracellular glucose concentration, Vglut is the max-imal rate and Kglut is a constant. The equation is taken from Pedersenet al. (2005). The change in concentration with time for intracellular
glucose, Gi, is as follows:
dGidt
= Jglut − JGK (2)
where JGK is the rate of glucokinase in converting intracellular glu-cose into glucose 6-phosphate, after which the rest of the glycolysisprocess, as shown in Appendix A, follows.
3. Methodology
The ordinary differential equations were solved using thenon-linear curve-fitting function in the Matlab 7.0 programming
Fig. 3. A diagram showing how the dual oscillator model is combined with the Cobelli model. Plasma glucose concentration computed using the Cobelli model is fed as input(extracellular glucose, Ge) into the glycolytic component of the dual oscillator model, as represented by the thick arrow.

Author's personal copy
60 Y.H. Chew et al. / Molecular and Cellular Endocrinology 307 (2009) 57–67
Fig. 4. Plasma glucose concentration from the Cobelli model after a glucose load of100 mg/kg min for 3 min.
language. The ODE (ordinary differential equation) solver used wasRunge–Kutta 4,5. The dual oscillator model and glucose regulationmodel were first solved separately and compared to the literatureto ensure reproducibility of the simulation results reported in theliterature. Both models were later combined by setting the glu-cose concentration in the glucose regulation model (please referto Appendix B) as the input to the dual oscillator model, which isthe extracellular glucose, Ge in Section 2.3.
4. Results and discussions
The simulation results of the glucose regulation model were thesame as those reported in Ward and Martin (2006), with the sameglucose load of 100 mg/kg min for 3 min. Therefore, these results arenot discussed in detail here. The plasma glucose concentration-timeprofile generated from the Cobelli model is shown in Fig. 4.
Based on Fig. 4, the concentration of glucose increased sharplyafter the glucose load and slowly decreased back to its steady-statevalue after about 100 min. The dynamics of plasma glucose is due tothe interaction of a few unit processes such as glucose uptake (bothinsulin-dependent and insulin-independent), hepatic glucose pro-duction and renal excretion. As the secretion of insulin by pancreaticislets depends on blood glucose level, the data of Fig. 4 was usedas an input in the dual oscillator model. This enables the study ofbursting activity in pancreatic islets under the stimulation of reg-ulated glucose level. In Bertram et al. (2007a), different burstingpatterns were generated by setting different constant values for theglucokinase reaction rate, JGK. In the present study however, JGK wascalculated using Eqs. (1) and (2) in Section 2.3 and Eqs. (A.1)–(A.4)in Appendix A with blood glucose level (Fig. 4) as the extracellularglucose input. It is illustrated in Fig. 5.
Referring to Fig. 5, the glucokinase reaction rate increased whenblood glucose level increased. It rose rapidly from an initial valueof 0.2 �M/ms to its peak at about 0.62 �M/ms, and then decreasedto 0.15 �M/ms at minute 120. According to Bertram et al. (2007a),glycolytic oscillations in the dual oscillator model only occur forintermediate values of JGK. In other words, there exist upper andlower threshold values. Glycolytic oscillations only occur when JGKis in between the threshold values. They hypothesized that thethreshold values depend on the type of PFK isoform in abundance.It has been reported earlier in Yaney et al. (1995) that three iso-forms of PFK are expressed inˇ-cells, with the M-type isoform beingresponsible for glycolytic oscillations in muscle extracts and has thehighest activity level in islets. The C-type isoform is usually foundin the brain while the L-type isoform is found in the liver. These
Fig. 5. Glucokinase reaction rate, JGK , as simulated using data in Fig. 4 as an input.
two isoforms are reported to have a lower affinity for FBP (Boscaet al., 1982) and a higher affinity for ATP (Foe and Kemp, 1985;Dunaway et al., 1988). Bertram et al. (2007a) demonstrated that atvery low level of M-type isoform, no glycolytic oscillation occursfor any value of JGK. However, as the fraction of M-type isoformincreases, glycolytic oscillations occur at JGK values in between thelower and upper thresholds, and the distance between the thresh-olds increases as the fraction of M-type isoform increases (Fig. 9in Bertram et al. (2007a)). In the present work, it is assumed thatall active PFK are of the M-type isoform. Therefore, there is a wideintermediate region where glycolytic oscillations could occur.
With the changing JGK values in Fig. 5, the bursting patterns ofsome main variables of the dual oscillator model are presented inFig. 6. Looking at the bursting pattern of free cytosolic Ca2+ concen-tration in Fig. 6(a), when JGK values were high (near its peak value),the bursting of electrical activity was fast. It almost resembled a fastbursting oscillation. However, slow oscillation was still visible, witha period of about 8 min. Starting from minute 20, compound oscil-lations became very obvious, with a slow component (glycolyticoscillations) having period of 6 min and a fast component (electricaloscillations) with periods of 10–20 s. The compound bursting con-tinued until minute 55 when the bursting pattern changed again.The concentration of free cytosolic Ca2+ oscillated with a tooth-likemanner for a while, spiked up and oscillated for 20 min and finallysettled into a stable pattern.
The changing bursting activities as shown in Fig. 6 can beexplained by referring to the ‘sliding threshold’ diagrams in Bertramet al. (2007b) as displayed in Fig. 7 here. The diagram that bestdescribes Fig. 6 in this study would be Case 2.
If we read the diagram in Case 2 from right to left (in oppositedirection of the arrow), the bursting pattern of cytosolic Ca2+ inFig. 7 resembles our simulation results in Fig. 6. However, our resultsdid not start at the high oscillations region (region 3) because thehighest value of JGK had not reached the upper threshold value yet.Nevertheless, it almost approached high oscillations, which meansthat the upper threshold value for the dual oscillator model in thisstudy is only slightly higher than 0.62 �M/ms, the peak value inFig. 5. This was comparable with Bertram et al. (2007a), where theupper threshold value was 0.66 �M/ms when the fraction of M-type PFK was 1.0 while the nucleotide concentrations were fixed atATPc = 1.4 �M and ADPc = 1.1 �M.
The compound bursting until minute 55 as produced in thisstudy was in region 2 of the sliding threshold diagram, where boththe glycolytic and electrical components were in oscillatory mode.The bursting pattern between minutes 55 and 70 resembled thatin region 1, where only the electrical component was in oscillatory

Author's personal copy
Y.H. Chew et al. / Molecular and Cellular Endocrinology 307 (2009) 57–67 61
Fig. 6. Changes in the bursting pattern of islet activity under regulated extracellular glucose level.
mode while the glycolytic component was non-oscillatory. If weslide further to the left in the diagram in Case 2, the bursting activitywas supposed to reach non-oscillatory mode for both the electri-cal and glycolytic components (region 4), which would have beena constant line for the Ca2+ concentration such as shown in region1 of Case 1. However, not only was there not a constant line, butCa2+ concentration suddenly spiked up and oscillated at high ampli-tude for 20 min. At the same time, FBP concentration (Fig. 5(c)),which can be used as a representative of the glycolytic component,was also oscillating at high frequency during that period of timeinstead of settling into a stationary mode. This phenomenon can beexplained by the bistability theory reported in Bertram et al. (2004).According to this theory, at the point of bistability, for the same
value of JGK, the glycolytic subsystem can either approach a stablesteady state or can produce stable periodic oscillations. They furtherdemonstrated that values such as the concentration of F6P duringthe point of bistability could determine which of the two long-termbehaviours would prevail. Therefore, it is possible that the decreas-ing value of JGK in Fig. 5 crossed the bistability point and at thatparticular moment, the changes in parameter values happened tobe sufficient to convert the stationary mode of the glycolytic subsys-tem into an oscillatory mode. This could also explain the continuousoscillation of FBP in the last 50 min. While FBP concentration wasoscillating, Ca2+ concentration and the plasma membrane potentialsettled into a steady non-oscillatory mode after some sudden high-amplitude spikings. These conditions resembled that of region 1

Author's personal copy
62 Y.H. Chew et al. / Molecular and Cellular Endocrinology 307 (2009) 57–67
Fig. 7. A ‘sliding threshold’ diagram taken from Nunemaker et al. (2006), which was generated by inducing step increase in glucose level. It illustrates the regime change inislet intracellular Ca2+ patterns (as observed in experiments and simulation results) at different regions due to varying interactions between the mechanisms that drive fastelectrical oscillations (EO) and slow glycolytic oscillations (GO). The arrow indicates an increasing glucose level.
in Case 3 of Fig. 7, where the glycolytic component is oscillatorywhile the electrical component is non-oscillatory. In other words,the bursting system in the pancreatic islet has changed from Case2 to Case 3 (or vice versa) due to bistability. This phenomenon wasnot captured in the sliding threshold diagrams by Nunemaker etal. (2006) because the diagrams were developed by inducing stepincrease in glucose level. Thus, they might have skipped the pointof bistability.
The time profiles of other variables in Fig. 6 such as cytosolicATP, mitochondrial NADH and rate of oxygen consumption were intune with the profiles of FBP and cytosolic Ca2+. As mitochondrionis fuelled by FBP in the form of NADH, the concentration of mito-chondrial NADH is always in phase with FBP. Oxygen consumptionand cytosolic ATP concentration also oscillated in phase with FBP,but exhibited ‘teeth’ as reflection of the effect of Ca2+ (Bertram etal., 2007a).
The concentration of free cytosolic Ca2+ brings upon the secre-tion of insulin with each burst. It has been reported that the rate ofinsulin release is correlated with the plateau fraction of the electri-cal bursting activity, which is the fraction of time spent in the activephase over a period (Miura and Pernarowski, 1995). It is interest-ing to note here that if we study the plateau fraction of Fig. 5(a), abiphasic kinetic is displayed. The bursting activity has a high plateaufraction from minute 0 until minute 20, which makes up the firstphase. This is followed by a second phase where the plateau frac-tion decreases slightly around minute 20, stays constant for a whileand then gradually decreases until minute 55. Even though thereseems to be a period of spiking from minute 70 until minute 85 dueto bistability, the frequency and number of spiking are very smallrelative to the bursting in the first 55 min and is therefore not signif-icant. Referring to Fig. 5(a) again, the biphasic pattern matches withthe biphasic insulin secretion observed experimentally, which has afirst phase from ∼0–15 min and a second phase from ∼15–60 min,firstly discovered by Curry et al. (1968). The biphasic kinetics ofinsulin secretion has been linked to distinct functional pools ofinsulin granules in the beta-cells (Rorsman et al., 2000). This theoryis also used in the Cobelli model to generate the biphasic kinet-ics of insulin. However, the cellular processes underlying the twophases of insulin release still remain obscure. The results of thisstudy, as shown in Fig. 5, interestingly show biphasic kinetics due tochanging plateau fraction caused by regime change. Nevertheless,further investigation would be needed to understand if there is anyconnection between plateau fractions, regime change and bipha-sic kinetics, especially at varying glucose concentration. A deeperunderstanding on the causes of any disturbance in biphasic kinet-ics would be beneficial for the diagnosis and treatment of diabeticpatients.
5. Conclusion
In conclusion, the bursting activity of pancreatic beta-cells playsan important physiological role in the glucose homeostasis systemof the body. The bursting activity is part of the mechanism duringthe secretion of insulin from the beta-cells. By studying the chang-ing regime of bursting activity stimulated by hormone-regulatedglucose as employed in the present study, interesting results havebeen observed such as the sudden glycolytic oscillations at lowglucose level due to bistability and a possible connection betweenplateau fractions, regime change and the biphasic kinetics in insulinsecretion. These observations are of great importance becauseunderstanding the bursting pattern would definitely be beneficialfor the treatment and prevention of type 2 diabetes.
Acknowledgements
The authors wish to thank the Ministry of Science, Technologyand Innovation of Malaysia (MOSTI) for providing financial supportthrough the eScienceFund Grant No. 79045, Research ManagementCentre, Universiti Teknologi Malaysia (UTM) and also ChemicalEngineering Pilot Plant (CEPP), UTM for their technical support.
Appendix A. Dual oscillator model
A.1. The glycolytic model
The model used here is taken from Bertram et al. (2004),Pedersen et al. (2005) and Bertram et al. (2007a). Following Eqs.(1) and (2) in Section 2.3, the changes in concentration with timefor glucose 6-phosphate (G6P) and FBP are as follows:
dG6Pdt
= JGK − JPFK (A.1)
dFBPdt
= JPFK − 12JGPDH (A.2)
It is assumed that the concentrations of G6P and fructose 6-phosphate (F6P) are always in equilibrium due to rapid catalyticactivity of the enzyme phosphoglucose isomerase, and that theysatisfy the following equilibrium relation:
F6P = 0.3G6P (A.3)
JGK is the glucokinase reaction rate. It is described by a Hill func-tion of Gi (Matschinsky et al., 1998), assuming that the reaction is

Author's personal copy
Y.H. Chew et al. / Molecular and Cellular Endocrinology 307 (2009) 57–67 63
Table A1Parameter values for the dual oscillator model.
Glycolytic componentVglut = 8 mM/ms Kglut = 7 mM Vgk = 0.8 mM/ms Kgk = 7 mMngk = 4 kGPDH = 0.0005 Vmax = 0.005 �M/ms �= 0.06K1 = 30 �M K2 = 1 �M K3 = 50000 �M K4 = 220 �Mf13 = 0.02 f23 = 0.2 f41 = 20 f42 = 20f43 = 20
Mitochondrial componentp1 = 400 p2 = 1 p3 = 0.01 �M p4 = 0.6 �M/msp5 = 0.1 mM p6 = 177 mV p7 = 5 mV p8 = 7 �M/msp9 = 0.1 mM p10 = 177 mV p11 = 5 mV p13 = 10 mMp14 = 190 mV p15 = 8.5 mV p16 = 35 �M/ms p17 = 0.002 �M ms−1 mV−1
p18 = −0.03 �M/ms p19 = 0.35 �M/ms p20 = 2 p21 = 0.04 �M ms−1 mV−1
p22 = 1.1 �M ms−1 p23 = 0.01 ms−1 p24 = 0.016 mV−1 JGPDHbas = 0.0005 �M/msfm = 0.01 NADm,tot = 10 mM Am,tot = 15 mM Cm = 1.8 �M/mV
Electrical/calcium componentC = 5300fF �n = 20 ms gK = 2700 pS gCa = 1000 pSgK(Ca) = 300 pS gK(ATP) = 16000 pS VK = −75 mV VCa = 25 mVKD = 0.5 �M khyd = 5 × 10⁻⁵ ms−1 �M−1 khyd,bas = 5 × 10⁻⁵ ms−1 � = 0.07Ac,tot = 2500 �M AMPc = 500 �M ˛= 4.5 × 10⁻⁶ �M/ms kPMCA = 0.1 ms−1
pleak = 0.0002 ms−1 kSERCA = 0.4 ms−1 fc = 0.01 fer = 0.01Vc/Ver = 31 Cabas = 0.05 �M
irreversible:
JGK = VgkGngki
Kngkgk
+ Gngki
(A.4)
The reaction rate of glyceraldehyde 3-P dehydrogenase (GPDH),JGPDH is assumed to be at rapid equilibrium (Tornheim, 1997), andis therefore given by
JGPDH = kGPDH√
FBP
1 �M�M s−1 (A.5)
The PFK reaction rate, JPFK, describes the binding rate of activa-tors (AMP and FBP), an inhibitor (ATP) and the substrate F6P. Duringthe reaction, ATP is both a substrate and an inhibitor of PFK. As sub-strate, it is assumed to be saturating. Therefore, it is not includedexplicitly in the model. The reaction rate of PFK is given by
JPFK = Vmax(1 − �)ω1110 + �
∑ijlωij1l∑
ijklωijkl(A.6)
where i, j, k and l can take the value of 0 or 1, and
ωijkl =1
f ik13fjk23f
il41f
jl42f
kl43
(AMP
K1
)i(FBPK2
)j(F6PK3
)k(ATPK4
)l(A.7)
The parameter values for the model are given in Table A1. They arethe same as used in Bertram et al. (2007a). The parameter valuesfor glucose transportation and glucokinase reaction rate are takenfrom Pedersen et al. (2005).
A.2. The mitochondrial model
The mitochondrial model is based on the detailedMagnus–Keizer model of mitochondrial metabolism (Magnusand Keizer, 1998a,b), which was later simplified by Bertram et al.(2006) using curve fitting. The reaction rate of pyruvate dehydro-genase (PDH), which produces the coenzyme NADH from NAD+
and pyruvate, is given as
JPDH =(
p1NADmp2NADm + NADHm
)(Cam
p3 + Cam)
(JGPDH + JGPDHbas) (A.8)
JGPDH (which should be proportional to pyruvate concentration) isused as the input for the PDH reaction as pyruvate is not explicitlyincluded in the glycolytic model.
A differential equation for NADHm is given in the following:
dNADHmdt
= �(JPDH − JO) (A.9)
where Jo is the consumption of oxygen at the final stage of the elec-tron transport chain when NADH is converted to NAD+. The factor� = 0.001 is only a unit conversion factor to equalize both sides ofthe equation. Jo can be expressed as
Jo =(p4NADHmp5 + NADHm
)(1
1 + exp((� − p6)/p7)
)(A.10)
� is the mitochondrial inner membrane potential.It is assumed that nucleotide is conserved throughout mitochon-
drial metabolism. Therefore
NADm + NADHm = NADtot (A.11)
where NADtot is the total concentration of nucleotide (in mM).The mitochondrial inner membrane potential changes with
time, giving:
d� dt
= (JH,res − JH,atp − JANT − JH,leak − JNaCa − 2Juni)Cm
(A.12)
Cm is the mitochondrial inner membrane capacitance. The con-vention used here is that the membrane potential has a positivevalue if the inner membrane is hyperpolarized. The first term inthe equation, JH,res, represents the flux through respiration-drivenproton pumps, which is expressed as
JH,res =(p8NADHmp9 + NADHm
)(1
1 + exp((� − p10)/p11)
)(A.13)
ATP is formed through the phosphorylation of ADP by F1F0 ATPsynthase. The reaction rate is expressed as follows:
JF1F0 =(
p13
p13 + ATPm)(
p16
1 + exp((p14 −� )/p15)
)(A.14)
The first factor represents the opposing effect of mitochondrial ATPon the action of the synthase. Mitochondrial ATP can even make thesynthase run backwards. However, this possibility is not includedin Eq. (A.14). The second factor reflects the positive action of mem-brane polarization on the synthase activity.
The phosphorylation of ADP is driven by proton flux. For eachATP molecule produced, three protons move through the F1F0 ATPsynthase, as follows:
JH,atp = 3JF1F0 (A.15)

Author's personal copy
64 Y.H. Chew et al. / Molecular and Cellular Endocrinology 307 (2009) 57–67
Protons also enter the mitochondria through leakage down theproton gradient. It is assumed that the leakage depends linearly onthe membrane potential, such that
JH,leak = p17� + p18 (A.16)
The ATP produced in the mitochondria is transported to thecytosol through the adenine nucleotide translocator. ATP is movedout while ADP is moved into the mitochondria. Flux through thetranslocator, JANT, is given by
JANT = p19
(RATm
RATm + p20
)exp(0.5FRT� ) (A.17)
where RATm = ATPm/ADPm and FRT = F/RT = 0.037 mV−1, which is theFaraday’s constant divided by the gas constant and the temperature.An increase in the mitochondrial ATP concentration activates thetranslocator while an increase in ADP deactivates the transporter.
Calcium ions enter the mitochondria through Ca2+ uniporters.Flux through the uniporters, Juni, is written as follows:
Juni = (p21� − p22)Ca2c (A.18)
where Cac is the cytosolic Ca2+ concentration. Calcium is trans-ported back to the cytosol from the mitochondria through Na+/Ca2+
exchangers. The flux of this transportation, JNaCa, is as follows:
JNaCa = p23
(CamCac
)ep24� (A.19)
In the above equation, it is assumed that the mitochondrial Na+
concentration remains constant where it is balanced by Na+/K+
exchangers. Thus, the changes in concentration of mitochondrialCa2+ is
dCamdt
= −fmJm (A.20)
where fm is the fraction of Ca2+ that is free and Jm = JNaCa − Juni.The final differential equation in the mitochondrial metabolism
model is the changes with time of the ADP concentration (in mM),ADPm, as follows:
dADPmdt
= �(JANT − JF1F0) (A.21)
Again, it is assumed that the adenine nucleotides are conserved,giving:
ADPm + ATPm = Am,tot (A.22)
where Am,tot is the total concentration. This equation is used todetermine the concentration of mitochondrial ATP.
A.3. The electrical/calcium model
This model is taken from the phantom bursting model of Bertramand Sherman (2004) and Bertram et al. (2000). Four ionic cur-rents determine the plasma membrane potential. Incorporating themembrane capacitance, C, the voltage is described as
dvdt
= −(IK + ICa + IK(Ca) + IK(ATP))C
(A.23)
where IK is a v-dependent K+ current, ICa is a v-dependent Ca2+
current, IK(Ca) is a calcium-activated K+ current, and IK(ATP) is anATP-sensitive K+ current:
IK = �gKn(V − VK ) (A.24)
ICa = �gCam∞(V)(V − VCa) (A.25)
IK(Ca) = gK(Ca)(V − VK ) (A.26)
IK(ATP) = gK(ATP)(V − VK ) (A.27)
where
gK(Ca) = �gK(Ca)Ca2c
K2D + Ca2
c
(A.28)
gK(ATP) = �gK(ATP)o∞(ADPc, ATPc) (A.29)
The equation for the IK activation variable is
dndt
= n∞(V) − n�n
(A.30)
while n∞(V) is the equilibrium value of n
n∞(V) = 11 + exp(−(V + 16)/5)
(A.31)
Activation of Ca2+ current is assumed to be instantaneous andhas the following equilibrium function:
m∞(V) = 11 + exp(−(V + 20)/12)
(A.32)
It is assumed that the K(ATP) conductance changes instanta-neously with the concentrations of ADP and ATP. The function o∞is the fraction of ATP-sensitive K+ channels that is open. The resultsof Hopkins et al. (1992) reveal that when the channel has: (1) nonucleotide or a single MgADP−1 bound or; (2) two MgADP−1 bound,the channel is open with relative conductances of 0.08 and 0.89,respectively. Therefore the open fraction depends on the nucleotideconcentration and has the following expression:
o∞(ADPc, ATPc)
= 0.08(1 + 2MgADP−/17 �M) + 0.89(MgADP−/17 �M)2
(1 +MgADP−/17 �M)2(1 + ADP3−/26 �M + ATP4−/1 �M)(A.33)
where ADPc and ATPc are cytosolic concentrations. The nucleotideconcentrations are related to the concentrations of ADPc and ATPc
by the equations below (Magnus and Keizer, 1998a):
MgADP− = 0.165ADPc (A.34)
ADP3− = 0.135ADPc (A.35)
ATP4− = 0.005ATPc (A.36)
The cytosolic ADP concentration (in �M), ADPc, is given by
dATPcdt
= Jhyd − �JANT (A.37)
where � is the mitochondria/cytosol volume ratio. Jhyd representsthe cytosolic hydrolysis of ATP, which has been shown to be due toCa2+ pumps in the endoplasmic reticulum (SERCA) and the plasmamembrane (Ainscow and Rutter, 2002). The hydrolysis rate of ATPis
Jhyd = (khydCac + khyd,bas)ATPc (A.38)
khyd is the basal level for hydrolysis which accounts for other sourcesof hydrolysis.
As the cytosolic adenine nucleotide concentration is assumed tobe conserved, the following equation is used:
ADPc + ATPc = Ac,tot (A.39)
The equation above is used to determine the cytosolic ATP con-centration (in �M), ATPc. The AMP concentration is fixed, whilenucleotides are recycled between ADP and ATP due to hydrolysisand flux through the mitochondrial adenine translocator.
The cytosolic Ca2+ concentration changes with time and dependson the flux across the plasma membrane, Jmem, the flux out of the

Author's personal copy
Y.H. Chew et al. / Molecular and Cellular Endocrinology 307 (2009) 57–67 65
endoplasmic reticulum (ER), Jer, and the flux out of the mitochon-dria, Jm, as shown below:
dCacdt
= fc(Jmem + Jer + �Jm) (A.40)
where fc is the fraction of free to total cytosolic Ca2+.The plasma membrane flux term is given by
Jmem = −(˛ICa + kPMCA(Cac − Cabas)) (A.41)
where ˛ converts current to flux and kPMCA is the Ca2+ pumprate across the plasma membrane. Cabas is a constant basal Ca2+
parameter. The flux out of mitochondria, Jm, is scaled by the mito-chondrial/cytosol volume ratio, �.
The actions of IP3-generating muscarinic agonist are not con-sidered, thus the flux out of the ER is assumed to be due onlyto leakage (Jleak), and Ca2+ flux into the ER is through sar-coplasmic/endoplasmic reticulum calcium ATPase (SERCA) pumps(JSERCA):
Jer = Jleak − JSERCA (A.42)
where
Jleak = pleak(Caer − Cac) (A.43)
JSERCA = kSERCACac (A.44)
where pleak is the leakage permeability and kSERCA is the SERCApump rate.
The differential equation for the Ca2+ concentration in the ER isas follows:
dCaerdt
= −fer(VcVer
)Jer (A.45)
where fer is the fraction of free to total ER Ca2+, while Vc and Ver arethe volumes of the cytosolic and ER compartments, respectively.
All the parameter values for the three components of the dualoscillator model are given in Table A1. The values used here arethe same as reported in Bertram et al. (2007a) except JGK, whichis treated as a variable in this study. JGK is determined by Eq. (A.4)(Pedersen et al., 2005).
Appendix B. Glucose regulation model
The ordinary differential equations and their initial values forthe compartments in the model (Cobelli and Mari, 1983) are givenas follows:
du1
dt= NHGB(u1, u12, u2) − F3(u1) − F4(u1, u13) − F5 + Ix(t),
u1(0) = u10 (B.1)
du1p
dt= −k21u1p + k12u2p +W(u1), u1p(0) = u1p0 (B.2)
du2p
dt= k21u1p − (k12 + k02(u1))u2p, u2p(0) = u2p0 (B.3)
du11
dt= −(m01 +m21 +m31)u11 +m12u12 +m13u13 + Iu(t),
u11(0) = u110 (B.4)
du12
dt= −(m02 +m12)u12 +m21u11 + k02(u1)u2p, u12(0) = u120
(B.5)
du13
dt= −m13u13 +m31u11, u13(0) = u130 (B.6)
du2
dt= −h02u2 + F7(u1, u13), u2(0) = u20 (B.7)
where mij, hij, and kij are constant rate parameters (min−1), exceptk02, which is a function of u1. As for the nonlinear functions, F3represents renal excretion of glucose, F4 is the peripheral insulin-dependent glucose utilization, while F5 is the peripheral insulin-independent glucose utilization. Ix(t) is the rate of glucose input.W(x1) is a function representing insulin synthesis while Iu(t) is theinsulin test input. F7 is the endogenous release of glucagon, whichis dependent on blood glucose and interstitial fluids insulin.
The net hepatic glucose balance, NHGB, is given by the followingequation:
NHGB = F1(u1, u12, u2) − F2(u1, u12) (B.8)
where F1 is the glucose production in the liver while F2 is the glucoseuptake in the liver.
As experimentally measured variables are expressed in terms ofconcentration, the concentrations of glucose, insulin and glucagonare denoted as follows:
Ge = u1
V1(B.9)
y2 = u11
V11(B.10)
y3 = u12
V12(B.11)
y4 = u13
V13(B.12)
y5 = u2
V2(B.13)
where Ge is the concentration of plasma glucose (mg/100 ml), whiley2, y3 and y4 are the concentrations in �U/ml of insulin in plasma,liver and interstitial fluids respectively. y5 is the concentration ofblood glucagon (pg/ml). V1, V11, V12, V13 and V2 are the distributionvolumes of various compartments, with their assumed values takenfrom the literature (Norwich, 1977; Sherwin et al., 1974; Insel et al.,1975) as 20%, 4.5%, 3.1%, 10.6% and 20% of body weight, respectively.
The metabolic unit processes in the model consist of manyenzyme-catalyzed biochemical reactions. Cobelli et al. (1982)adopted an aggregated approach to provide an overall mathe-matical description for their input-output behaviour. They usedhyperbolic-tangent function to represent threshold and saturationphenomena, which are typically observed in the processes of pro-duction of material from one or more substrates (Charette, 1969).This form of function allows the effect of the controlling variablessuch as hormones to be easily incorporated into these descriptionsas a change in the saturation value and in the slope of the character-istic. The functions for each subsystem in the model are illustratedin the following.
Liver glucose production:
F1(u1, u12, u2) = a11G1(u2)H1(u12)M1(u1) (g/min) (B.14)
where
G1(u2) = 0.5{1 + tanh[b11(e21 + c11)]} (B.15)
H1(u12) = 0.5{1 − tanh[b12(e12 + c12)]
+ [1 − tanh(b13e12 + c13)]} (B.16)
M1(u1) = 0.5{1 − tanh[b14(ex + c14)]} (B.17)

Author's personal copy
66 Y.H. Chew et al. / Molecular and Cellular Endocrinology 307 (2009) 57–67
Table B1Baseline parameter values for a normal state.
Glucose subsystemLiver production Liver uptake Renal excretion
a11 = 6.727 a21 = 0.56 a31 = 7.14 × 10⁻⁶
b11 = 2.1451 a22 = 0.105 a32 = −9.15 × 10⁻²
b12 = 1.18 × 10⁻² b21 = 1.54 × 10⁻² b31 = 0.143b13 = 0.15 b22 = 0.1 c31 = −2.52 × 10⁴
b14 = 5.9 × 10⁻² c21 = −172c11 = −0.854 c22 = −25c12 = −100c13 = 9.8c14 = −20
Insulin-dependent peripheral utilization Insulin-independent peripheral utilizationa41 = 3.45 a51 = 8.4 × 10⁻²
b41 = 1.4 × 10⁻² a52 = 3.22 × 10⁻⁴
b42 = 1.4 × 10⁻² a53 = 3.29 × 10⁻²
c41 = −146 b51 = 2.78 × 10⁻²
c42 = 0 c51 = 91.5
Insulin subsystemBeta-cell secretion Distribution and metabolism
k12 = 3.128 × 10⁻² m01 = 0.125k21 = 4.34 × 10⁻³ m02 = 0.185aw = 0.74676 m12 = 0.209a6 = 1 m13 = 0.02bw = 1.09 × 10⁻² m21 = 0.268b6 = 5 × 10⁻² m31 = 0.042cw = −175c6 = −44
Glucagon subsystemAlpha-cell secretion Distribution and metabolism
a71 = 2.3479 h02 = 0.086643b71 = 6.86 × 10⁻⁴
b72 = 3 × 10⁻²
c71 = 99.246c72 = 40
A normal individual of 70 kg body weight is considered, with plasma glucose concentration y1 = 91.5 mg/100 ml, plasma insulin concentration y2 = 11 �U/ml, and bloodglucagon concentration y5 = 75 pg/ml. For further details, please refer to Cobelli and Mari (1983).
e21, e12 and ex are the differences between the actual plasmaconcentrations of glucagon, insulin, and glucose and their basalconcentration values respectively.
Liver glucose uptake:
F2(u1, u12) = H2(u12) +M2(u1) (g/min) (B.18)
where
H2(u12) = 0.5a21{1 + tanh[b21(e12 + c21)]} (B.19)
M2(u1) = 0.5a22{1 + tanh[b22(ex + c22)]} (B.20)
Renal glucose excretion:
F3(u1) = M31(u1)M32(u1) if u1 > 2.52 × 10⁴ (g/min)= 0 if u1 ≤ 2.52 × 10⁴ (g/min)
(B.21)
where
M31(u1) = 0.5{1 + tanh[b31(u1 + c31)]} (B.22)
M32(u1) = a31u1 + a32 (B.23)
Insulin-dependent peripheral glucose utilization:
F4(u1, u13) = a41H4(u13)M4(u1) (g/min) (B.24)
where
H4(u13) = 0.5{1 + tanh[b41(e13 + c41)]} (B.25)
M4(u1) = 0.5{1 + tanh[b42(ex + c42)]} (B.26)
In this case, e13 is the difference between the actual and basalvalues of interstitial-fluid insulin concentration.
Insulin-independent glucose uptake:
F5(u1) =M51(u1) +M52(u1) (g/ min) (B.27)
where
M51(u1) = a51 tanh[b51(ex + c51)] (B.28)
M52(u1) = a52ex + a53 (B.29)
Insulin synthesis:
W(u1) = 0.5aw{1 + tanh[bw(ex + cw)]} (U/ min) (B.30)
Insulin secretion:
F6(u2p, u1) = 0.5a6{1 + tanh[b6(ex + c6)]}u2p (�U/min) (B.31)
Glucagon secretion:
F7(u1, u13) = a71H7(u13)M7(u1) (�g/min) (B.32)
where
H7(u13) = 0.5{1 − tanh[b71(e13 + c71)]} (B.33)
M7(u1) = 0.5{1 − tanh[b72(ex + c72)]} (B.34)
Initial conditions (Ward and Martin, 2006):

Author's personal copy
Y.H. Chew et al. / Molecular and Cellular Endocrinology 307 (2009) 57–67 67
u1(0) = ubasal (mg)
u11(0) = u11(basal) (�U)
u13(0) = m31 × u11(0)/m13 (�U)
u12(0) = ((m01 + m21 + m31) × u11(0) − m13 × u13(0))/m12 (�U)
F6(0) = (m02 + m12) × u12(0) − m21 × u11(0) (�U/min)
u2p(0) = F6(0)/(0.5(1 + tanh(b6 × c6))) (�U)
u1p(0) = (F6(0) + k12 × u2p(0))/k21 (�U)
u2(0) = u2(basal) (pg)
The values of all the parameters used in the Cobelli model areshown in Table B1.
References
Ainscow, E.K., Rutter, G.A., 2002. Glucose-stimulated oscillations in free cytosolicATP concentration imaged in single islet ˇ-cells. Diabetes 51, S162–S170.
Bergsten, P., Hellman, B., 1993. Glucose-induced amplitude regulation of pulsatileinsulin secretion from individual pancreatic islets. Diabetes 42, 670–674.
Bergsten, P., 1995. Slow and fast oscillations of cytoplasmic Ca2+ in pancreatic isletscorrespond to pulsatile insulin release. Am. J. Physiol.-Endoc. M. 268, E282–E287.
Bertram, R., Pedersen, M.G., Luciani, D.S., Sherman, A., 2006. A simplified model formitochondrial ATP production. J. Theor. Biol. 243, 575–586.
Bertram, R., Previte, J., Sherman, A., Kinard, T.A., Satin, L.S., 2000. The phantomburster model for pancreatic ˇ-cells. Biophys. J. 79, 2880–2892.
Bertram, R., Sherman, A., 2004. A calcium-based phantom bursting model for pan-creatic islets. Bull. Math. Biol. 66, 1313–1344.
Bertram, R., Satin, L., Zhang, M., Smolen, P., Sherman, A., 2004. Calcium and glycolysismediate multiple bursting modes in pancreatic islets. Biophys. J. 87, 3074–3087.
Bertram, R., Satin, L.S., Pedersen, M.G., Luciani, D.S., Sherman, A., 2007a. Interaction ofglycolysis and mitochondrial respiration in metabolic oscillations of pancreaticislets. Biophys. J. 92, 1544–1555.
Bertram, R., Sherman, A., Satin, L.S., 2007b. Metabolic and electrical oscillations:partners in controlling pulsatile insulin secretion. Am. J. Physiol.-Endoc. M. 293,E890–E900.
Bosca, L., Aragon, J.J., Sols, A., 1982. Specific activation by fructose 2,6-biphosphateand inhibition by P-enolpyruvate of ascites tumor phosphofructokinase.Biochem. Biophys. Res. Commun. 106, 486–491.
Charette, W.P., 1969. Control systems theory applied to metabolic homeostasissystems and the derivation and identification of mathematical models. Ph.D.Dissertation, California Institute of Technology.
Chou, H.F., Berman, N., Ipp, E., 1994. Evidence for pancreatic pacemaker for insulinoscillations in low-frequency range. Am. J. Physiol.-Reg. I. 266, R1786–R1791.
Cobelli, C., Federspil, G., Pacini, G., Salvan, A., Scandellari, C., 1982. An integratedmathematical model of the dynamics of blood glucose and its hormonal control.Math. Biosci. 58, 27–60.
Cobelli, C., Mari, A., 1983. Validation of a mathematical model of complex endocrine-metabolic systems. A case study on a model of glucose regulation. Med. Biol. Eng.Comput. 21, 390–399.
Cook, D.L., 1984. Electrical pacemaker mechanisms of pancreatic islet cells. Fed. Proc.43, 2368–2372.
Curry, D.L., Bennett, L.L., Grodsky, G.M., 1968. Dynamics of insulin secretion by theperfused rat pancreas. Endocrinology 83, 572–584.
DeFronzo, R.A., Tobin, J.D., Andres, R., 1979. Glucose clamp technique: a methodfor quantifying insulin secretion and resistance. Am. J. Physiol.-Endoc. M. 6,E214–E223.
Dunaway, G.A., Kasten, T.P., Sebo, T., Trapp, R., 1988. Analysis of the phosphofructok-inase subunits and isoenzymes in human tissues. Biochem. J. 251, 677–683.
Efendic, S., Grill, V., Luft, R., Wajngot, A., 1988. Low insulin response: a marker ofpre-diabetes. Adv. Exp. Med. Biol. 246, 167–174.
Foe, L.G., Kemp, R.G., 1985. Isolation and characterization of phosphofructokinase Cfrom rabbit brain. J. Biol. Chem. 260, 726–730.
Gilon, P., Shepherd, R.M., Henquin, J.C., 1993. Oscillations of secretion driven by oscil-lations of cytoplasmic Ca2+ as evidenced in single pancreatic islets. J. Biol. Chem.268, 22265–22268.
Grodsky, G.M., 1972. A threshold distribution hypothesis for packet storage of insulinand its mathematical modelling. J. Clin. Invest. 51, 2047–2059.
Guigliano, M., Bove, M., Grattarola, M., 2000. Insulin release at the molecularlevel: metabolic-electrophysiological modelling of the pancreatic beta-cells.IEEE Trans. Biomed. Eng. 47, 611–623.
Hopkins, W., Fatherazi, S., Peter-Riesch, B., Corkey, B., Cook, D., 1992. Two sites ofadenine-nucleotide regulation of ATP-sensitive potassium channels in mousepancreatic ˇ-cells and HIT cells. J. Membr. Biol. 129, 287–295.
Hughes, S.J., Faehling, M., Thorneley, C.W., Proks, P., Ashcroft, F.M., Smith, P.A.,1998. Electrophysiological and metabolic characterization of single beta-cellsand islets from diabetic GK rats. Diabetes 47, 73–81.
Insel, P.A., Liljenquist, J.E., Tobin, J.D., Sherwin, R.S., Watkins, P., Anders, R., Berman,M., 1975. Insulin control of glucose metabolism in man. J. Clin. Invest. 55,1057–1066.
Longo, E.A., Tornheim, K., Deeney, J.T., Varnum, B.A., Tillotson, D., Prentki, M.,Corkey, B.E., 1991. Oscillations in cytosolic free Ca2+, oxygen consumption, andinsulin secretion in glucose-stimulated rat pancreatic islets. J. Biol. Chem. 266,9314–9319.
Magnus, G., Keizer, J., 1998a. Model of ˇ-cell mitochondrial calcium handling andelectrical activity. I. Cytoplasmic variables. Am. J. Physiol. Cell Physiol. 274,C1158–C1173.
Magnus, G., Keizer, J., 1998b. Model of ˇ-cell mitochondrial calcium handling andelectrical activity. II. Mitochondrial variables. Am. J. Physiol. Cell Physiol. 274,C1174–C1184.
Matschinsky, F.M., Glaser, B., Magnuson, M.A., 1998. Pancreatic beta-cell glucoki-nase: closing the gap between theoretical concepts and experimental realities.Diabetes 47, 307–315.
Miura, R.M., Pernarowski, M., 1995. Correlations of rates of insulin release for isletsand plateau fractions for ˇ-cells. Bull. Math. Biol. 57 (2), 229–246.
Norwich, K.H., 1977. Molecular Dynamics in Biosystems. Pergamon, New York.Nunemaker, C.S., Zhang, M., Wasserman, D.H., McGuinness, O.P., Powers, A.C.,
Bertram, R., Sherman, A., Satin, L.S., 2005. Individual mice can be distinguishedby the period of their islet calcium oscillations: is there an intrinsic islet periodthat is imprinted in vivo. Diabetes 54, 3517–3522.
Nunemaker, C.S., Bertram, R., Sherman, A., Tsaneva-Atanasova, K., Daniel, C.R., Satin,L.S., 2006. Glucose modulates [Ca2+]i oscillations in pancreatic islets via ionicand glycolytic mechanisms. Biophys. J. 91, 2082–2096.
Pedersen, M.G., Bertram, R., Sherman, A., 2005. Intra- and inter-islet synchronizationof metabolically driven insulin secretion. Biophys. J. 89, 107–119.
Peschke, E., Peschke, D., 1998. Evidence for a circadian rhythm of insulin release fromperifused rat pancreatic islets. Diabetologia 41, 1085–1092.
Pørksen, N., 2002. The in vivo regulation of pulsatile insulin secretion. Diabetes 45,3–20.
Pørksen, N., Hollingdal, M., Juhl, C., Butler, P., Veldhuis, J.D., Schmitz, O., 2002. Pul-satile insulin secretion: detection, regulation and role in diabetes. Diabetes 51,S245–S254.
Pørksen, N., Munn, S., Steers, J., Vore, S., Veldhuis, J., Butler, P., 1995. Pulsatile insulinsecretion accounts for 70% of total insulin secretion during fasting. Am. J. Physiol.-Endoc. M. 269, E478–E488.
Ritzel, R.A., Veldhuis, J.D., Butler, P.C., 2006. The mass, but not the frequency, of insulinsecretory bursts in isolated human islets is entrained by oscillatory glucoseexposure. Am. J. Physiol.-Endoc. M. 290, E750–E756.
Rorsman, P., 1997. The pancreatic beta-cell as a fuel sensor: An electrophysiologist’sviewpoint. Diabetologia 40, 487–495.
Rorsman, P., Eliasson, L., Renström, E., Gromada, J., Barg, S., Göpel, S., 2000. The cellphysiology of insulin secretion. News Physiol. Sci. 15, 72–77.
Shapiro, E.T., Tillil, H., Polonsky, K.S., Fang, V.S., Rubenstein, A.H., Van Cauter, E., 1988.Oscillations in insulin secretion during constant glucose infusion in normal man:relationship to changes in plasma glucose. J. Clin. Endocrinol. Metab. 67, 307–314.
Sherwin, R.S., Kramer, K.J., Tobin, J.D., Insel, P.A., Liljenquist, J.E., Berman, M., Anders,R., 1974. A model of the kinetics of insulin in man. J. Clin. Invest. 53, 1481–1492.
Simon, C., Follenius, M., Brandenberger, G., 1987a. Postprandial oscillations of plasmaglucose insulin and C-peptide in man. Diabetologia 30, 769–773.
Simon, C., Brandenberger, G., Follenius, M., 1987b. Ultradian oscillations of plasmaglucose, insulin and C-peptide in man during continuous enteral nutrition. J.Clin. Endocrinol. Metab. 64, 669–674.
Simon, C., Brandenberger, G., 2002. Ultradian oscillations of insulin secretion inhumans. Diabetes 51, S258–S261.
Sturis, J., Polonsky, K.S., Mosekilde, E., Van Cauter, E., 1991. Computer model formechanisms underlying ultradian oscillations of insulin and glucose. Am. J.Physiol.-Endoc. M. 260, E801–E809.
Temple, R., Clark, P.M.S., Hales, C.N., 1992. Measurement of insulin secretion in type2 diabetes: problems and pitfalls. Diabetic Med. 9, 503–512.
Tolic, I.M., Mosekilde, E., Sturis, J., 2000. Modeling the insulin-glucose feedback sys-tem: the significance of pulsatile insulin secretion. J. Theor. Biol. 207, 361–375.
Tornheim, K., 1997. Are metabolic oscillations responsible for normal oscillatoryinsulin secretion? Diabetes 46, 1375–1380.
Ward, E., Martin, T., 2006. A fuzzy model of glucose regulation. J. Med. Syst. 30,187–203.
Wierschem, K., Bertram, R., 2004. Complex bursting in pancreatic islets: a potentialglycolytic mechanism. J. Theor. Biol. 228, 513–521.
Yaney, G.C., Schultz, V., Cunningham, B.A., Dunaway, G.A., Corkey, B.E., Tornheim,K., 1995. Phosphofructokinase isozymes in pancreatic islets and clonal ˇ-cells(INS-1). Diabetes 44, 1285–1289.


![[S3-guideline exocrine pancreatic cancer]](https://img.pdfslide.net/doc/110x75/6344e86f03a48733920b1c67/s3-guideline-exocrine-pancreatic-cancer.jpg)


