Embed Size (px)
Citation preview

ventionalof molecu-inatedr using the
ry columnation ofeatmenterationin a realtalyst thatant step in
Modeling Pd-Catalyzed Destruction of Chlorinated Ethenesin Groundwater
Chris M. Stoppel1 and Mark N. Goltz2
Abstract: Groundwater contamination by chlorinated ethenes is a widespread environmental problem. Shortcomings in conremediation methods have motivated research into novel treatment technologies. A palladium/alumina catalyst in the presencelar hydrogen gas~referred to hereafter as the Pd/H2 system! has been demonstrated to destroy chlorinated ethenes in contamgroundwater. This study presents a model for aqueous-phase destruction of chlorinated ethenes in contaminated groundwatePd/H2 system that includes catalyst deactivation and regeneration. The model is validated using published data from laboratoexperiments from Stanford University. The model is then coupled with an analytical groundwater flow model to simulate applicin-well Pd/H2 reactors for in situ treatment of chlorinated ethene contaminated groundwater in a recirculating horizontal flow trWell ~HFTW! system. Applying the model under realistic conditions results in approximately 130 days of HFTW system opwithout significant catalyst deactivation. This suggests catalyst deactivation will not significantly affect system performanceremediation scenario. The model presented in this study, which simulates deactivation kinetics and regeneration of an in-well cais a component of a recirculating well system designed for in situ treatment of contaminated groundwater, represents an importtransitioning the Pd/H2 technology to the field.
DOI: 10.1061/~ASCE!0733-9372~2003!129:2~147!
CE Database keywords: Ground-water pollution; Models; Water treatment.
reneaeaRap
talch
tnetiacan
to
sts,ve-psfulat
mi-es-
tene
ow
n-
nre-llre-i-
asetedn a
cetheing
eyail
40,ail
y 1rs.w
itteo
3-
Introduction
Chlorinated ethenes, such as tetrachloroethene~PCE! and trichlo-roethene~TCE!, are prevalent groundwater contaminants. Curremediation technologies, such as pump-and-treat and permreactive barriers, have shortcomings that have motivated resinto the development of innovative treatment technologies.cent studies conducted at Stanford University have shown rdestruction of chlorinated ethenes using a palladium~Pd! catalystin the presence of molecular hydrogen gas~hereafter referred toas the Pd/H2 system! ~Lowry and Reinhard 1999, 2000!. In thissystem, contaminant destruction is accomplished at the casurface with hydrogen gas acting as an electron donor. Therinated ethene contaminant molecule is destroyed throughprocess of hydrodehalogenation, whereby the halide atoms omolecule are replaced by hydrogen. Due to the very fast kinof the Pd-catalyzed hydrodehalogenation reaction, a Pd recan potentially be deployed in well to effect in situ contamindestruction~that is, contaminant destruction without the needpump contaminated groundwater to the surface!. As the contami-
1Air Force Center for Environmental Excellence, 3207 SidnBrooks, Building 532, Brooks Air Force Base, TX 78235-5344. [email protected]
2Air Force Institute of Technology, 2950 P Street, Building 6Wright-Patterson Air Force Base, OH 45433-7765. [email protected]
Note. Associate Editor: Wendell P. Ela. Discussion open until Jul2003. Separate discussions must be submitted for individual papeextend the closing date by one month, a written request must be filedthe ASCE Managing Editor. The manuscript for this paper was submfor review and possible publication on August 28, 2001; approvedMarch 7, 2002. This paper is part of theJournal of EnvironmentalEngineering, Vol. 129, No. 2, February 1, 2003. ©ASCE, ISSN 0739372/2003/2-147–154/$18.00.
JO
tblerche-id
ystlo-hethecstort
nant is treated in situ, the in-well system reduces pumping corisk of contaminant exposure, and the overall size of the aboground treatment facility. In addition, the treatment well pummaintain positive control of contaminant migration. Successapplication of the Pd/H2 system has been demonstratedLawrence Livermore National Laboratory~McNab and Ruiz2000!.
One potential problem with in-well deployment of the Pd/H2
system is catalyst deactivation, resulting in decreased contanant destruction efficiency. Catalyst deactivation due to the prence of sulfur containing species (HS2 and SO3
22) and formationof HCl at the catalyst surface has been observed~Lowry andReinhard 2000!. Lowry and Reinhard~2000! showed that flushingthe catalyst column for 90 min with a dilute sodium hypochlorisolution resulted in complete recovery of catalyst activity. Oproposed strategy for in-well application of the Pd/H2 system is toinstall the catalytic reactors as components of a horizontal fltreatment well~HFTW! system. In an HFTW system, multipledual-screened wells, alternately operating in upflow and dowflow directions, are used to create recirculating flow patterns~orinterflow! between wells. As seen in Fig. 1, this configuratioallows a portion of contaminated groundwater to recirculate,sulting in recycling of contaminated water through the in-wetreatment reactors, thereby increasing overall contaminantmoval efficiency~comparing contaminant concentrations upgradent and downgradient of the treatment system!. An HFTW systemhas been successfully demonstrated at Edwards Air Force B~AFB!, where TCE-contaminated groundwater was recirculathrough stimulated bioactive treatment zones located betweesingle well pair~McCarty et al. 1998!. The HFTW demonstrationat Edwards AFB involved injection of toluene into the subsurfato stimulate indigenous bacteria that biologically degradedTCE. An advantage of the proposed treatment strategy, us
:
:
,Toithdn
URNAL OF ENVIRONMENTAL ENGINEERING / FEBRUARY 2003 / 147
dn-ent
H
o-i-
-
ur-
-
ntal
valed
sedines
terrved
n-orc-
Fig. 1. Concept for horizontal flow treatment well system with iwell Pd reactors~a! plan view ~note that streamlines shown are flower part of aquifer where treatment well 1, upflow well, is extration well! ~b! cross section
ysrd, wtioelheneommt
am
tedrortaefo
otio
lumsta
ionta-
gis
d.
e.ry
onss
iser
e
ta-edpass
148 / JOURNAL OF ENVIRONMENTAL ENGINEERING / FEBRUARY 200
--en
d
t--i-he
i-
-ntre
nnnnt
(kd) for specified conditions@water flow rate through the column~Q!, influent contaminant/poison concentration (Cin), and catalystmass (gcat)]. This study extends the work of Lowry and Reinhar~2000! by incorporating catalyst regeneration in the model, geeralizing the model so that it can be used to predict treatmefficiency for a range of conditions, and coupling the Pd/H2 sys-tem submodel with an HFTW groundwater flow model.
The following assumptions are used in developing the Pd/2
submodel:
1. The hydrodehalogenation reaction is not limited by hydrgen. So long as H2 concentrations are greater than approxmately 1 mM, competition for H2 by other species~oxygen,nitrate, and nitrite! does not limit chlorinated ethene destruction ~Lowry and Reinhard 2001!. Since aqueous hydrogenconcentrations of greater than 1 mM have been attained ding lab and field-scale experiments~Lowry and Reinhard2000; McNab and Ruiz 2000!, it may be assumed that competition for H2 will not reduce the efficiency of the Pd/H2
system.2. Due to the faster time scale of regeneration~minutes! rela-
tive to catalyst deactivation~days or weeks!, catalyst regen-eration is assumed instantaneous. Based on the experimeresults of Lowry and Reinhard~2000!, it is also assumed thatcatalyst recovery is complete, so that contaminant remoefficiencies after regeneration will equal efficiencies attainprior to catalyst deactivation.
3. Although the chlorinated ethene destruction model is baupon experimental column results of TCE destructiondeionized water, destruction of other chlorinated ethen~PCE, dichloroethene, and vinyl chloride! is assumed to besimilar.
4. Since the time scale for catalyst deactivation is much greathan the reactor residence time, the decrease in the obsefirst-order reaction rate constant for contaminant destruct(kobs) during the time contaminated water spends in the calyst reactor is assumed negligible.
5. As discussed in Lowry and Reinhard~2000!, the 2–3 dayperiod of catalyst ‘‘super activity’’ observed at the beginninof column experiments when a fresh catalyst is useddeemed a transient phenomenon and will not be modele
6. The effect of groundwaterpH on contaminant destructionefficiency in the catalyst column is considered negligiblThis assumption is based on experimental work by Lowand Reinhard~2000! who found a minimal effect of pH onthe TCE destruction reaction over a range of 7 pH units.
7. In order to apply the results of Lowry and Reinhard~2000!to other experimental conditions, the catalyst deactivatirate constant (kd) is assumed to be proportional to the maloading of the influent contaminant or catalyst poison (QCin)and inversely proportional to the mass of catalyst (gcat) inthe reactor.
8. A contaminant/poison’s ability to deactivate the catalystthe same whether it acts alone or in conjunction with othpoisons. This assumption allows us to calculate a singlekd asthe sum of thekd values of individual poisons to quantify theeffect of catalyst deactivation resulting from multiplgroundwater constituents.
9. Mass transfer resistances are considered negligible.The Pd/H2 system submodel predicts the efficiency of the ca
lytic reactor in destroying the contaminant when contaminatgroundwater passes through the reactor one time. This single-contaminant destruction efficiency (hsp) is defined in Eq.~1!
Pd/H2 reactors installed in well as components of an HFTW stem, is that it will not be necessary to inject a potentially hazaous substance like toluene into the subsurface. In this studycouple a submodel that simulates in-well Pd-catalyzed destrucof chlorinated ethenes with a model of the groundwater flow fithat results from operation of a dual-well HFTW system. Tmodel presented in this study, which simulates deactivation kiics and regeneration potential of an in-well catalyst that is a cponent of an HFTW system designed to achieve in situ contanant destruction, represents an important step in transitioningPd/H2 technology to the field.
PdÕH2 Reactor Submodel Development
First-order kinetic models have been used to describe contnant destruction in the Pd/H2 system, and Ferland et al.~2000!coupled a first-order model of in-well Pd-catalyzed chlorinaethene destruction with an HFTW system. However, other pcesses like catalyst deactivation and regeneration are impoand need to be considered in order to better model, and therunderstand, chlorinated ethene destruction using the Pd/H2 sys-tem.
Lowry and Reinhard~2000! presented a model for the Pd/H2
system that incorporated the effect of catalyst deactivationtreatment efficiency. Their model assumed catalyst deactivawas a first-order process, and they conducted laboratory coexperiments to determine the first-order deactivation rate con
3

mit-
o
ucse
na-as.4st
llrcean
ica-
lug
,ter
ataan
ble
ial
r
nt
n-In
con-
zeds. Ifdue
lyst,e
ichation
g1.
-lyst
ins for
Al-
on-
i-
hsp5Cin2Cout
Cin(1)
whereCin5 influent contaminant concentration andCout5 efflu-ent contaminant concentration. As previously discussed, contanant destruction in the Pd/H2 system has been modeled as a firsorder process. Eq.~2! is the ordinary differential equation used tmodel first-order kinetics
dC
dt52kobsC (2)
where C5contaminant concentration; t5time; andkobs5observed first-order rate constant for contaminant destrtion. Note that as the contaminant influent concentration increabeyond the ability of the catalyst to vacate sites for dechlorition, the reaction becomes zero order. Lowry validated thesumption of first-order kinetics for TCE concentrations up to 19mg/L in column experiments performed with 0.5 g Pd/Al cataly~Lowry 2000!. As it is envisioned that an HFTW system witypically be used for plume containment rather than for souarea remediation, it is not anticipated that chlorinated contamindissolved concentrations would exceed 20 mg/L in most appltions.
If we assume the catalytic reactor can be modeled as a pflow reactor, with C(t50)5Cin and C(t5t r)5Cout where t r
5residence time of fluid in the reactor, we can solve Eq.~2! andcombine it with Eq. ~1! to obtain the following equation forsingle-pass efficiency:
hsp512e2kobstr (3)
In order to account for catalyst deactivation,kobs is assumed tobe a time-dependent variable,kobs(t), which decreases with timeleading to a decrease in catalyst efficiency. The method for demining kobs(t) is adopted from Chang et al.~1999!, who assumedthat catalyst deactivation was due to a decrease in available clyst sites, and that the observed first-order rate constant atgiven time is proportional to the fraction of catalyst sites availaat that time (uv). This relation is described in Eq.~4!
kobs~ t !5kobs0•uv~ t ! (4)
where kobs05first-order rate constant observed after the initperiod of catalyst super activity.
In order to modeluv(t) as a function of time, we first consideEq. ~5! ~Levenspiel 1999! applied by Lowry and Reinhard~2000!to simulate catalyst deactivation
gcat
Q5
1
krxne2kdt lnCin
Cout(5)
where gcat5mass of catalyst in the reactor;Q5fluid flow ratethrough the catalytic reactor; andkrxn5first-order reaction rateconstant normalized by the catalyst concentration~Lowry and Re-inhard 2000!
krxn5kobs
gcat
nV
(6)
where n5porosity of the catalyst-filled column andV5emptycolumn bed volume. Eq.~5! assumes the first-order rate consta(krxn) determined from Eq.~6! is multiplied by a term that expo-
JOU
-
-s
-
t
-
-y
nentially decreases with time,e2kdt. The catalyst deactivationrate constant,kd , is determined by first linearizing Eq.~5! toobtain the following form:
ln lnS Cin
CoutD5 lnS krxngcat
Q D2kdt (7)
In this form, kd is the slope of the best-fit line through concetration data obtained over time from column experiments.order to determine the time dependence of the single-passtaminant destruction efficiency@hsp(t)#, Eq. ~5! is transformedinto the following equation:
hsp~ t !512e2@gcat•krxn /Q•ekdt# (8)
Lowry and Reinhard~2000! used Eq.~8! to account for catalystdeactivation in column experiments performed using deioniwater with dissolved TCE and other suspected catalyst poisonwe now assume that this decrease in destruction efficiency isto a decrease in available catalyst sites, we can calculateuv(t) asfollows:
uv~ t !512e2@gcat•krxn /Q•ekdt#
12e2@gcat•krxn /Q# (9)
where the denominator on the right-hand side of Eq.~9! repre-sents the initial single-pass destruction efficiency of the cataand the numerator represents the single-pass efficiency at timt.Substituting Eq.~6! for krxn in Eq. ~9! and canceling like termsgives us
uv~ t !512e2@kobs0•tr /ekdt#
12e2@kobs0•tr #(10)
Upon examination of Eq.~10! we see thatuv(0)51, indicatingthat all catalyst sites are initially available. The rate at whcatalyst sites are deactivated is dependent upon the deactivrate constant,kd . The values ofkd determined by Lowry andReinhard~2000! in their model solute column experiments, alonwith the conditions of their column studies, are listed in TableAs noted earlier, if we assumekd is proportional to the contaminant or poison mass loading and inversely proportional to catamass, we can use thekd values and experimental conditionsTable 1 as a basis to determine deactivation rate constantdifferent contaminant/poison loadings and catalyst masses.though Lowry and Reinhard~2000! only determined values ofkd
for a limited number of compounds, similar studies could be c
Table 1. Baseline Catalyst Deactivation Rate Constants (kd) andCorresponding Experimental Conditions
Catalyst poison Poison loading~mg/min! gcat ~g! kd (day213103)
TCE 3.531023 0.5 5.6
SO322 4.431022 0.5 900
HS2 4.031024 0.5 424
Table 2. Mkd Values for Trichloroethene and Known Catalyst Posons
Contaminant/poison Mkd (gcat/mgpoison)
TCE 5.6031024
HS2 3.6831021
SO322 7.1031023
RNAL OF ENVIRONMENTAL ENGINEERING / FEBRUARY 2003 / 149
ater
-
TCEen-
-7
ry
ex-theof
ults
en
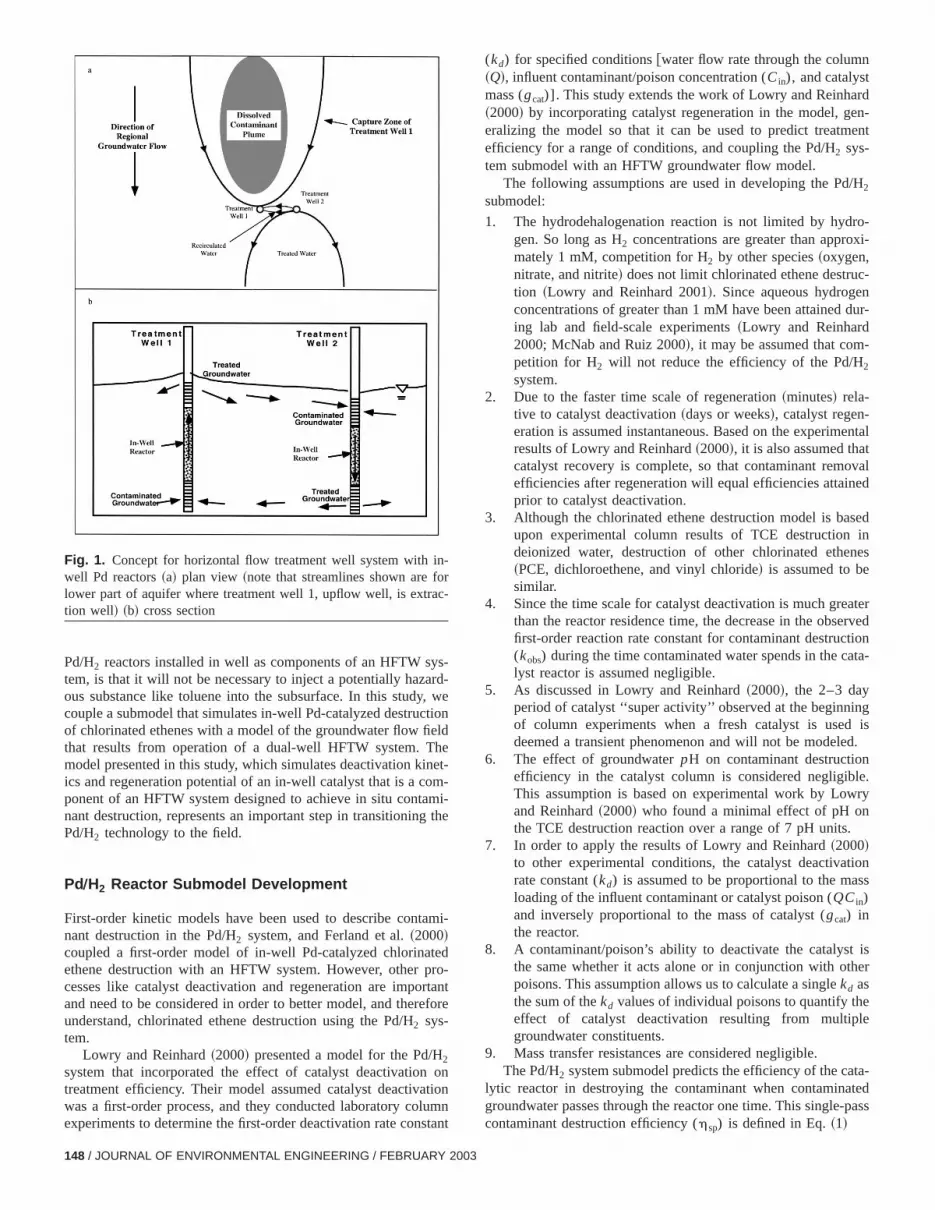
Fig. 2. Comparison of submodel simulation and experimental res~Lowry and Reinhard 2000! of catalyst destruction efficiency (hsp)versus operating time (T). Experimental and model parameters givin text.
hx
-
h
d
the2 and
on-
asstheerat-
ex-lyst
ld,e
thevi-
150 / JOURNAL OF ENVIRONMENTAL ENGINEERING / FEBRUARY 2003
i-et.
where kobs(t) is calculated using Eqs.~4! and ~10! andnV/Q5fluid residence time in the catalytic reactor.
Fig. 2 compares experimental data for TCE in deionized wpassing through a Pd on alumina column~Lowry and Reinhard2000! and submodel output from Eq.~12! using parameters specific to the experiment (Q51 mL/min, V50.7 mL, n50.4).Note that this experiment was constructed to purposely keepdestruction efficiencies relatively low, in order to maximize ssitivity of the system to changes in catalyst performance~Lowryand Reinhard 2000!. A kd value of 5.6531023 day21 was calcu-lated from Eq.~11! with TCE (Cin53.5 mg/L) as the sole contaminant andgcat50.5 gm. A best fit of the data for the initial 5days of operation was obtained usingkobs051.25 min21. Thisvalue for kobs0 is within the range of values reported by Lowand Reinhard~2000! for their model fits of data from their TCE indeionized water experiments. The discrepancy between theperimental data and the submodel output in the first days ofexperiment is apparently due to the period of super activityfresh catalyst, a phenomenon which is not incorporated inmodel. The catalyst was regenerated on days 58, 82, and 10the effect of regeneration is simulated as follows:
uv~ t !5uv~ t2r ! for t5r (13)
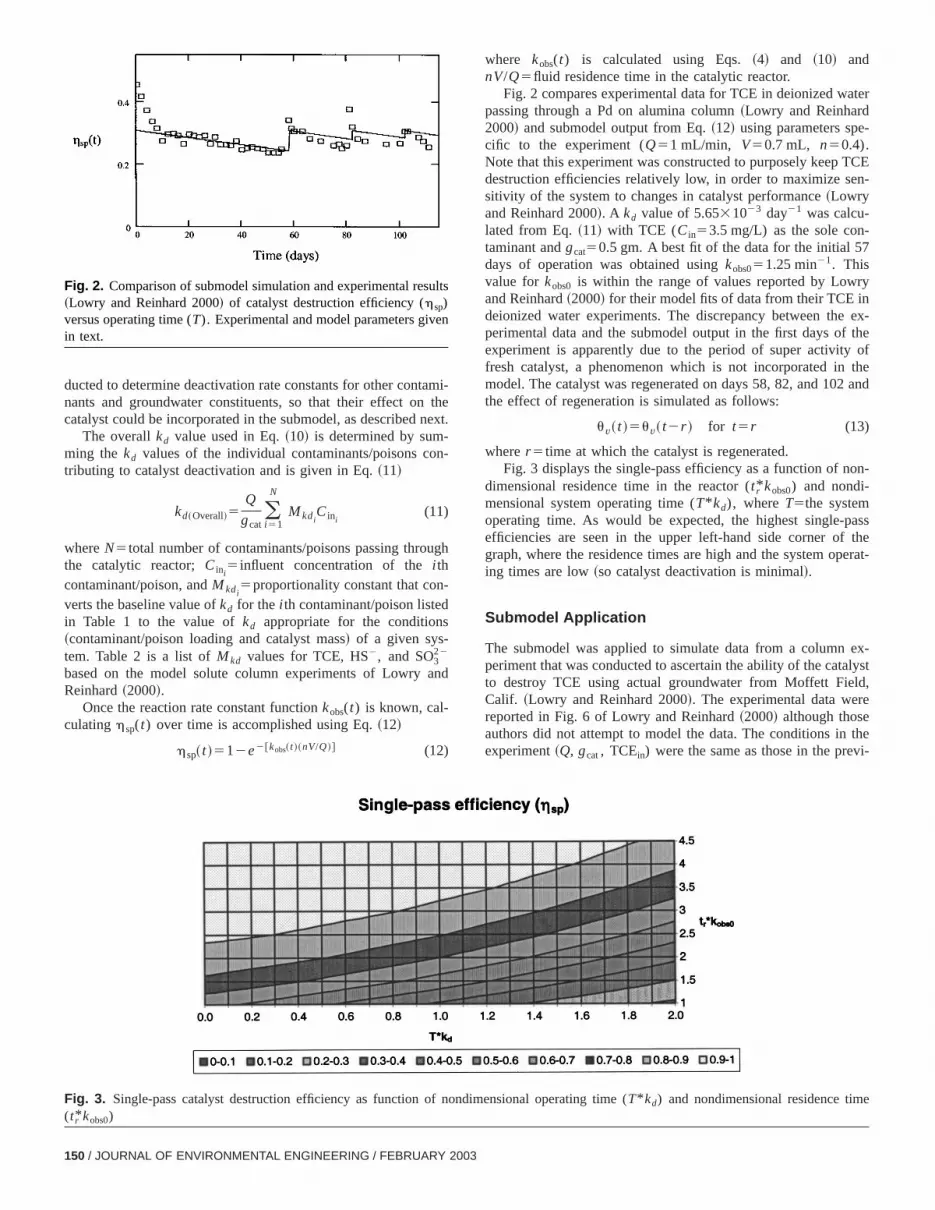
wherer 5time at which the catalyst is regenerated.Fig. 3 displays the single-pass efficiency as a function of n
dimensional residence time in the reactor (t r* kobs0) and nondi-mensional system operating time (T* kd), whereT5the systemoperating time. As would be expected, the highest single-pefficiencies are seen in the upper left-hand side corner ofgraph, where the residence times are high and the system oping times are low~so catalyst deactivation is minimal!.
Submodel Application
The submodel was applied to simulate data from a columnperiment that was conducted to ascertain the ability of the catato destroy TCE using actual groundwater from Moffett FieCalif. ~Lowry and Reinhard 2000!. The experimental data werreported in Fig. 6 of Lowry and Reinhard~2000! although thoseauthors did not attempt to model the data. The conditions inexperiment~Q, gcat, TCEin) were the same as those in the pre
e
Fig. 3. Single-pass catalyst destruction efficiency as function of nondimensional operating time (T* kd) and nondimensional residence tim(t r* kobs0)ducted to determine deactivation rate constants for other contamnants and groundwater constituents, so that their effect on tcatalyst could be incorporated in the submodel, as described ne
The overallkd value used in Eq.~10! is determined by sum-ming thekd values of the individual contaminants/poisons contributing to catalyst deactivation and is given in Eq.~11!
kd~Overall!5Q
gcat(i 51
N
MkdiCini
(11)
whereN5total number of contaminants/poisons passing througthe catalytic reactor;Cini
5 influent concentration of thei thcontaminant/poison, andMkdi
5proportionality constant that con-verts the baseline value ofkd for the i th contaminant/poison listedin Table 1 to the value ofkd appropriate for the conditions~contaminant/poison loading and catalyst mass! of a given sys-tem. Table 2 is a list ofMkd values for TCE, HS2, and SO3
22
based on the model solute column experiments of Lowry anReinhard~2000!.
Once the reaction rate constant functionkobs(t) is known, cal-culatinghsp(t) over time is accomplished using Eq.~12!
hsp~ t !512e2@kobs~ t !~nV/Q!# (12)

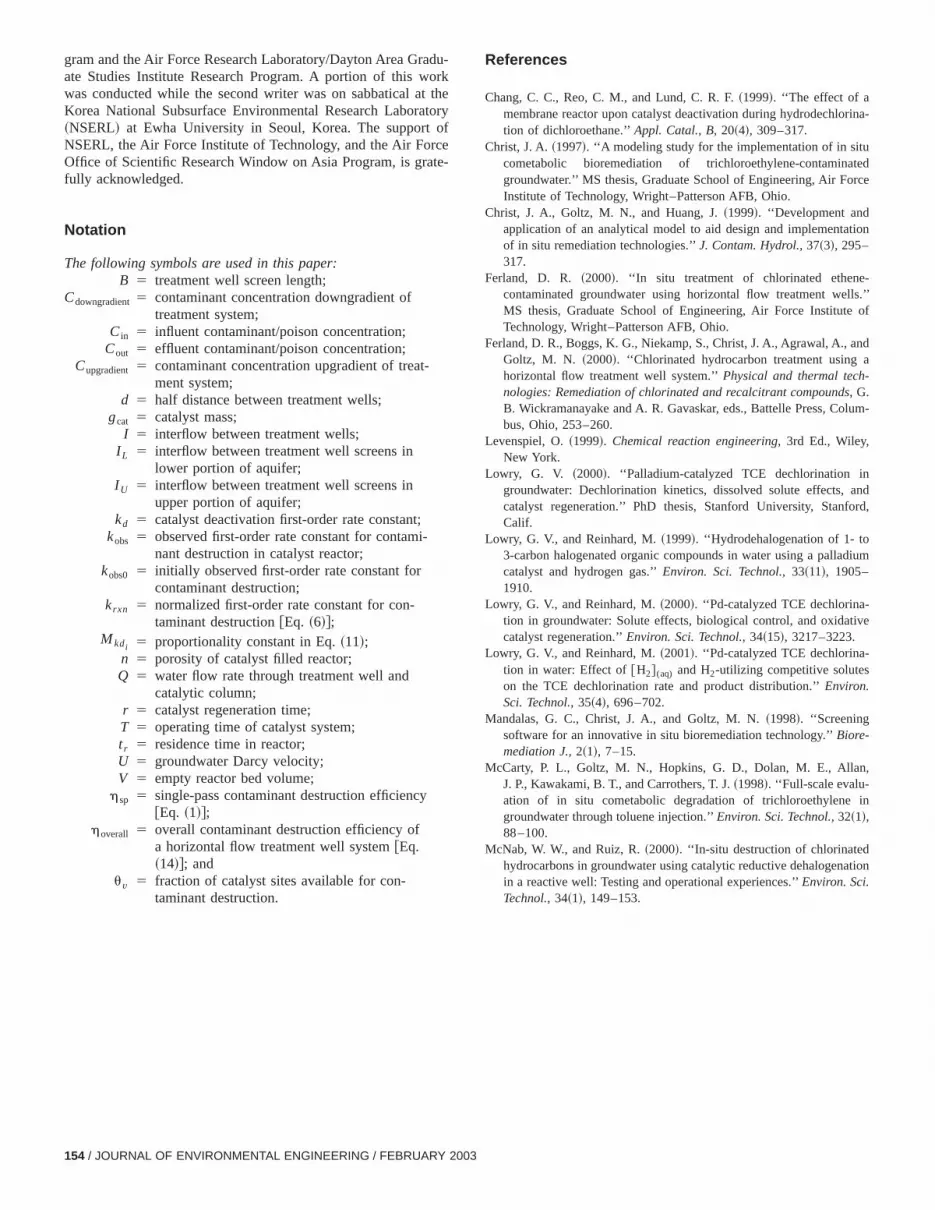
Fig. 4. Independently determined submodel output compared to experimental column results using Moffett groundwater~Lowry and Reinhard2000!
ionareffet
eas
-
llmn
ett
ictsrstlysrin
.1
eed
e
redso-rystenan
-
t thnlineffi-on
was
l toitram-
wa-
embealo-t
ant
-vely.ndforfi-
tionthe
plex
anass
JOU
t
-
tg
-
e
d
regeneration was performed with a hypochlorite pulse thatten times stronger than the first~750 mg/L!. This regeneration ismodeled, with subsequent simulation results comparing welthe observed data~Fig. 4!. Based on the simulations in Fig. 4,appears that the submodel, using independently obtained paeters, is able to qualitatively fit the experimental data.
Horizontal Flow Treatment Well Application
The submodel is next incorporated into the analytical groundter flow model developed by Christ et al.~1999! to determineoverall contaminant destruction efficiency in an HFTW systwith in-well Pd reactors. Note that the submodel may alsorelevant to other applications, such as Pd-catalyzed hydrodehgenation in an aboveground reactor~as part of a pump-and-treagroundwater remediation system! or in situ ~as the catalyst in apermeable reactive barrier!. For our discussion of in-well appli-cation as part of an HFTW system, we define overall contamindestruction efficiency (hoverall) as
hoverall5Cupgradient2Cdowngradient
Cupgradient(14)
whereCupgradientandCdowngradient5contaminant concentrations upgradient and downgradient of the treatment system, respectiAlthough an HFTW system may consist of multiple upflow adownflow well pairs, the analysis presented next is simplifieda single well pair. In this configuration, overall treatment efciency is dependent on single-pass treatment efficiency (hsp) andinterflow between the two treatment wells. Interflow~I! is definedas the fraction of groundwater pumped through an extracscreen at one well that originated at the injection screen ofadjacent treatment well and may be determined using compotential theory as described by Christ et al.~1999!. Mandalaset al. ~1998! showed that the overall treatment efficiency ofHFTW system could be related to the interflow and single-ptreatment efficiency by the following expression:
hoverall5hsp
12I ~12hsp!(15)
ous example that used deionized water~Fig. 2!. Fig. 4 comparessubmodel output with experimental results~Lowry and Reinhard2000!. The value ofkobs0 that was used (kobs051.25 min21) wasthe value that was calculated earlier from the TCE destructdata presented in Fig. 2 for deionized water. Note that weassuming that the presence of other compounds in the MoField groundwater does not influence the value ofkobs0—that is,we implicitly assume that there is no initial competition for activcatalyst sites among solutes. As described next, it was alsosumed that both TCE and HS2 contributed to catalyst deactivation. TheM kd values for TCE and HS2 that were used to calcu-latekd(Overall) in Eq. ~11! are the values reported in Table 2. Recathat these values were obtained from the model solute coluexperiments of Lowry and Reinhard~2000!, and thus were deter-mined independently from the column experiment using MoffField groundwater that is now being modeled.
Referring to Fig. 4, we see that the submodel over predTCE destruction efficiency by nearly a factor of 2 during the fi20 days operation. This may be due to deactivation of the cataby inorganic species not accounted for in the submodel, as duthe first 20 days, the submodel only accounted for TCE~3.5mg/L! as a catalyst poison. After 20 days operation, 060.05 mg/L HS2 was detected in the column effluent~Lowryand Reinhard 2000!. The writers speculated that this may havresulted from the growth of sulfate reducing bacteria that thrivon the ample supply of aqueous hydrogen~electron donor! andsulfate~177 mg/L! within the column. In order to account for thpresence of HS2, we conservatively set the influent HS2 value ofthe submodel to 0.15 mg/L, the upper bound of the measuconcentration range. The first regeneration with hypochloritelution ~75 mg/L! was conducted after 34 days operation. Lowand Reinhard~2000! noted that this dose had no effect on catalyperformance. Therefore, we did not attempt to model this regeration in Fig. 4. However, the hypochlorite appeared to haveimpact on sulfate reduction, as HS2 was not detected in the column effluent until six days later, so for days 34–40, HS2 con-centration is assumed to be 0 mg/L in the submodel. We resevalue of HS2 in the submodel to 0.15 mg/L following detectioof HS2 near that value on day 41. As a result, a noticeable decin the prediction of the submodel of the TCE destruction eciency can be seen from day 41 through day 45 when the sec
RNAL OF ENVIRONMENTAL ENGINEERING / FEBRUARY 2003 / 151

Table 3. Horizontal Flow Treatment Well Operating Parameters and Aquifer/Contaminant Characteristics
HFTW operating parameters Aquifer/contaminant characteristics
Number of treatment wells 2 Groundwater Darcy velocity~U!a 0.02056 m/day
Treatment well pumping rate~Q!a 10 L/min TCE concentration 3.5 mg/L
Catalytic reactor length Variable SO42 concentration 170 mg/Lb
Catalytic reactor diameter 15 cm Angle of regional groundwater flow~relative to lineconnecting the treatment wells!a
90°
Catalytic reactor porosity 0.4
Half distance between treatment wells~d!a 10 m
Treatment well screen lengths~B!a 8 maUsed to calculate interflow~I! following Christ et al.~1999!.bAssumed to result in HS2 concentrations of 0.6 mg/L in the catalytic reactor due to sulfate reducing bacteria.
t-owthe
e
be-
t-
pahyby
ynalmethe
tiva-us
i-entsis
umnher
in-mealyst
152 / JOURNAL OF ENVIRONMENTAL ENGINEERING / FEBRUARY 2003
d
--
Ferland et al.~2000! constructed HFTW overall efficienccontour graphs for an HFTW system by plotting nondimensioflow rate (Q/UBd) versus nondimensional reactor residence ti(kobs0t r), assuming chlorinated ethene degradation kinetics inreactor were first order, with rate constantkobs0. In order to ac-count for declining system performance due to catalyst deaction over time, Fig. 5 is a plot of efficiency contours at variosystem operating times~T! for a deactivation rate constant (kd) of0.1 day21. The reader will note that for small values of nondmensional flow rate, the contours are flat. This region represno interflow between treatment wells and HFTW efficiencyequal to the single-pass efficiency. As we increase the flow~hold-ing the residence time constant by increasing the reactor collength!, the contours begin to slope downward, indicating higsystem performance is achieved with increasing flow due tocreased interflow. A comparison of the four figures over tishows how overall system performance declines due to catdeactivation.
Fig. 5. Horizontal flow treatment well efficiency contour plots over time for parameter values in Table 3
Note that Eq.~15! implicitly assumes that the single-pass treament efficiencies in both wells are equal, and that the interflbetween the upper well screens in the well pair is equal tointerflow between the lower well screens. To use Eq.~15! to de-termine the overall treatment efficiency of an HFTW system, wcalculate single-pass treatment efficiency using the Pd/H2 systemsubmodel and we calculate interflow using the methods describy Christ et al.~1999!. The interflow calculation requires the following parameter values: Flow rate in treatment wells~Q!, re-gional Darcy velocity~U!, treatment well screen length~B!, halfdistance between treatment wells~d!, and angle of regionalgroundwater flow~relative to a line connecting the treatmenwells!. We now apply this methodology for a hypothetical contaminated aquifer scenario. Table 3 lists the HFTW operatingrameters and aquifer/contaminant characteristics used in ourpothetical scenario. Catalyst deactivation is simulatedassuming significant HS2 production~0.6 mg/L! in the catalyticreactor due to the growth of sulfate-reducing bacteria.

Table 4. Scenario Conditions~Based upon Edwards Air Force Base Site 19!
HFTW operating parametersa Aquifer/contaminant characteristics
Number of treatment wells 2 Groundwater Darcy velocity~U! 0.02056 m/day
Treatment well pumping rate~Q!d 31.25 L/min TCE concentration 15 mg/La
Catalytic reactor length 36 m SO42 concentration 170 mg/Lb
Catalytic reactor diameter 15.24 cm TCE plume width 200 mCatalytic reactor residence time (t r) 8.4 minc Angle of regional groundwater flow~relative to line
connecting the treatment wells!d67.5°
Half distance between treatment wells~d!d 40 m
Upper well screen lengths (BU)d 8 mLower well screen lengths (BL)d 5 maHypothetical.bAssumed to result in HS2 concentrations of 0.6 mg/L in the catalytic reactor due to sulfate reducing bacteria.cCalculated assuming catalyst porosity of 0.4.dUsed to calculate interflows in upper and lower aquifer (I U and I L) following Christ et al.~1999!.
-e
.t
--
singis
eti-isn.tersanths-of
esnd5
e,edae
eed
tionane-
En
x-the
rchnceh-nte
ento-
ithd on
JOU
-
As time progresses, catalyst deactivation results in decreaoverall efficiency predictions by the model presented in thstudy, while the Ferland~2000! model predicts no decrease inperformance. Note that for the parameters used in this hypothcal ~though realistic! scenario, significant catalyst deactivationnot observed until approximately 130 days into the simulatioFor an HFTW system operating using the engineered paramein Table 4, it appears that catalyst deactivation may not beimportant cost factor, as the cost of regeneration every 4 monwould not significantly impact overall system cost. Note, however, that the Table 4 design includes a reactor column length36 m, which may not be practical. This design, however, usonly two treatment wells to capture a 200 m wide plume ainitially attain downgradient TCE concentrations of less thanmg/L. In reality, multiple well pairs could be used. For examplincorporating an additional well pair would reduce the requirpumping rate of a single well and the in-well reactor size byfactor of two without changing the original residence time. Thdeactivation rate constant (kd) also remains constant since thratio of contaminant/poison loading to the amount of catalyst usin a treatment well remains constant.
Conclusions
This study presents a method for modeling catalyzed destrucof chlorinated ethenes in contaminated groundwater usingHFTW system with in-well Pd reactors. Using independently dtermined parameter values, the Pd/H2 reactor submodel did agood job of qualitatively simulating hydrodehalogenation of TCin Moffett Field groundwater as observed in laboratory columexperiments. The overprediction of the Pd/H2 submodel of thecontaminant destruction efficiency in the laboratory column eperiments suggests there may be other catalyst poisons inwater that are not accounted for by the model. Additional reseamay also provide insight on catalyst deactivation in the preseof multiple poisons. A field-scale evaluation of the HFTW tecnology with in-well Pd/H2 reactors is planned at Edwards AFB ithe future. Data from this evaluation may be used to validamodel predictions.
Acknowledgments
This work was supported, in part, by grants from the Departmof Defense Environmental Security Technology Certification Pr
Fig. 6. Comparison of horizontal flow treatment well models wand without catalyst deactivation for remediation scenario baseEdwards Air Force Base Site 19~Table 4 parameter values!
The HFTW model coupled with the Pd/H2 reactor submodel isnow used to simulate remediation of a real contaminated groundwater site, based on characteristics of a TCE contaminant plumat Site 19 of Edwards AFB~McCarty et al. 1998!. The site char-acteristics and HFTW operating parameters are listed in Table 4Note that since the upper and lower screen lengths in the treament wells are different, the interflow between the upper andlower screens will be different and Eq.~15! cannot be used. Christ~1997! derived Eqs.~16! and~17!, which can be used to calculatethe overall treatment efficiency of an HFTW system in the upper(hoverallU) and lower (hoverallL) portions of an aquifer, respec-tively, when the interflows between the upper (I U) and lower (I L)well screens are unequal.
hoverallU512F ~12I L!~12hsp!1I L~12I U!~12hsp!2
12I UI L~12hsp!2 G
(16)
hoverallL512F ~12I U!~12hsp!1I U~12I L!~12hsp!2
12I UI L~12hsp!2 G
(17)
Fig. 6 compares overall HFTW system efficiency in the upperaquifer (hoverallU) predicted by Ferland’s~2000! model that as-sumes first-order chlorinated ethene destruction kinetics with predictions of the model developed in this study. As expected, system performance predictions from both models initially are equal.
RNAL OF ENVIRONMENTAL ENGINEERING / FEBRUARY 2003 / 153
adu-orkt thetoryof
rceate-
na-
dce
on
.’’of
d
m-
ndd,
ium
e
n
ion
gram and the Air Force Research Laboratory/Dayton Area Grate Studies Institute Research Program. A portion of this wwas conducted while the second writer was on sabbatical aKorea National Subsurface Environmental Research Labora~NSERL! at Ewha University in Seoul, Korea. The supportNSERL, the Air Force Institute of Technology, and the Air FoOffice of Scientific Research Window on Asia Program, is grfully acknowledged.
Notation
The following symbols are used in this paper:B 5 treatment well screen length;
Cdowngradient5 contaminant concentration downgradient oftreatment system;
Cin 5 influent contaminant/poison concentration;Cout 5 effluent contaminant/poison concentration;
Cupgradient 5 contaminant concentration upgradient of treat-ment system;
d 5 half distance between treatment wells;gcat 5 catalyst mass;
I 5 interflow between treatment wells;I L 5 interflow between treatment well screens in
lower portion of aquifer;I U 5 interflow between treatment well screens in
upper portion of aquifer;kd 5 catalyst deactivation first-order rate constant;
kobs 5 observed first-order rate constant for contami-nant destruction in catalyst reactor;
kobs0 5 initially observed first-order rate constant forcontaminant destruction;
krxn 5 normalized first-order rate constant for con-taminant destruction@Eq. ~6!#;
Mkdi 5 proportionality constant in Eq.~11!;n 5 porosity of catalyst filled reactor;Q 5 water flow rate through treatment well and
catalytic column;r 5 catalyst regeneration time;T 5 operating time of catalyst system;t r 5 residence time in reactor;U 5 groundwater Darcy velocity;V 5 empty reactor bed volume;
hsp 5 single-pass contaminant destruction efficiency@Eq. ~1!#;
hoverall 5 overall contaminant destruction efficiency ofa horizontal flow treatment well system@Eq.~14!#; and
uv 5 fraction of catalyst sites available for con-taminant destruction.
154 / JOURNAL OF ENVIRONMENTAL ENGINEERING / FEBRUARY 2003
References
Chang, C. C., Reo, C. M., and Lund, C. R. F.~1999!. ‘‘The effect of amembrane reactor upon catalyst deactivation during hydrodechlorition of dichloroethane.’’Appl. Catal., B,20~4!, 309–317.
Christ, J. A.~1997!. ‘‘A modeling study for the implementation of in situcometabolic bioremediation of trichloroethylene-contaminategroundwater.’’ MS thesis, Graduate School of Engineering, Air ForInstitute of Technology, Wright–Patterson AFB, Ohio.
Christ, J. A., Goltz, M. N., and Huang, J.~1999!. ‘‘Development andapplication of an analytical model to aid design and implementatiof in situ remediation technologies.’’J. Contam. Hydrol.,37~3!, 295–317.
Ferland, D. R. ~2000!. ‘‘In situ treatment of chlorinated ethene-contaminated groundwater using horizontal flow treatment wellsMS thesis, Graduate School of Engineering, Air Force InstituteTechnology, Wright–Patterson AFB, Ohio.
Ferland, D. R., Boggs, K. G., Niekamp, S., Christ, J. A., Agrawal, A., anGoltz, M. N. ~2000!. ‘‘Chlorinated hydrocarbon treatment using ahorizontal flow treatment well system.’’Physical and thermal tech-nologies: Remediation of chlorinated and recalcitrant compounds, G.B. Wickramanayake and A. R. Gavaskar, eds., Battelle Press, Colubus, Ohio, 253–260.
Levenspiel, O.~1999!. Chemical reaction engineering, 3rd Ed., Wiley,New York.
Lowry, G. V. ~2000!. ‘‘Palladium-catalyzed TCE dechlorination ingroundwater: Dechlorination kinetics, dissolved solute effects, acatalyst regeneration.’’ PhD thesis, Stanford University, StanforCalif.
Lowry, G. V., and Reinhard, M.~1999!. ‘‘Hydrodehalogenation of 1- to3-carbon halogenated organic compounds in water using a palladcatalyst and hydrogen gas.’’Environ. Sci. Technol.,33~11!, 1905–1910.
Lowry, G. V., and Reinhard, M.~2000!. ‘‘Pd-catalyzed TCE dechlorina-tion in groundwater: Solute effects, biological control, and oxidativcatalyst regeneration.’’Environ. Sci. Technol.,34~15!, 3217–3223.
Lowry, G. V., and Reinhard, M.~2001!. ‘‘Pd-catalyzed TCE dechlorina-tion in water: Effect of@H2# (aq) and H2-utilizing competitive soluteson the TCE dechlorination rate and product distribution.’’Environ.Sci. Technol.,35~4!, 696–702.
Mandalas, G. C., Christ, J. A., and Goltz, M. N.~1998!. ‘‘Screeningsoftware for an innovative in situ bioremediation technology.’’Biore-mediation J.,2~1!, 7–15.
McCarty, P. L., Goltz, M. N., Hopkins, G. D., Dolan, M. E., Allan,J. P., Kawakami, B. T., and Carrothers, T. J.~1998!. ‘‘Full-scale evalu-ation of in situ cometabolic degradation of trichloroethylene igroundwater through toluene injection.’’Environ. Sci. Technol.,32~1!,88–100.
McNab, W. W., and Ruiz, R.~2000!. ‘‘In-situ destruction of chlorinatedhydrocarbons in groundwater using catalytic reductive dehalogenatin a reactive well: Testing and operational experiences.’’Environ. Sci.Technol.,34~1!, 149–153.