Embed Size (px)
Citation preview

Biological Instability in a Chlorinated Drinking WaterDistribution NetworkAlina Nescerecka1,2, Janis Rubulis1, Marius Vital2, Talis Juhna1, Frederik Hammes2*
1 Department of Water Engineering and Technology, Riga Technical University, Riga, Latvia, 2 Department of Environmental Microbiology, Eawag, Swiss Federal Institute
for Aquatic Science and Technology, Dubendorf, Switzerland
Abstract
The purpose of a drinking water distribution system is to deliver drinking water to the consumer, preferably with the samequality as when it left the treatment plant. In this context, the maintenance of good microbiological quality is often referredto as biological stability, and the addition of sufficient chlorine residuals is regarded as one way to achieve this. The full-scaledrinking water distribution system of Riga (Latvia) was investigated with respect to biological stability in chlorinateddrinking water. Flow cytometric (FCM) intact cell concentrations, intracellular adenosine tri-phosphate (ATP), heterotrophicplate counts and residual chlorine measurements were performed to evaluate the drinking water quality and stability at 49sampling points throughout the distribution network. Cell viability methods were compared and the importance ofextracellular ATP measurements was examined as well. FCM intact cell concentrations varied from 56103 cells mL21 to4.666105 cells mL21 in the network. While this parameter did not exceed 2.16104 cells mL21 in the effluent from any watertreatment plant, 50% of all the network samples contained more than 1.066105 cells mL21. This indisputably demonstratesbiological instability in this particular drinking water distribution system, which was ascribed to a loss of disinfectantresiduals and concomitant bacterial growth. The study highlights the potential of using cultivation-independent methodsfor the assessment of chlorinated water samples. In addition, it underlines the complexity of full-scale drinking waterdistribution systems, and the resulting challenges to establish the causes of biological instability.
Citation: Nescerecka A, Rubulis J, Vital M, Juhna T, Hammes F (2014) Biological Instability in a Chlorinated Drinking Water Distribution Network. PLoS ONE 9(5):e96354. doi:10.1371/journal.pone.0096354
Editor: Jose Luis Balcazar, Catalan Institute for Water Research (ICRA), Spain
Received January 10, 2014; Accepted April 7, 2014; Published May 5, 2014
Copyright: � 2014 Nescerecka et al. This is an open-access article distributed under the terms of the Creative Commons Attribution License, which permitsunrestricted use, distribution, and reproduction in any medium, provided the original author and source are credited.
Funding: The authors acknowledge the financial support of the EU project ‘‘TECHNEAU’’ (Nr. 018320) and the NMS-CH project ‘‘BioWater: Assessment ofbiological stability in drinking water distribution networks with chlorine residuals’’ (Sciex-N-7 12.265). The funders had no role in study design, data collection andanalysis, decision to publish, or preparation of the manuscript.
Competing Interests: The authors have declared that no competing interests exist.
* E-mail: [email protected]
Introduction
The goal of public drinking water supply systems is to produce
water of acceptable aesthetic and hygienic quality and to maintain
that quality throughout distribution until the point of consump-
tion. From a microbiological perspective, the quality of treated
water can deteriorate as a result of excessive bacterial growth,
which can lead to problems such as a sensory deterioration of
water quality (e.g. taste, odor, turbidity, discoloration) as well as
pathogen proliferation [1–10]. To avoid this, biological stability
during distribution can be achieved by maintaining sufficient
residual disinfectants in the water, and/or through nutrient
limitations [3,7,11,12]. However, drinking water systems should
not be viewed as sterile; complex indigenous bacterial communi-
ties have been shown to inhabit both chlorinated and non-
chlorinated drinking water distribution systems [5,13–17].
The concept of biological stability and its impact on a system’s
microbiology has been discussed extensively in the framework of
non-chlorinated drinking water distribution systems [3,7,17–20].
However, many treatment plants worldwide employ a final
disinfection step to ensure that no viable bacteria enter the
distribution system. The latter is often achieved by oxidative
disinfection, usually by chlorination [21]. Disinfection has a
number of implications for a biological system. During chlorina-
tion, one can expect that a considerable fraction of bacteria in the
water are killed or damaged, while some residual chlorine may
remain in the water (Figure 1). This could be visible through
numerous microbial monitoring methods. For example, the
number of cultivable bacteria, measured with heterotrophic plate
counts, would reduce dramatically [22,23]. Secondly, bacteria cells
are likely to display measurable membrane damage irrespective of
their cultivability [24], though the rate and extent of damage may
differ between different communities. This would be detectable
with several staining techniques coupled with epifluorescence
microscopy or flow cytometry (FCM). Also, adenosine tri-
phosphate (ATP), often used as a cultivation-independent viability
method [19,22,25] will be severely affected. Based on data from
Hammes and co-workers [4] one may reasonably expect increased
levels of extracellular ATP (so-called free ATP) and decreased
concentrations of intracellular ATP (bacterial ATP) following
oxidative disinfection. Irrespective of the detection method, the
overall consequence of disinfection is a considerable decrease in
the viable biomass, potentially opening a niche for microorganisms
to occupy downstream of the treatment process. Following initial
disinfection, residual chlorine might provoke undesirable changes
during drinking water distribution. Disinfectants target not only
bacteria, but it also react with natural organic matter, pipe surfaces
and particles in the network, thus potentially forming/releasing
assimilable organic carbon (AOC) [26–30]. AOC can easily be
consumed by bacteria, and is therefore seen as a main contributor
PLOS ONE | www.plosone.org 1 May 2014 | Volume 9 | Issue 5 | e96354

to biological instability. Moreover, chlorine decay within the
network negatively affects its ability to inhibit microbial growth at
the far ends of the network [12]. If all factors were considered, the
presence of nutrients, a reduction in the number of competing
bacteria, and the lack of residual disinfectant would potentially
lead to biological instability in the distribution network, manifest-
ing in a subsequent bacterial growth (Figure 1). Besides the
importance of nutrients, the extent of bacterial growth will be
influenced by a number of factors. For example, increased water
temperature can accelerate chlorine decay and favor bacteria
growth [19,31], while changes in hydraulic conditions can alter
nutrient supply for microorganisms in biofilms and/or bacteria
detachment from the pipe surfaces [32,33]. Finally, the quality of
materials in contact with drinking water, as well as the presence of
sediments and loose deposits, can both affect the general microbial
quality of the water [6,34,35].
In the present study we examined some of the above-discussed
concepts in a full-scale, chlorinated distribution system in the city
of Riga (Latvia) with a number of microbiological methods. The
purpose was a detailed investigation of the entire city’s distribution
network, asking the basic question whether evidence of spatial
and/or temporal biological instability exists, and if so, to which
degree. Additional goals were to evaluate the use of fluorescent
staining coupled with FCM, as well as ATP analysis, for the
assessment of chlorinated drinking water in a distribution network
with disinfectant residuals.
Materials and Methods
Ethics statementPermission for sampling at all locations in the present study was
obtained from the local water utility (Rıgas Udens).
Description of study siteSampling was performed in the full-scale distribution network of
Riga (Latvia) with a total length of about 1400 km. The city is
supplied with drinking water from six water treatment plants
(WTP) produced from both surface and groundwater (150 000 m3
d21). Only the three major WTP, which are continuously
operated, were included in the sampling campaign. Average
WTP effluent water quality parameters for each treatment plant
are shown in Table 1. The distribution network mainly consists of
cast iron (80%) and unlined iron (15%) pipes as old as 50 years.
The diameters of pipes ranged from 100 to 1200 mm. Three
reservoirs are operated in the network to compensate for
fluctuations in the daily water demand, while four high-pressure
zones are maintained in some distal areas of the network. The
high-pressure zones were excluded from the present study. A total
of 49 sampling sites were selected across the city to cover the
network broadly and to include both proximal and distal zones
relative to the treatment plants. The sampling sites were selected
according to the approximate water retention times obtained from
a validated hydraulic model made in EPANET 2.0 [36,37] based
on a total length of 538 km (39% of the total length of the
network). Apart from the effluents of the three treatment plants,
the sampling sites were in all cases fire hydrants in order to attain
some degree of reproducibility between sampling and to avoid
localized effects (e.g. household growth). The exact locations of
sampled fire hydrants can be obtained from the authors after
agreement from the local water utility.
Sampling protocolA specific sampling protocol was designed and followed in order
to avoid artifacts due to water stagnation in unused fire hydrants.
Each hydrant was pre-flushed at a high velocity (never exceeding
1.6 m s21) for no more than 60 s, then immediately adjusted to a
low velocity of 0.015–0.25 m s21 and connected to an online
system for monitoring pH, temperature, redox potential, electro-
conductivity and turbidity. The low sampling velocity was
specifically used to ensure a minimal possible impact of cell wall
erosion and detachment from biofilms on the samples and
measurements. Readings of all parameters were taken at 5–10
minute intervals, and water was only sampled for microbiological
analysis once all of the parameters stabilized. The impact of this
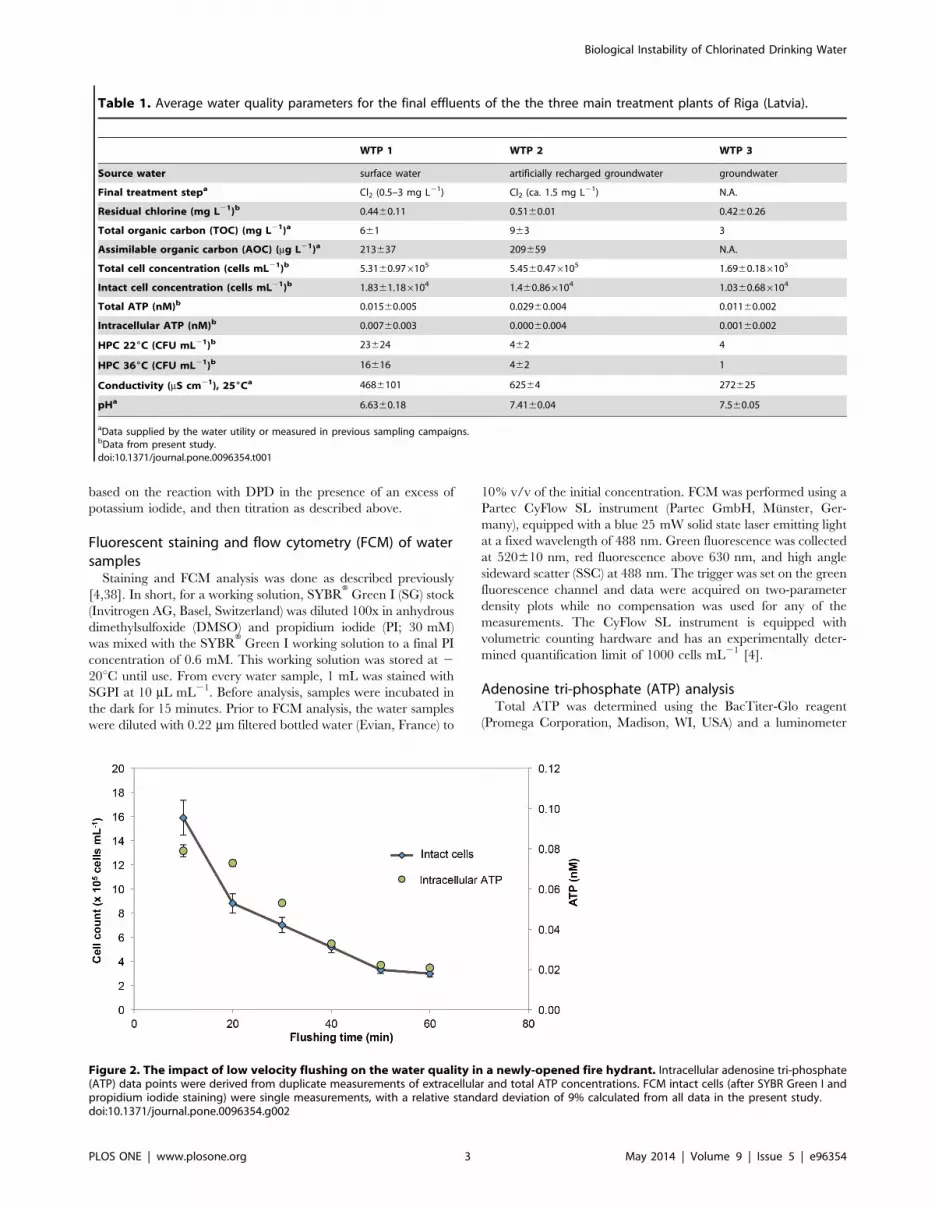
hydrant flushing is demonstrated in an example in Figure 2 and
discussed in detail in the results section. Samples were kept in cold
storage (<5uC) and analyzed within four hours of sampling.
Chemical analysisDetermination of free chlorine was performed according to
standard method EN ISO 7393-1, based on the direct reaction
with N,N-diethyl-1,4-phenylenediamine (DPD) and subsequent
formation of a red compound at pH 6.2–6.5. Afterwards titration
by means of a standard solution of ammonium iron (III) sulfate
until disappearance of the red color was performed. Determina-
tion of total chlorine was performed according to EN ISO 7393-1,
Figure 1. A worst-case-scenario in an unstable, chlorinated distribution network. Prediction of changes in the microbiological state of thewater due to the depletion of residual chlorine and the concomitant growth of bacteria, potentially resulting in hygienic and sensory deterioration ofthe water quality.doi:10.1371/journal.pone.0096354.g001
Biological Instability of Chlorinated Drinking Water
PLOS ONE | www.plosone.org 2 May 2014 | Volume 9 | Issue 5 | e96354
based on the reaction with DPD in the presence of an excess of
potassium iodide, and then titration as described above.
Fluorescent staining and flow cytometry (FCM) of watersamples
Staining and FCM analysis was done as described previously
[4,38]. In short, for a working solution, SYBRH Green I (SG) stock
(Invitrogen AG, Basel, Switzerland) was diluted 100x in anhydrous
dimethylsulfoxide (DMSO) and propidium iodide (PI; 30 mM)
was mixed with the SYBRH Green I working solution to a final PI
concentration of 0.6 mM. This working solution was stored at 2
20uC until use. From every water sample, 1 mL was stained with
SGPI at 10 mL mL21. Before analysis, samples were incubated in
the dark for 15 minutes. Prior to FCM analysis, the water samples
were diluted with 0.22 mm filtered bottled water (Evian, France) to
10% v/v of the initial concentration. FCM was performed using a
Partec CyFlow SL instrument (Partec GmbH, Munster, Ger-
many), equipped with a blue 25 mW solid state laser emitting light
at a fixed wavelength of 488 nm. Green fluorescence was collected
at 520610 nm, red fluorescence above 630 nm, and high angle
sideward scatter (SSC) at 488 nm. The trigger was set on the green
fluorescence channel and data were acquired on two-parameter
density plots while no compensation was used for any of the
measurements. The CyFlow SL instrument is equipped with
volumetric counting hardware and has an experimentally deter-
mined quantification limit of 1000 cells mL21 [4].
Adenosine tri-phosphate (ATP) analysisTotal ATP was determined using the BacTiter-Glo reagent
(Promega Corporation, Madison, WI, USA) and a luminometer
Table 1. Average water quality parameters for the final effluents of the the three main treatment plants of Riga (Latvia).
WTP 1 WTP 2 WTP 3
Source water surface water artificially recharged groundwater groundwater
Final treatment stepa Cl2 (0.5–3 mg L21) Cl2 (ca. 1.5 mg L21) N.A.
Residual chlorine (mg L21)b 0.4460.11 0.5160.01 0.4260.26
Total organic carbon (TOC) (mg L21)a 661 963 3
Assimilable organic carbon (AOC) (mg L21)a 213637 209659 N.A.
Total cell concentration (cells mL21)b 5.3160.976105 5.4560.476105 1.6960.186105
Intact cell concentration (cells mL21)b 1.8361.186104 1.460.866104 1.0360.686104
Total ATP (nM)b 0.01560.005 0.02960.004 0.01160.002
Intracellular ATP (nM)b 0.00760.003 0.00060.004 0.00160.002
HPC 226C (CFU mL21)b 23624 462 4
HPC 366C (CFU mL21)b 16616 462 1
Conductivity (mS cm21), 256Ca 4686101 62564 272625
pHa 6.6360.18 7.4160.04 7.560.05
aData supplied by the water utility or measured in previous sampling campaigns.bData from present study.doi:10.1371/journal.pone.0096354.t001
Figure 2. The impact of low velocity flushing on the water quality in a newly-opened fire hydrant. Intracellular adenosine tri-phosphate(ATP) data points were derived from duplicate measurements of extracellular and total ATP concentrations. FCM intact cells (after SYBR Green I andpropidium iodide staining) were single measurements, with a relative standard deviation of 9% calculated from all data in the present study.doi:10.1371/journal.pone.0096354.g002
Biological Instability of Chlorinated Drinking Water
PLOS ONE | www.plosone.org 3 May 2014 | Volume 9 | Issue 5 | e96354

(Glomax, Turner Biosystems, Sunnyvale, CA, USA) as described
elsewhere [25]. A water sample (500 ml) and the ATP reagent
(50 ml) were warmed to 38uC simultaneously in separate sterile
Eppendorf tubes. The sample and the reagent were then
combined and then the luminescence was measured after 20 s
reaction time at 38uC. The data were collected as relative light
units (RLU) and converted to ATP (nM) by means of a calibration
curve made with a known ATP standard (Promega). For
extracellular ATP analysis, each sample was filtered through a
0.1 mm sterile syringe filter (Millex-GP, Millipore, Billerica, MA,
USA), followed by analysis as described above. The intracellular
ATP was calculated by subtracting the extracellular ATP from the
total ATP for each individual sample. ATP was measured in
duplicate for all samples.
Heterotrophic plate countsTo obtain heterotrophic plate counts (HPC), samples were
serially diluted in sterile distilled water and then inoculated onto
nutrient yeast agar plates using the spread plate technique. All
plates were incubated in dark at 22uC or 36uC for 3 and 7 days,
respectively. Results were expressed as colony forming units (CFU)
per ml of water sample.
Statistical analysisStatistical data evaluation was performed with the MS Excel
Data Analysis tool (Descriptive statistics, Regression). The
reproducibility for indirect/calculated data (e.g., intracellular
ATP) was calculated by a propagation-of-uncertainty method.
FCM data was not always measured in duplicate, due to practical
constraints. In these cases, a 9% error (average coefficient of
variation (CV) (n = 39)) was applied for representing FCM data.
The residual chlorine concentration distribution box plot was
created using on-line calculator on http://www.physics.csbsju.
edu/stats/.
Results and Discussion
The importance of correct samplingSample collection during this study elucidated some of the
problems specific for this network and highlighted the broader
importance of correct sampling procedures. Fire hydrants were
selected as sampling points to enable direct access to the
distribution network and avoid potential household effects [39].
We opted for a low velocity water flow in combination with online
monitoring to achieve comparable samples. In some cases, the
water initially emerging from the fire hydrants were visibly turbid
and/or discolored (data not shown). Turbid water is clearly
unwanted and serves as a first visual confirmation of some form of
system failure. In this regard, a recent study in the Netherlands has
established an important link between suspended solids and
microbial growth and biological instability [6]. Hence in some
instances continuous low velocity flushing of up to 60 minutes was
required before stable values for chemical and physical parameters
as well as microbiological parameters were obtained (Figure 2;
Table S1). The data in Figure 2 demonstrate clearly the need for a
carefully planned sampling protocol when assessing full-scale
systems. It should be noted that Figure 2 represents an example of
some of the worst sampling points in the system. Data from other
hydrants often showed less fluctuation during flushing (Figure S1).
One potential problem during the sampling procedure is the re-
suspension of sediments/particles and sloughing of biofilms from
the pipes, causing artifacts in the measurements. In this respect, we
specifically employed a low velocity (0.015–0.25 m s21) pre-
sampling flushing procedure. The latter differs from extreme
flushing applied for network cleaning, which is operated with high
velocities of 1.5–1.8 m s21 [40,41]. According to Antoun and co-
workers [40] low-veocity flushing (below 0.3 m s21) does not cause
any scouring actions. However, it should be considered that part of
the samples, especially during the first minutes of the flushing, can
cointain biofilm bacteria detatched in a result of pre-flushing [35].
The concept of detecting instability: a single point in thedistribution network
In the introduction we proposed the straightforward hypothesis
that biological parameters would show an increase between the
point of treatment and a point during distribution in case of
biological instability (Figure 1). Before the relation between
different parameters and the impact on the entire network are
discussed in detail below, a single sampling point is compared to its
source water as an example to illustrate the concept (Figure 3A).
The point was selected on the basis of (1) hydraulic data linking it
with a specific WTP, (2) its medial distance from WTP (neither too
close and nor too far from the WTP) and, (3) the fact that all
microbiological parameters (FCM, ATP and HPC) as well as
residual chlorine measurements were performed on this sample.
For the purpose of clarity, the data was normalized to the values of
the treated water and expressed as the relative change (the raw
data and standard deviations for the data in Figure 3A are shown
in Figure S2). Evidently the data from Figure 3A supports the basic
hypothesis. The microbial parameters such as intact cell concen-
tration, ATP and colony forming units all show a considerable
increase in their values. Simultaneously, only 12% (0.06 mg L21)
of the initial residual chlorine concentration (0.5 mg L21) was left
in the water sample. The data suggests that the residual chlorine in
the network was not sufficient to inhibit microbial growth,
concurring with earlier report from Prevost and colleagues [42]
showing increased HPC, total direct and direct viable bacteria
counts in a distribution network coinciding with chlorine
depletion. Other studies also showed the presence of viable
bacteria in water with chlorine concentration lower than 0.1 mg
L21 [23] and that residual chlorine levels below 0.07 mg L21
allows bacterial growth [12]. Data of residual chlorine concentra-
tions in the drinking water network is summarized in Figure S3.
Evidently a considerable fraction of samples (18%) had residual
chlorine concentrations below 0.1 mg L21.
Staining of bacteria with fluorescent dyes was previously
suggested as a way to distinguish between viable and damaged
bacteria in real water samples [43,44], and the application of this
approach has been successfully demonstrated in laboratory scale
chlorination studies [24,45]. One focus point of the present study
was to determine whether FCM combined with viability staining
can be used for a fast and meaningful assessment of viable bacteria
in chlorinated drinking water systems. The same samples from
Figure 3A, stained with SYBR Green and propidium iodide
(SGPI), are shown as density plots obtained with FCM (Figure 3B).
The theory behind the staining method and the interpretation of
such data are discussed in detail elsewhere [20,24,38,43,46]. In the
treatment plant sample, where the water was recently exposed to
chlorine, 98% of all cells were measured as membrane compro-
mised, seen by absence of events inside the gated area of the plot
(Figure 3B). In the distribution network (DN) sample, a high
concentration of intact cells appeared (Figure 3B). Since these
intact cells were clearly not present in the influent, the plausible
conclusion is that the bacterial growth occurred during distribu-
tion.
Biological Instability of Chlorinated Drinking Water
PLOS ONE | www.plosone.org 4 May 2014 | Volume 9 | Issue 5 | e96354

Detailed assessment of dynamic changes in a singlepoint
High frequency monitoring of a single sampling point revealed
temporal instability in the distribution network. We monitored the
effluent of one treatment plant and one point in the network with
1-hour intervals during a day (ca. 21 h). The sampling was
arranged in such a way that the network sampling started 15 hours
after the treatment plant sampling, which corresponded with the
estimated water residence time (WRT) for this location. Figure 4
displays the changes of intracellular ATP and intact cell
concentrations in the network and the water treatment plant.
Values for both parameters were low in the water samples from
the treatment plant (n = 19): intracellular ATP varied from
0.0025 nM to 0.0096 nM (mean = 0.006160.002 nM) and the
intact cell concentration amongst 19 samples varied from 7.56103
to 6.36104 cells mL21 (mean = 1.6610461.26104 cells mL21 in
average). In turn, the values from the distribution network point
(n = 23) were significantly higher: intact cell concentrations ranged
from 1.376105 to 4.666105 cells mL21
(mean = 2.5610569.96104 cells mL21), and the ATP concentra-
tions from 0.021 to 0.063 nM (mean = 0.03860.012 nM). More-
over, a distinct pattern was apparent in the distribution network
data, with values peaking at about 05:00–07:00 and again at
12:00–13:00. During both these events, the intracellular ATP data
followed a similar pattern as the intact cell concentration data,
with a good overall correlation (R2 = 0.81; p,0.005). Although it
is not evident exactly why the bacterial concentrations peaked at
these specific time periods, a plausible explanation is a change in
the flow velocity due to diurnal changes in water consumption by
both industrial and domestic consumers. It was previously shown
in laboratory scale experiments that increased flow velocity could
lead to increased bacterial detachment from biofilms and a re-
suspension of loose deposits, thus leading to an increase in
suspended cell concentrations [32,33,47]. In addition, it is possible
that lower water consumption overnight resulted in considerably
reduced flow rates, and consequently a faster decay of chlorine and
increased bacterial growth [42,48].
Detailed data sets of diurnal changes in the microbial quality of
water mains, such as Figure 4, are particularly scarce in literature.
Importantly, this clearly demonstrated temporal instability in the
network for which the exact cause remains uncertain. Moreover, it
Figure 3. Changes in bacterial parameters between water treatment plant (WTP) and distribution network (DN) sampling points. (A)For comparison, all values at the WTP were set to 1, and values in the DN were expressed relative to their values at the WTP. The original raw data forthese samples are shown in Figure S2. Data points are average values for duplicate FCM and ATP measurements and triplicate HPC measurements; (B)Flow cytometric density plots of samples stained with SYBR Green I and propidium iodide, showing the intact cell concentration at the plant and inthe specific network point.doi:10.1371/journal.pone.0096354.g003
Biological Instability of Chlorinated Drinking Water
PLOS ONE | www.plosone.org 5 May 2014 | Volume 9 | Issue 5 | e96354

shows that the absolute cell concentrations at any sampling point
may be influenced by the time of sampling.
Instability data for the entire networkFull-scale distribution networks are complicated systems, not
restricted to a single source or a straight distribution line [17]. The
Riga distribution network is supplied with drinking water from
several separate treatment plants (Table 1). One plant treats
surface water from the Daugava River (WTP 1) and the others
supply natural groundwater (WTP 3) and artificially recharged
groundwater (WTP 2). Chlorination is applied as the final
disinfection step at all plants, resulting in low concentrations of
intact cells, intracellular ATP and cultivable bacteria in the
effluents (Table 1). A large fraction of the active chorine is rapidly
consumed due to relatively high levels of organic matter. Despite
the fact that the purpose of chlorination and residual chlorine is to
limit microbial growth during distribution, a considerable increase
in the concentration of intact cells was detected throughout the
distribution network. Figure 5A shows the range of intact cell
concentrations arranged in ascending order. Treated water
contained between 1.846105–5.636105 total cells mL21 and
between 9.76103–2.136104 intact cells mL21 (hence 2–5% intact
cells) depending on WTP. The data confirms effective final
disinfection in all treatment plants. The total cell concentration
values of the drinking water samples from the distribution network
(n = 49) varied from 1.626105 cells mL21 to 1.076106 cells mL21
and the range of the intact cell concentration was from
5.286103 cells mL21 to 4.666105 cells mL21 (3–59% intact
cells). Notably, 50% of all samples contained more than 1.066105
intact cells mL21 corresponding to an increase of at least one order
of magnitude in those samples compared to effluent water, which
clearly shows that bacterial growth in the distribution network was
not an isolated occurrence. The observed increase in intact cell
concentration is likely related to the presence of assimilable
organic carbon (AOC) in the distributed water. While AOC was
not measured in the present study, previous data for two of the
treatment plants were high (in the range of 200 mg L21; Table 1),
and nutrient availability in the water is generally regarded as a key
factor that promotes microbial growth [29,49]. It cannot be
excluded that some variability in the data resulted from bacteria
detached from biofilms or re-suspended from sediments during the
fire hydrant sampling procedure. However, the potential adverse
impact of this was minimized by the low velocity sampling
protocol (see above), while the systematic increase in cell
concentrations in the network clearly suggests the occurrence of
biological instability rather than sampling artifacts. In contrast to
these findings, several studies analyzing drinking water distribution
systems without any additional residual disinfectants showed no (or
only minute) changes in bacterial parameters during distribution
[17,19,20]. These distributions systems rely on nutrient limitation
to achieve biological stability, and while intact cell concentrations
are often relatively high (ca. 16105 cells mL21) [17,20], changes
during distribution tend to be negligible.
To examine the spatial distribution of the growth/instability in
the network, the data was divided into four broad categories based
on the extent of growth (Figure 5A). These were visualized on the
sampling map (Figure 5B). The sampling points with the lowest
intact cell concentration (less than 56104 cells mL21) are marked
with green bullets. Yellow and orange colored bullets indicate
higher concentrations, while the points with the highest values
(over 26105 cells mL21) are shown as red bullets. As could be
expected, the map shows that the points with the lowest cell
concentrations are mostly concentrated in areas close to the water
treatment plants. Low intact cell concentrations in those areas
could be ascribed to (1) disinfection during treatment and (2)
growth inhibition from sufficient residual chlorine. Also the flow
rate in the outgoing pipes closest to the treatment plants is high,
which likely prevents water stagnation, sedimentation and cell
adhesion on the pipe surface, and, consequently, biofilm formation
and further bacterial growth. A different situation is observed in
the distant areas from the water treatment plants and particularly
in the so-called mixing zones, where the water from three different
water treatment plants potentially mix. The map displays different
color points spread in these zones without any visible order. The
prevalence of the samples with higher cell concentrations there
compared to the areas close to WTPs also corroborates the
Figure 4. Diurnal changes in bacterial parameters of WTP and DN points. Intensive sampling of one WTP (n = 19) and one point in the DN(n = 23) during 21 hours reveals steady cell concentrations at the treatment plant but clear variations in the distribution network. Intracellularadenosine tri-phosphate (ATP) data points were derived from duplicate measurements of extracellular and total ATP concentrations. FCM intact cells(after SYBR Green I and propidium iodide staining) were single measurements, with a relative standard deviation of 9% calculated from all data in thepresent study.doi:10.1371/journal.pone.0096354.g004
Biological Instability of Chlorinated Drinking Water
PLOS ONE | www.plosone.org 6 May 2014 | Volume 9 | Issue 5 | e96354

argument that increasing distance and water residence time could
lead to chlorine decay with concomitant oxidation of dissolved
organic matter; both these events would favor bacterial growth.
Moreover, mixing zones are potential hot-spots for bacterial
growth, as one water might well contain the nutrients that are
growth limiting in the other.
The uneven spatial distribution of the samples with different
intact cell concentrations is noteworthy, highlighted for example
by the three points in upper-left corner of the map. Based on the
long distance from the WTPs, high intact cell concentrations were
expected, but the samples taken from the hydrants located in this
small area rather show variability (respectively 1.826104,
1.876105, 2.516105 intact cells mL21). Such different intact cell
concentrations could be due to several reasons: the time the
samples were taken, which is linked to water consumption and the
potential impact of which is shown in Figure 4, the condition of the
pipes in this specific area (unknown), the way water flows from the
treatment plant, and/or the relative proximity of these sample
points to one of the reservoirs (Figure 5B), etc. Other authors
showed a decrease in AOC [13] and ATP [19] in the some distal
points of the distribution networks. Decrease of AOC concentra-
tion was explained by its consumption by bacteria within the
network. These authors argued that an insufficient amount of
nutrients led to starvation and a decrease in bacterial parameters
at the end of the pipelines. However, it is an unlikely reason in the
present study, because this phenomenon seems more occasional
than systematic.
The combined data demonstrates clearly biological instability
throughout the distribution network. However, despite the relative
simplicity of the concept (Figure 1; Figure 3A), a complex interplay
of chemical, physical and biological parameters and hydraulic
conditions should be taken into account for characterization of
each particular case of instability.
Figure 5. Intact cell concentrations of all samples measured from the distribution network (n = 49). (A) Intact cell concentrationsarranged in ascending order and categorized into four main classes (colored bars) according to increasing concentrations. Data points are averagevalues of duplicate measurements. Blue and purple stripes above and below data bars show the measured values. (B) Actual distribution of theclasses of intact cells (colored circles) throughout the drinking water distribution network. WTP 1, WTP 2, WTP 3 represent location and productivity ofthe main water treatment plans supplying the city: WTP 1 operates using surface water, WTP 2 – artificially recharged ground water, WTP 3 – naturalgroundwater. WTP 4 – 6 indicates on other three pump stations with less significance for the city water supply.doi:10.1371/journal.pone.0096354.g005
Biological Instability of Chlorinated Drinking Water
PLOS ONE | www.plosone.org 7 May 2014 | Volume 9 | Issue 5 | e96354

Comparison of different microbiological parametersFCM and ATP data showed clear correlations, but these data
did not correlate well with conventional HPC data. A total amount
of 49 different samples was measured in duplicate with ATP (total
and extracellular) and FCM (total and intact cell concentration)
analyses, while 38 of those samples were further analyzed with
HPC. The significant linear correlation (R2 = 0.77; n = 49)
between intracellular ATP and FCM intact cell concentration is
shown in Figure 6A. This corroborates previous studies that
showed good results comparing total ATP with total cell
concentration [19,50] and intracellular ATP with intact cell count
as well [20,25]. The strong correlation is encouraging, since FCM
and ATP analysis are independent viability parameters – integrity
of the cell membrane (FCM) and cellular energy (ATP). A
correlation between these parameters during disinfection is not
necessarily a given fact. The membrane integrity based PI staining
method implies that PI positive cells are damaged and thus
considered as inactive, yet extreme examples where living cells
became permeable for propidium iodide have been described [46].
In turn, Nocker and co-workers [51] showed that after UV-C
exposure cells became inactivated, while their membranes
remained essentially intact. Discrepancies between intracellular
ATP and intact cell concentration can also result from cell
morphology, bacterial species and physiological state, that was
discussed in detail previously [25]. The results provided by FCM
provide information on single cell level, whereas during ATP
analyses the values are evaluated per volume. Hence, intracellular
ATP-per-cell was calculated for characterization of biomass
activity. In the present study intracellular ATP-per-cell ranges
from zero (no cell-bound ATP observed) to 5.92610210 nM cell21
( = 3610217 g cell21) with the average value of 1.68610210 nM
cell21 ( = 8.52610218 g cell21) (stdev = 9.58610211 nM cell21,
n = 49). The result is in the same range as ATP-per-cell values
obtained from various water sources, which were analyzed with
the same methods [20,25]. This suggests that bacterial activity
(ATP values) in the intact cells was not affected by any remaining
chlorine residuals, and that membrane damage (SGPI values) was
in this case reflective of viability in the sample. The good
correlation between these two independent parameters is an
optimistic prospect for applying these methods for chlorinated
water analyses in future studies.
The conventional HPC results were compared with the FCM
intact cell concentration values. A weak correlation (R2 = 0.18,
n = 38) was observed between HPC (at 22uC) and intact cell
concentrations (Figure 6B), similar to reports in previous studies
[38,50]. It could be explained by the often described phenomenon,
that less than 1% of drinking water bacteria are cultivable on
conventional agar plates [25,50,52]. In addition, Mezule and co-
workers [53] demonstrated evidence of the presence of so called
viable-but-not-cultivable (VNBC) bacterial state, in both drinking
water and biofilms for the network investigated here, thus
indicating further limitations in the HPC method. Since intracel-
lular ATP showed a good correlation with intact cell concentra-
tion, but intact cell count correlated weakly with HPC, it was
expected that intracellular ATP and HPC would not correlate well
(Figure 6C; R2 = 0.11, n = 38). Various studies were performed to
compare ATP and HPC parameters from water samples, but good
correlations were never observed e.g., R2 = 0.20 [19], R2 = 0.36
[22] and R2 = 0.31 [50]. Our results combined with those from
previous studies cast further doubts on the value of using the HPC
method for general microbiological drinking water quality control.
In our opinion, the clear correlation between two methodologi-
cally independent viability parameters (intracellular ATP and
FCM intact cell counts), and the absence of any correlations with
Figure 6. Comparison of the various microbiological parame-ters. Clear correlations were observed between intact cells andintracellular ATP (n = 49) (A), but no obvious correlations betweenthese two parameters and heterotrophic plate counts at 22uC (n = 38)(B) (C).doi:10.1371/journal.pone.0096354.g006
Biological Instability of Chlorinated Drinking Water
PLOS ONE | www.plosone.org 8 May 2014 | Volume 9 | Issue 5 | e96354

two different HPC methods, renders the former methods more
meaningful for assessing and understanding biological instability,
particularly in chlorinated environments.
Importance of measuring extracellular ATPArguments for and against the concept and importance of
measuring extracellular ATP have been made [4,19,20,25,54,55].
To understand this better, we arranged our data according to
increasing intracellular ATP concentrations, after which the
measured extracellular ATP values were added to each corre-
sponding sample (Figure 7). It is evident that extracellular ATP
constitutes a considerable fraction of the total ATP amount in
some samples – varying from 3% up to 100% – with an average
contribution of 36% (n = 49). Moreover, 33% of the samples
contain more that 50% of extracellular ATP. This data supports
other studies, where analyses showed high extracellular ATP in
drinking water samples from the distribution networks [20,25].
Interestingly, the highest extracellular ATP ratio is mostly
observed in the samples with relatively low intracellular ATP, in
this case samples with close proximity to the treatment plant. In
the case of chlorinated water, this could potentially be explained
by the oxidative effect of chlorine on bacterial cells. Previous
studies have shown extensive damage to bacterial membranes
during chlorination [24,45], after which a release of extracellular
ATP from the damaged bacteria can occur. This membrane
damage was also clearly detected in the present study (e.g.,
Figure 3B). Although, there is lack of detailed data considering the
release of extracellular ATP in water samples affected by
chlorination, strong evidence of ATP release during oxidation
was presented in previous studies [4,20]. Both these works showed
a significant decrease in cell concentrations and intracellular ATP
after ozonation, whereas extracellular ATP comprised 83–100%
of the total ATP. Moreover, Figure 7 shows that samples with
increased intracellular ATP concentrations, which we linked to
bacterial growth during distribution, often had considerably less
extracellular ATP in relation to total ATP. This could be due to
the fact that extracellular ATP can be biodegraded by bacteria or
extracellular enzymes in the network [54,56–58]. However, it
cannot be excluded that a decrease in extracellular ATP during
distribution occurs due to oxidation by residual chlorine present in
the network.
Conclusions
N An investigation of a full-scale chlorinated drinking water
distribution network with various microbiological methods
clearly demonstrated both spatial and temporal biological
instability in the network.
N Fluorescent staining with SGPI in combination with ATP
measurements provided reliable and descriptive information
about bacterial density and viability in chlorinated drinking
water samples.
N A good correlation was observed between intracellular ATP
and intact cell counts (R2 = 0.77), whereas HPC showed poor
correlations with both parameters (R2 = 0.18 with intact cell
concentration and R2 = 0.11 with intracellular ATP).
N Extracellular ATP constituted on average 36% of total ATP in
the present study, which confirms the necessity of extracellular
ATP subtraction from total ATP measurements during
chlorinated drinking water analyses.
N Overall the results raise questions with respect to the offset
between increased biological safety gained from disinfection
opposed to increased risk from instability (uncontrolled
bacterial growth). While an improvement of the chlorination
procedure could be a solution, the data suggests looking
beyond only disinfection for achieving biological stability of
drinking water.
Supporting Information
Figure S1 Additional examples of hydrant flushing.Changes in intact cell concentration and intracellular ATP during
flushing in 6 newly-opened fire hydrants. Intact cell concentration
values are shown as solid lines with blue markers, whereas
intracellular ATP results displayed as single green bullets.
(TIF)
Figure S2 Actual data for Figure 3A. Changes in various
bacterial parameters between one water treatment plant and a
randomly selected point in the distribution network (actual values
for Figure 3A).
(TIF)
Figure 7. Distribution of intracellular and extracellular ATP in the water samples. In general, higher concentrations and relativepercentages of extracellular ATP were measured in samples that exhibited lower intracellular ATP concentrations (n = 49).doi:10.1371/journal.pone.0096354.g007
Biological Instability of Chlorinated Drinking Water
PLOS ONE | www.plosone.org 9 May 2014 | Volume 9 | Issue 5 | e96354
Figure S3 Residual chlorine concentration in the distri-

bution network. 50% of residual chlorine concentration in the
network was between 0.12 (first quartile) and 0.23 (third quartile)
mg mL21, with a mean value of 0.17 mg mL21 (n = 27). The
whiskers indicate on minimum and maximum values, whereas
bullets show outliers of the population.
(TIF)
Table S1 Physical and chemical parameters of watermeasured on-line during low velocity flushing of newly-opened fire hydrant. Some measurements were omitted
during the first 20 minutes of flushing due to the high
fluctuation in measuring tools readings.
(DOC)
Acknowledgments
The authors thank Stefan Kotzsch for critical input, Arturs Briedis, Edgars
Grundbergs and Kaspars Neilands for assistance in the sampling
campaigns, and sampling/information support from Rigas Udens Ltd.
Author Contributions
Conceived and designed the experiments: FH MV JR TJ. Performed the
experiments: FH MV JR. Analyzed the data: FH MV JR TJ AN.
Contributed reagents/materials/analysis tools: FH TJ. Wrote the paper:
FH MV JR TJ AN.
References
1. Bartram J, Cotruvo J, Exner M, Fricker C, Glasmacher A (2003) Heterotrophic
plate count and drinking-water safety: The significance of HPCs for waterquality and human health. World Health Organization. 244 p.
2. Boe-Hansen R, Albrechtsen H-J, Arvin E, Jørgensen C (2002) Bulk water phaseand biofilm growth in drinking water at low nutrient conditions. Water Res 36:
4477–4486. doi:10.1016/S0043-1354(02)00191-4.
3. Hammes F, Berger C, Koster O, Egli T (2010) Assessing biological stability ofdrinking water without disinfectant residuals in a full-scale water supply system.
J Water Supply Res Technol 59: 31. doi:10.2166/aqua.2010.052.
4. Hammes F, Berney M, Wang Y, Vital M, Koster O, et al. (2008) Flow-
cytometric total bacterial cell counts as a descriptive microbiological parameterfor drinking water treatment processes. Water Res 42: 269–277. doi:10.1016/
j.watres.2007.07.009.
5. Juhna T, Birzniece D, Larsson S, Zulenkovs D, Sharipo A, et al. (2007)Detection of Escherichia coli in biofilms from pipe samples and coupons in
drinking water distribution networks. Appl Environ Microbiol 73: 7456–7464.
doi:10.1128/AEM.00845-07.
6. Liu G, Lut MC, Verberk JQJC, Van Dijk JC (2013) A comparison of additionaltreatment processes to limit particle accumulation and microbial growth during
drinking water distribution. Water Res 47: 2719–2728. doi:10.1016/j.wa-tres.2013.02.035.
7. Van der Kooij D (2000) Biological stability: A multidimensional quality aspect oftreated water. In: Belkin S, editor. Environmental Challenges. Springer
Netherlands. pp. 25–34.
8. Vital M, Stucki D, Egli T, Hammes F (2010) Evaluating the growth potential ofpathogenic bacteria in water. Appl Environ Microbiol 76: 6477–6484.
doi:10.1128/AEM.00794-10.
9. Vital M, Fuchslin HP, Hammes F, Egli T (2007) Growth of Vibrio cholerae O1
Ogawa Eltor in freshwater. Microbiology 153: 1993–2001. doi:10.1099/mic.0.2006/005173-0.
10. Vital M, Hammes F, Egli T (2008) Escherichia coli O157 can grow in natural
freshwater at low carbon concentrations. Environ Microbiol 10: 2387–2396.doi:10.1111/j.1462-2920.2008.01664.x.
11. LeChevallier MW, Schulz W, Lee RG (1991) Bacterial nutrients in drinkingwater. Appl Environ Microbiol 57: 857–862.
12. Niquette P, Servais P, Savoir R (2001) Bacterial dynamics in the drinking water
distribution system of Brussels. Water Res 35: 675–682.
13. Liu W, Wu H, Wang Z, Ong SL, Hu JY, et al. (2002) Investigation of assimilableorganic carbon (AOC) and bacterial regrowth in drinking water distribution
system. Water Res 36: 891–898.
14. Eichler S, Christen R, Holtje C, Westphal P, Botel J, et al. (2006) Composition
and dynamics of bacterial communities of a drinking water supply system asassessed by RNA- and DNA-based 16S rRNA gene fingerprinting. Appl Environ
Microbiol 72: 1858–1872. doi:10.1128/AEM.72.3.1858-1872.2006.
15. Hong P-Y, Hwang C, Ling F, Andersen GL, LeChevallier MW, et al. (2010)
Pyrosequencing analysis of bacterial biofilm communities in water meters of adrinking water distribution system. Appl Environ Microbiol 76: 5631–5635.
doi:10.1128/AEM.00281-10.
16. Pinto AJ, Xi C, Raskin L (2012) Bacterial community structure in the drinkingwater microbiome Is governed by filtration processes. Environ Sci Technol 46:
8851–8859. doi:10.1021/es302042t.
17. Lautenschlager K, Hwang C, Liu W-T, Boon N, Koster O, et al. (2013) A
microbiology-based multi-parametric approach towards assessing biologicalstability in drinking water distribution networks. Water Res 47: 3015–3025.
doi:10.1016/j.watres.2013.03.002.
18. Rittmann BE, Snoeyink VL (1984) Achieving biologically stable drinking water.J - Am Water Works Assoc 76: 106–114.
19. Van der Wielen PWJJ, van der Kooij D (2010) Effect of water composition,
distance and season on the adenosine triphosphate concentration in unchlori-
nated drinking water in the Netherlands. Water Res 44: 4860–4867.doi:10.1016/j.watres.2010.07.016.
20. Vital M, Dignum M, Magic-Knezev A, Ross P, Rietveld L, et al. (2012) Flow
cytometry and adenosine tri-phosphate analysis: Alternative possibilities toevaluate major bacteriological changes in drinking water treatment and
distribution systems. Water Res 46: 4665–4676. doi:10.1016/j.wa-
tres.2012.06.010.
21. LeChevallier MW, Au K-K (2004) Water treatment and pathogen control:
Process efficiency in achieving safe drinking-water. IWA Publishing. 136 p.
22. Delahaye E, Welte B, Levi Y, Leblon G, Montiel A (2003) An ATP-basedmethod for monitoring the microbiological drinking water quality in a
distribution network. Water Res 37: 3689–3696. doi:10.1016/S0043-1354(03)00288-4.
23. Francisque A, Rodriguez MJ, Miranda-Moreno LF, Sadiq R, Proulx F (2009)
Modeling of heterotrophic bacteria counts in a water distribution system. Water
Res 43: 1075–1087. doi:10.1016/j.watres.2008.11.030.
24. Ramseier MK, von Gunten U, Freihofer P, Hammes F (2011) Kinetics ofmembrane damage to high (HNA) and low (LNA) nucleic acid bacterial clusters
in drinking water by ozone, chlorine, chlorine dioxide, monochloramine,ferrate(VI), and permanganate. Water Res 45: 1490–1500. doi:10.1016/
j.watres.2010.11.016.
25. Hammes F, Goldschmidt F, Vital M, Wang Y, Egli T (2010) Measurement and
interpretation of microbial adenosine tri-phosphate (ATP) in aquatic environ-ments. Water Res 44: 3915–3923. doi:10.1016/j.watres.2010.04.015.
26. LeChevallier MW, Welch NJ, Smith DB (1996) Full-scale studies of factors
related to coliform regrowth in drinking water. Appl Environ Microbiol 62:
2201–2211.
27. Polanska M, Huysman K, van Keer C (2005) Investigation of assimilable organiccarbon (AOC) in flemish drinking water. Water Res 39: 2259–2266.
doi:10.1016/j.watres.2005.04.015.
28. Ramseier MK, Peter A, Traber J, von Gunten U (2011) Formation of assimilableorganic carbon during oxidation of natural waters with ozone, chlorine dioxide,
chlorine, permanganate, and ferrate. Water Res 45: 2002–2010. doi:10.1016/
j.watres.2010.12.002.
29. Van der Kooij D (1990) Assimilable organic carbon (AOC) in drinking water. In:McFeters GA, editor. Drinking Water Microbiology. New York, NY: Springer
New York. pp. 57–87.
30. Weinrich LA, Jjemba PK, Giraldo E, LeChevallier MW (2010) Implications of
organic carbon in the deterioration of water quality in reclaimed waterdistribution systems. Water Res 44: 5367–5375. doi:10.1016/j.wa-
tres.2010.06.035.
31. Jjemba P (2010) Guidance document on the microbiological quality andBiostability of reclaimed water following storage and distribution. WateReuse
Research Foundation.
32. Lehtola MJ, Laxander M, Miettinen IT, Hirvonen A, Vartiainen T, et al. (2006)
The effects of changing water flow velocity on the formation of biofilms andwater quality in pilot distribution system consisting of copper or polyethylene
pipes. Water Res 40: 2151–2160. doi:10.1016/j.watres.2006.04.010.
33. Manuel CM, Nunes OC, Melo LF (2007) Dynamics of drinking water biofilm inflow/non-flow conditions. Water Res 41: 551–562. doi:10.1016/j.wa-
tres.2006.11.007.
34. Bucheli-Witschel M, Kotzsch S, Darr S, Widler R, Egli T (2012) A new method
to assess the influence of migration from polymeric materials on the biostabilityof drinking water. Water Res 46: 4246–4260. doi:10.1016/j.watres.2012.05.008.
35. Douterelo I, Husband S, Boxall JB (2014) The bacteriological composition of
biomass recovered by flushing an operational drinking water distribution system.
Water Res 54: 100–114. doi:10.1016/j.watres.2014.01.049.
36. Rossman LA (2000) EPANET 2 Users manual. National Risk ManagementResearch Laboratory. U.S. Environmental Protection Agency, Cincinatti, Ohio.
37. Rubulis J, Dejus S, Meksa R (2011) Online measurement usage for predicting
water age from tracer tests to validate a hydraulic model American Society ofCivil Engineers. pp. 1488–1497. doi:10.1061/41203(425)133.
38. Berney M, Vital M, Hulshoff I, Weilenmann H-U, Egli T, et al. (2008) Rapid,
cultivation-independent assessment of microbial viability in drinking water.
Water Res 42: 4010–4018. doi:10.1016/j.watres.2008.07.017.
39. Lautenschlager K, Boon N, Wang Y, Egli T, Hammes F (2010) Overnightstagnation of drinking water in household taps induces microbial growth and
changes in community composition. Water Res 44: 4868–4877. doi:10.1016/j.watres.2010.07.032.
Biological Instability of Chlorinated Drinking Water
PLOS ONE | www.plosone.org 10 May 2014 | Volume 9 | Issue 5 | e96354

40. Antoun EN, Dyksen JE, Hiltebrand DJ (1999) Unidirectional flushing: A
powerful tool. J - Am Water Works Assoc 91: 62–71.41. Friedman M, Kirmeyer GJ, Antoun E (2002) Developing and implementing a
distribution system flushing program. J - Am Water Works Assoc 94: 48–56.
42. Prevost M, Rompre A, Coallier J, Servais P, Laurent P, et al. (1998) Suspendedbacterial biomass and activity in full-scale drinking water distribution systems:
Impact of water treatment. Water Res 32: 1393–1406. doi:10.1016/S0043-1354(97)00388-6.
43. Berney M, Hammes F, Bosshard F, Weilenmann H-U, Egli T (2007) Assessment
and interpretation of bacterial viability by using the LIVE/DEAD BacLight Kitin combination with flow cytometry. Appl Environ Microbiol 73: 3283–3290.
doi:10.1128/AEM.02750-06.44. Gregori G, Citterio S, Ghiani A, Labra M, Sgorbati S, et al. (2001) Resolution of
viable and membrane-compromised bacteria in freshwater and marine watersbased on analytical flow cytometry and nucleic acid double staining. Appl
Environ Microbiol 67: 4662–4670. doi:10.1128/AEM.67.10.4662-4670.2001.
45. Lisle JT, Pyle BH, McFeters GA (1999) The use of multiple indices ofphysiological activity to access viability in chlorine disinfected Escherichia coli
O157:H7. Lett Appl Microbiol 29: 42–47. doi:10.1046/j.1365-2672.1999.00572.x.
46. Shi L, Gunther S, Hubschmann T, Wick LY, Harms H, et al. (2007) Limits of
propidium iodide as a cell viability indicator for environmental bacteria.Cytometry A 71A: 592–598. doi:10.1002/cyto.a.20402.
47. Tsai Y-P (2005) Impact of flow velocity on the dynamic behaviour of biofilmbacteria. Biofouling 21: 267–277. doi:10.1080/08927010500398633.
48. Srinivasan S, Harrington GW, Xagoraraki I, Goel R (2008) Factors affectingbulk to total bacteria ratio in drinking water distribution systems. Water Res 42:
3393–3404. doi:10.1016/j.watres.2008.04.025.
49. Van der Kooij D (1992) Assimilable organic carbon as an indicator of bacterial
regrowth. J - Am Water Works Assoc 84: 57–65.50. Siebel E, Wang Y, Egli T, Hammes F (2008) Correlations between total cell
concentration, total adenosine tri-phosphate concentration and heterotrophic
plate counts during microbial monitoring of drinking water. Drink Water EngSci Discuss 1: 71–86. doi:10.5194/dwesd-1-71-2008.
51. Nocker A, Sossa KE, Camper AK (2007) Molecular monitoring of disinfectionefficacy using propidium monoazide in combination with quantitative PCR.
J Microbiol Methods 70: 252–260. doi:10.1016/j.mimet.2007.04.014.
52. Van der Kooij D, Vrouwenvelder JS, Veenendaal HR (2003) Elucidation andcontrol of biofilm formation processes in water treatment and distribution using
the Unified Biofilm Approach. Water Sci Technol J Int Assoc Water Pollut Res47: 83–90.
53. Mezule L, Larsson S, Juhna T (2013) Application of DVC-FISH method intracking Escherichia coli in drinking water distribution networks. Drink Water Eng
Sci 6: 25–31. doi:10.5194/dwes-6-25-2013.
54. Cowan DA, Casanueva A (2007) Stability of ATP in Antarctic mineral soils.Polar Biol 30: 1599–1603. doi:10.1007/s00300-007-0324-9.
55. Venkateswaran K, Hattori N, La Duc MT, Kern R (2003) ATP as a biomarkerof viable microorganisms in clean-room facilities. J Microbiol Methods 52: 367–
377. doi:10.1016/S0167-7012(02)00192-6.
56. Azam F, Hodson RE (1977) Dissolved ATP in the sea and its utilisation bymarine bacteria. Nature 267: 696–698. doi:10.1038/267696a0.
57. Mempin R, Tran H, Chen C, Gong H, Ho KK, et al. (2013) Release ofextracellular ATP by bacteria during growth. BMC Microbiol 13: 301.
doi:10.1186/1471-2180-13-301.58. Riemann B (1979) The occurrence and ecological importance of dissolved ATP in
fresh water. Freshw Biol 9: 481–490. doi:10.1111/j.1365-2427.1979.tb01532.x.
Biological Instability of Chlorinated Drinking Water
PLOS ONE | www.plosone.org 11 May 2014 | Volume 9 | Issue 5 | e96354