Embed Size (px)
Citation preview
by
W. W. Walker & R. H. [email protected] [email protected]
Support from U.S. Dept. of the Interior & U.S. Army COEData from South Florida Water Management District
GEER ConferenceJuly 31, 2008
Modeling Phosphorus Dynamics in Everglades Wetlands & Stormwater Treatment Areas
Topics
• Model Concepts & Evolution• STA Modeling• Marsh Modeling• Limitations & Directions• Data & Research Needs
Phosphorus Mass Balance Models• Aggregated Variables & Processes• Limited User Input Data • Calibrated & Tested vs. Regional Datasets• Testing Strategies
– Independent Datasets or Time Periods– Residuals Analysis
• Applicability Limited by Data Boundaries• Uncertainty Evaluated• Excel / Visual Basic Platforms• Details: wwwalker.net/dmsta & …/epgm
Model Applications• Engineering Design
– Design & Optimization of Stormwater Treatment Areas– Evaluation of Regional Water Mgt & P Control Plans– Consideration of BMP’s, STA’s & Reservoirs
• Adaptive Management– Forecasting Marsh Enrichment/Recovery– Benchmark for Interpreting Monitoring Data
• STA Performance• Downstream Marsh Transects
– Optimizing STA Operation (Flows, Depths, Veg.)– Integrating Research & Monitoring Data– Identifying Research Questions & Data Gaps
Al d bi d di
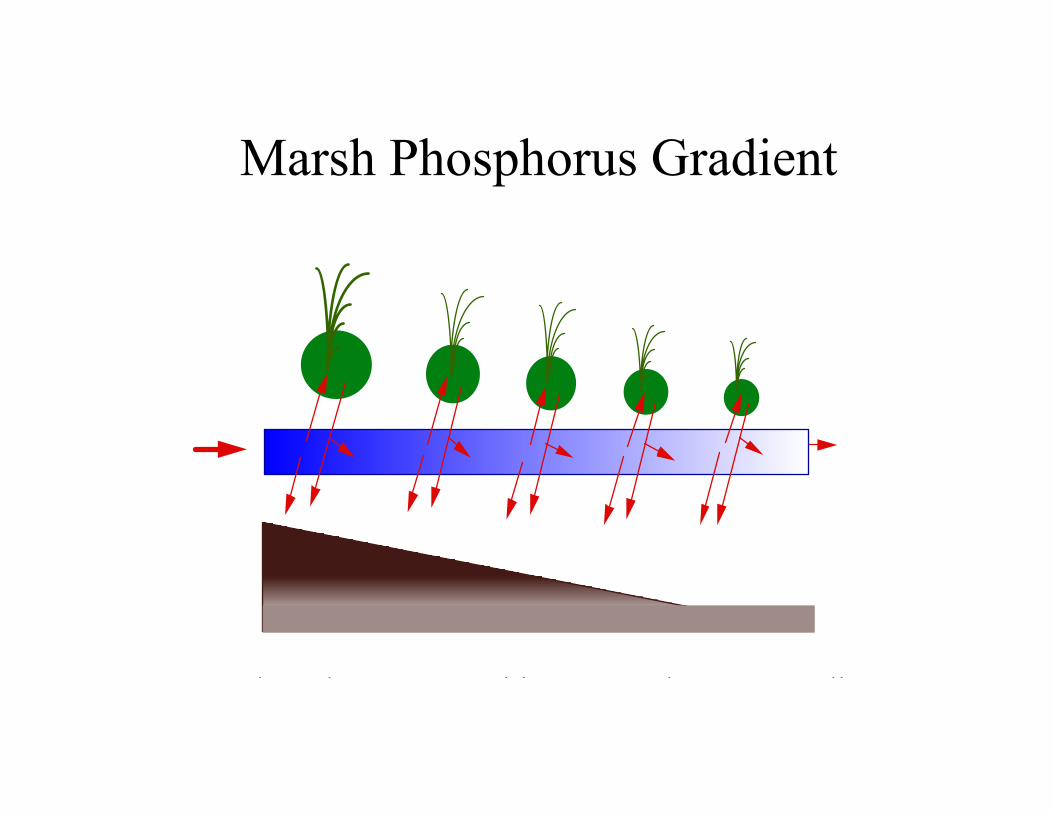
Marsh Phosphorus Gradient
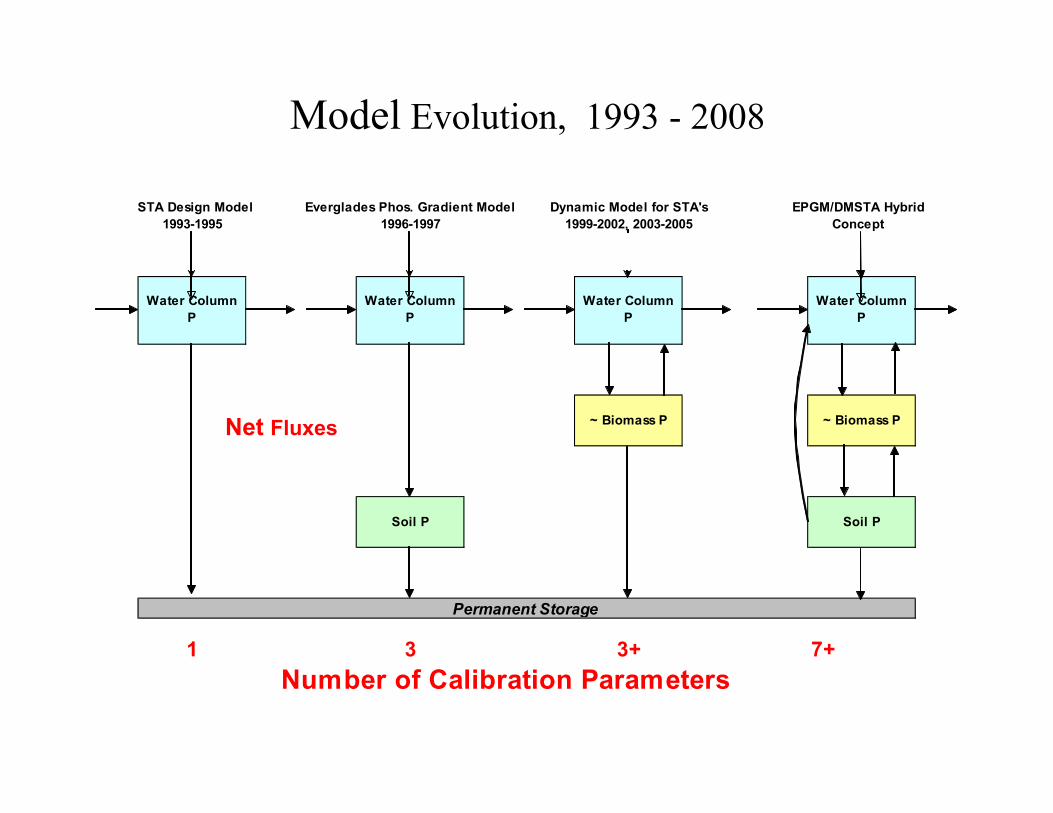
7+
Permanent Storage
~ Biomass P
Soil P
Water ColumnP
Soil P
Water ColumnP
~ Biomass P
Water ColumnP
Water ColumnP
1 3+3Number of Calibration Parameters
Net Fluxes
Model Evolution, 1993 - 2008
Everglades Phos. Gradient Model1993-1995 1996-1997 1999-2002, 2003-2005 Concept
EPGM/DMSTA HybridDynamic Model for STA'sSTA Design Model
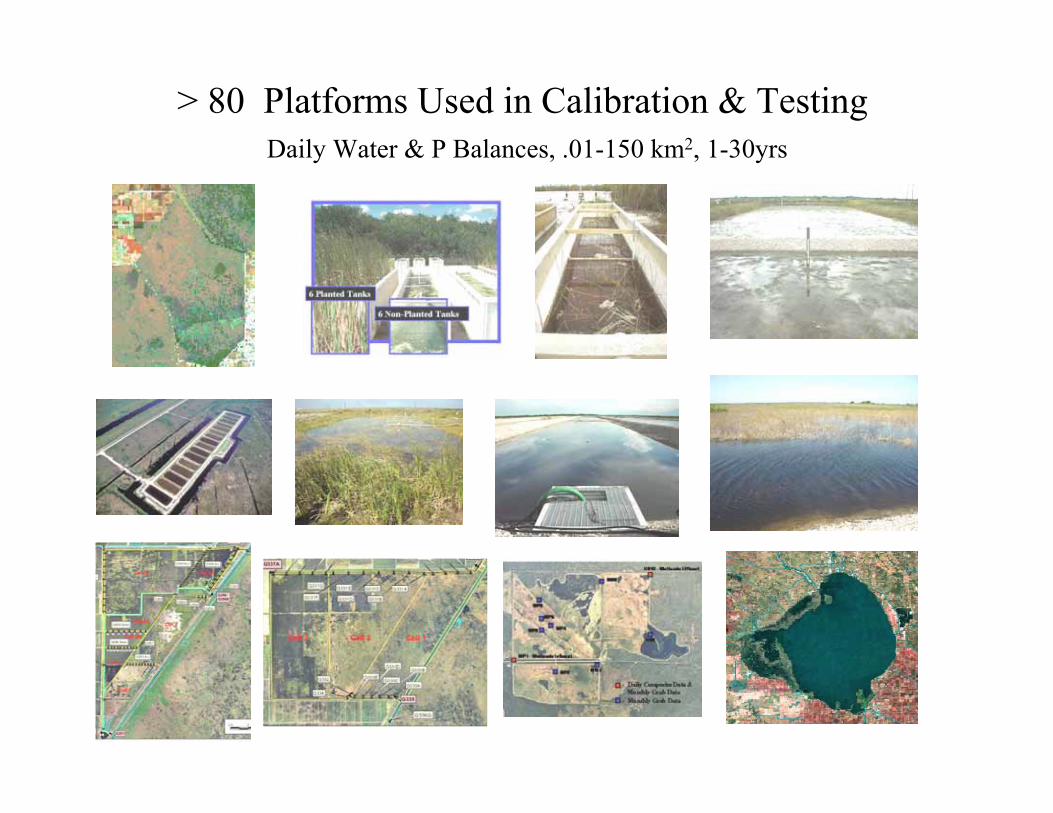
> 80 Platforms Used in Calibration & TestingDaily Water & P Balances, .01-150 km2, 1-30yrs
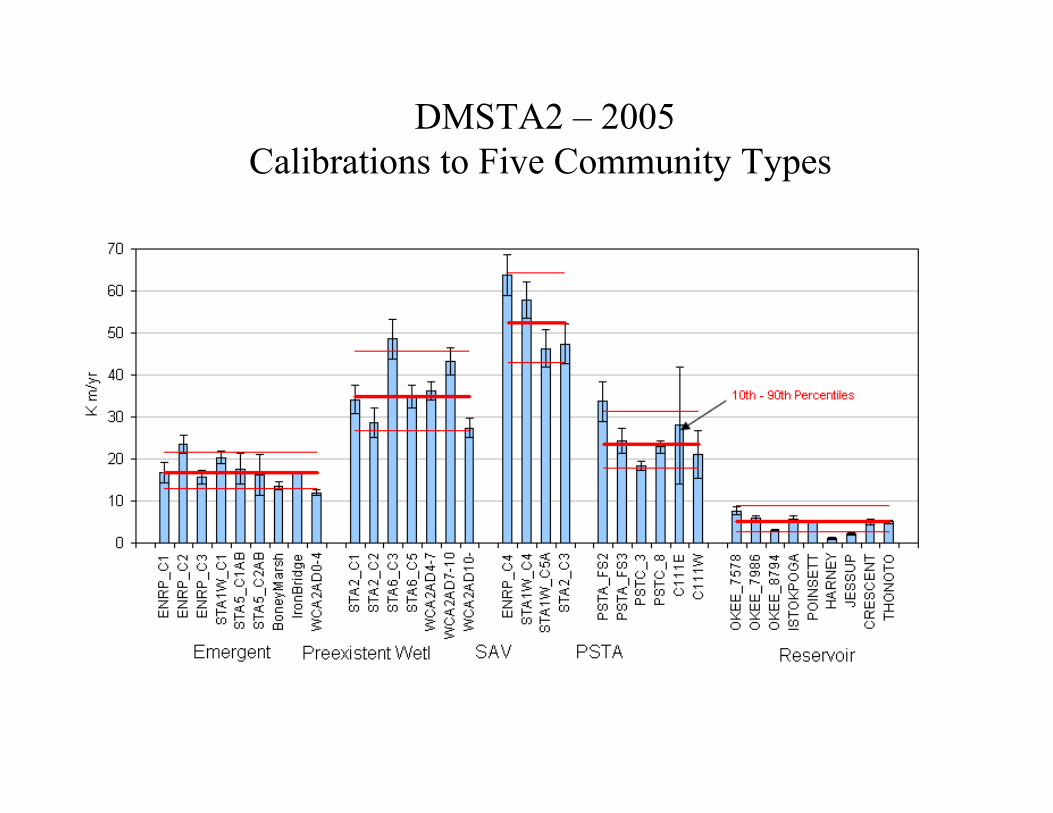
DMSTA2 – 2005Calibrations to Five Community Types
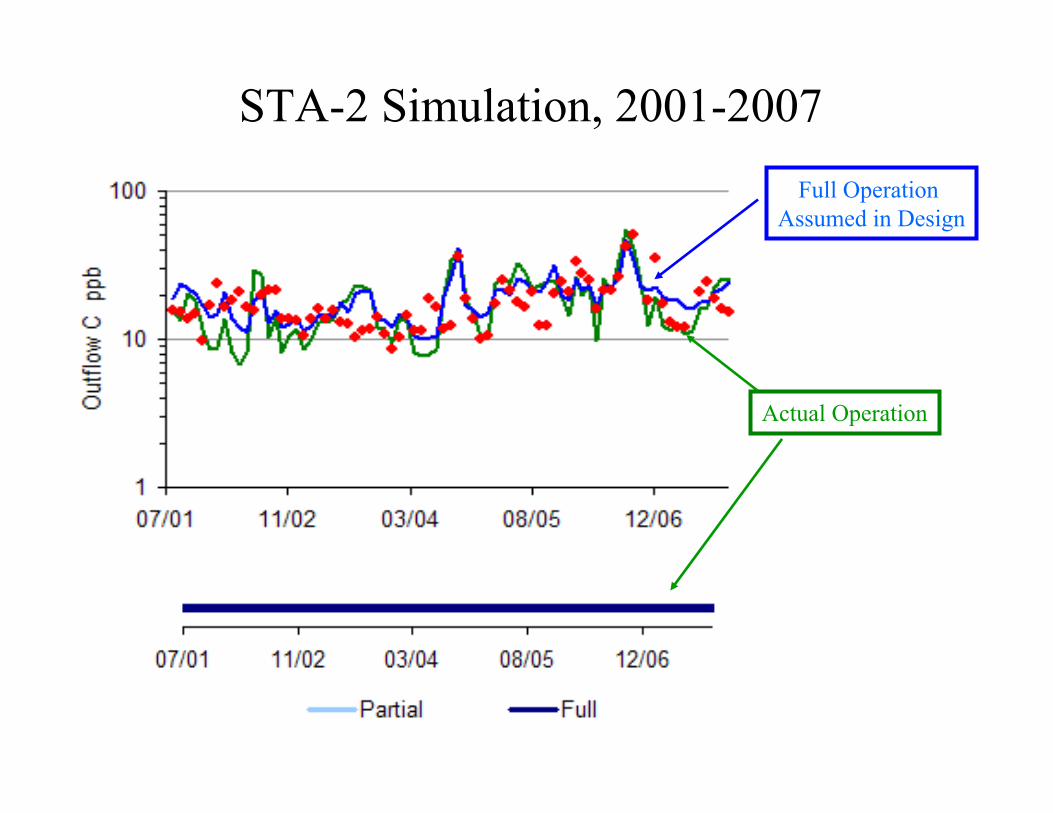
Actual Operation
Full Operation Assumed in Design
STA-2 Simulation, 2001-2007
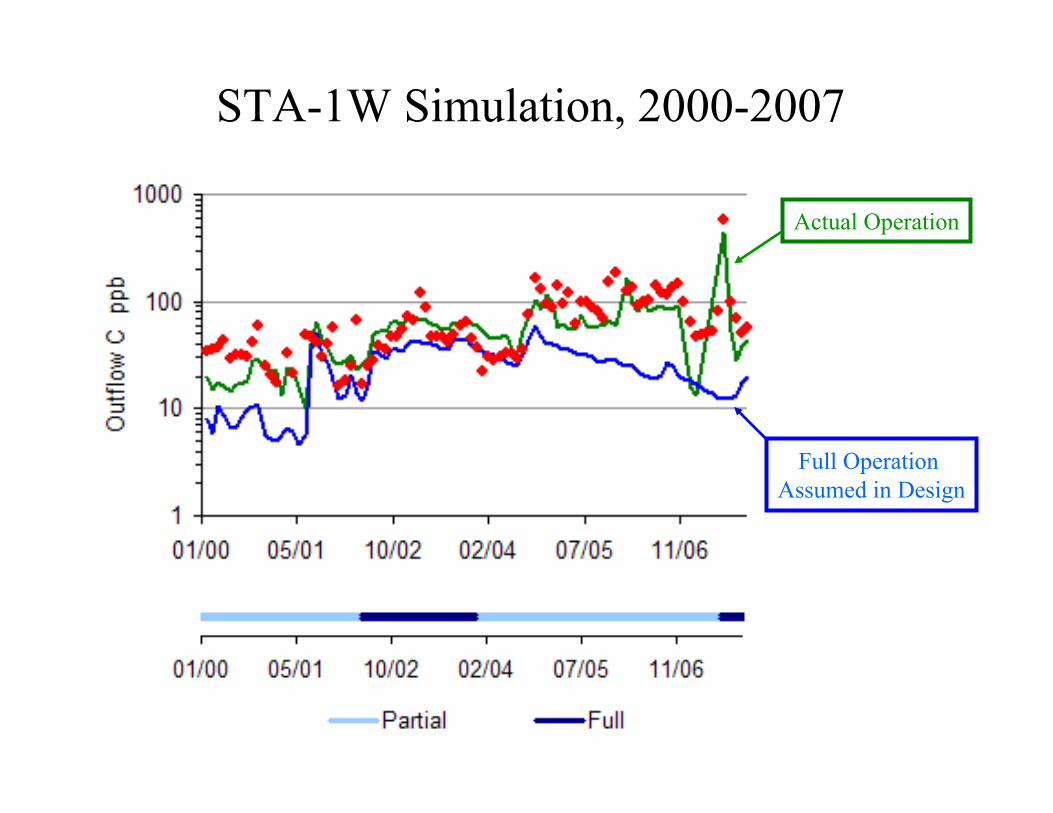
STA-1W Simulation, 2000-2007
Actual Operation
Full Operation Assumed in Design

Al d bi d di
Marsh Phosphorus Gradient
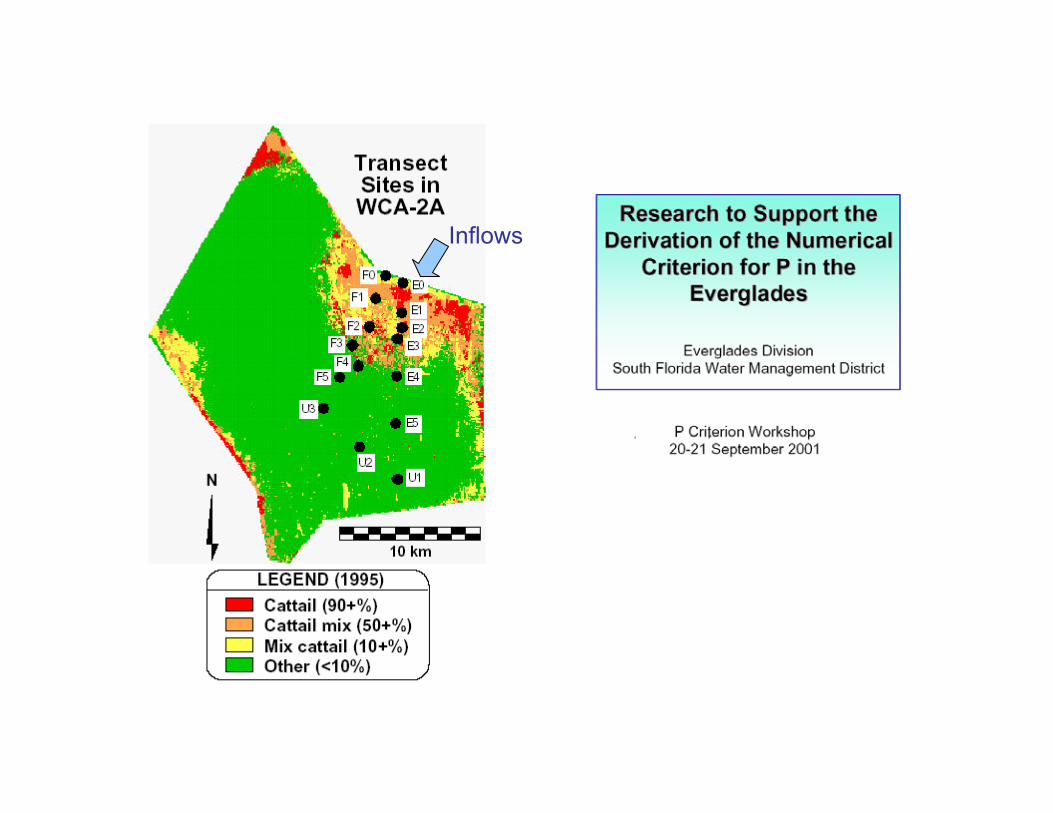
Inflows
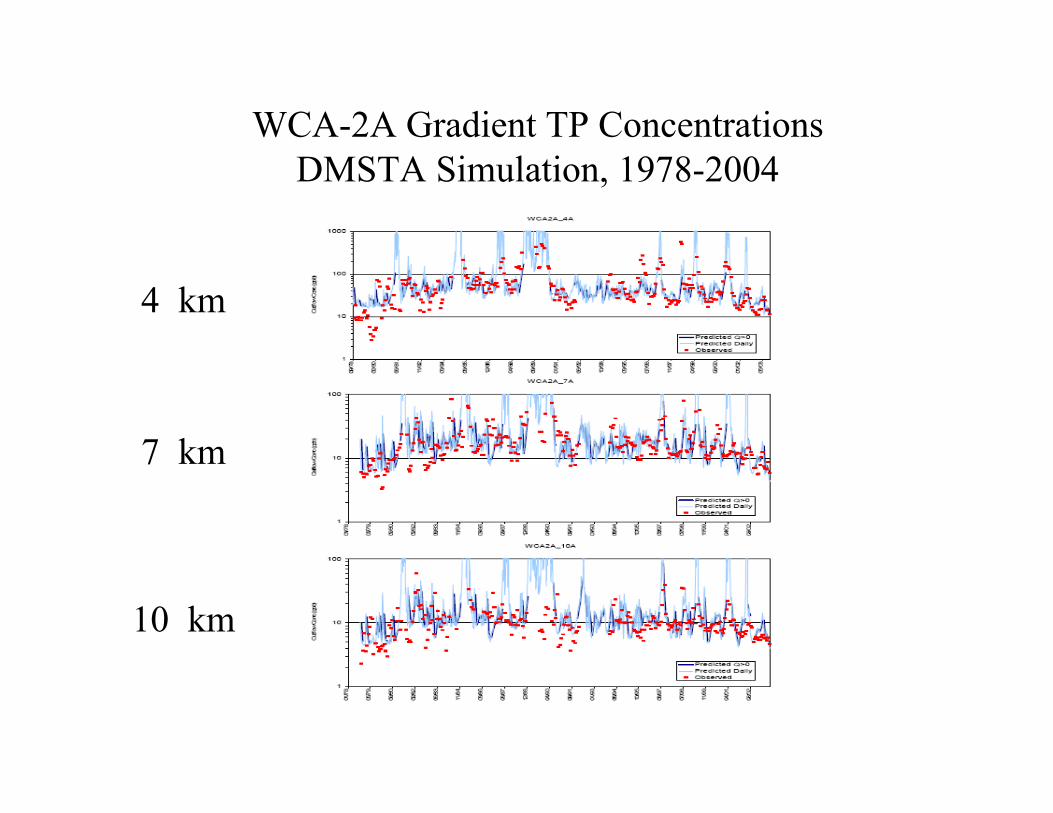
WCA-2A Gradient TP ConcentrationsDMSTA Simulation, 1978-2004
4 km
7 km
10 km
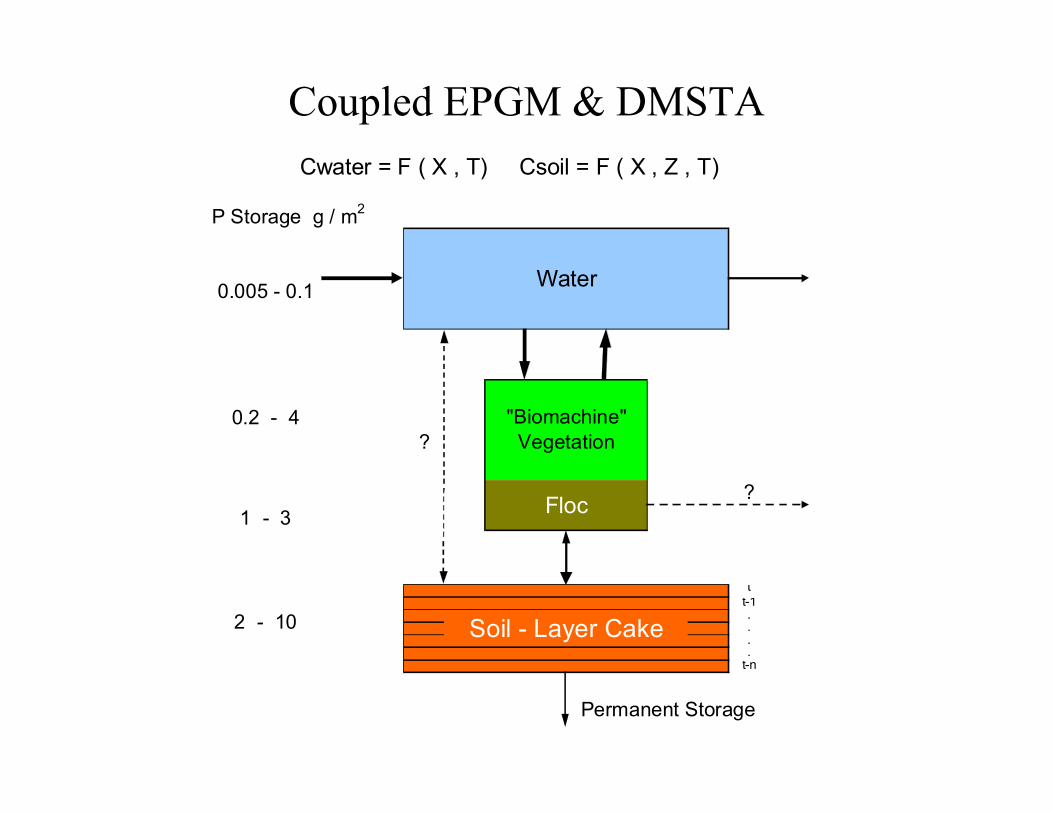
Coupled EPGM & DMSTA
P Storage g / m2
0.005 - 0.1
0.2 - 4?
?1 - 3
tt-1....
t-n
Permanent Storage
Vegetation
Floc
2 - 10 Soil - Layer Cake
Cwater = F ( X , T) Csoil = F ( X , Z , T)
Water
"Biomachine"
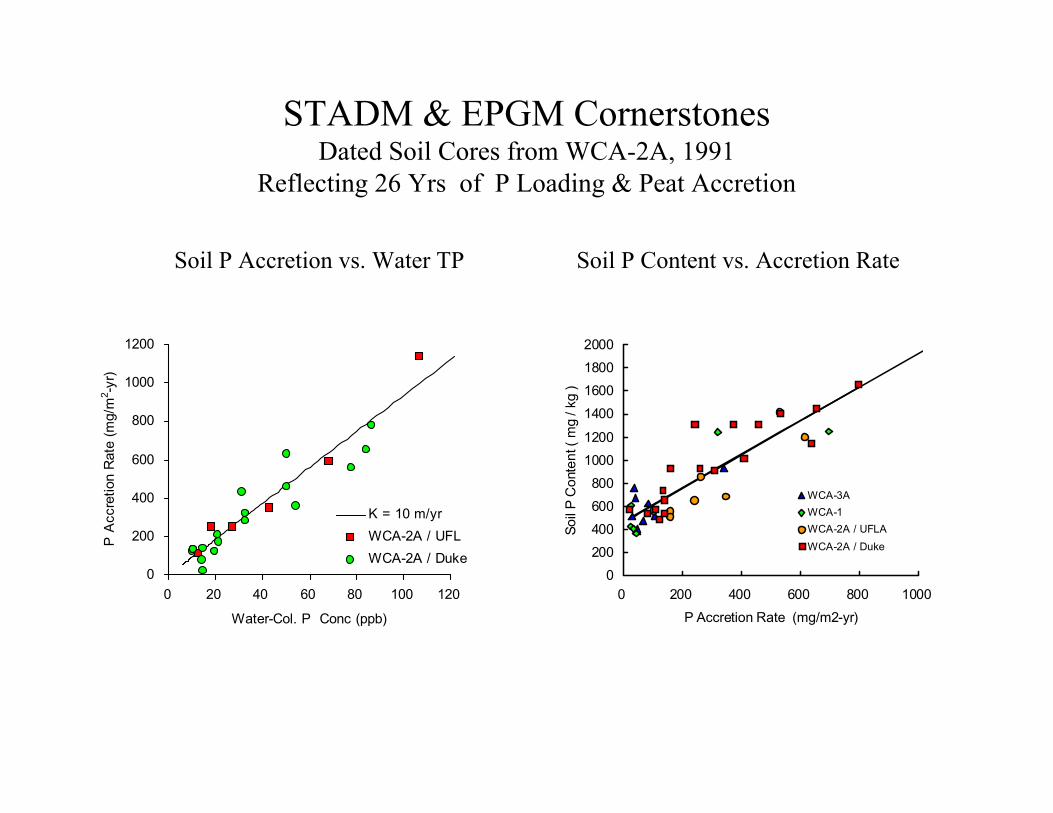
Soil P Accretion vs. Water TP
0
200
400
600
800
1000
1200
0 20 40 60 80 100 120
Water-Col. P Conc (ppb)
P A
ccre
tion
Rat
e (m
g/m
2 -yr)
K = 10 m/yrWCA-2A / UFLWCA-2A / Duke
STADM & EPGM CornerstonesDated Soil Cores from WCA-2A, 1991
Reflecting 26 Yrs of P Loading & Peat Accretion
0
200
400
600
800
1000
1200
1400
1600
1800
2000
0 200 400 600 800 1000
P Accretion Rate (mg/m2-yr)
Soil
P C
onte
nt (
mg
/ kg
)
WCA-3AWCA-1WCA-2A / UFLAWCA-2A / Duke
Soil P Content vs. Accretion Rate
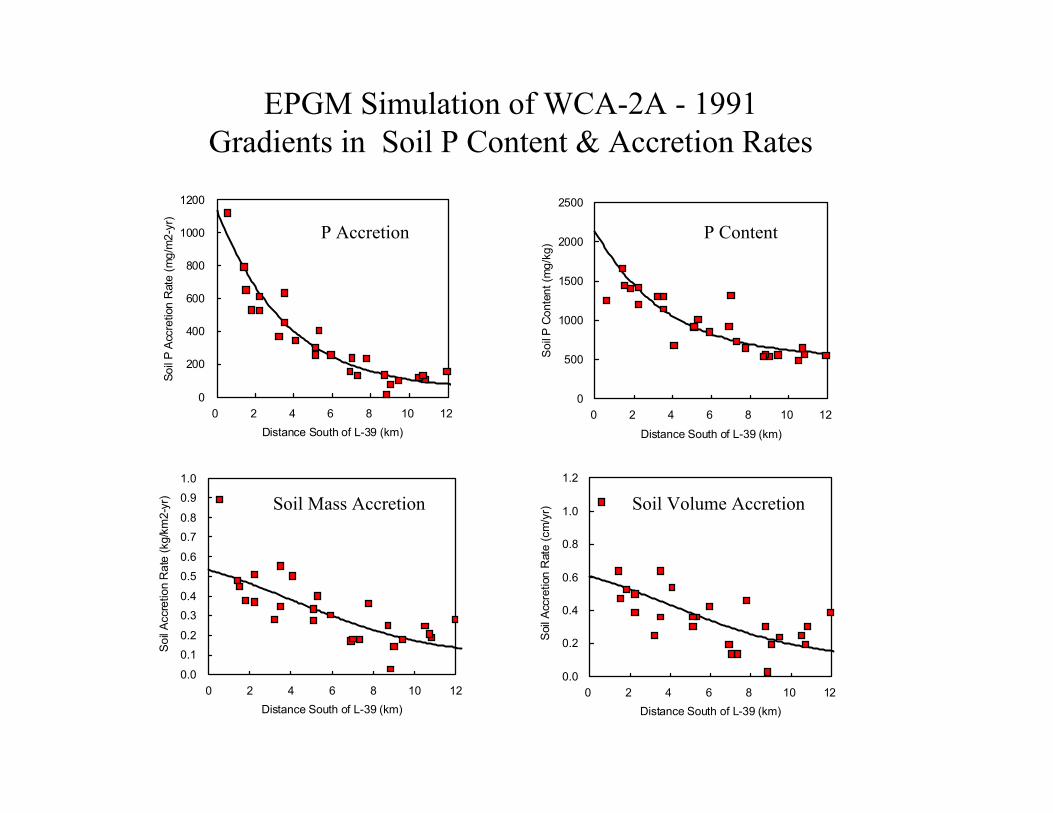
EPGM Simulation of WCA-2A - 1991Gradients in Soil P Content & Accretion Rates
0
500
1000
1500
2000
2500
0 2 4 6 8 10 12
Distance South of L-39 (km)
Soi
l P C
onte
nt (m
g/kg
)
0.0
0.2
0.4
0.6
0.8
1.0
1.2
0 2 4 6 8 10 12Distance South of L-39 (km)
Soil
Accr
etio
n R
ate
(cm
/yr)
0.0
0.1
0.2
0.30.4
0.5
0.6
0.70.8
0.9
1.0
0 2 4 6 8 10 12Distance South of L-39 (km)
Soil
Accr
etio
n R
ate
(kg/
km2-
yr)
0
200
400
600
800
1000
1200
0 2 4 6 8 10 12Distance South of L-39 (km)
Soil
P A
ccre
tion
Rat
e (m
g/m
2-yr
)
P Accretion P Content
Soil Volume AccretionSoil Mass Accretion
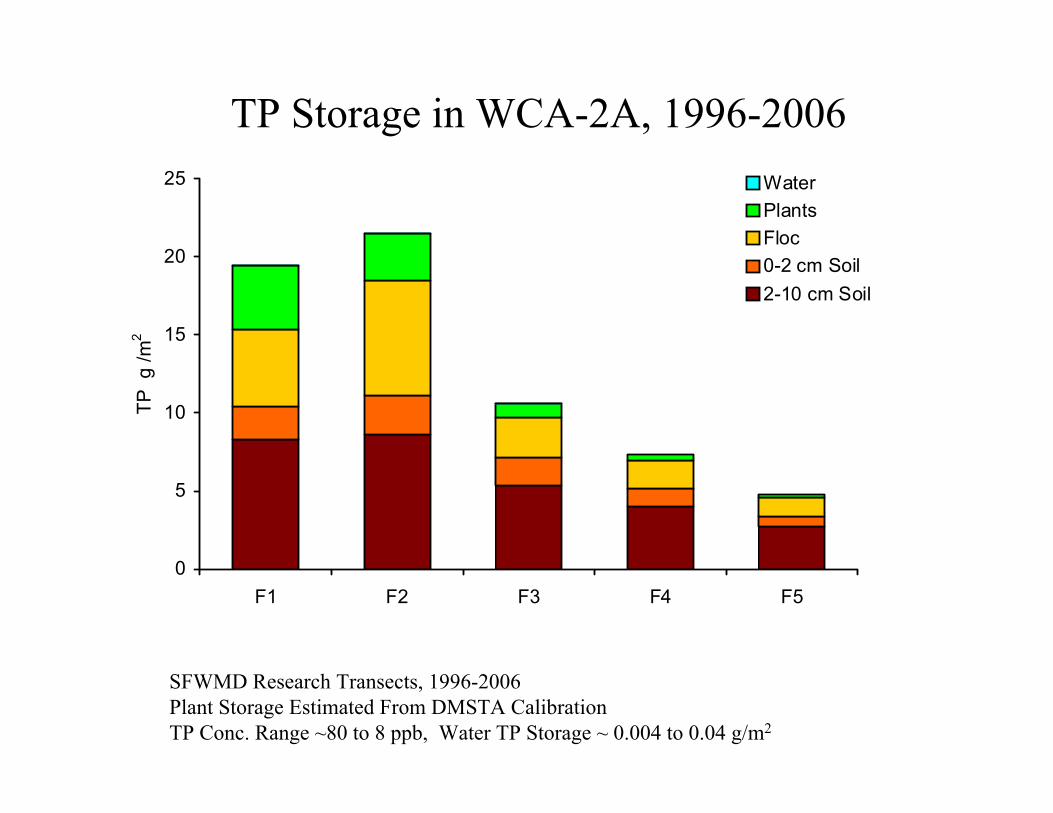
SFWMD Research Transects, 1996-2006Plant Storage Estimated From DMSTA CalibrationTP Conc. Range ~80 to 8 ppb, Water TP Storage ~ 0.004 to 0.04 g/m2
0
5
10
15
20
25
F1 F2 F3 F4 F5
TP g
/m2
WaterPlantsFloc0-2 cm Soil2-10 cm Soil
TP Storage in WCA-2A, 1996-2006
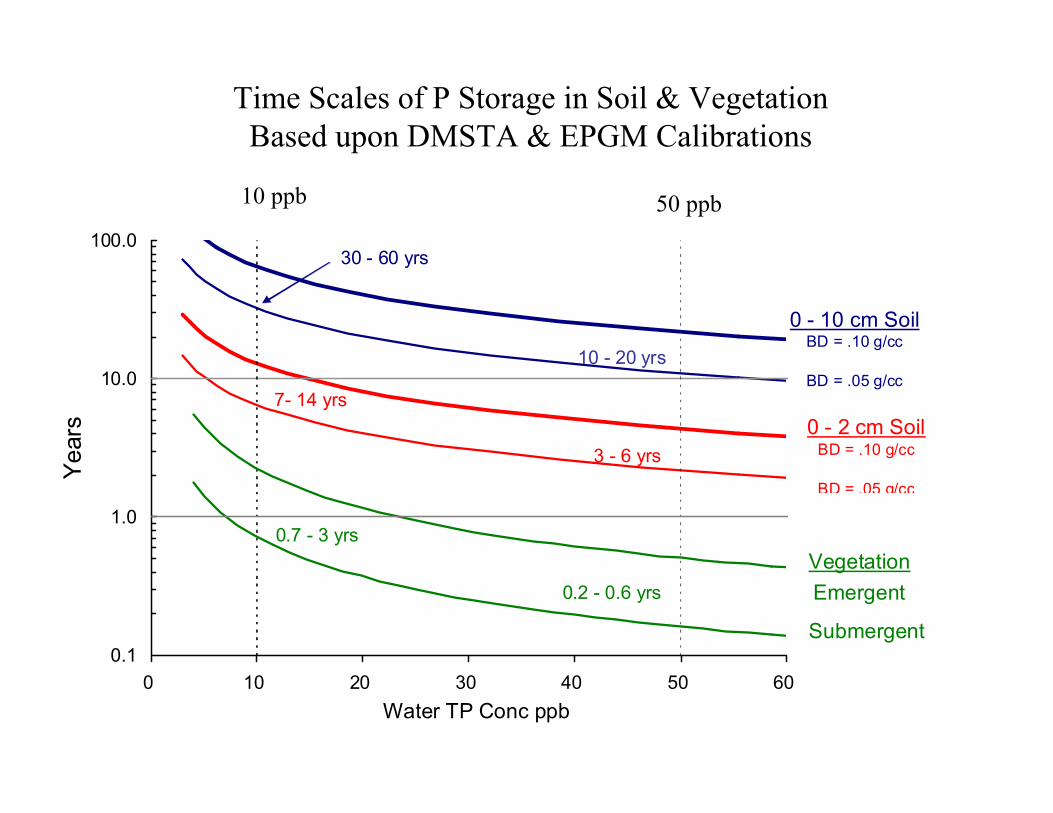
Time Scales of P Storage in Soil & VegetationBased upon DMSTA & EPGM Calibrations
10 ppb 50 ppb
0.1
1.0
10.0
100.0
0 10 20 30 40 50 60Water TP Conc ppb
Year
s
0 - 10 cm SoilBD = .10 g/cc
BD = .05 g/cc
30 - 60 yrs
7- 14 yrs
0.7 - 3 yrs
0 - 2 cm SoilBD = .10 g/cc
BD = .05 g/cc
0.2 - 0.6 yrs
3 - 6 yrs
10 - 20 yrs
Submergent
EmergentVegetation
0
500
1000
1500
2000
2500
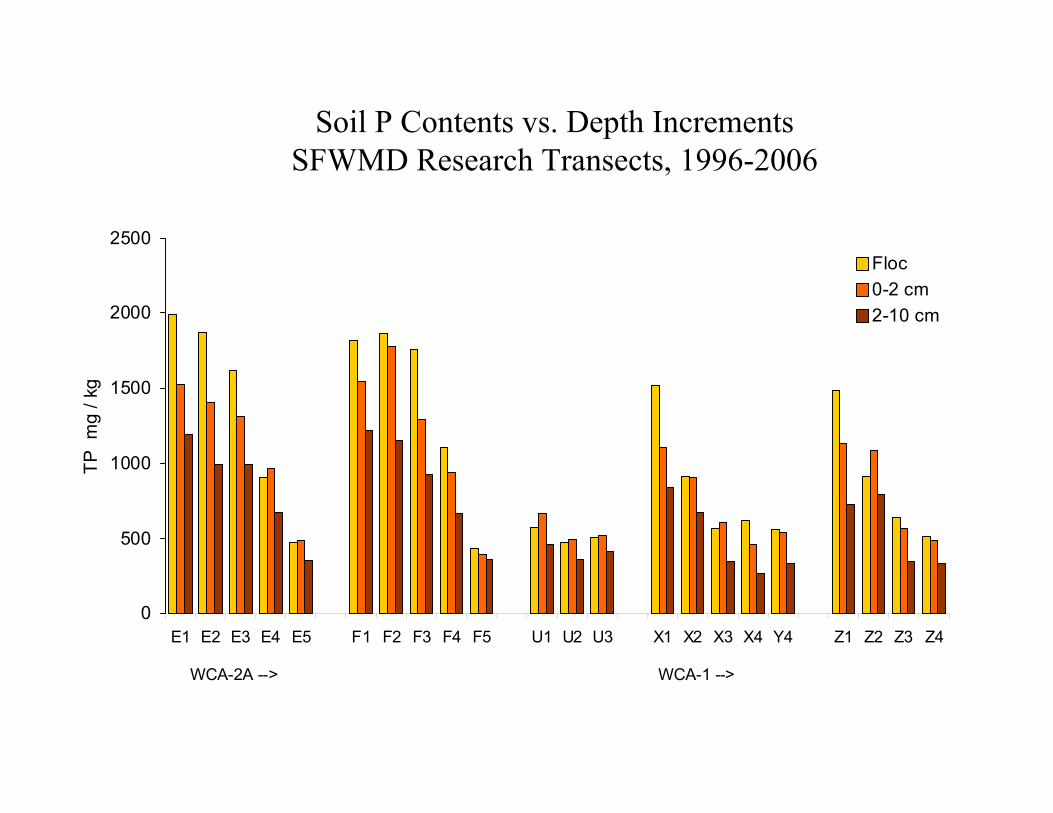
E1 E2 E3 E4 E5 F1 F2 F3 F4 F5 U1 U2 U3 X1 X2 X3 X4 Y4 Z1 Z2 Z3 Z4
TP m
g / k
g
Floc0-2 cm2-10 cm
WCA-2A --> WCA-1 -->
Soil P Contents vs. Depth IncrementsSFWMD Research Transects, 1996-2006
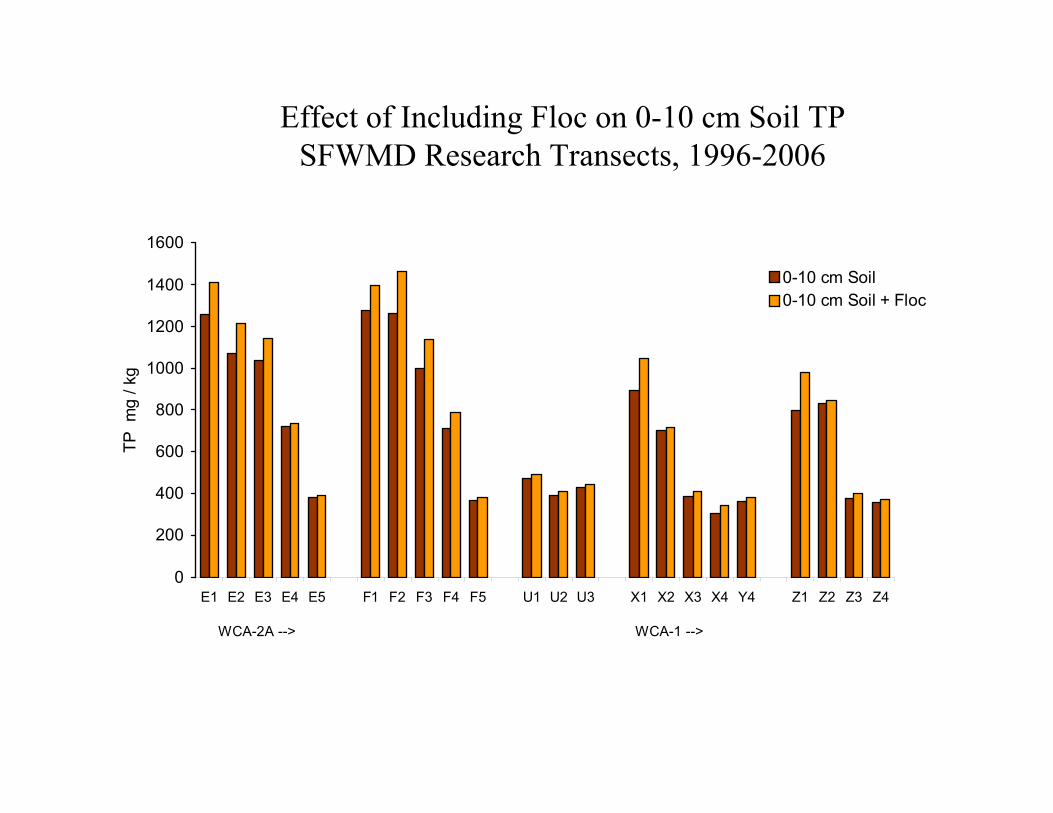
Effect of Including Floc on 0-10 cm Soil TP SFWMD Research Transects, 1996-2006
0
200
400
600
800
1000
1200
1400
1600
E1 E2 E3 E4 E5 F1 F2 F3 F4 F5 U1 U2 U3 X1 X2 X3 X4 Y4 Z1 Z2 Z3 Z4
TP m
g / k
g
0-10 cm Soil0-10 cm Soil + Floc
WCA-2A --> WCA-1 -->
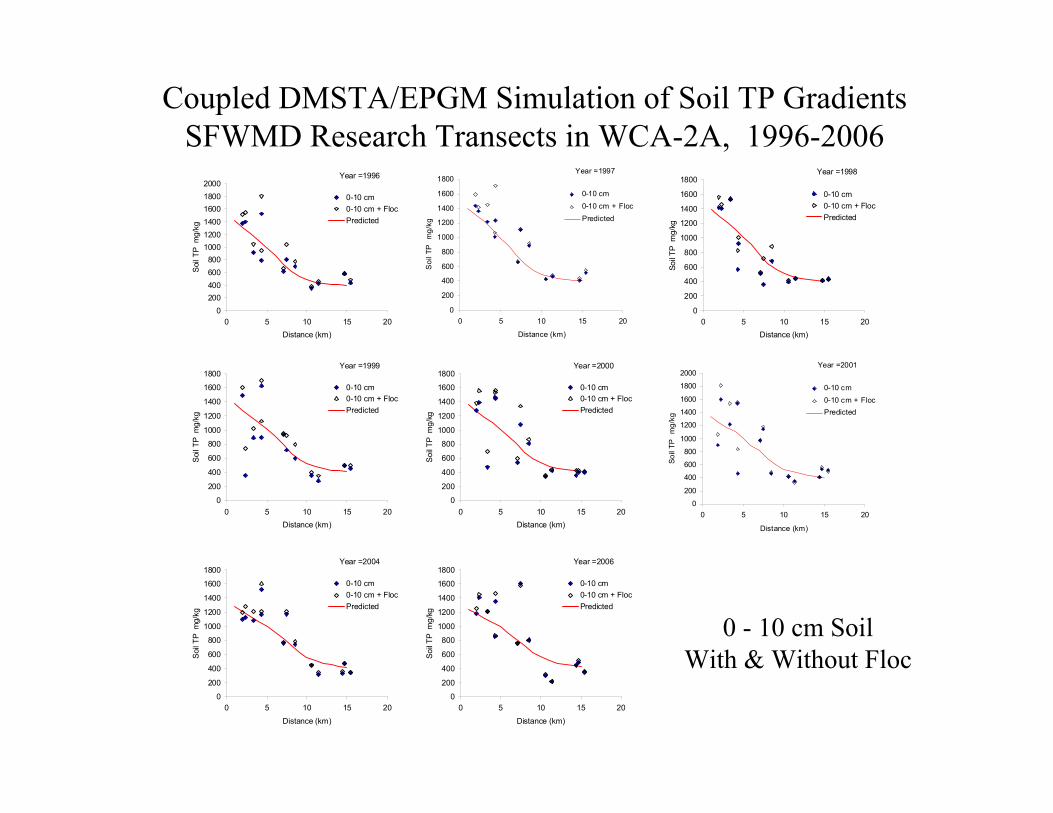
Coupled DMSTA/EPGM Simulation of Soil TP GradientsSFWMD Research Transects in WCA-2A, 1996-2006
Year =1996
0200400600800
100012001400160018002000
0 5 10 15 20Distance (km)
Soi
l TP
mg/
kg0-10 cm0-10 cm + FlocPredicted
Year =1997
0
200
400
600
800
1000
1200
1400
1600
1800
0 5 10 15 20
Distance (km)
Soi
l TP
mg/
kg
0-10 cm0-10 cm + FlocPredicted
Year =1998
0
200
400
600
800
1000
1200
1400
1600
1800
0 5 10 15 20Distance (km)
Soil T
P m
g/kg
0-10 cm0-10 cm + FlocPredicted
Year =1999
0
200
400
600
800
1000
1200
1400
1600
1800
0 5 10 15 20Distance (km)
Soi
l TP
mg/
kg
0-10 cm0-10 cm + FlocPredicted
Year =2000
0
200
400
600
800
1000
1200
1400
1600
1800
0 5 10 15 20Distance (km)
Soi
l TP
mg/
kg
0-10 cm0-10 cm + FlocPredicted
Year =2001
0
200
400
600
800
1000
1200
1400
1600
1800
2000
0 5 10 15 20
Distance (km)
Soil
TP m
g/kg
0-10 cm0-10 cm + FlocPredicted
Year =2004
0
200
400
600
800
1000
1200
1400
1600
1800
0 5 10 15 20
Distance (km)
Soil
TP m
g/kg
0-10 cm0-10 cm + FlocPredicted
Year =2006
0
200
400
600
800
1000
1200
1400
1600
1800
0 5 10 15 20
Distance (km)
Soil
TP m
g/kg
0-10 cm0-10 cm + FlocPredicted
0 - 10 cm SoilWith & Without Floc
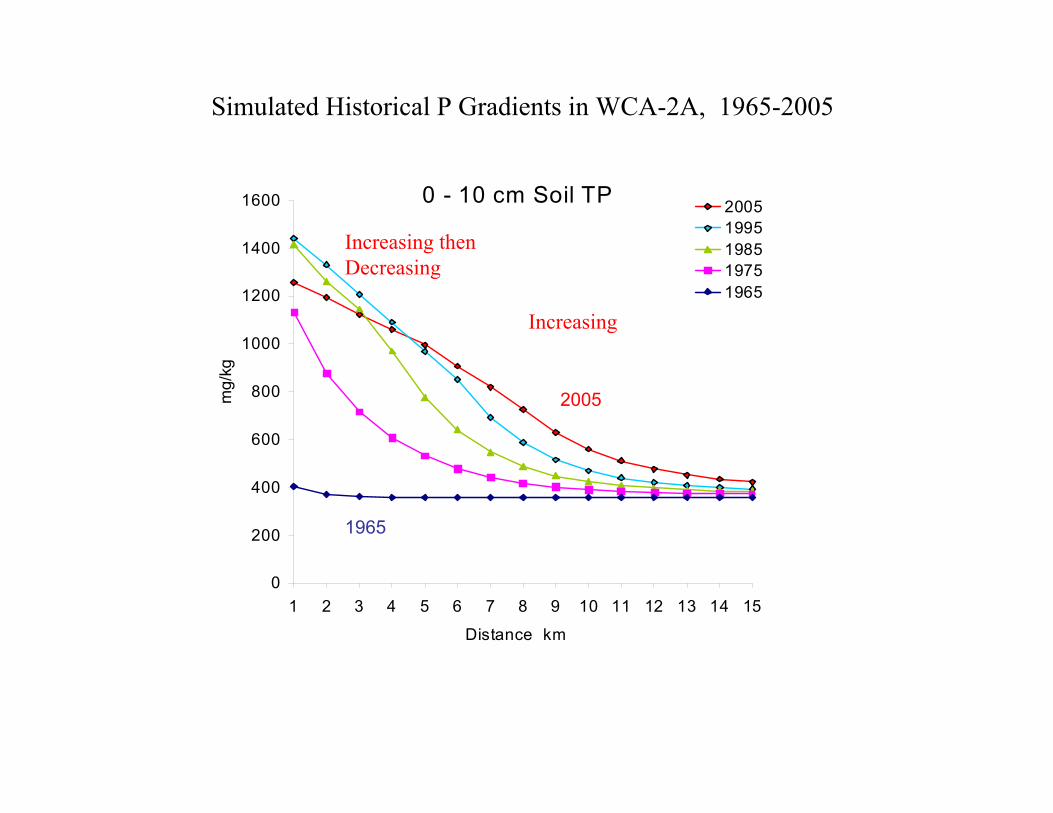
Simulated Historical P Gradients in WCA-2A, 1965-2005
0 - 10 cm Soil TP
0
200
400
600
800
1000
1200
1400
1600
1 2 3 4 5 6 7 8 9 10 11 12 13 14 15
Distance km
mg/
kg20051995198519751965
2005
1965
Increasing then Decreasing
Increasing
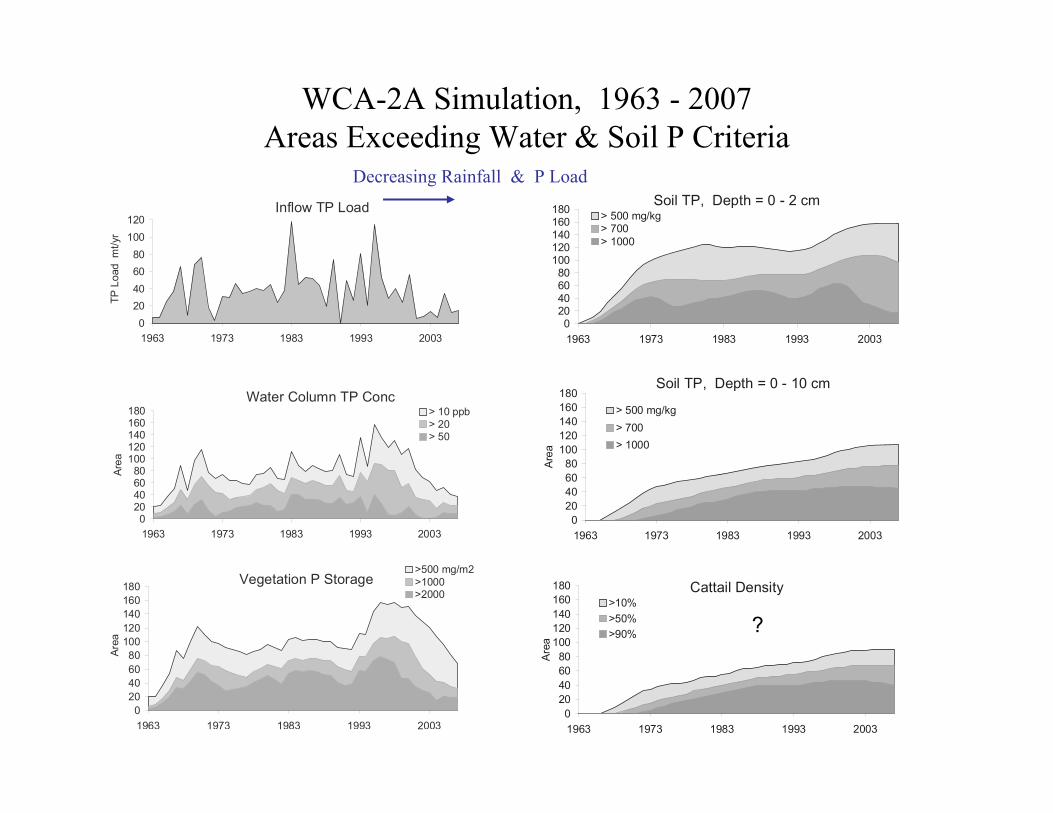
WCA-2A Simulation, 1963 - 2007Areas Exceeding Water & Soil P Criteria
Inflow TP Load
020406080
100120
1963 1973 1983 1993 2003
TP L
oad
mt/y
r
Water Column TP Conc
020406080
100120140160180
1963 1973 1983 1993 2003
Area
> 10 ppb> 20 > 50
Vegetation P Storage
020406080
100120140160180
1963 1973 1983 1993 2003
Area
>500 mg/m2>1000>2000
Soil TP, Depth = 0 - 2 cm
020406080
100120140160180
1963 1973 1983 1993 2003
> 500 mg/kg> 700> 1000
Soil TP, Depth = 0 - 10 cm
020406080
100120140160180
1963 1973 1983 1993 2003Ar
ea
> 500 mg/kg> 700> 1000
Cattail Density
020406080
100120140160180
1963 1973 1983 1993 2003
Area
>10%>50%>90% ?
Decreasing Rainfall & P Load
A
Water Column TP Conc
020406080
100120140160180
1963 1973 1983 1993 2003 2013 2023 2033 2043 2053
Are
a
> 10 ppb> 20 > 50
Vegetation P Storage
020406080
100120140160180
1963 1973 1983 1993 2003 2013 2023 2033 2043 2053
Are
a
>500 mg/m2>1000>2000
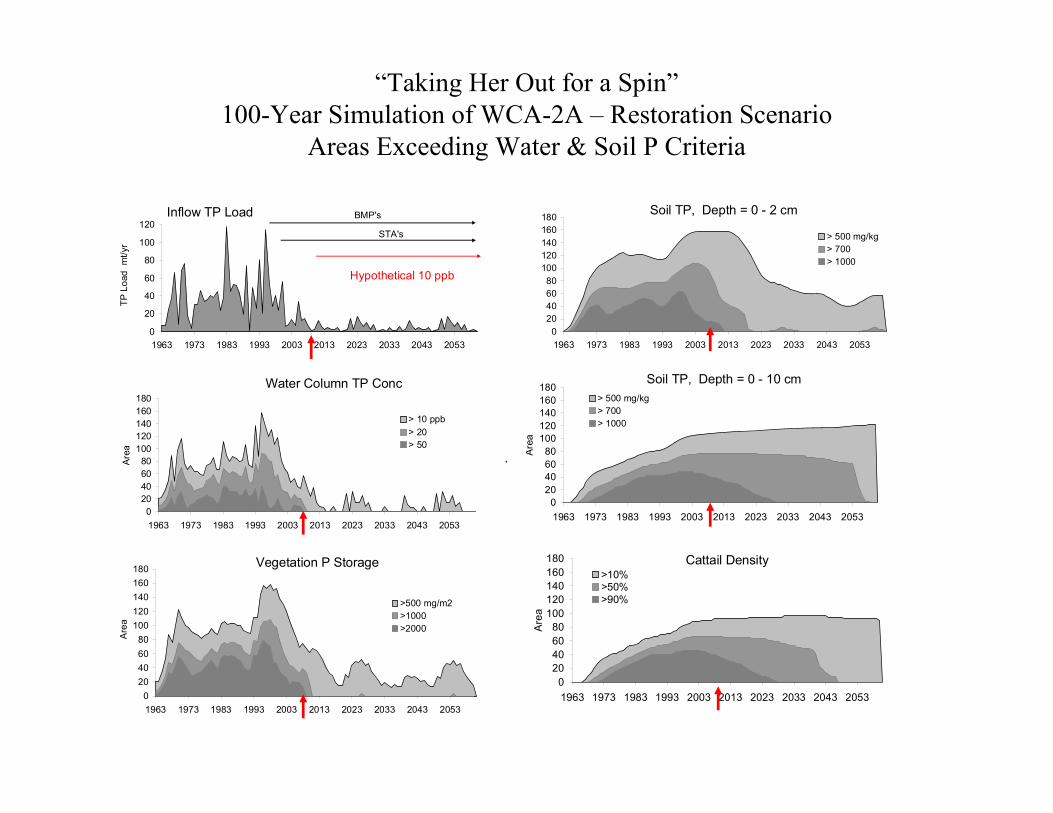
Inflow TP Load
0
20
40
60
80
100
120
1963 1973 1983 1993 2003 2013 2023 2033 2043 2053
TP L
oad
mt/y
r
BMP's
STA's
Hypothetical 10 ppb
“Taking Her Out for a Spin”100-Year Simulation of WCA-2A – Restoration Scenario
Areas Exceeding Water & Soil P Criteria
Soil TP, Depth = 0 - 2 cm
020406080
100120140160180
1963 1973 1983 1993 2003 2013 2023 2033 2043 2053
> 500 mg/kg> 700> 1000
Soil TP, Depth = 0 - 10 cm
020406080
100120140160180
1963 1973 1983 1993 2003 2013 2023 2033 2043 2053A
rea
> 500 mg/kg> 700> 1000
Cattail Density
020406080
100120140160180
1963 1973 1983 1993 2003 2013 2023 2033 2043 2053
Are
a
>10%>50%>90%
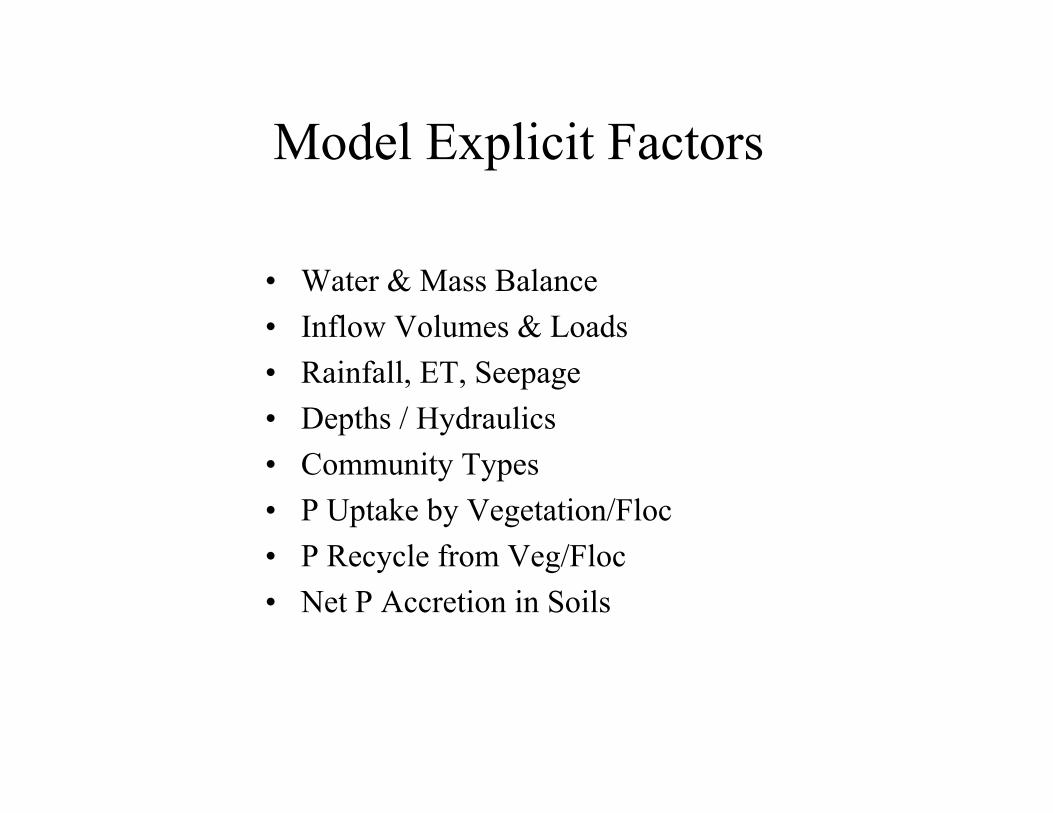
Model Explicit Factors
• Water & Mass Balance• Inflow Volumes & Loads• Rainfall, ET, Seepage• Depths / Hydraulics• Community Types• P Uptake by Vegetation/Floc• P Recycle from Veg/Floc• Net P Accretion in Soils
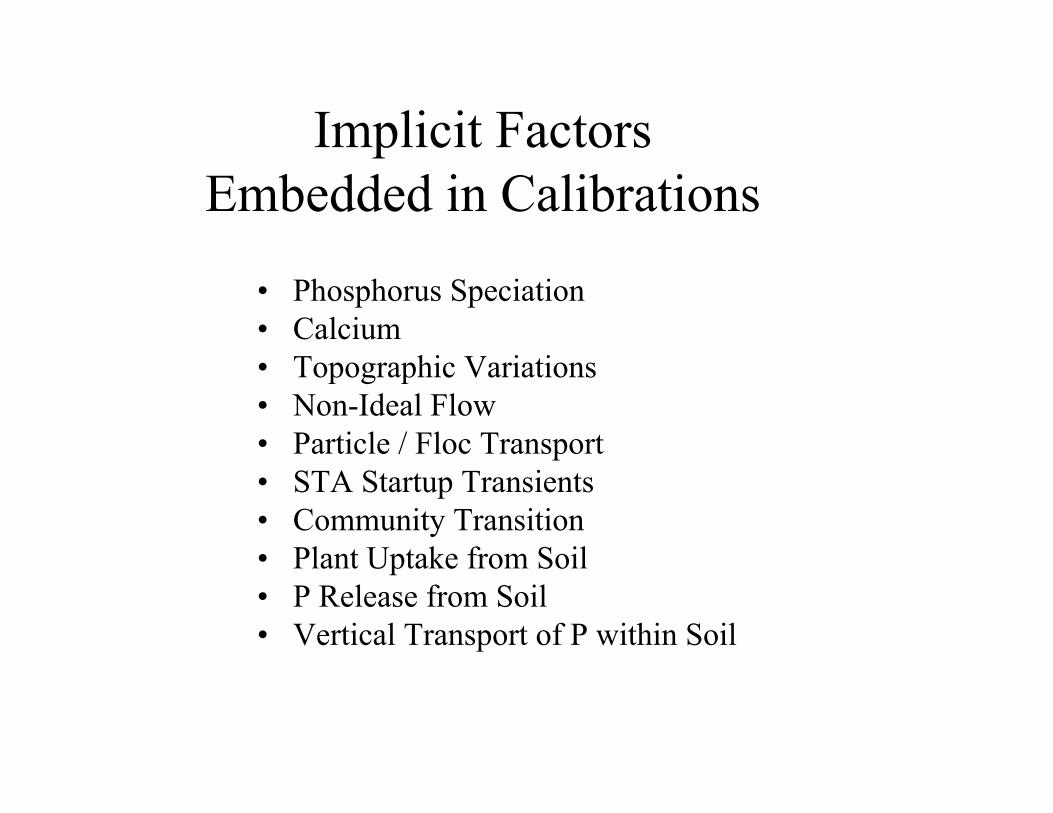
Implicit FactorsEmbedded in Calibrations
• Phosphorus Speciation• Calcium • Topographic Variations• Non-Ideal Flow • Particle / Floc Transport• STA Startup Transients• Community Transition• Plant Uptake from Soil• P Release from Soil• Vertical Transport of P within Soil
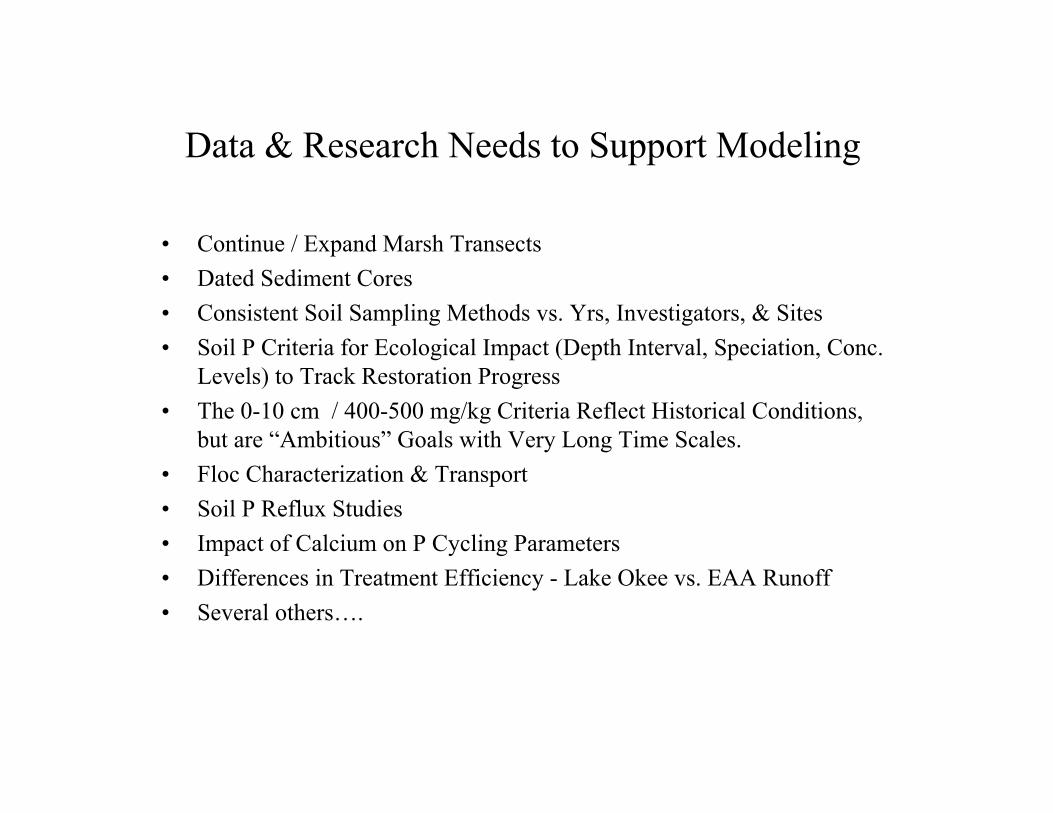
Data & Research Needs to Support Modeling
• Continue / Expand Marsh Transects• Dated Sediment Cores• Consistent Soil Sampling Methods vs. Yrs, Investigators, & Sites• Soil P Criteria for Ecological Impact (Depth Interval, Speciation, Conc.
Levels) to Track Restoration Progress• The 0-10 cm / 400-500 mg/kg Criteria Reflect Historical Conditions,
but are “Ambitious” Goals with Very Long Time Scales. • Floc Characterization & Transport • Soil P Reflux Studies• Impact of Calcium on P Cycling Parameters • Differences in Treatment Efficiency - Lake Okee vs. EAA Runoff• Several others….


