Embed Size (px)
Citation preview

Protecting the Florida Everglades wetlands with wetlands: Canstormwater phosphorus be reduced to oligotrophic conditions?
William J. Mitsch a,b,*, Li Zhang a, Darryl Marois a,b, Keunyea Song b,c
a Everglades Wetland Research Park, Florida Gulf Coast University, 4940 Bayshore Drive, Naples, FL 34112, USAbOlentangy River Wetland Research Park, The Ohio State University, Columbus, OH 43210, USAc School of Natural Resources, University of Nebraska, 3310 Holdrege Street, Lincoln, NE 68583-0974, USA
A R T I C L E I N F O
Article history:Received 23 June 2014Received in revised form 23 September 2014Accepted 3 October 2014Available online 25 October 2014
Keywords:PhosphorusFlorida EvergladesTreatment wetlandsStormwater treatmentCladium jamaicenseNymphaea odorataTypha domingensisNajas guadalupensis
A B S T R A C T
The Florida Everglades is being threatened by high-nutrient stormwater coming from agricultural runoff.The main nutrient problem is phosphorus, which causes the highly oligotrophic sawgrass (Cladiumjamaicense) communities in the northern Everglades to become eutrophic Typha latifolia/T. domingensiscommunities. Current government directives require that the total phosphorus concentration of stormwater drainage into the Everglades be limited to approximately 10ppb (mg-P/L). Over 23,000hatreatment wetlands, referred to locally as stormwater treatment areas (STAs), have been created fromfarmland to treat the stormwater. They are generally effective in removing 60–80% of the totalphosphorus; however, the 10ppb goal has rarely been achieved. A three-year experiment, involvingmesocosms plantedwith Everglades-nativewetland plantswas conducted in the Florida Everglades fromMarch 2010 to March 2013. Eighteen flow-through mesocosms (6m�1m�1m with 40-cm waterdepth) received about 2.6 cm/day inflow. The eighteen mesocosms were randomly assigned with sixdifferent plant communities with three replicates of each treatment, consisting of sawgrass (C.jamaicense); waterlily (Nymphaea odorata); cattail (Typha domingensis); submerged aquatic vegetation(SAV) includingNajas guadalupensis, and Chara sp. and aNymphaea–Eleocharis sp.mixed community; andsoil without vegetation as a control. Total phosphorus (TP) in the inflowwater was 25�1mg-P/L (n = 55)over the 3 years. Through 2012 the average outflow of all of the treatments was 34�1mg-P/L, a 51%decrease from the average outflow of 69�6mg-P/L for 2011. Outflows began to be routinely lower thanthe inflow in the 3rd year of the study. The average total phosphorus concentration decreased overall to19�1 (n =5) at the end of the study in 2013 suggesting that the suspected phosphorus reflux from themesocosm soils into the water column slowed after 2–2.5 years of mesocosm operation. Comparingoutflows of the individual treatments for 2013, the Nymphaea, control/Chara, and Typha treatments werelower (p<0.05) than the inflow with average outflow concentration of 11�1, 15�3 and 16�1mg-P/Lrespectively. When the 2013 data are isolated, 4 of the 6 vegetation treatments showed total phosphorusremoval, ranging from mixed community (17% removal), to Typha (28% removal), to the control (34%removal) and to Nymphaea (51% removal). We conclude that any treatment wetland constructed withlocal Florida soils and designed to achieve low (�10–15ppb P) concentrations would probably take aminimum of 2 years to become sinks of phosphorus. We also conclude that wetlands can be created toachieve these low thresholds if low TP loading and self-design strategies are incorporated into theproject design.
ã 2014 Elsevier B.V. All rights reserved.
1. Introduction
The Florida Everglades, one of the largest and most uniquewetland systems in theworld, and especially its “river of grass,” arebeing threatened by high-nutrient stormwater coming from thehighly fertilized Everglades Agricultural Area to the north. Themain nutrient problem is phosphorus, which causes the highlyoligotrophic sawgrass (Cladium jamaicense) in the northernEverglades to become a partially eutrophic Typha latifolia/T.
* Corresponding author at: Florida Gulf Coast University, Everglades WetlandResearch Park, 4940 Bayshore Drive, Naples, FL 34112, USA. Tel.: +1 239 325-1365;fax: +1 239 732 7043.
E-mail address: [email protected] (W.J. Mitsch).
http://dx.doi.org/10.1016/j.ecoleng.2014.10.0060925-8574/ã 2014 Elsevier B.V. All rights reserved.
Ecological Engineering 80 (2015) 8–19
Contents lists available at ScienceDirect
Ecological Engineering
journal homepage: www.elsevier .com/ locate /ecoleng

domingensis community. Current government directives arerequiring that the total phosphorus concentration of storm waterdrainage be limited to about 10ppb (mg-L), the approximateconcentration of phosphorus in rainfall.
1.1. Stormwater treatment areas in the Florida Everglades
There are currently six stormwater treatment areas (STAs)covering 23,000ha that have been restored from former farmlandto treat the agricultural runoff from the Everglades AgriculturalArea (EAA) south of Lake Okeechobee (Fig. 1). Some of thesesystems have been in operation for almost 20 years (Fig. 2a).Overall, from their start through 2012, these wetlands reducedphosphorus loads by 73% and lowered the average phosphorusconcentrations from 140 to 37ppb (Pietro, 2012; Fig. 2b). There issignificant adaptive management associated with the operation ofthe STAs including water depth management, water diversions,and drought contingency planning. The dynamics of phosphorus inthese wetlands has been evaluated and modeled in several studies(Newman and Pietro, 2001; Juston and DeBusk, 2006, 2011;Dierberg and DeBusk, 2008; Paudel et al., 2010; Paudel and Jawitz,2012; Entry and Gottlieb, 2014). Juston and DeBusk (2006) found inan investigation of four of these STAs that mass loadings at orbelow 1.3 gPm�2 yr�1 provided “a high likelihood of achievingoutflow total P (TP) concentrations less than 30mg/L”. Furthermorethey found that in submerged aquatic vegetation (SAV) wetlandsand emergent vegetationwetlands restored fromhistoricwetlandsrather than agriculture, loading rates at or below 2gPm�2 yr�1 ledto outflow P concentrations consistently between 10 and 20ppband mass removal efficiencies consistently above 85%. Entry andGottlieb (2014) concluded that as a result of $1.35 billion spent onthe STA’s over 17 years and investments in best managementpractices in the basin, total phosphorus decreased by 10–58% invarious locations in the Greater Everglades. Phosphorus
concentrations decreased from 12 to 7ppb in the EvergladesNational Park itself over that time.
Our review of data from STA-1W, the oldest operating STAsystem (started in 1994), shows that the inflow concentration forthe latest 5 years (2008–2012) is 191ppb and an average outflowconcentration has been 35ppb, resulting in an average retentionrate, by concentration, of 82%. Analyzing 17 years of data from thissame wetland, an average retention rate of 1.25 gPm�2 yr�1 wasrealized. This is well within the “sustainable” range of phosphorusretention of 1–2gPm�2 yr�1 for low-nutrient (non-municipalwastewater) treatment wetlands as summarized by Mitsch et al.(2000). All said, however, reaching the mandated 10ppb thresholdof total phosphorus has not been achieved with any consistencyfrom the STAs.
1.2. Mesocosm study on achieving low phosphorus concentrations
Although the created and restored wetlands (STAs) havesubstantially reduced phosphorus (P) loading to the Evergladesover the past decade, efforts continue to investigate newmanagement strategies to enhance the treatment performanceof these wetlands. One such effort was to initiate a three-yearproof-of-concept study mesocosm phosphorus study, starting in2010. The study examined whether several species of nativeaquatic macrophytes can be used to enhance the treatmentperformance of the STAs. We hypothesized that fragrant waterlily(Nymphaea odorata) and/or sawgrass (C. jamaicense), both commonin the oligotrophic waters of the Florida Everglades, may be able toreduce water-column P concentrations to levels below that of theTypha-submerged aquatic vegetation (SAV) systems currently
[(Fig._1)TD$FIG]
Fig. 1. Location of the mesocosm study site near stormwater treatment area (STA)1W in south Florida (from Villa et al., 2014).
[(Fig._2)TD$FIG]
Fig. 2. Total phosphorus inflow and outflow from stormwater treatment areas(STAs; created and restored wetlands) in south Florida: (a) STA-1W for 18 years1995–2012; (b) average� standard error of inflows and outflows for six STAs shownin Fig. 1.
W.J. Mitsch et al. / Ecological Engineering 80 (2015) 8–19 9
established in these wetlands, perhaps even to the 10ppb waterquality goal. Phosphorus removal to low levels could result fromthe right combination of emergent or floating leaved plantscombined with algal communities that are either benthic,planktonic, or epiphytic communities. This hypothesis was basedon P removal data from un-impacted areas of the adjacent WaterConservation Areas, where the abovementioned species oftendominate the plant community, and from previous research on theecophysiology of these species. Phosphorus and other waterquality parameters for the mesocosms inflow and all themesocosm outflows for different vegetation communities weremeasured for almost 3 years. Indicators of ecosystem functionincluding litter bags and enzyme activity (decomposition), aquaticmetabolism (water column/soil uptake and release and P co-precipitation), peak biomass (macrophyte uptake), and change insoil phosphorus (phosphorus efflux) were also determined.
2. Methods
The study was conducted in mesocosms located near theoutflow of STA-1W about 40 km west of West Palm Beach, Florida(Fig. 1). The main objective of the study was to assess nutrientremoval efficacy of different wetland vegetation communitiesnative to south Florida, using the outflowwater from a stormwatertreatment area (STA) as the inflow. The results presented here are
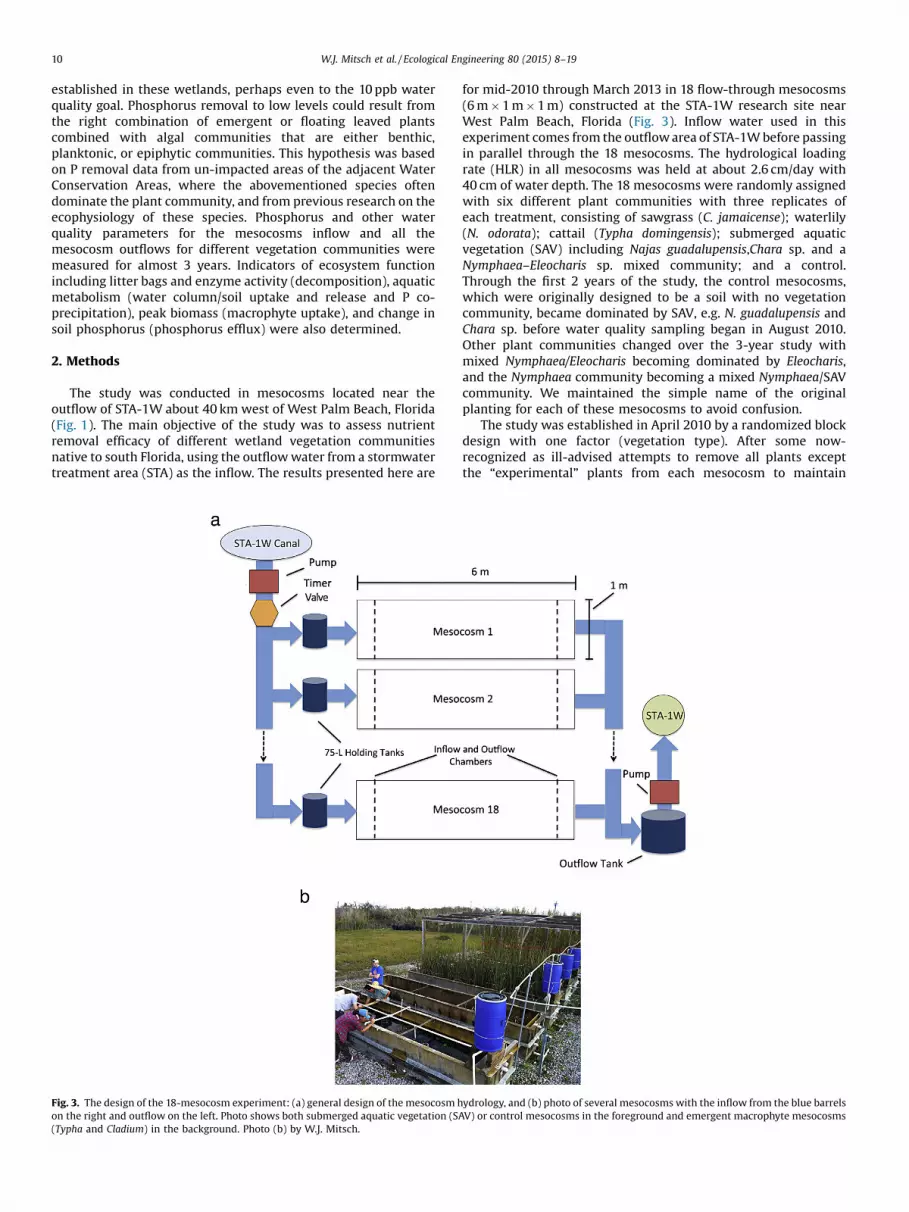
for mid-2010 through March 2013 in 18 flow-through mesocosms(6m�1m�1m) constructed at the STA-1W research site nearWest Palm Beach, Florida (Fig. 3). Inflow water used in thisexperiment comes from the outflowarea of STA-1Wbefore passingin parallel through the 18 mesocosms. The hydrological loadingrate (HLR) in all mesocosms was held at about 2.6 cm/day with40 cm of water depth. The 18 mesocosms were randomly assignedwith six different plant communities with three replicates ofeach treatment, consisting of sawgrass (C. jamaicense); waterlily(N. odorata); cattail (Typha domingensis); submerged aquaticvegetation (SAV) including Najas guadalupensis,Chara sp. and aNymphaea–Eleocharis sp. mixed community; and a control.Through the first 2 years of the study, the control mesocosms,which were originally designed to be a soil with no vegetationcommunity, became dominated by SAV, e.g. N. guadalupensis andChara sp. before water quality sampling began in August 2010.Other plant communities changed over the 3-year study withmixed Nymphaea/Eleocharis becoming dominated by Eleocharis,and the Nymphaea community becoming a mixed Nymphaea/SAVcommunity. We maintained the simple name of the originalplanting for each of these mesocosms to avoid confusion.
The study was established in April 2010 by a randomized blockdesign with one factor (vegetation type). After some now-recognized as ill-advised attempts to remove all plants exceptthe “experimental” plants from each mesocosm to maintain
[(Fig._3)TD$FIG]
Fig. 3. The design of the 18-mesocosm experiment: (a) general design of the mesocosm hydrology, and (b) photo of several mesocosms with the inflow from the blue barrelson the right and outflow on the left. Photo shows both submerged aquatic vegetation (SAV) or control mesocosms in the foreground and emergent macrophyte mesocosms(Typha and Cladium) in the background. Photo (b) by W.J. Mitsch.
10 W.J. Mitsch et al. / Ecological Engineering 80 (2015) 8–19

monocultures, we decided that the best strategy was to allow thecommunities to develop, just as we allow the soil community todevelop. There are several reasons for this experiment strategy:
� realism—the experiment, from the beginning, was about plantcommunities, perhaps initially planted with one or two species,but allowed to self-design as they would in a real-size wetland.So our results are much more realistic of what would happen iffull-scale wetlands are constructed, than if we continually triedto maintain monocultures.
� disturbance—early in the study we noticed that the outflowphosphorus may have been higher simply due to the turbulencecaused when harvesting filamentous algae, SAVs and lemnids.We believe that the high phosphorus concentrations initiallyseen in this study in some mesocosms may have been partiallydue to this management. We stopped cleaning out themesocosms in summer 2012.
� time requirements—as the mesocosms developed, more andmore time was required to clean these mesocosms. It becamephysically impossible to continue.
� importance of self-design in mesocosms studies—mesocosmsare, by definitions “little cosms” or “little ecosystems”. Thesestudies cannot be designed to be static single-species experi-ment. If we were interested in the behavior or physiology ofsingle species, a strict laboratory experimentwith plants in smallchambers or test tubes would have been more appropriate.
� value of succession in a 3-year experiment—by observingchanges that occur in mesocosms over the 3-year study withmild dosages of phosphorus, the pattern expected of phosphorusretention, soil dynamics and vegetation changes of full-scalewetlands can be better predicted if the plant community is notdisturbed. Otherwise, it like studying amowed lawn—successionarrested every 2 weeks.
The hydrological operating system consists of a pump located inthe canal connected with a distribution system and timers to eachmesocosm. Two timers set for automatic operation control themain inflow system. Timer 1 controls the inflow water from thecanal into blue barrel reservoirs through left and right valves.These valves are opened for 30min twice a day (3:00 am and3:00 pm).When these valves close, themiddle valve opens to allowthewater pass through a 2.5 cm line to awaste line. This procedurewas to insure that the canal pump would not become cloggedwhen water is not being pumped to the mesocosms. Timer2 controls an on/off valve at the bottom of the blue barrel to passinflow water from the barrel into individual mesocosms.
2.1. Phosphorus and other water quality
Water quality samples were collected at the main inflow fromthe STA-1W outflow canal and at outflows of the 18 mesocosmstwice per month from August 26, 2010 (four months aftervegetation was introduced) until mid-March 2013. Nutrients,including total phosphorus (TP), soluble reactive phosphorus(SRP), dissolved organic carbon (DOC), total dissolved carbon(TOC), total dissolved Kjeldahl nitrogen (TDKN), total Kjeldahlnitrogen (TKN), dissolved calcium (Ca2+) and dissolved magnesium(Mg2+) were analyzed at the South Florida Water ManagementDistrict (SFWMD) laboratories using laboratory standard methods.Samples were acidified in the field and stored at 4 �C beforesubsequent analysis. Total phosphorus (TP), total dissolvedphosphorus (TDP), and soluble reactive phosphorus (SRP) in watersamples were analyzed by molybdate blue colorimetric methods(APHA, 1998) using a Lachat autoanalyzer (QuickChem). Dissolvedorganic carbon (DOC) was analyzed using a TOC analyzer(Shimadzu). Dissolved organic phosphorus (DOP) was calculated
as the difference between TDP and SRP. Particulate phosphorus (PP)was calculated as the difference between TP and TDP.
2.2. Decomposition
Phosphomonoesterase and phosphodiesterase activities weremeasured for surface water, soil, and litter. Surface water andsurface soil (�10 cm) samples were collected each month fromApril to August 2011 for extracellular enzyme activity measure-ments. All samples were kept at 4 �C and the enzyme analysis wasconducted less than 7 days after sampling. Large aggregates anddetrital material from soil samples were removed before analysis.Litter samples were also collected from retrieved litterbags.Phosphomonoesterase and phosphodiesterase activities weremeasured with the methylumbelliferyl (MUF)-substrate method(Kang and Freeman, 1998).
To estimate the decomposition rates of different vegetation,litterbags (15 cm�12 cm, 1mm mesh size) containing approxi-mately 20g of dead/dried leaves of Typha, Cladium and fresh leavesof Nymphaea and Najas–Chara sp. were deployed in eachmesocosm on April 7, 2011. Litterbags with Typha and Cladiumwere collected 2 times, 30 and 94 days after the deployment whileNajas–Chara sp. litter bagswere collected 9,16, 30 and 37 days afterdeployment. Litterbags with Nymphaea leaves were collected5 times during the 56-day period followingdeployment. Six bags ofeach litter type were collected during each sampling event fromtriplicate mesocosms. The dry weight of the remaining littermaterial was measured and compared with the initial weight toestimate the litter decomposition rate over time.
2.3. Aquatic metabolism
Diurnal dissolved oxygen (DO) was measured in mesocosms tocalculate gross primary productivity (GPP), respiration (R) andnet primary productivity (NPP) of submerged and benthicvegetation and plankton. YSI 600XLM water quality sondes weredeployed into the mesocosms’ water columns for one- and two-week periods every month from February to July in 2011 and fromFebruary to December in 2012. The sondes measured andrecorded dissolved oxygen (DO), temperature, and pH data at20min intervals. A total of 22 weeks of diel water quality datawere measured between February 2011 and December 2012.Sondes were calibrated in the SFWMD lab prior to eachdeployment and were post-calibrated immediately after beingremoved from the field to check for accuracy. Data with frequentnegative DO values were not used as this indicated poorcalibration. Also, data without diurnal DO patterns were notused, as they provide erroneous results with the metabolismcalculation methods utilized in this study. Manual samples weretaken with a sonde once every two weeks to measure tempera-ture, DO, and pH during periods when sondes were not deployedfor diurnal measurements. All meteorological data includingwind speed, solar radiation, and barometric pressure weregathered from a SFWMD weather station located 2.5 km fromthe study site. Dissolved oxygen data were smoothed using a 2 hmoving average to remove most noise, while keeping a good fitwith the diurnal trends of the data (Coloso et al., 2008). Aquaticmetabolism was determined using methods based on Odum(1956) and Staehr et al. (2010). Diffusion of oxygen between theair–water interface was calculated using wind speed, watertemperature, and barometric pressure per Staehr et al. (2010), andwas determined to be insignificant due to dense vegetation in themesocosms and the tank walls blocking wind from creating muchsurface mixing. Similar conclusions have been made in previousstudies of diffusion in densely vegetated waters (Cronk andMitsch, 1994; Reeder, 2011). To further check this assumption,
W.J. Mitsch et al. / Ecological Engineering 80 (2015) 8–19 11

water temperature profiles were taken in some mesocosms,which showed virtually non-existent mixing depths. Aquaticrespiration was calculated using the average DO2/Dt duringnighttime hours (1 h after dusk and 1h before dawn). This is doneon the basis that no photosynthesis is occurring during dark hoursand thus any substantial change in DO must be solely due torespiration. Next, net primary production during daylight(NPPdaytime) was calculated using the average DO2/Dt duringdaytime hours. Dawn and dusk times were determined using totalsolar radiation data from a nearby weather station, with anyreading over 0.01 kWm�2 indicating the presence of daylight.Respiration during the daytime was assumed to not be signifi-cantly different than R during the nighttime (Cole et al., 2000;Staehr et al., 2010).
2.4. Aboveground standing biomass
Permanent quadrats (1m�1m) were established in the middleof each mesocosm. Standing biomass of all species was measuredquarterly using nondestructivemethods, except for SAV treatments,whereSAVbiomasswasharvestedusing a 30-cm-diameter cylinder,then subsequently dried andweighed. SAVmeasurement frequencyvaried depending on SAV recovery from the previous harvest. ForTypha and Cladium treatments, the four tallest ramets in the1m�1m quadrat were identified, and then the height of dead andlive leaves from each individual ramet, from the bottom of watercolumn to leaf tip, were measured. After measuring the ramets, alllive and dead leaves were counted for each quadrat. Estimation ofaboveground standing biomass of Nymphaea was based onmeasurement of horizontal and vertical distances of leaves and apercentage of living tissue in the leaf. The horizontal diameter is themeasurement fromedge toedgepassing through thepoint atwhicha “V” is formed by the lobes. The vertical distance is the length fromthe “V” to the tip of the leaf. All leaves whether at or below watersurface in the quadrate are measured. For Eleocharis species, two20 cm�20 cm framewere used in place of the 1m�1mquadrat tomeasure stems heights (live and dead stems). A regressionmethodbetween length of leaves and their oven-dry weights at 65 �C wasapplied to estimate aboveground standing biomass for Typha,Cladium, and Eleocharis. To calculate Nymphaea biomass, leafdiameter was used instead of leaf length. A suitable model foreach vegetation type was selected based on R-squared values andcurve shape. The selectedmodels for these vegetation communitiesare presented in Supplement A. A linear correction equation wasused for Typha and sawgrass due to overestimation of the powermodel,whereX is thedryweightoutputof thepowermodel andY isthe corrected dry weight. SAV and control biomass was calculatedby dividing the dry weight harvested by the surface area of thecylinder used for harvesting (0.071m2).
2.5. Soil analysis
Soils for the mesocosms were taken from outflow areas of STA-1W.Threereplicatesoilsamplesforinitialsoilanalysiswerecollectedon April 21, 2010, as the mesocosms were being constructed. InJanuary 7, 2013, soils in each of the 18 mesocosms were sampled at4 depths: surface floc, 0–2 cm, 2–10 cm, and 10–40cm. Total carbon(TC), totalphosphorus (TP), and totalnitrogen (TN)weredeterminedfor all of these samples byDBEnvironmental Inc., Rockledge, FLwithstandard methods (USEPA, 1983) and QA/QC control.
2.6. Data analysis
All statistical analyses were calculated using SPSS 15.0. ANOVAand MANOVA were used for multiple comparisons. All tests wereconducted at a 95% confidence interval (p= 0.05).
3. Results
3.1. Temporal patterns of outflow phosphorus
Total phosphorus (TP) concentrations in the inflow waterranged between 13 and 78mg-P/L (average 25�1mg-P/L, n =55)from August 2010 through March 2013 (Fig. 4a). The outflow TP ofthe Nymphaea–Eleocharis sp. mixed community treatment wasmuch higher than the outflows of the other treatments for the first2 years (August 2010 through July 2012) and averaged 103�12mg-P/L over the entire study period. The outflows of the othertreatments averaged between31�2mg-P/L (Nymphaea treatment)and 47�3mg-P/L (Cladium treatment) for the entire study period.
The outflow TP of all of the treatments began to decreases fromthe middle of November 2011 (Fig. 4b and Fig. 5a), approximately1.5 years after the start of the study. From November 2011–12 theaverage outflow of all of the treatments was 34�1mg-P/L, a 51%decrease from the average outflow of 69�6mg-P/L for 2011 butstill greater than the average inflow TP for the study period(average 25�1mg-P/L, n=55) (Fig. 4b).
Outflow total phosphorus of the vegetation treatments began toconverge for all treatments, including the mixed Eleocharis/Nymphaea treatment, in late 2012 and outflows began to beroutinely lower than the inflow about then. From November 9,2012, through the end of this reporting period of March 6, 2013(9 sampling periods), 70% of the treatment outflow concentrationswere lower than the inflowconcentrations (Fig. 4b). The average TPconcentration decreased overall to 19�1mg-P/L (n =5) for 2013 forall treatments, a decrease of 44% from the 2012 average (Fig. 5a).
[(Fig._4)TD$FIG]
0
10
20
30
40
50
60
70
80
90
100
A S O
N
D
J F M
A M
J J A S O
N
D
J F M
A M
J J A S O
N
D
J F M
Inflow
SAV
Control
Waterlily
Eleocharis and Waterlily Sawgrass
Cattail
Tota
l Pho
spho
rus,
ppb
2010 20122011 2013
0
10
20
30
40
50
60
70
80
90
100
A S O
N
D
J F M
A M
J J A S O
N D
J F M
A M
J J A S O
N
D
J F M
Inflow
SAVAA
Control
Waterlily
nd Eleocharis anWaterlily Sawgrass
Cattail
TTota
lPho
spho
rus,
ppb
otal
Pho
spho
rus,
ppb
TTT
2010 20122011 2013
0
10
20
30
40
50
60
70
80
90
100
A S O
N
D
J F M
A M
J J A S O
N
D
J F M
A M
J J A S O
N
D
J F M
Inflow
SAV
Control
Waterlily
Eleocharis and Waterlily Sawgrass
Cattail
Tota
l Pho
spho
rus,
ppb
2010 20122011 2013
0
5
10
15
20
25
30
35
40
45
50 Inflow
SAV
Control
Waterlily
Eleocharis and Waterlily Sawgrass
Cattail
Sept Oct Nov Dec Jan Feb Mar2012 2013
Tota
l Pho
spho
rus,
ppb
a)
b)
Fig. 4. Temporal patterns of total phosphorus (TP) in surface water inflow andoutflow for different vegetation treatments (a) August 2010 through March 2013,and (b) enlarged for last sevenmonths of this study, September 2012 throughMarch2013.
12 W.J. Mitsch et al. / Ecological Engineering 80 (2015) 8–19
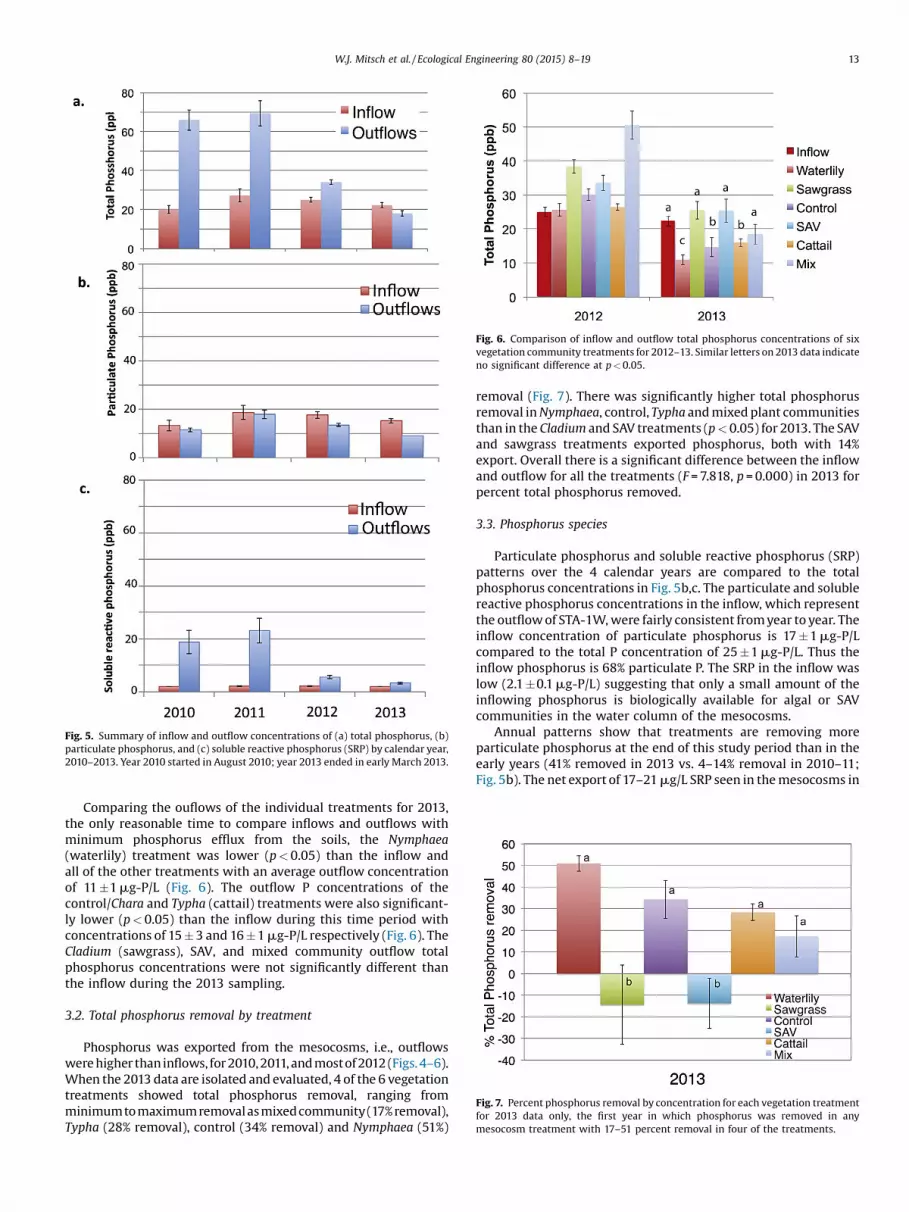
Comparing the ouflows of the individual treatments for 2013,the only reasonable time to compare inflows and outflows withminimum phosphorus efflux from the soils, the Nymphaea(waterlily) treatment was lower (p<0.05) than the inflow andall of the other treatments with an average outflow concentrationof 11�1mg-P/L (Fig. 6). The outflow P concentrations of thecontrol/Chara and Typha (cattail) treatments were also significant-ly lower (p<0.05) than the inflow during this time period withconcentrations of 15�3 and 16�1mg-P/L respectively (Fig. 6). TheCladium (sawgrass), SAV, and mixed community outflow totalphosphorus concentrations were not significantly different thanthe inflow during the 2013 sampling.
3.2. Total phosphorus removal by treatment
Phosphorus was exported from the mesocosms, i.e., outflowswerehigher thaninflows, for2010,2011,andmostof2012(Figs.4–6).When the 2013 data are isolated and evaluated, 4 of the 6 vegetationtreatments showed total phosphorus removal, ranging fromminimumtomaximumremovalasmixedcommunity(17%removal),Typha (28% removal), control (34% removal) and Nymphaea (51%)
removal (Fig. 7). There was significantly higher total phosphorusremoval inNymphaea, control, Typha andmixedplant communitiesthan in the Cladium and SAV treatments (p<0.05) for 2013. The SAVand sawgrass treatments exported phosphorus, both with 14%export. Overall there is a significant difference between the inflowand outflow for all the treatments (F=7.818, p =0.000) in 2013 forpercent total phosphorus removed.
3.3. Phosphorus species
Particulate phosphorus and soluble reactive phosphorus (SRP)patterns over the 4 calendar years are compared to the totalphosphorus concentrations in Fig. 5b,c. The particulate and solublereactive phosphorus concentrations in the inflow, which representthe outflowof STA-1W,were fairly consistent fromyear to year. Theinflow concentration of particulate phosphorus is 17�1mg-P/Lcompared to the total P concentration of 25�1mg-P/L. Thus theinflow phosphorus is 68% particulate P. The SRP in the inflow waslow (2.1�0.1mg-P/L) suggesting that only a small amount of theinflowing phosphorus is biologically available for algal or SAVcommunities in the water column of the mesocosms.
Annual patterns show that treatments are removing moreparticulate phosphorus at the end of this study period than in theearly years (41% removed in 2013 vs. 4–14% removal in 2010–11;Fig. 5b). The net export of 17–21mg/L SRP seen in themesocosms in
[(Fig._7)TD$FIG]
Fig. 7. Percent phosphorus removal by concentration for each vegetation treatmentfor 2013 data only, the first year in which phosphorus was removed in anymesocosm treatment with 17–51 percent removal in four of the treatments.
[(Fig._5)TD$FIG]
Fig. 5. Summary of inflow and outflow concentrations of (a) total phosphorus, (b)particulate phosphorus, and (c) soluble reactive phosphorus (SRP) by calendar year,2010–2013. Year 2010 started in August 2010; year 2013 ended in early March 2013.
[(Fig._6)TD$FIG]
Fig. 6. Comparison of inflow and outflow total phosphorus concentrations of sixvegetation community treatments for 2012–13. Similar letters on 2013 data indicateno significant difference at p<0.05.
W.J. Mitsch et al. / Ecological Engineering 80 (2015) 8–19 13
the first 2 years has almost disappeared by 2013. In 2013, SRPincreased on average by only 1.4mg-P/L in themesocosms (Fig. 5c).
3.4. Other water chemistry
Complete data for all water quality parameters for all years aregiven in Supplement B. The data showed few differences amongvegetation treatments. Two exceptions are dissolved organiccarbon (DOC) and calcium. Outflow DOC of all treatmentsdecreased in mid-summer 2011, stabilized for several monthsfrom August 2011 through January 2012, increased againFebruary–April 2012, and then decreased again through August2012 (Table 1). Changes in outflowDOC seem to be impacted by theinflow DOC. The Cladium (sawgrass) vegetation communityappears to be exporting more dissolved organic carbon (andhence more dissolved organic phosphorus) than the other treat-ments, especially in 2012 and 2013.
Four months after vegetation was introduced into themesocosms, outflow dissolved Ca concentrations of SAV andcontrol treatments became significantly lower than those in theinflow water and they have remained so throughout the studyperiod (see Supplement B). Outflow dissolved Ca concentrations ofthe Nymphaea treatment began to decrease in mid-2012, similar tothe patterns of the SAV and control treatments.
3.5. Enzyme activity and decomposition
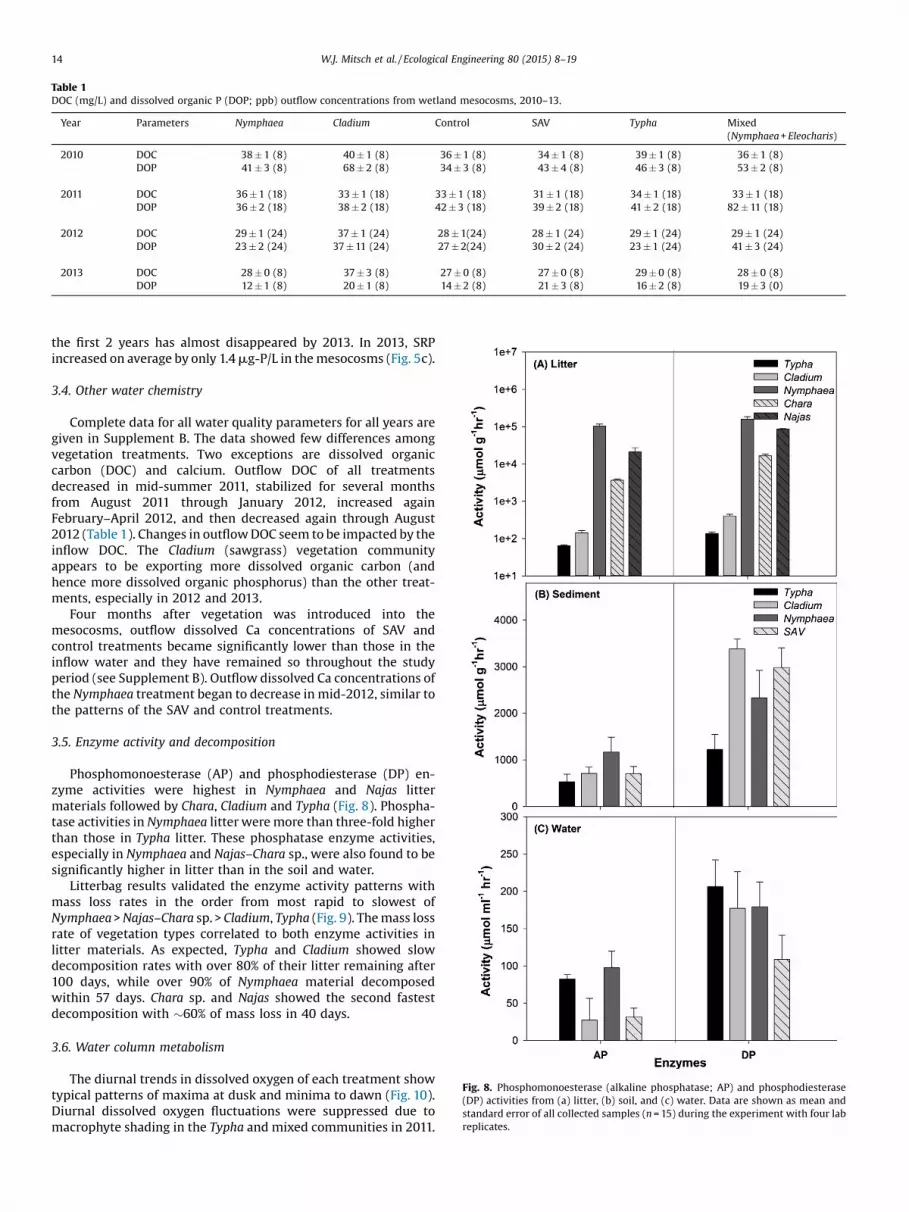
Phosphomonoesterase (AP) and phosphodiesterase (DP) en-zyme activities were highest in Nymphaea and Najas littermaterials followed by Chara, Cladium and Typha (Fig. 8). Phospha-tase activities in Nymphaea litter weremore than three-fold higherthan those in Typha litter. These phosphatase enzyme activities,especially in Nymphaea and Najas–Chara sp., were also found to besignificantly higher in litter than in the soil and water.
Litterbag results validated the enzyme activity patterns withmass loss rates in the order from most rapid to slowest ofNymphaea>Najas–Chara sp. >Cladium, Typha (Fig. 9). Themass lossrate of vegetation types correlated to both enzyme activities inlitter materials. As expected, Typha and Cladium showed slowdecomposition rates with over 80% of their litter remaining after100 days, while over 90% of Nymphaea material decomposedwithin 57 days. Chara sp. and Najas showed the second fastestdecomposition with �60% of mass loss in 40 days.
3.6. Water column metabolism
The diurnal trends in dissolved oxygen of each treatment showtypical patterns of maxima at dusk and minima to dawn (Fig. 10).Diurnal dissolved oxygen fluctuations were suppressed due tomacrophyte shading in the Typha and mixed communities in 2011.
Table 1DOC (mg/L) and dissolved organic P (DOP; ppb) outflow concentrations from wetland mesocosms, 2010–13.
Year Parameters Nymphaea Cladium Control SAV Typha Mixed(Nymphaea+ Eleocharis)
2010 DOC 38�1 (8) 40�1 (8) 36�1 (8) 34�1 (8) 39�1 (8) 36�1 (8)DOP 41�3 (8) 68�2 (8) 34�3 (8) 43�4 (8) 46�3 (8) 53�2 (8)
2011 DOC 36�1 (18) 33�1 (18) 33�1 (18) 31�1 (18) 34�1 (18) 33�1 (18)DOP 36�2 (18) 38�2 (18) 42�3 (18) 39�2 (18) 41�2 (18) 82�11 (18)
2012 DOC 29�1 (24) 37�1 (24) 28�1(24) 28�1 (24) 29�1 (24) 29�1 (24)DOP 23�2 (24) 37�11 (24) 27�2(24) 30�2 (24) 23�1 (24) 41�3 (24)
2013 DOC 28�0 (8) 37�3 (8) 27�0 (8) 27�0 (8) 29�0 (8) 28�0 (8)DOP 12�1 (8) 20�1 (8) 14�2 (8) 21�3 (8) 16�2 (8) 19�3 (0)
[(Fig._8)TD$FIG]
Fig. 8. Phosphomonoesterase (alkaline phosphatase; AP) and phosphodiesterase(DP) activities from (a) litter, (b) soil, and (c) water. Data are shown as mean andstandard error of all collected samples (n =15) during the experiment with four labreplicates.
14 W.J. Mitsch et al. / Ecological Engineering 80 (2015) 8–19

By 2012 the Cladium communities also had suppressed diurnalpatterns due to shading. In 2011, submerged aquatic vegetation(SAV) and control treatments had significantly higher GPP (6.4 and7.4 gO2m�2 day�1 respectively) than did all other treatments(Table 2). The Nymphaea mesocosms had significantly higherGPP (5.2 gO2m�2 day�1) than the Typha (2.9 gO2m�2 day�1) and
Nymphaea + Eleocharis mesocosms (3.3 gO2m�2 day�1). In 2012,the average GPP of the sawgrass, Typha, and mixed treatmentsshowed a significant decreases over the previous year. Therelative differences among vegetation communities shifted ac-cordingly in 2012 with the control having significantly higher GPP(7.0 gO2m�2 day�1) than all other vegetation communities. Also,the Nymphaea and SAV communities had significantly higher GPP(5.5 and 5.9 gO2m�2 day�1, respectively) than those of Typha,mixed, and Cladium treatments (1.7, 2.3, and 1.5 gO2m�2 day�1,respectively).
3.7. pH and metabolism
For each sampling period, the maximum pH within a 24hperiod was averaged from the 20min pH data gathered by thesondes. The averages of these maximum pHs across all diurnalsampling periods for each treatment (Fig. 11a) shows a clearpattern of highest pH in the control and SAV treatments,intermediate pH in the Nymphaea treatment, and lowest pH inthe remaining three treatments that have significant emergentvegetation. The correlation between daily maximum pH and itscause GPP produced a moderate positive correlation (R2 = 0.53)between these two variables (Fig. 11b). The high pH in the SAV andcontrol treatments, in turn, have a significant influence on calciumcarbonate and calcium oxide precipitation and, in all probability,on the co-precipitation of calcium phosphates (see next section).
3.8. Calcium precipitation
Average percent removal of Ca2+ followed a similar trend as GPP,with SAV and control mesocosms having the highest % removalrates of 42.8% and 35.7% respectively in 2012 (Fig. 12a). Mixed andNymphaea mesocosms had moderate removal rates with 7.0% and18.3% respectively. Typha mesocosms had very low Ca2+ removalrates at 1.0% and Cladium actually exported Ca2+ with a removalrate of �3.9%. For percent removal calculations, outflow concen-trations were paired with inflow concentrations that weremeasured in the previous sampling period to account for theapproximate two-week retention time. A positive correlation(R2 = 0.49) was found between the decrease in calcium as waterflowed through the mesocosms and the average daily maximumpH (Fig. 12b).
3.9. Macrophyte productivity
Aboveground biomass was used as a surrogate measure ofemergent plant productivity. As expected, macrophyte biomass inthe Typha and Cladium treatments reached high values of 1600–2700 gdry-weightm�2 by the end of the third growing season 2012(Fig. 13), typical results for these emergent macrophytes (Mitschand Gosselink, 2015). The mixed and Nymphaea vegetationcommunities had the lowest biomass in 2012 of less than100 gdry-weightm�2. Middle-level biomass measurements were
[(Fig._9)TD$FIG]
Fig. 9. Mass remaining (% of original tissue dryweight) of different vegetation usinglitterbags deployed in eachmesocosm.Meanswith standard error of samples (n =6)are presented.
Table 2Gross primary productivity (GPP) means� standard errors for each treatment in 2011 and 2012 in different common units of gO2m�2 d�1, kJm�2 d�1, and % of total solarradiation (from Marois et al., unpublished manuscript).
Treatement 2011 2012
GPP gO2 m�2 d�1 GPP kJ m�2 d�1 GPP (% solar rad.) GPP gO2 m�2 d�1 kJ m�2 d�1 GPP (% solar rad.)
Nymphaea (waterlily) 5.2�0.3 76.9�4.9 0.37 5.5� 0.2 82.0 � 2.9 0.54Cladium (sawgrass) 4.3�0.2 64.8�3.1 0.31 1.5�0.1 22.3�0.9 0.12Control 7.4�0.3 111.0�3.9 0.55 7.0�0.3 104.7�4.7 0.7Submerged aquatic vegetation (SAV) 6.4�0.4 95.1�6.2 0.45 5.9�0.3 87.8� 4.4 0.58Typha (cattail) 2.9�0.2 43.0�2.5 0.21 1.7�0.1 25.0�1.4 0.14Mixed 3.3�0.2 48.6�3.1 0.24 2.3�0.1 34.7�1.6 0.17
[(Fig._10)TD$FIG]
0
5
10
15
20
25
3/12/11 12:00 AM
3/13/11 12:00 AM
3/14/11 12:00 AM
3/15/11 12:00 AM
3/16/11 12:00 AM
DO
(mg/
L)
0
5
10
15
20
25
3/23/12 12:00 PM
3/24/12 12:00 PM
3/25/12 12:00 PM
3/26/12 12:00 PM
3/27/12 12:00 PM
DO
(mg/
L)
Waterlily Cattail Mix SAV Control Sawgrass
a)
b)
Fig. 10. Examples of diurnal pattern of dissolved oxygen in six mesocosmtreatments for: (a) March 11-16, 2011, and (b) March 23–27, 2012.
W.J. Mitsch et al. / Ecological Engineering 80 (2015) 8–19 15

found in the SAV and control treatments, which had biomass of500–700 gdry-weightm�2 in 2012.
3.10. Soil efflux
We measured the total phosphorus in the soil at the beginningof the study (April 2010) and at the end of the study (January 2013).The overall behavior of the mesocosms as exporters of phosphorusfor the first two-plus years of this study is undoubtedly due to theexport of excess phosphorus from the mesocosm soil originallytaken from the accrued soil layer of STA-1W wetland. Overall, thetotal phosphorus in the soil columndecreased by 19% over those 33months ofmesocosm operation (Table 3). That decrease representsa significant amount of phosphorus that was exported from themesocosm soils into thewater column, causing the patterns shownin Fig. 4 where total phosphorus in the mesocosm outflows washigher than the phosphorus in the inflow for two-plus years.
4. Discussion
4.1. Patterns of total phosphorus retention over 3 years
Results from the final six months of this mesocosm studysuggest that the suspected phosphorus reflux from the mesocosmsoils into the water column slowed after 2 years of mesocosmoperation and that the soil phosphorus concentrations may havereached equilibriumwith phosphorus concentrations in the watercolumn. Of course it is also possible that the higher macrophyteproductivity in later years in the mesocosms contributed to thereduction in phosphorus export. There was significantly higher
total phosphorus removal in Nymphaea, control, Typha, and mixedplant communities than in the Cladium and SAV treatments in2013. Our recognition of Nymphaea as potentially important inFlorida Everglades nutrient biogeochemistry is in keeping with thestudy by Troxler and Richards (2009) who found that Nymphaeaand Utricularia had the highest phosphorus concentrations in theFlorida Everglades deepwater sloughs. In a mesocosm study in thesame STA-1W outflow area but a decade before our study, Whiteet al. (2006) showed that SAV mesocosms removed 45% of totalphosphorus while Typha mesocosms removed only 34%. Further-more Typha took 85% of its phosphorus requirements from the soilwhile the SAVmet 53% of its phosphorus needs fromphosphorus inthe water column. It was concluded in that study that emergent[(Fig._13)TD$FIG]
Fig. 13. Patterns of aboveground peak biomass for different vegetation treatments,2010–12. The control treatment was not measured in 2010 or 2011.
[(Fig._11)TD$FIG]
Fig.11. (a) Average dailymaximumpH in sixmesocosm treatments, and (b) averagedaily maximum pH as a function of gross primary productivity in the mesocosmtreatments (R2 = 0.53).
[(Fig._12)TD$FIG]
Fig. 12. (a) Estimated average (�std dev) annual calcium retention for each of sixtreatments in 2011–12, and (b) average percent Ca2+ removal rates in mesocosmversus average daily maximum pH.
16 W.J. Mitsch et al. / Ecological Engineering 80 (2015) 8–19

plants such as Typha are less effective in removing phosphorusthan is submersed aquatic vegetation at low phosphorus concen-trations. Our study agrees with that finding.
4.2. Aquatic productivity and potential phosphorus co-precipitation
The general trend of aquatic metabolism being significantlyhigher in treatments with less emergent macrophyte cover(control and SAV) and lower in those with more cover (Typhaand Cladium) is likely due to shading effect of macrophytes onthe water column, reducing available solar energy to thewater column. When comparing our metabolism measurements22–111kJm�2 day�1 to other studies of aquatic metabolism infreshwater wetlands, many similarities emerge. Cronk andMitsch (1994) found average gross primary productivity (GPP)of 46–73kJm�2 day�1 in the water column in created marshes innortheastern Illinois that were dominated by Typha. These GPPvalues are somewhat higher than those found in our mesocosmsplanted with Typha of 25–43kJm�2 day�1, probably because theIllinois wetlands were not as densely vegetated as were theFlorida mesocosms. Hagerthey et al. (2010) estimated GPP in twoFlorida Everglades Nymphaea communities and found averagevalues of approximately 3.0 and 3.4 gO2m�2 day�1, somewhatlower than our values of 5.2–5.5 gO2m�2 day�1 measured in theNymphaea mesocosm communities. The higher values found inour study were possibly due to the mesocosm’s warmer watertemperatures. Hagerthey et al. (2010) also measured GPP in ahabitat being invaded by Cladium and found an average valueof approximately 2.9 gO2m�2 day�1, almost identical to theaverage of our metabolism measurements in the Cladiummesocosms. Maynard et al. (2012) found average GPP valuesof 6.4–13.7 gO2m�2 day�1 in a eutrophic flow-through wetlandsimilar to our SAV and control mesocosm communities of 5.9–7.4 gO2m�2 d�1 respectively) and the control treatment was inthis range in 2012 (7.0 gO2m�2 d�1). Tuttle et al. (2008) found arange of solar efficiencies in created flow-through wetlands inOhio of 0.01–0.45%, close to our range of 0.12–0.70%.
Higher pH, ranging from 7.8 to 8.8 and caused by watercolumn productivity, may be one of main factors causing Ca2+
decrease in the SAV and control treatments via calcium carbonateand calcium oxide precipitation. Reddy et al. (1993) showed thatthere was a strong correlation between calcium accumulationrates and phosphorus accumulation rates in the Everglades,attributing the phosphorus accumulation to the co-precipitationof dissolved inorganic phosphorus (also known as solublereactive phosphorus, or SRP) with calcium carbonate precipita-tion. House (1990) developed a model for predicting phosphorusco-precipitation that requires only the temperature, pH, initialSRP and Ca2+ concentrations, and final Ca2+ concentrations topredict SRP removal by co-precipitation with calcite. However,the inflow concentrations of SRP in our study were too low(�2mg l�1) to estimate retention this way. There was also ahigh flux of phosphorus from the mesocosm soil that confoundedany simpler retention calculations using inflow and outflowconcentrations.
4.3. Enzyme activity
Higher phosphatase activity in the litter of the mesocosmssuggests that phosphorus release by decomposition processesoccurs primarily in the litter layer while phosphorus release fromthe soil and water column areminimal. Phosphodiesterase activitywas often 2–5 times higher than phosphomonoesterase activity inall media, regardless of vegetation communities. Higher phospho-diesterase activity reflects the dominance of phosphodiester in themesocosms. Phosphodiesters, which consist of nucleic acids andphospholipids, are more labile and largely originated by microbialcommunities and algal-derived detritus (Turner and Newman,2005); they indicate high biological process rates in themesocosms. Consistent findings of dominance of phosphodiestersand high phosphodiesterase activities have been reported in theEverglades and Water Conservation Areas (Pant et al., 2002). Thisresult suggests the important roles of phosphodiesterase inphosphorus return to the water column.
4.4. Dissolved organic carbon
We found that changes in outflow DOC seem to be impactedmostly by the inflow DOC. We also found that the Cladiumcommunity appears to be exportingmore dissolved organic carbon(and hence by definition more dissolved organic phosphorus) thanthe other treatments, especially in 2012–13. Villa et al. (2014)found, in a companion study using carbon stable isotopes in thesemesocosms, that while inflow water was determined as the mainsource for outflowDOC (68–97%), 24–30% of the outflowDOC camefrom emergent and floating leaved biomass (e.g., Typha, Cladium,and Nymphaea) in those treatments. Only 3–5% of the outflowDOCwas due to submerged aquatic vegetation (such as Najas) in theSAV and control treatments. It can be presumed that the dissolvedorganic phosphorus (DOP) in the outflow was proportionally fromthe same sources.
4.5. Phosphorus budgets
Annual phosphorus budgets were developed for four of themesocosm treatments based on estimates of processes describedabove and based on the 2012–13 water quality results (Table 4).Inflow of phosphorus to all of the treatments was estimated to be0.25 gPm�2 yr�1, an inflow rate that is an order ofmagnitude lowerthan the loading rates of the current stormwater treatment area(STA) wetlands. This low loading rate is not surprising as the inflowphosphorus to the mesocosms is after the STAs have reducedstormwater phosphorus concentrations by 80% or more. The twovegetation treatments that show phosphorus retention in Table 4are the Nymphaea treatment that shows a net retention of0.13 gPm�2 yr�1 and the Typha treatment, which showed aretention of 0.07gPm�2 yr�1. Again, these retention rates areone-tenth those seen in the full-scale STAs. We estimated the STA-1W to have an average retention rate of 1.25 gPm�2 yr�1. Thevegetation treatment with high aquatic metabolism (submergedaquatic vegetation) had aquatic metabolism cycling of 6–18gPm�2 yr�1, yet showing a slight net export of phosphorus. Thevegetation communities with the highest emergent plant netprimary productivity and hence highest phosphorus uptake bymacrophytes was the Cladium community where an estimated12gPm�2 yr�1 was required for above-ground and below-groundproductivitymeasured in the last year. Yet that treatment showed aslight export of phosphorus. So, in the end, the “Nymphaea system”,which had become a system dominated as much by submersedaquatic vegetation (SAV) consisting of Southern naiad (N.guadalupensis) and the algae Chara spp. as by N. odorata, appearedto be the most effective in retaining low concentrations of
Table 3Soil phosphorus, nitrogen, and carbon in mesocosm soils at the beginning (April2010) and near the end (January 2013) of the mesocosm study.
Total phosphorus,g/kg
Total nitrogen, g/kg Total organic carbon, g/kg
2010a 0.64�0.07 (7) 20.1�1.0 (7) 330�10 (7)2013b 0.52�0.08 (18) 22.3�0.8 (18) 310�5 (18)
a Soils for mesocosms were from outflow areas of STA-1W.b Soils taken at 4 depths: floc, 0–2 cm, 2–10 cm, and 10–40 cm.
W.J. Mitsch et al. / Ecological Engineering 80 (2015) 8–19 17

phosphorus. Since this is a typical community found in the low-nutrient Florida Everglades deeper sloughs, the optimum phos-phorus retention at low phosphorus concentrations for thiscommunity makes sense. It could be the main community thatwould develop, despite planting of other vegetation, if wetlandswere ecologically engineered with low-concentration inflows andlow loading rates in attempts to achieve 10ppb phosphorusconcentrations.
5. Conclusions
� Two of the six mesocosms began to show phosphorus retentionafter 2 years of phosphorus export. The net export of phosphorusfor the first 2 years was hypothesized to be due primarily tophosphorus efflux from the soils used in the mesocosm study.
� Evaluating the data only at the end of study, phosphorusretention was most effective in the “Nymphaea community”(actually a combination of Nymphaea and submerged aquaticvegetation) treatment and slightly less effective in the control(also SAV) and Typha communities. All showed statisticallysignificant decreases in total phosphorus during the last threemonths of this study. The other community treatments (Cladium,Nymphaea + Eleocharis, and SAVs) did not show statistical differ-ences between inflows and outflows for 2013.
� Achieving 10ppb phosphorus concentrations consistently fromcreated wetlands in the Florida Everglades remains problematicbut this research confirms that it may be possible with lowloading rates, the right vegetation communities, and low-nutrient soils.
� Phosphorus retention per unit area of these additional low-Ptreatment wetlands was estimated to be 0.12 gPm�2 yr�1, 10% ofthe retention rate of the current STAs. In other words, a wetlandto reduce phosphorus from 30ppb to approximately 10ppbwould require 10 times thewetland area to retain the samemassof phosphorus as the current STAs.
� Nymphaea and SAV (Najas–Chara) treatments exhibited signifi-cantly higher phosphatase activities than the other fourvegetation community treatments. These laboratory methodson enzymes can be used as substitutes for the more traditionallitterbag decomposition studies and as “indicators” of potentialrelease of available nutrients from biomass decomposition.
� The wetland mesocosms without dense emergent plants, e.g.,submerged aquatic vegetation (SAV) and control mesocosms,had dramatic diurnal dissolved oxygen (primary productivityand respiration) and pH patterns. The high pH caused by theprimary productivity led to higher precipitation of calcium andpresumably higher co-precipitation of phosphorus.
� Our study concludes that any treatment wetland constructedwith local soils and inflow concentrations and loading rates
similar to those in these mesocosm studies would probably takea minimum of 2–3 years to become phosphorus sinks.
� Because of the 2 years that these mesocosms took to deplete thelabile phosphorus from the soils and the short period in whichthemesocosmswere operating as sinks before the project ended,the conclusions presented here are preliminary. It is clear thatthis study should have been continued for one or twomore years.We recommend verification with a four- or five-year mesocosmstudy before any full-scale downstreamwetland downstream ofthe current STAs are constructed.
Acknowledgements
This research is the result of a project entitled “AssessingNutrient Removal Efficacy and Uptake of Several Native WetlandPlant Communities” sponsored by the South Florida WaterManagement District (SFWMD), West Palm Beach, Florida, toThe Ohio State University (contract 4600001988) and to FloridaGulf Coast University (purchase order 4500070343) over 2010-2013. Special thanks to Shili Miao for her role in establishing thisstudy, and to Bob Johnson, Chung Nguyen, Kevin Cunniff, EvanWaletzko, Jorge Villa, and the SFWMD laboratory staff for theirsignificant contributions.
Appendix A. Supplementary data
Supplementary data associated with this article can befound, in the online version, at http://dx.doi.org/10.1016/j.eco-leng.2014.10.006http://dx.doi.org/10.1016/j.ecoleng.2014.10.006.
References
APHA, 1998. Standard methods for the examination of water and wastewater, 20thEd. American Public Health Association, Washington, DC.
Cole, J., Pace,M.L., Carpenter, S.R., Kitchell, J.F., 2000. Persistence of net heterotrophyin lakes during nutrient addition and food web manipulations. Limnol.Oceanogr. 45, 1718–1730.
Coloso, J.J., Cole, J.J., Hanson, P.C., Pace, M.L., 2008. Depth-integrated, continuousestimates of metabolism in a clear-water lake. Can. J. Fish. Aquat. Sci. 65,712–722.
Cronk, J., Mitsch,W.J., 1994. Aquatic metabolism in 4 newly constructed fresh-waterwetlands with different hydrologic inputs. Ecol. Eng. 3, 449–468.
Dierberg, F.E., DeBusk, T.A., 2008. Particulate phosphorus transformations in southFlorida stormwater treatment areas used for Everglades protection. Ecol. Eng.34, 100–115.
Entry, J.A., Gottlieb, A., 2014. The impact of stormwater treatment areas andagricultural best management practices on water quality in the EvergladesProtection Area. Environ. Monit. Assess. 186, 1023–1037.
Hagerthey, S.E., Cole, J.J., Kilbane, D., 2010. Aquatic metabolism in the Everglades:dominance of water column heterotrophy. Limnol. Oceanogr. 55, 653–666.
House, W., 1990. The prediction of phosphate coprecipitation with calcite in fresh-waters. Water Res. 24, 1017–1023.
Table 4Estimations of phosphorus fluxes near the end of the study for four of the treatments when macrophyte biomass and aquatic productivity were optimum.
Phosphorus flux, g-Pm�2 yr�1
Flux Nymphaea Cladium SAV Typha
Inflow 0.25Outflow 0.12 0.28 0.28 0.18Retention 0.13 �0.03 �0.03 0.07Macrophyte Plant uptake 0.2 11.8 3.5Macrophyte translocation to above-ground biomass 0.03 2.5 1.9Water column (submerged/algal) cyclinga 18 5 20 6Water column (submerged/algal) cyclingb 6.1 1.6 6.5 1.8Soil efflux (average over 2.7 year study)c 3.2
a Phosphorus cycling estimated from annual gross primary productivity and redfield ratio C:P = 41 by weight.b Estimated from carbon:phosphorus analysis of chara/najas mixture that was common to all of the treatments (from Marois et al., unpublished manuscript).c Estimated from the 2010 and 2013 phosphorus pools in Table 3 and average bulk density of soil over 2.75 years between these samples.
18 W.J. Mitsch et al. / Ecological Engineering 80 (2015) 8–19

Juston, J., DeBusk, T.A., 2006. Phosphorus mass load and outflow concentrationrelationships in stormwater treatment areas for Everglades restoration. Ecol.Eng. 26, 206–223.
Juston, J., DeBusk, T.A., 2011. Evidence and implications of the backgroundphosphorus concentration of submerged aquatic vegetation wetlands instormwater treatment areas for Everglades restoration. Water Res. Res. 41,430–446.
Kang, H., Freeman, C., 1998. Measurement of cellulase and xylosidase activities infeat using a sensitivefluorogenic compound assay. Commun. Soil Sci. Plant Anal.29, 2769–2774.
Marois, D.E., Mitsch, W.J., Song, K., Miao, S., Nguyen, C., press. Estimating theimportance of aquatic primary productivity for phosphorus retention in FloridaEverglades mesocosms. unpublished manuscript.
Maynard, J.J., Dahlgren, R.A., O'Geen, A.T., 2012. Quantifying spatial variability andbiogeochemical controls of ecosystemmetabolism in a eutrophic flow-throughwetland. Ecol. Eng. 47, 221–236.
Mitsch, W.J., Horne, A.J., Nairn, R.W., 2000. Nitrogen and phosphorus retention inwetlands—ecological approaches to solving excess nutrient problems. Ecol. Eng.14, 1–7.
Mitsch, W.J., Gosselink, J.G., 2015. Wetlands, 5th ed. John Wiley & Sons, Inc.,Hoboken, NJ.
Newman, S., Pietro, K., 2001. Phosphorus storage and release in response toflooding: implications for Everglades stormwater treatment areas. Ecol. Eng. 18,23–38.
Odum, H.T., 1956. Primary production in flowing waters. Limnol. Oceanogr. 1,102–117.
Pant, H.K., Reddy, K.R., Dierberg, F.E., 2002. Bioavailability of organic phosphorus in asubmerged aquatic vegetation-dominated treatment wetland. J. Environ. Qual.31, 1748–1756.
Paudel, R., Min, J.-K., Jawitz, J.W., 2010. Management scenario evaluation for a largetreatment wetland using a spatio-temporal phosphorus transport and cyclingmodel. Ecol. Eng. 36, 1627–1638.
Paudel, R., Jawitz, J.W., 2012. Does increasedmodel complexity improve descriptionof phosphorus dynamics in a large treatment wetland? Ecol. Eng. 42, 283–294.
Pietro, K., 2012. Synopsis of the Everglades Stormwater Treatment Areas,Water Year1996–2012. Technical Publication ASB-WQTT-12–001, South Florida WaterManagement District, West Palm Beach, FL, 56 pp.
Reddy, K., DeLaune, R., DeBusk, W., Koch, M., 1993. Long-term nutrientaccumulation in the Everglades (northern Everglades of Florida). Soil Sci.Soc. Am. J. 57, 1147–1155.
Reeder, B.C., 2011. Assessing constructed wetland functional success using dielchanges in dissolved oxygen, pH, and temperature in submerged, emergent, andopen-water habitats in the Beaver Creek Wetlands Complex, Kentucky (USA).Ecol. Eng. 37, 1772–1778.
Staehr, P.A., Bade, D., Van de Bogert, M.C., Koch, G.R., Williamson, C., Hanson, P.,Cole, J.J., Kratz, T., 2010. Lakemetabolism and the diel oxygen technique: state ofthe science. Limnol. Oceanogr.: Methods 8, 628–644.
Troxler, T.G., Richards, J.H., 2009. d13C, d15N, carbon, nitrogen and phosphorus asindicators of plant ecophysiology and organic matter pathways in Evergladesdeep slough, Florida, USA. Aquat. Bot. 91, 157–165.
Turner, B.L., Newman, S., 2005. Phosphorus cycling inwetland soils: the importanceof phosphate diesters. J. Environ. Qual. 34, 1921–1929.
Tuttle, C.L., Zhang, L., Mitsch, W.J., 2008. Aquatic metabolism as an indicator of theecological effects of hydrologic pulsing in flow-through wetlands. Ecol. Indic. 8,795–806.
U.S. Environmental ProtectionAgency(USEPA),1983.Methods forchemicalanalysisofwater and wastes. Environmental monitoring and support laboratory. Office ofResearch and Development. Environmental Protection Agency, Cincinnati, OH.
Villa, J., Mitsch, W.J., Song, K., Miao, S., 2014. Contribution of different wetland plantspecies to the DOC exported from a mesocosm experiment in the FloridaEverglades. Ecol. Eng. 71, 118–125.
White, J.R., Reddy, R., Majer-Newman, J., 2006. Hydrologic and vegetation effectson water column phosphorus in wetland mesocosms. Soil Sci. Soc. Am. J. 70,1242–1251.
W.J. Mitsch et al. / Ecological Engineering 80 (2015) 8–19 19


