Embed Size (px)
Citation preview
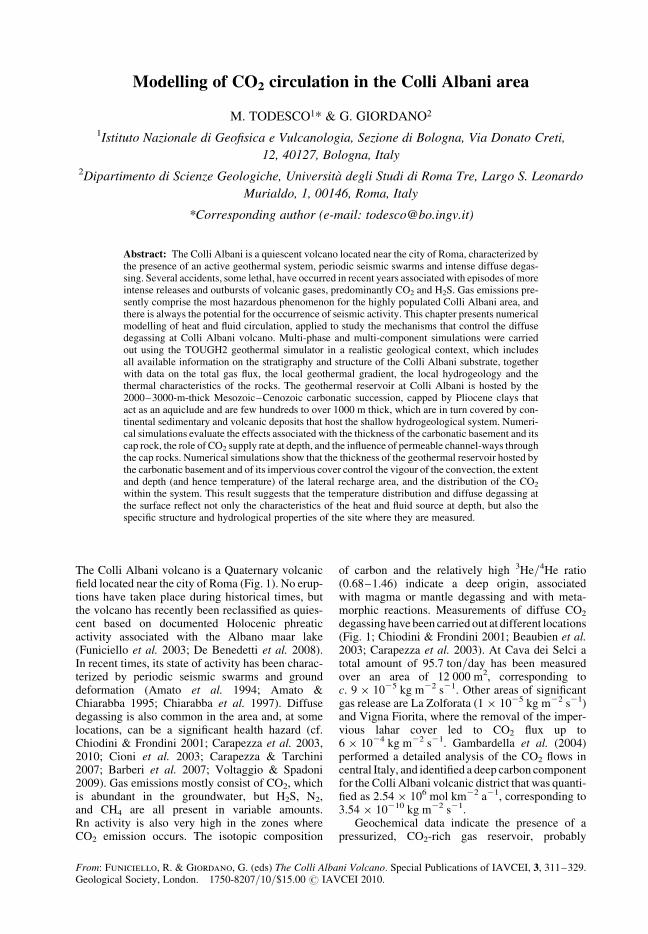
Modelling of CO2 circulation in the Colli Albani area
M. TODESCO1* & G. GIORDANO2
1Istituto Nazionale di Geofisica e Vulcanologia, Sezione di Bologna, Via Donato Creti,
12, 40127, Bologna, Italy2Dipartimento di Scienze Geologiche, Universita degli Studi di Roma Tre, Largo S. Leonardo
Murialdo, 1, 00146, Roma, Italy
*Corresponding author (e-mail: [email protected])
Abstract: The Colli Albani is a quiescent volcano located near the city of Roma, characterized bythe presence of an active geothermal system, periodic seismic swarms and intense diffuse degas-sing. Several accidents, some lethal, have occurred in recent years associated with episodes of moreintense releases and outbursts of volcanic gases, predominantly CO2 and H2S. Gas emissions pre-sently comprise the most hazardous phenomenon for the highly populated Colli Albani area, andthere is always the potential for the occurrence of seismic activity. This chapter presents numericalmodelling of heat and fluid circulation, applied to study the mechanisms that control the diffusedegassing at Colli Albani volcano. Multi-phase and multi-component simulations were carriedout using the TOUGH2 geothermal simulator in a realistic geological context, which includesall available information on the stratigraphy and structure of the Colli Albani substrate, togetherwith data on the total gas flux, the local geothermal gradient, the local hydrogeology and thethermal characteristics of the rocks. The geothermal reservoir at Colli Albani is hosted by the2000–3000-m-thick Mesozoic–Cenozoic carbonatic succession, capped by Pliocene clays thatact as an aquiclude and are few hundreds to over 1000 m thick, which are in turn covered by con-tinental sedimentary and volcanic deposits that host the shallow hydrogeological system. Numeri-cal simulations evaluate the effects associated with the thickness of the carbonatic basement and itscap rock, the role of CO2 supply rate at depth, and the influence of permeable channel-ways throughthe cap rocks. Numerical simulations show that the thickness of the geothermal reservoir hosted bythe carbonatic basement and of its impervious cover control the vigour of the convection, the extentand depth (and hence temperature) of the lateral recharge area, and the distribution of the CO2
within the system. This result suggests that the temperature distribution and diffuse degassing atthe surface reflect not only the characteristics of the heat and fluid source at depth, but also thespecific structure and hydrological properties of the site where they are measured.
The Colli Albani volcano is a Quaternary volcanicfield located near the city of Roma (Fig. 1). No erup-tions have taken place during historical times, butthe volcano has recently been reclassified as quies-cent based on documented Holocenic phreaticactivity associated with the Albano maar lake(Funiciello et al. 2003; De Benedetti et al. 2008).In recent times, its state of activity has been charac-terized by periodic seismic swarms and grounddeformation (Amato et al. 1994; Amato &Chiarabba 1995; Chiarabba et al. 1997). Diffusedegassing is also common in the area and, at somelocations, can be a significant health hazard (cf.Chiodini & Frondini 2001; Carapezza et al. 2003,2010; Cioni et al. 2003; Carapezza & Tarchini2007; Barberi et al. 2007; Voltaggio & Spadoni2009). Gas emissions mostly consist of CO2, whichis abundant in the groundwater, but H2S, N2,and CH4 are all present in variable amounts.Rn activity is also very high in the zones whereCO2 emission occurs. The isotopic composition
of carbon and the relatively high 3He/4He ratio(0.68–1.46) indicate a deep origin, associatedwith magma or mantle degassing and with meta-morphic reactions. Measurements of diffuse CO2
degassing have been carried out at different locations(Fig. 1; Chiodini & Frondini 2001; Beaubien et al.2003; Carapezza et al. 2003). At Cava dei Selci atotal amount of 95.7 ton/day has been measuredover an area of 12 000 m2, corresponding toc. 9 � 1025 kg m22 s21. Other areas of significantgas release are La Zolforata (1 � 1025 kg m22 s21)and Vigna Fiorita, where the removal of the imper-vious lahar cover led to CO2 flux up to6 � 1024 kg m22 s21. Gambardella et al. (2004)performed a detailed analysis of the CO2 flows incentral Italy, and identified a deep carbon componentfor the Colli Albani volcanic district that was quanti-fied as 2.54 � 106 mol km22 a21, corresponding to3.54 � 10210 kg m22 s21.
Geochemical data indicate the presence of apressurized, CO2-rich gas reservoir, probably
From: Funiciello, R. & Giordano, G. (eds) The Colli Albani Volcano. Special Publications of IAVCEI, 3, 311–329.Geological Society, London. 1750-8207/10/$15.00 # IAVCEI 2010.
hosted in the aquifers beneath and within the volca-nic cover. The accidental burst of a shallow geother-mal well in 1986 and again during the drilling ofsome water wells (Carapezza & Tarchini 2007;Barberi et al. 2007) corroborate the existence ofsuch a pressurized system. Sudden releases of CO2
and rapid heating of water springs have also been
reported in relation to seismic events (Funicielloet al. 2003; Tuccimei et al. 2006).
Emissions are also present near and within theAlbano lake, where volcanic gases percolatethrough the lake bottom and dissolve into the lakewaters at depth (Anzidei et al. 2008). CO2 storagein the lake’s water is associated with a potential
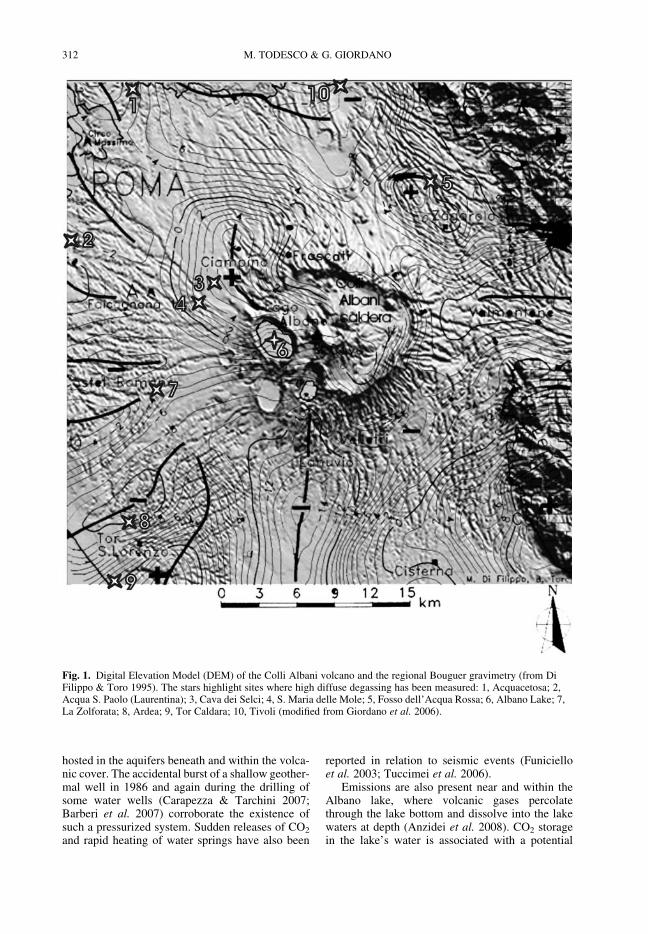
Fig. 1. Digital Elevation Model (DEM) of the Colli Albani volcano and the regional Bouguer gravimetry (from DiFilippo & Toro 1995). The stars highlight sites where high diffuse degassing has been measured: 1, Acquacetosa; 2,Acqua S. Paolo (Laurentina); 3, Cava dei Selci; 4, S. Maria delle Mole; 5, Fosso dell’Acqua Rossa; 6, Albano Lake; 7,La Zolforata; 8, Ardea; 9, Tor Caldara; 10, Tivoli (modified from Giordano et al. 2006).
M. TODESCO & G. GIORDANO312
(although not impending) hazard, as testified by thepresence of lahar deposits related to lake overflows(cf. Tavolato Formation; Funiciello et al. 2003; DeBenedetti et al. 2008; Giordano & The CARG Team2010). In this work, numerical modelling of heat andfluid circulation has been applied to study the mech-anisms controlling diffuse gas emissions at the ColliAlbani volcano. Simulations were carried out toevaluate conditions favouring the ascent and exsolu-tion of CO2 from the carbonatic basement up to theshallow volcanic series hosting the water table.Numerical simulations evaluate the effects associ-ated with the thickness of the carbonatic basementand its cap rock, the role of CO2 supply rate atdepth, and the influence of permeable channel-waysthrough the cap rocks (Table 1). The resulting reser-voir conditions and degassing rate at the surface arecompared for the different cases.
Preliminary results show that overall fluid circu-lation and surface CO2 emissions are highly affectedby the thickness and physical properties of thecarbonatic basement, which acts as the maingeothermal reservoir.
The geological-hydrogeological framework
The ascent and propagation of deep-seated gases iscontrolled by the rate at which they are generatedat depth, but they also depend on the hydrogeologi-cal properties of the rocks through which they flow.The reconstruction of the Colli Albani geology isdescribed in the chapters by Mattei et al. andGiordano & The CARG Team 2010 (cf. Giordanoet al. 2006; Bianchi et al. 2008), whereas the hydro-geology is described by the chapter by Mazza &Capelli 2010 (cf. Boni et al. 1995; Capelli et al.2006). The permeable volcanic edifice overlies aregional aquiclude, several hundreds of metresthick, composed of alternating marine clay and
sand belonging to the Pliocene–Quaternary post-orogenic succession. This formation represents themain cap rock. A highly permeable Meso–Ceno-zoic carbonatic succession forms the basement andthe main geothermal reservoir for the area (Chiodini& Frondini 2001; Gambardella et al. 2004; Cara-pezza & Tarchini 2007) (Fig. 2). This basement isaffected by syn-orogenic thrust tectonics and post-orogenic extensional tectonics forming structuralhighs and lows (Fig. 2) that are clearly identifiedfrom gravity data (Fig. 1; Di Filippo & Toro 1995;Mattei et al. 2010). Gas emissions are usuallyassociated with structural highs that act as traps,and with local tectonic discontinuities that representpreferential pathways for fluid ascent. The geother-mal system is sustained by the Colli Albani magmachamber, which is located largely below and partlywithin the carbonatic series (cf. Conticelli et al.2010).
Numerical model and computational
domain
Fluid circulation at Colli Albani was simulated withthe TOUGH2 geothermal simulator (Pruess et al.1999). This multi-phase and multi-componentmodel describes the coupled flow of heat andfluids through heterogeneous porous media. In thepresent application, the considered fluid com-ponents are water and CO2. The model accountsfor the dissolution of CO2 in liquid water accordingto Henry’s law, and describes water phase change asa function of system conditions.
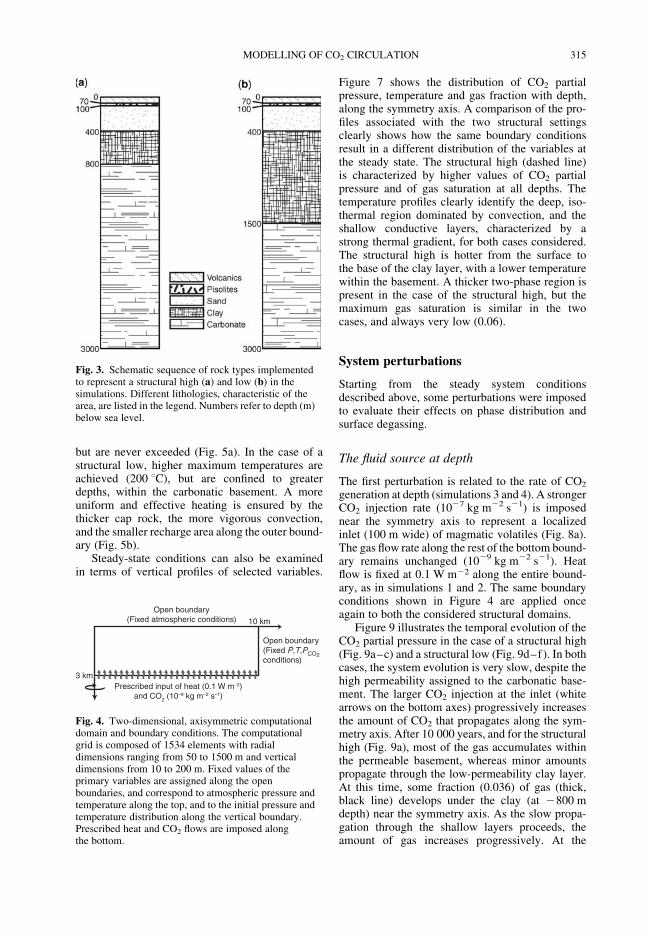
All the geological, geophysical, geochemicaland hydrogeological information available for theColli Albani region have been considered toprovide a reliable description of the undergroundrock sequence, with the most relevant porousdomains. Physical and hydraulic properties assignedto each rock unit are reported in Table 2. Two sche-matic stratigraphic sequences were defined to rep-resent typical conditions of structural high and low(Fig. 3).
The computational domain and boundary con-ditions are shown in Figure 4. The domain is initiallycold and water saturated. Heat (0.1 W m22) and hot(c. 350 8C) CO2 (1029 kg m22 s21) are injectedalong the base of the domain until the steady stateis reached, for each of the two considered rocksequences (simulations 1 and 2). Heating and fluidflow prompt a vigorous convection within thepermeable carbonatic basement for both structuralsettings (Fig. 5). At steady state, a wide, clockwiseconvective cell occupies the entire basement, butnegligible fluid motion occurs at shallower depths(Fig. 5b, d). The CO2 released at the bottom dis-solves in the water, rises along the symmetry axis,
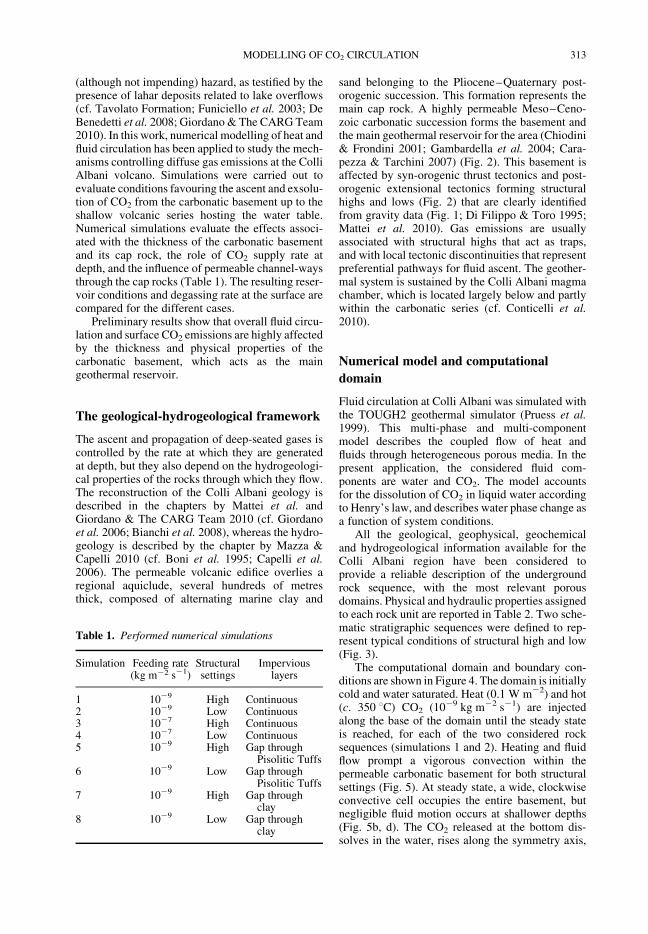
Table 1. Performed numerical simulations
Simulation Feeding rate(kg m22 s21)
Structuralsettings
Imperviouslayers
1 1029 High Continuous2 1029 Low Continuous3 1027 High Continuous4 1027 Low Continuous5 1029 High Gap through
Pisolitic Tuffs6 1029 Low Gap through
Pisolitic Tuffs7 1029 High Gap through
clay8 1029 Low Gap through
clay
MODELLING OF CO2 CIRCULATION 313
and accumulates at the base of the low-permeabilityclay layer. Hot water propagates outwards, along thebase of the clay, and finally leaves the domainthrough its outer boundary, 10 km from the sym-metry axis. Recharge of cold, liquid water occursthrough the same vertical boundary at greaterdepths. With time, CO2 penetrates within the claylayer and slowly propagates, forming a wideplume. Eventually, in both simulations, someminor fractions of CO2 (0.06) exsolve to form awater-dominated two-phase region, delimited bythe thick, black line in Figure 5b, d. Diffuse degas-sing takes place where the gas phase develops,as shown in Figure 5a, c. Although the evolutionin the two considered cases is qualitatively similar,the different geometries associated with thestructural high and structural low cause some sig-nificant differences. The thinner basement in simu-lation 2 prompts a more vigorous convection. CO2
is more effectively diluted and reaches a lower con-centration within the plume. The thicker clay layer
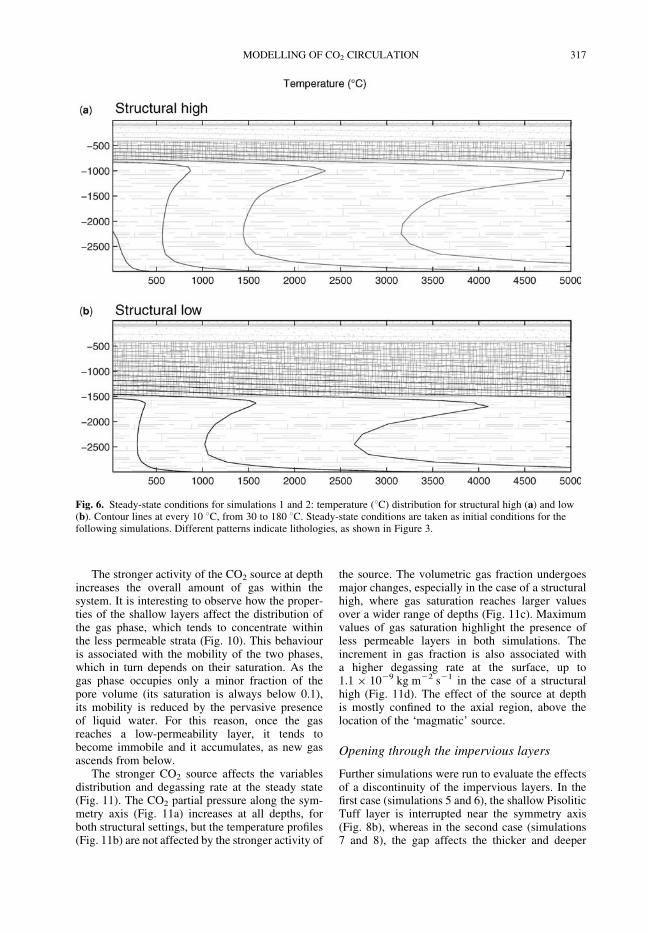
hinders the ascent of CO2 towards the surface, andthe resulting degassing rate does not exceed0.2 � 1029 kg m22 s21. In contrast, CO2 concen-trates in the case of a structural high, and achieveshigher partial pressures (up to 5 MPa at the steadystate) (Fig. 5b). The higher CO2 enrichment inturn leads to the development of a wider two-phasezone and stronger degassing rate at the surface (up to0.8 � 1029 kg m22 s21). The structural setting alsoaffects the temperature distribution within thesystem at the steady state (Fig. 6). In both the con-sidered cases, the shallow layers above theimpermeable clay are heated mostly by conduction,and remain colder, whereas the permeable basementis effectively heated by convection. In the case of astructural high, convection carries heat over a widerportion of the domain and, at the same time, theouter boundary is permeable over a larger fractionof its length, allowing an effective recharge ofcold water. As a result, temperatures in excess of150 8C are found at depths shallower than 1000 m,
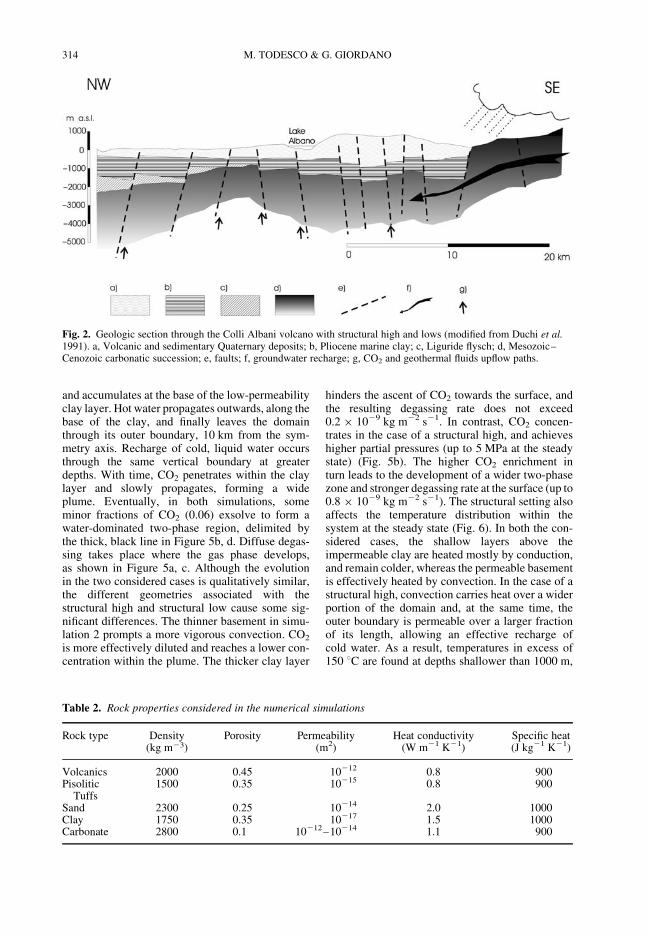
Fig. 2. Geologic section through the Colli Albani volcano with structural high and lows (modified from Duchi et al.1991). a, Volcanic and sedimentary Quaternary deposits; b, Pliocene marine clay; c, Liguride flysch; d, Mesozoic–Cenozoic carbonatic succession; e, faults; f, groundwater recharge; g, CO2 and geothermal fluids upflow paths.
Table 2. Rock properties considered in the numerical simulations
Rock type Density(kg m23)
Porosity Permeability(m2)
Heat conductivity(W m21 K21)
Specific heat(J kg21 K21)
Volcanics 2000 0.45 10212 0.8 900Pisolitic
Tuffs1500 0.35 10215 0.8 900
Sand 2300 0.25 10214 2.0 1000Clay 1750 0.35 10217 1.5 1000Carbonate 2800 0.1 10212–10214 1.1 900
M. TODESCO & G. GIORDANO314
but are never exceeded (Fig. 5a). In the case of astructural low, higher maximum temperatures areachieved (200 8C), but are confined to greaterdepths, within the carbonatic basement. A moreuniform and effective heating is ensured by thethicker cap rock, the more vigorous convection,and the smaller recharge area along the outer bound-ary (Fig. 5b).
Steady-state conditions can also be examinedin terms of vertical profiles of selected variables.
Figure 7 shows the distribution of CO2 partialpressure, temperature and gas fraction with depth,along the symmetry axis. A comparison of the pro-files associated with the two structural settingsclearly shows how the same boundary conditionsresult in a different distribution of the variables atthe steady state. The structural high (dashed line)is characterized by higher values of CO2 partialpressure and of gas saturation at all depths. Thetemperature profiles clearly identify the deep, iso-thermal region dominated by convection, and theshallow conductive layers, characterized by astrong thermal gradient, for both cases considered.The structural high is hotter from the surface tothe base of the clay layer, with a lower temperaturewithin the basement. A thicker two-phase region ispresent in the case of the structural high, but themaximum gas saturation is similar in the twocases, and always very low (0.06).
System perturbations
Starting from the steady system conditionsdescribed above, some perturbations were imposedto evaluate their effects on phase distribution andsurface degassing.
The fluid source at depth
The first perturbation is related to the rate of CO2
generation at depth (simulations 3 and 4). A strongerCO2 injection rate (1027 kg m22 s21) is imposednear the symmetry axis to represent a localizedinlet (100 m wide) of magmatic volatiles (Fig. 8a).The gas flow rate along the rest of the bottom bound-ary remains unchanged (1029 kg m22 s21). Heatflow is fixed at 0.1 W m22 along the entire bound-ary, as in simulations 1 and 2. The same boundaryconditions shown in Figure 4 are applied onceagain to both the considered structural domains.
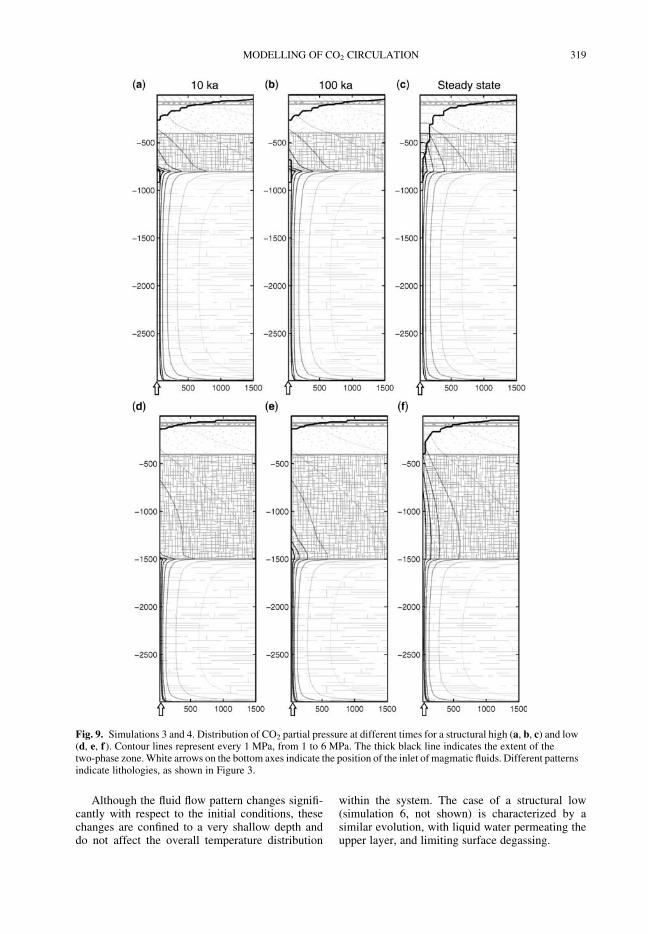
Figure 9 illustrates the temporal evolution of theCO2 partial pressure in the case of a structural high(Fig. 9a–c) and a structural low (Fig. 9d–f). In bothcases, the system evolution is very slow, despite thehigh permeability assigned to the carbonatic base-ment. The larger CO2 injection at the inlet (whitearrows on the bottom axes) progressively increasesthe amount of CO2 that propagates along the sym-metry axis. After 10 000 years, and for the structuralhigh (Fig. 9a), most of the gas accumulates withinthe permeable basement, whereas minor amountspropagate through the low-permeability clay layer.At this time, some fraction (0.036) of gas (thick,black line) develops under the clay (at 2800 mdepth) near the symmetry axis. As the slow propa-gation through the shallow layers proceeds, theamount of gas increases progressively. At the
Fig. 3. Schematic sequence of rock types implementedto represent a structural high (a) and low (b) in thesimulations. Different lithologies, characteristic of thearea, are listed in the legend. Numbers refer to depth (m)below sea level.
Open boundary(Fixed P,T,PCO2conditions)
Open boundary(Fixed atmospheric conditions)
Prescribed input of heat (0.1 W m–2) and CO2 (10–9 kg m–2 s–1)
10 km
3 km
Fig. 4. Two-dimensional, axisymmetric computationaldomain and boundary conditions. The computationalgrid is composed of 1534 elements with radialdimensions ranging from 50 to 1500 m and verticaldimensions from 10 to 200 m. Fixed values of theprimary variables are assigned along the openboundaries, and correspond to atmospheric pressure andtemperature along the top, and to the initial pressure andtemperature distribution along the vertical boundary.Prescribed heat and CO2 flows are imposed alongthe bottom.
MODELLING OF CO2 CIRCULATION 315
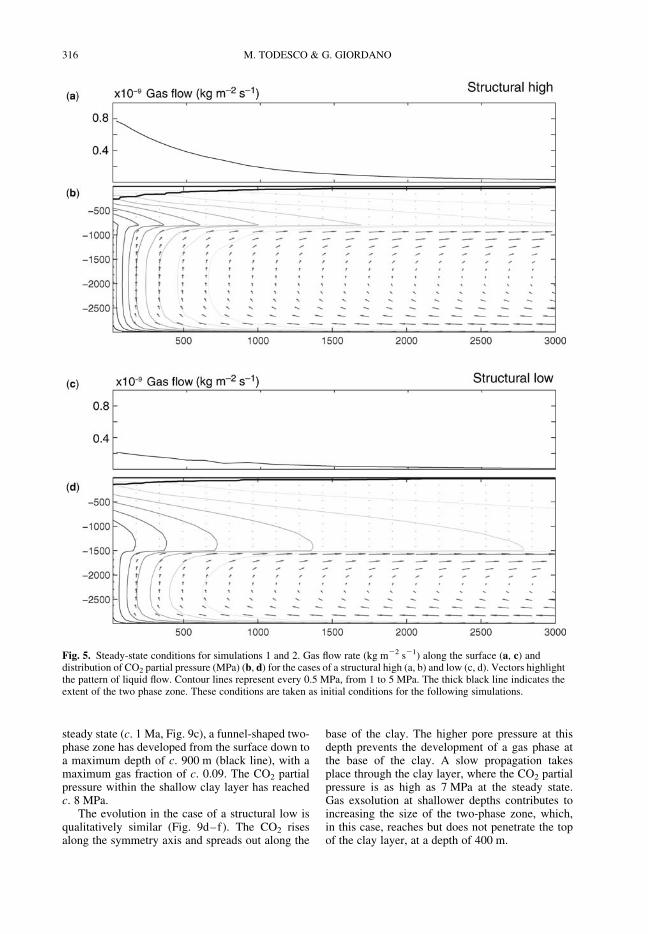
steady state (c. 1 Ma, Fig. 9c), a funnel-shaped two-phase zone has developed from the surface down toa maximum depth of c. 900 m (black line), with amaximum gas fraction of c. 0.09. The CO2 partialpressure within the shallow clay layer has reachedc. 8 MPa.
The evolution in the case of a structural low isqualitatively similar (Fig. 9d–f). The CO2 risesalong the symmetry axis and spreads out along the
base of the clay. The higher pore pressure at thisdepth prevents the development of a gas phase atthe base of the clay. A slow propagation takesplace through the clay layer, where the CO2 partialpressure is as high as 7 MPa at the steady state.Gas exsolution at shallower depths contributes toincreasing the size of the two-phase zone, which,in this case, reaches but does not penetrate the topof the clay layer, at a depth of 400 m.
Fig. 5. Steady-state conditions for simulations 1 and 2. Gas flow rate (kg m22 s21) along the surface (a, c) anddistribution of CO2 partial pressure (MPa) (b, d) for the cases of a structural high (a, b) and low (c, d). Vectors highlightthe pattern of liquid flow. Contour lines represent every 0.5 MPa, from 1 to 5 MPa. The thick black line indicates theextent of the two phase zone. These conditions are taken as initial conditions for the following simulations.
M. TODESCO & G. GIORDANO316
The stronger activity of the CO2 source at depthincreases the overall amount of gas within thesystem. It is interesting to observe how the proper-ties of the shallow layers affect the distribution ofthe gas phase, which tends to concentrate withinthe less permeable strata (Fig. 10). This behaviouris associated with the mobility of the two phases,which in turn depends on their saturation. As thegas phase occupies only a minor fraction of thepore volume (its saturation is always below 0.1),its mobility is reduced by the pervasive presenceof liquid water. For this reason, once the gasreaches a low-permeability layer, it tends tobecome immobile and it accumulates, as new gasascends from below.
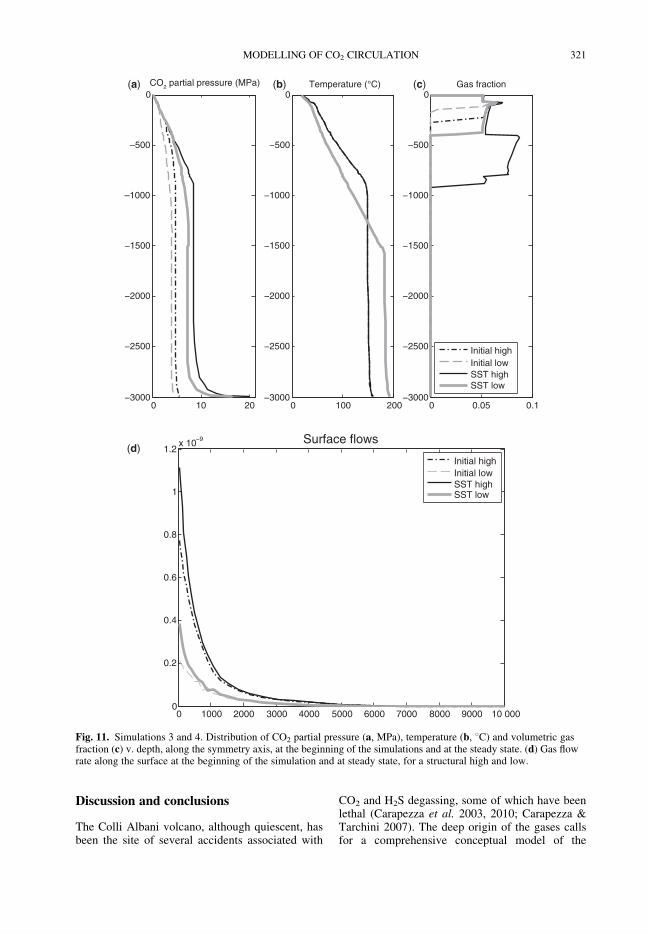
The stronger CO2 source affects the variablesdistribution and degassing rate at the steady state(Fig. 11). The CO2 partial pressure along the sym-metry axis (Fig. 11a) increases at all depths, forboth structural settings, but the temperature profiles(Fig. 11b) are not affected by the stronger activity of
the source. The volumetric gas fraction undergoesmajor changes, especially in the case of a structuralhigh, where gas saturation reaches larger valuesover a wider range of depths (Fig. 11c). Maximumvalues of gas saturation highlight the presence ofless permeable layers in both simulations. Theincrement in gas fraction is also associated witha higher degassing rate at the surface, up to1.1 � 1029 kg m22 s21 in the case of a structuralhigh (Fig. 11d). The effect of the source at depthis mostly confined to the axial region, above thelocation of the ‘magmatic’ source.
Opening through the impervious layers
Further simulations were run to evaluate the effectsof a discontinuity of the impervious layers. In thefirst case (simulations 5 and 6), the shallow PisoliticTuff layer is interrupted near the symmetry axis(Fig. 8b), whereas in the second case (simulations7 and 8), the gap affects the thicker and deeper
Fig. 6. Steady-state conditions for simulations 1 and 2: temperature (8C) distribution for structural high (a) and low(b). Contour lines at every 10 8C, from 30 to 180 8C. Steady-state conditions are taken as initial conditions for thefollowing simulations. Different patterns indicate lithologies, as shown in Figure 3.
MODELLING OF CO2 CIRCULATION 317
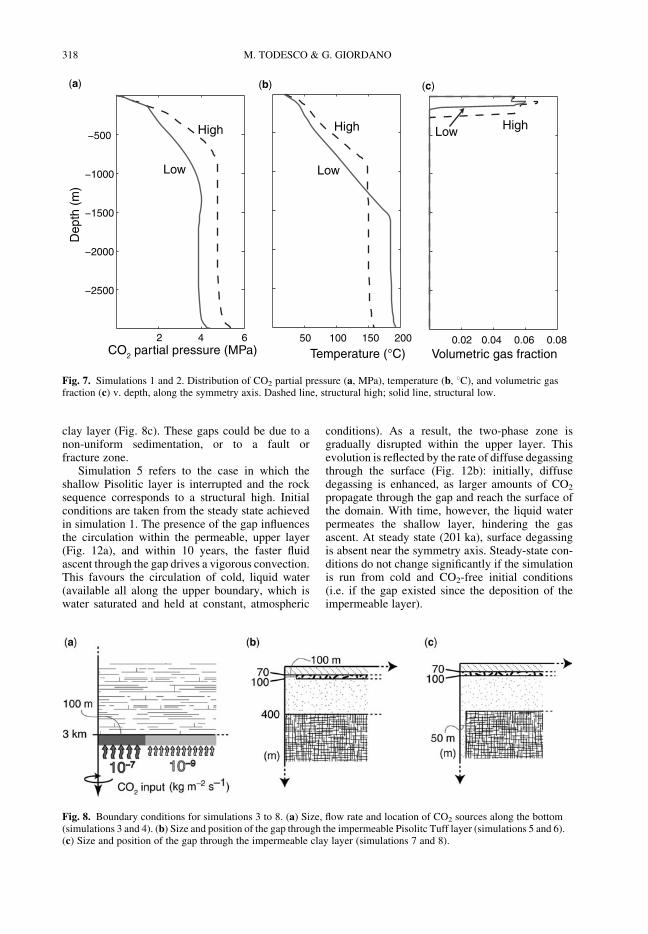
clay layer (Fig. 8c). These gaps could be due to anon-uniform sedimentation, or to a fault orfracture zone.
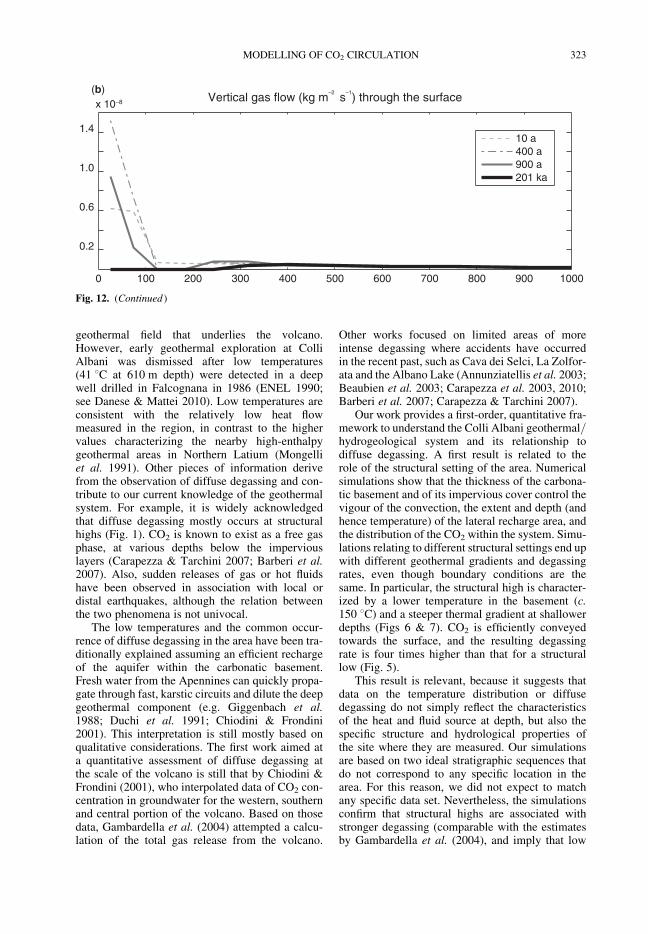
Simulation 5 refers to the case in which theshallow Pisolitic layer is interrupted and the rocksequence corresponds to a structural high. Initialconditions are taken from the steady state achievedin simulation 1. The presence of the gap influencesthe circulation within the permeable, upper layer(Fig. 12a), and within 10 years, the faster fluidascent through the gap drives a vigorous convection.This favours the circulation of cold, liquid water(available all along the upper boundary, which iswater saturated and held at constant, atmospheric
conditions). As a result, the two-phase zone isgradually disrupted within the upper layer. Thisevolution is reflected by the rate of diffuse degassingthrough the surface (Fig. 12b): initially, diffusedegassing is enhanced, as larger amounts of CO2
propagate through the gap and reach the surface ofthe domain. With time, however, the liquid waterpermeates the shallow layer, hindering the gasascent. At steady state (201 ka), surface degassingis absent near the symmetry axis. Steady-state con-ditions do not change significantly if the simulationis run from cold and CO2-free initial conditions(i.e. if the gap existed since the deposition of theimpermeable layer).
50 100 150 200
Temperature (°C)
High
Low
(b)
2 4 6
−2500
−2000
−1500
−1000
−500
CO2 partial pressure (MPa)
Dep
th (
m)
High
Low
(a)
0.02 0.04 0.06 0.08Volumetric gas fraction
HighLow
(c)
Fig. 7. Simulations 1 and 2. Distribution of CO2 partial pressure (a, MPa), temperature (b, 8C), and volumetric gasfraction (c) v. depth, along the symmetry axis. Dashed line, structural high; solid line, structural low.
Fig. 8. Boundary conditions for simulations 3 to 8. (a) Size, flow rate and location of CO2 sources along the bottom(simulations 3 and 4). (b) Size and position of the gap through the impermeable Pisolitc Tuff layer (simulations 5 and 6).(c) Size and position of the gap through the impermeable clay layer (simulations 7 and 8).
M. TODESCO & G. GIORDANO318
Although the fluid flow pattern changes signifi-cantly with respect to the initial conditions, thesechanges are confined to a very shallow depth anddo not affect the overall temperature distribution
within the system. The case of a structural low(simulation 6, not shown) is characterized by asimilar evolution, with liquid water permeating theupper layer, and limiting surface degassing.
Fig. 9. Simulations 3 and 4. Distribution of CO2 partial pressure at different times for a structural high (a, b, c) and low(d, e, f). Contour lines represent every 1 MPa, from 1 to 6 MPa. The thick black line indicates the extent of thetwo-phase zone. White arrows on the bottom axes indicate the position of the inlet of magmatic fluids. Different patternsindicate lithologies, as shown in Figure 3.
MODELLING OF CO2 CIRCULATION 319
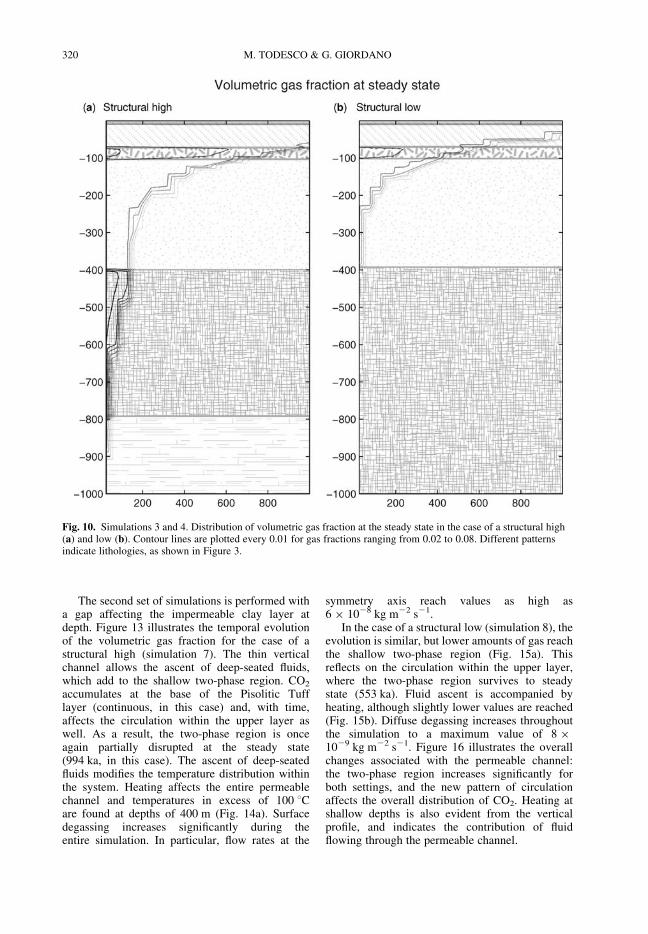
The second set of simulations is performed witha gap affecting the impermeable clay layer atdepth. Figure 13 illustrates the temporal evolutionof the volumetric gas fraction for the case of astructural high (simulation 7). The thin verticalchannel allows the ascent of deep-seated fluids,which add to the shallow two-phase region. CO2
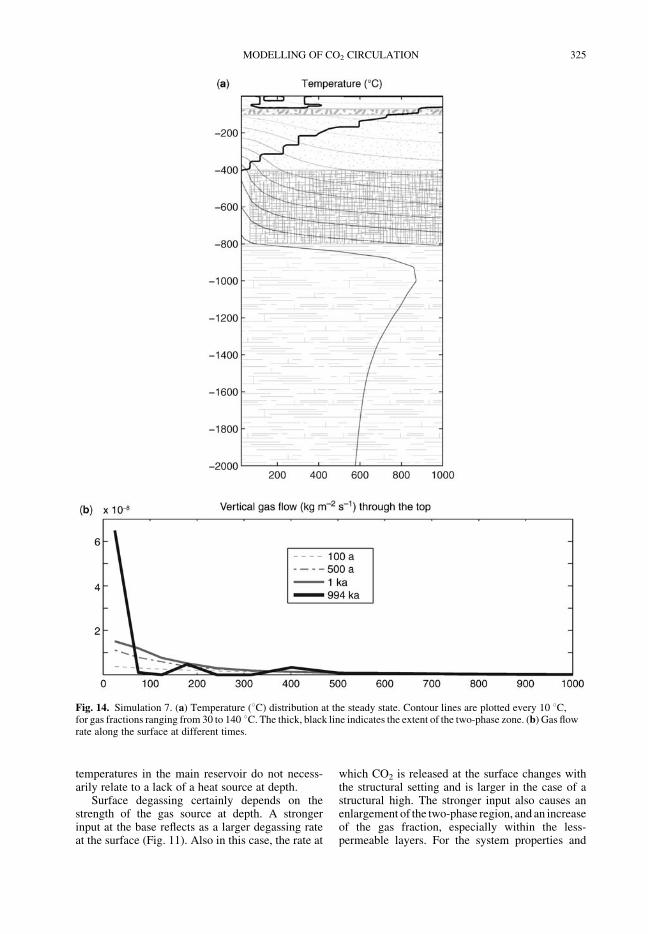
accumulates at the base of the Pisolitic Tufflayer (continuous, in this case) and, with time,affects the circulation within the upper layer aswell. As a result, the two-phase region is onceagain partially disrupted at the steady state(994 ka, in this case). The ascent of deep-seatedfluids modifies the temperature distribution withinthe system. Heating affects the entire permeablechannel and temperatures in excess of 100 8Care found at depths of 400 m (Fig. 14a). Surfacedegassing increases significantly during theentire simulation. In particular, flow rates at the
symmetry axis reach values as high as6 � 1028 kg m22 s21.
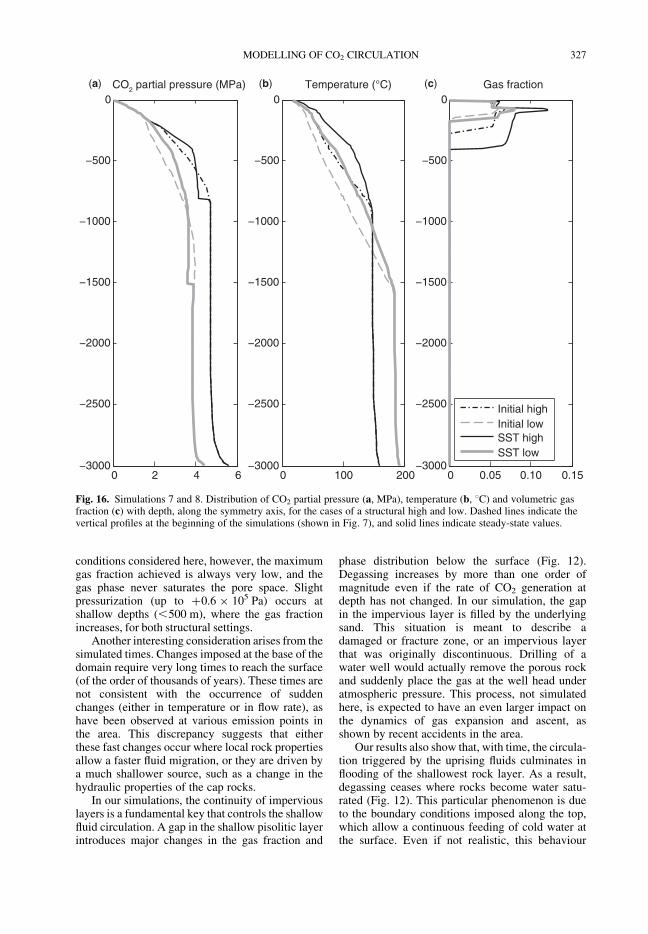
In the case of a structural low (simulation 8), theevolution is similar, but lower amounts of gas reachthe shallow two-phase region (Fig. 15a). Thisreflects on the circulation within the upper layer,where the two-phase region survives to steadystate (553 ka). Fluid ascent is accompanied byheating, although slightly lower values are reached(Fig. 15b). Diffuse degassing increases throughoutthe simulation to a maximum value of 8 �1029 kg m22 s21. Figure 16 illustrates the overallchanges associated with the permeable channel:the two-phase region increases significantly forboth settings, and the new pattern of circulationaffects the overall distribution of CO2. Heating atshallow depths is also evident from the verticalprofile, and indicates the contribution of fluidflowing through the permeable channel.
Fig. 10. Simulations 3 and 4. Distribution of volumetric gas fraction at the steady state in the case of a structural high(a) and low (b). Contour lines are plotted every 0.01 for gas fractions ranging from 0.02 to 0.08. Different patternsindicate lithologies, as shown in Figure 3.
M. TODESCO & G. GIORDANO320
Discussion and conclusions
The Colli Albani volcano, although quiescent, hasbeen the site of several accidents associated with
CO2 and H2S degassing, some of which have beenlethal (Carapezza et al. 2003, 2010; Carapezza &Tarchini 2007). The deep origin of the gases callsfor a comprehensive conceptual model of the
0 0.05 0.1−3000
−2500
−2000
−1500
−1000
−500
0Gas fraction
0 10 20−3000
−2500
−2000
−1500
–1000
–500
0CO2 partial pressure (MPa)
0 100 200−3000
−2500
−2000
−1500
−1000
−500
0Temperature (°C)
Initial highInitial lowSST highSST low
0 1000 2000 3000 4000 5000 6000 7000 8000 9000 10 0000
0.2
0.4
0.6
0.8
1
1.2x 10⁻⁹ Surface flows
Initial highInitial lowSST highSST low
(d)
(b)(a) (c)
Fig. 11. Simulations 3 and 4. Distribution of CO2 partial pressure (a, MPa), temperature (b, 8C) and volumetric gasfraction (c) v. depth, along the symmetry axis, at the beginning of the simulations and at the steady state. (d) Gas flowrate along the surface at the beginning of the simulation and at steady state, for a structural high and low.
MODELLING OF CO2 CIRCULATION 321
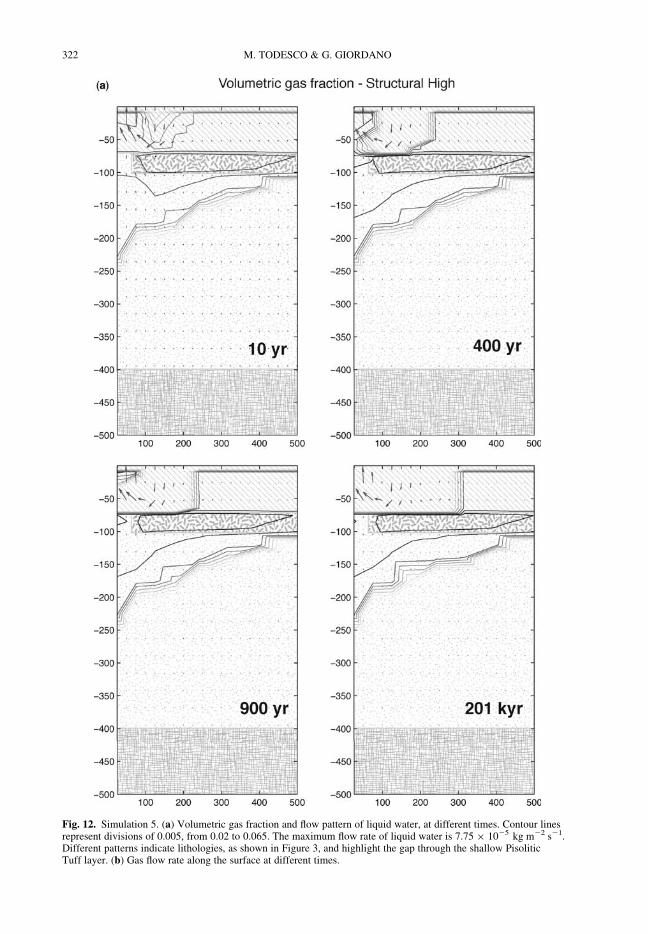
Fig. 12. Simulation 5. (a) Volumetric gas fraction and flow pattern of liquid water, at different times. Contour linesrepresent divisions of 0.005, from 0.02 to 0.065. The maximum flow rate of liquid water is 7.75 � 1025 kg m22 s21.Different patterns indicate lithologies, as shown in Figure 3, and highlight the gap through the shallow PisoliticTuff layer. (b) Gas flow rate along the surface at different times.
M. TODESCO & G. GIORDANO322
geothermal field that underlies the volcano.However, early geothermal exploration at ColliAlbani was dismissed after low temperatures(41 8C at 610 m depth) were detected in a deepwell drilled in Falcognana in 1986 (ENEL 1990;see Danese & Mattei 2010). Low temperatures areconsistent with the relatively low heat flowmeasured in the region, in contrast to the highervalues characterizing the nearby high-enthalpygeothermal areas in Northern Latium (Mongelliet al. 1991). Other pieces of information derivefrom the observation of diffuse degassing and con-tribute to our current knowledge of the geothermalsystem. For example, it is widely acknowledgedthat diffuse degassing mostly occurs at structuralhighs (Fig. 1). CO2 is known to exist as a free gasphase, at various depths below the imperviouslayers (Carapezza & Tarchini 2007; Barberi et al.2007). Also, sudden releases of gas or hot fluidshave been observed in association with local ordistal earthquakes, although the relation betweenthe two phenomena is not univocal.
The low temperatures and the common occur-rence of diffuse degassing in the area have been tra-ditionally explained assuming an efficient rechargeof the aquifer within the carbonatic basement.Fresh water from the Apennines can quickly propa-gate through fast, karstic circuits and dilute the deepgeothermal component (e.g. Giggenbach et al.1988; Duchi et al. 1991; Chiodini & Frondini2001). This interpretation is still mostly based onqualitative considerations. The first work aimed ata quantitative assessment of diffuse degassing atthe scale of the volcano is still that by Chiodini &Frondini (2001), who interpolated data of CO2 con-centration in groundwater for the western, southernand central portion of the volcano. Based on thosedata, Gambardella et al. (2004) attempted a calcu-lation of the total gas release from the volcano.
Other works focused on limited areas of moreintense degassing where accidents have occurredin the recent past, such as Cava dei Selci, La Zolfor-ata and the Albano Lake (Annunziatellis et al. 2003;Beaubien et al. 2003; Carapezza et al. 2003, 2010;Barberi et al. 2007; Carapezza & Tarchini 2007).
Our work provides a first-order, quantitative fra-mework to understand the Colli Albani geothermal/hydrogeological system and its relationship todiffuse degassing. A first result is related to therole of the structural setting of the area. Numericalsimulations show that the thickness of the carbona-tic basement and of its impervious cover control thevigour of the convection, the extent and depth (andhence temperature) of the lateral recharge area, andthe distribution of the CO2 within the system. Simu-lations relating to different structural settings end upwith different geothermal gradients and degassingrates, even though boundary conditions are thesame. In particular, the structural high is character-ized by a lower temperature in the basement (c.150 8C) and a steeper thermal gradient at shallowerdepths (Figs 6 & 7). CO2 is efficiently conveyedtowards the surface, and the resulting degassingrate is four times higher than that for a structurallow (Fig. 5).
This result is relevant, because it suggests thatdata on the temperature distribution or diffusedegassing do not simply reflect the characteristicsof the heat and fluid source at depth, but also thespecific structure and hydrological properties ofthe site where they are measured. Our simulationsare based on two ideal stratigraphic sequences thatdo not correspond to any specific location in thearea. For this reason, we did not expect to matchany specific data set. Nevertheless, the simulationsconfirm that structural highs are associated withstronger degassing (comparable with the estimatesby Gambardella et al. (2004), and imply that low
0 100 200 300 400 500 600 700 800 900 1000
0.2
0.6
1.0
1.4
x 10–8 Vertical gas flow (kg m–2 s–1
) through the surface(b)
10 a400 a900 a201 ka
Fig. 12. (Continued )
MODELLING OF CO2 CIRCULATION 323
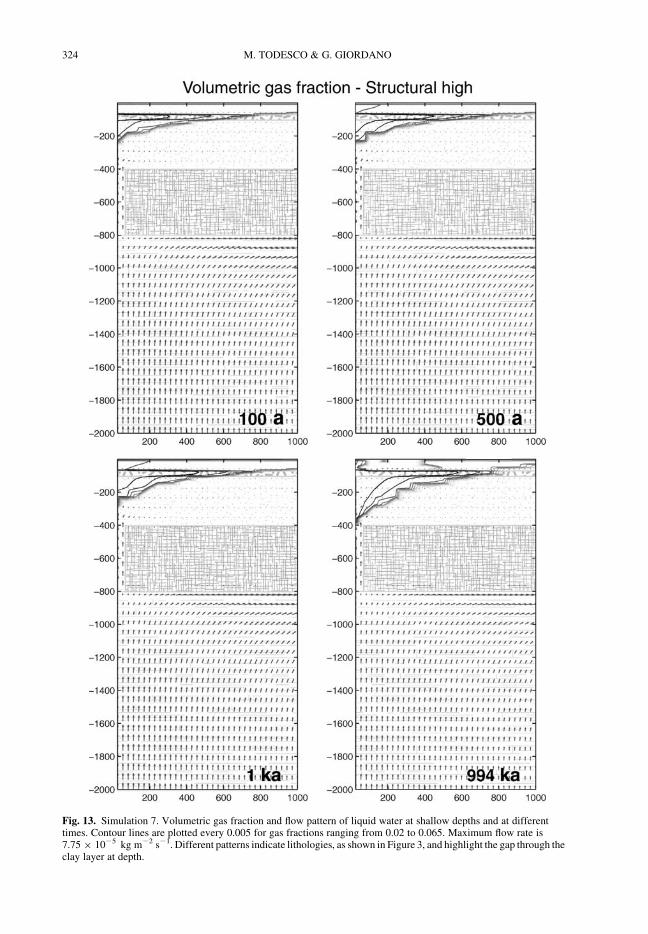
Fig. 13. Simulation 7. Volumetric gas fraction and flow pattern of liquid water at shallow depths and at differenttimes. Contour lines are plotted every 0.005 for gas fractions ranging from 0.02 to 0.065. Maximum flow rate is7.75 � 1025 kg m22 s21. Different patterns indicate lithologies, as shown in Figure 3, and highlight the gap through theclay layer at depth.
M. TODESCO & G. GIORDANO324
temperatures in the main reservoir do not necess-arily relate to a lack of a heat source at depth.
Surface degassing certainly depends on thestrength of the gas source at depth. A strongerinput at the base reflects as a larger degassing rateat the surface (Fig. 11). Also in this case, the rate at
which CO2 is released at the surface changes withthe structural setting and is larger in the case of astructural high. The stronger input also causes anenlargement of the two-phase region, and an increaseof the gas fraction, especially within the less-permeable layers. For the system properties and
Fig. 14. Simulation 7. (a) Temperature (8C) distribution at the steady state. Contour lines are plotted every 10 8C,for gas fractions ranging from 30 to 140 8C. The thick, black line indicates the extent of the two-phase zone. (b) Gas flowrate along the surface at different times.
MODELLING OF CO2 CIRCULATION 325
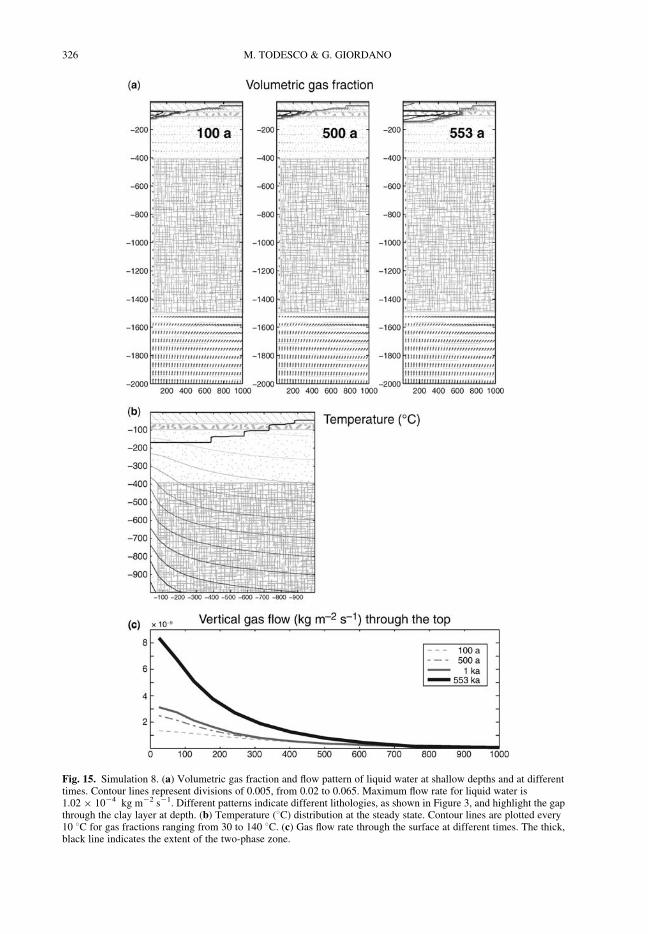
Fig. 15. Simulation 8. (a) Volumetric gas fraction and flow pattern of liquid water at shallow depths and at differenttimes. Contour lines represent divisions of 0.005, from 0.02 to 0.065. Maximum flow rate for liquid water is1.02 � 1024 kg m22 s21. Different patterns indicate different lithologies, as shown in Figure 3, and highlight the gapthrough the clay layer at depth. (b) Temperature (8C) distribution at the steady state. Contour lines are plotted every10 8C for gas fractions ranging from 30 to 140 8C. (c) Gas flow rate through the surface at different times. The thick,black line indicates the extent of the two-phase zone.
M. TODESCO & G. GIORDANO326
conditions considered here, however, the maximumgas fraction achieved is always very low, and thegas phase never saturates the pore space. Slightpressurization (up to þ0.6 � 105 Pa) occurs atshallow depths (,500 m), where the gas fractionincreases, for both structural settings.
Another interesting consideration arises from thesimulated times. Changes imposed at the base of thedomain require very long times to reach the surface(of the order of thousands of years). These times arenot consistent with the occurrence of suddenchanges (either in temperature or in flow rate), ashave been observed at various emission points inthe area. This discrepancy suggests that eitherthese fast changes occur where local rock propertiesallow a faster fluid migration, or they are driven bya much shallower source, such as a change in thehydraulic properties of the cap rocks.
In our simulations, the continuity of imperviouslayers is a fundamental key that controls the shallowfluid circulation. A gap in the shallow pisolitic layerintroduces major changes in the gas fraction and
phase distribution below the surface (Fig. 12).Degassing increases by more than one order ofmagnitude even if the rate of CO2 generation atdepth has not changed. In our simulation, the gapin the impervious layer is filled by the underlyingsand. This situation is meant to describe adamaged or fracture zone, or an impervious layerthat was originally discontinuous. Drilling of awater well would actually remove the porous rockand suddenly place the gas at the well head underatmospheric pressure. This process, not simulatedhere, is expected to have an even larger impact onthe dynamics of gas expansion and ascent, asshown by recent accidents in the area.
Our results also show that, with time, the circula-tion triggered by the uprising fluids culminates inflooding of the shallowest rock layer. As a result,degassing ceases where rocks become water satu-rated (Fig. 12). This particular phenomenon is dueto the boundary conditions imposed along the top,which allow a continuous feeding of cold water atthe surface. Even if not realistic, this behaviour
0 0.05 0.10 0.15−3000
−2500
−2000
−1500
−1000
−500
0Gas fraction
0 100 200−3000
−2500
−2000
−1500
−1000
−500
0Temperature (°C)
Initial highInitial lowSST highSST low
0 2 4 6−3000
−2500
−2000
−1500
−1000
−500
0CO2 partial pressure (MPa)(a) (b) (c)
Fig. 16. Simulations 7 and 8. Distribution of CO2 partial pressure (a, MPa), temperature (b, 8C) and volumetric gasfraction (c) with depth, along the symmetry axis, for the cases of a structural high and low. Dashed lines indicate thevertical profiles at the beginning of the simulations (shown in Fig. 7), and solid lines indicate steady-state values.
MODELLING OF CO2 CIRCULATION 327
well illustrates the sensitivity of surface degassingto the presence of liquid water. It is reasonable toexpect that drying of a shallow aquifer couldresult in a remarkable increase in gas emissions,which would be totally unrelated to the state ofthe volcano.
Finally, our results show that major effects areobserved if a gap exists through the main cap rockof the reservoir at depth. Hot, CO2-rich fluids canpropagate through the clay thanks to a permeablechannel-way, and freely expand within the shallowlayers. As a result, not only will the emission rateat the surface increase significantly (Figs 14–16),but the temperature distribution will also be affectedto shallow depths.
This result is consistent with the findings of highCO2 partial pressure reported within the NE–SW-trending Ardea graben. This area contradictsthe usual trends, in which major degassing occursat structural highs. The Ardea graben, however, isan active tectonic area, and degassing could beassociated with fracturing, which may dissect thePliocene clay aquiclude (Faccenna et al. 1994).
Although preliminary, our results are consistentwith the data and suggest that, upon appropriatecalibration, the model could provide importantinsights into the mechanism controlling diffusedegassing. Future improvements should involvethe simulation of complex three-dimensionaldomains, describing both structural highs and lowswithin the same simulation. Our results stress theneed for a detailed definition of the rock propertiesand of the subsurface rock sequences, in order todefine the location, size and geometry of aquicludesand permeable regions.
The integration of geophysical, volcanological,and monitoring data into a consistent physicalmodel represents a very promising approach toboth scientific and civil defence issues.
References
Amato, A. & Chiarabba, C. 1995. Earthquake occur-rence and crustal structure. In: Trigila, R. (ed.) TheVolcano of the Alban Hills. Tipografia SGS, Roma,193–211.
Amato, A., Chiarabba, C., Cocco, M., Di Bona, M. &Selvaggi, G. 1994. The 1989–1990 seismic swarmin the Alban Hills volcanic area, central Italy.Journal of Volcanology and Geothermal Research,61, 225–237.
Anzidei, M. et al. 2008. The Albano Maar Lake high res-olution bathymetry and dissolved CO2 budget (ColliAlbani volcano, Italy): Constrains to hazard evalu-ation. Journal of Volcanology and GeothermalResearch, 178, 258–268.
Barberi, F., Carapezza, M. L., Ranaldi, M. & Tarch-
ini, L. 2007. Gas blowout from shallow boreholes atFiumicino (Rome): induced hazard and evidence of
deep CO2 degassing on the Tyrrhenian margin ofCentral Italy. Journal of Volcanological and Geother-mal Research, 165, 17–31.
Beaubien, S. E., Ciotoli, G. & Lombardi, S. 2003.Carbon dioxide and radon gas hazard in the AlbanHills area (central Italy). Journal of Volcanologicaland Geothermal Research, 123, 63–80.
Bianchi, I., Piana Agostinetti, N., De Gori, P. &Chiarabba, C. 2008. Deep structure of the ColliAlbani volcanic district (central Italy) from receiverfunctions analysis. Journal of Geophysical Research,113, B09313, doi: 10.1029/2007JB005548.
Boni, C., Bono, P., Lombardi, S., Mastrorillo, L. &Percopo, C. 1995. Hydrogeology, fluid geochemistryand thermalism. In: Trigila, R. (ed.) The Volcanoof the Alban Hills. Tipografia SGS, Roma, 221–242.
Capelli, G., Mazza, R. & Gazzetti, C. 2006. Strumentie strategie per la tutela e l’uso compatibile della risorsaidrica nel Lazio: gli acquiferi vulcanici. PitagoraEditrice, Bologna, 191.
Carapezza, M. L., Badalamenti, B., Cavarra, L. &Scalzo, A. 2003. Gas hazard assessment in adensely inhabited area of Colli Albani Volcano (Cavadei Selci, Roma). Journal of Volcanological andGeothermal Research, 123, 81–94.
Carapezza, M. L., Barberi, F., Tarchini, L., Ranaldi,M. & Ricci, T. 2010. Volcanic hazards of the ColliAlbani. In: Funiciello, R. & Giordano, G. (eds)The Colli Albani Volcano. Geological Society,London, Special Publications of IAVCEI, 3, 279–297.
Carapezza, M. L. & Tarchini, L. 2007. Magmatic degas-sing of the Alban Hills volcano (Rome, Italy): geo-chemical evidence from accidental gas emission fromshallow pressurized aquifers. Journal ofVolcanological and Geothermal Research, 165, 5–16.
Chiarabba, C., Amato, A. & Delaney, P. T. 1997.Crustal structure, evolution, and volcanic unrest ofthe Alban Hills, central Italy. Bulletin of Volcanology,59, 161–170.
Chiodini, G. & Frondini, F. 2001. Carbon dioxide degas-sing from the Albani Hills volcanic region, CentralItaly. Chemical Geology, 177, 67–83.
Cioni, R., Guidi, M., Raco, B., Marini, L. & Gambar-
della, B. 2003. Water chemistry of Lake Albano(Italy). Journal of Volcanology and GeothermalResearch, 120, 179–195.
Conticelli, S., Boari, E. et al. 2010. Geochemistry,isotopes and mineral chemistry of the Colli Albanivolcanic rocks: constraints on magma genesis andevolution. In: Funiciello, R. & Giordano, G. (eds)The Colli Albani Volcano. Geological Society,London, Special Publications of IAVCEI, 3, 107–139.
Danese, E. & Mattei, M. 2010. The sedimentary sub-strate of the Colli Albani volcano. In: Funiciello,R. & Giordano, G. (eds) The Colli Albani Volcano.Geological Society, London, Special Publications ofIAVCEI, 3, 141–151.
De Benedetti, A. A., Funiciello, R., Giordano, G.,Diano, G., Caprilli, E. & Paterne, M. 2008. Volca-nology, history and myths of the Lake Albano maar(Colli Albani volcano, Italy). In: Cashman, K. &Giordano, G. (eds) Volcanoes and Human History.Journal of Volcanological and Geothermal Research,Special issue, 176, 387–406.
M. TODESCO & G. GIORDANO328
Di Filippo, M. & Toro, B. 1995. Gravity Features. In:Trigila, R. (ed.) The Volcano of the Alban Hills.Tipografia SGS, Roma, 213–219.
Duchi, V., Paolieri, M. & Pizzetti, A. 1991. Geochem-ical study on natural gas and water discharges in theSouthern Latium (Italy): circulation, evolution of fluidsand geothermal potential in the region. Journal of Vol-canological and Geothermal Research, 47, 221–235.
ENEL 1990. Esplorazione geotermica nel P.R. ColliAlbani. Internal Report, Pisa, 54.
Faccenna, C., Funiciello, R., Bruni, A., Mattei, M. &Sagnotti, L. 1994. Evolution of a transfer-relatedbasin: the Ardea basin (Latium, central Italy). BasinResearch, 5, 35–46.
Funiciello, R., Giordano, G. & De Rita, D. 2003. TheAlbano Maar Lake (Colli Albani volcano, Italy): recentvolcanic activity and evidence of pre-Roman Agecatastrophic lahar events. Journal of Volcanologyand Geothermal Research, 123, 43–61.
Gambardella, B. et al. 2004. Fluxes of deep CO2 inthe volcanic areas of central-southern Italy. Journal ofVolcanology and Geothermal Research, 136, 31–52.
Giggenbach, W. F., Minissale, A. A. & Scandiffio, G.1988. Isotopic and chemical assessment of geothermalpotential of the Colli Albani area, Latium, Italy.Applied Geochemistry, 3, 475–486.
Giordano, G. & The CARG Team 2010. Stratigraphy,volcano tectonics and evolution of the Colli Albanivolcanic field. In: Funiciello, R. & Giordano, G.(eds) The Colli Albani Volcano. Geological Society,London, Special Publications of IAVCEI, 3, 43–98.
Giordano, G., De Benedetti, A. A. et al. 2006. TheColli Albani mafic caldera (Roma, Italy): stratigraphy,
structure and petrology. Journal of Volcanology andGeothermal Research, Special issue ‘Explosive maficvolcanism’, 155, 49–80.
Mattei, M., Conticelli, S. & Giordano, G. 2010. TheTyrrhenian margin geological setting: from the Apen-nine orogeny to the K-rich volcanism. In: Funiciello,R. & Giordano, G. (eds) The Colli Albani Volcano.Geological Society, London, Special Publications ofIAVCEI, 3, 7–27.
Mazza, R. & Capelli, G. 2010. Hydrogeology of theColli Albani volcano. In: Funiciello, R. & Gior-
dano, G. (eds) The Colli Albani Volcano. GeologicalSociety, London, Special Publications of IAVCEI, 3,189–213.
Mongelli, F., Zito, G. et al.1991. Geothermal regimeof Italy and surrounding seas. In: Cermak, V. &Rybach, L. (eds) Terrestrial Heat Flow andthe Lithosphere Structure. Springer-Verlag, Berlin/Heidelberg, 381–394.
Pruess, K., Oldenburg, C. M. & Moridis, G. 1999.TOUGH2 User’s Guide, Version 2.0, ReportLBNL-43134, Lawrence Berkeley National Labora-tory, Berkeley, California.
Tuccimei, P., Giordano, G. & Tedeschi, M. 2006. CO2
release variations during the last 2000 years at theColli Albani volcano (Roma, Italy) from speleothemsstudies. Earth and Planetary Science Letters, 243,449–462.
Voltaggio, M. & Spadoni, M. 2009. Mapping of H2Sfluxes from the ground using copper passive samplers:an application study at Zolforata di Pomezia degassingarea. Journal of Volcanological and GeothermalResearch, 179, 56–68.
MODELLING OF CO2 CIRCULATION 329


