Embed Size (px)
Citation preview

MODELLING OF FRICTION PHENOMENA IN MATERIAL REMOVAL PROCESSES
F. Valiorgue1, J. Rech1, H.Hamdi1, C.Bonnet1, P. Gilles2, J.M. Bergheau1
1. LTDS-ENISE, France, 2. AREVA NP, France
ABSTRACT
The understanding and modelling of friction phenomena is really important for modelling analytically and numerically the cutting operations. To perform measurement in extreme conditions similar to machining conditions (high speeds, high pressures, high temperatures) a new generation of tribometer was designed. This experimental set up has been used to characterize the friction phenomena related to the machining of AISI 316L austenitic stainless steels with a TiN coated carbide insert.
This paper presents the method used to obtain a new model for the friction coefficient. This process is divided into two steps. Firstly the tribometer measures macroscopic forces induced in the pin. This is performed for various sliding speed and forces applied on the pin to obtain a large range of macroscopic friction coefficient. These data are then used to build and load a scratching numerical model implemented in ABAQUS® EXPLICIT software to extract the local friction coefficient from the macroscopic scratching forces ratio.
In this paper we describe the experimental set up used to obtain the macroscopic results, the numerical model implemented in ABAQUS® EXPLICIT and the results concerning the friction between TiN coated carbide tools and AISI 316L during turning operations. KEYWORDS: Tribometer, Finite Element Model, Friction, 316L, Turning operations. 1 INTRODUCTION:
The key objectives for scientists involved in machining studies are to predict the performance of cutting tools or to estimate finished surface integrity. Some authors have begun to propose models built to predict analytically or numerically the cutting operations. It appears that one of the most important phenomena to be modelled is the friction phenomena occurring at the tool-chip interface and tool-workpiece interface during the machining process. As reported several times in the scientific literature [1,2], it is well known that machining processes induce very strong thermal and mechanical loads at the second and third shear zones (Figure 1). Temperatures can reach 500 to 1000 °C, pressures are sometimes up to 2 Gpa and friction velocity goes from 1 m.s-1 to 10 m.s-1. Moreover it is obvious that each tribo-system (second shear zone and third shear zone) are “open tribo-systems” (as defined by Zambelli [3]), meaning that cutting tools rub continuously on a refreshed surface, since the chip is removed.
Proceedings of the 10th Advances in Materials and Processing TechnologiesOct. 7-11, 2007, Daejeon, Korea, pp. 976-985

Insert
Chip
Workpiece1
2
3
1. Primary Shear Zone
2. Secondary Shear Zone
3. Third Shear Zone
Cutting Edge
Speed
Insert
Chip
Workpiece1
2
3
1. Primary Shear Zone
2. Secondary Shear Zone
3. Third Shear Zone
Cutting Edge
SpeedSpeed
Figure 1: Localisation of the three shear zones during machining.
The final goal of this paper is thus to present an original method to identify an efficient friction model for the Finite Element Modelling (FEM) of cutting process. This will upgrade the prediction of residual stresses and tool’s wear.
The specifications for this model are: • Its accuracy in extreme conditions relevant with the cutting process. • Its accuracy in the context of an open tribo-system.
The context of this work deals with the dry machining of AISI 316L stainless steels with a TiN coated carbide tool. As a consequence, the friction model will be identified only for this application. 2 METHODOLOGY 2.1 Principle
The identification of the friction model is divided in two parts: The first step consists in collecting experimental data from friction tests performed in
extreme conditions. The tribometer used for these investigations is based on the principle of “pin-on-cylinder”. The pin is made of carbide, it is coated with TiN and its head is spherical (9 mm diameter). The cylinder is made of 316L. This “pin-on-cylinder” tribometer has been designed in order to reach the previous specifications (Figure 2). The system is integrated on a lathe to realise the rotation of the cylinder and create the feed of the pin. The pin rubs on the surface of the cylinder under a high normal force provided by a jack (200 to 1000 N). The output data of the tests are normal and tangential friction forces.
Proceedings of the 10th Advances in Materials and Processing TechnologiesOct. 7-11, 2007, Daejeon, Korea, pp. 976-985

Figure 2: Configuration of the new tribometer.
The second step consists in building a numerical model on the ABAQUS® EXPLICIT software which is supposed to simulate the previous scratching operation. The objective of this model is to identify the interfacial friction coefficient by fitting the numerical data with the experimental ones. This work is based on the following assumption: the tangential force is divided into a ploughing and an adhesion component as shown in figure 3. Thus the macroscopic scratching coefficient μ (ratio of the tangential force on the normal force) is decomposed into a ploughing coefficient μp and an interfacial friction coefficient μf.
Tangential forceFploughingFadhesion
Speed
Normal force
Pin
Cylinder
Tangential forceFploughingFadhesion
Speed
Normal force
Pin
Cylinder
FploughingFadhesion
Speed
Normal force
Pin
Cylinder
Figure 3: Decomposition of the tangential force.
The ploughing part of the tangential force is due to the workpiece material plastic strain under the pin while the adhesion is due to the interfacial friction coefficient.
Cylinder
Pin
Chuck
Kistler dynamometer
Jack system
Proceedings of the 10th Advances in Materials and Processing TechnologiesOct. 7-11, 2007, Daejeon, Korea, pp. 976-985

2.2 Numerical operations
The input values for the numerical model are: • the speed, • the normal and tangential forces.
The first step of this method is to find the real penetration depth corresponding to the
normal force applied by the pneumatic jack. Hence the penetration depth is increased until the real value of the normal force is reached.
Then the identification of the interfacial friction coefficient is realized by an iterative procedure as shown in Figure 4. The first simulation runs with an assumed interfacial coefficient. Depending on the result, its value is modified in order to fit the experimental macroscopic data within a minimum of iterations.
Scratch model with ABAQUS and fixed
interfacial coefficient
Fitting criteria
Macroscopic results obtain
with the tribometer
NO
YES
Extraction of the interfacial
friction coefficient
Optimization algorithm
Measured values Simulated values
Scratch model with ABAQUS and fixed
interfacial coefficient
Fitting criteria
Macroscopic results obtain
with the tribometer
NO
YES
Extraction of the interfacial
friction coefficient
Optimization algorithm
Measured values Simulated values
Scratch model with ABAQUS and fixed
interfacial coefficient
Fitting criteria
Macroscopic results obtain
with the tribometer
NO
YES
Extraction of the interfacial
friction coefficient
Optimization algorithm
Measured values Simulated values
Figure 4: Algorithm for the numerical determination of the interfacial friction coefficient.
The different speeds are set around the industrial value to observe its impact on the friction phenomena. 3 EXPERIMENTAL RESULTS
The industrial context gives a cutting speed of 1 m.s-1. Therefore the friction tests have been performed around this value.
Concerning the normal force applied on the pin, three different values have been used to change pressures under the pin’s head [4]. Table 1shows the 6 couples of conditions used for this round of tests.
Proceedings of the 10th Advances in Materials and Processing TechnologiesOct. 7-11, 2007, Daejeon, Korea, pp. 976-985

0,5 1 1,5400 Couple 1 Couple 2 Couple 3
1000 Couple 4 Couple 5 Couple 6Normal forces (N)
Sliding speeds (m.s-1)
Table 1: Matrix of the 6 experimental conditions.
Each test was performed three times to estimate the deviation of the friction coefficient values (± 0.02 for both parameters). Figure 5 shows an example of the normal and tangential forces obtained with the kistler dynamometer. The macroscopic friction coefficient is calculated by dividing the two average components .
Figure 5: Macroscopic Friction coefficient determination.
This operation is repeated for each combination of parameters and Figure 6 summarises the macroscopic friction coefficients found.
0,5
1
1,5
4001000
0,72
0,51
0,33
0,8
0,68
0,53
00,10,20,30,40,50,6
0,7
0,8
Macroscopic coefficient
Sliding speed (m.s-1) Normal forces (N)
Figure 6: Macroscopic friction coefficient values depending on sliding speed and normal force.
Proceedings of the 10th Advances in Materials and Processing TechnologiesOct. 7-11, 2007, Daejeon, Korea, pp. 976-985

4 NUMERICAL MODEL 4.1 Numerical model presentation
This chapter describes the scratching model implemented in ABAQUS® EXPLICIT and used to identify the interfacial friction coefficient. 4.1.1 Geometry of the model
The numerical model is composed of the pin’s head and a part of the AISI 316L cylinder (Figure 7). The pin’s head is spherical with a diameter of 9 mm. It is composed of 6416 tetrahedral elements. The cylinder is made of 10760 hexagonal elements. To obtain accurate results elements under the pin are smaller than others and have a size of 50µm. The nodes of the tube’s bottom are constrained and the speed is applied to the nodes of the pin’s head.
6 mm
10 mm
1.5 mmPin’s head
Tube
6 mm
10 mm
1.5 mmPin’s head
Tube
Figure 7: Geometry of numerical model.
4.1.2 Mechanical modelling of the pin’s head The pin is made of tungsten carbide. Due to its very high young modulus, yield stress is
never reached hence it is supposed to be only elastic. The material values are presented in Table 2 [5].
E ν ρ
630 GPa 0,22 12,9.10-3 g.mm-3
Table 2: Mechanical properties of tungsten carbide.
4.1.3 Mechanical modelling of the tube The Johnson - Cook behaviour model has been chosen to implement its mechanical
behaviour under high strain rates and high temperatures [6]. This model integrates strain hardening (I), sensitivity to the strain’s speed (II), and thermal softening (III).
Proceedings of the 10th Advances in Materials and Processing TechnologiesOct. 7-11, 2007, Daejeon, Korea, pp. 976-985

( ) 0
00
. 1 .ln . 1m
n
F
T TA B C
T Tεσ εε
⎡ ⎤⎡ ⎤⎛ ⎞ ⎛ ⎞−⎡ ⎤ ⎢ ⎥= + + −⎢ ⎥⎜ ⎟ ⎜ ⎟⎜ ⎟⎢ ⎥⎣ ⎦ −⎢ ⎥⎢ ⎥ ⎝ ⎠⎝ ⎠⎣ ⎦ ⎣ ⎦
&
&
I II III
The parameters used for 316L are described in Table 3.
A B n C 0ε& m 0T fT 514 514 0,508 0,0417 1 0,533 293 K 1450 K
Table 3: Johnson - Cook parameters for AISI 316L.
The mechanical characteristics of 316L are presented in Table 4.
E ν ρ 175 500 MPa 0,3 7,7.10-7 kg.mm-3
Table 4: Mechanical properties of AISI 316L. 4.1.4 Thermal modelling
The mechanical model is coupled to a thermal one. Computation for temperature are based on the following model.
( ) ( ). . . 0, 9. :P pC T div gradTρ λ σ ε− =uuuuur
&
Where: ρ : is the apparent density,
PC : is the mass heat capacity (J.kg-1.K-1), T : is the temperature (°C), λ : is the heat conductivity (W.m-1.K-1),
σ : is the stress tensor,
pε& : is the strain rate tensor, 0,9 : is the thermal and mechanical dissipation ratio. 5 NUMERICAL MODEL RESULTS
Firstly the penetration depth is set up to reach the expected normal force and then numerical macroscopic friction coefficients can be calculated. To reach this purpose the macroscopic forces are extracted and divided as in the experimental procedure. This is done for the six couplse of values.
Iterations are then made until macroscopic coefficients reach experimental values. The curve below (Figure 9) shows the evolution of the macroscopic coefficient depending on the interfacial friction coefficient.
(1)
(2)
Proceedings of the 10th Advances in Materials and Processing TechnologiesOct. 7-11, 2007, Daejeon, Korea, pp. 976-985
Input value: Interfacial coefficient
Results for Fn=400 N and speed= 0.5 m.s-1
Oup
ut v
alue
: mac
rosc
opic
coe
ffic
ient
Measured value
Fitting value
Input value: Interfacial coefficient
Results for Fn=400 N and speed= 0.5 m.s-1
Oup
ut v
alue
: mac
rosc
opic
coe
ffic
ient
Measured value
Fitting value
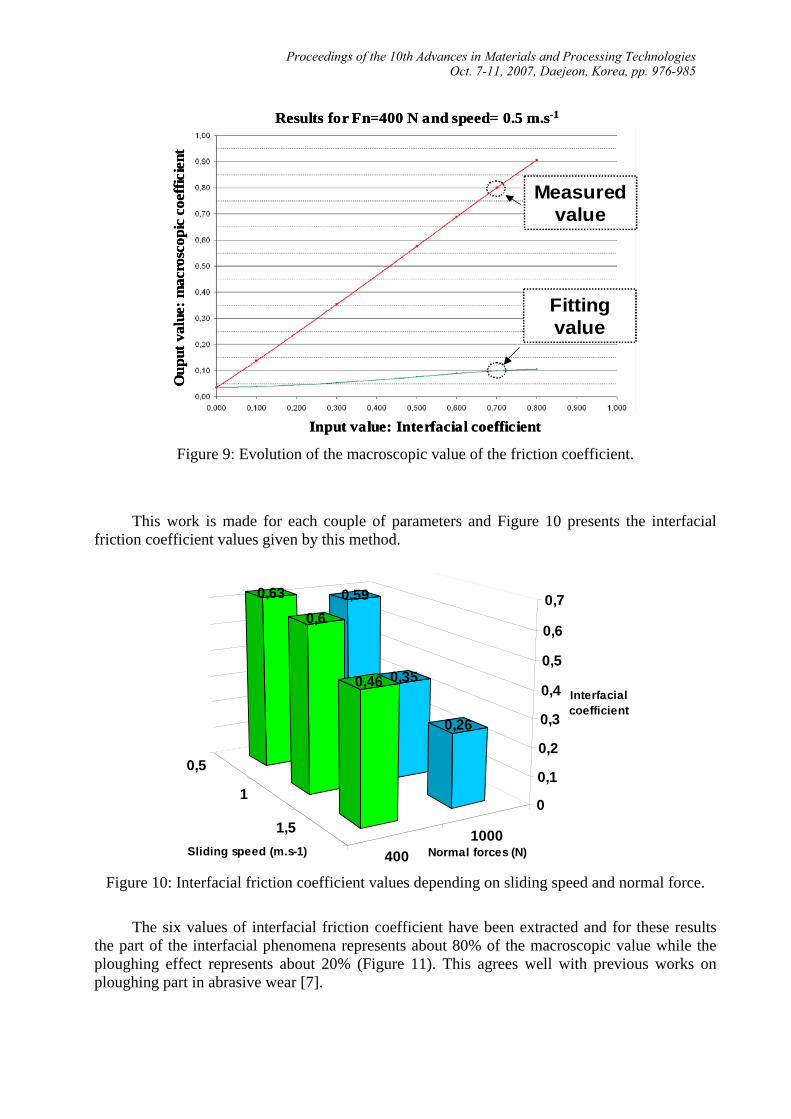
Figure 9: Evolution of the macroscopic value of the friction coefficient.
This work is made for each couple of parameters and Figure 10 presents the interfacial friction coefficient values given by this method.
0,5
1
1,5
4001000
0,59
0,35
0,26
0,63
0,6
0,46
0
0,1
0,2
0,3
0,4
0,5
0,6
0,7
Interfacial coefficient
Sliding speed (m.s-1) Normal forces (N)
Figure 10: Interfacial friction coefficient values depending on sliding speed and normal force.
The six values of interfacial friction coefficient have been extracted and for these results the part of the interfacial phenomena represents about 80% of the macroscopic value while the ploughing effect represents about 20% (Figure 11). This agrees well with previous works on ploughing part in abrasive wear [7].
Proceedings of the 10th Advances in Materials and Processing TechnologiesOct. 7-11, 2007, Daejeon, Korea, pp. 976-985

Ratio between adhesive and macroscopic values
0
0,1
0,2
0,3
0,4
0,5
0,6
0,7
0,8
0,9
1
1 2 3 4 5 6
Couple of values
Rat
io ratioaverage value
Figure 11: Ratio between adhesive and macroscopic values
Beside to ensure the validity of the fitted values the shape of the residual groove is compared to the ones obtain with the FEM. The half of the numerical shape is plotted with MATLAB® with the ABAQUS® results. The picture below (Figure 1) shows the two results obtain for on couple of value: F=1000N and V=1.5 m.s-1.
Plane o
f
symmetr
y
Half of groove about 500 µm
Plane o
f
symmetr
y
Half of groove about 500 µm
Figure 12: Measurements of residual grooves: numerical on the left, experimental on the right.
The difference between experimental and numerical results is under 20% that is not bad compared to the sophistication of the model.
Proceedings of the 10th Advances in Materials and Processing TechnologiesOct. 7-11, 2007, Daejeon, Korea, pp. 976-985

6 CONCLUSION
This paper presents a new method for the determination of the interfacial friction coefficient between 316L and TiN coated tools. The main idea of this project is to make FEM of metal cutting more precise. This work involves experimental results obtained with a high performance tribometer and a FEM implemented in ABAQUS® EXPLICIT. The first macroscopic and numerical results show the possibilities of the method. It is possible to obtain a realistic interfacial friction coefficient between this two materials.
Our present work is to replace the sliding speed by the temperature at the interface between pin and cylinder and to change normal force into pressure under the pin’s head. A friction model depending on pressure and temperature will then help us to model cutting operation and residual stresses generation more accurately. 7 REFERENCES [1] E.M. Trent, Metal Cutting, Edition Butterworth Heinemann (1991). [2] D. Buryta, Stress distributions on the rake face during orthogonal machining, Int. Jour. Mach.
Tools Manuf (1991), 721-739. [3] G. Zambelli, Matériaux et contacts, Presses polytechniques et universitaires romandes (1998). [4] F. Zemzemi, Characterization of the friction properties at the tool-chip-workpiece interfaces
during the high speed dry machining of steels, Proceeding of the 5th International Conference on High Speed Machining (2006).
[5] Sandvick, Internal report (1999). [6] T. Özel, Determination of Work Material Flow Stress and Friction Properties for FEA of
Machining Using Orthogonal Cutting Tests, Journal of Materials Processing Technology (2004), 1019-1025.
[7] G. Kermouche, Experimental and numerical study of the ploughing part of abrasive wear (2003), Wear 255 30-37.
Proceedings of the 10th Advances in Materials and Processing TechnologiesOct. 7-11, 2007, Daejeon, Korea, pp. 976-985