Embed Size (px)
Citation preview

Modelling Si–N-limited growth of diatoms
Kevin J.Flynn and Veronique Martin-Jézéquel1
Ecology Research Unit, School of Biological Sciences, University of WalesSwansea, Singleton Park, Swansea SA2 8PP, UK and 1UMR 6539, CNRS,Université de Bretagne Occidentale, Institut Universitaire Européen de la Mer,Technopole Brest-Iroise, Place Nicolas Copernic, F-29280 Plouzane, France
Abstract. A mechanistic model for silicon (Si) physiology is developed, interfaced with a model ofnitrogen (N) physiology, which is capable of simulating the major documented facets of Si–N physi-ology in diatoms. The model contains a cell cycle component that is involved in regulating the timingof the synthesis of valves, girdles and setae. In addition to reproducing the timing of diatom celldivision within a light–dark cycle, the model simulates the following features seen in real diatoms.Synthesis of valves only occurs during G2 interphase and M, while the girdles and (if appropriate)setae are synthesized during G1. Si stress alone results in a loss of setae, followed by a thinning of thevalves in successive generations until a minimum Si cell quota is attained. After this point, theduration of G2 increases and growth is Si limited. Concurrently, the carbon (C) cell quota increases,offering the capability to simulate the documented increase in sinking rates with Si stress. N stressalone results in an increase in the duration of G1 and G2 interphases, and high Si cell quotas. Fromthis complex model, which must be run for arrays of subpopulations to simulate non-synchronousgrowth, a simpler model is developed. This is capable of reproducing similar growth dynamics,although with no reference to component parts of the frustule. When allied to a photoacclimativesubmodel, a prediction of the model is that diatoms starved of Si will release increased amounts ofdissolved organic C because cell growth is halted more rapidly than the photosystems can bedegraded.
Introduction
Silicate metabolism in diatoms is inextricably linked to the regulation of cellgrowth and division (Volcani, 1978; Martin-Jézéquel et al., 2000), and criticallythe formation of new valves in the daughter cells (Crawford, 1981; Volcani, 1981;Pickett-Heaps et al., 1990; Martin-Jézéquel et al., 1997). Orthosilicic acid uptakeas well as silica deposition into the valves are mainly confined to part of the cellcycle, just before (G2 interphase) and during mitosis (Brzezinski, 1992; Brzezin-ski and Conley, 1994; Schmid, 1994). Only the formation of girdle bands and setaeoccurs during the G1 interphase.
Silicon (Si) incorporation into the frustule follows several steps involving a freeSi pool and a few proteins; a major regulatory step is the uptake phase (Martin-Jézéquel et al., 2000). The silicification process is not energetically expensive, anddoes not require concurrent photosynthesis (Raven, 1983; Sullivan, 1986; Martin-Jézéquel et al., 2000). Silicon metabolism is thus very different from nitrogen (N)metabolism. The latter is closely coupled to carbon (C) metabolism and, especi-ally during nitrate assimilation, to the provision of reductant either directly asphotoreductant or via C catabolism.
The cellular content of Si and the rate of entry of Si vary with the stage of thecell cycle. Under limitations that prolong G2 [e.g. light, temperature, N, iron (Fe)],the increased period available for Si uptake enables a heavier silicification of thecells [(Martin-Jézéquel et al., 2000) and references therein]. Si limitation itself
Journal of Plankton Research Vol.22 no.3 pp.447–472, 2000
447© Oxford University Press 2000
at HO
TE
L D
IEU
CE
NT
RE
DO
C M
ED
ICA
LE
on Novem
ber 7, 2013http://plankt.oxfordjournals.org/
Dow
nloaded from
at HO
TE
L D
IEU
CE
NT
RE
DO
C M
ED
ICA
LE
on Novem
ber 7, 2013http://plankt.oxfordjournals.org/
Dow
nloaded from
at HO
TE
L D
IEU
CE
NT
RE
DO
C M
ED
ICA
LE
on Novem
ber 7, 2013http://plankt.oxfordjournals.org/
Dow
nloaded from
at HO
TE
L D
IEU
CE
NT
RE
DO
C M
ED
ICA
LE
on Novem
ber 7, 2013http://plankt.oxfordjournals.org/
Dow
nloaded from
at HO
TE
L D
IEU
CE
NT
RE
DO
C M
ED
ICA
LE
on Novem
ber 7, 2013http://plankt.oxfordjournals.org/
Dow
nloaded from
at HO
TE
L D
IEU
CE
NT
RE
DO
C M
ED
ICA
LE
on Novem
ber 7, 2013http://plankt.oxfordjournals.org/
Dow
nloaded from
at HO
TE
L D
IEU
CE
NT
RE
DO
C M
ED
ICA
LE
on Novem
ber 7, 2013http://plankt.oxfordjournals.org/
Dow
nloaded from
at HO
TE
L D
IEU
CE
NT
RE
DO
C M
ED
ICA
LE
on Novem
ber 7, 2013http://plankt.oxfordjournals.org/
Dow
nloaded from
at HO
TE
L D
IEU
CE
NT
RE
DO
C M
ED
ICA
LE
on Novem
ber 7, 2013http://plankt.oxfordjournals.org/
Dow
nloaded from
at HO
TE
L D
IEU
CE
NT
RE
DO
C M
ED
ICA
LE
on Novem
ber 7, 2013http://plankt.oxfordjournals.org/
Dow
nloaded from
at HO
TE
L D
IEU
CE
NT
RE
DO
C M
ED
ICA
LE
on Novem
ber 7, 2013http://plankt.oxfordjournals.org/
Dow
nloaded from
at HO
TE
L D
IEU
CE
NT
RE
DO
C M
ED
ICA
LE
on Novem
ber 7, 2013http://plankt.oxfordjournals.org/
Dow
nloaded from
at HO
TE
L D
IEU
CE
NT
RE
DO
C M
ED
ICA
LE
on Novem
ber 7, 2013http://plankt.oxfordjournals.org/
Dow
nloaded from
at HO
TE
L D
IEU
CE
NT
RE
DO
C M
ED
ICA
LE
on Novem
ber 7, 2013http://plankt.oxfordjournals.org/
Dow
nloaded from
at HO
TE
L D
IEU
CE
NT
RE
DO
C M
ED
ICA
LE
on Novem
ber 7, 2013http://plankt.oxfordjournals.org/
Dow
nloaded from
at HO
TE
L D
IEU
CE
NT
RE
DO
C M
ED
ICA
LE
on Novem
ber 7, 2013http://plankt.oxfordjournals.org/
Dow
nloaded from
at HO
TE
L D
IEU
CE
NT
RE
DO
C M
ED
ICA
LE
on Novem
ber 7, 2013http://plankt.oxfordjournals.org/
Dow
nloaded from
at HO
TE
L D
IEU
CE
NT
RE
DO
C M
ED
ICA
LE
on Novem
ber 7, 2013http://plankt.oxfordjournals.org/
Dow
nloaded from
at HO
TE
L D
IEU
CE
NT
RE
DO
C M
ED
ICA
LE
on Novem
ber 7, 2013http://plankt.oxfordjournals.org/
Dow
nloaded from
at HO
TE
L D
IEU
CE
NT
RE
DO
C M
ED
ICA
LE
on Novem
ber 7, 2013http://plankt.oxfordjournals.org/
Dow
nloaded from
at HO
TE
L D
IEU
CE
NT
RE
DO
C M
ED
ICA
LE
on Novem
ber 7, 2013http://plankt.oxfordjournals.org/
Dow
nloaded from
at HO
TE
L D
IEU
CE
NT
RE
DO
C M
ED
ICA
LE
on Novem
ber 7, 2013http://plankt.oxfordjournals.org/
Dow
nloaded from
at HO
TE
L D
IEU
CE
NT
RE
DO
C M
ED
ICA
LE
on Novem
ber 7, 2013http://plankt.oxfordjournals.org/
Dow
nloaded from
at HO
TE
L D
IEU
CE
NT
RE
DO
C M
ED
ICA
LE
on Novem
ber 7, 2013http://plankt.oxfordjournals.org/
Dow
nloaded from
at HO
TE
L D
IEU
CE
NT
RE
DO
C M
ED
ICA
LE
on Novem
ber 7, 2013http://plankt.oxfordjournals.org/
Dow
nloaded from
at HO
TE
L D
IEU
CE
NT
RE
DO
C M
ED
ICA
LE
on Novem
ber 7, 2013http://plankt.oxfordjournals.org/
Dow
nloaded from

seems to be the only condition of growth directly related to a decreased silicifi-cation of the frustules (Paasche, 1973a; Brzezinski et al., 1990).
Within diatoms, Si is required in broadly equimolar amounts to N. As theconcentrations of nitrate and silicate in sea water at the start of the temperatewater production cycle are often also similar, there is clearly a potential for co-nutrient limitation of diatom growth. Further, because the regeneration of Si is aslow process in comparison with the rapid cycling of N and phosphorus (P), domi-nated by dissolution of Si from frustules, post-spring bloom growth of diatoms islikely to become rate limited by Si. Hence non-diatom species may come to domi-nate the phytoplankton population (Officer and Ryther, 1980; Egge and Aksnes,1992; Conley et al., 1993). Modelling Si–N interactions adequately would thus aidthe simulation of phytoplankton succession.
Attempts to model Si-limited growth have been hampered by the fact that Sinutrition is rather different to that of other nutrients. As the nutrient is primarilyrequired for a critical phase of growth, the amount of Si in the cell does not relatesimply to growth rate (Davis et al., 1978). The model of Brzezinski employed cellcycle events to demonstrate the steady-state interactions between silicate and cellgrowth (Brzezinski, 1992). However, that model is not suited for placementwithin a dynamic modelling scenario, especially one that should ideally also becapable of simulating Si–N co-limitation within a light–dark cycle as wouldusually occur in nature. To date only one model, that of Davidson and Gurney,has attempted to simulate Si–N co-limitation (Davidson and Gurney, 1999). Intheir model, the individual nutrient limitations were handled using quota models.It was found that using threshold, additive or multiplicative mechanisms tocombine the individual quota controls to give a final control of growth wereunsuitable; Davidson and Gurney developed a more complex, sigmoidal,mechanism (Davidson and Gurney, 1999). While their model is compact, itcannot simulate changes in the C cell quota that occur during Si stress and affectthe important process of diatom sedimentation (Bienfang et al., 1982).
A series of mechanistic models has now been developed that can simulateinteractions between ammonium and nitrate (Flynn and Fasham, 1997; Flynn etal., 1997), N nutrition and light (Flynn and Flynn, 1998; Geider et al., 1998), andiron–light–ammonium–nitrate (Flynn and Hipkin, 1999). These models allcontain elements of metabolic regulation with recognizable parallels in cell physi-ology. As a consequence, they offer dynamic reviews of our knowledge of algalphysiology and may thus be useful tools in hypothesis setting and experimentdesign.
The aim of this work was to develop a mechanistic model for Si physiology thatis compatible with the previously developed mechanistic models, specifically withthe ammonium–nitrate interaction model (ANIM) of Flynn et al. (Flynn et al.,1997). This new dynamic model simulates the synthesis of frustules, girdles andsetae and, like the steady-state model of Brzezinski (Brzezinski, 1992), employsa cell cycle component. We then present a simplified alternative model that, whileit does not reproduce all the subtleties of the full model, offers a compromise suit-able for more routine use, still reproducing the important facets of Si assimilationand interaction with N.
K.J.Flynn and V.Martin-Jézéquel
448

Construction of the complex model
The main model consists of six levels (state variables), describing the C biomassand cell numbers in a volume of water, and the cell-specific content of four inter-nal Si pools. The latter are dissolved (DSi) and particulate pools for Si in thevalves (VSi), girdles (GSi) and setae (SSi). DSi describes all Si within the cell notcurrently part of the structure. Definitions and values for constants are given inTable I.
Various processes require feedback operations. These employ rectangularhyperbolic (Michaelis–Menten type) or sigmoidal functions that are normalizedto maximum pool sizes allowing ready modification of those pool sizes. Half-saturation constants in normalized rectangular hyperbolic equations, typically0.05, are chosen to enable rate processes to continue at optimal (often maximal)rates until near the limit of pool size without having to resort to using very smallintegration steps in the simulation to control the final feedback action. The useof sigmoidal functions to regulate complex feedback processes is explained inFlynn et al. (Flynn et al., 1997). Generally, these functions allow smoother feed-back operations to be achieved than if simple rectangular hyperbolic functionsare employed. Sigmoidal functions are also more appropriate where allosteric orother complex interactive processes are being summarized by a single equation.
Modelling Si–N-limited diatom growth
449
Table I. Values of constants for the complex (C) and simple (S) models
Constant Model Value Unit Comment
Ccellmax C 75 pg C cell–1 maximum possible cell sizeCcellmin C 25 pg C cell–1 minimum possible cell size DSidiv C 2.5 pg Si cell–1 minimum size of DSi to allow valve construction
(set as the minimum possible Si cell quota) DSimax C 12.5 pg Si cell–1 size of DSi that transinhibits transport via the
primary Si transporter (set at the maximumpossible value for valve Si, VSi)
DSimax2 C 0.6 pg Si cell–1 size of DSi that transinhibits transport via theG1Si transporter (set at the maximum possibleDSi value during G1 interphase). Must be lessthan GSimax
G9max C 0.0132 Si C–1 maximum girdle Si:CG9min C 0 Si C–1 minimum girdle Si:CG2Tmin C 0.0833 day minimum period of G2 interphase (= 2 h)GSimax C 1 pg Si cell–1 maximum amount of Si in girdlesMT C 0.0625 day period of M phase (= 1.5 h)SiKt C 4 µM Si half-saturation constant for Si transport via the
primary Si transporterSiKt2 C 8 µM Si half-saturation constant for Si transport via the
G1 Si transporterSSimax C 5 pg Si cell–1 maximum amount of Si in setaeµmax C 2.9 day–1 maximum theoretical growth rate
Ccellmax S 75 pg C cell–1 maximum possible cell sizeCcellmin S 35 pg C cell–1 average minimum cell size of populationSiKg S 0.345 µM half-saturation constant for Si-dependent growthSiCellmax S 30 pg Si cell–1 maximum Si quotaSiCellmin S 7 pg Si cell–1 minimum Si quotaµmax S 2.9 day–1 maximum theoretical growth rate

The power and constants used in these sigmoidal functions were chosen byinspection to achieve a robust operation of the model consistent with the behav-iour of diatoms as recorded in the literature.
Several of the following equations contain conditional statements operating byBoolean logic (i.e. if the condition is true then the value is 1, else it is 0).
The assimilation of Si is critically dependent on the cell cycle. In the model, asin reality [(Brzezinski and Conley, 1994) and references therein], the regulatoryphase for valve formation is considered to be G2, and that for the setae and thegirdle bands is G1. The actual construction of the cell cycle simulator will differdepending on the simulation platform; however, in essence it contains two timers:one for the duration of G2 and one for M. The operation of the model cycle isdescribed below.
Following cell division, the cell is in G1 phase, in which the bulk of cell growthoccurs. The duration of G1 depends primarily on the availability of nutrients otherthan Si, including light for phototrophs. S phase, when DNA is synthesized, is notmodelled per se but is included with G1. In the model, the trigger for the nextdivision is set by the C cell quota (Ccell); thus, the cell cycle cannot exit G1 andS phases unless the cell size is at least twice the minimum size of a new daughtercell (i.e. 2 · Ccellmin). In Boolean terms:
exit G1S = (Ccell ≥ 2 · Ccellmin) (1)
Under the influence of nutrient limitation, the cell cycle may be prolonged orarrested prior to this trigger point. (The trigger could be co-controlled by criticallevels of other nutrients such as N and/or P.) Once this stage is passed, the cell isin G2 and the G2 timer is started. The minimum period of this phase in the modelis described by the parameter G2T. During this period, the most rapid phase ofSi transport is initiated, with Si accumulated to support the synthesis of newvalves.
The size of DSi varies up to a maximum level DSimax. At the point in time justbefore the use of DSi in the synthesis of VSi, DSi must contain sufficient Si tomake new VSi for the next cell generation. The relative size of DSi (RelP) isdescribed by:
DSiRelP = –––––– (2)
DSimax
Si transport (SiT) for the support of valve synthesis is described by:
ExtSi (1 – RelP) · 1.05SiT = µmax · 3 · DSimax · ––––––––––– · –––––––––––––– · (cell cycle = (G2,M)) (3)
(ExtSi + SiKt) (1 – RelP) + 0.05
The maximum rate of transport is normalized to µmax, the maximum theoreti-cal rate of cell growth, and is sufficient to enable the transport of the required Siwithin a portion of the whole cell cycle (hence reference to 3 · DSimax). As µmax
K.J.Flynn and V.Martin-Jézéquel
450

and DSimax are used as scalars, the model can be reconfigured readily for differ-ent maximum growth rates and Si content for the valves. Transport is a functionof a standard Michaelis–Menten equation with reference to the external Siconcentration (ExtSi) and the half-saturation constant for transport, SiKt.Brzezinski and Martin-Jézéquel et al. argue that the value of SiKt is considerablyhigher than may be estimated from experimental studies of transport into asyn-chronous cell suspensions because transport is confined to only a portion of thecell cycle (Brzezinski, 1992; Martin-Jézéquel et al., 2000). Following the data inBrzezinski (Brzezinski, 1992), we set SiKt at 4 µM. The transport rate is moder-ated (transinhibited) by the size of DSi, via the value of RelP [which variesbetween 0 and 1; equation (2)], using a hyperbolic function with a half-saturationconstant of 0.05. Thus, as DSi approaches DSimax, transport is halted, while cellsthat are Si stressed will maintain a higher transport potential for a greater period.The Boolean term in equation (3) allows transport of Si for valve synthesis onlywhen the cell is in the G2 or M phases of the cell cycle.
During growth limitation by all nutrients, the period of cell cycle phasesincreases, some proportionately more so than others. Thus, while the majorchange during N stress is the prolonging of G1, the duration of G2 also lengthens(Olson et al., 1986). A result of this is that there is a longer period of Si transportin cells subjected to N stress. Such cells have higher Si cell quotas than N-repletecells (Harrison et al., 1976; Martin-Jézéquel et al., in preparation). To simulate thisevent, the period of G2T can be made a variable, related to the N:C status. In theabsence of experimental data sets relating the period of the G2 interphase to theN status, we use a simple linear function. Thus:
G2T = G2Tmin · (1 + f · (1 – Qmu)) (4)
where G2Tmin is the minimum period of G2T (set here to 2 h), Qmu is an indexof the N:C status with a value between 0 and 1 for poor to high values of cellularN · C–1 [see equation (2) in (Flynn et al., 1999)], and f is a scalar (set here to 3 toenable the period of G2T to vary over a range of 1–4, in this instance givingperiods of 2–8 h). More complex, non-linear equations could be substituted.
Once the period of time defined by G2T has elapsed the cycle still cannot exitG2, to enter M phase, unless a critical amount of Si is available within the cell forsynthesis of new valves. This critical value is set by DSidiv, which describes theminimum amount of Si required for the synthesis of two new valves (in practice,the value of DSidiv will be close to the minimum Si cell quota). In Boolean terms:
exit G2 = (G2 timer > G2T) · (DSi ≥ DSidiv) (5)
If the external level of Si is high, then the amount of Si accumulated after theperiod set by G2T may be significantly more than this minimum level. Valves willthen be relatively thick. However, if there is insufficient Si available, then the cellcycle is suspended at this stage (i.e. in G2) and C growth must be slowed or halted;this aspect is considered below. Assuming that the condition is met and equation(5) is satisfied, the final part of the cycle (M phase) is entered and a timer started
Modelling Si–N-limited diatom growth
451

of duration MT. During this time, the synthesis of valves (VSis) occurs [see thetext for equation (8)] and cells divide.
Cell division occurs over a fraction of the cell cycle. If division occurred over1 day, the rate of increase would be 0.693 day–1, or Ln(2). When division occursover a fraction of a day, MT, the cell-specific growth rate (cellµ) is given by:
cellµ = Ln(21/MT) · (cell cycle = M) (6)
The increase in cell numbers, which only occurs during the M phase of the cellcycle, is:
d— · cell = cell · cellµ (7)dt
VSis occurs concurrently with cell division, during M phase. We argue that themaximum amount of Si taken in during G2 must be capable of being convertedinto VSi during M phase. Accordingly, the maximum possible rate of VSis hasbeen set as two times that for transport as the duration of M phase (MT) isapproximately half of the minimum duration of G2 phase (G2T). The value ofVSis (g Si cell–1) is, like transport, made a function of the size of DSi via RelP[equation (2)], normalizing it to DSimax using a half-saturation constant of 0.05.Thus:
RelP · 1.05VSis = µmax · 6 · DSimax · ————— · (cellµ > 0) (8)
RelP + 0.05
The cell now enters G1 phase again, the major period of cell growth. Duringthe growth of diatoms in G1, girdles of additional Si are deposited to allow forthe increase in cell volume. Insufficient Si for girdles must restrict C growth (Cµ).In those species of diatom that have setae, these are also synthesized during G1.However, setae are of secondary importance, their synthesis having no knowndirect implications for cell or C growth. The loss of setae is one of the first symp-toms of Si stress (Paasche, 1980a; Brzezinski et al., 1990).
There are several transporters for Si in diatoms (Hildebrand et al., 1997, 1998)and the Kt for Si transport is reported to change during the cell cycle (Sullivan,1977). Thus, a high-affinity (low Kt) system operates during G2, with a lower affin-ity system present at other times. If the enhancement of Si transport that occursduring G2 and M phases was due solely to the synthesis of additional transportproteins, then Kt would not alter. We thus have an additional input into DSi tosupport synthesis of girdles and setae. The Si transporter that operates during G1could be set only to operate during the G1 phase, or (as here) it could operate allthe time, although transinhibition would come into force at a level of DSi abovea certain level (DSimax2). The rate of Si transport via the G1 Si transporter, G1SiT,is set as:
K.J.Flynn and V.Martin-Jézéquel
452
ExtSiG1SiT = µmax · (GSimax + SSimax) · ––––––––––––
ExtSi + SiKt2(9)
DSi11 – 1 ––––––– 22 · 1.05DSimax2· ––––––––––––––––––– · (DSi ≤ DSimax2)DSi
1 – 1–––––––2 + 0.05DSimax2
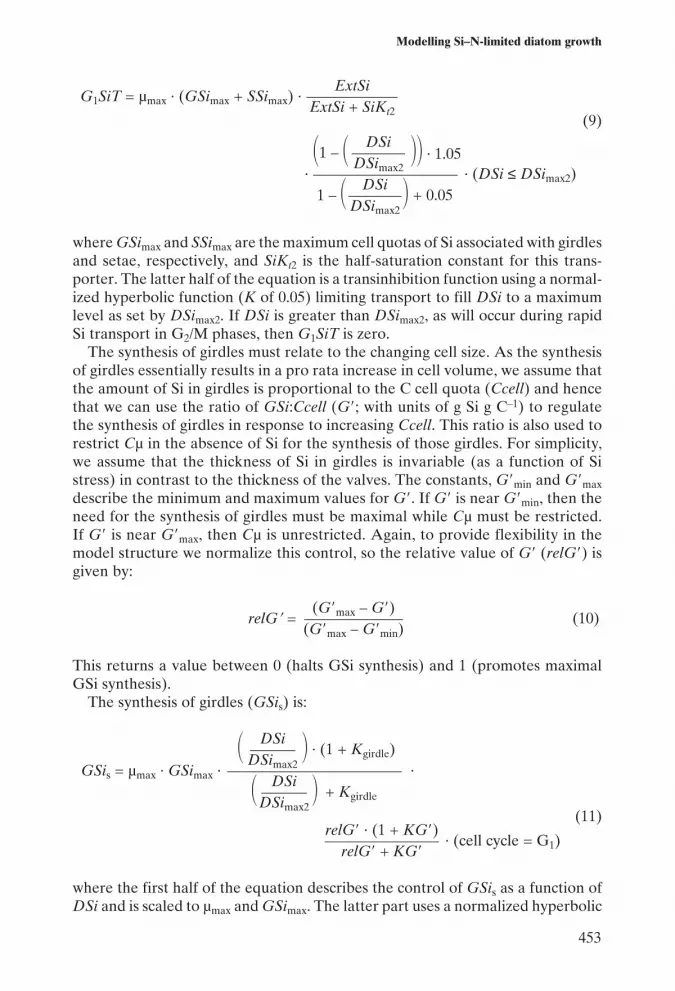
where GSimax and SSimax are the maximum cell quotas of Si associated with girdlesand setae, respectively, and SiKt2 is the half-saturation constant for this trans-porter. The latter half of the equation is a transinhibition function using a normal-ized hyperbolic function (K of 0.05) limiting transport to fill DSi to a maximumlevel as set by DSimax2. If DSi is greater than DSimax2, as will occur during rapidSi transport in G2/M phases, then G1SiT is zero.
The synthesis of girdles must relate to the changing cell size. As the synthesisof girdles essentially results in a pro rata increase in cell volume, we assume thatthe amount of Si in girdles is proportional to the C cell quota (Ccell) and hencethat we can use the ratio of GSi:Ccell (G9; with units of g Si g C–1) to regulatethe synthesis of girdles in response to increasing Ccell. This ratio is also used torestrict Cµ in the absence of Si for the synthesis of those girdles. For simplicity,we assume that the thickness of Si in girdles is invariable (as a function of Sistress) in contrast to the thickness of the valves. The constants, G9min and G9maxdescribe the minimum and maximum values for G9. If G9 is near G9min, then theneed for the synthesis of girdles must be maximal while Cµ must be restricted.If G9 is near G9max, then Cµ is unrestricted. Again, to provide flexibility in themodel structure we normalize this control, so the relative value of G9 (relG9) isgiven by:
(G9max – G9)relG9 = ––––––––––––– (10)
(G9max – G9min)
This returns a value between 0 (halts GSi synthesis) and 1 (promotes maximalGSi synthesis).
The synthesis of girdles (GSis) is:
DSi1 –––––– 2 · (1 + Kgirdle)DSimax2GSis = µmax · GSimax · ––––––––––––––––––––––– ·DSi1 –––––– 2 + KgirdleDSimax2
(11)relG9 · (1 + KG9)––––––––––––––– · (cell cycle = G1)relG9 + KG9
where the first half of the equation describes the control of GSis as a function ofDSi and is scaled to µmax and GSimax. The latter part uses a normalized hyperbolic
Modelling Si–N-limited diatom growth
453
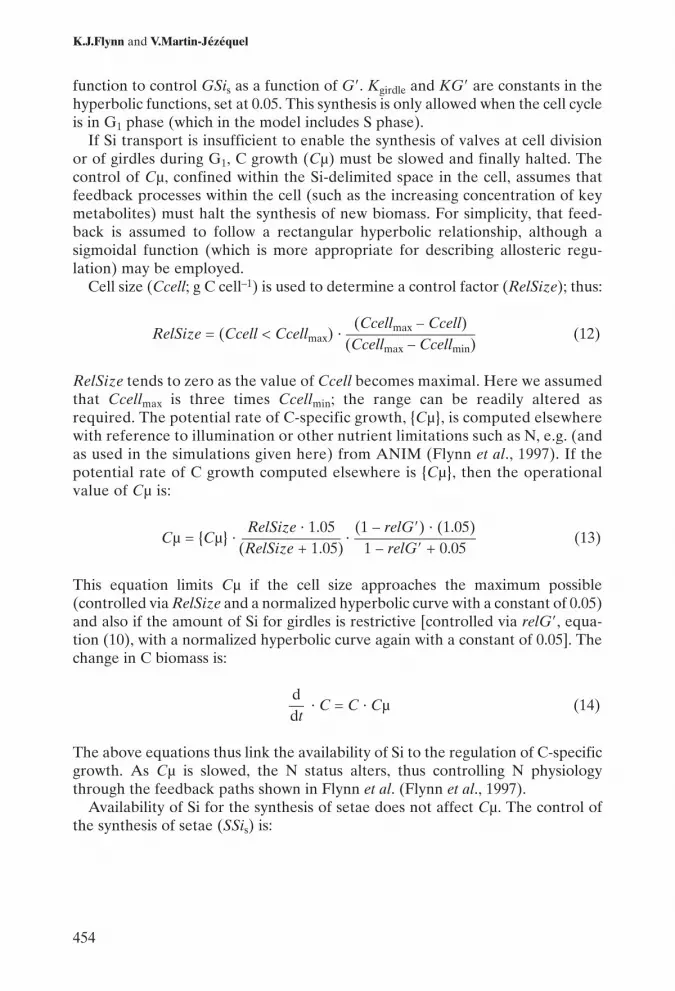
function to control GSis as a function of G9. Kgirdle and KG9 are constants in thehyperbolic functions, set at 0.05. This synthesis is only allowed when the cell cycleis in G1 phase (which in the model includes S phase).
If Si transport is insufficient to enable the synthesis of valves at cell divisionor of girdles during G1, C growth (Cµ) must be slowed and finally halted. Thecontrol of Cµ, confined within the Si-delimited space in the cell, assumes thatfeedback processes within the cell (such as the increasing concentration of keymetabolites) must halt the synthesis of new biomass. For simplicity, that feed-back is assumed to follow a rectangular hyperbolic relationship, although asigmoidal function (which is more appropriate for describing allosteric regu-lation) may be employed.
Cell size (Ccell; g C cell–1) is used to determine a control factor (RelSize); thus:
(Ccellmax – Ccell)RelSize = (Ccell < Ccellmax) · ––––––––––––––––– (12)
(Ccellmax – Ccellmin)
RelSize tends to zero as the value of Ccell becomes maximal. Here we assumedthat Ccellmax is three times Ccellmin; the range can be readily altered asrequired. The potential rate of C-specific growth, {Cµ}, is computed elsewherewith reference to illumination or other nutrient limitations such as N, e.g. (andas used in the simulations given here) from ANIM (Flynn et al., 1997). If thepotential rate of C growth computed elsewhere is {Cµ}, then the operationalvalue of Cµ is:
RelSize · 1.05 (1 – relG9) · (1.05)Cµ = {Cµ} · ––––––––––––– · –––––––––––––––– (13)
(RelSize + 1.05) 1 – relG9 + 0.05
This equation limits Cµ if the cell size approaches the maximum possible(controlled via RelSize and a normalized hyperbolic curve with a constant of 0.05)and also if the amount of Si for girdles is restrictive [controlled via relG9, equa-tion (10), with a normalized hyperbolic curve again with a constant of 0.05]. Thechange in C biomass is:
d— · C = C · Cµ (14)dt
The above equations thus link the availability of Si to the regulation of C-specificgrowth. As Cµ is slowed, the N status alters, thus controlling N physiologythrough the feedback paths shown in Flynn et al. (Flynn et al., 1997).
Availability of Si for the synthesis of setae does not affect Cµ. The control ofthe synthesis of setae (SSis) is:
K.J.Flynn and V.Martin-Jézéquel
454

DSi1 –––––– 23
DSimax2SSis = µmax · SSimax · –––––––––––––––––DSi1 –––––– 23
+ KsetaeDSimax2(15)
SSi11 – 1–––––––22 · 1.05SSimax· ––––––––––––––––––– · (cell cycle = G1)SSi
1 – 1–––––––2 + 0.05SSimax
The first part of the control uses a sigmoidal function to relate SSis to DSi, witha constant of Ksetae and a power of three. This ensures that setae are only synthe-sized when DSi is relatively full and thus synthesis of setae decreases most rapidlywhen Si stress develops. Altering the value of the power and of Ksetae changes theeffect of Si stress on the synthesis of setae. The second part of the equation limitsthe synthesis of setae when the cell has a maximum coverage of setae (SSimax),using a normalized hyperbolic function with a half-saturation constant of 0.05. Ifthe simulation is for a species that lacks setae, this equation is deleted and refer-ence to SSimax removed from equation (9).
As DSi, VSi, GSi and SSi are all cell quotas (pg Si cell–1), the values of thesehalve when the cell divides. As division is not instantaneous, the division of thesepools between the daughter cells is also not instantaneous, but occurs concur-rently with the transfer of Si between DSi and VSi. The changes in the size of thedissolved pool, valves, girdles and setae are, respectively:
d— · DSi = SiT + G1SiT – VSis – GSis – SSis – DSi · cellµ (16)dt
d— · VSi = VSis – VSi · cellµ (17)dt
d— · GSi = GSis – GSi · cellµ (18)dt
and
d— · SSi = SSis – SSi · cellµ (19)dt
The model as described above generates synchronous division. In order togenerate a representation of asynchronous growth, the model has been set tosimulate the growth of 20 subpopulations with random initialization of cell sizeand position in the cell cycle. This number of subpopulations is normallysufficient, especially given that the cell division in each population is not instan-taneous, but occurs over the period set by MT.
Modelling Si–N-limited diatom growth
455

The model has been configured to simulate the growth of a diatom with setaeapproximating to the size of Thalassiosira weissflogii (note that this species doesnot have setae), with reference to the data for various diatom species in Paasche(Paasche, 1973a, b, 1975) and Harrison et al. (Harrison et al., 1976, 1977). Thetypical cell size is set at 50 pg C cell–1, with the total Si content of a cell of thissize varying between 5 and 25 pg Si cell–1. Parameterization for different speciesis hindered by the fact that most studies of diatom Si physiology do not report Sicontent relative to both cell and C, while the C content per cell rises with Si stress(Harrison et al., 1977). In addition, data from chemostat studies do not report theSi content of Si-replete cells. There are also few estimates of the size of dissolvedand particulate pools of Si. However, because the model equations are normal-ized, the values of minimum and maximum pool sizes can be readily altered. Themodel was constructed and run using Powersim Constructor (Isdalstø, Norway)using the Euler integration method with a step size of 5.625 min.
The behaviour of the complex model under steady state
Transport rates for Si in diatoms are related to both the concentration of thesubstrate, by Michaelis–Menten kinetics, and the number of transporters, whichvaries with the cell cycle phase (Martin-Jézéquel et al., 2000). With Si limitation,the incorporation of Si is related to substrate availability and correlates with Si-limited growth rates [Figure 1a; cf. (Guillard et al., 1973; Conway et al., 1976;Conway and Harrison, 1977; Davis et al., 1978; Paasche, 1980a)]. The cell quotaof biogenic silica under Si limitation (Figure 2a) is in accordance with the litera-ture (Paasche, 1973a; Harrison et al., 1976; Brzezinski et al., 1990), falling withlittle or no change in µ until a critical quota is attained, when µ then declines withlittle subsequent change in the Si quota.
In general, maximum Si cell quotas are obtained at lower (non-Si limited)growth rates (Sullivan and Volcani, 1981; Brzezinski, 1992; Martin-Jézéquel et al.,2000). Thus light and temperature limitation of growth leads to an increase in Si cell–1 (Paasche, 1980b; Taylor, 1985; Martin-Jézéquel et al., 2000). Under Nlimitation, the major regulation of Si incorporation is not by Si availability, butrelated to the cell cycle. As the duration of G2 increases with N stress, so more Sican be incorporated into the values until a maximum level is attained; Si cell–1 isinversely correlated to the growth rate [(Harrison et al., 1976); V.Martin-Jézéquel, P.Claquin, J.Kromkamp, G.Kraay and M.Veldhuis, unpublished). Inthe model, the Si transport curve (Figure 1b) does not show significantly elevatedSi transport, in part also because the level of Si cell–1 was actually near maximalthroughout N stress (Figure 2b). However, Si:C does rise with this treatment(Figure 3b), as it should. In view of constraints imposed by the modelling soft-ware, it was not possible to prolong the period of G2 indefinitely with decreasinggrowth rates associated with increasing N stress. In addition, this particular issuerequires clarification of the relationship between N stress and the period of G2;at present, we have used a very simple assumption [equation (4)] for this control.
The range of variation in Si quota obtained by the model is in accordance withthe literature. Depending on the nutritional status, the amount of Si per cell can
K.J.Flynn and V.Martin-Jézéquel
456

vary with a range of 1–3 in Thalassiosira species (Binder and Chisholm, 1980;Brzezinski, 1985; Harrison et al., 1990). However, very few data are available forcomparison of the various Si pools relative to cell C and N. The only data avail-able for continuous cultures were generated by Davis (Davis, 1976) andHarrison et al. (Harrison et al., 1976, 1977). The extensive review of Brzezinskigives a mean mass ratio of 0.3 for Si:C and 2.24 for Si:N (Brzezinski, 1985). Thesame review indicates a variability within clones due to the growth irradiance ofthe order of 44% for Si:C and 50% for Si:N. Unfortunately, these data wereacquired for one light condition; different light–dark regimes may give rise todifferent variations.
Modelling Si–N-limited diatom growth
457
Fig. 1. Simulated silicate and nitrate transport rates at different steady-state growth rates incontinuous light with growth being limited by silicate (a), nitrate (b) or both nutrients (c).

In T.weissflogii, the range of Si:C is around 0.25 and N:C is 0.125 (mass ratios)(Brzezinski, 1985); model output is consistent with these values (Figure 3).Under Si limitation, Si:C is driven by the Si cell quota (Figure 3a), in accordancewith Harrison et al. (Harrison et al., 1977). On the contrary, under N limitation(Figure 3b), the changes in Si:C are driven by both Si and C cell quotas, againin accordance with Harrison et al. (Harrison et al., 1977). Paasche shows that withtemperature Si:C increases with the growth rate, due to decreasing cellular Ccontent at high temperature (Paasche, 1973b). In view of the minimal interfer-ence between Si metabolism with N and C metabolism (Martin-Jézéquel et al.,2000), N:C is quite stable under Si limitation, as also simulated by the model(Figure 3a). The positive correlation of N:C with the growth rate under N limi-tation from the model as expected in accordance with Goldman (Goldman,1976) and Harrison et al. (Harrison et al., 1977), (Figure 3b). No data exist in theliterature to confirm the model performance under dual limitation (Figure 3c),
K.J.Flynn and V.Martin-Jézéquel
458
Fig. 2. Simulated silicate and carbon cell quotas at different steady-state growth rates in continuouslight with growth being limited by silicate (a), nitrate (b) or both nutrients (c). The spread of data isdue to varying degrees of synchrony between subpopulations in different model runs.

although the output appears logical given the responses seen to single nutrientlimitations.
Estimates of the variation of the length of the G1 and G2 interphases are basedon the analysis of Olson et al. (Olson et al., 1986), Vaulot et al. (Vaulot et al., 1987)and Brzezinski et al. (Brzezinski et al., 1990) for T.weissflogii. Under Si limitation,the major influence in the model was a marked increase in G2, and under N limi-tation by an increase in G1. Distributions of cellular Si in valves, girdle bands andsetae are directly linked to the regulation of these phases (Figure 4). No specificdata set is available to confirm the values obtained in the model. Timing of Sideposition was shown in T.weissflogii, but by an indirect approach (Brzezinskiand Conley, 1994). These authors noticed ~40% of the Si in girdle bands. In our
Modelling Si–N-limited diatom growth
459
Fig. 3. Simulated silicate and nitrogen carbon quotas (mass ratios) at different steady-state growthrates in continuous light with growth being limited by silicate (a), nitrate (b) or both nutrients (c).

model, the Si percentage in the girdles is lower than this value, around 10%. Thepercentage value in the model will also reflect the contribution of Si in the setae(which are not present in T.weissflogii), while the absolute content is a functionof the value of the constant GSimax in the model and can be readily altered.Silicification of the setae was analysed by Brzezinski et al. (Brzezinski et al., 1990)and is linked to the length of G1; thus N-stressed cells have more Si in their setae(Figure 4b). In the model, the process is associated with both the period of G1and the availability of Si (Figure 4a). Thus, there is a marked difference in theamount of Si in the setae between Si- and N-limited situations (Figure 4a and b).Valve silicification, which is mostly dependent on the duration of G2, mirrors
K.J.Flynn and V.Martin-Jézéquel
460
Fig. 4. Simulated distribution of cellular silicate between values, girdles and setae at different steady-state growth rates in continuous light with growth being limited by silicate (a), nitrate (b) or bothnutrients (c).

closely the total cellular Si, as expected from the literature (Martin-Jézéquel etal., 2000).
Figure 5a shows that the relationship between growth rates and Si cell quotadoes not suggest that a very satisfactory mode of model control is possible usingthe quota approach as it lacks a progressive curvilinear relationship as obtainedfor N and P [(Harrison et al., 1976; Tilman and Kilham, 1976); but see (Paasche,1973b; Davidson and Gurney, 1999)]. In principle, the quota model is inappro-priate because the current amount of Si in the frustules is of no consequence forthe growth of the next cell generation. If Si is exhausted suddenly, the Si cell quotamay be high, but no further cell division is possible. Thus, only DSi should beconsidered as forming a usable cell quota. However, the relationship between
Modelling Si–N-limited diatom growth
461
Fig. 5. Steady-state model output during Si-limited growth under continuous light and in a light–darkcycle. Relationships between Si cell quota and growth rate (a), external concentration of silicate andgrowth rate (b), and cell-specific transport and growth rate (c).

growth rates and the size of DSi is no more promising (not shown). DSi may actu-ally be higher at very low growth rates as a consequence of the extension of G2and hence of the increase in the average DSi content across the whole populationduring Si-limited growth.
Figure 5b shows that Monod kinetics describe the control of steady-state Si-limited growth. The half-saturation constant for Si-limited growth, Kg, forcontinuous light is 0.345 µM, and 0.1847 µM in the light–dark cycle (note that SiKtwas set at 4 µM and SiKt2 at 8 µM). The two points at a value of µ of 0.693 day–1
(1 division day–1) in the light–dark simulation reflect the fact that cell division andSi acquisition in diatoms are not restricted to one or other of the illuminationphases. Thus, once µ falls below 0.693 day–1 there is more time to accumulate Siat lower concentrations of Si (over the dark phase) with no effect on the acqui-sition of C (hence, also, Kg being lower for the simulation in the light–dark cycle).Figure 5c shows the linear relationship between µ and Si transport until themaximum µ is attained for a given irradiance regime, after which the Si contentper cell rises with no change in µ (this event may also be deduced from Figure 5a).
Construction of the simple model
The simple model was developed from an analysis of steady-state simulationsgenerated by the complex model (Figure 5). The critical process that limits cellgrowth (i.e. division, cellµ, rather than C growth) is the rate of transport of Si intothe cell. The basis of the simplified model is thus to make cellµ a function of Sitransport (SiT) (Figure 5c), which in turn essentially follows Monod kinetics(Figure 5b) now using a half-saturation constant for growth (Kg) rather than fortransport (Kt). However, to link this in with C-specific growth (Cµ), we need toconsider the value of Ccell. If the increase in Ccell halts, because of N stress forexample, then cell division is not required and so neither is Si transport. If Ccellis high, because a lack of Si prevents cell division, then Cµ and other processessuch as N assimilation must be halted. In steady-state growth, cellµ and Cµ arethe same. Accordingly, two control links are introduced related to the value ofCcell: one to regulate SiT and the other to regulate Cµ and hence also N assimi-lation.
The transport rate for Si is now given by:
ExtSi (1 – RelSize)2SiT = µmax · SiCellmax · –––––––––––– · ––––––––––––––––– (20)
(ExtSi + SiKg) (1 – RelSize)2 + 0.01
SiT is scaled to µmax and to the maximum amount of Si per cell (SiCellmax), andthrough a Michaelis–Menten equation to the external substrate concentrationusing the half-saturation constant for growth (SiKg). The form of Si in the cell(dissolved, valves, girdles, setae) is not considered. RelSize is as described inequation (12). However, while individual cells may attain the minimum cell size(Ccellmin), it is very unlikely that all cells in a population would do so simul-taneously. Ccellmin was thus set at a higher level (the lowest average valueattained by the population) than in the complex model (Table I). The form of the
K.J.Flynn and V.Martin-Jézéquel
462

latter part of equation (20), referring to RelSize, is important for the performanceof the model; it must halt SiT when cells are small, and allow it to operate at amaximum rate when cells are large. We use a sigmoidal function with a power of2 and a constant of 0.01, allowing very little transport when Ccell is close toCcellmin. The value of SiCell can exceed SiCellmax when growth is limited by N.The degree to which this happens is a function of the part of the equation relat-ing cell size to transport and also to cellµ in equation (21), which is describedbelow.
The control of Cµ by RelSize is the same as the first half of equation (13), withomission of the part referring to girdles. The control of cellµ is different, being alinear increasing function of SiT as long as SiT remains less than a critical value(Figure 5c). That function is set by the minimum cell quota for Si (SiCellmin); thus,cellµ = SiT/SiCellmin. Once the value of this, cellµ, reaches the maximum possiblegrowth rate, µmax, this link is severed and cellµ = µmax. As SiT is now faster thanit need be, the value of SiCell increases towards SiCellmax with no further increasein µ (Figure 5c). The value of cellµ is also moderated by a sigmoidal curve refer-ring to RelSize. Thus:
SiT SiTcellµ = 11 ––––––– < µmax 2 · ––––––– +
SiCellmin SiCellmin (21)SiT (1 – RelSize)2 · 1.0051––––––– ≥ µmax 2 · µmax 2 · ––––––––––––––––––
SiCellmin (1 – RelSize)2 · 0.005
The values of the power function and constant are important for the simulationof Ccell and Sicell. The change in SiCell is given by:
d— · SiCell = SiT – SiCell · cellµ (22)dt
The simple Si model thus contains only five equations, in comparison with 19equations running as multiple arrays for each subpopulation in the complexmodel.
Batch culture simulations: a comparison of the complex and simple models
In these simulations (Figures 6–9), there was a continual low input of fresh media(with a dilution rate equivalent to 5% of maximum growth rates) that was eitherlow in Si (15:50 µM Si:N) or low in N (50:15 µM Si:N). Thus, the simulated cellswere not suddenly starved of nutrients, as may be implied from the externalconcentrations (Figure 6). The low-Si system slowly consumed most of the nitrate(Figure 6) with only the Si:C ratio falling (Figure 7). The low-N system was alsosubjected to a level of Si limitation, with both the Si:C and N:C ratios falling(Figure 7).
It is apparent from the comparative plots of data from the complex and simplemodels in Figures 6–8 that the performance of the simple model under different
Modelling Si–N-limited diatom growth
463

combinations of Si and/or N stress mirrors closely that of the complex models. Toa large extent, differences between the model output were because of the increas-ing level of synchronous growth developing between the arrayed subpopulationsin the complex model as they became increasingly nutrient limited.
Under nutrient-replete conditions, the Si:N mass ratio is around two (Brzezin-ski, 1985; Harrison et al., 1990). Si limitation has a rapid severe effect on cellularSi (Figure 8, low Si) with a concurrent decrease of Si:C (Figure 7) as the C cellquota increases. In contrast, N limitation affects both C and N metabolism withsignificant decreases in the N cell quota and N:C, but relatively little change inthe C quota [Figure 8, low N; cf. (Harrison et al., 1977)].
K.J.Flynn and V.Martin-Jézéquel
464
Fig. 6. Simulated batch cultures supplied with a slow input of fresh medium containing 15:50 or50:15 µM of Si and nitrate N (low Si and low N, respectively). The plots show the model output forboth the complex and simple model structures.
Fig. 7. Changes in the mass ratio of Si:C and N:C in simulated batch cultures; as for Figure 6, theseshow the model output for both the complex and simple model structures.

In contrast to the situation with N (Syrett, 1981; Huppe and Turpin, 1994),transport and incorporation of Si are not affected by the light–dark cycle (Blanket al., 1986; Martin-Jézéquel et al., 1997, 2000). Accordingly, the incorporation ofSi with cell division is not limited to the light phase; diatom division typicallyshows activity in light and dark phases, as shown by the model [inset of Figure 8,low Si; cf. (Nelson and Brand, 1979)]. Patterns of silicification into the differentparts of the cells are related to the cell cycle (Pickett-Heaps, 1991; Pickett-Heapset al., 1994), as simulated by the complex model in Figure 9c and d, in accordancewith the timing of deposition during each interphase (Brzezinski and Conley,1994; Martin-Jézéquel et al., 2000). The formation of valves occupies ~10% of thetotal cell cycle, with the deposition of girdle bands and setae continuing duringmost of the cycle (Paasche, 1980a). Si limitation induces a progressive Si incorpor-ation into the cells (Figure 9c) due to the increase in the absolute and relativeperiod of the G2 phase. However, this is associated with a decrease in the totalcellular Si with declines in the Si content of valves (Paasche, 1973a) and setae(Brzezinski et al., 1990) (Figure 9c). These simulated results also follow the obser-vations of a decreased silicification of the frustule, without an immediate impacton cell growth rates under Si limitation. In contrast, N limitation primarily affectsthe duration of the G1 phase [Figure 9d; (Vaulot et al., 1987)]. In particular, thisenables a maximal synthesis of setae (Figure 9d), without direct impact on thetotal silicification (cf. Figure 2b).
With Si limitation, and its associated decrease in Si transport, there is a changein the regulation of Si incorporation with a decreasing silicification of the frustule
Modelling Si–N-limited diatom growth
465
Fig. 8. Changes in the cell quota for Si and C in simulated batch cultures; as for Figure 6, these showthe model output for both the complex and simple model structures. Also shown are the growth ratesfor the complex simulations with the inset in the low-Si plot giving an example of the diel variationin population cell division (the dark phase was the latter half of each day).

and a complete cessation of the cell division unless, as here, there is a slow inputof Si to the system [Figure 9a; cf. (Paasche, 1980a; Martin-Jézéquel et al., 2000)].The inset in Figure 9a shows the different timing of Si and N transport; the latteris coupled with C fixation in the illuminated first half of each day. Only during Nstress does nitrate transport become continuous (Figure 9b).
K.J.Flynn and V.Martin-Jézéquel
466
Fig. 9. As Figure 6, but for cells belonging to a single subpopulation in the complex model. Transportof nitrate and silicate into cells grown in low-Si (a) or low-N (b) systems; peaks of Si transport corre-spond with the period before and during cell division, with the shoulder after the peak the period ofSi transport for synthesis of girdles and setae. During N limitation, nitrate transport was continuous.The distribution of Si within the same population and the duration of cell interphases are shown in(c) and (d). The difference between the total and the sum of valves, girdles and setae is the dissolvedSi pool that accumulates during G2 phase prior to the synthesis of valves during cell division.

Conclusions
We have presented two models capable of simulating the documented behaviourof Si-dependant dynamics of diatom growth. By placing these models with asubmodel to simulate N interactions, we have generated a Si–N interaction modelcomplete (in the complex Si model) with a cell cycle simulation. The perform-ance of both models under different types of stress is in keeping with data fromthe literature, including correct simulations of changes in cell and C quotas forboth Si and N under different conditions of Si and/or N stress. Davidson andGurney used a sigmoidal function to relate cell size, as defined by N cell–1, to theinteraction between the Si and N quotas (Davidson and Gurney, 1999). This couldbe viewed as analogous to the sigmoidal relationship between the need for Si andcell size [indexed in our model to C cell–1 rather than to N cell–1 as in (Davidsonand Gurney, 1999)] in equation (20). However, while the model of Davidson andGurney (Davidson and Gurney, 1999), hereafter the DG model, gives a pseudo-mechanistic simulation for the Si–N interaction where N is the more limitingnutrient (as was the instance in the data set they modelled), it does not do sowhere Si the more limiting. The latter situation is more likely in nature as N isregenerated continuously within the photic zone.
A comparison of the simple model with the DG model for Thalassiosirapseudonana is given in Figure 10. The models were configured as described in thefigure legend, with the simple model tuned (using Powersim Solver v2 software)to match the DG output for cell number and external nutrients under the low-Nscenario for which the DG model was developed (Davidson and Gurney, 1999;Davidson et al., 1999). This matching of the simple model output for the low-Nscenario was achieved using a lower cell quota for Si than used by the DG model,part way between the value used by Davidson and Gurney (Davidson andGurney, 1999) and the values of Paasche (Paasche, 1973b) for this diatom. Whilethe N cell quotas, nutrient usage and cell growth dynamics are similar betweenboth models for the N-limiting scenario (Figure 10a and e), and the C cell–1 valuesfrom the simple model are as expected from the experimental data set (David-son et al., 1999; Figure 10e), the Si cell quotas are contrary (Figure 10c). Thebehaviour of the DG model is not in keeping with the literature (Sullivan andVolcani, 1981; Brzezinski, 1992; Martin-Jézéquel et al., 2000) in that the simulatedSi cell quota does not increase on N deprivation, but rather falls (Figure 10c).During exponential growth, the simple model gave SI:C and N:C mass ratios ofaround 0.18; on N exhaustion, the former increased to 0.28, while the latterdecreased to around 0.06. These are the expected responses. The DG model doesnot simulate C quotas, only cell quotas, so no comparison can be drawn betweenthe models on this point. Using the same parameters, except with a differentnutrient scenario, a low-Si system for which the DG model was not developed,the differences in the cell quotas for Si and N are just as obvious. Again, the DGmodel does not reproduce the expected shift with nutrient exhaustion, in this caseof N cell–1 rising. This is because while cell growth halts, the DG model cannotsimulate the continuing C growth with the increase in C cell and N cell quotas(Figure 10d and f) that the literature says should occur in Si-limited cells. If the
Modelling Si–N-limited diatom growth
467

K.J.Flynn and V.Martin-Jézéquel
468

Si quota in the simple model is increased to enable a matching with the DG modelin the low-Si scenario, the Si is exhausted in the low-N scenario (which it is notby the DG model). Until the appropriate experiments are conducted withadequate parameterization of both model structures, it will not be possible to sayfor sure whether the simplicity of the DG model structure outweighs the appar-ent technical inaccuracies in its output.
Inclusion of a photoacclimative submodel (Flynn and Flynn, 1998; Geider etal., 1998) allows the consideration of the interaction between Si stress and photo-synthesis. Unfortunately, published data sets are not adequate for a rigoroustesting of the models; in this context, the models should be seen as offering a routeto formulate hypotheses for testing with experiments. This is certainly the casefor the complex model because it contains a high level of detail. One predictionfrom the model is that during Si stress dissolved organic carbon (DOC) must bereleased. With Si limitation, Cµ must be halted [equation (13)]. However, becausethe photosystems may well not degrade rapidly enough, the fixation of Ccontinues out of step with Cµ. Either the cell must burst or this surplus C mustbe lost as DOC.
Finally, the model may be combined with the Fe-submodel of Flynn and Hipkin(Flynn and Hipkin, 1999), enabling a consideration of the growth of diatoms inFe-deplete areas. Fe stress slows all growth processes, but would not be expectedto affect silicification itself. With a prolonging of G2 [requiring a modification ofequation (4) to include Fe stress], the prediction is that Fe-stressed cells, like N-stressed cells (Figures 2–4), will have thick valves. Recently, we have linked thesimple Si model with the Fe–light–ammonium–nitrate model of Flynn and Hipkin(Flynn and Hipkin, 1999); simulations show an increase [two to sixfold depend-ing on the values of the powers in equations (20) and (21)] in Si cell–1 with Festress. This is in keeping with the observation that diatoms from low-Fe watersdo indeed have high Si cell quotas (Boyle, 1998; Hutchins and Bruland, 1998;Takeda, 1998).
Acknowledgements
This work was supported by the Natural Environment Research Council (UK)and Centre National de la Recherche Scientifique and Université de BretagneOccidentale (France).
Modelling Si–N-limited diatom growth
469
Fig. 10. Comparison between the performance of the model of Davidson and Gurney (Davidson andGurney, 1999), the DG model, and the simple Si–N model. The DG model was constructed using the‘summer’ parameters for T.pseudonana of Davidson and Gurney (Davidson and Gurney, 1999) andrun in batch simulations using two alternative nutrient regimes: low N and low Si. Values for thesimple model of Ccellmin (12.28 pg C cell–1), Sicellmin (1.483 pg Si cell–1), Sicellmax (2.39 pg Si cell–1)and the theoretical maximum growth rate (6.15 day–1, giving 1.5 day–1 in a 12 h:12 h light–dark cycle)were obtained from tuning the simple model to the DG model output in the low-N system for cellnumbers and external nutrients. Ccellmax was set at 20 pg C cell–1 [see (Davidson et al., 1999)].

References
Bienfang,P.K., Harrison,P.J. and Quarmby,L.M. (1982) Sinking rate response to depletion of nitrate,phosphate and silicate in four marine diatoms. Mar. Biol., 67, 295–302.
Binder,B.J. and Chisholm,S.W. (1980) Changes in the soluble silicon pool size in the marine diatomThalassiosira weisflogii. Mar. Biol. Lett., 1, 205–212.
Blank,G.S., Robinson,D.H. and Sullivan,C.W. (1986) Diatom mineralization of silicic acid. VIII.Metabolic requirements and the timing of protein synthesis. J. Phycol., 22, 382–389.
Boyle,E. (1998) Pumping iron makes thinner diatoms. Nature, 393, 733–734.Brzezinski,M.A. (1985) The Si:C:N ratio of the marine diatoms: interspecific variability and the effect
of some environmental variables. J. Phycol., 21, 347–357.Brzezinski,M.A. (1992) Cell-cycle effects on the kinetics of silicic acid uptake and resource compe-
tition among diatoms. J. Plankton Res., 14, 1511–1539.Brzezinski,M.A. and Conley,D.J. (1994) Silicon deposition during the cell cycle of Thalassiosira weis-
flogii (Bacillariophyceae) determined using 123rhodamine and propidium iodide staining. J.Phycol., 30, 45–55.
Brzezinski,M.A., Olson,R.J. and Chisholm,S.W. (1990) Silicon availability and cell-cycle progressionin marine diatoms. Mar. Ecol. Prog. Ser., 67, 83–96.
Conley,D.J., Schelske,C.L. and Stoermer,E.F. (1993) Modification of the biogeochemical cycle ofsilica with eutrophication. Mar. Ecol. Prog. Ser., 101, 179–192.
Conway,H.L. and Harrison,P.J. (1977) Marine diatoms grown in chemostats under silicate orammonium limitation. IV Transient response of Chaetoceros debilis, Skeletonema costatum andThalassiosira gravida to a single addition of the limiting nutrient. Mar. Biol., 43, 33–43.
Conway,H.L., Harrison,P.J. and Davis,C.O. (1976) Marine diatoms grown in chemostats under silicateor ammonium limitation. II. Transient response of Skeletonema costatum to a single addition of thelimiting nutrient. Mar. Biol., 35, 187–199.
Crawford,R.M. (1981) The siliceous components of the diatom cell wall and their morphologicalvariation.. In Simpson,T.L. and Volcani,B.E. (eds), Silicon and Siliceous Structures in BiologicalSystems. Springer-Verlag, New York, pp. 129–156.
Davidson,K. and Gurney,W.S.C. (1999) An investigation of non-steady-state algal growth. II. Math-ematical modelling of co-nutrient-limited algal growth. J. Plankton Res., 21, 839–858.
Davidson,K., Wood,G., John,E.H. and Flynn,K.J. (1999) An investigation of non-steady-state algalgrowth. I. An experimental model ecosystem. J. Plankton Res., 21, 811–837.
Davis,C.O. (1976) Continuous culture of marine diatoms under silicate limitation. II. Effect of lightintensity on growth and nutrient uptake of Skeletonema costatum. J. Phycol., 12, 291–300.
Davis,C.O., Breitner,N.F. and Harrison,P.J. (1978) Continuous culture of marine diatoms undersilicon limitation. 3. A model of Si-limited diatom growth. Limnol. Oceanogr., 23, 41–52.
Egge,J.K. and Aksnes,D.L. (1992) Silicate as regulating nutrient in phytoplankton competition. Mar.Ecol. Prog. Ser., 83, 281–289.
Flynn,K.J. and Fasham,M.J.R. (1997) A short version of the ammonium-nitrate interaction model. J.Plankton Res., 19, 1881–1897.
Flynn,K.J. and Flynn,K. (1998) The release of nitrite by marine dinoflagellates—development of amathematical simulation. Mar. Biol., 130, 455–470.
Flynn,K.J. and Hipkin,C.R. (1999) Interactions between iron, light, ammonium and nitrate: insightsfrom the construction of a dynamic model of algal physiology. J. Phycol., in press.
Flynn,K.J., Fasham,M.J.R. and Hipkin,C.R. (1997) Modelling the interaction between ammonium andnitrate uptake in marine phytoplankton. Phil. Trans. R. Soc. Lond., 352, 1625–1645.
Flynn,K.J., Page,S., Wood,G. and Hipkin,C.R. (1999) Variations in the maximum transport rates forammonium and nitrate in the prymnesiophyte Emiliania huxleyi and the raphidophyte Heterosigmacarterae. J. Plankton Res., 21, 355–371.
Geider,R.J., MacIntyre,H.L. and Kana,T.M (1998) A dynamic regulatory model of phytoplanktonacclimation to light, nutrients and temperature. Limnol. Oceanogr., 43, 679–694.
Goldman,J.C. (1976) Phytoplankton response to wastewater nutrient enrichment in continuousculture. J. Exp. Mar. Biol. Ecol., 23, 31–43.
Guillard,R.R.L., Kilham,P. and Jackson,T.A. (1973) Kinetics of silicon-limited growth in the marinediatom Thalassiosira pseudonana Hasle and Heimdal (=Cyclotella nana Hustedt). J. Phycol., 9,233–237.
Harrison,P.J., Conway,H.L. and Dugdale,R.C. (1976) Marine diatoms grown in chemostats undersilicate or ammonium limitation. I. Cellular chemical composition and steady-state growth kineticsof Skeletonema costatum. Mar. Biol., 35, 177–186.
Harrison,P.J., Conway,H.L., Holmes,R.W. and Davis,C.O. (1977) Marine diatoms grown in
K.J.Flynn and V.Martin-Jézéquel
470

chemostats under silicate or ammonium limitation. III. Cellular chemical composition andmorphology of Chaetoceros debilis, Skeletonema costatum and Thalassiosira gravida. Mar. Biol., 43,19–31.
Harrison,P.J., Thompson,P.A. and Calderwood,G.S. (1990) Effects of nutrient and light limitation onthe biochemical composition of phytoplankton. J. Appl. Phycol., 2, 45–56.
Hildebrand,M., Volcani,B.E., Gassman,W. and Schroeder,J.I. (1997) A gene family of silicon trans-porters. Nature, 385, 688–689.
Hildebrand,M., Dahlin,K. and Volcani,B.E. (1998) Characterization of a silicon transporter genefamily in Cylindrotheca fusiformis: sequences, expression analysis and identification of homologsin other diatoms. Mol. Gen. Genet., 260, 480–486.
Huppe,H.C. and Turpin,D.H. (1994) Integration of carbon and nitrogen metabolism in plant and algalcells. Ann. Rev. Plant Physiol. Plant Mol. Biol., 45, 577–607.
Hutchins,D.A. and Bruland,K.W. (1998) Iron-limited diatom growth and Si/N uptake ratios in acoastal upwelling regime. Nature, 393, 561–564.
Martin-Jézéquel,V., Daoud,N. and Queguiner,B. (1997) Coupling of silicon, carbon and nitrogenmetabolisms in marine diatoms. In Dehairs,F., Elskens,M. and Goyens,L. (eds), Integrated MarineSystem Analysis. Vriej University of Brussels, pp. 65–83.
Martin-Jézéquel,V., Hildebrand,M. and Brzezinski,M. (2000) Silicification in diatoms. Implication forgrowth. J. Phycol., submitted.
Nelson,D.M. and Brand,L.E. (1979) Cell division periodicity in 13 species of marine phytoplanktonon a light-dark cycle. J. Phycol., 15, 67–75.
Officer,C.B. and Ryther,J.H. (1980) The possible importance of silicon in marine eutrophication. Mar.Ecol. Prog. Ser., 3, 83–91.
Olson,R.J., Vaulot,D. and Chisholm,S.W. (1986) Effects of environmental stresses on the cell cycle oftwo marine phytoplankton species. Plant Physiol., 80, 918–925.
Paasche,E. (1973a) Silicon and the ecology of marine plankton diatoms. I. Thalassiosira pseudonana(Cyclotella nana) growth in a chemostat with silicate as limiting nutrient. Mar. Biol., 19, 117–126.
Paasche,E. (1973b) Silicon and the ecology of marine plankton diatoms. II. Silicate-uptake kineticsin five diatom species. Mar. Biol., 19, 262–269.
Paasche,E. (1975) Growth of the plankton diatom Thalassiosira nordenskioldii Cleve at low silicateconcentrations. J. Exp. Mar. Biol. Ecol., 18, 173–183.
Paasche,E. (1980a) Silicon. In Morris,I. (ed.), The Physiological Ecology of Phytoplankton. Studies inEcology, Vol. 7. Blackwell, Oxford, pp. 259–284.
Paasche,E. (1980b) Silicon content of five marine plankton diatom species measured with a rapid filtermethod. Limnol. Oceanogr., 25, 474–480.
Pickett-Heaps,J. (1991) Cell division in diatoms. Int. Rev. Cytol., 128, 63–108.Pickett-Heaps,J., Schmid,A.M.M. and Edgar,L.A. (1990) The cell biology of diatom valve formation.
Prog. Phycol. Res., 7, 1–168.Pickett-Heaps,J.D., Carpenter,J. and Koutoulis,A. (1994) Valve and seta (spine) morphogenesis in the
centric diatom Chaetoceros peruvianus Brightwell. Protoplasma, 181, 269–282.Raven,J.A. (1983) The transport and function of silicon in plants. Biol. Rev., 58, 179–207.Schmid,A.M.M. (1994) Aspects of morphogenesis and function of diatom cell walls with implication
for taxonomy. Protoplasma, 181, 43–60.Sullivan,C.W. (1977) Diatom mineralization of silicic acid. II. Regulation of Si(OH)4 transport rates
during the cell cycle of Navicula pelliculosa. J. Phycol., 13, 86–91.Sullivan,C.W. (1986) Silicification by diatoms. In Silicon Biochemistry. Ciba Foundation Symposium
121. Wiley, Chichester, pp. 59–89.Sullivan,C.W. and Volcani,B.E. (1981) Silicon in the cellular metabolism of diatoms. In Simpson,T.L.
and Volcani,B.E. (eds), Silicon and Siliceous Structures in Biological Systems. Springer-Verlag, NewYork, pp. 15–42.
Syrett,P.J. (1981) Nitrogen metabolism of microalgae. Can. Bull. Fish. Aquat. Sci., 210, 182–210.Takeda,S. (1998) Influence of iron availability on nutrient consumption ratios of diatoms in oceanic
waters. Nature, 393, 774–777.Taylor,N.J. (1985) Silica incorporation in the diatom Coscinodiscus granii as affected by light intensity.
Br. Phycol. J., 20, 365–374.Tilman,D. and Kilham,S.S. (1976) Phosphate and silicate growth and uptake kinetics of the diatoms
Asterionella formosa and Cyclotella meneghiniana in batch and semicontinuous culture. J. Phycol.,12, 375–383.
Vaulot,D., Olson,R.J., Merkel,S. and Chisholm,S.W. (1987) Cell-cycle response to nutrient starvationin two phytoplankton species Thalassiosira weissflogii and Hymenomonas carterae. Mar. Biol., 95,625–630.
Modelling Si–N-limited diatom growth
471

Volcani,B.E. (1978) Rôle of silicon in diatoms metabolism and silicification. In Bendz,G. andLindqvist,I. (eds), Biochemistry of Silicon and Related Problems. Plenum Press, New York, pp.177–204.
Volcani,B.E. (1981) Cell wall formation in diatoms: morphogenesis and biochemistry. In Simpson,T.L.and Volcani,B.E. (eds), Silicon and Siliceous Structures in Biological Systems. Springer-Verlag, NewYork, pp. 157–200.
Received on July 21, 1999; accepted on October 6, 1999
K.J.Flynn and V.Martin-Jézéquel
472


