Embed Size (px)
Citation preview
MODELING THE EVOLUTION OF DUSTY STARBURST GALAXIES IN MULTIBAND DEEP SURVEYS
Y. P. Wang1,2
Received 2005 January 26; accepted 2005 October 3
ABSTRACT
We model the constraints set on the evolution of dusty starburst galaxies by the current deep extragalactic sur-veys performed in the far-infrared with Spitzer, and at radio wavelengths with the VLA. Our models fit the numbercounts in all the available spectral bands well and also provide a reasonably close match to the redshift distribu-tion of the Spitzer detections. We find (1) dusty starburst galaxies with infrared burst phases triggered by galacticinteractions at redshift z � 1 2 are good candidates to fit the Spitzer results at 24, 70, and 160 �m, assumingplausible strengths for the PAH features for the infrared luminous sources. An Arp 220–like spectral energy dis-tribution (SED) for ultraluminous infrared galaxies (ULIRGs) of Lir > 1012 L� and one like that of M82 forluminous infrared galaxies (LIRGs) of Lir � 1011 1012 L� give a successful fit to the Spitzer 24 �m and ISOCAM15 �m number counts at flux levels of S� < 1 mJy. (2) The strong evolution of the number density of the ULIRGsfrom redshift z � 0 to �1 predicted by our models is consistent with the current deep 1.4 GHz radio surveysand accounts for the upturn in the 1.4 GHz differential counts at the submillijansky flux level. (3) Comparisonwith number counts at near-infrared bands, as well as the background measurements using DIRBE and 2MASS,shows that only a fraction of the stellar mass in the universe is included in our models of dusty starburst mergersat z � 1 2.
Subject headings: galaxies: evolution — galaxies: interactions — galaxies: Seyfert — galaxies: starburst —infrared: galaxies
Online material: color figures
1. INTRODUCTION
During the last few years, remarkable progress has beenmade in probing the distant universe. This progress is driven inpart by the availability of powerful new instruments at variouswavelengths spanning the X-ray, near-, mid-, and far-infrared,and submillimeter, as well as out to the radio, which have com-plemented the traditional studies of galaxy evolution at z � 1based on UV/optical observations.
A crucial advance is the discovery by far-infrared (FIR) andsubmillimeter observations of a significant population of dustystarburst galaxies at high redshift with infrared luminosities Lir >1012 L�, which are ULIRGs with central activities (active ga-lactic nucleus [AGN] or starburst). These objects are heavilyhidden by dust extinction and are triggered either by violent merg-ers between gas-rich objects or by encounters of galaxies (Smail& Ivison 1997; Hughes et al. 1998; Blain et al. 1999; Eales et al.2000; Holland et al. 1999; Puget et al. 1999; Dole et al. 2000;Hughes 2000; Sanders 2000; Sajina et al. 2003; Xu et al. 2004).The formation rates for massive stars (M > 5 M�) are approxi-mately 200–900M� yr�1, assuming the bolometric luminositiesof ULIRGs are dominated by star formation activities (Condon1992; Scoville et al. 1997; Ivison et al. 1998, 2000).
Another important clue to galaxy evolution is the populationof optically faint, near-infrared bright, extremely red objects(EROs) often found as counterparts of sources identified inmany other wavebands (Richards 1999; Smail et al. 1999;Alexander et al. 2001; Chary & Elbaz 2001; Cowie et al. 2001;Lutz et al. 2001; Pierre et al. 2001; Smith et al. 2001; Alexanderet al. 2002; Franceschini et al. 2002; Ivison et al. 2002; Mainieriet al. 2002; Page et al. 2001; Stevens et al. 2003). The classi-
fications of this population are divided between dusty starburstsand more evolved objects. Morphological studies by HubbleSpace Telescope (HST ) and ground-based near-infrared imag-ing show that active dusty EROs are mostly disturbed systems,indicating mergers or galactic interactions could be the drivingmechanisms for their behavior (Smail et al. 2002b; Gilbanket al. 2003;Moustakas et al. 2004). The dereddened star formationrates in these objects are in the range 20–200M� yr�1, with FIRluminosities generally below 1012 L�. In these cases, near-infrareddeep surveys, with detection sensitivity at least 3 mag deeper thanthat of FIR and submillimeter surveys, can provide the possibil-ity of unveiling the high-z dusty starburst galaxies in a way com-plementary to the surveys at FIR/submillimeter, which are onlysensitive to the very bright infrared sources (Kennicutt 1998;Cimatti et al. 1999, 2002; Smail et al. 2002a; Bouwens et al. 2005).NASA’s new infrared facility Spitzer, which brings signifi-
cant improvements in IR sensitivity and survey efficiency overthe previous deep infrared cosmological surveys, has produceddeep new multiwavelength number counts from 24 to 160 �mthat provide a unique opportunity for galaxy evolution studies.Because of their sensitivity to the prominent polycyclic aromatichydrocarbon (PAH) spectral features, Spitzer, as well as the In-frared Space Observatory (ISO) 15 �m deep cosmological sur-veys, can provide an unbiased view on the evolution of bothULIRGs and LIRGs at the redshift range 0< z < 2:5 (Egamiet al. 2004; Le Floc’h et al. 2004; Marleau et al. 2004). Al-though the initial phenomenological models fitted the unifiedISO/Spitzer number counts well, they have been shown not to fitthe source redshift distribution (Perez-Gonzalez et al. 2005).This paper uses models based on a binary aggregation descrip-tion of galaxy evolution to fit the new data and to provide a morecomplete test of our understanding of infrared galaxy evolution.In x 2, we review our previous work. Section 3 discusses
the main features of the binary aggregation dynamics and thenumerical simulation approach we use, which is centered on
A
1 Purple Mountain Observatory, Chinese Academy of Sciences, Nanjing,China; [email protected].
2 National Astronomical Observatories of China, Chinese Academy of Sci-ences, Beijing, China.
138
The Astrophysical Journal, 638:138–147, 2006 February 10
# 2006. The American Astronomical Society. All rights reserved. Printed in U.S.A.
an infrared burst phase triggered by gas-rich mergers. A briefdiscussion of the construction of template spectra of dustystarburst galaxies is also given in this section. The model fittingto the recent Spitzer results, as well as other available multibanddeep surveys spanning from near-infrared to radio wavelengths,and the estimate of the integrated background intensities are allpresented in x 4. In x 5, we summarize our conclusions. Thecosmological parametersH0 ¼ 70 km s�1 Mpc�1,� ¼ 0:3, and� ¼ 0:7 are adopted throughout.
2. SUMMARY OF PREVIOUS WORK
Theoretical modeling of the evolution of dusty starburst gal-axies constrained by both the observed cosmic infrared back-ground and the number counts in FIR and submillimeter deepsurveys by Infrared Astronomical Satellite (IRAS ), ISO, andSCUBA indicate a dramatic increase in the number density ofLIRGs and ULIRGs toward redshift z � 1 (Dole et al. 2000;Wang & Biermann 2000; Chary & Elbaz 2001; Franceschiniet al. 2001; Chapman et al. 2002; Totani & Takeuchi 2002;Wang 2002; Lagache et al. 2003). Wang & Biermann (2000)andWang (2002) discussed the effects of galaxy mergers on thestrong evolution seen in these deep surveys in the context of abinary aggregation evolutionary scheme. The model requires thatthe infrared behavior be luminosity- and redshift-dependent witha significant population of dusty starburst galaxies or AGNs fromgas-rich mergers at redshift z � 1 2 and less luminous gas-poor objects at lower z. The infrared emission of more massivemerging systems is taken to be enhanced to a higher level and tofade away faster than less massive systems within the mergertimescale of a given epoch. This hypothesis is based on theobservation that ULIRGs are usually more than a factor of 20brighter than normal starburst galaxies, and it is consistent withthe recent proposal for a ‘‘downsizing formation scenario.’’
The mechanism driving the strong evolution of infraredluminous sources is still unclear. It could be, for example, anincrement of major/minor merger rates, an upturn in the prob-ability of minor tidal interactions, or an enrichment of cold gastoward high redshift. Although visual morphological classi-fications of merger pairs is still very challenging, work by Bellet al. (2005) and Shi et al. (2005) shows that a decrease of themajor-merger rate since redshift z � 1 is probably not the dom-inant cause for the rapid decline in the cosmic star formationrate. This finding supports the prediction by Wang & Biermann(2000) that submillijansky sharp upturn in the FIR numbercounts diagram could not be interpreted solely by a merger ratedecrease with cosmic time, but required a luminosity-dependentinfrared burst phase from gas-rich mergers at high redshift andgas-poor mergers at low redshift. We hope that future sophisti-cated morphological studies from deep imaging as well as COmass determination from ALMA will allow such issues to beaddressed more completely.
Although the details of the infrared burst phase are still un-clear, it is believed to be related to a stage of the merger processwhen the dust mass and temperature are both dramatically in-creased (Kleinmann &Keel 1987; Taniguchi &Ohyama 1998).Numerical simulations on the evolution of dusty starburst gal-axies by Bekki & Shioya (2001) show that there is very strongphotometric evolution during the merger process of two gas-richdisks, and a dramatic change of the SED around a cosmic time-scale T � 1:3 Gyr,when the twomerging disks becomevery closeand suffer from violent relaxation. The star formation activitiesat this moment may reach a maximal rate of�400M� yr�1. Theinfrared flux in this case increases by an order of magnitude,especially in the FIR (60–170 �m) in the emitting frame.
However, such dramatic changes only occur for major merg-ers. Episodic starburst phases are indicated by recent obser-vations (Shi et al. 2005), and they may tend to smooth out theextreme maxima predicted in the models. Our model is not re-stricted to major mergers. However, for simplicity, we assumein the current work that galactic interactions would trigger onlya single infrared burst within a merger timescale and simulate arange of such interactions with a luminosity-dependent infraredburst phase in addition to the mass-light scaling relation of nor-mal starburst galaxies. We believe that episodic bursts wouldnot change the main results of this work, but we relax the re-quirements for a high fraction of mergers at high redshift. Thus,the current work should be indicative of the overall pattern ofinfrared galaxy evolution regardless of the detailed time depen-dence of the star formation.
The redshift distribution of ULIRGs in the model of Wang& Biermann (2000) and Wang (2002) shows a remarkable in-crease of the number density from the local universe up toredshift z � 1 and a mild decrease toward still higher redshifts.We have found a similar result based on the study of the cosmicstar formation history using X-ray deep surveys (Wang et al.2003). This paper examineswhether the evolution of the ULIRGsobserved in the IRAS and ISO deep FIR surveys is still com-patible with recent observations such as (1) in the 1.4 GHz radioband, which is itself a star formation indicator and is an impor-tant way to study the evolution of starburst galaxies, and (2) 24,70, and 160 �m observations by Spitzer, which are particularlyuseful for studying the evolution of the starburst population inthe redshift range 1 < z < 2. Another important rationale forthis work is to try to learn more about the relevant physical pro-cesses. Although near-infrared number counts, unlike mid- orfar-infrared counts, would not provide strong constraints onthe star formation activities in our modeling, we include here acomparison of ourmodeling with the results of near-infrared deepsurveys to get an estimate of the fraction of stellar mass containedin these starburst merging galaxies to the total stellar mass budgetin the universe.
With model constraints ranging from near-infrared out todeep radio surveys, we have constructed an overall model for bothULIRGs and LIRGs that evolves in a continuous way, based on amerger-triggered starburst scenario. This approach differs fromother models that assume ULIRGs evolve separately from LIRGsand with an extremely strong evolutionary rate.
3. MODEL DESCRIPTIONAND NUMERICAL SIMULATION
3.1. Key Numerical Relations
We describe the modeling algorithm briefly in this section.Readers are referred to Wang & Biermann (2000) and referencestherein for the details of the binary aggregation dynamics and thenumerical techniques. An aggregation phenomenon based on theSmoluchowski (1916) equation is adopted in the model to tracethe evolution of the mass distribution function with cosmic time,which is in the form of
@N (m; t)
@t¼ 1
2
Z m
0
dm0K(m0; m� m0; t)N (m0; t)N (m� m0; t)
� N (m; t)
Z 1
0
dm0K(m; m0; t)N (m0; t); ð1Þ
whereN (m; t) is themass distribution function in the ‘‘comoving’’frame. The kernel K(m; m0; t) ¼ ng(t) �V (t)h i reflects the inter-action rate for each pair of masses (m; m0) and depends on the
MULTIBAND EVOLUTION OF DUSTY STARBURST GALAXIES 139
mechanism and environment of such aggregations. The pa-rameter ng is the density of galaxies, V (t) is the relative velocityof the interacting pairs, and � is the cross section. In aggrega-tion dynamics, the interaction kernel K ¼ ng �Vh i is the keypoint for driving the whole evolutionary process, which de-pends strongly on the environmental structures. However, thedetermination of the interaction kernel suffers from variousuncertainties and complexities. We adopt in this model a sim-plified formula for the aggregation kernel K(m; m0; t) withseparated time evolution and cross section terms as below:
K(m; m0; t) / t k�m2=3 þ m02=3� 1þ �
�m2=3 þ m02=3�h i
; ð2Þ
where t k reflects the evolution of the aggregation rate with cos-mic time. The free parameter k depends on the specific structuresand interacting environments. A range of values is discussed byCavaliere & Menci (1997) for groups, clusters, and large-scalestructures. The second free parameter is � , which describes therelative importance of two kinds of encounters (geometric col-lisions and focused resonant interactions) in the cross section.The aggregation timescale � is inversely proportional to the in-teraction kernel K(m; m0; t), i.e., K(m; m0; t) / ��1.
A Monte Carlo inverse-cascading process is used to simulatethe binary aggregation of galaxies described by equation (1).This equation has been solved in a number of cases (Safronov1963; Trubnikov 1971; Silk & White 1978), which show thatthe dynamical process does not strongly depend on the initialconditions; i.e., the mass spectrum is independent of initialdetails with self-similar evolution. For this study, we adopted a�-function atM ¼ 2:5 ; 109 M� as an initial mass spectrum (sodwarfs are included in the new calculation) and start the sim-ulation from redshift z ¼ 15. In the previous studies, we had setthe initial mass toM ¼ 2:5 ; 1010 M�. Other model parametersof the dynamical processes are discussed in detail by Wang &Biermann (2000) and are still valid for the current modeling.
Up to now, the mass distribution function N (m; t) could bederived from the Smoluchowski equation using the Monte Carlosimulation. However, to compare the modeling with various ob-servational constraints, such as luminosity functions of galax-ies in general or with the morphologies, source counts, redshiftdistributions, and background intensities from multiband sur-veys, we need to understand the conversion of the mass distri-bution function N (m; t) to the observable luminosity functionN (L; t), as well as the modeling of a luminosity-dependent in-frared burst phase from gas-rich mergers, all of which are de-scribed in detail by Wang & Biermann (1998, 2000) and Wang(1999, 2002). We summarize several main points as follows.
A simple prescription of the mass-light ratio for the faintblue galaxies is given by Cavaliere & Menci (1997) as L/L� ¼(M /M�)
� (L� is the local standard characteristic luminosity withthe corresponding mass M�). Here � ¼ 4/3 if the cross sectionis purely geometrical; this value is consistent with the obser-vational results by Kormendy (1990); L� / f (z; k0; �0) can beused to describe redshift dimming or luminosity evolution. Sim-plifying the color and K-corrections, we get roughly that LB /L�/M
��
� �M �. We assume in our model an infrared to optical color
ratio L60�m /LB / M � (� � 1:5 is adopted in the calculation).This value is consistent with both the numerical calculations ofthe photometric and spectroscopic evolution of dusty starburstgalaxies, and with the current understanding of the ULIRGs,which are believed to be the extremely luminous infrared burstphase due to starburst merger events where the FIR luminosity,Lir , is enhanced by both accumulation of dust and an increase
in the dust temperature. This burst phase can enhance the in-frared luminosity by a factor of about 20 over that of normalstarburst galaxies (Kleinmann & Keel 1987; Silva et al. 1998;Taniguchi & Ohyama 1998; Bekki & Shioya 2001). We adoptL60 �m / L�(0)/M
��
� �f (z)M �þ�, f (z) / (1þ z)� in themodeling.
A value of � � 5 after a transition redshift z � 1 gives the bestfit, which successfully interprets the sharp upturn at the faintend of FIR number counts. In addition, choosing z � 1 as atransition redshift, with gas-rich mergers at z � 1 and gas-poormergers at z < 1, is also consistent with the cosmic timescale atz � 1, which is about 3 ;109 yr, approximately the timescalefor disk evolution. Galaxies may become gas-poor during thisstage. The scaling factor of the mass-light ratio is normalized bythe local luminosity function from the IRAS survey.Except for understanding the physical basis for the two
major free parameters in the interaction kernel (k � �1:35 and� � 1), which we adjust in the simulation to give a good fit tothe current observations, the uncertainties in the relative emis-sion over the radiation spectrum across cosmic time as galaxiesevolve, including progressive evolution and episodic starburstactivities triggered by galactic interactions, etc., are now themajor challenges to galaxy evolution studies.With only numbercounts, redshift distributions, and integrated background levels,which are rather loose constraints, we simply assume a luminosity-dependent infrared burst phase after a transition redshift to mimicthe change of the SED shapes (especially in the FIR) for gal-axies with different luminosities. We simulate such an effect byadding a scaling factor (Lir/Lc)
�� to the luminosity evolution termdefined in the last paragraph [ f (z) / (1þ z)� ], where Lc is theminimal luminosity bin of the calculated luminosity function.The best-fit result gives �� 0:9 at far-infrared wavelengths.This luminosity-dependent infrared burst reflects a physi-
cal reality that the infrared-luminous galaxies at the bright tailof the luminosity function become gas-poor faster than the lessluminous ones and fade away quickly within the merger time-scale of that epoch. This behavior is consistent with the currentconcept of a ‘‘downsizing formation scenario.’’ In addition, itindicates that less luminous infrared sources, such as LIRGs,could have infrared burst phases persisting longer than those ofULIRGs. In fact, we can describe such an idea with an infraredburst ‘‘duty circle,’’ fon. This term is based on expressing the du-ration of the infrared burst phase in terms of the merger time-scale, tsb/tmerger, where tsb is the starburst timescale and tmerger
the merging timescale. Learning from observations, we havetmerger / (1þ z)�m and tsb / 1/Lnir . Therefore, we can derive anempirical relation fon / ð1/LnirÞ(1þ z)m. From the discussionabove, we now understand that this luminosity-dependent in-frared burst phase is actually implicitly related to the starbursttimescale.
3.2. Model Characteristics
While the basic concepts of our model are clearly plausible, thedetails of the necessary assumptions are somewhat arbitrary. How-ever, it seems that they are very important for fitting the sharpupturn at faint flux levels in the current deep FIR surveys. For adetailed comparison with the color behavior versus flux density,we shall in the future include a real physical model comprisingboth proper chemical evolution and dust emission properties.In the current calculations, starburst galaxies, dust-shrouded
AGNs, and ‘‘nonevolving’’ galaxies are treated separately as threemajor classes of infrared-emitting sources. The nonevolvinggalaxies represent the big spiral and elliptical galaxies, whichwere already in place about 8 Gyr ago and are considered tohave a fixed luminosity function with cosmic time (Lilly et al.
WANG140 Vol. 638
1998; Schade et al. 1999). We know from recent work byHammer et al. (2005) that some intermediate-mass spiral gal-axies may have experienced starburst phases due to galactic in-teractions, which are counted within the starburst populationtriggered by galactic mergers/interactions in our calculation. Al-though the treatment of the three populations separately in themodeling is a bit arbitrary, this simplification should not affectthe current results significantly.
Unlike other models that assume ULIRGs evolve sepa-rately from LIRGs and with an extremely strong evolutionaryrate, we prefer to think that merger-triggered infrared-luminoussources including both ULIRGs and LIRGs exhibit a continu-ous evolution, where the infrared emission of ULIRGsmay changemore rapidly than that of less luminous sources (i.e., LIRGsmay have a longer infrared burst duration than that of ULIRGs).We simulate such a continuous range of evolution by assuminga luminosity-dependent infrared burst phase based on the con-sideration of different timescales for the starburst galaxies of dif-ferent infrared luminosities to consume the cool gas. The AGNcomponent is included as an additional model constraint, sincethe dust-enshrouded geometry could result in significant radi-ation from them at infrared wavelengths. We assume AGN ac-tivities are triggered by galactic mergers or interactions basedon the aggregation dynamics, similar to the starburst popula-tion. The statistics of the starburst and AGN populations arenormalized by the observed local luminosity function of star-burst galaxies at 60 �m from Saunders et al. (1990) and that ofSeyferts fromRush et al. (1993). The abundance of dust-shroudedAGNs is very uncertain, especially for those dust-enshroudedQSOs at high redshift. For the models, we set the abundances ofthe dust-shrouded AGNs relative to the total AGN populationto be 50% and 80% at local and high redshift, respectively, basedon the statistics from Hubble Space Telescope imaging surveyof nearby AGNs and the cosmic X-ray background (Malkanet al. 1998; Gilli et al. 1999).
3.3. Template SEDs
To construct a template spectrum for the high-redshift dustystarburst sources around redshift z � 1, we utilize the publicly
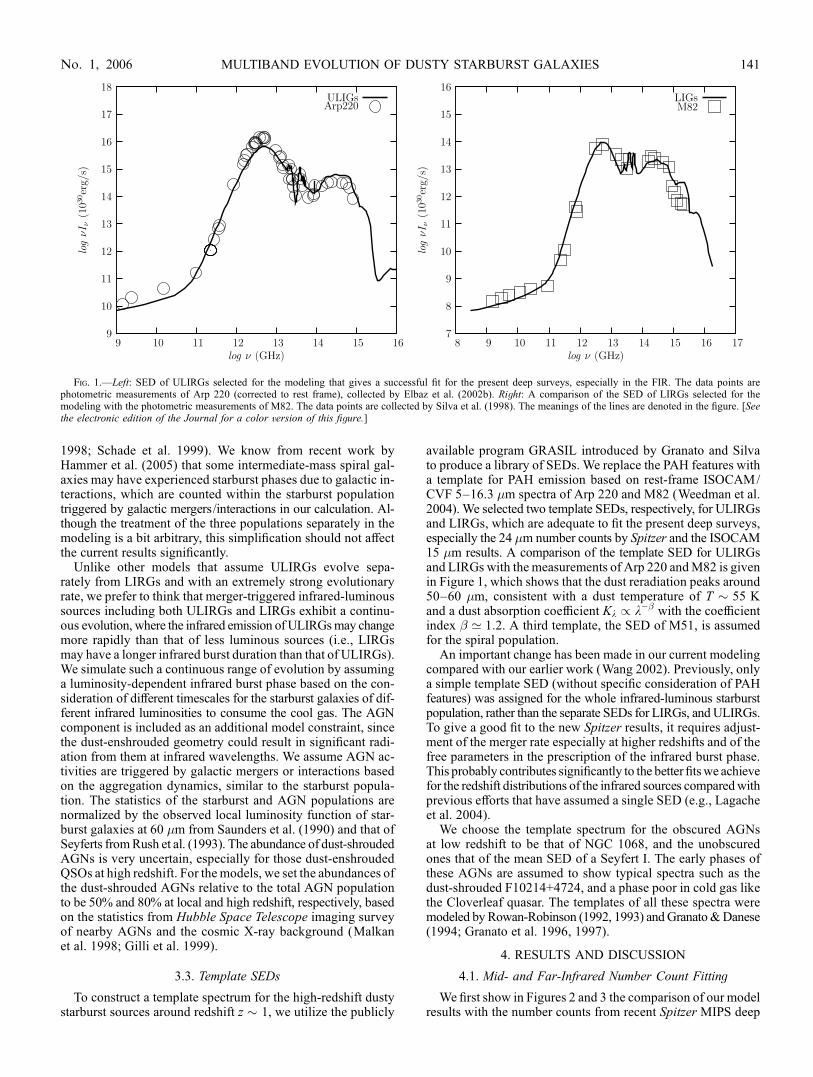
available program GRASIL introduced by Granato and Silvato produce a library of SEDs. We replace the PAH features witha template for PAH emission based on rest-frame ISOCAM/CVF 5–16.3 �m spectra of Arp 220 and M82 (Weedman et al.2004). We selected two template SEDs, respectively, for ULIRGsand LIRGs, which are adequate to fit the present deep surveys,especially the 24 �m number counts by Spitzer and the ISOCAM15 �m results. A comparison of the template SED for ULIRGsand LIRGs with the measurements of Arp 220 andM82 is givenin Figure 1, which shows that the dust reradiation peaks around50–60 �m, consistent with a dust temperature of T � 55 Kand a dust absorption coefficient Kk / k�� with the coefficientindex � ’ 1:2. A third template, the SED of M51, is assumedfor the spiral population.
An important change has been made in our current modelingcompared with our earlier work (Wang 2002). Previously, onlya simple template SED (without specific consideration of PAHfeatures) was assigned for the whole infrared-luminous starburstpopulation, rather than the separate SEDs for LIRGs, and ULIRGs.To give a good fit to the new Spitzer results, it requires adjust-ment of the merger rate especially at higher redshifts and of thefree parameters in the prescription of the infrared burst phase.This probably contributes significantly to the better fitswe achievefor the redshift distributions of the infrared sources comparedwithprevious efforts that have assumed a single SED (e.g., Lagacheet al. 2004).
We choose the template spectrum for the obscured AGNsat low redshift to be that of NGC 1068, and the unobscuredones that of the mean SED of a Seyfert I. The early phases ofthese AGNs are assumed to show typical spectra such as thedust-shrouded F10214+4724, and a phase poor in cold gas likethe Cloverleaf quasar. The templates of all these spectra weremodeled by Rowan-Robinson (1992, 1993) andGranato&Danese(1994; Granato et al. 1996, 1997).
4. RESULTS AND DISCUSSION
4.1. Mid- and Far-Infrared Number Count Fitting
We first show in Figures 2 and 3 the comparison of our modelresults with the number counts from recent Spitzer MIPS deep
Fig. 1.—Left: SED of ULIRGs selected for the modeling that gives a successful fit for the present deep surveys, especially in the FIR. The data points arephotometric measurements of Arp 220 (corrected to rest frame), collected by Elbaz et al. (2002b). Right: A comparison of the SED of LIRGs selected for themodeling with the photometric measurements of M82. The data points are collected by Silva et al. (1998). The meanings of the lines are denoted in the figure. [Seethe electronic edition of the Journal for a color version of this figure.]
MULTIBAND EVOLUTION OF DUSTY STARBURST GALAXIES 141No. 1, 2006
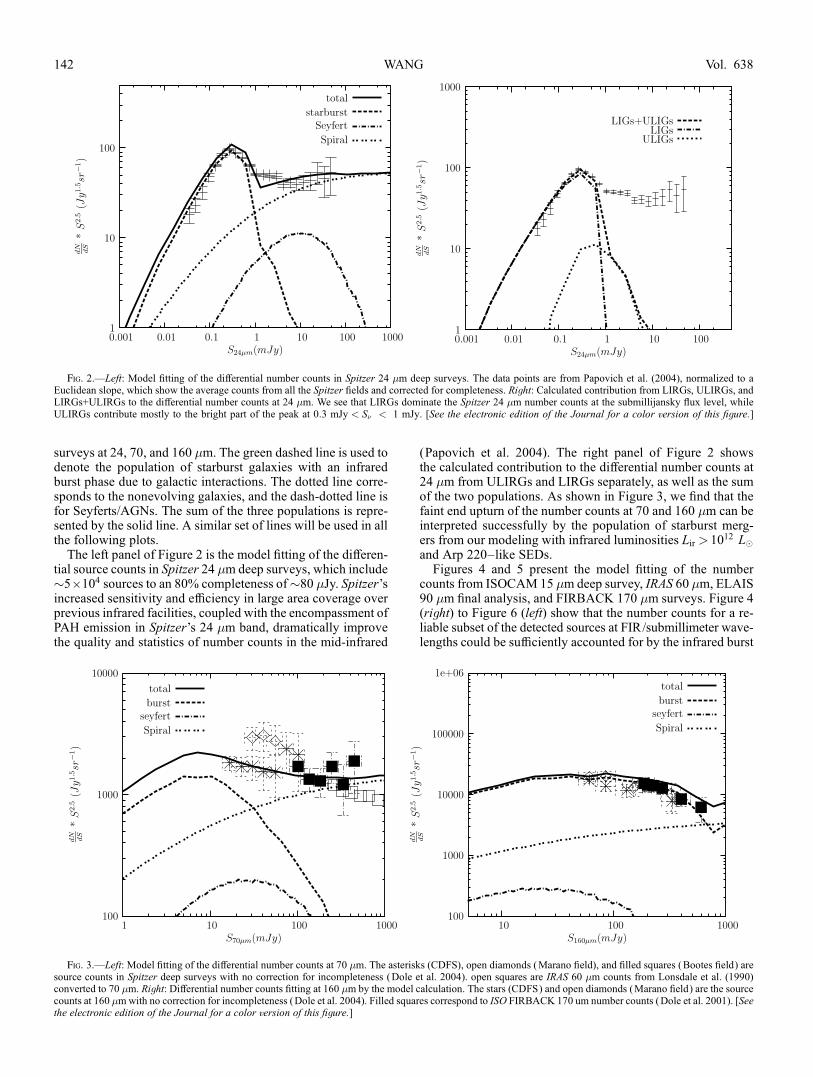
surveys at 24, 70, and 160 �m. The green dashed line is used todenote the population of starburst galaxies with an infraredburst phase due to galactic interactions. The dotted line corre-sponds to the nonevolving galaxies, and the dash-dotted line isfor Seyferts/AGNs. The sum of the three populations is repre-sented by the solid line. A similar set of lines will be used in allthe following plots.
The left panel of Figure 2 is the model fitting of the differen-tial source counts in Spitzer 24 �m deep surveys, which include�5 ; 104 sources to an 80% completeness of�80 �Jy. Spitzer’sincreased sensitivity and efficiency in large area coverage overprevious infrared facilities, coupled with the encompassment ofPAH emission in Spitzer’s 24 �m band, dramatically improvethe quality and statistics of number counts in the mid-infrared
(Papovich et al. 2004). The right panel of Figure 2 showsthe calculated contribution to the differential number counts at24 �m from ULIRGs and LIRGs separately, as well as the sumof the two populations. As shown in Figure 3, we find that thefaint end upturn of the number counts at 70 and 160 �m can beinterpreted successfully by the population of starburst merg-ers from our modeling with infrared luminosities Lir > 1012 L�and Arp 220–like SEDs.Figures 4 and 5 present the model fitting of the number
counts from ISOCAM 15 �m deep survey, IRAS 60 �m, ELAIS90 �m final analysis, and FIRBACK 170 �m surveys. Figure 4(right) to Figure 6 (left) show that the number counts for a re-liable subset of the detected sources at FIR/submillimeter wave-lengths could be sufficiently accounted for by the infrared burst
Fig. 2.—Left: Model fitting of the differential number counts in Spitzer 24 �m deep surveys. The data points are from Papovich et al. (2004), normalized to aEuclidean slope, which show the average counts from all the Spitzer fields and corrected for completeness. Right: Calculated contribution from LIRGs, ULIRGs, andLIRGs+ULIRGs to the differential number counts at 24 �m. We see that LIRGs dominate the Spitzer 24 �m number counts at the submillijansky flux level, whileULIRGs contribute mostly to the bright part of the peak at 0:3 mJy < S� < 1 mJy. [See the electronic edition of the Journal for a color version of this figure.]
Fig. 3.—Left: Model fitting of the differential number counts at 70 �m. The asterisks (CDFS), open diamonds (Marano field), and filled squares (Bootes field) aresource counts in Spitzer deep surveys with no correction for incompleteness (Dole et al. 2004). open squares are IRAS 60 �m counts from Lonsdale et al. (1990)converted to 70 �m. Right: Differential number counts fitting at 160 �m by the model calculation. The stars (CDFS) and open diamonds (Marano field) are the sourcecounts at 160 �mwith no correction for incompleteness (Dole et al. 2004). Filled squares correspond to ISO FIRBACK 170 um number counts (Dole et al. 2001). [Seethe electronic edition of the Journal for a color version of this figure.]
WANG142 Vol. 638
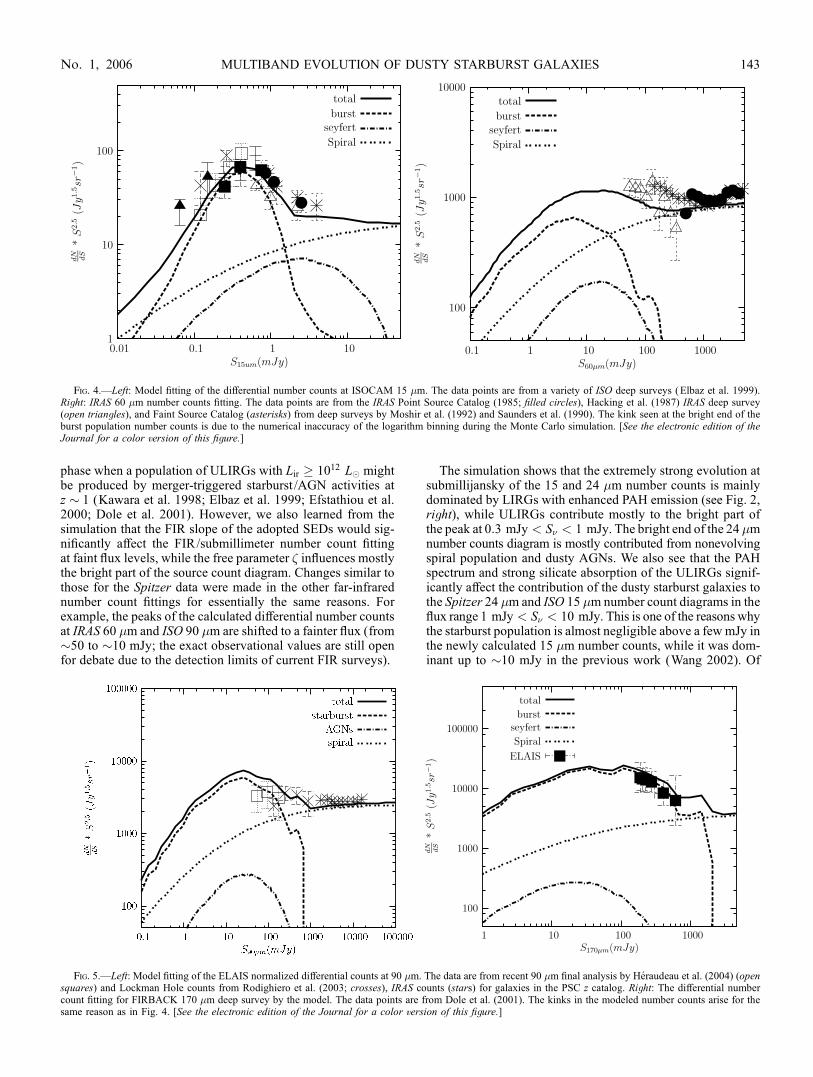
phase when a population of ULIRGs with Lir � 1012 L� mightbe produced by merger-triggered starburst /AGN activities atz � 1 (Kawara et al. 1998; Elbaz et al. 1999; Efstathiou et al.2000; Dole et al. 2001). However, we also learned from thesimulation that the FIR slope of the adopted SEDs would sig-nificantly affect the FIR/submillimeter number count fittingat faint flux levels, while the free parameter � influences mostlythe bright part of the source count diagram. Changes similar tothose for the Spitzer data were made in the other far-infrarednumber count fittings for essentially the same reasons. Forexample, the peaks of the calculated differential number countsat IRAS 60 �m and ISO 90 �m are shifted to a fainter flux (from�50 to �10 mJy; the exact observational values are still openfor debate due to the detection limits of current FIR surveys).
The simulation shows that the extremely strong evolution atsubmillijansky of the 15 and 24 �m number counts is mainlydominated by LIRGs with enhanced PAH emission (see Fig. 2,right), while ULIRGs contribute mostly to the bright part ofthe peak at 0:3 mJy < S� < 1 mJy. The bright end of the 24 �mnumber counts diagram is mostly contributed from nonevolvingspiral population and dusty AGNs. We also see that the PAHspectrum and strong silicate absorption of the ULIRGs signif-icantly affect the contribution of the dusty starburst galaxies tothe Spitzer 24 �m and ISO 15 �m number count diagrams in theflux range 1 mJy < S� < 10 mJy. This is one of the reasons whythe starburst population is almost negligible above a few mJy inthe newly calculated 15 �m number counts, while it was dom-inant up to �10 mJy in the previous work (Wang 2002). Of
Fig. 4.—Left: Model fitting of the differential number counts at ISOCAM 15 �m. The data points are from a variety of ISO deep surveys (Elbaz et al. 1999).Right: IRAS 60 �m number counts fitting. The data points are from the IRAS Point Source Catalog (1985; filled circles), Hacking et al. (1987) IRAS deep survey(open triangles), and Faint Source Catalog (asterisks) from deep surveys by Moshir et al. (1992) and Saunders et al. (1990). The kink seen at the bright end of theburst population number counts is due to the numerical inaccuracy of the logarithm binning during the Monte Carlo simulation. [See the electronic edition of theJournal for a color version of this figure.]
Fig. 5.—Left: Model fitting of the ELAIS normalized differential counts at 90 �m. The data are from recent 90 �m final analysis by Heraudeau et al. (2004) (opensquares) and Lockman Hole counts from Rodighiero et al. (2003; crosses), IRAS counts (stars) for galaxies in the PSC z catalog. Right: The differential numbercount fitting for FIRBACK 170 �m deep survey by the model. The data points are from Dole et al. (2001). The kinks in the modeled number counts arise for thesame reason as in Fig. 4. [See the electronic edition of the Journal for a color version of this figure.]
MULTIBAND EVOLUTION OF DUSTY STARBURST GALAXIES 143No. 1, 2006
course, there are a few other modifications to better fit the recentSpitzer 24 �m number counts: (1) we include the dwarf pop-ulation with initial mass spectrum M ¼ 2:5 ; 109 M�, (2) weincrease the scaling factor of the interaction kernel K(m; m0; t)in equation (2) to shorten the merger timescale of dwarfs orminor mergers at high redshift to a reasonable range and enlargethe absolute value of the free parameter k to make the exponen-tial damping faster, and (3) the free parameters in the prescrip-tion of infrared burst duration (�; � ) are adjusted to change therelative infrared burst duration of LIRGs and ULIRGs.
4.2. Number Counts at Other Wavelengths
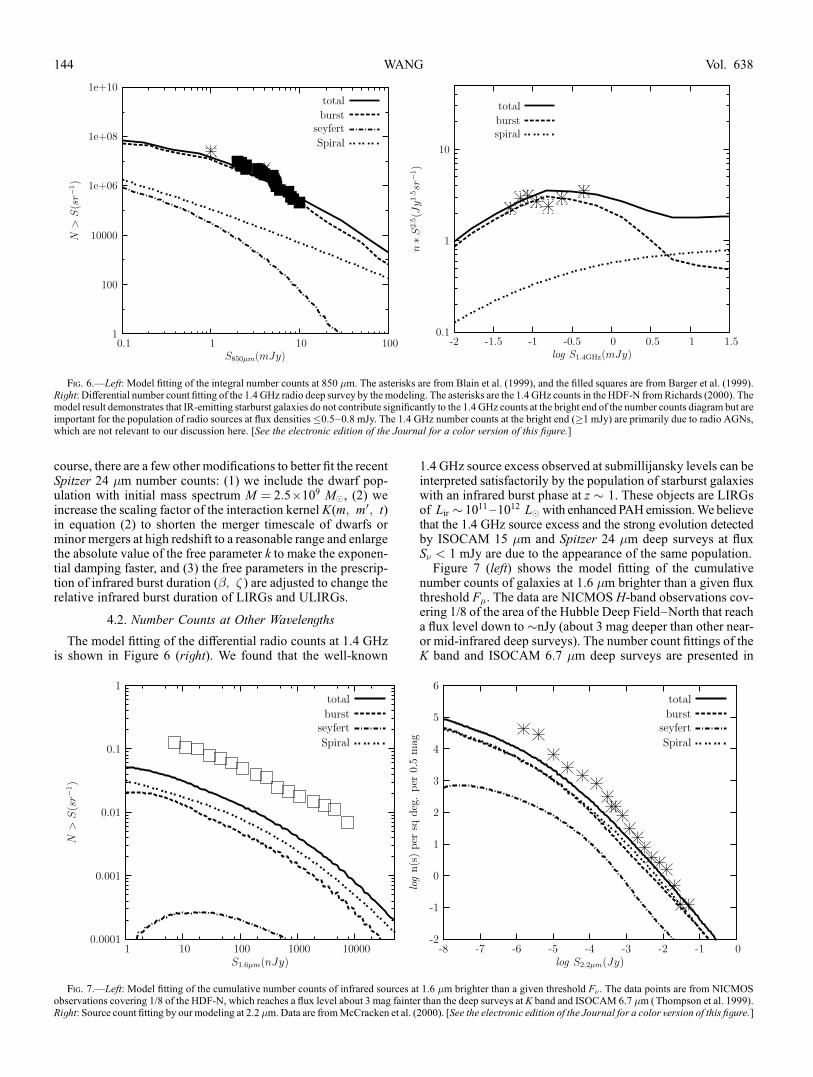
The model fitting of the differential radio counts at 1.4 GHzis shown in Figure 6 (right). We found that the well-known
1.4 GHz source excess observed at submillijansky levels can beinterpreted satisfactorily by the population of starburst galaxieswith an infrared burst phase at z � 1. These objects are LIRGsof Lir � 1011 1012 L� with enhanced PAHemission.We believethat the 1.4 GHz source excess and the strong evolution detectedby ISOCAM 15 �m and Spitzer 24 �m deep surveys at fluxS� < 1 mJy are due to the appearance of the same population.Figure 7 (left) shows the model fitting of the cumulative
number counts of galaxies at 1.6 �m brighter than a given fluxthreshold F�. The data are NICMOS H-band observations cov-ering 1/8 of the area of the Hubble Deep Field–North that reacha flux level down to�nJy (about 3 mag deeper than other near-or mid-infrared deep surveys). The number count fittings of theK band and ISOCAM 6.7 �m deep surveys are presented in
Fig. 6.—Left: Model fitting of the integral number counts at 850 �m. The asterisks are from Blain et al. (1999), and the filled squares are from Barger et al. (1999).Right: Differential number count fitting of the 1.4 GHz radio deep survey by themodeling. The asterisks are the 1.4 GHz counts in the HDF-N fromRichards (2000). Themodel result demonstrates that IR-emitting starburst galaxies do not contribute significantly to the 1.4 GHz counts at the bright end of the number counts diagram but areimportant for the population of radio sources at flux densities�0.5–0.8 mJy. The 1.4 GHz number counts at the bright end (�1 mJy) are primarily due to radio AGNs,which are not relevant to our discussion here. [See the electronic edition of the Journal for a color version of this figure.]
Fig. 7.—Left: Model fitting of the cumulative number counts of infrared sources at 1.6 �m brighter than a given threshold F� . The data points are from NICMOSobservations covering 1/8 of the HDF-N, which reaches a flux level about 3 mag fainter than the deep surveys at K band and ISOCAM 6.7 �m (Thompson et al. 1999).Right: Source count fitting by our modeling at 2.2 �m. Data are fromMcCracken et al. (2000). [See the electronic edition of the Journal for a color version of this figure.]
WANG144 Vol. 638
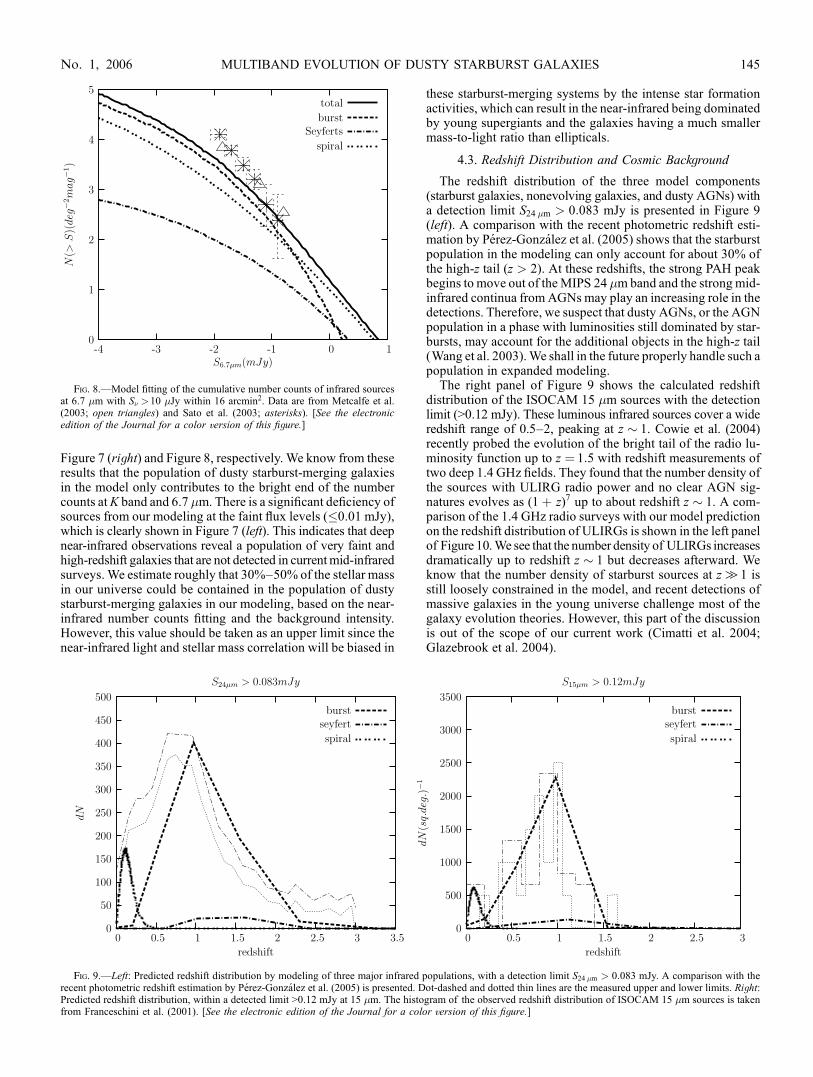
Figure 7 (right) and Figure 8, respectively. We know from theseresults that the population of dusty starburst-merging galaxiesin the model only contributes to the bright end of the numbercounts atK band and 6.7 �m. There is a significant deficiency ofsources from our modeling at the faint flux levels (�0.01 mJy),which is clearly shown in Figure 7 (left). This indicates that deepnear-infrared observations reveal a population of very faint andhigh-redshift galaxies that are not detected in currentmid-infraredsurveys. We estimate roughly that 30%–50% of the stellar massin our universe could be contained in the population of dustystarburst-merging galaxies in our modeling, based on the near-infrared number counts fitting and the background intensity.However, this value should be taken as an upper limit since thenear-infrared light and stellar mass correlation will be biased in
these starburst-merging systems by the intense star formationactivities, which can result in the near-infrared being dominatedby young supergiants and the galaxies having a much smallermass-to-light ratio than ellipticals.
4.3. Redshift Distribution and Cosmic Background
The redshift distribution of the three model components(starburst galaxies, nonevolving galaxies, and dusty AGNs) witha detection limit S24 �m > 0:083 mJy is presented in Figure 9(left). A comparison with the recent photometric redshift esti-mation by Perez-Gonzalez et al. (2005) shows that the starburstpopulation in the modeling can only account for about 30% ofthe high-z tail (z > 2). At these redshifts, the strong PAH peakbegins to move out of theMIPS 24 �m band and the strong mid-infrared continua fromAGNsmay play an increasing role in thedetections. Therefore, we suspect that dusty AGNs, or the AGNpopulation in a phase with luminosities still dominated by star-bursts, may account for the additional objects in the high-z tail(Wang et al. 2003).We shall in the future properly handle such apopulation in expanded modeling.
The right panel of Figure 9 shows the calculated redshiftdistribution of the ISOCAM 15 �m sources with the detectionlimit (>0.12 mJy). These luminous infrared sources cover a wideredshift range of 0.5–2, peaking at z � 1. Cowie et al. (2004)recently probed the evolution of the bright tail of the radio lu-minosity function up to z ¼ 1:5 with redshift measurements oftwo deep 1.4 GHz fields. They found that the number density ofthe sources with ULIRG radio power and no clear AGN sig-natures evolves as (1þ z)7 up to about redshift z � 1. A com-parison of the 1.4 GHz radio surveys with our model predictionon the redshift distribution of ULIRGs is shown in the left panelof Figure 10.We see that the number density of ULIRGs increasesdramatically up to redshift z � 1 but decreases afterward. Weknow that the number density of starburst sources at z31 isstill loosely constrained in the model, and recent detections ofmassive galaxies in the young universe challenge most of thegalaxy evolution theories. However, this part of the discussionis out of the scope of our current work (Cimatti et al. 2004;Glazebrook et al. 2004).
Fig. 8.—Model fitting of the cumulative number counts of infrared sourcesat 6.7 �m with S� >10 �Jy within 16 arcmin2. Data are from Metcalfe et al.(2003; open triangles) and Sato et al. (2003; asterisks). [See the electronicedition of the Journal for a color version of this figure.]
Fig. 9.—Left: Predicted redshift distribution by modeling of three major infrared populations, with a detection limit S24 �m > 0:083 mJy. A comparison with therecent photometric redshift estimation by Perez-Gonzalez et al. (2005) is presented. Dot-dashed and dotted thin lines are the measured upper and lower limits. Right:Predicted redshift distribution, within a detected limit >0.12 mJy at 15 �m. The histogram of the observed redshift distribution of ISOCAM 15 �m sources is takenfrom Franceschini et al. (2001). [See the electronic edition of the Journal for a color version of this figure.]
MULTIBAND EVOLUTION OF DUSTY STARBURST GALAXIES 145No. 1, 2006
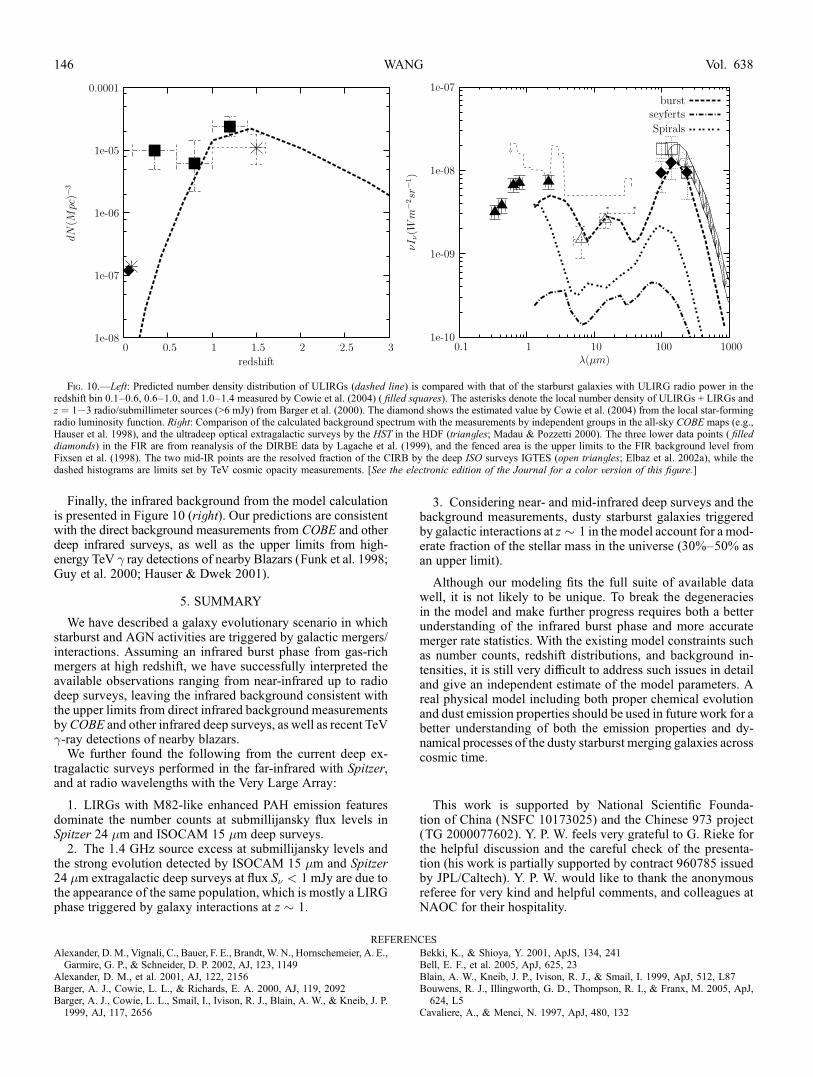
Finally, the infrared background from the model calculationis presented in Figure 10 (right). Our predictions are consistentwith the direct background measurements from COBE and otherdeep infrared surveys, as well as the upper limits from high-energy TeV ray detections of nearby Blazars (Funk et al. 1998;Guy et al. 2000; Hauser & Dwek 2001).
5. SUMMARY
We have described a galaxy evolutionary scenario in whichstarburst and AGN activities are triggered by galactic mergers/interactions. Assuming an infrared burst phase from gas-richmergers at high redshift, we have successfully interpreted theavailable observations ranging from near-infrared up to radiodeep surveys, leaving the infrared background consistent withthe upper limits from direct infrared background measurementsbyCOBE and other infrared deep surveys, as well as recent TeV-ray detections of nearby blazars.
We further found the following from the current deep ex-tragalactic surveys performed in the far-infrared with Spitzer,and at radio wavelengths with the Very Large Array:
1. LIRGs with M82-like enhanced PAH emission featuresdominate the number counts at submillijansky flux levels inSpitzer 24 �m and ISOCAM 15 �m deep surveys.
2. The 1.4 GHz source excess at submillijansky levels andthe strong evolution detected by ISOCAM 15 �m and Spitzer24 �m extragalactic deep surveys at flux S� < 1 mJy are due tothe appearance of the same population, which is mostly a LIRGphase triggered by galaxy interactions at z � 1.
3. Considering near- and mid-infrared deep surveys and thebackground measurements, dusty starburst galaxies triggeredby galactic interactions at z � 1 in the model account for a mod-erate fraction of the stellar mass in the universe (30%–50% asan upper limit).
Although our modeling fits the full suite of available datawell, it is not likely to be unique. To break the degeneraciesin the model and make further progress requires both a betterunderstanding of the infrared burst phase and more accuratemerger rate statistics. With the existing model constraints suchas number counts, redshift distributions, and background in-tensities, it is still very difficult to address such issues in detailand give an independent estimate of the model parameters. Areal physical model including both proper chemical evolutionand dust emission properties should be used in future work for abetter understanding of both the emission properties and dy-namical processes of the dusty starburst merging galaxies acrosscosmic time.
This work is supported by National Scientific Founda-tion of China (NSFC 10173025) and the Chinese 973 project(TG 2000077602). Y. P. W. feels very grateful to G. Rieke forthe helpful discussion and the careful check of the presenta-tion (his work is partially supported by contract 960785 issuedby JPL/Caltech). Y. P. W. would like to thank the anonymousreferee for very kind and helpful comments, and colleagues atNAOC for their hospitality.
REFERENCES
Alexander, D. M., Vignali, C., Bauer, F. E., Brandt,W. N., Hornschemeier, A. E.,Garmire, G. P., & Schneider, D. P. 2002, AJ, 123, 1149
Alexander, D. M., et al. 2001, AJ, 122, 2156Barger, A. J., Cowie, L. L., & Richards, E. A. 2000, AJ, 119, 2092Barger, A. J., Cowie, L. L., Smail, I., Ivison, R. J., Blain, A. W., & Kneib, J. P.1999, AJ, 117, 2656
Bekki, K., & Shioya, Y. 2001, ApJS, 134, 241Bell, E. F., et al. 2005, ApJ, 625, 23Blain, A. W., Kneib, J. P., Ivison, R. J., & Smail, I. 1999, ApJ, 512, L87Bouwens, R. J., Illingworth, G. D., Thompson, R. I., & Franx, M. 2005, ApJ,624, L5
Cavaliere, A., & Menci, N. 1997, ApJ, 480, 132
Fig. 10.—Left: Predicted number density distribution of ULIRGs (dashed line) is compared with that of the starburst galaxies with ULIRG radio power in theredshift bin 0.1–0.6, 0.6–1.0, and 1.0–1.4 measured by Cowie et al. (2004) ( filled squares). The asterisks denote the local number density of ULIRGs + LIRGs andz ¼ 1 3 radio/submillimeter sources (>6 mJy) from Barger et al. (2000). The diamond shows the estimated value by Cowie et al. (2004) from the local star-formingradio luminosity function. Right: Comparison of the calculated background spectrum with the measurements by independent groups in the all-sky COBE maps (e.g.,Hauser et al. 1998), and the ultradeep optical extragalactic surveys by the HST in the HDF (triangles; Madau & Pozzetti 2000). The three lower data points ( filleddiamonds) in the FIR are from reanalysis of the DIRBE data by Lagache et al. (1999), and the fenced area is the upper limits to the FIR background level fromFixsen et al. (1998). The two mid-IR points are the resolved fraction of the CIRB by the deep ISO surveys IGTES (open triangles; Elbaz et al. 2002a), while thedashed histograms are limits set by TeV cosmic opacity measurements. [See the electronic edition of the Journal for a color version of this figure.]
WANG146 Vol. 638
Chapman, S. C., Smail, I., Ivison, R. J., Helou, G., Dale, D. A., & Lagache, G.2002, ApJ, 573, 66
Chary, R., & Elbaz, D. 2001, ApJ, 556, 562Cimatti, A., et al. 1999, A&A, 352, L45———. 2002, A&A, 381, L68———. 2004, Nature, 430, 184Condon, J. J. 1992, ARA&A, 30, 575Cowie, L. L., Barger, A. J., Fomalont, E. B., & Capak, P. 2004, ApJ, 603, L69Cowie, L. L., et al. 2001, ApJ, 551, L9Dole, H., et al. 2000, in ISO Surveys of a Dusty Universe, ed. D. Lemke, M.Stickel, & K. Wilke (Berlin: Springer), 54
———. 2001, A&A, 372, 364———et al. 2004, ApJS, 154, 87Eales, S., Lilly, S., Webb, T., Dunne, L, Gear, W., Clements, D., & Yun, M.2000, AJ, 120, 2244
Efstathiou, A., et al. 2000, MNRAS, 319, 1169Egami, E., et al. 2004, ApJS, 154, 130Elbaz, D., Cesarsky, C., Chanial, P., Aussel, H., Franceschini, A., Fadda, D., &Chary, R. R. 2002a, A&A, 384, 848
Elbaz, D., Flores, H., Chanial, P., Mirabel, I. F., Sanders, D., Duc, P.-A.,Cesarsky, C. J., & Aussel, H. 2002b, A&A, 381, L1
Elbaz, D., et al. 1999, A&A, 351, L37Fixsen, D. J., Dwek, E., Mather, J. C., Bennett, C. L., & Shafer, R. A. 1998,ApJ, 508, 123
Franceschini, A., Aussel, H., Cesarsky, C. J., Elbaz, D., & Fadda, D. 2001,A&A, 378, 1
Franceschini, A., Fadda, D., Cesarsky, C., Elbaz, D., Flores, H., & Granato, G. L.2002, ApJ, 568, 470
Funk, B., Magnussen, N., Meyer, H., Rhode, W., Westerhoff, S., & Wiebel-Sooth, B. 1998, Astropart. Phys., 9, 97
Gilbank, D. G., Smail, I., Ivison, R. J., & Packham, C. 2003, MNRAS, 346,1125
Gilli, R., Risaliti, G., & Salvati, M. 1999, A&A, 347, 424Glazebrook, K., et al. 2004, Nature, 430, 181Granato, G. L., & Danese, L. 1994, MNRAS, 268, 235Granato, G. L., Danese, L., & Franceschini, A. 1996, ApJ, 460, L11———. 1997, ApJ, 486, 147Guy, J., Renault, C., Aharonian, F., Rivoal, M., & Tavernet, J.-P. 2000, A&A,359, 419
Hacking, P. B., Condon, J. J., & Houck, J. R. 1987, ApJ, 316, L15Hammer, F., Flores, H., Elbaz, D., Zheng, X. Z., Liang, Y. C., & Cesarsky, C.2005, A&A, 430, 115
Hauser, M. G., & Dwek, E. 2001, ARA&A, 39, 249Hauser, M. G., et al. 1998, ApJ, 508, 25Heraudeau Ph., et al. 2004, MNRAS, 354, 924Holland, W. S., et al. 1999, MNRAS, 303, 659Hughes, D. H. 2000, in ASP Conf. Ser. 200, Clustering at High Redshift, ed. A.Mazure, O. Le Fevre, & V. Le Brun (San Francisco: ASP), 81
Hughes, D. H., et al. 1998, Nature, 394, 241Ivison, R. J., Smail, I., Barger, A. J., Kneib, J.-P., Blain, A. W., Owen, F. N.,Kerr, T. H., & Cowie, L. L. 2000, MNRAS, 315, 209
Ivison, R. J., Smail, I., Le Borgne, J.-F., Blain, A. W., Kneib, J.-P., Bezecourt,J., Kerr, T. H., & Davies, J. K. 1998, MNRAS, 298, 583
Ivison, R. J., et al. 2002, MNRAS, 337, 1Kawara, K., et al. 1998, A&A, 336, L9Kennicutt, R. C., Jr. 1998, ARA&A, 36, 189Kleinmann, S. G., & Keel, W. C. 1987, in Star Formation in Galaxies, ed. C. J. L.Perrson (NASA CP: 2466; Washington: NASA), 559
Kormendy, J. 1990, in ASP Conf. Ser. 10, Evolution of the Universe of Gal-axies: The Edwin Hubble Centennial Symposium, ed. R. G. Kron (SanFrancisco: ASP), 33
Lagache, G., Abergel, A., Boulanger, F., Desert, F. X., & Puget, J.-L. 1999,A&A, 344, L322
Lagache, G., Dole, H., & Puget, J.-L. 2003, MNRAS, 338, 555Lagache, G., et al. 2004, ApJS, 154, 112Le Floc’h, E., et al. 2004, ApJS, 154, 170
Lilly, S., et al. 1998, ApJ, 500, 75Lonsdale, C. J., Hacking, P. B., Conrow, T. P., & Rowan-Robinson, M. 1990,ApJ, 358, L60
Lutz, D., et al. 2001, A&A, 378, L70Madau, P., & Pozzetti, L. 2000, MNRAS, 312, 9Mainieri, V., Bergeron, J., Hasinger, G., Lehmann, I., Rosati, P., Schmidt, M.,Szokoly, G., & Della Ceca, R. 2002, A&A, 393, 425
Malkan, M. A., Gorjian, V., & Tam, R. 1998, ApJS, 117, 25Marleau, F. R., et al. 2004, ApJS, 154, 66McCracken, H. J., Metcalfe, N., Shanks, T., Campos, A., Gardner, J. P., &Fong, R. 2000, MNRAS, 311, 707
Metcalfe, L., et al. 2003, A&A, 407, 791Moshir, M., Kopman, G., & Conrow, T. A. O. 1992, IRAS Faint Source Survey,Explanatory Supplement Version 2 (Pasadena: JPL)
Moustakas, L. A., et al. 2004, ApJ, 600, L131Page, M. J., Stevens, J. A., Mittaz, J. P. D., & Carrera, F. J. 2001, Science, 294,2516
Papovich, C., et al. 2004, ApJS, 154, 70Perez-Gonzalez, P. G., et al. 2005, ApJ, 630, 82Pierre, M., et al. 2001, A&A, 372, L45Puget, J. L., et al. 1999, A&A, 345, 29Richards, E. A. 1999, ApJ, 513, L9———. 2000, ApJ, 533, 611Rodighiero, G., Lari, C., Franceschini, A., Gregnanin, A., & Fadda, D. 2003,MNRAS, 343, 1155
Rowan-Robinson, M. 1992, MNRAS, 258, 787Rowan-Robinson, M., Benn, C. R., Lawrence, A., McMahon, R. G., &Broadhurst, T. J. 1993, MNRAS, 263, 123
Rush, B., Malkan, M. A., & Spinoglio, L. 1993, ApJS, 89, 1Safronov, V. S. 1963, Soviet Phys. Doklady, 7, 967Sajina, A., Borys, C., Chapman, S., Dole, H., Halpern, M., Lagache, G., Puget,J.-L., & Scott, D. 2003, MNRAS, 343, 1365
Sanders, D. B. 2000, Adv. Space Res., 25, 2251Sato, Y., et al. 2003, A&A, 405, 833Saunders, W., Rowan-Robinson, M., Lawrence, A., Efstathiou, G., Kaiser, N.,Ellis, R. S., & Frenk, C. S. 1990, MNRAS, 242, 318
Schade, D., et al. 1999, ApJ, 525, 31Scoville, N. Z., Yun, M. S., & Bryant, P. M. 1997, ApJ, 484, 702Shi, Y., Rieke, G. H., Papovich, C., Perez-Gonzalez, P. G., & Le Floc’h, E.2005, ApJ, submitted
Silk, J., & White, S. M. 1978, ApJ, 223, L59Silva, L., Granato, G. L., Bressan, A. & Danese, A. 1998, ApJ, 509, 103Smail, I., & Ivison, R. J. 1997, ApJ, 490, 5Smail, I., Ivison, R. J., Blain, A. W., & Kneib, J.-P. 2002a, MNRAS, 331, 495Smail, I., Ivison, R. J., Kneib, J.-P., Cowie, L. L., Blain, A. W., Barger, A. J.,Owen, F. N., & Morrison, G. 1999, MNRAS, 308, 1061
Smail, I., Owen, F. N., Morrison, G. E., Keel, W. C., Ivison, R. J., & Ledlow,M. J. 2002b, ApJ, 581, 844
Smith, G. P., Treu, T., Ellis, R. S., Smail, I., Kneib, J.-P., & Frye, B. L. 2001,ApJ, 562, 635
Smoluchovski, M. 1916, Phys. Z., 17, 557Stevens, J. A., Page, M. J., Ivison, R. J., Smail, I., Lehmann, I., Hasinger, G., &Szokoly, G. 2003, MNRAS, 342, 249
Taniguchi, Y., & Ohyama, Y. 1998, ApJ, 508, L13Thompson, R. I., Storrie-Lombardi, L. J., Weymann, R. J., Rieke, M. J.,Schneider, G., Stobie, E., & Lytle, D. 1999, AJ, 117, 17
Totani, T., & Takeuchi, T. T. 2002, ApJ, 570, 470Trubnikov, B. A. 1971, Soviet Phys. Doklady, 16, 124Wang, Y. P. 1999, Ph.D. thesis, Wuppertal Univ., Germany———. 2002, A&A, 383, 755Wang, Y. P., & Biermann, P. L. 1998, A&A, 334, 87———. 2000, A&A, 356, 808Wang, Y. P., Yamada, T., & Taniguchi, Y. 2003, ApJ, 588, 113Weedman, D., Charmandaris, V., & Zezas, A. 2004, ApJ, 600, 106Xu, C. K., Sun, Y. C., & He, X. T. 2004, ApJ, 603, L73
MULTIBAND EVOLUTION OF DUSTY STARBURST GALAXIES 147No. 1, 2006


