Embed Size (px)
Citation preview
REVIEW / SYNTHÈSE
Modelling the role of highly unsaturated fatty acidsin planktonic food web processes: a mechanisticapproach
Gurbir Perhar, George B. Arhonditsis, and Michael T. Brett
Abstract: Highly unsaturated fatty acids (HUFAs) are a subgroup of fatty acids characterized by chains of 20 or more car-bon atoms with multiple double bonds, which potentially limit the growth of zooplankton. Zooplankton require high HUFAconcentrations during periods of rapid growth, but co-limitation with nutrients is also likely to occur. Recent modelling re-sults suggest food webs with high quality (nutritional and biochemical) primary producers can attain inverted biomass distri-butions with efficient energy transfer between trophic levels. In this study, our objective is to highlight the recent advancesin studying the role of HUFAs in aquatic food webs. We take a first-principles approach to investigate the chemical natureof HUFAs, and the role they play in zooplankton ecology. To this end, we introduce a novel zooplankton growth sub modelthat tracks the interplay between nitrogen, phosphorus, and HUFAs in plankton population models. Our aim is to produce asub model that incorporates the knowledge gained from decades of biochemical research into management-oriented predic-tive tools.
Key words: polyunsaturated fatty acids, zooplankton, growth limitation, eutrophication, plant–animal interface, mechanisticmodelling.
Résumé : Les acides gras fortement non saturés (HGFNS) constituent un groupe d’acides gras caractérisés par des chainescomportant 20 atomes de carbone ou plus avec doubles liaisons, limitant potentiellement la croissance du zooplancton. Lezooplancton nécessite de fortes concentrations en HGFNS pendant la période de croissance rapide, mais une colimitationavec les nutriments pourrait également survenir. De récents résultats de modélisation suggèrent que les chaines alimentairesavec des producteurs primaires de haute qualité (nutritionnelle et biochimique) peuvent connaître des distributions de bio-masse inversées avec un transfert efficace d’énergie entre les échelles trophiques. L’objectif des auteurs consiste à mettre enévidence les récents progrès dans l’étude du rôle des HGFNS dans les chaines trophiques aquatiques. Ils partent avec uneapproche de premier principe pour examiner la nature chimique des HGFNS et le rôle qu’ils jouent dans l’écologie du zoo-plancton. À cette fin, ils introduisent un nouveau sous modèle de croissance zooplanctonique retraçant les interactions entrel’azote, le phosphore et les HGFNS dans des populations modèles de plancton. Le but consiste à produire des sous modèlesincorporant la connaissance acquise au cours de décades de recherches biochimiques dans des outils de prédiction orientésvers l’aménagement.
[Traduit par la Rédaction]
Introduction
In recent years, fatty acids have become a hot topic in bothscience and the media. Similar to the interest generated byglobal climate change, research involving fatty acids is re-ceiving more exposure than ever before in a broad numberof contexts. Health science researchers continue to publish awide array of work relating dietary fatty acids to everythingfrom cognitive functioning and nervous system maintenance(Minokoshi et al. 2002), to heart health (Mozaffarian and
Rimm 2006), and hormonal imbalances and insulin resistancecomplications (Yamauchi et al. 2001). The media is also un-relenting in their efforts to sell the public on the benefits offoods and supplements containing essential fatty acids. Whatis the science behind these carbon structures? Do they pos-sess the potential to address such a broad range of ailments?What makes certain groups of fatty acids essential and othersnot? In this review, we attempt to fill the gap in understand-ing fatty acids through a first-principles approach. We beginby building our knowledge from the basics with a solid
Received 25 April 2012. Accepted 19 June 2012. Published at www.nrcresearchpress.com/er on 28 August 2012.
G. Perhar and G.B. Arhonditsis. Ecological Modelling Laboratory, University of Toronto, 1265 Military Trail, Scarborough, ON M1C1A4, Canada.M.T. Brett. Department of Civil and Environmental Engineering, University of Washington, Seattle, WA 98195-2700, USA.
Corresponding author: Gurbir Perhar (e-mail: [email protected]).
155
Environ. Rev. 20: 155–172 (2012) doi:10.1139/A2012-007 Published by NRC Research Press
Env
iron
. Rev
. Dow
nloa
ded
from
ww
w.n
rcre
sear
chpr
ess.
com
by
Uni
vers
ity o
f T
oron
to o
n 09
/06/
12Fo
r pe
rson
al u
se o
nly.
understanding of the core biochemistry, followed by an ex-amination of the basic sources of these molecules, their as-similation in the lower aquatic food web, and finally theirimportance to human health. A thorough review of the litera-ture will aid us in constructing a nutrient and fatty acid ex-plicit zooplankton growth sub model, accounting for varioussomatic growth limitations in plankton population models.We conclude this study by presenting preliminary model re-sults from incorporating the sub model into the Lake Wash-ington Eutrophication Model (Arhonditsis and Brett, 2005a),and discuss the benefits of integrating such a construct intooperational ecosystem management models.
Chemical structureSome fundamental understanding of fatty acid chemistry is
required to appreciate their nature and comprehend their im-portance. In the most basic of terms, a fatty acid is a longhydrocarbon chain with variant length and degrees of unsatu-ration that terminates with a carboxylic acid group (seeFig. 1) (Hoffmann-Ostenhof et al. 1978). In biological sys-tems, fatty acids usually contain an even number of carbonatoms, mostly between 14 and 24 (Hoffmann-Ostenhof et al.1978). The term fatty acid refers to any of the aliphaticmonocarboxylic acids that can be created by hydrolysis ofnaturally occurring fats and oils (Hoffmann-Ostenhof et al.1978). There are two main types of fatty acids: saturated andunsaturated. The saturated fatty acids (SAFAs) do not containany double bonds or other functional groups along the hydro-carbon chain; rather, every carbon has the maximum numberof possible hydrogens attached to it, giving rise to a linearstructure and a relatively high melting point. Unsaturatedfatty acids, on the other hand, contain double bonds alongthe hydrocarbon chain, creating a kinked, irregular structurewhich can result in a relatively low melting point. In general,double bonds are introduced in fatty acids with 16 or morecarbon atoms (Hoffmann-Ostenhof et al. 1978). Doublebonds in fatty acids are created by fatty acid desaturases.These enzymes remove two hydrogens, creating carbon-carbondouble bonds at specific locations along the fatty acidchain, but are not present in all plants and animals (Vanceand Vance 1985). Fatty acids with one double bond are re-ferred to as monounsaturated fatty acids (MUFA) and thosewith more than one as polyunsaturated fatty acids (PUFA);PUFAs with more than 20 carbons are referred to as HU-FAs. With the presence of a double bond, two configura-tions can occur: the cis-configuration (hydrogens on thesame side of the plane), or trans-configuration (hydrogenson opposite sides of the plane). From a purely chemicalpoint of view, a trans fatty acid (TFA) is an unsaturatedfatty acid that has one or more double bonds in the trans-configuration (Hoffmann-Ostenhof et al. 1978). TFAs occurnaturally in ruminal biohydrogenation, and therefore TFAsare present in dairy products and ruminant meat. Trans fattyacids are also found in industrially synthesized food due tohydrogenation or heat treatment effects on oils and fats(Vance and Vance 1985).
NomenclatureThere are four common conventions for naming fatty
acids, three of which specify the number of carbons and thenumber of double bonds. Common names such as oleic acid
do not convey structural information (Hoffmann-Ostenhof etal. 1978). These names are often derived from the source ofthe fatty acid. For example, oleic acid is derived from oleum(olive oil) and arachidonic acid is found in arachnids (Hoff-mann-Ostenhof et al. 1978). The IUPAC convention for nam-ing fatty acids conveys the chain length, and the number andposition (relative to the carboxyl end) of all double bonds. Inthe IUPAC system, the carboxyl carbon is designated as c-1and double bonds are counted from this end (Hoffmann-Os-tenhof et al. 1978). Thus, the systematic name for arachi-donic acid is c-5, c-8, c-11, c-14 eicosatetraenoic acid. Thisname indicates that arachidonic acid has double bonds in thefifth, eighth, eleventh, and fourteenth carbon position andspecifies that the double bonds are in the cis-configurations.However, this method is not efficient in recognizing biocon-verted compounds, since elongation occurs at the carboxylend (Davidson and Cantrill 1985). Holman (1964) developedan abbreviation convention, which names the fatty acidsbased on the chain length and the number of double bonds(this is the convention used in the present study). Unlike theIUPAC method, the carbon at the methyl end (not the car-boxyl end) is defined to be c-1 (omega position) and the dou-ble bonds are numbered from this methyl end. Each fattyacid belongs to a metabolic family n-x, where x is the posi-tion of the first double bond. Utilizing this method, arachi-donic acid would be denoted as 20:4 (n-6). This compoundcontains 20 carbons, four double bonds and the first doublebond from the methyl end occurs at the sixth carbon, makingthis compound a member of the omega-6 fatty acid family.Fatty acids labeled essential cannot be synthesized de novo
or be efficiently bioconverted from intermediate forms. Assuch, somatic requirements must be satisfied entirely throughingestion, making them an essential component of a nutri-tionally balanced diet. Although the aforementioned desatur-ases exist in animals, they are usually limited to inserting adouble bond into no lower than the n-9 (omega-9) position(Arts et al. 1992), making n-3 and n-6 fatty acids essential.Fish are rich in essential fatty acids (EFAs), but they alsolack the desaturases to form n-3 and n-6 EFAs (Arts et al.1992). The desaturases required to form n-3 and n-6 EFAsexist at the lower trophic levels in aquatic food webs, partic-ularly in phytoplankton.
Impacts on human healthThe primary role of HUFAs in mammals is cell signaling
(Nakamura and Nara 2004), but n-3 HUFAs may also be im-portant in preventing chronic health conditions, such as Alz-heimer’s disease, type II diabetes, kidney disease, rheumatoidarthritis, high blood pressure, coronary heart disease, alcohol-ism, and possibly cancer (Das 2006). Eicosapentaenoic acid(EPA), for example, is a precursor of eicosanoids (signalinghormones), and eicosanoids derived from EPA tend to im-pede inflammation associated with many chronic diseases(Morris 2011). Alpha-Linolenic acid (ALA), a precursor ofEPA, is hypothesized to support the growth and developmentof infants (Morris 2011). Individuals with ALA deficiencymay also experience neurological problems, such as numb-ness, weakness, and blurry vision (Holman et al. 1982;Trumbo et al. 2002). Docosahexaenoic acid (DHA) is re-quired for the development and maturation of the eyes, con-stituting up to 80% of total PUFAs in the retina (Innis 2003).
156 Environ. Rev. Vol. 20, 2012
Published by NRC Research Press
Env
iron
. Rev
. Dow
nloa
ded
from
ww
w.n
rcre
sear
chpr
ess.
com
by
Uni
vers
ity o
f T
oron
to o
n 09
/06/
12Fo
r pe
rson
al u
se o
nly.
Brain, retina, and sperm are the tissues in the human bodywith the highest DHA concentrations, and demand for DHAis particularly pressing during the latter stages of pregnancyand early infancy (Arterburn et al. 2006; Morris 2011).Fatty acids have various fates once assimilated into so-
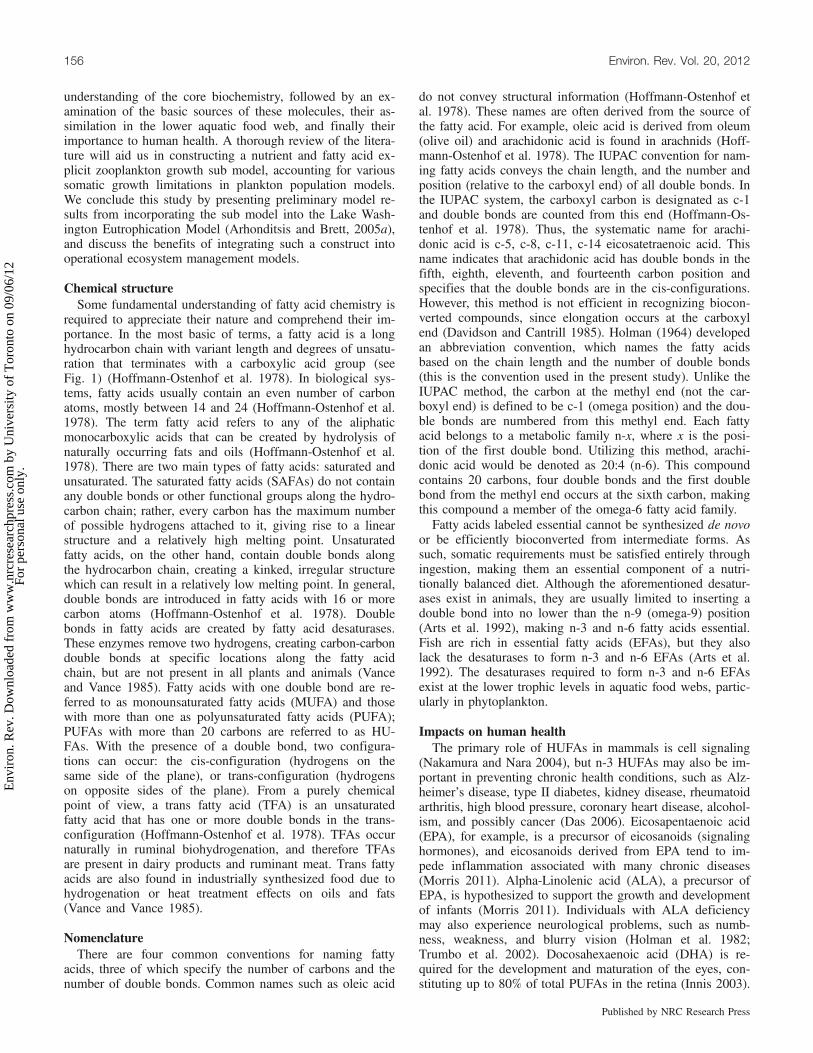
matic lipids and can been classified as storage and structuralcomponents. Storage lipids, such as wax esters, cholesterols,and triglycerols (TG) are neutral storage reserves, which canbe broken down for energy should the need arise (Lee et al.2006). Cholesterol is a sterol found in animal cells that canaccount for up to half of the lipid content in a plasma mem-brane, and thus affects its fluid behavior. Cholesterol mole-cules typically orient their small hydrophilic hydroxyl grouptoward the membrane surface, while the remainder is em-bedded in the lipid bilayer (see Fig. 2, and also Karp 2005).Cholesterol-rich micro-domains tend to float within the morefluid and disordered environment of the bilayer, formingwhat are referred to as lipid rafts. These floating cholesterolplatforms tend to concentrate proteins, whereby membranesare organized into functional compartments (Fig. 2). Lipidrafts provide a favorable local environment for cell-surfacereceptors to interact with other membrane proteins that trans-mit signals from the extracellular space to the cell interior(Karp 2005). Structural lipids, such as phospholipids, are po-lar molecules that form cellular membranes, effectively divid-ing cells into functional regions (e.g., cell membrane,
mitochondrial membrane, nuclear envelope, vacuole mem-brane). These lipids are arguably the most important inplants, but are generally considered unlikely sources of en-ergy (Lee et al. 2006).Sources of fatty acids in the human diet range from plant
oils from seeds and nuts (Calder 2004), to EFAs found infatty fish, such as salmon, tuna, herring, and mackerel. Thesefish species are oil-rich, storing dietary fat as triaglycerides(TGs) in their flesh (Lunn and Buttriss 2008)1. ALA is theprinciple source of n-3 fatty acids in the modern Westerndiet, but EPA and DHA dietary intake has decreased dramat-ically in the last century (Burdge and Calder 2005). This de-creasing trend is a major health concern, as ALA conversioninto long-chain n-3 HUFAs, such as EPA (approximately 8%)and DHA (approximately 4%), is inefficient (Burdge andCalder 2005). In the past, hunter-gatherer societies consumedn-6:n-3 HUFAs in the ratio of roughly 1:4 (De Henauw et al.2007). The same ratio in the modern western diet is 10–25:1(Simopoulos 1991)2. Prior to the Agricultural Revolution,consumption of wild plants, berries, nuts, and lean meat wassubstantial. In the last 10 000 years though, a large depend-ency on cereal grains, which are relatively high in n-6 HU-FAs compared to leafy green vegetables has become thenorm (Simopoulos 1991). Moreover, there has been an in-creased usage of vegetable oils instead of fish oils (Simopou-los 2002). The n-6:n-3 consumption balance is important, as
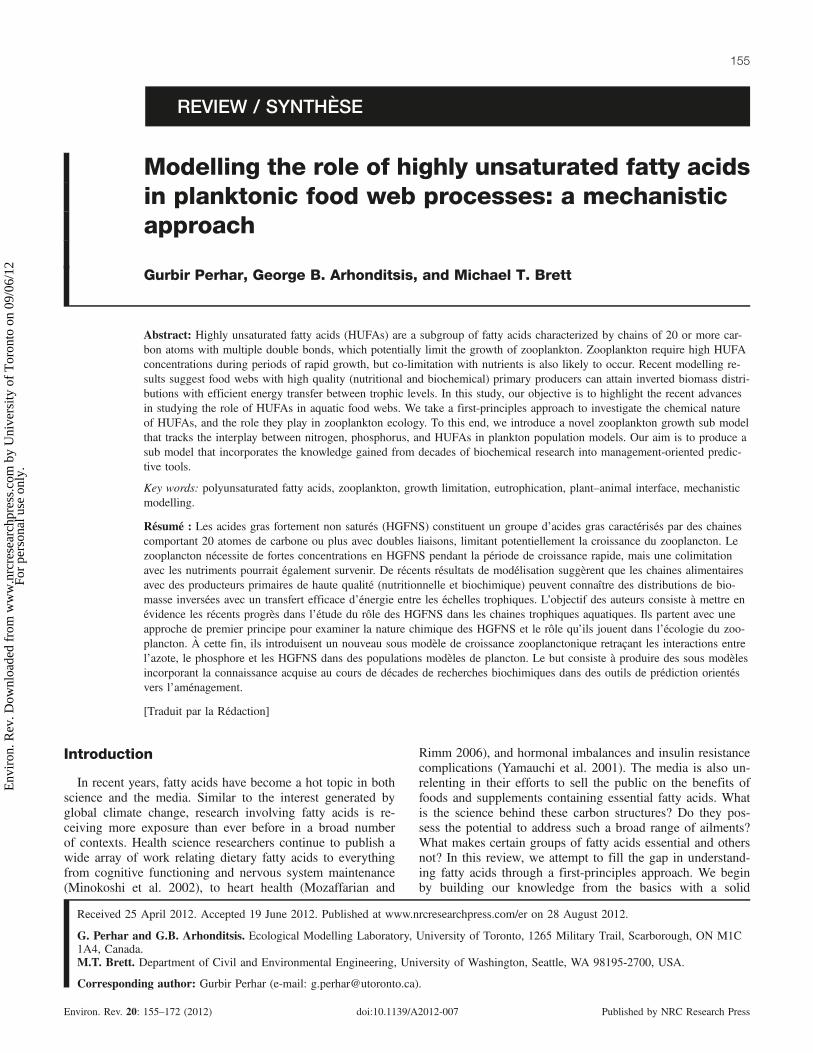
Fig. 1. List of fatty acids in aquatic food webs, their chemical abbreviations, structures, and diagrams. (a) Myristic Acid, SAFA. 14:0,C14H28O2; (b) Palmitoleic Acid, MUFA. 16:1 (n-7), C16H30O2; (c) Arachidonic Acid, PUFA. 20:4 (n-6) ARA, C20H32O2; (d) Linoleic Acid,PUFA. 18:2 (n-6) LA, C18H32O2; (e) Docosahexaenoic Acid, HUFA. 22:6 (n-3) DHA, C22H32O2; (f) Eicosapentaenoic Acid, HUFA. 20:5 (n-3) EPA, C20H30O2; (g) Alpha-Linolenic Acid, PUFA. 18:3 (n-3) ALA, C18H30O2.
1Lean fish can also be favourable for human nutrition; see Ahlgren et al. (1994).2This ratio can conceivably vary, especially in societies heavily dependent on seafood.
Perhar et al. 157
Published by NRC Research Press
Env
iron
. Rev
. Dow
nloa
ded
from
ww
w.n
rcre
sear
chpr
ess.
com
by
Uni
vers
ity o
f T
oron
to o
n 09
/06/
12Fo
r pe
rson
al u
se o
nly.
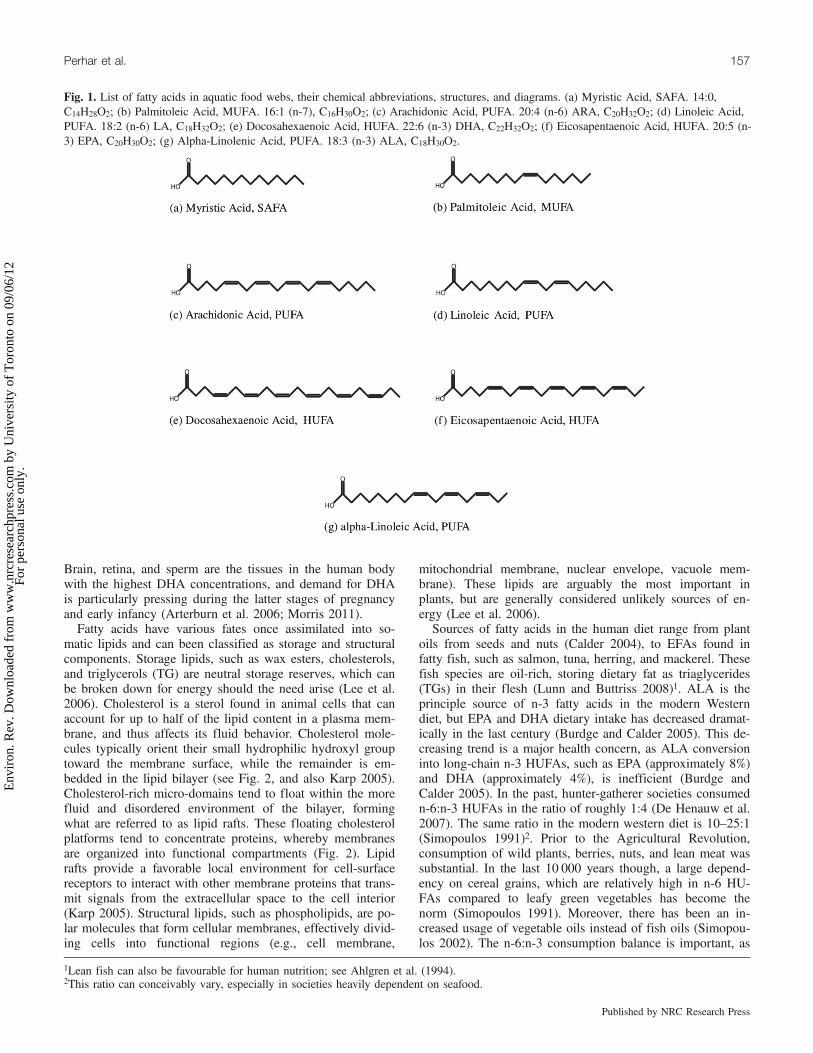
desaturase enzymes responsible for converting LA and ALAto long-chain HUFAs are concentration dependent (Simopou-los 1991; Portolesi et al. 2007). Because there is competitionbetween n-3 and n-6 fatty acids for the same desaturase en-zymes, a high consumption of n-6 HUFAs may hinder thebioconversion of ALA to EPA and DHA (Fig. 3).
Phytoplankton
Fatty acid synthesis and taxonomic differencesPrimary producers and consumers demonstrate greater dis-
parity with regards to their somatic elemental compositionrelative to other prey–predator relationships in the upperfood web (Persson and Vrede 2006). As such, consumers arerequired to preferentially retain nutrients and other importantmolecules while recycling excess material. In particular, PU-FAs are reported to be higher in zooplankton than seston,whereas MUFAs and SAFAs are higher in seston than inzooplankton (Persson and Vrede 2006). Planktonic primaryproducers have the ability to synthesize de novo n-3 PUFAs,whereby the addition of double bonds to SAFAs via D9,D12, and D15 desaturases leads to ALA formation (Bell andTocher 2009). High food quality algae and several consumerspecies use appropriate elongases, enzymes which lengthenfatty acid chains by two carbon atoms on the carboxyl end,to transform ALA to EPA and eventually to DHA (Bell andTocher 2009). ALA content of seston samples has been re-ported to be positively related to cyanobacteria abundance,while diatoms, dinoflagellates, and cryptophytes containhigher amounts of longer chained n-3 PUFAs (Brett et al.2009).The typical phytoplankton species available to herbivorous
zooplankton feeding vary greatly in regards to their fatty acidcontent (Volkman et al. 1989). Some differences also existbetween freshwater and marine phytoplankton, though mostlyminor within algal groups (Brett et al. 2009). It has been hy-pothesized that these differences could stem from differentadaptation levels of algae to their environment. Others cau-tion that this pattern may partly be associated with an aqua-culture bias, in that most of the marine phytoplankton fattyacid surveys are geared towards identifying taxa with poten-tial value as mariculture food stocks, thereby skewing themarine phytoplankton HUFA values (Brett et al. 2009). An-other possible systematic bias underlying the disparity be-
tween marine and freshwater studies may be that the formerones have high diatom encounters, whereas freshwater stud-ies are based on higher presence of cyanophytes. Generally,diatoms contain the largest amount of MUFAs (% dry mass),but their PUFA content is relatively low (18 carbons, n-3 andn-6). Diatoms do, however, have relatively high HUFA (>20carbons) content and n-3:n-6 ratios (Brett et al. 2009). Whilevery few studies are available for marine cyanobacteria,
Fig. 2. Depiction of phospholipid bilayer, showing regions of lipid raft formation (b) and non-raft forming regions (a and c).
Fig. 3. Mechanism demonstrating bioconversion of ALA to DHAvia desaturation and elongation. Fatty acids as listed from top tobottom: alpha-Linolenic acid (ALA), Stearidonic acid, 20: 4(n-3),Eicosapentaenoic acid (EPA), Docosapentaenoic acid (DPA), 24: 5(n-3), 24: 6(n-3), Docosahexaenoic acid (DHA). Peroxisomal oxida-tion occurs when fatty acid chains are too long for mitochondria tohandle.
158 Environ. Rev. Vol. 20, 2012
Published by NRC Research Press
Env
iron
. Rev
. Dow
nloa
ded
from
ww
w.n
rcre
sear
chpr
ess.
com
by
Uni
vers
ity o
f T
oron
to o
n 09
/06/
12Fo
r pe
rson
al u
se o
nly.
freshwater studies report high levels of SAFAs, very low lev-els of n-3 HUFAs (making it very low quality food) as wellas very low n-3:n-6 ratios. Both marine and freshwater cryp-tophytes have low MUFAs, very high PUFAs, moderate tohigh HUFAs, and a high n-3:n-6 ratio (Brett et al. 2009).Flagellates are shown to contain little EPA, but high propor-tions of DHA and therefore their use in aquaculture stemsfrom their ease of growth and high DHA content (Brett et al.2009).
Phytoplankton fatty acid content and seasonal planktondynamicsA great deal of research has focused on the seasonal varia-
bility of the zooplankton fatty acids in conjunction with thecontemporaneous changes in phytoplankton community com-position and the ambient conditions. Early work by Jeffries(1970) suggested that taxonomy is not the only determiningfactor of zooplankton fatty acid profiles, and reported a tightcausal linkage with the ingested prey. Biogenic seston fattyacid availability follows the phytoplankton succession pat-terns (Ravet et al. 2010). That is, the interplay between envi-ronmental conditions and nutrient loading regimes controlsthe dominant competitors of the algal community, and subse-quently the algal fatty acid content as well as the pertinentfluxes to consumers (Müller-Navarra et al. 2000). In particu-lar, the onset of thermal stratification in the spring along withthe high nutrient concentrations promote the rapid growth ofPUFA-rich nanoplankton and small diatoms, both of whichare heavily grazed by cladocerans (Fraser et al. 1989;Sommer 1986). As grazing exceeds primary production, bothpopulations crash, resulting in the so-called clear-water phase(Sommer 1986; Pinckney et al. 1998). Early to mid-summerphytoplankton abundance and community composition aremodulated by silicate depletion rates and (or) soluble phos-phorus availability, while cyanobacteria blooms usually occurlater in the summer (Sommer 1986). Cyanobacteria areknown to be poor food quality as a result of mechanical in-terference, toxicity, and (or) inadequate biochemical nutri-tional value for consumers (Müller-Navarra et al. 2000;Perhar and Arhonditsis 2009). Arts et al. (1992) showed thepoor food quality of cyanobacteria may stem from their nutri-tional inadequacy, as consumers exclusively fed cyanobacte-ria exhibited near-starvation traits. The increasing mixingdepth and decreasing day length in the autumn yields the an-nual minimum of phytoplankton biomass, mainly character-ized by chlorophyte dominance (Sommer 1986).Field samples show a very strong correlation between ses-
ton EPA:C and consumer growth, but a moderately weak cor-relation between seston P:C and consumer growth (Müller-Navarra et al. 2000). Müller-Navarra et al. (2004) explainthe effects of total phosphorus loading on zooplankton viafatty acid pathways, whereby increases in total phosphorusloading favors cyanobacteria dominance, which contain littlen-3 HUFAs, resulting in limited Daphnia egg production. Onthe other hand, the food quality of algae that are otherwisenutritionally beneficial to consumers is diminished when fac-ing P-deficient conditions (Ferrão-Filho et al. 2003). As totalphosphorus is decreased and algae becomes P stressed, EPAand DHA production appears to cease (Ferrão-Filho et al.2003). Yet, linoleic and linolenic acids are still produced andcan be potentially bioconverted into EPA and DHA, albeit
with low efficiency (Farkas and Herodek 1964; Ferrão-Filhoet al. 2003). Further, the indirect-limitation hypothesis pre-dicts that P-stressed algae pose problems of ingestion and as-similation for consumers (Van Donk et al. 1997). Namely,algae under poor nutrient conditions undergo morphologicalchanges (e.g., thickening of the cell wall), which can in turnresult in reduced digestion by consumers (Van Donk et al.1997). The findings of Ravet and Brett (2006) lent credibilityto the indirect-limitation hypothesis, and noted mutant algalspecies lacking cell walls (Van Donk et al. 1997) did notpose the same limitation on Daphnia relative to non-mutantstrains.
Zooplankton
Historical backgroundThe study of zooplankton fatty acids started with Lovern
(1935), who compared the fatty acids composition of the ma-rine calanoid copepod Calanus finmarchicus, and three fresh-water zooplankton species (Cyclops strenuous, Daphniagaleata, Diaptomus gracilis) vis-à-vis the fatty acids of thefish feeding on them. The resemblance in the correspondingfatty acid profiles led to the conclusion that fish deposit diet-ary lipids into their tissues with no major modifications. Sim-ilar conclusions were drawn by Ackman and Eaton (1966),who compared the fatty acids in krill (Meganyctiphanes nor-vegica) with the fatty acids in the fin whales that consumethem. Farkas and Herodek (1964) also noted an increase inzooplankton EPA and DHA concentrations as temperaturedecreased. In a subsequent study, Farkas (1979) similarlynoted that cladocerans tended to accumulate EPA, while co-pepods accumulated DHA. It was hypothesized that this dif-ference may be associated with their overwintering strategies;namely, cladocerans typically diapause and overwinter asresting eggs, while many copepods remain in an active state.In the same context, Farkas (1979) suggested that copepodsmay have the ability to bioconvert much of their EPA intoDHA as a homeoviscous adaptation to cold weather condi-tions, whereas daphnids (cladocerans) may have limited ca-pacity to do the same. This cold weather adaptation theorystemmed from the findings of Farkas and Herodek (1964), inwhich it was reported that the fatty acids in zooplankton al-ways had a lower melting point than the ambient water tem-perature. One of the most important studies of marinezooplankton fatty acid was published by Lee et al. (1971),who studied the dietary impact on wax esters (neutral storagelipids) in polar and deep living calanoid copepods. Theyfound a relationship between diet and the fatty acid composi-tion of wax esters in copepods, and also reported an increasein fatty acid concentration as food availability increased. Itwas also shown that structural lipids (phospholipids) werenot affected by diet, reflecting the animals’ ability to storefatty acids in periods of high food abundance.
Taxonomic differencesSubstantial research efforts have been focused on the fatty
acid dynamics in copepods (Scott et al. 2002). Marine cope-pods were shown to be particularly rich in lipids (35%–75%dry mass), primarily in wax esters and secondarily in triglycer-ides (Lee et al. 2006). The fatty alcohol component of wax es-ters are synthesized de novo from dietary carbohydrates and
Perhar et al. 159
Published by NRC Research Press
Env
iron
. Rev
. Dow
nloa
ded
from
ww
w.n
rcre
sear
chpr
ess.
com
by
Uni
vers
ity o
f T
oron
to o
n 09
/06/
12Fo
r pe
rson
al u
se o
nly.
proteins, and can therefore be used as fish biomarkers(Dalsgaard et al. 2003). Persson and Vrede (2006) classifiedzooplankton taxa according to their PUFA and HUFA con-tent. The general trend was consistent with the findings ofFarkas (1979) that established the aforementioned seasonalhypothesis, in that cladocerans were found to have highEPA and copepods high DHA concentrations. Farkas andHerodek (1964) also noted that marine environments aregenerally colder than freshwater, and that marine fish havehigher DHA concentrations than freshwater fish, an asser-tion on par with the cold weather adaptation theory. In anattempt to shed light on the different HUFA accumulationstrategies between cladocerans and copepods, Persson andVrede (2006) argued that may be related to the fact that co-pepods have more developed and refined nervous systemscompared to cladocerans. With intelligent predator avoid-ance abilities and raptorial prey attack, copepods can re-spond to stimuli within milliseconds (Lenz et al. 2000).Certain copepod species have chemoreceptors, utilized totaste food and track mates, and thick myelin sheaths cover-ing their axons, thereby achieving quick nerve impulsetimes. Because of these behavioural differences, the ques-tion arising is whether the increased DHA requirement incopepods actually stems from their overwintering strategiesor from their nervous system structure (Ravet et al. 2010).Persson and Vrede (2006) also stressed another important
pattern that involves the bioaccumulation of HUFAs up thefood chain. Herbivorous zooplankton were found to havehigher HUFA content than the grazed seston, while carnivo-rous zooplankton had higher HUFA concentrations relative toherbivorous animals. Müller-Navarra et al. (2004) attributethe HUFA bioaccumulation up the food chain to the zoo-plankton feeding patterns and diet. Namely, herbivorous zoo-plankton feed upon seston (characterized by low fatty acidcontent), while carnivorous zooplankton selectively feed onrotifers and crustacean zooplankton (both with relativelyhigh fatty acid content).
Impacts of diet on zooplankton fatty acid contentMany laboratory studies have examined the impacts of dif-
ferent diets on zooplankton fatty acid composition, reportingsimilarities between consumer fatty acid patterns and dietcontent. Storage lipids are especially sensitive to the diet con-tent (Langdon and Waldock 1981), and can be potentiallytraced through different trophic levels (Fraser et al. 1989).Dabramo and Sheen (1993) showed that the tissue fatty acidcontent of the freshwater prawn, Macrobrachium rosenbergii,reflected that of its artificially purified diet. SAFA andMUFA concentrations reportedly changed in response toPUFA additions. Further, n-3 PUFA levels decreased unlessprovided in the diet, while n-6 PUFA remained unchanged(or even increased) possibly due to differential metabolicrates (Dabramo and Sheen 1993). Weers et al. (1997) fedDaphnia galeata with combinations of algae and emulsionsof varying DHA:EPA values and found that increased DHA:EPA ratios led to an increase of the Daphnia DHA concentra-tion. Yet, there was still up to four times more EPA thanDHA, suggesting a retro-conversion mechanism undertakenby Daphnia, whereby ingested DHA was converted into EPA(Taipale et al. 2011). Similarly, Burns et al.’s (2011) experi-ments with the cladoceran Ceriodaphnia dubia showed that
this daphnid, even when fed with excess DHA, accumulatesvery little of this fatty acid. Daphnids also tend to accumulateless SAFAs and more MUFAs than what is available in theirdiet, possibly due to preferential utilization of SAFAs for ca-tabolic needs, while conserving unsaturated fatty acids (MU-FAs and PUFAs) for storage, structure, and bioconversion(Burns et al. 2011).A different perspective was offered by a handful of field
studies that focused on the fatty acid composition of fresh-water zooplankton in natural ecosystems. In particular, Pers-son and Vrede (2006) studied a series of alpine lakes inSweden, and found zooplankton to be greatly enriched withPUFA and HUFA relative to the seston. Yet, the same studyalso noted that zooplankton fatty acid composition was nearlyindependent of the seston fatty acid content, but closely re-lated to the zooplankton taxa. Likewise, Smyntek et al.(2008) reported a strong correlation between zooplanktonfatty acid content and their taxonomic affiliation, but virtu-ally no causal connection with seston fatty acid profiles. Theconclusions of the two studies were similar to those drawn byMüller-Navarra (2006), who observed a strong dependence inzooplankton fatty acid content when fed with purified algae(consisting of Scenedesmus obliquus, Cryptomonas erosa,and Nitzschia palea), but virtually no relation when fed withnatural seston diets. Kainz et al. (2004) studied the accumula-tion patterns of essential fatty acids across zooplankton sizeclasses in a series of lakes on Vancouver Island, Canada, andconcluded that all zooplankton sizes accumulated two to fourtimes the essential fatty acid content of seston. The results areon par with existing evidence that meso-zooplankton (copepods)tends to have higher DHA content, and macro-zooplankton(cladocerans) is characterized by higher EPA levels (Kainzet al. 2004). However, the notion of using animal size as aHUFA preference indicator has been challenged, given thatsmall cladocerans share more in common with large clado-cerans than they do with copepods (Kainz et al. 2004; Pers-son and Vrede 2006).A careful review of the pertinent literature suggests that
the dietary impacts on animal fatty acid content is not alwaysdiscernible. One plausible explanation that has been proposedhighlights the importance of the animal growth strategies. Inparticular, Brett et al. (2009) argued that this pattern may bedue to the fact that fast growing and relatively lean zooplank-ton species, such as the Daphnia used in the Müller-Navarra(2006) study, require only a short period of time to replacetheir lipid reserves with new dietary lipids, and thus the sig-nature of the seston fatty acid content is more easily detected.By contrast, marine copepods grow more slowly and build uplarge lipid reserves over a period of months, and any freshlyassimilated fatty acid content would be diluted into their lipidsomatic pool (Brett et al. 2009). Consistent with the assertionof Brett et al. (2009), Stübing et al. (2003) studied fatty acidaccumulation in larval euphausiids, which have high growthrates and relatively low lipid reserves, and their resultsshowed a clear causal link between fatty acid compositionand diet. Persson et al. (2007) offered a somewhat differentperspective arguing that freshwater zooplankton in oligotro-phic environments may often be limited by the food availabil-ity, and therefore allocate less ingested substrate towardreplenishing storage lipids. Food quantity limitation may re-sult in individuals not being able to perform basal metabolic
160 Environ. Rev. Vol. 20, 2012
Published by NRC Research Press
Env
iron
. Rev
. Dow
nloa
ded
from
ww
w.n
rcre
sear
chpr
ess.
com
by
Uni
vers
ity o
f T
oron
to o
n 09
/06/
12Fo
r pe
rson
al u
se o
nly.
processes and physiological maintenance. Elser and Urabe(1999) predict a critical point, at which food quantity andquality are evenly matched. Increasing quantity beyond thispoint gives rise to abundant carbon, making food quality thesole limiting factor. Further, Brett et al. (2009) pointed outthat zooplankton have the ability to modify somatic fattyacid profiles in response to diet, and that different groupswould be expected to have different self-regulatory capacities.
Internal regulation of fatty acidsThere is evidence that zooplankton can maintain a quasi-
homeostatic response to varying fatty acid availability in theirdiet. Müller-Navarra (2006) showed daphnids feeding onSAFA-rich cyanobacteria accumulated only half of the avail-able SAFA, but when fed upon MUFA-poor cryptophytes,twice the available MUFAs were accumulated. This studyrenders support to Jeffries (1970), by placing zooplanktontaxonomy ahead of prey characteristics when determiningfatty acid profiles and this likelihood brings into focus the in-ternal regulatory mechanisms in consumer species. In thiscontext, Brett et al. (2009) argued that the differences in fattyacid composition and response to diet among different zoo-plankton orders may be attributed to variable turnover rates.The turnover rate for a particular fatty acid is dependentupon the somatic fatty acid concentration (Jobling 2004). Ifthe initial tissue fatty acid content is low, fatty acid accumu-lation takes place with little turnover. Once the animal carry-ing capacity is reached, and accumulation no longer occurs,existing fatty acids can be replaced with new dietary sources(Jobling 2004). Graeve et al. (2005) experimentally testedfatty acid turnover rates, employing 13C labeled diets to de-termine the time needed for marine copepods to turn overtheir fatty acid pools. The same study concluded that Cala-nus hyperboreus exchanged nearly all of its lipid pool in11 days, whereas Calanus finmarchicus and Calanus glacia-lis exchanged 22% and 45% of their original pools after14 days, respectively (Graeve et al. 2005). It is also importantto note that lipid turnover rates appear to vary with growthrates, which in turn vary with age, food availability, andwater temperature (Graeve et al. 2005).
Reproductive investmentReproduction requires a large HUFA investment to subita-
neous eggs. Müller-Navarra (2006) found substantial varia-tion between cladoceran somatic tissue fatty acids and theirsubitaneous eggs. Daphnia spp. egg fatty acid and n-3HUFA concentrations were nearly double and triple the con-centrations found in maternal somatic tissues, respectively(Müller-Navarra 2006). In a similar study, Wacker and Mar-tin-Creuzburg (2007) found that Daphnia magna eggs con-tained significantly more SAFAs, MUFAs, PUFAs, andHUFAs (both n-3 and n-6) relative to their somatic tissuesregardless of their diet. Both studies showed that Daphnia in-vest fatty acids heavily in their eggs, and preferentially enrichthem with n-3 PUFAs (Wacker and Martin-Creuzburg 2007).On the other hand, little is known about PUFA requirementsin copepods, although their fatty acid variability (for reasonsother than their diet) is hypothesized to stem from differentdevelopmental stages, differential growth rates and egg pro-duction. During egg production, copepods convert storagelipids into phospholipids and transfer them to the gonads,
where they become part of the egg yolk (lipovitelin produc-tion; Müller-Navarra 2006). HUFAs in resting eggs providenewly hatched juvenile copepods with high growth-yieldmolecules. Given that cladoceran eggs have high PUFA andHUFA content compared to their somatic tissues, Müller-Navarra (2006) hypothesized that the same may hold true forcladocerans.
Temperature impactsNearly five decades after the Farkas and Herodek (1964)
study, little has been done to consolidate their findings andgain further insights into temperature impacts on zooplanktonfatty acid content. This study was the first to note that ac-tively overwintering zooplankton (e.g., copepods) were ableto strongly modify their fatty acid content in response to tem-perature (i.e., homeoviscous adaptation). Farkas and Herodek(1964) concluded that copepods increased their DHA concen-tration and decreased their SAFA content when stressed bycold water temperatures. Hazel (1995) noted almost all poiki-lotherms adapt to cold stress by increasing their PUFA andespecially HUFA content. It has been also surmised thatwhen zooplankton have limited ability to modify lipid com-position in response to cold weather conditions, then over-wintering in a non-active state (e.g., resting eggs) is the onlynatural selection (Farkas 1979).More recently, however, Arts et al. (1992) and Schlech-
triem et al. (2006) challenged Farkas’ notion of DHA impor-tance in cold water adaptation by highlighting the capacity ofcertain cladocerans to overwinter actively under ice coveredlakes. Schlechtriem et al. (2006) showed that Daphnia at 11°Chad four times higher EPA levels than in 22°C, but thecold-stressed animals still did not accumulate DHA. Nantonand Castell (1999) reported high concentrations of bothEPA and DHA in the tropical marine copepods Amonardiaand Tisbe, and thus questioned their importance in the coldweather membrane adaptation hypothesis all together. Thelatter finding raises the question whether high PUFA con-tent in zooplankton is actually vital for reasons other thanmembrane fluidity. For example, recent studies have focusedon the impact of starvation on zooplankton fatty acid com-position (Schlechtriem et al. 2006). Schlechtriem et al.(2006) showed that Daphnia pulex starved at 22°C diedafter 3 days with virtually no change to the fatty acidcomposition, while those starved at 11° C survived for anadditional 3 days. The daphnids studied at the lower tem-perature had markedly changed their fatty acid profiles,with large decreases in both SAFAs and MUFAs but rela-tively unchanged PUFAs and HUFAs, which probably sug-gests preferential catabolism of non-PUFA molecules.
Mechanistic sub model for zooplanktongrowth
MotivationAs the empirical evidence for the regulatory role of three
distinct and not mutually exclusive factors (P limitation, FAlimitation, and food quantity) on the strength of the primaryproducer-grazer coupling has grown, several models havebeen developed to advance our theoretical understanding ofwhere and when their individual and (or) synergistic effectsbecome important (Mulder and Bowden 2007). Considerable
Perhar et al. 161
Published by NRC Research Press
Env
iron
. Rev
. Dow
nloa
ded
from
ww
w.n
rcre
sear
chpr
ess.
com
by
Uni
vers
ity o
f T
oron
to o
n 09
/06/
12Fo
r pe
rson
al u
se o
nly.
insights into the potential implications of the ecological stoi-chiometry have been gained by a series of homeostatic con-sumer models that explicitly account for the effects of P-deficient food on zooplankton growth rate as well as on con-sumer-driven P recycling (e.g., Andersen 1997; Anderson etal. 2005). For example, Sterner (1997) modeled the effectsof food quantity (C) and quality (P) on the growth of homeo-static heterotrophic consumers, indicating that consumergrowth differs between high and low P food concentrationsonly when food quantity is above a critical level. Hence, twodiets might give identical consumer growth rates at low foodquantity, but may give different consumer growth at highfood quantity. Intriguing results were also presented by Lo-ladze et al. (2001), who modified the Rosenzweig–MacArthurvariation of the Lotka–Volterra equations and demonstratedthat the chemical heterogeneity in the first two trophic lev-els can transform the prey and predators into competitorsfor phosphorus. On the other hand, there is a surprising gapin the literature of predictive frameworks for the FA limita-tion, i.e., modeling studies that explicitly consider the con-straints on zooplankton growth pertinent to the biochemicalheterogeneity of the lake seston (Gulati and DeMott 1997;Arhonditsis and Brett 2005a, 2005b; Zhao et al. 2008). Tothis end, our objective is to develop a mathematical modelthat explicitly tracks the interplay between nitrogen, phospho-rus, and HUFAs in plankton ecosystem models. The pur-pose of this modeling construct is to elucidate themechanisms governing HUFA fate within the animal body,to evaluate the limitations imposed on zooplankton growth,and to subsequently quantify their transport through thefood web. It is our hope that the incorporation of theknowledge gained from decades of biochemical researchinto management-oriented predictive tools will provide amore robust platform to base management decisions off.
Model descriptionBased on the present review of the fatty acid literature, we
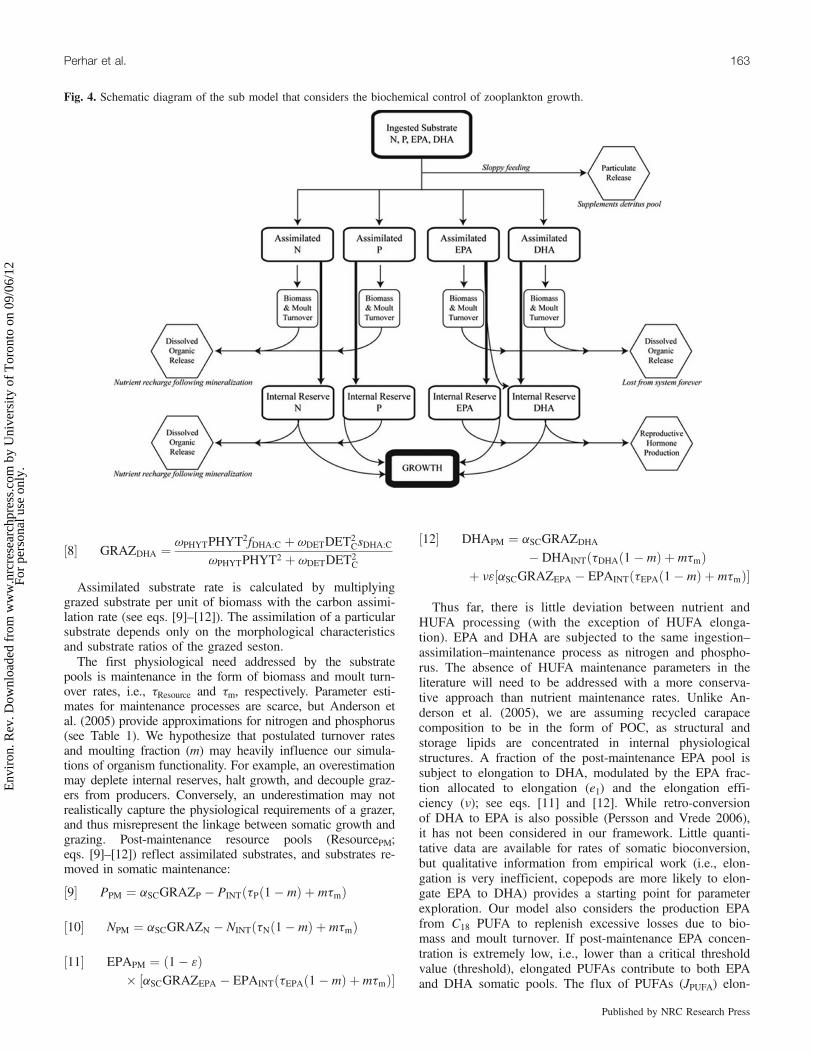
propose a modular addition to existing plankton food webmodels to accommodate the roles of nitrogen, phosphorus,and HUFAs on zooplankton growth. The proposed additionsinvolve the zooplankton differential equation, leaving all othercompartments unaltered. Individual-level parameters, such asmaximum grazing rate, food selection strategies, and higherpredation rate are carried over from the host model. The newadditions begin once food enters the feeding apparatus of thegrazer and our augmentation aims to track growth-limitingsubstrates through the zooplankton gut. In short, our proposi-tion is an individual-based model plugged into a planktonpopulation model, thereby offering the opportunity to test ani-mal physiology in conjunction with environmental variabilityand trophic interactions. We introduce differential equationsthat describe the dynamics of somatic nitrogen, phosphorus,EPA, and DHA, and thus characterize the limitation of zoo-plankton growth as a function of the aforementioned resourcepools. The following description tracks food particles from thewater column through the zooplankter’s gut, and illustratesthe multiple pathways and fates of the substrates accountedfor (see Fig. 4); collected parameter values and ranges fromthe literature are presented in the Table 1.The somatic processes taking place within a zooplankter are
split into three phases: pre-gut, maintenance, and post mainte-
nance. With the present mathematical depiction of zooplanktonphysiology, pre-gut processing comprises the ingestion and as-similation of the grazed food. Similar to our earlier work (Ar-honditsis and Brett 2005a, 2005b; Zhao et al. 2008; Perhar andArhonditsis 2009; Perhar et al. unpublished), we first introducethe variable total food quality concentration in eq. [1]:
½1� FQTOT ¼ ½FQ2PHYT
ffiffiffiffiffiffiffiffiffiffiffiffiffiPHYT
pþ FQ2
DET
ffiffiffiffiffiffiffiffiffiffiffiffiDETC
p�ZPLIM
Total food quality concentration considers the sum of allfood sources (i.e., PHYT and DETC) weighted by their re-spective food quality indices (i.e., FQPHYT and FQDET) re-flecting the morphological features (i.e., ingestibility,digestibility, and toxicity) of the grazed seston. We have in-cluded an additional parameter (ZPLIM; eq. [2] to account forsecondary limitation resulting from the imbalance betweenthe P:C ratio of the grazed seston (GRAZP ; see eq. [5] andthe critical minimum phosphorus somatic quota (Pmin):
½2� if GRAZP � Pmin ; ZPLIM ¼ GRAZP
Pmin
if GRAZP > Pmin ; ZPLIM ¼ 1
The inclusion of secondary limitation addresses the indirect-limitation hypothesis that states nutrient-stressed algae demon-strate morphological changes that reduce their digestibility forzooplankton. Total food quality determines the extent to whichingested food is either assimilated or egested (i.e., via sloppyfeeding) based on morphological characteristics. Respirationcosts are implicitly considered (aC1 and aC2) in the calculationof carbon assimilation efficiency (aC; eq. [3]):
½3� aC ¼ aC1FQTOT
aC2 þ FQTOT
To calculate the carbon assimilation rate (aSC; eq. [4], wefirst quantify the grazed carbon rate using zooplankton maxi-mum grazing rate (l), zooplankton grazing preference for phy-toplankton (uPHYT) and detritus (uDET), available phytoplanktonand detritus biomass, and the zooplankton grazing half satura-tion constant (µ). Multiplying by carbon assimilation efficiency,we calculate the carbon assimilation rate (aSC):
½4� aSC ¼ laCðuPHYTPHYT2 þ uDETDET
2CÞ
m2 þ uPHYTPHYT2 þ uDETDET
2C
The resource concentrations in algae and detritus (phospho-rus: PCPHYT and sP:C; nitrogen: NCPHYT and sN:C; EPA: fEPA:Cand sEPA:C; DHA: fDHA:C and sDHA:C) are weighted by abun-dance, allowing for the separation of grazed food per unit ofbiomass into four separate pools, i.e., phosphorus, nitrogen,EPA and DHA per unit biomass; eqs. [5]–[8], respectively:
½5� GRAZP ¼ uPHYTPHYT2PCPHYT þ uDETDET
2CsP:C
uPHYTPHYT2 þ uDETDET2C
½6� GRAZN ¼ uPHYTPHYT2NCPHYT þ uDETDET
2CsN:C
uPHYTPHYT2 þ uDETDET2C
½7� GRAZEPA ¼ uPHYTPHYT2fEPA:C þ uDETDET
2CsEPA:C
uPHYTPHYT2 þ uDETDET2C
162 Environ. Rev. Vol. 20, 2012
Published by NRC Research Press
Env
iron
. Rev
. Dow
nloa
ded
from
ww
w.n
rcre
sear
chpr
ess.
com
by
Uni
vers
ity o
f T
oron
to o
n 09
/06/
12Fo
r pe
rson
al u
se o
nly.
½8� GRAZDHA ¼ uPHYTPHYT2fDHA:C þ uDETDET
2CsDHA:C
uPHYTPHYT2 þ uDETDET2C
Assimilated substrate rate is calculated by multiplyinggrazed substrate per unit of biomass with the carbon assimi-lation rate (see eqs. [9]–[12]). The assimilation of a particularsubstrate depends only on the morphological characteristicsand substrate ratios of the grazed seston.The first physiological need addressed by the substrate
pools is maintenance in the form of biomass and moult turn-over rates, i.e., tResource and tm, respectively. Parameter esti-mates for maintenance processes are scarce, but Anderson etal. (2005) provide approximations for nitrogen and phosphorus(see Table 1). We hypothesize that postulated turnover ratesand moulting fraction (m) may heavily influence our simula-tions of organism functionality. For example, an overestimationmay deplete internal reserves, halt growth, and decouple graz-ers from producers. Conversely, an underestimation may notrealistically capture the physiological requirements of a grazer,and thus misrepresent the linkage between somatic growth andgrazing. Post-maintenance resource pools (ResourcePM;eqs. [9]–[12]) reflect assimilated substrates, and substrates re-moved in somatic maintenance:
½9� PPM ¼ aSCGRAZP � PINTðtPð1� mÞ þ mtmÞ
½10� NPM ¼ aSCGRAZN � NINTðtNð1� mÞ þ mtmÞ
½11� EPAPM ¼ ð1� 3Þ� ½aSCGRAZEPA � EPAINTðtEPAð1� mÞ þ mtmÞ�
½12� DHAPM ¼ aSCGRAZDHA
� DHAINTðtDHAð1� mÞ þ mtmÞþ n3½aSCGRAZEPA � EPAINTðtEPAð1� mÞ þ mtmÞ�
Thus far, there is little deviation between nutrient andHUFA processing (with the exception of HUFA elonga-tion). EPA and DHA are subjected to the same ingestion–assimilation–maintenance process as nitrogen and phospho-rus. The absence of HUFA maintenance parameters in theliterature will need to be addressed with a more conserva-tive approach than nutrient maintenance rates. Unlike An-derson et al. (2005), we are assuming recycled carapacecomposition to be in the form of POC, as structural andstorage lipids are concentrated in internal physiologicalstructures. A fraction of the post-maintenance EPA pool issubject to elongation to DHA, modulated by the EPA frac-tion allocated to elongation (e1) and the elongation effi-ciency (n); see eqs. [11] and [12]. While retro-conversionof DHA to EPA is also possible (Persson and Vrede 2006),it has not been considered in our framework. Little quanti-tative data are available for rates of somatic bioconversion,but qualitative information from empirical work (i.e., elon-gation is very inefficient, copepods are more likely to elon-gate EPA to DHA) provides a starting point for parameterexploration. Our model also considers the production EPAfrom C18 PUFA to replenish excessive losses due to bio-mass and moult turnover. If post-maintenance EPA concen-tration is extremely low, i.e., lower than a critical thresholdvalue (threshold), elongated PUFAs contribute to both EPAand DHA somatic pools. The flux of PUFAs (JPUFA) elon-
Fig. 4. Schematic diagram of the sub model that considers the biochemical control of zooplankton growth.
Perhar et al. 163
Published by NRC Research Press
Env
iron
. Rev
. Dow
nloa
ded
from
ww
w.n
rcre
sear
chpr
ess.
com
by
Uni
vers
ity o
f T
oron
to o
n 09
/06/
12Fo
r pe
rson
al u
se o
nly.
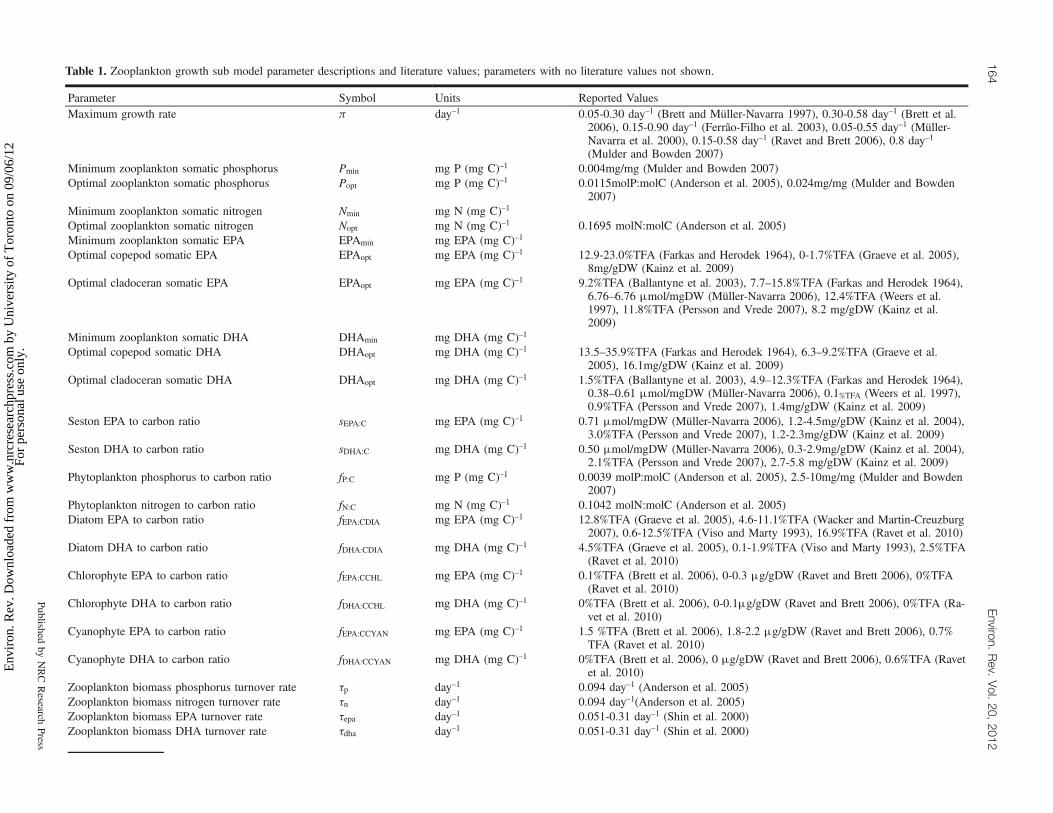
Table 1. Zooplankton growth sub model parameter descriptions and literature values; parameters with no literature values not shown.
Parameter Symbol Units Reported ValuesMaximum growth rate p day–1 0.05-0.30 day–1 (Brett and Müller-Navarra 1997), 0.30-0.58 day–1 (Brett et al.
2006), 0.15-0.90 day–1 (Ferrão-Filho et al. 2003), 0.05-0.55 day–1 (Müller-Navarra et al. 2000), 0.15-0.58 day–1 (Ravet and Brett 2006), 0.8 day–1(Mulder and Bowden 2007)
Minimum zooplankton somatic phosphorus Pmin mg P (mg C)–1 0.004mg/mg (Mulder and Bowden 2007)Optimal zooplankton somatic phosphorus Popt mg P (mg C)–1 0.0115molP:molC (Anderson et al. 2005), 0.024mg/mg (Mulder and Bowden
2007)Minimum zooplankton somatic nitrogen Nmin mg N (mg C)–1
Optimal zooplankton somatic nitrogen Nopt mg N (mg C)–1 0.1695 molN:molC (Anderson et al. 2005)Minimum zooplankton somatic EPA EPAmin mg EPA (mg C)–1
Optimal copepod somatic EPA EPAopt mg EPA (mg C)–1 12.9-23.0%TFA (Farkas and Herodek 1964), 0-1.7%TFA (Graeve et al. 2005),8mg/gDW (Kainz et al. 2009)
Optimal cladoceran somatic EPA EPAopt mg EPA (mg C)–1 9.2%TFA (Ballantyne et al. 2003), 7.7–15.8%TFA (Farkas and Herodek 1964),6.76–6.76 mmol/mgDW (Müller-Navarra 2006), 12.4%TFA (Weers et al.1997), 11.8%TFA (Persson and Vrede 2007), 8.2 mg/gDW (Kainz et al.2009)
Minimum zooplankton somatic DHA DHAmin mg DHA (mg C)–1
Optimal copepod somatic DHA DHAopt mg DHA (mg C)–1 13.5–35.9%TFA (Farkas and Herodek 1964), 6.3–9.2%TFA (Graeve et al.2005), 16.1mg/gDW (Kainz et al. 2009)
Optimal cladoceran somatic DHA DHAopt mg DHA (mg C)–1 1.5%TFA (Ballantyne et al. 2003), 4.9–12.3%TFA (Farkas and Herodek 1964),0.38–0.61 mmol/mgDW (Müller-Navarra 2006), 0.1%TFA (Weers et al. 1997),0.9%TFA (Persson and Vrede 2007), 1.4mg/gDW (Kainz et al. 2009)
Seston EPA to carbon ratio sEPA:C mg EPA (mg C)–1 0.71 mmol/mgDW (Müller-Navarra 2006), 1.2-4.5mg/gDW (Kainz et al. 2004),3.0%TFA (Persson and Vrede 2007), 1.2-2.3mg/gDW (Kainz et al. 2009)
Seston DHA to carbon ratio sDHA:C mg DHA (mg C)–1 0.50 mmol/mgDW (Müller-Navarra 2006), 0.3-2.9mg/gDW (Kainz et al. 2004),2.1%TFA (Persson and Vrede 2007), 2.7-5.8 mg/gDW (Kainz et al. 2009)
Phytoplankton phosphorus to carbon ratio fP:C mg P (mg C)–1 0.0039 molP:molC (Anderson et al. 2005), 2.5-10mg/mg (Mulder and Bowden2007)
Phytoplankton nitrogen to carbon ratio fN:C mg N (mg C)–1 0.1042 molN:molC (Anderson et al. 2005)Diatom EPA to carbon ratio fEPA:CDIA mg EPA (mg C)–1 12.8%TFA (Graeve et al. 2005), 4.6-11.1%TFA (Wacker and Martin-Creuzburg
2007), 0.6-12.5%TFA (Viso and Marty 1993), 16.9%TFA (Ravet et al. 2010)Diatom DHA to carbon ratio fDHA:CDIA mg DHA (mg C)–1 4.5%TFA (Graeve et al. 2005), 0.1-1.9%TFA (Viso and Marty 1993), 2.5%TFA
(Ravet et al. 2010)Chlorophyte EPA to carbon ratio fEPA:CCHL mg EPA (mg C)–1 0.1%TFA (Brett et al. 2006), 0-0.3 mg/gDW (Ravet and Brett 2006), 0%TFA
(Ravet et al. 2010)Chlorophyte DHA to carbon ratio fDHA:CCHL mg DHA (mg C)–1 0%TFA (Brett et al. 2006), 0-0.1mg/gDW (Ravet and Brett 2006), 0%TFA (Ra-
vet et al. 2010)Cyanophyte EPA to carbon ratio fEPA:CCYAN mg EPA (mg C)–1 1.5 %TFA (Brett et al. 2006), 1.8-2.2 mg/gDW (Ravet and Brett 2006), 0.7%
TFA (Ravet et al. 2010)Cyanophyte DHA to carbon ratio fDHA:CCYAN mg DHA (mg C)–1 0%TFA (Brett et al. 2006), 0 mg/gDW (Ravet and Brett 2006), 0.6%TFA (Ravet
et al. 2010)Zooplankton biomass phosphorus turnover rate tp day–1 0.094 day–1 (Anderson et al. 2005)Zooplankton biomass nitrogen turnover rate tn day–1 0.094 day–1(Anderson et al. 2005)Zooplankton biomass EPA turnover rate tepa day–1 0.051-0.31 day–1 (Shin et al. 2000)Zooplankton biomass DHA turnover rate tdha day–1 0.051-0.31 day–1 (Shin et al. 2000)
164Environ.
Rev.
Vol.20,
2012
Publishedby
NRCResearch
Press
Env
iron
. Rev
. Dow
nloa
ded
from
ww
w.n
rcre
sear
chpr
ess.
com
by
Uni
vers
ity o
f T
oron
to o
n 09
/06/
12Fo
r pe
rson
al u
se o
nly.
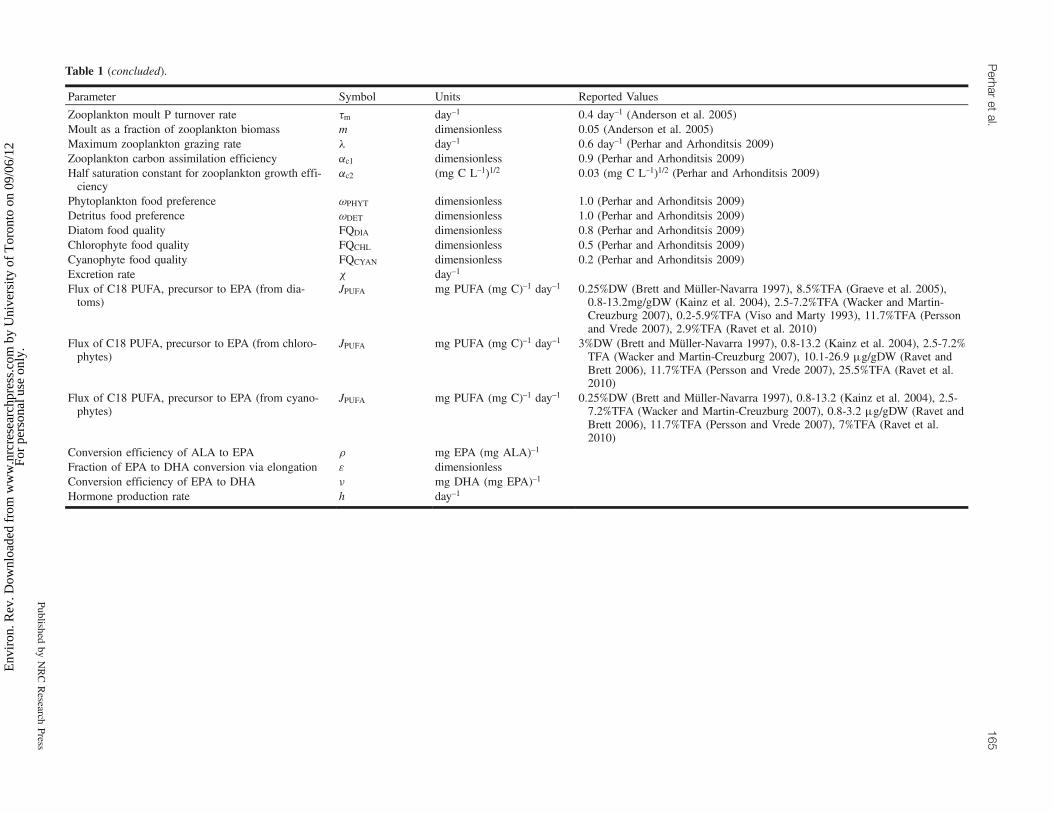
Table 1 (concluded).
Parameter Symbol Units Reported Values
Zooplankton moult P turnover rate tm day–1 0.4 day–1 (Anderson et al. 2005)Moult as a fraction of zooplankton biomass m dimensionless 0.05 (Anderson et al. 2005)Maximum zooplankton grazing rate l day–1 0.6 day–1 (Perhar and Arhonditsis 2009)Zooplankton carbon assimilation efficiency ac1 dimensionless 0.9 (Perhar and Arhonditsis 2009)Half saturation constant for zooplankton growth effi-ciency
ac2 (mg C L–1)1/2 0.03 (mg C L–1)1/2 (Perhar and Arhonditsis 2009)
Phytoplankton food preference uPHYT dimensionless 1.0 (Perhar and Arhonditsis 2009)Detritus food preference uDET dimensionless 1.0 (Perhar and Arhonditsis 2009)Diatom food quality FQDIA dimensionless 0.8 (Perhar and Arhonditsis 2009)Chlorophyte food quality FQCHL dimensionless 0.5 (Perhar and Arhonditsis 2009)Cyanophyte food quality FQCYAN dimensionless 0.2 (Perhar and Arhonditsis 2009)Excretion rate c day–1
Flux of C18 PUFA, precursor to EPA (from dia-toms)
JPUFA mg PUFA (mg C)–1 day–1 0.25%DW (Brett and Müller-Navarra 1997), 8.5%TFA (Graeve et al. 2005),0.8-13.2mg/gDW (Kainz et al. 2004), 2.5-7.2%TFA (Wacker and Martin-Creuzburg 2007), 0.2-5.9%TFA (Viso and Marty 1993), 11.7%TFA (Perssonand Vrede 2007), 2.9%TFA (Ravet et al. 2010)
Flux of C18 PUFA, precursor to EPA (from chloro-phytes)
JPUFA mg PUFA (mg C)–1 day–1 3%DW (Brett and Müller-Navarra 1997), 0.8-13.2 (Kainz et al. 2004), 2.5-7.2%TFA (Wacker and Martin-Creuzburg 2007), 10.1-26.9 mg/gDW (Ravet andBrett 2006), 11.7%TFA (Persson and Vrede 2007), 25.5%TFA (Ravet et al.2010)
Flux of C18 PUFA, precursor to EPA (from cyano-phytes)
JPUFA mg PUFA (mg C)–1 day–1 0.25%DW (Brett and Müller-Navarra 1997), 0.8-13.2 (Kainz et al. 2004), 2.5-7.2%TFA (Wacker and Martin-Creuzburg 2007), 0.8-3.2 mg/gDW (Ravet andBrett 2006), 11.7%TFA (Persson and Vrede 2007), 7%TFA (Ravet et al.2010)
Conversion efficiency of ALA to EPA r mg EPA (mg ALA)–1
Fraction of EPA to DHA conversion via elongation 3 dimensionlessConversion efficiency of EPA to DHA n mg DHA (mg EPA)–1
Hormone production rate h day–1
Perhar
etal.
165
Publishedby
NRCResearch
Press
Env
iron
. Rev
. Dow
nloa
ded
from
ww
w.n
rcre
sear
chpr
ess.
com
by
Uni
vers
ity o
f T
oron
to o
n 09
/06/
12Fo
r pe
rson
al u
se o
nly.
gated to EPA are controlled by the PUFA-EPA elongationefficiency (r; see eqs. [13] and [14]):
½13� if EPAPM � threshold;
EPAPM ¼ aSCGRAZEPA � EPAINTðtEPAð1� mÞ þ mtmÞþ ð1� 3ÞJPUFAr
½14� DHAPM ¼ aSCGRAZDHA
� DHAINTðtDHAð1� mÞ þ mtmÞþ 3JPUFArn
In a subsequent study, we investigate model sensitivity andbehavior and provide logical rules that determine the se-quence of different internal processes and the threshold con-ditions under which these mechanisms are triggered and (or)switched off (Perhar et al. unpublished).Finally, there are post-maintenance costs to consider for
each resource pool before somatic growth (Growth) and inter-nal resource concentrations are calculated. The nitrogen andphosphorus pools are subjected to a regulated release fraction(c). Conceptually, these releases represent post-gut excretionin the forms of urine and feces, but can also be thought of asa homeostatic regulation mechanism. Once accounted for, thesomatic nutrient concentration differential equations can becalculated as
½15� dPINT
dt¼ PPM � GrowthPINT � cPPINT
½16� dNINT
dt¼ NPM � GrowthNINT � cNNINT
Pre-gut regulation released substrate into the water columnin particulate form (via sloppy feeding), but maintenance by-products and post-maintenance release can be fractionatedinto particulate and dissolved forms, and broken down intodifferent dissolved nutrient forms (e.g., nitrate, ammonium,dissolved organic nitrogen), depending on the specificationof the host plankton population model. Empirical work hasshown cladocerans release phosphorus even under severephosphorus limiting conditions (DeMott et al. 1998), but thismay reflect maintenance turnover rather than post-growthregulation/release. Fractions of post- maintenance EPA andDHA pools are subjected to hormone production (hEPA andhDHA). These HUFA subtractions are analogous to reproduc-tive investments (via hormone production and HUFA amass-ing in eggs); once accounted for, the somatic HUFAconcentration differential equations can be specified as fol-lows:
½17� dEPAINT
dt¼ EPAPM � GrowthEPAINT � hEPAEPAINT
½18� dDHAINT
dt¼ DHAPM � GrowthDHAINT
� hDHADHAINT
We do not explicitly account for reproduction, but havequalitative data to parameterize our proxy parameter (h; Smyn-tek et al. 2008). Once all somatic processes are accounted for,resource saturation quotients (gLIMRESOURCE
) are calculated:
½19� gLIMP¼ PINT � Pmin
Popt � Pmin
½20� gLIMN¼ NINT � Nmin
Nopt � Nmin
½21� gLIMEPA¼ EPAINT � EPAmin
EPAopt � EPAmin
½22� gLIMDHA¼ DHAINT � DHAmin
DHAopt � DHAmin
The purpose of the saturation quotients is to evaluate thedegree to which somatic quotas are being met. To define thesaturation quotients, the differences between internal andminimum quotas are used as dividends, and the divisors arethe differences between optimal and minimum quotas. Thesesaturation quotients (ranging from 0 when a resource pool isdepleted, to 1 when a resource pool is saturated) are the driv-ers of zooplankton somatic growth, and may be considered ina number of ways. One possible approach resembles Liebig’sLaw of the Minimum, postulating that the grazer growth islimited by the resource in shortest supply, with no regard forwhether it stems from a mineral or HUFA deficiency. Thesecond approach separately considers the effects of mineraland HUFA limitation. That is, the product of the lowest min-eral limitation (i.e., nitrogen or phosphorus), the lowestHUFA limitation (i.e., EPA or DHA) and maximum growthrate (p) yield zooplankton actual growth rate. The third ap-proach considers all four saturation quotients in a multiplica-tive form; zooplankton actual growth rate would be theproduct of maximum growth rate, nitrogen, phosphorus,EPA, and DHA saturation. The three strategies outlined putincreasing pressure on growth limitation. Consider for exam-ple that each resource pool is 75% saturated. Under the firststrategy, zooplankton growth rate is 75% of the maximumgrowth rate; with the second this falls to 56% of the maxi-mum growth rate (0.752 = 0.56); while the final approachfalls the growth rate to 32% of the maximum growth rate(0.754 = 0.32). As such, the second or third approach mayexcessively limit zooplankton somatic growth. It is importantto note, however, that when growth is limited by an individ-ual resource, the limitation does not imply resource starva-tion, but that it is the resource least saturated in the grazer’sbody and thus determines the growth rate.
½23� Growth ¼ pmin½gLIMP; gLIMN
; gLIMEPA; gLIMDHA
�
The challenge with the explicit consideration of HUFAsand minerals in a population model is the inevitable fusionof homeostatic processes at the individual level with popula-tion-scale dynamics. Anderson et al. (2005) noted this diffi-culty, stating,
“introducing stoichiometric constraints into theoretical andempirical studies of population dynamics will require a farmore comprehensive and explicit integration of populationand ecosystem perspectives than has previously beenachieved.”
166 Environ. Rev. Vol. 20, 2012
Published by NRC Research Press
Env
iron
. Rev
. Dow
nloa
ded
from
ww
w.n
rcre
sear
chpr
ess.
com
by
Uni
vers
ity o
f T
oron
to o
n 09
/06/
12Fo
r pe
rson
al u
se o
nly.
Integrating a homeostatic individual-based sub model witha plankton population model yields an expensive construct,based on the number of parameters considered. While manyof the processes are lacking data in the literature, future sensi-tivity analyses and calibration exercises are likely to delineateplausible regions and may facilitate their realistic characteriza-tion (Perhar et al. unpublished). In this regard, the proliferationof a physiologically explicit approach to modeling planktoncommunities may not only make management decisions viawater quality models more robust, but should also provide astarting point for empirical work to validate/challenge themathematical outputs and hypotheses generated.
ApplicationThe dynamics and sensitivity of the zooplankton growth
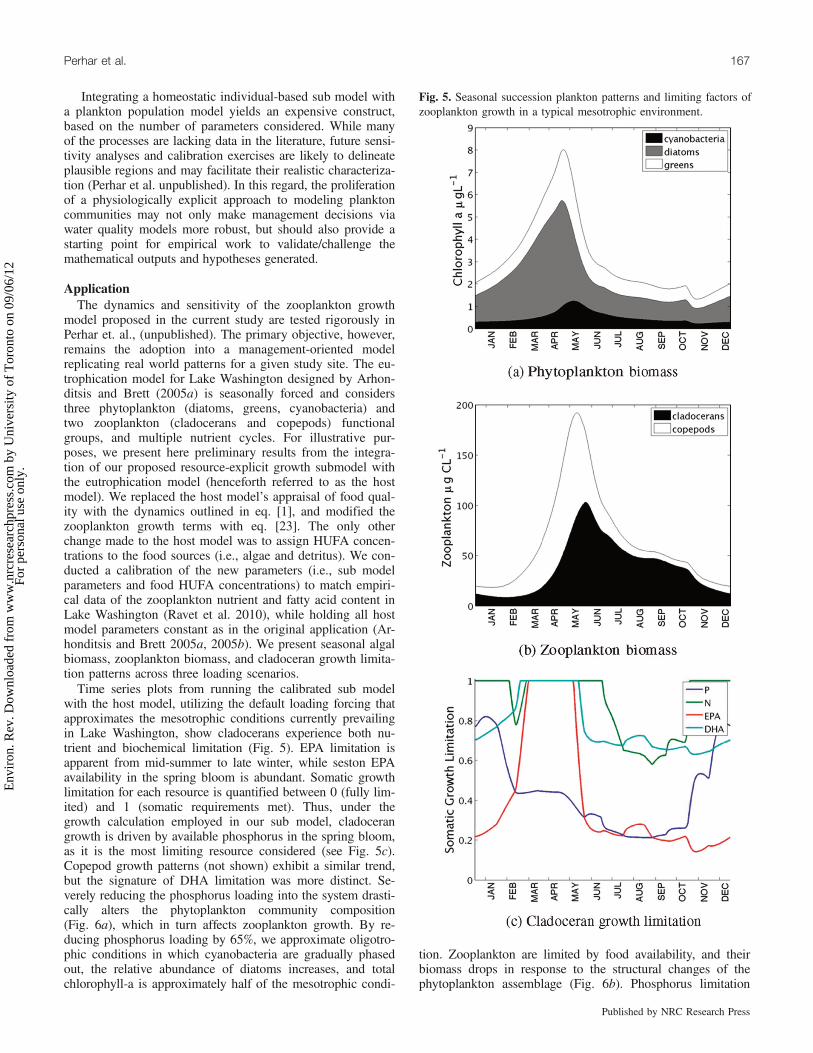
model proposed in the current study are tested rigorously inPerhar et. al., (unpublished). The primary objective, however,remains the adoption into a management-oriented modelreplicating real world patterns for a given study site. The eu-trophication model for Lake Washington designed by Arhon-ditsis and Brett (2005a) is seasonally forced and considersthree phytoplankton (diatoms, greens, cyanobacteria) andtwo zooplankton (cladocerans and copepods) functionalgroups, and multiple nutrient cycles. For illustrative pur-poses, we present here preliminary results from the integra-tion of our proposed resource-explicit growth submodel withthe eutrophication model (henceforth referred to as the hostmodel). We replaced the host model’s appraisal of food qual-ity with the dynamics outlined in eq. [1], and modified thezooplankton growth terms with eq. [23]. The only otherchange made to the host model was to assign HUFA concen-trations to the food sources (i.e., algae and detritus). We con-ducted a calibration of the new parameters (i.e., sub modelparameters and food HUFA concentrations) to match empiri-cal data of the zooplankton nutrient and fatty acid content inLake Washington (Ravet et al. 2010), while holding all hostmodel parameters constant as in the original application (Ar-honditsis and Brett 2005a, 2005b). We present seasonal algalbiomass, zooplankton biomass, and cladoceran growth limita-tion patterns across three loading scenarios.Time series plots from running the calibrated sub model
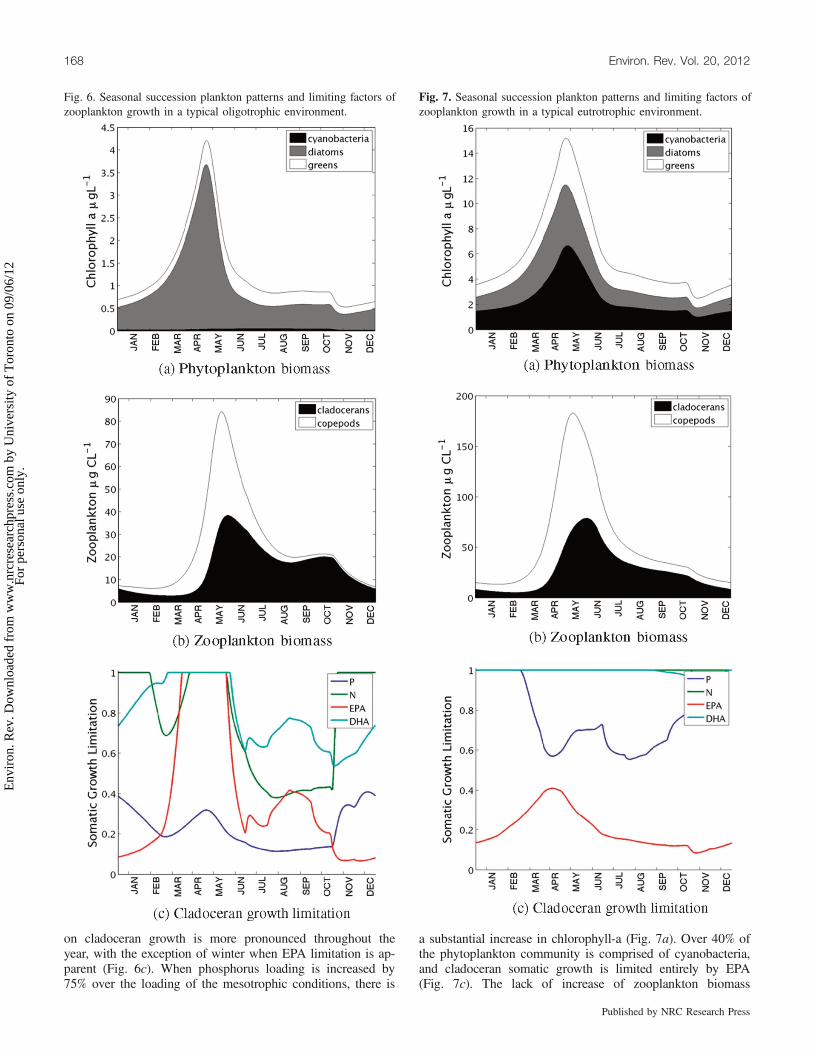
with the host model, utilizing the default loading forcing thatapproximates the mesotrophic conditions currently prevailingin Lake Washington, show cladocerans experience both nu-trient and biochemical limitation (Fig. 5). EPA limitation isapparent from mid-summer to late winter, while seston EPAavailability in the spring bloom is abundant. Somatic growthlimitation for each resource is quantified between 0 (fully lim-ited) and 1 (somatic requirements met). Thus, under thegrowth calculation employed in our sub model, cladocerangrowth is driven by available phosphorus in the spring bloom,as it is the most limiting resource considered (see Fig. 5c).Copepod growth patterns (not shown) exhibit a similar trend,but the signature of DHA limitation was more distinct. Se-verely reducing the phosphorus loading into the system drasti-cally alters the phytoplankton community composition(Fig. 6a), which in turn affects zooplankton growth. By re-ducing phosphorus loading by 65%, we approximate oligotro-phic conditions in which cyanobacteria are gradually phasedout, the relative abundance of diatoms increases, and totalchlorophyll-a is approximately half of the mesotrophic condi-
tion. Zooplankton are limited by food availability, and theirbiomass drops in response to the structural changes of thephytoplankton assemblage (Fig. 6b). Phosphorus limitation
Fig. 5. Seasonal succession plankton patterns and limiting factors ofzooplankton growth in a typical mesotrophic environment.
Perhar et al. 167
Published by NRC Research Press
Env
iron
. Rev
. Dow
nloa
ded
from
ww
w.n
rcre
sear
chpr
ess.
com
by
Uni
vers
ity o
f T
oron
to o
n 09
/06/
12Fo
r pe
rson
al u
se o
nly.
on cladoceran growth is more pronounced throughout theyear, with the exception of winter when EPA limitation is ap-parent (Fig. 6c). When phosphorus loading is increased by75% over the loading of the mesotrophic conditions, there is
a substantial increase in chlorophyll-a (Fig. 7a). Over 40% ofthe phytoplankton community is comprised of cyanobacteria,and cladoceran somatic growth is limited entirely by EPA(Fig. 7c). The lack of increase of zooplankton biomass
Fig. 6. Seasonal succession plankton patterns and limiting factors ofzooplankton growth in a typical oligotrophic environment.
Fig. 7. Seasonal succession plankton patterns and limiting factors ofzooplankton growth in a typical eutrotrophic environment.
168 Environ. Rev. Vol. 20, 2012
Published by NRC Research Press
Env
iron
. Rev
. Dow
nloa
ded
from
ww
w.n
rcre
sear
chpr
ess.
com
by
Uni
vers
ity o
f T
oron
to o
n 09
/06/
12Fo
r pe
rson
al u
se o
nly.
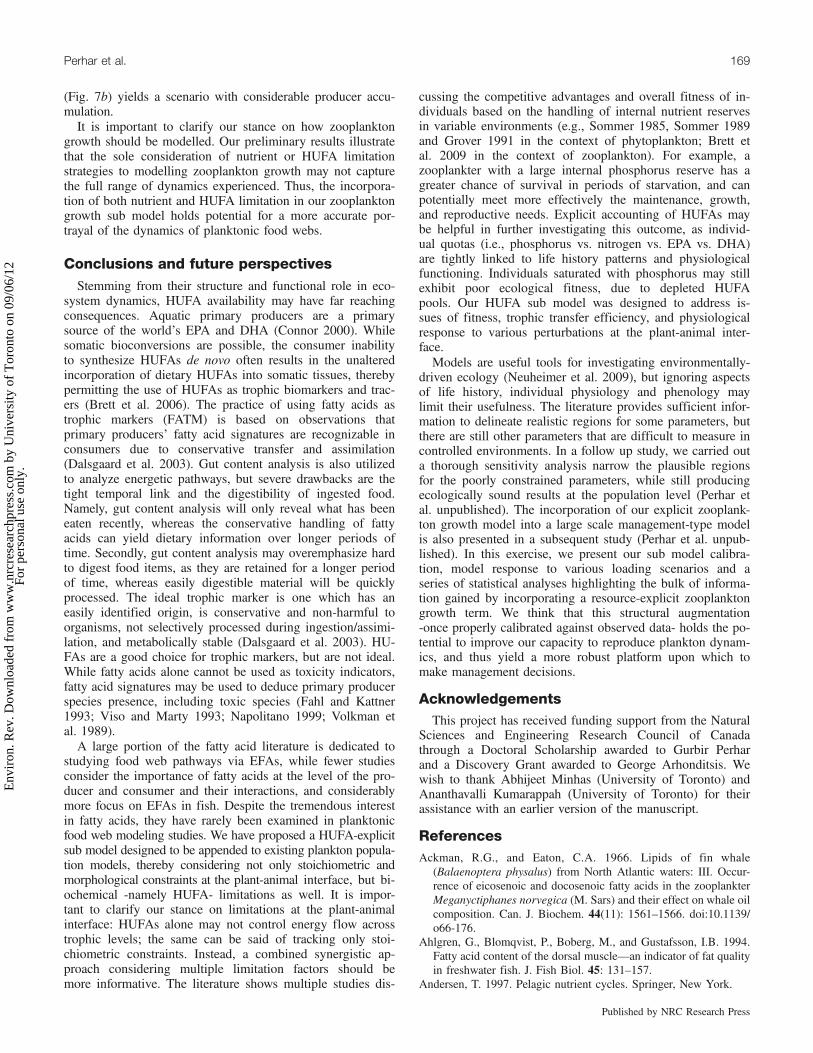
(Fig. 7b) yields a scenario with considerable producer accu-mulation.It is important to clarify our stance on how zooplankton
growth should be modelled. Our preliminary results illustratethat the sole consideration of nutrient or HUFA limitationstrategies to modelling zooplankton growth may not capturethe full range of dynamics experienced. Thus, the incorpora-tion of both nutrient and HUFA limitation in our zooplanktongrowth sub model holds potential for a more accurate por-trayal of the dynamics of planktonic food webs.
Conclusions and future perspectivesStemming from their structure and functional role in eco-
system dynamics, HUFA availability may have far reachingconsequences. Aquatic primary producers are a primarysource of the world’s EPA and DHA (Connor 2000). Whilesomatic bioconversions are possible, the consumer inabilityto synthesize HUFAs de novo often results in the unalteredincorporation of dietary HUFAs into somatic tissues, therebypermitting the use of HUFAs as trophic biomarkers and trac-ers (Brett et al. 2006). The practice of using fatty acids astrophic markers (FATM) is based on observations thatprimary producers’ fatty acid signatures are recognizable inconsumers due to conservative transfer and assimilation(Dalsgaard et al. 2003). Gut content analysis is also utilizedto analyze energetic pathways, but severe drawbacks are thetight temporal link and the digestibility of ingested food.Namely, gut content analysis will only reveal what has beeneaten recently, whereas the conservative handling of fattyacids can yield dietary information over longer periods oftime. Secondly, gut content analysis may overemphasize hardto digest food items, as they are retained for a longer periodof time, whereas easily digestible material will be quicklyprocessed. The ideal trophic marker is one which has aneasily identified origin, is conservative and non-harmful toorganisms, not selectively processed during ingestion/assimi-lation, and metabolically stable (Dalsgaard et al. 2003). HU-FAs are a good choice for trophic markers, but are not ideal.While fatty acids alone cannot be used as toxicity indicators,fatty acid signatures may be used to deduce primary producerspecies presence, including toxic species (Fahl and Kattner1993; Viso and Marty 1993; Napolitano 1999; Volkman etal. 1989).A large portion of the fatty acid literature is dedicated to
studying food web pathways via EFAs, while fewer studiesconsider the importance of fatty acids at the level of the pro-ducer and consumer and their interactions, and considerablymore focus on EFAs in fish. Despite the tremendous interestin fatty acids, they have rarely been examined in planktonicfood web modeling studies. We have proposed a HUFA-explicitsub model designed to be appended to existing plankton popula-tion models, thereby considering not only stoichiometric andmorphological constraints at the plant-animal interface, but bi-ochemical -namely HUFA- limitations as well. It is impor-tant to clarify our stance on limitations at the plant-animalinterface: HUFAs alone may not control energy flow acrosstrophic levels; the same can be said of tracking only stoi-chiometric constraints. Instead, a combined synergistic ap-proach considering multiple limitation factors should bemore informative. The literature shows multiple studies dis-
cussing the competitive advantages and overall fitness of in-dividuals based on the handling of internal nutrient reservesin variable environments (e.g., Sommer 1985, Sommer 1989and Grover 1991 in the context of phytoplankton; Brett etal. 2009 in the context of zooplankton). For example, azooplankter with a large internal phosphorus reserve has agreater chance of survival in periods of starvation, and canpotentially meet more effectively the maintenance, growth,and reproductive needs. Explicit accounting of HUFAs maybe helpful in further investigating this outcome, as individ-ual quotas (i.e., phosphorus vs. nitrogen vs. EPA vs. DHA)are tightly linked to life history patterns and physiologicalfunctioning. Individuals saturated with phosphorus may stillexhibit poor ecological fitness, due to depleted HUFApools. Our HUFA sub model was designed to address is-sues of fitness, trophic transfer efficiency, and physiologicalresponse to various perturbations at the plant-animal inter-face.Models are useful tools for investigating environmentally-
driven ecology (Neuheimer et al. 2009), but ignoring aspectsof life history, individual physiology and phenology maylimit their usefulness. The literature provides sufficient infor-mation to delineate realistic regions for some parameters, butthere are still other parameters that are difficult to measure incontrolled environments. In a follow up study, we carried outa thorough sensitivity analysis narrow the plausible regionsfor the poorly constrained parameters, while still producingecologically sound results at the population level (Perhar etal. unpublished). The incorporation of our explicit zooplank-ton growth model into a large scale management-type modelis also presented in a subsequent study (Perhar et al. unpub-lished). In this exercise, we present our sub model calibra-tion, model response to various loading scenarios and aseries of statistical analyses highlighting the bulk of informa-tion gained by incorporating a resource-explicit zooplanktongrowth term. We think that this structural augmentation-once properly calibrated against observed data- holds the po-tential to improve our capacity to reproduce plankton dynam-ics, and thus yield a more robust platform upon which tomake management decisions.
AcknowledgementsThis project has received funding support from the Natural
Sciences and Engineering Research Council of Canadathrough a Doctoral Scholarship awarded to Gurbir Perharand a Discovery Grant awarded to George Arhonditsis. Wewish to thank Abhijeet Minhas (University of Toronto) andAnanthavalli Kumarappah (University of Toronto) for theirassistance with an earlier version of the manuscript.
ReferencesAckman, R.G., and Eaton, C.A. 1966. Lipids of fin whale
(Balaenoptera physalus) from North Atlantic waters: III. Occur-rence of eicosenoic and docosenoic fatty acids in the zooplankterMeganyctiphanes norvegica (M. Sars) and their effect on whale oilcomposition. Can. J. Biochem. 44(11): 1561–1566. doi:10.1139/o66-176.
Ahlgren, G., Blomqvist, P., Boberg, M., and Gustafsson, I.B. 1994.Fatty acid content of the dorsal muscle—an indicator of fat qualityin freshwater fish. J. Fish Biol. 45: 131–157.
Andersen, T. 1997. Pelagic nutrient cycles. Springer, New York.
Perhar et al. 169
Published by NRC Research Press
Env
iron
. Rev
. Dow
nloa
ded
from
ww
w.n
rcre
sear
chpr
ess.
com
by
Uni
vers
ity o
f T
oron
to o
n 09
/06/
12Fo
r pe
rson
al u
se o
nly.
Anderson, T.R., Hessen, D.O., Elser, J.J., and Urabe, J. 2005.Metabolic stoichiometry and the fate of excess carbon andnutrients in consumers. Am. Nat. 165(1): 1–15. doi:10.1086/426598. PMID:15729636.
Arhonditsis, G.B., and Brett, M.T. 2005a. Eutrophication model forLake Washington (USA). Part I. Model description and sensitivityanalysis. Ecol. Model. 187(2–3): 140–178. doi:10.1016/j.ecolmodel.2005.01.040.
Arhonditsis, G.B., and Brett, M.T. 2005b. Eutrophication model forLake Washington (USA). Part II. Model calibration and systemdynamics analysis. Ecol. Model. 187(2–3): 179–200. doi:10.1016/j.ecolmodel.2005.01.039.
Arterburn, L.M., Hall, E.B., and Oken, H. 2006. Distribution,interconversion, and dose response of n-3 fatty acids in humans.Am. J. Clin. Nutr. 83(6 Suppl): 1467S–1476S. PMID:16841856.
Arts, M.T., Evans, M.S., and Robarts, R.D. 1992. Seasonal patternsof total energy reserve lipids of dominant zooplanktoniccrustaceans from a hyper-eutrophic lake. Oecologia (Berl.),90(4): 560–571. doi:10.1007/BF01875451.
Bell, M.V., and Tocher, D.R. 2009. Biosynthesis of polyunsaturatedfatty acids in aquatic ecosystems: general pathways and newdirections. In Lipids in aquatic ecosystems. Edited by M. Arts, M.Brett, and M. Kainz. Springer Dordrecht, Heidelberg, London,New York.
Brett, M.T., Müller-Navarra, D.C., Ballantyne, A.P., Ravet, J.L., andGoldman, C.R. 2006. Daphnia fatty acid composition reflects thatof their diet. Limnol. Oceanogr. 51(5): 2428–2437. doi:10.4319/lo.2006.51.5.2428.
Brett, M.T., Müller-Navarra, D.C., and Persson, J. 2009. Crustaceanzooplankton fatty acid composition. In Lipids in aquaticecosystems. Edited by M. Arts, M. Brett, and M. Kainz. SpringerDordrecht, Heidelberg, London, New York.
Burdge, G.C., and Calder, P.C. 2005. Conversion of alpha-linolenicacid to longer-chain polyunsaturated fatty acids in human adults.Reprod. Nutr. Dev. 45(5): 581–597. doi:10.1051/rnd:2005047.PMID:16188209.
Burns, C.W., Brett, M.T., and Schallenberg, M. 2011. A comparisonof the trophic transfer of fatty acids in freshwater plankton bycladocerans and calanoid copepods. Freshw. Biol. 56(5): 889–903.doi:10.1111/j.1365-2427.2010.02534.x.
Calder, P.C. 2004. n-3 fatty acids and cardiovascular disease:evidence explained and mechanisms explored. Clin. Sci. 107(1):1–11. doi:10.1042/CS20040119. PMID:15132735.
Connor, W.E. 2000. Importance of n-3 fatty acids in health anddisease. Am. J. Clin. Nutr. 71(1 Suppl): 171S–175S. PMID:10617967.
Dabramo, L.R., and Sheen, S.S. 1993. Polyunsaturated fatty-acidnutrition in juvenile fresh-water prawn Macrobrachium rosenber-gii. Aquaculture, 115(1–2): 63–86. doi:10.1016/0044-8486(93)90359-7.
Dalsgaard, J., St John, M., Kattner, G., Müller-Navarra, D.C., andHagen, W. 2003. Fatty acid trophic markers in the pelagic marineenvironment. Adv. Mar. Biol. 46: 225–340. doi:10.1016/S0065-2881(03)46005-7. PMID:14601414.
Das, U.N. 2006. Essential fatty acids—a review. Curr. Pharm.Biotechnol. 7(6): 467–482. doi:10.2174/138920106779116856.PMID:17168664.
Davidson, B.C., and Cantrill, R.C. 1985. Erythrocyte membrane acyl:CoA synthetase activity. Res Lett. 193(1): 69–74. PMID:4065333.
De Henauw, S., Van Camp, J., Sturtewagen, G., Matthys, C., Bilau,M., Warnants, N., Raes, K., Van Oeckel, M., and De Smet, S.2007. Simulated changes in fatty acid intake in humans through n-3 fatty acid enrichment of foods from animal origin. J. Sci. FoodAgric. 87(2): 200–211. doi:10.1002/jsfa.2689.
DeMott, W.R., Gulati, R.D., and Siewertsen, K. 1998. Effects ofphosphorus-deficient diets on the carbon and phosphorus balanceof Daphnia magna. Limnol. Oceanogr. 43(6): 1147–1161. doi:10.4319/lo.1998.43.6.1147.
Elser, J.J., and Urabe, J. 1999. The stoichiometry of consumer-drivennutrient recycling: theory, observations, and consequences.Ecology, 80(3): 735–751. doi:10.1890/0012-9658(1999)080[0735:TSOCDN]2.0.CO;2.
Fahl, K., and Kattner, G. 1993. Lipid content and fatty acidcomposition of algal communities in sea-ice and water from theWeddell Sea (Antarctica). Polar Biol. 13(6): 405–409. doi:10.1007/BF01681982.
Farkas, T. 1979. Adaptation of fatty acid compositions to temperature- study on planktonic crustaceans. Comp. Biochem. Physiol. B,64(1): 71–76. doi:10.1016/0305-0491(79)90185-8.
Farkas, T., and Herodek, S. 1964. Effect of environmentaltemperature on fatty acid composition of crustacean plankton. J.Lipid Res. 5(3): 369–373. PMID:5873375.
Ferrão-Filho, A.S., Fileto, C., Lopes, N.P., and Arcifa, M.S. 2003.Effects of essential fatty acids and N and P-limited algae on thegrowth rate of tropical cladocerans. Freshw. Biol. 48(5): 759–767.doi:10.1046/j.1365-2427.2003.01048.x.
Fraser, A.J., Sargent, J.R., Gamble, J.C., and Seaton, D.D. 1989.Formation and transfer of fatty acids in an enclosed marine food-chain comprising phytoplankton, zooplankton and herring (Clupeaharengus L.) larvae. Mar. Chem. 27(1–2): 1–18. doi:10.1016/0304-4203(89)90024-8.
Graeve, M., Albers, C., and Kattner, G. 2005. Assimilation andbiosynthesis of lipids in Arctic Calanus species based on feedingexperiments with a 13C labeled diatom. J. Exp. Mar. Biol. Ecol.317(1): 109–125. doi:10.1016/j.jembe.2004.11.016.
Grover, J.P. 1991. Resource competition in a variable environment—phytoplankton growing according to the variable-internal-storesmodel. Am. Nat. 138(4): 811–835. doi:10.1086/285254.
Gulati, R.D., and DeMott, W.R. 1997. The role of food quality forzooplankton: remarks on the state-of-the-art, perspectives andpriorities. Freshw. Biol. 38(3): 753–768. doi:10.1046/j.1365-2427.1997.00275.x.
Hazel, J.R. 1995. Thermal adaptation in biological membranes: Ishomeoviscous adaptation the explanation? Annu. Rev. Physiol.57(1): 19–42. doi:10.1146/annurev.ph.57.030195.000315. PMID:7778864.
Hoffmann-Ostenhof, O., Cohn, W.E., Braunstein, A.E., Dixon, H.B.F., Horecker, B.L., Jakoby, W.B., Karlson, P., Klyne, W., Liebecq,C., and Webb, E.C. 1978. Nomenclature of lipids (recommenda-tions 1976) IUPAC IUB commission on biochemical nomencla-ture. Biochem. J. 171(1): 21–35. PMID:646817.
Holman, R.T. 1964. Nutritional + Metabolic Interrelationshipsbetween fatty acids. Fed. Proc. 23: 1062–1067. PMID:14209800.
Holman, R.T., Johnson, S.B., and Hatch, T.F. 1982. A case of humanlinolenic acid deficiency involving neurological abnormalities.Am. J. Clin. Nutr. 35(3): 617–623. PMID:6801965.
Innis, S.M. 2003. Perinatal biochemistry and physiology of long-chain polyunsaturated fatty acids. J. Pediatr. 143(4 Suppl): S1–S8.doi:10.1067/S0022-3476(03)00396-2. PMID:14597908.
Jeffries, H.P. 1970. Seasonal composition of temperate planktoncommunities: fatty acids. Limnol. Oceanogr. 15(3): 419–426.doi:10.4319/lo.1970.15.3.0419.
Jobling, M. 2004. Are modifications in tissue fatty acid profilesfollowing a change in diet the result of dilution? Test of a simpledilution model. Aquaculture, 232(1–4): 551–562. doi:10.1016/j.aquaculture.2003.07.001.
Kainz, M., Arts, M.T., and Mazumder, A. 2004. Essential fatty acidsin the planktonic food web and their ecological role for higher
170 Environ. Rev. Vol. 20, 2012
Published by NRC Research Press
Env
iron
. Rev
. Dow
nloa
ded
from
ww
w.n
rcre
sear
chpr
ess.
com
by
Uni
vers
ity o
f T
oron
to o
n 09
/06/
12Fo
r pe
rson
al u
se o
nly.
trophic levels. Limnol. Oceanogr. 49(5): 1784–1793. doi:10.4319/lo.2004.49.5.1784.
Karp, G. 2005. Cell and molecular biology. 4th ed. John Wiley andSons, New York.
Langdon, C.J., and Waldock, M.J. 1981. The effect of algal andartificial diets on the growth and fatty acid composition ofCrassostrea gigas spat. J. Mar. Biol. Assoc. U. K. 61(02): 431–448. doi:10.1017/S0025315400047056.
Lee, R.F., Nevenzel, J.C., and Paffenho, G.A. 1971. Importance ofwax esters and other lipids in marine food chain - phytoplanktonand copepods. Mar. Biol. (Berl.), 9: 99–108. doi:10.1007/BF00348249.
Lee, R.F., Hagen, W., and Kattner, G. 2006. Lipid storage in marinezooplankton. Mar. Ecol. Prog. Ser. 307: 273–306. doi:10.3354/meps307273.
Lenz, P.H., Hartline, D.K., and Davis, A.D. 2000. The need for speed.I. Fast reactions and myelinated axons in copepods. J. Comp.Physiol. A Neuroethol. Sens. Neural Behav. Physiol. 186(4): 337–345. doi:10.1007/s003590050434. PMID:10798722.
Loladze, I., Kuang, Y., and Elser, J.J. 2001. Stoichiometry inproducer-grazer systems: linking energy flow with elementcycling. Bull. Math. Biol. 62(6): 1137–1162. doi:10.1006/bulm.2000.0201. PMID:11127517.
Lovern, J.A. 1935. Fat metabolism in fishes. VI. The fats of someplankton crustacea. Biochem. J. 29(4): 847–849. PMID:16745734.
Lunn, J., and Buttriss, J.L. 2008. Incorporating omega-3 in the foodchain – why, where and how? Nutr. Bull. 33(3): 250–256. doi:10.1111/j.1467-3010.2008.00715.x.
Minokoshi, Y., Kim, Y.B., Peroni, O.D., Fryer, L.G.D., Muller, C.,Carling, D., and Kahn, B.B. 2002. Leptin stimulates fatty-acidoxidation by activating AMP-activated protein kinase. Nature,415(6869): 339–343. doi:10.1038/415339a. PMID:11797013.
Morris, D. 2011. Flax – a health and nutrition primer, 4th ed. URLhttp://www.flaxcouncil.ca.
Mozaffarian, D., and Rimm, E.B. 2006. Fish intake, contaminants,and human health: evaluating the risks and the benefits. JAMA,296(15): 1885–1899. doi:10.1001/jama.296.15.1885. PMID:17047219.
Mulder, K., and Bowden, W.B. 2007. Organismal stoichiometry andthe adaptive advantage of variable nutrient use and productionefficiency in Daphnia. Ecol. Model. 202(3–4): 427–440. doi:10.1016/j.ecolmodel.2006.11.007.
Müller-Navarra, D.C. 2006. The nutritional importance of poly-unsaturated fatty acids and their use as trophic markers forherbivorous zooplankton: Does it contradict? Arch. Hydrobiol.167(1): 501–513. doi:10.1127/0003-9136/2006/0167-0501.
Müller-Navarra, D.C., Brett, M.T., Liston, A.M., and Goldman, C.R.2000. A highly unsaturated fatty acid predicts carbon transferbetween primary producers and consumers. Nature, 403(6765):74–77. doi:10.1038/47469. PMID:10638754.
Müller-Navarra, D.C., Brett, M.T., Park, S., Chandra, S., Ballantyne,A.P., Zorita, E., and Goldman, C.R. 2004. Unsaturated fatty acidcontent in seston and tropho-dynamic coupling in lakes. Nature,427(6969): 69–72. doi:10.1038/nature02210. PMID:14702086.
Nakamura, M.T., and Nara, T.Y. 2004. Structure, function, anddietary regulation of Delta 6, Delta 5, and Delta 9 desaturases.Annu. Rev. Nutr. 24(1): 345–376. doi:10.1146/annurev.nutr.24.121803.063211. PMID:15189125.
Nanton, D.A., and Castell, J.D. 1999. The effects of temperature anddietary fatty acids on the fatty acid composition of harpacticoidcopepods, for use as a live food for marine fish larvae.Aquaculture, 175(1–2): 167–181. doi:10.1016/S0044-8486(99)00031-9.
Napolitano, G.E. 1999. Fatty acids as trophic and chemical markers in
freshwater ecosystems. In Lipids in freshwater ecosystems. EditedbyM. Arts and B. Wainman. Springer-Verlag, New York. pp. 21–44.
Neuheimer, A.B., Gentleman, W.C., Galloway, C.L., and Johnson, C.L.2009. Modeling larval Calanus finmarchicus on Georges Bank:time-varying mortality rates and a cannibalism hypothesis. Fish.Oceanogr. 18(3): 147–160. doi:10.1111/j.1365-2419.2009.00503.x.
Perhar, G., and Arhonditsis, G.B. 2009. The effects of seston foodquality on planktonic food web patterns. Ecol. Model. 220(6):805–820. doi:10.1016/j.ecolmodel.2008.12.019.
Persson, J., and Vrede, T. 2006. Polyunsaturated fatty acids inzooplankton: variation due to taxonomy and trophic position.Freshw. Biol. 51(5): 887–900. doi:10.1111/j.1365-2427.2006.01540.x.
Persson, J., Brett, M.T., Vrede, T., and Ravet, J.L. 2007. Foodquantity and quality regulation of trophic transfer between primaryproducers and a keystone grazer (Daphnia) in pelagic freshwaterfood webs. Oikos, 116(7): 1152–1163. doi:10.1111/j.0030-1299.2007.15639.x.
Pinckney, J.L., Paerl, H.W., Harrington, M.B., and Howe, K.E. 1998.Annual cycles of phytoplankton community-structure and bloomdynamics in the Neuse River Estuary, North Carolina. Mar. Biol.(Berl.), 131(2): 371–381. doi:10.1007/s002270050330.
Portolesi, R., Powell, B.C., and Gibson, R.A. 2007. Competitionbetween 24:5n-3 and ALA for D6 desaturase may limit theaccumulation of DHA in HepG2 cell membranes. J. Lipid Res.48(7): 1592–1599. doi:10.1194/jlr.M700081-JLR200. PMID:17409318.
Ravet, J.L., and Brett, M.T. 2006. Phytoplankton essential fatty acidand phosphorus content constraints on Daphnia somatic growthand reproduction. Limnol. Oceanogr. 51(5): 2438–2452. doi:10.4319/lo.2006.51.5.2438.
Ravet, J.L., Brett, M.T., and Arhonditsis, G.B. 2010. The effects ofseston lipids on zooplankton fatty acid composition in LakeWashington. Ecology, 91(1): 180–190. doi:10.1890/08-2037.1.PMID:20380207.
Schlechtriem, C., Arts, M.T., and Zellmer, I.D. 2006. Effect oftemperature on the fatty acid composition and temporal trajectoriesof fatty acids in fasting Daphnia pulex (Crustacea, cladocera).Lipids, 41(4): 397–400. doi:10.1007/s11745-006-5111-9. PMID:16808154.
Scott, C.L., Kwasniewski, S., Falk-Petersen, S., and Sargent, J.R.2002. Species differences, origins and functions of fatty alcoholsand fatty acids in the wax esters and phospholipids of Calanushyperboreus, C. glacialis and C. finmarchicus from Arctic waters.Mar. Ecol. Prog. Ser. 235: 127–134. doi:10.3354/meps235127.
Simopoulos, A.P. 1991. Omega-3 fatty acids in health and disease andin growth and development. Am. J. Clin. Nutr. 54(3): 438–463.PMID:1908631.
Simopoulos, A.P. 2002. The importance of the ratio of omega-6/omega-3 essential fatty acids. Biomed. Pharmacother. 56(8): 365–379. doi:10.1016/S0753-3322(02)00253-6. PMID:12442909.
Smyntek, P.M., Teece, M.A., Schulz, K.L., and Storch, A.J. 2008.Taxonomic differences in the essential fatty acid composition ofgroups of freshwater zooplankton relate to reproductive demandsand generation time. Freshw. Biol. 53(9): 1768–1782. doi:10.1111/j.1365-2427.2008.02001.x.
Sommer, U. 1985. Comparison between steady-state and non-steadystate competition—experiments with natural phytoplankton. Lim-nol. Oceanogr. 30(2): 335–346. doi:10.4319/lo.1985.30.2.0335.
Sommer, U. 1986. The periodicity of phytoplankton in LakeConstance (Bodensee) in comparison to other deep lakes ofcentral Europe. Hydrobiologia, 138(1): 1–7. doi:10.1007/BF00027228.
Sommer, U. 1989. Nutrient status and nutrient competition of
Perhar et al. 171
Published by NRC Research Press
Env
iron
. Rev
. Dow
nloa
ded
from
ww
w.n
rcre
sear
chpr
ess.
com
by
Uni
vers
ity o
f T
oron
to o
n 09
/06/
12Fo
r pe
rson
al u
se o
nly.
phytoplankton in a shallow, hypereutrophic lake. Limnol.Oceanogr. 34(7): 1162–1173. doi:10.4319/lo.1989.34.7.1162.
Sterner, R.W. 1997. Modelling interactions of food quality andquantity in homeostatic consumers. Freshw. Biol. 38(3): 473–481.doi:10.1046/j.1365-2427.1997.00234.x.
Stübing, D., Hagen, W., and Schmidt, K. 2003. On the use of lipidbiomarkers in marine food web analyses: an experimental casestudy on the Antarctic krill, Euphausia superba. Limnol.Oceanogr. 48(4): 1685–1700. doi:10.4319/lo.2003.48.4.1685.
Taipale, S.J., Kainz, M.J., and Brett, M.T. 2011. Diet-switchingexperiments show rapid accumulation and preferential retention ofhighly unsaturated fatty acids in Daphnia. Oikos, 120(11): 1674–1682. doi:10.1111/j.1600-0706.2011.19415.x.
Trumbo, P., Schlicker, S., Yates, A.A., and Poos, M. 2002. Dietaryreference intakes for energy, carbohydrate, fiber, fat, fatty acids,cholesterol, protein and amino acids. J. Am. Diet. Assoc. 102(11):1621–1630. doi:10.1016/S0002-8223(02)90346-9. PMID:12449285.
Van Donk, E., Lurling, M., Hessen, D.O., and Lokhorst, G.M. 1997.Altered cell wall morphology in nutrient-deficient phytoplanktonand its impact on grazers. Limnol. Oceanogr. 42(2): 357–364.doi:10.4319/lo.1997.42.2.0357.
Vance, J.E., and Vance, D.E. 1985. The role of phosphatidylcholinebiosynthesis in the secretion of lipoproteins from hepatocytes.Can. J. Biochem. Cell Biol. 63(8): 870–881. doi:10.1139/o85-108.PMID:3904950.
Viso, A.C., and Marty, J.C. 1993. Fatty acids from 28 marinemicroalgae. Phytochemistry, 34(6): 1521–1533. doi:10.1016/S0031-9422(00)90839-2.
Volkman, J.K., Jeffrey, S.W., Nichols, P.D., Rogers, G.I., andGarland, C.D. 1989. Fatty acid and lipid composition of 10species of microalgae used in mariculture. J. Exp. Mar. Biol. Ecol.128(3): 219–240. doi:10.1016/0022-0981(89)90029-4.
Wacker, A., and Martin-Creuzburg, D. 2007. Allocation of essentiallipids inDaphnia magna during exposure to poor food quality. Funct.Ecol. 21(4): 738–747. doi:10.1111/j.1365-2435.2007.01274.x.
Weers, P.M.M., Siewertsen, K., and Gulati, R.D. 1997. Is the fattyacid composition of Daphnia galeata determined by the fatty acidcomposition of the ingested diet? Freshw. Biol. 38(3): 731–738.doi:10.1046/j.1365-2427.1997.00238.x.
Yamauchi, T., Kamon, J., Waki, H., Terauchi, Y., Kubota, N., Hara, K.,Mori, Y., Ide, T., Murakami, K., Tsuboyama-Kasaoka, N., Ezaki,O., Akanuma, Y., Gavrilova, O., Vinson, C., Reitman, M.L.,Kagechika, H., Shudo, K., Yoda, M., Nakano, Y., Tobe, K., Nagai, R.,Kimura, S., Tomita, M., Froguel, P., and Kadowaki, T. 2001. Thefat-derived hormone adiponectin reverses insulin resistanceassociated with both lipoatrophy and obesity. Nat. Med. 7(8):941–946. doi:10.1038/90984. PMID:11479627.
Zhao, J.Y., Ramin, M., Cheng, V., and Arhonditsis, G.B. 2008.Plankton community patterns across a trophic gradient: the role ofzooplankton functional groups. Ecol. Model. 213(3–4): 417–436.doi:10.1016/j.ecolmodel.2008.01.016.
172 Environ. Rev. Vol. 20, 2012
Published by NRC Research Press
Env
iron
. Rev
. Dow
nloa
ded
from
ww
w.n
rcre
sear
chpr
ess.
com
by
Uni
vers
ity o
f T
oron
to o
n 09
/06/
12Fo
r pe
rson
al u
se o
nly.


