Embed Size (px)
Citation preview

1
68/126
Moldovan Migration Policy Dilemma: Brain Drain
or Jobless Growth? CARIM-East Research Report
SERGIU PORCESCU JOANNA NESTOROWICZ
STEFAN MARKOWSKI
February 2014
www.migracje.uw.edu.pl
2
CARIM-East
Creating an Observatory of Migration East of Europe
The CARIM-East project is co-financed by the European Commission. The CARIM-East project at the Centre of Migration Research (CMR) at The University of Warsaw is also supported by the Polish Ministry of Science and Higher Education.
The CARIM-east project is led by the European University Institute (EUI) in Florence, Italy with Centre of Migration Research, University of Warsaw as the partner institution.
The views expressed in this publication cannot in any circumstances be regarded as the official position of the European Commission.
This text may be downloaded only for personal research purposes. Any additional reproduction for other purposes, whether in hard copies or electronically, requires the consent of the Centre of Migration Research. Requests should be addressed to [email protected].
If cited or quoted, reference should be made as follows: Porcescu S., Nestorowicz J., Markowski S. (2014). Moldovan Migration Policy Dilemma: Brain Drain or Jobless Growth? CARIM-East Research Report. CMR Working Papers No 68(126). Warsaw: Centre of Migration Research, University of Warsaw.

3
About the CARIM-East project:
This project is the first migration observatory focused on the Eastern Neighbourhood of the European Union and covers all countries of the Eastern Partnership initiative (Belarus, Ukraine, the Republic of Moldova, Georgia, Armenia and Azerbaijan) and Russian Federation. The project’s two main themes are: (1) migration from the region to the European Union (EU) focusing in particular on countries of emigration and transit on the EU’s eastern border; and (2) intra-regional migration in the post-Soviet space. The project started on 1 April 2011 as a joint initiative of the European University Institute (EUI), Florence, Italy (the lead institution), and the Centre of Migration Research (CMR) at the University of Warsaw, Poland (the partner institution). CARIM researchers undertake comprehensive and policy-oriented analyses of very diverse aspects of human mobility and related labour market developments east of the EU and discuss their likely impacts on the fast evolving socio-economic fabric of the six Eastern Partners and Russia, as well as that of the European Union. In particular, CARIM-East: • builds a broad network of national experts from the region representing all principal disciplines focused on human migration, labour mobility and national development issues (e.g. demography, law, economics, sociology, political science); • develops a comprehensive database to monitor migration stocks and flows in the region, relevant legislative developments and national policy initiatives; • undertakes, jointly with researchers from the region, systematic and ad hoc studies of emerging migration issues at regional and national levels; • provides opportunities for scholars from the region to participate in workshops organized by the EUI and CMR, including academic exchange opportunities for PhD candidates; • provides forums for national and international experts to interact with policymakers and other stakeholders in the countries concerned. Results of the above activities are made available for public consultation through the website of the project: http://www.carim-east.eu/.
For more information: CARIM-East Robert Schuman Centre for Advanced Studies (EUI) Convento, Via delle Fontanelle 19 50014 San Domenico di Fiesole Italy Tel: +39 055 46 85 817 Fax: + 39 055 46 85 770 Email: [email protected] www.eui.eu/RSCAS/
CARIM-East Centre of Migration Research,University of Warsaw (CMR) Banacha 2 B, St Warsaw 02-097 Poland Tel/fax: (+48 22) 659 74 11 Tel: (+48 22) 822 91 73 E-mail: [email protected] www.migracje.uw.edu.pl/
Sergiu Porcescu - Academy of Sciences of Moldova, Chisinau, Moldova; e-mail: [email protected] Joanna Nestorowicz Centre of Migration Research, University of Warsaw, Warsaw, Poland; e-mail: [email protected] Stefan Markowski Centre of Migration Research, University of Warsaw, Warsaw, Poland; Tishner European University, Krakow, Poland; The University of New South Wales, UNSW Canberra, Canberra, Australia; e-mail: [email protected]

4
Abstract
Since the 1990s, Moldova has relied on migration as a vent for labour oversupply and on inflows of migrant remittances as its main engine of economic growth. Labour migrants account for almost a quarter of the labour force and Moldova is one of the most remittance-dependent economies in the world. Although this resource-poor economy has grown in recent years, albeit not as fast as its neighbours, it has failed to create enough new jobs in new industries to offset job losses in legacy sectors. Thus, Moldovan economic performance in the 2000s can be described as remittance-led jobless growth. This is not sustainable in the long run and Moldova must widen its home resource base to create conditions favourable to achieving faster and sustainable economic growth. One such possibility is to invest in more job-oriented education and training. But this may intensify labour migration from Moldova. The paper considers opportunities for Moldova, an open economy with mobile labour, to “educate itself out” of the jobless growth. Keywords: Moldova, remittances, migration, education, development
Streszczenie Od lat 90-tych XX w. Mołdawia, dawna republika ZSRR, polegała na emigracji jako głównym wentylu dla zbyt dużej podaży pracy. Migranckie transfery pieniężne z zagranicy były siłą napędową wzrostu gospodarczego. Emigranci zarobkowi stanowią blisko jedną czwartą mołdawskiej siły roboczej. Gospodarka ta jest jedną z najbardziej uzależnionych od migranckich transferów pieniężnych. Choć ten ubogi w zasoby kraj wykazywał tendencje rozwojowe w ostatnich latach, nie były one tak silne jak u jego sąsiadów. Nie udało się w tym czasie stworzyć miejsc pracy, które mogłyby zrównoważyć ograniczenie zatrudnienia w sektorach, które były spuścizną gospodarki ZSRR. Model rozwoju gospodarczego Mołdawii w latach dwutysięcznych może więc być określony jako zależny od transferów i nie zwiększający zatrudnienia. Formuła ta nie może być rozpatrywana w długofalowej perspektywie. Aby stworzyć warunki do bardziej zrównoważonego wzrostu, Mołdawia będzie musiała w najbliższej przyszłości zwiększyć swój lokalny zasób czynników produkcji. Możliwość osiągnięcia tego celu mają szansę stworzyć inwestycje w edukację i kształcenie zorientowane na kwalifikacje potrzebne na rynku pracy. W efekcie emigracja z Mołdowy mogłaby się jednak zintensyfikować. W artykule rozważane są szanse, które ma Mołdawia jako mała, otwarta gospodarka z mobilną siłą roboczą, aby wykształcić w sobie zdolność do zmiany obecnego modelu rozwoju. Słowa kluczowe: Mołdawia, transfery pieniężne, migracja, edukacja, rozwój

5
Table of contents
1. Introduction ................................................................................................................................................... 6
2. The Moldovan labor market .......................................................................................................................... 9
3. Labour migration from Moldova and inflows of remittances ..................................................................... 13
4. Return migrants ........................................................................................................................................... 20
5. Inflow of remittances .................................................................................................................................. 21
6. Education ..................................................................................................................................................... 22
7. Demand for education and training ............................................................................................................ 23
8. Changing gears: from jobless to jobrich growth.......................................................................................... 24
9. Policy challenge: Brain drain with job-rich growth ..................................................................................... 26
10. Conclusions ................................................................................................................................................ 29
References ....................................................................................................................................................... 30

6
1. Introduction
The Republic of Moldova is a former Soviet republic, which gained independence in 1991 following the collapse of the USSR. Since the early 1990s, Moldova has been going through a period of economic, social and political transition to distance itself from its Soviet past and make a fresh start as a small, open economy well integrated into the international and, in particular, European division of labour. However, the Soviet legacy has not been easy to divest of and it continues to weigh heavily on Moldova’s economy and polity. At its inception, the new republic inherited a divided society, dysfunctional Soviet institutions and a command economy embedded in the old Soviet division of labour. As the country was not a major industrial hub of the former USSR and lacks natural resources, the post-Soviet Moldova has found it difficult to chart its own path to sustainable, post-Soviet economic development.1 Thus, it remains a poorly industrialized, largely agrarian economy at the bottom of the European income-per-capita league. The one national aspiration that appears to transcend the spectrum of political opinion and unite most people behind it is the prospect of Moldova’s accession to the European Union. But, with the current turmoil in the Euro zone and the EU still languishing in economic doldrums, the prospect of Moldova becoming a new member state of the EU remains somewhat distant. As the institutional transformation has been rather slow, the Moldovan public remains very critical of the country’s political and economic directions. In 2012, a popular public opinion survey reported 69 per cent of respondents expressing concern that the country was moving in the wrong direction (BOP 2012) and a recent World Bank report on Moldova opined:
Government needs to improve the investment climate with a focus on enhancing productivity, improving export competitiveness, and reducing the costs of crossing borders; regulatory reforms should target EU standards; and all reforms should be shaped by the need to reduce the footprint of the public sector on the economy ... Moldova needs to develop a second engine of growth from exports of goods and services (World Bank 2011a: xii-xiii).
For the last decade, the economy has relied heavily on migration as a vent for labour oversupply and on inflows of migrant remittances (Cardais, 2008). In 2000, remittances accounted for 11.5 per cent of GDP and by 2008 their share of GDP increased to 30 per cent (ibid: xviii) - making Moldova one of the most remittance-dependent economies in the world. Since 2000, the growth of Moldovan GDP has essentially been remittance-led. The large inflow of remittances has lifted economic activity above the level that would have prevailed in its absence. However, the remittance-fuelled appetite for imports has opened up current account deficit while the continuing inflow of remittances has prevented the exchange rate from depreciating to correct the imbalance. Between 2004 and 2008, this was further aggravated by 1Between 1991 and 1999 Moldova’s real GDP growth decreased by 60 per cent (World Bank, 2011a, Figure 1.9: 7). It increased between 2000 and 2008 with the real GDP growing at a respectable average of 6.3 per cent. However, it still lagged behind the rest of the Commonwealth of Independent States (CIS) region, which averaged 7.4 per cent in 2000-2007 (ibid). The Global Financial Crisis (GFC) caused the Moldovan real GDP to shrink by 6.5 percent in 2008-2009 although there are now signs that the economic growth has returned and is accelerating again (ibid). While it is now less trade-dependent on the CIS region than it was in the past, over 40 per cent of Moldova’s exports in 2011 went to the CIS region (NBS, 2011a).

7
deteriorating terms of trade; mainly due to increased prices of imported fuels (World Bank 2011a: 14). As a result, the competitiveness of the Moldovan economy has declined, thus, impeding the growth of export-oriented and import-replacing industries. And, as domestic job losses in agriculture and manufacturing exceed newly created jobs in services and construction, labour continues to migrate from Moldova, albeit at a decreasing rate (ibid: xx). Thus, the Moldovan economic growth in the 2000s can be described as both remittance-led and jobless. It is because of the combination of these two factors that Moldova is a very interesting case of a developing economy. Addressing both of these policy challenges jointly is not only critical for Moldova’s policy makers but it also contributes to the broader understanding of the impact of migration on (migrant) sending economies. Unlike many developing countries, Moldova cannot continue to “export” labour indefinitely. Figure 1 shows the Moldovan population outlook until 2050 based on three scenarios: optimistic, moderate and pessimistic.2 Under all three scenarios the Moldovan population is predicted to decline from its current level of over 3.5 million to somewhere between 2.6 million (pessimistic case) and over 3.1 million (optimistic case). It is therefore unlikely that in future Moldova will be able to sustain significant net outflows of labour. The process of population decline will start slowly but the pace of decline should become apparent around 2020. The proportion of working age population is also expected to decline, especially after 2030. As its population shrinks, Moldova’s migrant outflows will decline and as many Moldovan temporary migrants settle for good in host countries, the inflow of remittances will slow down and possibly decline. Thus, while remittances have offered many Moldovan families a lifeline out of poverty and an opportunity to supplement low local wages, it is imperative for the country to diversify its sources of income to reduce its dependence on migrant remittances. With its lack of natural resources and small population Moldova is not well positioned to attract large inflows of foreign direct investment and footloose foreign human capital. To grow faster, it is necessary to invest in the domestic resource base, which in time could act as a magnet for inflows of foreign capital and labour and engender the virtuous circle of sustainable economic growth. One such possibility is to invest in homegrown human capital, that is, in education and training. The growth potential of investment in human capital formation has already been recognized by Moldovan policy makers and Moldova spends about 9.5 per cent of its GDP on education; well above comparable spending rates of other ex-communist countries (IMF 2012: 8). However, there is little indication of Moldova “educating” its way out of the jobless growth. This is because much of Moldova’s investment in human capital formation appears to have been wasted on the acquisition of skills that are not demanded by employers. Consequently, shortages of skills needed by industry and commerce are paralleled by an overproduction of qualifications that 2Using 2008 as the base year (and the year the projection was made), the three scenarios have been drawn assuming that:
a) Scenario I (pessimistic):the main determinants of the natural movement of population remain at the level of 2008: fertility rate of 1.268 children per fertile woman, life expectancy at birth of 65.12 years for men and 73.08 for women;
b) Scenario II (moderate): there will be a slight increase in the birth rate taking it to 1.5 by 2050. The reproductive behavior to remain the same but with the average age of mothers at birth to increase to 27 by 2050. Life expectancy to increase to nearly 69 years for men and 76 years for women by 2050; and
c) Scenario III (optimist); the birth rate to increase to about 1.5 by 2025 and 1.8 by 2050. Comisia Naţională pentru Populaţie şi Dezvoltare (2009: 33)

8
are not required by firms. To avoid such mismatches in future and to avoid the associated brain and skill waste, the provision of education services should be more demand-led and tailored to employer requirements. However, such marketable skills tend to be in short supply in other countries and with existing wage gaps it is likely that a large part of such educational investment could “leak out” abroad as more employable Moldovan labour force finds it easier to migrate. Exit visas and other emigration restrictions are no longer a policy option for sending countries while destination countries are often unwilling or unable to restrict migrant inflows. This presents policy makers with a classic “brain drain” dilemma: brains may no longer be wasted as the demand-oriented education makes them more marketable. But, this also makes Moldovan labour more internationally portable. The increased marketability of Moldovan brains could drain them away from the country to more developed economies, thus, condemning Moldova to the vicious cycle of slow and jobless growth. Figure 1. Moldova’s population outlook 2008-2050 (in millions)
Source: Comisia Naţională pentru Populaţie şi Dezvoltare (2009: 33).
However, the redirection of educational resources to the production of more marketable skills need not result in the transfer of Moldovan wealth to future importers of Moldovan labour. We argue in this paper that brain drain may increase the productivity growth of the in-country Moldovan labour when “brain formation” decisions are endogenous and when outflows of “brains” (of educated and skilled people) are limited and uncertain. That is, under certain conditions Moldovan policy makers should be able to leverage domestic productivity growth associated with more employment-oriented education to turn it into an engine of economic growth. As we show below, the success of this policy depends on two factors: (a) the strength of the “brains” demonstration effect, i.e., the strength of incentive to get educated for employability which would increase the proportion of those suitably educated in the labour force; and (b) the proportion of “stayers” and/or return-migrants in the pool of more skilled labour force. As the economy takes off and local wages increase the proportion of stayers is likely to grow while migration may continue to induce people to acquire marketable skills (see e.g.: Stark, Prskawetz, Helmenstein 1997; Beine, Docquier, Rapoport 2001). This could eventually engender the positive dynamics of skill formation and job creation in Moldova.

9
It is not the aim of this paper to re-examine the formal logic of this balancing act. This has been addressed at some length in the literature (see below). However, while the literature focuses on the necessary and sufficient conditions of successful education for growth in a generic small open economy from which newly-formed human capital drains to richer countries, it is much less specific as to how this balancing act is to be achieved in practice. Every developing country presents a different and often unique policy challenge. Our aim is to consider in some depth the specific conditions faced by Moldova to examine whether it is possible for Moldova to “educate itself out” of the jobless growth, broaden sources of growth, and engender a virtuous circle of wealth and job creation. By emphasizing the importance of qualitative aspects of human capital this paper also contributes to the academic literature on brain gain and brain waste. The paper is structured as follows. In the following section we consider the general structure of the Moldovan labour market. Next, we focus on the scale, scope and patterns of labour migration from Moldova and the associated inflow of remittances. This is followed by a discussion of education as means of human capital formation in Moldova and the extent to which it is supply-oriented and unresponsive to market demands, thus, contributing to brain waste. Thereafter we suggest a strategy for the development of a more growth- and employment-oriented education and discuss the moral hazard of accelerated brain drain. The section also contains a number of policy suggestions. 2. The Moldovan labour market Of the total Moldovan population of about 3.8 million people in 2011, some 2.8 million were aged 16-75 and could therefore be regarded as the notional working age population.3 Of the working age population, about 1.2 million people were listed as employed in 2011 and another 84 thousand as unemployed.4 If the labour force is defined as those in employment, self-employed and the formally registered unemployed, the Moldovan labour force accounts for about 46 per cent of the working age population. This is roughly in line with the World Bank finding that Moldova’s employment and labour force participation rates (c. 45 and 51 per cent respectively in 2007) were substantially below those of most other CIS countries.5 The study also found that between 2000 and 2008, the country’s employment rate decreased from 54.8 to 42.5 per cent while the unemployment did not rise significantly (ibid). It appears that those who left or lost their jobs either migrated abroad or ceased to be economically active (as defined by Moldovan statisticians). Figure 2a shows Moldovan employment by industry sector in 2010. Nearly a third of those employed worked in agriculture, forestry and fisheries and the vast majority of people in distributive trades, construction and the public sector. Manufacturing accounted for less than 13 per 3http://statbank.statistica.md ‘Resident population by Years, 5 years, Areas and Sex’ (accessed 1.10.2012). 4http://statbank.statistica.md “ILO unemployed by Age groups, Level of education, Unemployment duration, Years, Sex and Area” (accessed 1.10.2012). 5These countries achieved the employment rates of between 50 and 60 per cent and labour force participation rates of between 60 and 70 per cent (World Bank, 2011a, Figs. 1.20-1.21: 13-14). However, the World Bank defines the employment rate as the percentage of the working age population 15-64 who are currently employed.

10
cent of jobs. This is the industry structure of an “old economy” with only a small proportion of fast growing “new” industries such electronics and modern industrial mixes combining manufacturing and services. Not surprisingly, employment has shifted from agriculture (which decreased by nearly 11 per cent per year between 2000 and 2008) and “old manufacturing” to services (distributive trades, hotels) and, to a lesser extent, to construction and extractive industries (ibid: 12). But, overall the total employment decreased by nearly a quarter during 2000-08 and most of this loss was absorbed by migration. Thus, while the GDP grew in the 2000s it was largely jobless growth (Figure 2b). Figure 2a. Employment by industry in 2010, in percentages
Source: own calculations based on data http://statbank.statistica.md“Employed population by Level of educations, Age groups, Economic activities, Years, Sex and Area” (accessed 1.10.2012).
Figure 2b. GDP level (right axis) and scale of wage-employment (left axis) in Moldova 2000-2012
0
0,1
0,2
0,3
0,4
0,5
0,6
0,7
0,8
0,9
1
2000 2001 2002 2003 2004 2005 2006 2007 2008 2009 2010 2011 2012
mill
ions
0
10
20
30
40
50
60
70
80
90
100
billi
ons
MDL
1 U
SD=1
3.5
MD
L
Wage-employment level
GDP level (comparable prices)
Source: own calculations based on data http://statbank.statistica.md “Employed population by Level of educations, Age groups, Economic activities, Years, Sex and Area”, “Gross Domestic Product and Gross Value Added, 1995-2012”, National Bank of Moldova exchange rates (accessed 1.02.2013).
11
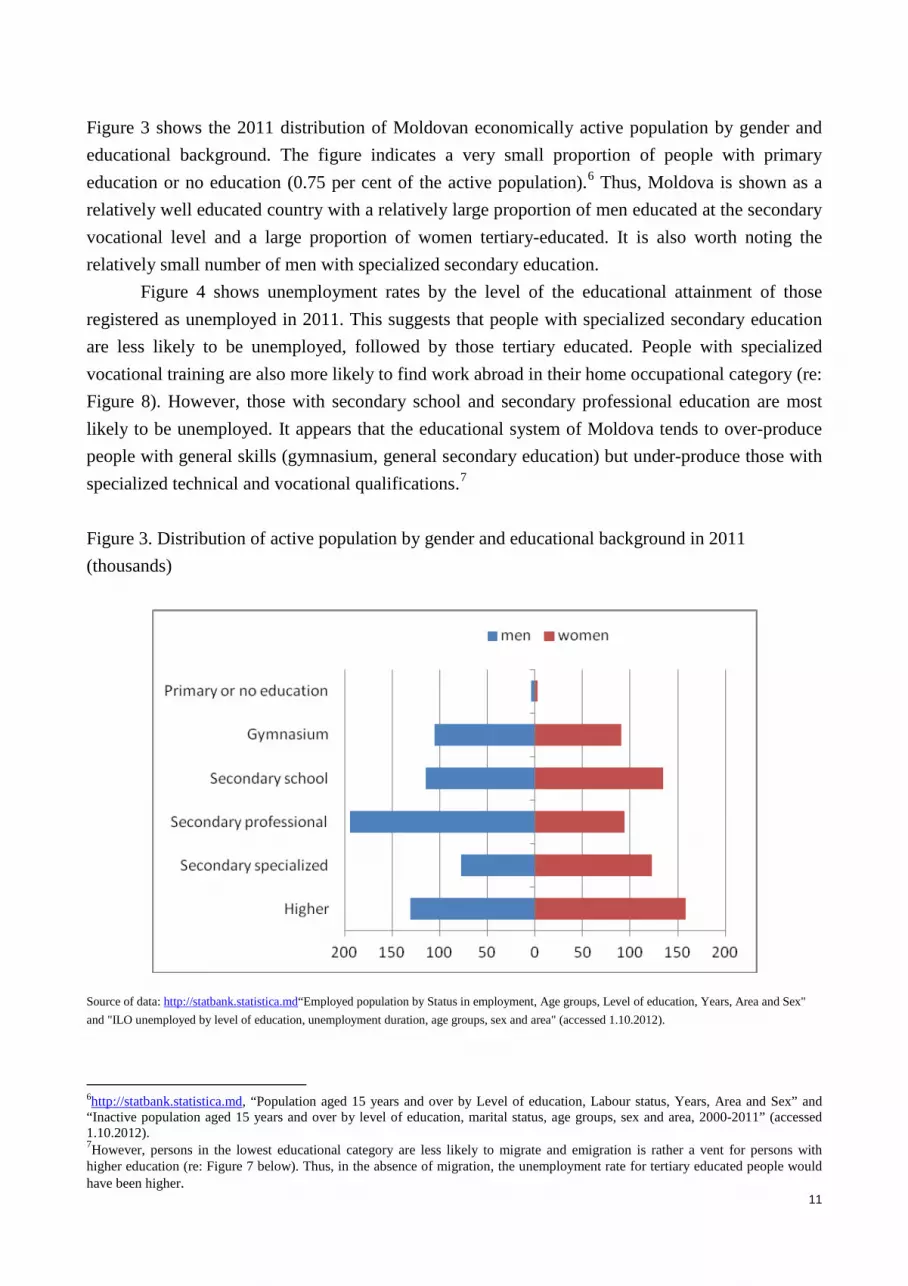
Figure 3 shows the 2011 distribution of Moldovan economically active population by gender and educational background. The figure indicates a very small proportion of people with primary education or no education (0.75 per cent of the active population).6 Thus, Moldova is shown as a relatively well educated country with a relatively large proportion of men educated at the secondary vocational level and a large proportion of women tertiary-educated. It is also worth noting the relatively small number of men with specialized secondary education. Figure 4 shows unemployment rates by the level of the educational attainment of those registered as unemployed in 2011. This suggests that people with specialized secondary education are less likely to be unemployed, followed by those tertiary educated. People with specialized vocational training are also more likely to find work abroad in their home occupational category (re: Figure 8). However, those with secondary school and secondary professional education are most likely to be unemployed. It appears that the educational system of Moldova tends to over-produce people with general skills (gymnasium, general secondary education) but under-produce those with specialized technical and vocational qualifications.7 Figure 3. Distribution of active population by gender and educational background in 2011 (thousands)
Source of data: http://statbank.statistica.md“Employed population by Status in employment, Age groups, Level of education, Years, Area and Sex" and "ILO unemployed by level of education, unemployment duration, age groups, sex and area" (accessed 1.10.2012).
6http://statbank.statistica.md, “Population aged 15 years and over by Level of education, Labour status, Years, Area and Sex” and “Inactive population aged 15 years and over by level of education, marital status, age groups, sex and area, 2000-2011” (accessed 1.10.2012). 7However, persons in the lowest educational category are less likely to migrate and emigration is rather a vent for persons with higher education (re: Figure 7 below). Thus, in the absence of migration, the unemployment rate for tertiary educated people would have been higher.

12
Figure 4. Moldovan unemployment rates by educational attainment in 2011 (per cent)
Source: own calculations based on data from http://statbank.statistica.md “Employed population by Status in employment, Age groups, Level of education, Years, Area and Sex” and “ILO unemployed by level of education, unemployment duration, age groups, sex and area” (accessed 1.10.2012).
Figure 5 shows the dispersion of average monthly earnings by industry/sector in 2010.8 Nearly a third of those employed worked in agriculture, forestry and fishing drawing wages close to the subsistence income. The vast majority of those employed drew wages equivalent to about 1.5-2.5 times the subsistence income and only those in finance and energy were paid on average 3-4 times the subsistence income. It is not surprisingly that the pull of foreign employment, even if costly to access and illegal, has been considerable for many Moldovans, especially those from the declining sectors such as primary industries and manufacturing. 8The average earnings in 2010 were Euro 194. This compares with the 2011 subsistence income per head of or about Euro 100 (MDL 1503) See:http://www.statistica.md/newsview.php?l=en&id=3731&idc=168(accessed 12.6.2012).

13
Figure 5. Average monthly earnings by sector in 2010 (in current Euros)
Source: http://statbank.statistica.md “Monthly average earnings by economic activities, 2011-2012” and bnm.md/en/medium_exchange_rates (accessed 1.10.2012).
A sector that is missing from Figures 3 and 5 is the “migration” sector. Labour migration has primarily attracted those who had previously worked in low-productivity jobs in agriculture or manufacturing or who were (self-employed) subsistence farmers (Spoor, Izman 2009; Bolganschi 2011). In that sense migration could be described as a vent for underemployment of Moldovans in stagnant and declining sectors, especially the agriculture. If, in addition, migration has removed people from the dole queue, it can also be described as a vent for unemployment. 3. Labour migration from Moldova and inflows of remittances Since Moldova’s independence, there have been three waves of migration (CIVIS/IASCI, 2010). The first wave was largely associated with petty cross-border trade: Moldovan citizens making short trips to neighbouring countries to buy goods for re-sale in Moldova. Stricter visa regimes, increased customs controls and the growing price convergence have made this type of migration less attractive. The second wave of migration was largely a “push migration” caused by poverty and the shrinking job pool in Moldova. It offered a chance of escaping home poverty and stagnation even if it meant seeking an illegal foreign employment. The post-communist Moldova continued to be strongly trade-dependent on the Russian economy and the prolonged Russian crisis in the late 1990s caused ripple effects in Moldova with jobs disappearing in sectors most depended on exports to Russia. Paradoxically though, the second wave was partially directed east as even the wobbly Russian economy offered Moldovan migrants better employment opportunities, albeit often illegal, than the stagnant home economy. The illegal labour migration to the west also took off during this period. The third and most recent wave has been associated with circular, short-term movements of migrants searching for better paid employment. It has been mostly driven by pull forces of

14
destination countries with “unemployment” as a migration trigger being replaced by “poorly paid employment” (CIVIS/IASCI, 2010: 9). Also, by the 2000s, labour migration networks have matured offering both the greater likelihood of finding a job and reduced cost of job search. In 2011, nearly 317 thousand Moldovans were described as either working or seeking work in another country. The Russian Federation accounted for over 60 per cent and Italy for about 18 per cent of all labour migrants from Moldova in the late 2000s.9 In 2011, Moldovan migrants accounted for almost a quarter of the active labour force and Moldova may well be described as a country of labour migrants.10 Table 1 shows the sectoral distribution of Moldovan labour migrants in different host countries. Most Moldovan migrants work in construction and domestic services sectors. In Russia, they are predominantly men employed in the construction sector (nearly 70%). Trade is the second most important sector employing about nearly 15 per cent of Moldovan labour migrants. In Italy and the EU as a whole, the dominant sector is domestic services, which attracts mostly women engaged in home and age care. The second major sector is construction, which employs mostly men. Jobs in construction and domestic services are largely semi-skilled. Only a very small number of Moldovan migrants have access to jobs, which could significantly enhance their human capital. Migration to Russia is more temporary with a quarter of migrants expecting to stay there for less than a year while migration to the EU is more longer-term as there often is a vague hope of permanent stay (NBS, 2008). Thus, migrants travelling “east” to work tend to be bona fide temporary labour migrants while those travelling “west” often see short term employment as a path to permanent residence.11 Another mode of accessing the EU market involves the acquisition of citizenship of one of the EU member states, for example the dual Moldovan-Romanian or Moldovan-Bulgarian citizenship (about 250,000 citizenships granted to Moldovans in Romania) (Panainte and Nedelciuc, 2012).
9Source: statbank.statistica.md: “Population aged 15 years and over, working or looking for work abroad by Level of education, Country of destination, Age groups, Years, Area and Sex” (accessed 1.1.2013). The Moldovan National Bureau of Statistics defines “migrants” as persons working or looking for work abroad at the time of the survey and those who are in-country at the time of enumeration but who had been abroad as migrants during 12 months prior to the survey. This is likely to overestimate the stock of labour migrants during the reporting year. 10International Organization for Migration, Mission in Moldova, http://iom.md/index.php/ro/rograme/migration-management/migration-facts-and-figures (accessed 28.6.2012). 11However, while a large proportion of Moldovans speak Russian, 65 per cent of Moldovan migrants arriving in the EU lacked the host country language skills (ibid).

15
Table 1. Sectoral distribution of Moldovan labour migrants in different host countries in 2008 (per cent)
Sector Russia EU-27 Italy other total Agriculture 0.7 5.9 3.5 3.1 2.4 Processing industry 5.5 4.4 2.6 4.7 5.1 Construction 68.0 28.7 18.1 31.6 53.1 Trade 14.4 4.6 2.3 12.2 11.4 Hotels and restaurants 2.0 3.8 4.1 3.8 2.7 Transport and communications 3.8 2.5 1.8 1.0 3.2
Domestic services 3.2 47.3 65.4 40.4 19.6 Other 2.4 2.9 2.9 3.2 2.7 Total 100 100 100 100 100
Source: NBS (2008).
As labour migrants to Russia and Italy account for about four fifths of all Moldovan labour migrants, agglomeration economies associated with and net benefits offered by these two destinations (e.g., established migrant networks and intermediaries, size of migrant communities) must be strong enough to attract Moldovan migrants away from other destinations even though wage premia might be realized by moving away from these well-trodden paths. Cultural similarities and the shared history make it easier for Moldovan migrants to navigate through the Russian labour market on their own while in Italy they are more dependent on job agencies. Only ten per cent of Moldovan migrants to Italy make their own travel arrangements while the corresponding figure for Russia is 25 per cent (NBS 2008: 8). These differences in the workings of migrant networks are also reflected in the relative cost of migration. The Russian labour market is relatively cheap to access and attracts less skilled people seeking casual and short-term employment. The EU is more costly to enter and, as most jobs accessible to Moldovans are low-wage, the average duration of stay must be longer to recoup the cost of investment and produce a net gain for the migrant.12 Nearly half of Moldovan migrants are “irregular” in that their status is often a combination of legal/illegal entry and subsequent illegal employment.13 Migrants to Russia cross the border legally but post entry many of them seek illegal casual employment. Many migrants to Italy may also enter legally but they often overstay their visas to work illegally. Others combine illegal entry with illegal work. Illegal entry and stay restrict migrant mobility as a border crossing could result in a deportation of overstayers and future visa refusals. The irregular status also encourages high propensity to save and remit money home (see below). 12While migration to Russia could by financed by an equivalent of a month’s pay (c. EUR200 in 2008), migration to the EU is relatively costly: an equivalent of an annual Moldovan salary (NBS 2008). The nature of work is also important as unskilled, casual construction work (Russia) requires little job-specific investment while domestic work (Italy) involves relationship and trust formation between the employer and the employee. 13 About 58 per cent of Moldovans working in the Russian Federation and 51 per cent of those working in the EU have no work permits (EUI 2012, “Moldova: Labour migration impact”, unpublished report, July version: 16).

16
Figure 6 shows the gender and age distributions of Moldovan labour migrants to Italy and Russia. The figure shows migration to Russia to be largely masculinized and that to Italy feminized. This is because the two main absorbing sectors (construction and domestic work) offer jobs that have traditionally been gender-specific. The gender distribution across age groups is broadly similar in Russia while in Italy there are more women in the older age cohorts. This reflects stronger demand for mature women employed in domestic and age care. Thus, older women tend to migrate to Italy to care for the elderly or work as housekeepers while younger men migrate to Russia to work on construction sites. Migrants to Russia are on average slightly younger (34 years compared to 38 years in Italy). Figure 6. Moldovan migrants to Italy (IT) and Russia (RUS) by gender and age in 2011 (per cent)
Note: The observed differences in proportions are statistically significant. For the test of proportions contact the authors. Source: own calculations based on http://statbank.statistica.md: “Population aged 15 years and over, working or looking for work abroad by Level of education, Country of destination, Age groups, Years, Area and Sex” (accessed 1.1.2013). Nearly 40 per cent of those migrating to the EU and 56 per cent of those migrating to Russia had been unemployed prior to their departure from Moldova (NBS, 2008). The EU attracts a somewhat larger proportion of previously employed workers (41%) relative to Russia (34%). It appears that the Russian labour market attracts those keen to find work while that of the EU those seeking better pay. Figure 7 shows the educational background of Moldovan migrants to Russia and Italy in 2011. Most Moldovan migrants to both destinations have at least secondary education, largely general rather than vocational. Russia attracts somewhat less educated people, which is surprising given the widespread knowledge of the Russian language in Moldova. A priori, one would expect a larger proportion of Moldovan professionals to work in Russia. Italy attracts a relatively larger proportion of tertiary educated men and women.

17
Figure 7. Educational background of Moldovan migrants to Italy (IT) and Russia (RUS) and of the active domestic population (POP) in 2011 (per cent)
0%
10%
20%
30%
40%
50%
60%
70%
80%
90%
100%
Men (IT) Women (IT) Men (RU) Women (RU) Men (POP) Women (POP)
HigherSecondary specializedSecondary professionalSecondary school
GymnasiumPrimary or no education
Note: The observed differences in proportions are statistically significant. For the test of proportions contact the authors. Source: own calculations based on http://statbank.statistica.md: “Population aged 15 years and over, working or looking for work abroad by Level of education, Country of destination, Age groups, Years, Area and Sex” and “Population aged 15 years and over by Labour status, Level of education, Years, Area and Sex” (accessed 1.1.2013). Table 2 shows the migrants’ occupational mobility between home and host markets. Nine occupational groups are identified (see Notes to the table). Group 9 (gr9) represents the least skilled manual workers. Each cell in the matrix shows the percentage of migrants from a designated home occupational group (row i) whose current job abroad is assigned a particular occupational designation (column j). For example, the more vocationally-oriented migrants (groups 6-8) are most likely to find foreign jobs in similar occupational categories. Those who were at the bottom of occupational classification at home (gr9) mostly stay at the bottom (here, by definition, there is no scope for downward mobility). Migrants who were close to the top of the occupational ladder at home see their skills and status devalued the most, e.g., those who were in gr1-3 at home drop down to much lower occupational groups in host countries and about half of them drop all the way down to the lowest two groups (gr8-9). Only gr8 (mostly machine and equipment operators) move up the occupational ladder when migrating abroad.

18
Table 2. Migrants by their last job in Moldova and their occupation at the last/current job abroad in 2008 (per cent)
Current occupational group abroad (current foreign job) Occupational group at home (last home job) gr1 gr2 gr3 gr4 gr5 gr6 gr7 gr8 gr9
gr1 3.0 4.4 0.0 0.0 10.1 0.0 23.3 17.4 41.8 gr2 0.8 7.5 1.2 0.0 16.0 0.0 24.9 1.6 48.0 gr3 0.0 0.0 4.4 2.0 21.5 0.6 14.5 1.3 55.7 gr4 0.0 0.0 0.0 0.0 63.5 5.3 0.0 0.0 31.2 gr5 0.6 0.0 0.7 0.0 32.2 0.3 20.8 1.1 44.2 gr6 0.5 0.0 0.6 0.0 12.8 4.5 50.7 1.2 29.7 gr7 0.0 0.0 0.0 0.1 3.3 0.4 76.5 2.5 17.1 gr8 0.0 0.0 0.0 0.0 4.0 1.4 43.4 38.3 12.9 gr9 0.0 0.0 0.1 0.3 8.0 0.2 36.9 2.4 52.1
Notes: Major groups of the Classificatory of Occupations in Moldova, harmonized with ISCO-88: Group 1 – Heads of public authorities of all levels, heads and high officials of economic-social and political units; Group 2 – Specialists with high level of qualification; Group 3 – Specialists with medium level of qualification; Group 4 – Administrative public servants; Group 5 – Workers in services, locative administration and community services, trade and assimilated; Group 6 – Qualified workers in agriculture, forestry, hunting, fish farming and fishery; Group 7 – Qualified workers in big and small industrial companies, handicraft, constructions, transport, telecommunications, geology and geologic prospecting; Group 8 – Operators, machine operator, equipment and machinery operators, assembling mechanics; Group 9 – Low-skilled workers. Source: NBS (2008). This is hardly surprising. Skills associated with various occupational groups in Moldova are highly country-specific and cross-border mobility makes many such skills obsolete. This country- specificity of skills could be interpreted as “brain waste” when tertiary-educated Moldovan lawyers work on Italian construction sites as semi-skilled casual workers. However, like other forms of capital, human capital is also depreciated and written off and brain waste occurs every time skills acquired in the past are no longer demanded and become legacy skills. Cross-border mobility of human capital inevitably changes the proportion of human capital that is depreciated or written off. But, much brain waste in Moldova is a product of post-communist transition with migration channelling abroad “brains” not much demanded at home. We have also attempted to explore quantitatively the likelihood of Moldovans with different educational backgrounds migrating abroad. Figure 8 shows the selectivity index (SI) of migration by gender and educational background in 2006 and 2011.14 The figure shows that 14 The Selectivity Index with respect to the level of educational attainment is calculated for emigrants following the formula
egSIeg eg
eg
M PM P
PP
−=
where Meg is the number of Moldovan migrants with educational attainment e and of gender g (e.g., tertiary educated women), and M is the total number of Moldovan migrants of gender g. The ratio Meg/M is thus the proportion of, for example, tertiary educated women in the total population of female migrants from Moldova. Variables denoted P represent analogous measures but for the resident population, including people who are temporarily away. Because migrants were defined as people who are working or searching for a job abroad, the same restrictions have been imposed on the domestic population (the inactive have not been included in either population count). In order to allow comparability, all indices are normalized by the respective population ratio.

19
people with higher, on the one hand, and primary or no education, on the other, are relatively less likely to migrate.15 This is also applies to people with specialized secondary education. While all three groups migrate abroad, these educational groupings tend to be underrepresented in the migrant population relative to the population as a whole. It appears that the opportunity cost of migrating for the two most educated groups is higher than for most other groups. The less-educated are also less likely to migrate; perhaps lacking resources or confidence to move. The opposite is the case when people are educated at upper and lower secondary levels (the SI is positive for both men and women). It is these two categories that are more likely to migrate; perhaps because they lack specialized and professional skills to stay in Moldova. For people with secondary vocational education, the SI varies with gender but not over time. Women with secondary vocational education are relatively more footloose while the opposite is true for men. It appears that the opportunity cost of migration is higher for men with secondary vocational education and, thus, they are relatively less mobile. Figure 8. Selectivity index of Moldovan migration with respect to education and gender, 2006 and 2011
Note: The indices calculated for the years 2007-2010 have not presented any critical differences and so are not reported. Source: own calculations based on http://statbank.statistica.md: “Population aged 15 years and over, working or looking for work abroad by Level of education, Country of destination, Age groups, Years, Area and Sex” (accessed 1.1.2013).
Overall, Moldovan migrants incur high rates of human and social capital depreciation. With the exceptional of those with technical or vocational training, they are rather unlikely to work in similar occupational categories as their skills tend to be specific to their home country and are not
15 The SI takes a negative value as the second term in the enumerator is larger than the first one; for example, the proportion of tertiary educated women is higher in the population as a whole than among the migrants).

20
internationally portable. And those higher up in the social pecking order in Moldova are unlikely to retain their social status when they migrate abroad. This deters some people and makes migration more selective (Borjas 1987, 1994). To make better use of their capabilities, both the migrants and their employers would have to invest in complementary resources needed to adapt and develop their home-acquired skills to match those required at destination. Such investments are unlikely to be made when migrants are employed illegally or for short periods of time. The mode of migration also influences this adaptation process. Migration networks make it easier to find a job initially but they often impede the subsequent adaptation process as migrants are channelled into ethnic ghettoes with high path dependency. In turn, that means that they form little human capital during their stay abroad which could subsequently be repatriated to Moldova. 4. Return migrants Of those migrants who return to Moldova, one in five declares that he/she does not wish to go abroad again (NBS, 2008). Nevertheless, the high proportion of those claiming to be uncertain is indicative of their rather “intentionally unpredictable” strategies, which reflects a broader trend where decisions to migrate are influenced by the ever changing opportunities at home and abroad and where migrants are highly flexible and agile when confronted with these opportunities (Drinkwater, Eade, Garapich 2006; Grabowska-Lusinska and Okolski 2010). In this respect Moldovans are becoming increasingly similar to other East European labour migrants. A survey conducted for the International Organization for Migration (IOM) in Moldova suggests that returning migrants are more likely than non-migrants to run their own business. Overall, four per cent of respondents had their own businesses at the time of survey but the proportion was seven per cent for those with first-hand migration experience. Another 8.4 per cent of respondents flagged their intention to open a business and the proportion was double that rate for those with direct migration experience (IOM 2008: 17). This could mean that returned migrants are somewhat more entrepreneurial than non-migrants and/or more confident about their business acumen.16 On the other hand, a survey of 1,010 potential migrants and 1,010 returned migrants conducted by the European Training Foundation (EFT) in 2008 revealed that in a majority of cases the experience obtained abroad did not help to obtain better employment at home and over 50 per cent of returnees were not working at the time of the survey (ETF 2008). It is very unlikely that the current generation of return migrants will form the new entrepreneurial class capable of engineer the job-rich growth in Moldova. Most of those who leave lack such skills as otherwise they would have stayed. And, because most migrants have little opportunity to invest in their human capital when abroad, acquire portable skills or accumulate financial assets, they lack the means to initiate new business ventures when they return home. 16 The IOM study also suggests that migrants tend to be less risk-averse than non-migrants (ibid: 20).

21
5. Inflow of remittances
Moldovan labour migrants have a high propensity to save and remit their savings back home (World Bank 2011b), especially for altruistic reasons and investment purposes (Piracha and Saraogi 2012). Migrant remittances account for about a third of the Moldovan GDP (Stratan et al, 2012). As remittances are mostly used for consumption (especially for the purchase of consumer durables), remittance spending is relatively import-intensive and only a small fraction of the inflow is channelled to the development of local enterprise and production (ibid: 8). Table 3 shows the distribution of remittance-funded household outgoings. Between 40 and 50 per cent of remittances are spent on day-to-day consumption and durable household goods with the highest proportion in households receiving remittances from Russia.17 House purchase is another major outgoing. Interestingly, little is spent on education and health, arguably an indication of the low socio-economic status of Moldovan migrants. This is similar to many poor remittance-receiving countries where migrant transfers keep their families out of poverty and, if possible, better housed, but add little to the domestic capacity to produce future wealth (NBS, 2008). Table 3. Remittance-funded household expenditures and savings, 2008 (by host country of remittance-senders, per cent)
Outgoings/savings All countries
EU-27 Russia Other
Daily needs 46.17 40.11 48.56 49.14 Durable goods 7.46 3.55 9.25 7.76 Agricultural investments 1.26 0.00 1.21 0.00 Non-agricultural business investments 0.00 0.00 0.00 0.00 House purchase 20.89 22.10 20.93 16.81 Debt repayment 9.76 18.14 5.42 12.50 Education 4.94 6.41 4.40 0.00 Health 2.37 2.05 2.43 0.00 Savings 6.48 5.32 7.47 0.00
Total per cent 100 100 100 100 Households (persons in thou.) 253.2 73.3 156.7 23.2
Note: The observed differences in proportions are statistically significant. For the test of proportions contact the authors. Source: NBS (2008). Clearly, the inflow of remittances is not the panacea for Moldova’s economic ills. Even in the short run their impact is ambivalent.18 While they drive economic growth and lift living standards of
17This is indicative of the different nature of the two migration flows and the cost accessing jobs in these labour markets. For example, households supported by remittances from the EU spend nearly a fifth of these inflows on debt repayments, which is in keeping with much higher cost of migrating to the EU than to Russia (Kring, 2008). 18Even those resources that are saved either are not deposited with financial intermediaries or the latter are too narrowly based to have the capacity to channel them effectively to more productive investments (Stratan et al, 2012). And, as the remittance inflow prevents the exchange rate from depreciating, imports become more competitive and displace locally produced but import-competing goods and services (tradeables). In some areas, such as housing and real estate, the inflow of remittances inflates prices and crowds out buyers who cannot compete against those flush with remittance money. This is a variant of the ‘Dutch disease’ in that sectors that do not benefit directly from the inflow of remittances find it is hard to stay competitive and there is even less incentive for local entrepreneurs to invest.

22
remittance recipients they also create a disincentive to seek low paid work (Stratan et al, 2012). This remittance-driven, jobless growth will be hard to sustain in the long run. For remittances to flow in at a present rate, most migrants would have to retain their temporary and irregular status. Once they settle in host countries their propensity to save may remain high but the propensity to remit their savings back home will decline as “home” starts to move from the country of origin to that of settlement (Dustman and Mestres 2009). And, with the predicted decline of population of working age, Moldova will not be able to sustain the present number of temporary migrants. Large scale migration would only be possible to sustain if the proportion of migrants in the Moldovan population increases over time to offset the loss of temporary migrants due to settlement and return. Thus, if Moldova is to break through the barrier of jobless growth it must seek new sources of growth. One such strategy is to redirect resources currently spent on education to make Moldovans more employable.
6. Education
Provision of education and training As noted, Moldova spends around 9.5 per cent of GDP on education, which is about twice the regional average (IMF, 2012: 8) and, as most educational expenditure is public rather than private, this accounts for a significant proportion of the government budget. Education is also one of the priority target areas for foreign aid provided to Moldova. As a result, Moldova is a relatively well educated country with over 80 per cent of those economically active having at least secondary qualifications. In the late 2000s, the proportion of tertiary educated people continued to increase while those with secondary vocational education retained their share of about 25 per cent of the economically active population. In 2010-11, of the 108 thousand students, over 84 per cent of those in tertiary education were enrolled at the licentiate level and nearly 12 per cent at the master’s level. About four per cent were enrolled in medicine and pharmacological studies. In 2011, there were 292 students and 78 graduates from higher education institutions per ten thousand inhabitants (Spoiala et al, 2012:78).19 However, while the education funding has been assigned high priority in Moldova, the social effectiveness of this expenditure is open to question. About half of those graduating take economics and law degrees (see Table 4). On the other hand, there are significant skill shortages in areas such as school teaching and, overall, the tertiary education spending appears to be poorly balanced with an oversupply of lawyers and economists but undersupply of scientists, engineers, IT and agricultural specialists. A survey conducted by the European Training Foundation in 2008 (ETF, 2008) revealed that only 12.8 per cent of students listed job opportunities as a reason for choosing a particular area of study in contrast to personal interest (59.4%).
19 At the same in neighboring Romania the number of students in tertiary education per thousand inhabitants was 43 and the number of graduates was 12. For The EU-27 the respective numbers were 38 and 10 (own calculations based on Eurostat: “Students by ISCED level, age and sex”, “Graduates in ISCED 5 and 6 by age and sex”, “Population on 1 January by age and sex”, accessed 1.02.2014).

23
Table 4. Percentage of Moldovan university graduates by field of study in 2005-2010 (per cent). Subject areas 2005 2006 2007 2008 2009 2010 Economics 28.53 24.44 27.33 38.93 34.75 31.77 Law 20.58 20.86 21.57 14.52 15.52 16.22 Education science 2.68 4.46 3.72 3.51 11.14 13.46 Engineering and related activities 8.20 7.74 8.26 6.06 7.69 8.47 Humanities 11.53 12.87 10.24 9.09 4.94 3.68 Architecture and construction 2.01 2.36 2.32 1.59 2.91 3.58 Public services 0.57 0.81 0.92 2.19 2.63 3.46 Political science 5.68 4.78 4.00 4.13 2.81 2.66 Manufacturing and processing 1.88 2.12 2.35 1.77 2.33 2.60 Sciences 7.79 6.30 5.35 4.63 2.93 2.24 Social service 0.81 1.12 1.42 1.97 2.32 2.22 Social sciences 1.73 2.46 2.59 3.00 1.94 1.70 Communication science 1.17 1.13 1.40 1.71 1.50 1.67 Natural sciences 1.56 1.65 2.25 2.32 2.20 1.62 Arts 1.87 2.21 2.67 1.55 1.21 1.48 Agriculture 1.48 1.87 1.38 0.96 1.06 1.25 Physical education and sports 1.04 1.52 0.94 0.92 1.05 0.97 Chemical technology and biotechnology 0.47 0.37 0.40 0.47 0.34 0.52 Military 0.00 0.60 0.51 0.36 0.35 0.39 Veterinary 0.40 0.35 0.37 0.31 0.36 0.04
Total number of graduates 16,975 16,500 19,479 29,063 25,937 23,035 Source: http://statbank.statistica.md: “Graduates from higher education institutions by cycles and subject groups, 2005-2011”(accessed 1.10.2012).
7. Demand for education and training
Although unemployment and low wages have been the two main push factors driving labour out of Moldova, there is also an apparent mismatch between jobs on offer and the supply of labour. In 2007, about 85 per cent of Moldovan companies, including the main exporters, reported shortages of qualified labour (Birca and Gamanji 2007). In May 2011, of 5705 reported job vacancies, about 25 per cent required applicants with tertiary and specialized secondary education. Most professional vacancies were for health workers, managers, civil servants, engineers, and accountants.20 Shortages of suitable qualified applicants may grow in future as the proportion of jobs that require at least secondary qualifications is expected to increase to nearly 80 per cent (Moldova 2020 Strategy: 12). The shortage of people with “needed” (relevant) qualifications has been the main (stated) reason for hard-to-fill vacancies (Bîrca and Gamanji 2007: 8). This applied to 67 per cent of reported vacancies. The employers also found it difficult to discriminate between those with “real” (usable) competences as opposed to those formally qualified in a particular area (21%). And, they
20See the web page of the National Agency for Employment/ www.anofm.md

24
often found it difficult to compete for labour as they could not match wage expectations of some potential employees (25% of reported vacancies) (ibid).21 The mismatch between job requirements (demand side of the market) and the attributes of job seekers (the supply side) has also been emphasized. In nearly 70 per cent of cases, a job seeker’s actual professional knowledge is inadequate relative to what is required on the job. In 30 per cent of cases, job seekers lack basic professional competences and a fifth of them have inadequate general education. In addition, they are poorly motivated as shown by their lack of work loyalty (32%) and find it difficult to adapt to the employing company (13%). Not surprisingly, 30 per cent of people graduating from universities, colleges and professional schools are not working in jobs aligned with their formal qualifications (ibid: 11). Most Moldovan firms are too small and resource-poor to invest in extensive skill development programs in-house. Their inability (and in some case unwillingness) to pay wages and salaries matching job seekers’ expectations is also a factor inhibiting a better match between the labour supply and demand.22 Opportunities for migration to higher wage countries make this problem more acute. There is growing awareness in Moldova that the supply of skills by educational institutions needs to be better tailored to market demand. To reduce the current mismatch, it has been suggested that business representatives should sit on university boards; needs assessments are conducted within the business sector; students should become involved in applied R&D projects and combine formal study with practical placements and internships in companies. All such initiatives aim at the production of more efficient and deployable human capital and, thus, the more job-oriented, adaptable and flexible labour force. 8. Changing gears: from jobless to jobrich growth While the challenge for the Moldovan educational sector is to better tailor supply to labour market demands, this also creates a dilemma for the Moldovan policy makers. If the country is to continue to spend a relative large proportion of its GDP on education, the switch to more market-oriented outcomes will also increase opportunities for Moldovans to migrate in search of better-paid jobs abroad. Thus, to avoid brain waste, the more market-oriented educational policy would accelerate brain drain. Importers of Moldovan labour would free ride at the expense of Moldova and, in the worst case scenario, all efforts to “educate Moldova” into the job-rich growth would be in vain as newly formed skills are exported en masse. To reduce brain waste without excessive brain drain, three conditions need to be met: 1. the supply side of the educational sector should be restructured to make it responsive to market
demand. The challenge for policy makers is to expose the sector to sufficient competition to
21Percentages do not sum to 100% as multiple responses were possible. 22As some studies show (e.g., Expert Grup, 2009: 50), for those who find jobs, one additional year spent in formal education increases, other things equal, the wage by 9.5 per cent. This needs to be weighted though by the probability of securing a job. Thus, the expected wage increment is lower.

25
make it both customer-focused and cost effective, i.e., to ensure that job-focused educational services are “tradable”, that is, that they are supplied through contestable markets opened to new entrants and potential import competition from foreign educational providers;
2. there must be a strong incentive for young Moldovans to invest in more marketable skills, i.e., they must be rewarded with an adequate return on their investment. Also, more employable Moldovans should be able to realize wage premia abroad relative to wages received by those working in traditional migrant occupations; and
3. in an open economy such as Moldova a large enough proportion of those “educated for jobs” should remain in country rather than migrate abroad to increase the productivity of Moldovan resident labour and make it more internationally competitive.
The second and third conditions have been addressed more broadly in the brain drain literature: an inducement to invest in more employment-oriented education at home has been described as a form of “migration lottery” or “probabilistic migration” (Mountford 1997; Stark, Prskawetz, Helmenstein 1997; Beine, Docquier, Rapoport 2001, ). As Mountford observed, the relevant human-capital-cum-migration literature straddles two areas. In the traditional endogenous economic growth literature, the seminal work of Lucas (1988) has triggered further contributions on the impact of human capital formation and accumulation on economic growth (e.g., Barro 1991; Mankiw et al, 1992; Galor and Tsiddon, 1994, Dolado et al, 1994). The other strand focused on the impact of migration on human capital formation, mobility and sustainment in an open economy, that is various aspects of brain drain, gain, waste, and so on (for a recent survey, see Venturini 2012). drawing on the earlier work of Miyagiwa (1991) and Galor and Stark (1990, 1991), Mountford has provided a conceptual bridge between these two strands of literature. Thus it is his approach that provides be the starting point for the line of argument presented in this paper. The demonstration effect of suitably educated people finding more rewarding foreign employment is expected to motivate others to invest in education. Thus, all those who invest in their enhanced employability receive a “migration lottery ticket” in that they now have a chance to migrate to secure higher return on their investment. However, successful foreign placement is not a certainty as only a proportion of those suitably educated will find better jobs abroad. For the brain drain to act as an inducement to increase the home country productivity, the increased human capital formation must more than offset the loss of productive capability due to migration (Mountford 1997: 288). In other words, a brain drain can enhance the (home) country’s welfare if it increases the level of domestic productivity by engendering “growth externality” associated with the increased number of people educated for jobs (migration lottery ticket holders) remaining in country even though others migrate abroad and find much coveted jobs (lottery winners) (ibid: 289). As tales of success filter back home, more people are induced to invest in suitable skills but only some of them would migrate abroad. But once they are more jobs-oriented, graduates will find more opportunities for finding employment at home. Once the level of productivity starts to increase other dynamics effects may come into play (e.g., footloose foreign capital may be attracted

26
to take advantage of higher quality local labour, domestic wages start to grow to attract more locals into education for jobs and remain in-country afterwards). Mountford’s model uses the carrot of migration quota policies to make migration “probabilistic”. Such model could have been applicable in the old Soviet Union, which restricted external mobility of its nationals using exit visas (op. cit.: 288). However, the restricted exit conditions are incompatible with an open economy such as Moldova whose nationals are free to leave and enter their homeland even though they may be denied entry rights elsewhere. Nevertheless, much of Mountford’s formal methodology is very useful in highlighting tradeoffs involved between positive and negative effects of increased educational effort and brain drain as well as the existence of multiple steady state equilibria so that an appropriate migration policy could permanently lift the economy from the low-education-low-productivity steady state to the high-education-high-productivity steady state. Moldova has already been exposed to brain drain in that many of its educated people have migrated abroad but, as shown earlier, this has also been associated with considerable brain waste as these migrants tend to drift into menial jobs where their human capital endowments depreciate rapidly.23 But, while migration has provided Moldova with an opportunity to export some of its surplus labour services, it has failed to induce Moldovans to educate themselves for better jobs abroad and at home. The supply side of home educational sector has not been able to produce skills needed to secure better paid jobs abroad and, thus, most migrants have only been able to access a restricted range of migrant-specific occupations regardless of their educational attainment. Thus, initially, the “migration lottery” aspect of education-for-jobs would be related to the probability of accessing more rewarding employment abroad, e.g., securing legal employment, getting jobs previously available only to the natives, or qualifying for permanent residence in the host country. As success stories of Moldovans making it good abroad accumulate, the associated demonstration effect should induce others to invest in more employment-oriented education. Similarly, the providers of educational services would find it increasingly profitable to offer courses for which demand is stronger. But, as only a proportion of those suitably educated find better jobs abroad, others would use their newly acquired skills at home, thus, boosting Moldova’s growth potential (growth externality). Host country governments could also assist Moldova in this respect by switching foreign aid to offers of assistance in the form of a pool of temporary work permits for suitably educated Moldovans. 9. Policy challenge: Brain drain with job-rich growth Figure 9 provides a stylized representation of the brain drain demonstration effect as it might apply to Moldova. Panel A shows the Moldovan domestic job market, where the Moldovan labour force, WFM, comprises all those employed and unemployed currently present in Moldova. There are two
23However, as many educated Moldovans have remained in Moldova, it is reasonable to expect that not all those educated for jobs will inevitably emigrate.

27
market segments represented by the two wage levels, WMlow and WMhigh respectively. The initial domestic supply schedule is the upward sloping SM1. This is kinked to indicate that labour is supplied by less productive workers whose reservation wage is low and increasing slowly along the lower segment of SM1 up to the level indicated by the kink in the schedule. However, labour services are also offered by more productive workers whose reservation wages are higher. These workers are represented by the upper segment of SM1 above the kink. The total number of the less productive workers is 0EM3 and the more productive ones is EM3EM4. The domestic demand for the less productive workers, DMlow, is shown as the horizontal line intersecting the lower segment of the supply schedule below the kink so that at the going wage rate for these less productive workers is WMlow. At this wage rate only 0EM2 of them take the jobs on offer and EM2EM3 are unemployed, i.e., their reservation wage is above WMlow. This is the lower end of the market, where the majority of Moldovans are employed (or not) and, while reservation wages of the less productive workers are low, there is not enough work to employ all of them, 0EM3, at wages they are prepared to accept.24 Figure 9. Brain drain-induced productivity growth
Panel A. Moldova Panel B. Abroad
Wage WFM Wage
WAhigh SA1 SA2 demand for native workers
WMhigh DMhigh SM2 SM1 WAlow demand for migrants
WMlow DMlow
0 EM1 EM2 EM3 EM4 Workers 0 EA1 EA2 EA3 Workers
Source: own elaboration.
However, there is also the “upper” market segment, which employs the more productive workers whose reservation wage is above the kink in the supply schedule SM1 but not higher than WMhigh. In our stylized representation, there are EM3EM4 of these workers. Presently, all of them are employed at the higher wage rate, WMhigh and the market demand for these workers, DMhigh, is shown as a thick horizontal line between EM3 and EM4 at the height of WMhigh (the wage rate prevailing in the
24Note that in this representation the unemployed are those unwilling to reduce their reservation rate rather than those keen but unable to find work at the prevailing wage rate. This is a more realistic representation of the Moldovan labour market where there would be more employment if some workers were prepared to work for less.

28
more productive segment of the economy). Thus, of the total number of workers present in country, EM4, 0EM2 are employed in the less productive sector; EM3EM4 in the more productive sector; and EM2EM3 workers are unemployed. However, there are also Moldovan workers who have left the country and are currently working abroad. These migrant workers are shown in panel B, which represents the foreign labour market labelled “Abroad”. This stylized foreign labour market is also segmented: the local workers are normally employed in the more productive and better paid jobs while the majority of foreign migrants are employed in less productive and lower wage jobs that the locals are not interested in. Thus, the initial “migrant” and “native” demand schedules are shown as horizontal lines at WAlow and WAhigh respectively. Abroad, Moldovans represent only a small segment of the migrant supply so all who wish to work find jobs at WAlow. However, the supply of Moldovan workers is also kinked indicating that most migrants, 0EA1, work in menial jobs at the prevailing (low) wage rate WAlow. Only a small number of suitably educated Moldovans, EA1EA2, are employed in jobs normally dominated by native workers at the higher wage WAhigh. Their reservation wages are above the low skill migrant wage, WAlow. Suppose that the government of Moldova initiates the proposed reform of the educational sector to increase the supply of workers educated for jobs. These workers must now bear the higher cost of their education, for example, they must now borrow from government (student loans) to pay for their education. Thus, they are most likely to seek jobs abroad to recoup their investment as domestic wages in the “more productive” market segment are not high enough to justify the effort. In Figure 9, panel B, the supply of more employable Moldovan workers shifts to the right from SA1
to SA2. The “menial” segment of the supply schedule remains invariant as these workers stay in their existing employment. Only the upper segment above the kink shifts/tilts to the right when more productive and employable people arrive from Moldova to compete for better jobs Abroad. All these people have reservation wages above WAlow but as they are also more employable, they are all shown to have found work at the higher “native” wage rate WAhigh. These are the migration lottery winners. And, as a larger number of Moldovans get better paid jobs abroad, this generates a demonstration effect inducing other Moldovans to invest in job-focused education. However, not all of these workers can find suitable jobs abroad and, thus, some stay in country to work in the more productive segment of the Moldovan economy. In panel A, the supply of Moldovan workers shifts to the left to SM2. But there are two components to this shift. The employment of low-productivity workers shrinks from 0EM2 to 0EM1, as some of them got educated for jobs and either left the country or they now compete for jobs in the upper market segment. Thus, the number of more productive workers increases from EM3EM4 to EM1EM2, the segment of the domestic labour supply above the kink tilts to the right. For simplicity, we assume that all of them find jobs at the higher domestic wage rate WMhigh, i.e., the new demand schedule, DMhigh, is shown as the thick horizontal line at the height of WMhigh. While the total domestic employment is lower, as more people migrate abroad, the low productivity sector of the economy contracts and the high productivity sector

29
expands - lifting up the average level of in-country productivity and the average wage rate and paving the way to higher rate of economic growth. As the economy grows, the domestic wage in the more productive segment of the economy increases so that the wage gap between Moldova and Abroad narrows. In future, fewer workers are inclined to migrate abroad in search of employment and some of those who previously migrated are now willing to return. Over time, the old style jobless growth may give way to more job creation in the high productivity sector of the economy. The success of this policy depends on two factors. First, the Moldovan educational sector must be induced to make the transition to more job-oriented education and training. Clearly, government reformers are not in a position to “pick winners” and prescribe who is to deliver a new range of services or what needs to be delivered. It is the educational market that should be allowed to engineer this change. To reduce the cost of market friction, it is necessary to keep these services “tradable” and contestable. This is the private sector domain and, if necessary, the restructuring of educational offerings may require entry of foreign service providers (e.g., vocational colleges rather than conventional universities). Second, the ‘who-pays’ question needs to be addressed. While there is some element of “publicness” in the provision of jobs-oriented education, the bulk of supplied offerings are private services for which individuals should pay privately as they will be the primary beneficiaries of their increased employability. However, in a developing country such as Moldova, this would be difficult to realize as many of those willing to learn lack the ability to pay for it. One way out of this quandary is to offer those making such investment government loans repayable in future through tax rate surcharges once people settle in new jobs and their pay reaches the threshold deemed high enough to trigger loan repayment.25 The state could also offer scholarships, on merit, to the most gifted students and/or those coming from particularly impoverished background. While every form of intervention brings with it its own moral hazards and adverse selection problems, the aim of lifting the Moldovan economy from the state of jobless growth needs to be kept in the forefront of the analysis.26 10. Conclusions With its lack of natural resources, peripheral location and relatively small population, Moldova is not well positioned to attract large inflows of foreign direct investment and footloose foreign human capital. It has to enhance its own resource base to attract inflows of globally mobile resources and ultimately engender the virtuous circle of sustainable economic growth.
25 This model has been successfully adopted in Australia as the so-called Higher Education Charge Scheme. 26The use of repayable loans to fund the provision of education raises many equity and moral hazard-related questions. What if those funded by loans leave for abroad never to return? Or, would the repayability of loans encourage the underreporting of earnings and make a larger proportion of workforce drift into the gray economy of tax evasion? Would people with outstanding educational loans be more inclined to work illegally abroad? Clearly, there would be many forms of repayment evasion and some supplementary policy instruments would need to be used. For example, those working abroad with outstanding educational debts may have to pay higher fees for the renewal of their Moldovan passports. Or, people working in Moldova for a period of time immediately following the completion of their education/training could have their debts written off by the state as a reward for fulfilling the “return of service obligation”.

30
Much hope has been attached to the growth-inducing potential of returning migrants who are expected to bring with them new skills and technical know-how as well the necessary business acumen. But, most Moldavian migrants perform un- or semi-skilled work with limited opportunity for new skill acquisition and, thus, lack the ability to lead the labour market revival. It is not only that little new human capital is being formed by migrants abroad but also a large proportion of previously formed human capital is written off permanently as returning migrants cannot find jobs compatible with their past education. Investment in human capital formation has long been recognized as a potential source of economic growth in Moldova. However, the education sector has failed to turn out sufficient numbers of people with skills and commitment to work demanded by Moldovan employers. Hence there is little indication of Moldova being able to educate its way out of the jobless growth. A strong case could be made for redirecting educational spending through policy intervention. This would be risky as some brain drain is inevitable. However, providing Moldovan migrants do well abroad, this would create a demonstration effect inducing more people back home to invest in education. As long as a proportion of them remain in country rather than migrate abroad, the resultant increase in the stock of human capital could be strong enough to increase Moldova’s labour productivity, increase the long-term rate of economic growth and create jobs. We suggest that this I best achieved through a combination of a market-driven supply restructuring and government grants and loans to make education accessible for those able and willing to study for jobs. The proposed policy is risky as the market may fail to redirect supply and its success may be qualified if the ensuing brain drain is excessive. But, is there an alternative? References Beine M., Docquier F., Rapoport H. (2001). Brain drain and economic growth: theory and evidence. Journal of Development Economics 64(1): 275–289.
Barro, J. (1991). Economic growth in a cross section of countries, Quarterly Journal of Economics, 106: 407-444.
Bîrca A., Gamanji A. (2007). Labour relation in the Republic of Moldova: Companies’ Viewpoint, Expert Group, online: http://www.expert-grup.org/library_upld/d78.pdf (accessed: 1.10.2012).
Bolganschi D. (2011). Rural Out Migration and Land Use in Moldova, Policy Research Reports, Budapest: Center for Policy Studies, Central European University.
BOP (2012) Barometrul Opiniei Publice, online: http://www.ipp.md/public/files/Barometru/Brosura_BOP_05.2012.pdf (accessed 10.6.2012).
Borjas G. J. (1987). Self-Selection and the Earnings of Immigrants, American Economic Review 77: 531-553.
Borjas G. J. (1994). The Economics of Immigration, Journal of Economic Literature 32: 1667-1717.

31
Cardais, A. (2008) Moldova: Hooked on Remittances, Business Week, 22 April. online: http://www.businessweek.com/globalbiz/content/apr2008/gb20080422_406625.htm (accessed 3.7.2012).
Comisia Naţională pentru Populaţie şi Dezvoltare (2009). Cartea verde a populatiei, Chisnau: Comisia Naţională pentru Populaţie şi Dezvoltare.
CIVIS/IASCI (2010). Strengthening the Link between Migration and Development in Moldova, Chisinau: CIVIS/IASCI. online: http://siteresources.worldbank.org/INTECA/Resources/WBMoldovaReport.pdf (accessed: 6.06.2012)
Dolado J., Goria A., Ichino A. (1994). Immigration, human capital and growth in the host country, Evidence from pooled country data, Journal of Population Economics 7: 193-215.
Drinkwater S., Eade J., Garapich M. (2006). Poles Apart? EU Enlargement and the Labour Market Outcomes of immigrants in the UK, IZA Discussion Paper No. 2410, Bonn: IZA.
Dustmann C., Mestres J. (2009). Remittances and temporary migration. CREAM Discussion Papers 9. London, UK: Centre for the Research and Analysis of Migration (CReAM).
ETF (2008). The Contribution of Human Resources Development to Migration Policy in Moldova, Chisinau: European Training Foundation.
EUI (2012). Moldova: Labour migration impact, unpublished report, version: 16.
Expert Grup (2009). Analizele Pieţelor Muncii in Regiunea Mării Negre, Moldova: Raport de Tara ENPI 08-14.
Galor O., Stark, O. (1990). Migrants’ savings, the probability of return migration and migrants’ performance, International Economic Review 31: 463-467.
Galor O., Stark O. (1991). The probability of return migration, migrants’ work effort and migrants’ performance, Journal of Development Economics 35: 399-405.
Galor O., Tsiddon D. (1994). Human Capital Distribution, technological Progress and Economic Growth, Working paper, Brown University.
Grabowska-Lusinska I., Okolski M. (2010). Emigracja ostatnia?, Warsaw: Wydawnictwo Naukowe Scholar.
IMF (2012). IMF Country Report No. 12/38/February. Washington DC: International Monetary Fund.
IOM (2008). How Moldovan Households Manage Their Finances, Knowledge and Practices Survey Report, Chisnau: International Organization for Migration.
Kring T. (2008). Moldovan Migrants in Italy: Remittances and the Role of the Labour Market Partners, International Organization for Migration. online: www.iom.md/attachments/110_2009_09_11_moldovan_migr_italy.pdf (accessed: 12.05.2012).

32
Lucas R. E. Jr. (1988). On the mechanics of economic development, Journal of Monetary Economics 22: 3-42.
Mankiw N., Romer D., Weil D. (1992) A contribution to the empirics of economic growth, Quarterly Journal of Economics 107: 407-437.
Miyagiwa K. (1991). Scale economies in education and the brain drain problem, International Economic Review 32: 743-759.
Moldova 2020 Strategy (2012) National Development Strategy: 7 Solutions for Economic Growth and Poverty Reduction, Government of Republic of Moldova, Chisinau. online: http://www.gov.md/publc/files/Moldova_2020_ENG.pdf (accessed 1.10.2012)
Mountford A. (1997). Can a brain drain be good for growth in the source economy?, Journal of Development Economics 53: 287-303.
NBS (2008). Labour force migration in the Republic of Moldova, Chisinau: National Bureau of Statistics. online: www.statistica.md/public/files/publicatii_electronice/migratia/Migratia_FM_en.pdf (accessed 1.10.2012).
NBS (2011a). Press Release on external trade in 2011, Chisinau: National Bureau of Statistics. online: http://www.statistica.md/newsview.php?l=ro&idc=168&id=3676 (accessed 14.2.2012).
NBS (2011b). Education in Moldova, Chisinau: National Bureau of Statistics. online: http://www.statistica.md/public/files/publicatii_electronice/Educatia/Educatia%20_RM_2011.pdf (accessed 1.10.2012).
NBS (2011c). Labour Market in the Republic of Moldova 2011, Chisinau: National Bureau of Statistics.
Panainte S., Nedelciuc V. (2012). Redobândirea Cetăţeniei Române: o Politică fără Viziune?, Romania: SOROS.
Piracha M., Saraogi A. (2012). The Determinants of Remittances: Evidence from Moldova, Oxford Development Studies 40(4): 467-491
Spoială L., Negruta A., Vasiliev M. (2012) (eds). Educaţia în Republica Moldova 2011/2012, Chisinau: Imprint Plus.
Spoor M., Izman F. (2009). Land reform and interlocking agricultural markets in Moldova, in: Spoor (ed.). The Political Economy of Rural Livelyhoods in Transition Economies. Land, peasants and rural poverty in transition, New York: Routledge, pp. 99-122.
Stark O., Prskawetz A., Helmenstein C. (1997). A brain gain with a brain drain. Reihe Ökonomie/ Economics Series 45, Vienna: Institut für Höhere Studien (IHS).

33
Stratan A., Chistruga M., Clipa V., Fala A., Septelici V. (2012). Development and Side Effects of Remittances in the CIS Countries: The Case of Republic of Moldova, Working paper, Institute of Economy, Finance and Statistics, Chisnau: Academy of Sciences of Moldova.
Venturini A. (2012). Methodological Aspects of Research on Human Capital Flows: A Survey, CARIM-East Research Report 2012/01, Florence: EUI.
World Bank (2011a). Moldova after the global crisis: Promoting Competitiveness, Report No. 55195-MD. online: http://siteresources.worldbank.org/INTMOLDOVA/News%20and%20Events/22937896/Moldova_CEM_2011en.pdf (accessed: 1.10.2012).
World Bank (2011b). Migration and Remittances Factbook 2011, online: http://siteresources.worldbank.org/INTLAC/Resources/Factbook2011-Ebook.pdf (accessed: 1.10.2012).


