Embed Size (px)
Citation preview
Nature © Macmillan Publishers Ltd 1997
letters to nature
NATURE | VOL 389 | 16 OCTOBER 1997 753
recent observation that activation of P2X receptors on neurites ofidentified nociceptors induces firing of action potentials20. In thatstudy20 it was suggested that P2X receptors localized at peripheralsensory nerve terminals provide a mechanism for sensing noci-ceptive stimulation. Thus it is possible that P2X receptors expressedon both the peripheral terminals and central presynaptic terminalsare capable of modulating or generating nociceptive signalling. M. . . . . . . . . . . . . . . . . . . . . . . . . . . . . . . . . . . . . . . . . . . . . . . . . . . . . . . . . . . . . . . . . . . . . . . . . . . . . . . . . . . . . . . . . . . . . . . . . . . . . . . . . . . . . . . . . . . . . . . . .
Methods
Cell cultures. Monocultures of dorsal horn neurons were prepared asdescribed21. For DRG–dorsal horn co-cultures, dorsal horn neurons wereisolated from rat embryos aged 16 days (E16) in utero, exposed to 0.25%trypsin for 20 min and dissociated. Similarly, DRGs were isolated separatelyfrom E16 embryos, exposed to trypsin and dissociated. Dorsal horn and DRGneurons were plated on glass coverslips previously prepared with a monolayerof rat cortical astrocytes. At the time of plating, 2.5S NGF (10 ng ml−1) and 5-fluoro-29-deoxyuridine (10 mM) were added, and 2.5S NGF was added onceevery week when cells were fed with fresh media. For dorsal horn plus DRGexplant cultures, conditions were the same except that the ganglia were isolatedand plated directly on the centre of the glass coverslips. Micro-island cultures22
were prepared as follows. Coverslips were precoated with PDL then dipped in0.5% agarose (type I, low EEP; Sigma) and allowed to dry for 1 h. Once dry, thedishes were sprayed with rat-tail collagen (2 mg ml−1 in a 0.2% acetic acidsolution) using an atomizer. The dishes were sterilized by ultraviolet irradiationfor 2 h, then plated with astrocytes. After 3–7 days, neurons were plated on topof the astrocytes. The plating density was usually 10,000–30,000 dorsal hornneurons per dish, and 30,000–50,000 DRG neurons per dish. Cultures at 2–4weeks were used for experiments. In some experiments, DRG cell bodies wereremoved for co-culture dishes before experiments, and dorsal horn neuronsand remaining DRG fibres stayed healthy for at least 2 h.Electrophysiology recordings. Standard bathing solution contained (inmM): 145 NaCl, 5 KCl, 2 CaCl2, 2 MgCl2, 10 HEPES, 5.5 D-glucose, and5 3 102 4 TTX, pH 7.3 with NaOH, 325 mOsm with sucrose, flow rate of1 ml min−1, and room temperature. Bicuculline (10 mM) and strychnine(5 mM) were also present. Dorsal horn neurons were voltage-clamped21 at−70 mV in perforated whole-cell patch configuration (Axopatch 200) withelectrodes containing internal solution (in mM): 75 Cs2SO4, 10 CsCl, 0.1 CaCl2,10 HEPES and 400 mg ml−1 amphotericin B, pH 7.3 with CsOH and 315–325mOsm with sucrose. For experiments on ATP-evoked glutamate release,200 mM ATP was puffed for 100 ms with puff pipettes of 1.5–2 mm diameterat 3.5–6.5 p.s.i. Recovery periods (4–8 min) were allowed between ATPapplications except when otherwise specified. For experiments testing phar-macology of ATP-evoked currents, cells were rested in normal bathing solutionfor ,8 min to allow recovery from desensitization caused by previous trials.CNQX (100 mM), La3+ (30 mM) and PPADS (50 mM) were preapplied to thebathing solution for 2–4 min. Effects of P2X receptor activation on sponta-neous glutamate release from presynaptic terminals of DRG neurons weredetermined by measuring the effects of 100 mM ATP and 100 mM abm-ATP onmEPSCs recorded from dorsal horn neurons. Cultures were perfused withstandard bathing solution plus 10 mM lidocaine. mEPSCs were recorded fromdorsal horn neurons voltage-clamped at −70 mV in perforated patchconfiguration21. After 5 min recording of control mEPSCs, 100 mM ATP orabm-ATP was bath-applied for 5 min and mEPSCs were continuouslyrecorded. Effects of PPADS were tested following wash of ATP for severalminutes to allow mEPSCs to return to the basal control conditions. After 3–5 min of pre-applying 50 mM PPADS, ATP and 50 mM PPADS were thencoapplied and mEPSCs recorded. In experiments measuring mEPSCs in lowextracellular Ca2+ concentrations, the bathing solution was the same as thestandard bathing solution except that Ca2+ was not added. In experiments withLa3+, 30 mM La3+ was present at all times in bathing solution and ATP wasapplied with 30 mM La3+. Thus, although basal mEPSC frequency was found tobe affected by 30 mM La3+, ATP always increased mEPSC frequency above thatin La3+. mEPSC sampling and data analysis were done as described21. Electro-physiological recordings from DRG neurons were made using conventionalwhole-cell voltage clamps at −70 mV with patch electrodes containing intra-cellular solution of (in mM): 130 Cs-gluconate, 10 CsCl, 11 EGTA, 1 CaCl2, 10HEPES, 20 TEA, 2 ATP-Mg, 305 mOsm, pH 7.2. A paired Wilcoxon test was
used for statistical analysis of the mean mEPSC frequency and amplitude underdifferent experimental conditions.
Received 24 March; accepted 17 July 1997.
1. Burnstock, G. in P2 Purinoceptors: Localization, Function and Transduction Mechanisms (eds Chad-wick, D. J. & Goode, J. A.) 1–34 (Wiley, New York, 1996).
2. North, R. A. in P2 Purinoreceptors: Localization, Function and Transduction Mechanisms (edsChadwick, D. J. & Goode, J. A.) 91–109 (Wiley, New York, 1996).
3. Chen, C.-C. et al. A P2X purinoceptor expressed by a subset of sensory neurons. Nature 377, 428–431(1995).
4. Lewis, C. et al. Coexpresionof P2X2 and P2X3 receptor subunits can account for ATP-gated currentsin sensory neurons. Nature 377, 432–435 (1995).
5. Vulchanova, L. et al. Differential distribution of two ATP-gated ion channels (P2X receptors)determined by immunocytochemistry. Proc. Natl Acad. Sci. USA 93, 8063–8067 (1996).
6. Roy, M. L. & Narashi, T. Differential properties of tetrodotoxin-sensitive and tetrodotoxin-resistantsodium channels in rat dorsal root ganglion neurons. J. Neurosci. 12, 2104–2111 (1992).
7. McLaren, G. J. et al. Investigation of the actions of PPADS, a novel P2X-purinoceptor antatonist, inthe guinea-pig isolated vas deferens. Br. J. Pharmacol. 111, 913–917 (1994).
8. Behham, C. D. & Tsien, R. W. A novel receptor-operated Ca2+-permeable channel activated by ATP insmooth muscle. Nature 328, 275–278 (1987).
9. Nakazawa, K., Fujimori, K., Takanaka, A. & Inoue, K. An ATP-mediated conductance in pheochro-mocytoma cells and its suppression by extracellular calcium. J. Physiol. (Lond.) 428, 257–272 (1990).
10. Rogers, M. & Dani, J. Comparison of quantitative calcium flux through NMDA, ATP, and AChreceptor channels. Biophys. J. 68, 501–506 (1995).
11. Bean, P. B. & Williams, C. A. & Ceelen, P. W. ATP-activated channels in rat and bullfrog sensoryneurons: current-voltage relation and single-channel behavior. J. Neurosci. 10, 11–19 (1990).
12. Reichling, D. B. & MacDermott, A. B. Lanthanum actions on excitatory amino acid-gated currentsand voltage-gated calcium currents in rat dorsal horn neurons. J. Physiol. (Lond.) 441, 199–218(1991).
13. Bardoni, R., Goldstein, P., Lee, J., Gu, J. G. & MacDermott, A. B. ATP P2X receptors mediate fastsynaptic transmission in the dorsal horn of spinal cord. J. Neurosci. 17, 5297–5304 (1997).
14. Krishtal, O. A., Marchenko, S. M. & Pidoplichko, V. I. Receptor for ATP in the membrane ofmammalian sensory neurons. Neurosci. Lett. 35, 41–45 (1983).
15. McGehee, D. S., Heath, M. J. S., Gelber, S., Devay, P. & Role, L. W. Nicotine enhancement of fastexcitatory synaptic transmission in CNS by presynaptic receptors. Science 269, 1692–1696 (1995).
16. Li, J. & Perl, E. R. ATP modulation of synaptic transmission in the spinal substantia gelatinosa. J.Neurosci. 15, 3357–3365 (1995).
17. White, T. D., Downie, J. W. & Leslie, R. A. Characteristics of K+- and veratridine-induced release ofATP from synaptosomes prepared from dorsal and ventral spinal cord. Brain Res. 334, 372–374 (1985).
18. Gray, R., Rajan, A. S., Radcliffe, K. A., Yakehiro, M. & Dani, J. A. Hippocampal synaptic transmissionenhanced by low concentrations of nicotine. Nature 383, 713–716 (1996).
19. Liu, H., Mantyh, P. W. & Basbaum, A. I. NMDA-receptor regulation of substance P release fromprimary afferent nociceptors. Nature 386, 721–724 (1997).
20. Cook, S. P., Vulchanova, L., Hargreaves, K. M., Elde, R. & McCleskey, E. W. Distinct ATP receptors onpain-sensing and stretch-sensing neurons. Nature 387, 505–508 (1997).
21. Gu, J. G., Albuquerque, C., Lee, C. J. & MacDermott, A. B. Synaptic strengthening through activationof Ca2+-permeable AMPA receptors. Nature 381, 793–796 (1996).
22. Segal M. M. & Furshpan, E. J. Epileptiform activity in microcultures containing small numbers ofhippocampal neurons. J. Neurophysiol. 64, 1390–1399 (1990).
Acknowledgements. We thank S. Siegelbaum, L. W. Role and J. Koester for comments on an early versionof the manuscript; C. Albuquerque and A. Shang for help in developing the micro-island co-cultures; andS. Rayport for advice. This work was supported by the MRC Fellowship of Canada (J.G.G.) and the NIHand Whitehall Foundation (A.B.M.).
Correspondence and requests for materials should be addressed to J.G.G. (e-mail: [email protected]).
Molecular basisof agonismandantagonism in theoestrogen receptorAndrzej M. Brzozowski*k, Ashley C. W. Pike*k,Zbigniew Dauter*, Roderick E. Hubbard*, Tomas Bonn†,Owe Engstrom†, Lars Ohman†, Geoffrey L. Greene‡,Jan-Ake Gustafsson§ & Mats Carlquist†
* Protein Structure Group, Chemistry Department, University of York,York YO1 5DD, UK† Karo Bio AB, NOVUM, S-141 57 Huddinge, Sweden‡ The Ben May Institute for Cancer Research, The University of Chicago,5841 S. Maryland Ave, Chicago, Illinois 60637, USA§ Karolinska Institute, S-141 86 Huddinge, SwedenkThese authors contributed equally to this work.. . . . . . . . . . . . . . . . . . . . . . . . . . . . . . . . . . . . . . . . . . . . . . . . . . . . . . . . . . . . . . . . . . . . . . . . . . . . . . . . . . . . . . . . . . . . . . . . . . . . . . . . . . . . . . . . . . . . . . . . .
Oestrogens are involved in the growth, development and homeo-stasis of a number of tissues1. The physiological effects of thesesteroids are mediated by a ligand-inducible nuclear transcriptionfactor, the oestrogen receptor (ER)2. Hormone binding to theligand-binding domain (LBD) of the ER initiates a series ofmolecular events culminating in the activation or repression of

Nature © Macmillan Publishers Ltd 1997
letters to nature
754 NATURE | VOL 389 | 16 OCTOBER 1997
target genes. Transcriptional regulation arises from the directinteraction of the ER with components of the cellular transcrip-tion machinery3,4. Here we report the crystal structures of the LBDof ER in complex with the endogenous oestrogen, 17b-oestradiol,and the selective antagonist raloxifene5, at resolutions of 3.1 and2.6 A, respectively. The structures provide a molecular basis forthe distinctive pharmacophore of the ER and its catholic bindingproperties. Agonist and antagonist bind at the same site withinthe core of the LBD but demonstrate different binding modes. Inaddition, each class of ligand induces a distinct conformation inthe transactivation domain of the LBD, providing structuralevidence of the mechanism of antagonism.
The structure of the complex between ER’s LBD and the antago-nist raloxifene (RAL) was determined by conventional multipleisomorphous replacement in combination with multicrystal aver-aging, and was subsequently used as a phasing model in molecularreplacement to solve the structure of the complex of the LBD
with 17b-oestradiol (E2) (see Methods and Table 1). The overallarchitecture of the ER LBD (helices H3–H12) is similar to that seenin the crystal structures of other nuclear receptor LBDs6–8, andemphasizes the universal nature of this fold within this receptorsuperfamily9. The LBD is folded into a three-layered antiparallela-helical sandwich comprising a central core layer of three helices(H5/6, H9 and H10) sandwiched between two additional layers ofhelices (H1–4 and H7, H8, H11). This helical arrangement creates a‘wedge-shaped’ molecular scaffold that maintains a sizeable ligand-binding cavity at the narrower end of the domain. The remainingsecondary structural elements, a small two-stranded antiparallelb-sheet (S1 and S2) and H12, are located at this ligand-bindingportion of the molecule, and flank the main three-layered motif(Fig. 1a).
The ER LBDs are arranged as non-crystallographic dimers withinboth the E2 and RAL complex crystals in a manner consistent withboth the oligomeric state of liganded ER in solution10 and previous
Table 1 Data collection, phase determination and refinement statistics
ER RAL derivatives
ER RAL ER E2 PCMBS-1 PCMBS-2 KAu(CN)2(4mM, 5 day) (4mM,14 day) (4mM, 2 day)
...................................................................................................................................................................................................................................................................................................................................................................
Resolution (A) 25–2.6 20–3.1 20–3 20–3 20–3.6Unique reflections 15,433 33,981 10,335 9,316 5,835Completeness (%) 95.7 99.1 97.6 89.0 94.2Multiplicity 4.5 2.5 4 3.1 2.5Rsym (I )* 8.0 10.0 8.1 9.2 7.0Riso† 16.9 20.7 13.7Phasing power (centric/acentric)‡ 1.22/1.88 1.23/2.02 0.71/0.94RCullis (centric/acentric)§ 0.75/0.68 0.76/0.66 0.90/0.85...................................................................................................................................................................................................................................................................................................................................................................RefinementReflections used (Rfree set) 13,868 (1,565) 30,583 (3,398)Rcryst (Rfree)k 21.9 (29.9) 21.8 (25.1)Protein (solvent) atoms 3,633 (100) 11,382 (114)% A,B,L (a,b,l,p)¶ 94.2 (5.8) 94.2 (5.8)R.m.s.d. bond lengths/angles (A)# 0.016/0.035 0.011/0.039R.m.s.d. n.c.s. protein (A)✩ 0.66 0.07R.m.s.d. n.c.s. B (A2)** 7.9 1.15...................................................................................................................................................................................................................................................................................................................................................................*RsymðI Þ ¼ 100 3 ShSi jIh;i 2 〈Ih〉jShSiIh;i , where I is the observed intensity. 〈I 〉 is the average intensity of multiple observations of symmetry-related reflections.†Riso ¼ SjjFPHj 2 jFPjj=SjFPj, where jFPj is the protein structure factor amplitude and jFPHj is the heavy-atom derivative structure factor amplitude.‡Phasing power for centric and acentric reflections ¼ r:m:s: ðjFHj=EÞ, where FH is the heavy atom structure factor amplitude and E is the residual lack of closure error.§Rcullis ¼ SjEj=SjjFPHj 2 jFPjj for centric and acentric reflections. Figure of merit was 0.48 for acentric reflections and 0.67 for centric reflections (20–3 A).kRcryst ¼ 100 3 SjjF0j 2 jFcjj=SjF0j; Rfree is the same as Rcryst but was calculated using a separate validation set of reflections that was excluded from the refinement process.¶Percentage of residues located in most favoured (additional) regions of the Ramachandran plot as determined by PROCHECK29.#R.m.s. deviation in bond length and angle distances from Engh and Huber ideal values.✩Root mean squared distance between all non-crystallographic symmetry (n.c.s.) related protein atom positions.**R.m.s. difference between all n.c.s.-related atomic temperature factors.
Figure 1 Ribbon representations of the ER-a LBD. a, The ER-a LBD indicating the
locations of the secondary structural elements. a and 310 helices (H) are coloured
red, extended regions (S) are yellow, and coil regions are blue. All secondary
structural elements have been numbered in keeping with the nomenclature that
has been established for other nuclear receptor LBDs. The monomer is displayed
looking onto the dimerization face. The dotted line indicates the unmodelled
region between H9 and H10. b, ER-a LBD homodimer viewed perpendicular to the
dimer axis. c, ER-a LBD homodimer viewed down the dimer axis. The component
monomers are drawn in red and green. The N and C termini and the helices that
are involved in the dimer interface are labelled. E2 is coloured blue and depicted in
space-filling form.

Nature © Macmillan Publishers Ltd 1997
letters to nature
NATURE | VOL 389 | 16 OCTOBER 1997 755
mutagenesis studies11. All crystal forms of the liganded ER LBDobtained so far contain identical non-crystallographic dimers (datanot shown). The overall homodimeric arrangement is the same inboth the E2 and RAL complexes, and is reminiscent of the crystal-lographic apo-retinoid-X receptor homodimer8. The dimer axisroughly coincides with the longest dimension of the LBD witheach molecule tilted approximately 108 away from the two-foldaxis. This symmetric ‘head-to-head’ arrangement locates thechain termini of each monomer on opposite sides of the dimerwith the carboxy termini projecting towards the two-fold axis(Fig. 1b). The H8/H11 face of the monomers line up to form anextensive dimerization interface that encompasses about 15%(1,703 A2) of each monomer’s surface area. Contacts between thetwo molecules are made primarily through the H11 helices, whichintertwine to form a rigid backbone, but also involve H8 from onemonomer and parts of H9 and H10 from the neighbouring mono-mer (Fig. 1c).
The E2 binding cavity is completely partitioned from theexternal environment and occupies a relatively large portion ofthe ER LBD’s hydrophobic core (Fig. 1a). It is located at one end ofthe molecule and is formed by parts of H3 (Met 342 to Leu 354),H6 (Trp 383 to Arg 394), H8 and the preceding loop (Val 418 toLeu 428), H11 (Met 517 to Met 528), H12 (Leu 539 to His 547) andthe S1/S2 hairpin (Leu 402 to Leu 410). Hormone recognition isachieved through a combination of specific hydrogen bonds andthe complementarity of the binding cavity to E2’s non-polarcharacter (Fig. 2a,c). E2 binds diagonally across the cavity betweenH11, H3 and H6 and adopts a low-energy conformation. Thephenolic hydroxyl of the A-ring (O3; see Fig. 2c for atom number-ing) nestles between H3 and H6 and makes direct hydrogenbonds to the carboxylate of Glu 353, the guanidinium group ofArg 394, and a water molecule. The 17-b hydroxyl (O17) of the D-ring makes a single hydrogen bond with His 524 in H11. Theremainder of the molecule participates in a number of hydrophobic
Figure 2 Agonist and antagonist binding modes. a, The 3.1-A resolution, six-fold
averaged electron-density map (using model phases) for the ER LBD–E2
complex. b, The experimental, 2.6-A resolution electron-density map for the ER
LBD–RAL complex after DMMULTI multicrystal averaging. In both cases, the map
is contoured at 1j and overlaid on the final refined models. c, d, Schematic
representation of the interactions made by E2 (c) and RAL (d) within the binding
cavity. Residues that interact with ligand and/or line the cavity are shown in
their approximate positions. Those that make direct hydrogen bonds are
depicted in ball-and-stick style with broken lines between the interacting
atoms. The hydrogen-bond distances shown are averaged between the six (E2)
or two (RAL) monomers. The atom names and ring nomenclature of E2 are also
given.
Nature © Macmillan Publishers Ltd 1997
letters to nature
756 NATURE | VOL 389 | 16 OCTOBER 1997
contacts that are concentrated over the A, A/B interface and D-rings.The A-ring, as well as the planar A/B-ring interface, is sandwichedbetween the side chains of Ala 350 and Leu 387 on its b face andPhe 404 on its a face. At the other end of the binding cavity, the D-ring makes non-polar contacts with Ile 424, Gly 521 and Leu 525.Although the cavity itself appears to be devoid of ordered watermolecules, an extensive solvent channel runs from the A-ringhydroxyl’s water ligand to the exterior of the LBD between H3and H5/6. The combination of the specific polar and non-polarinteractions account for the ability of ER to selectively recognize andbind E2 with subnanomolar affinity over the large and varied rangeof endogenous steroids.
Extensive binding studies of E2 analogues have provided adetailed description of the pharmacophore of ER12. The ER isunique among the steroid receptors in its ability to embrace awide variety of non-steroidal compounds. Although the ‘pincer-like’ arrangement around the A-ring imposes an absolute require-ment on effective ligands to contain an aromatic ring, theremainder of the binding pocket can accept a number of differenthydrophobic groups12,13. This overall promiscuity can be attributedto the size of the cavity, which has a probe accessible volume(450 A3) nearly twice that of E2’s molecular volume (245 A3). Thelength and breadth of the E2 skeleton is well matched by thereceptor, but there are large unoccupied cavities opposite the aface of the B-ring and the b face of the C-ring (Fig. 2a). Thepositions of these preformed cavities are similar to those predictedfrom binding studies12.
This structure is the first example of an LBD from the steroid classof nuclear receptors, and provides an instructive model formembers of this family. A similar overall hormone-binding modeis anticipated with the A-ring probably bound between H3 and H6by an arginine (homologue of Arg 394) and a glutamine (homo-logue of Glu 353). This exclusive replacement of the Glu 353 of ERby a glutamine fulfils the hydrogen-bonding requirements of the 3-keto steroids. The model proposed for the ligand binding mode ofdexamethasone in the human glucocorticoid receptor9, in which theD-ring binds between H3 and H6, should therefore be re-examinedin the light of our observations.
RAL is a clinically relevant selective antagonist that specificallycounters the mitogenic effects of E2 in the reproductive tissues,while maintaining beneficial oestrogenic effects in other tissues5,14.
RAL binds at the same site as E2 within the LBD (Fig. 2b,d), with thehydroxyl group of the benzothiophene moiety (O3; see Fig. 2d foratom numbering) mimicking the A-ring phenolic hydroxyl of E2 bybinding in the polar pocket between H3 and H6. In contrast, thebinding mode of RAL at the ‘D-ring end’ of the cavity, between H8and H11, is markedly different from that of E2. Although thephenolic hydroxyl (O11) hydrogen bonds with His 524, it isdisplaced 5.1 A from the position occupied by the 17b-OH in theE2 complex. Consequently, the imidazole ring of His 524 rotates inthe RAL complex to compensate for the change in oxygen positionand to maintain a favourable hydrogen-bonding position. Theremainder of the core is involved in non-polar contacts similar tothose seen for E2. The side chain of RAL makes extensive hydro-phobic contacts with H3 and H5/6, H11 and the loop between H11and H12. It is anchored to the protein by a direct hydrogen bondbetween Asp 351 and the piperazine ring nitrogen (N26). However,at over 11 A in length, the side chain is too long to be containedwithin the confines of the binding cavity, and instead it displacesH12 and protrudes from the pocket between H3 and H11. This helixdisplacement is anticipated to be a general feature of both steroidaland non-steroidal anti-oestrogens that possess a bulky side-chainsubstitutent. The importance of the narrow cleft at the A-ring end ofthe cavity in determining the overall ligand-binding mode is high-lighted by the observation that RAL’s benzothiophene moietyoccupies the same spatial position as the A and B rings of E2. Thealternate D-ring binding mode of RAL presumably arises as a resultof both the inflexibility of the arylbenzothiophene core and thelimited scope for positioning the side chain. The orientation of E2
and RAL should allow the accurate positioning of most of ER’sligands, but further structural studies will be required to understandboth the cavity’s plasticity and the reported range of differentbinding modes15.
The LBD’s transcriptional activation function (AF-2) can interactwith a number of putative transcriptional coactivators in a ligand-dependent manner4,16–18. Helix 12 is essential for such transactiva-tion as both loss or mutation in this region results in a receptor thatis unresponsive to ligand19. Mutational analyses in both ER andother nuclear receptors20,21 have identified several additional resi-dues that influence the function of AF-2, suggesting that the LBD’scoactivator recruitment surface, although centred on H12, probablyalso encompasses parts of the surrounding helices H3, H5/6 andH11.
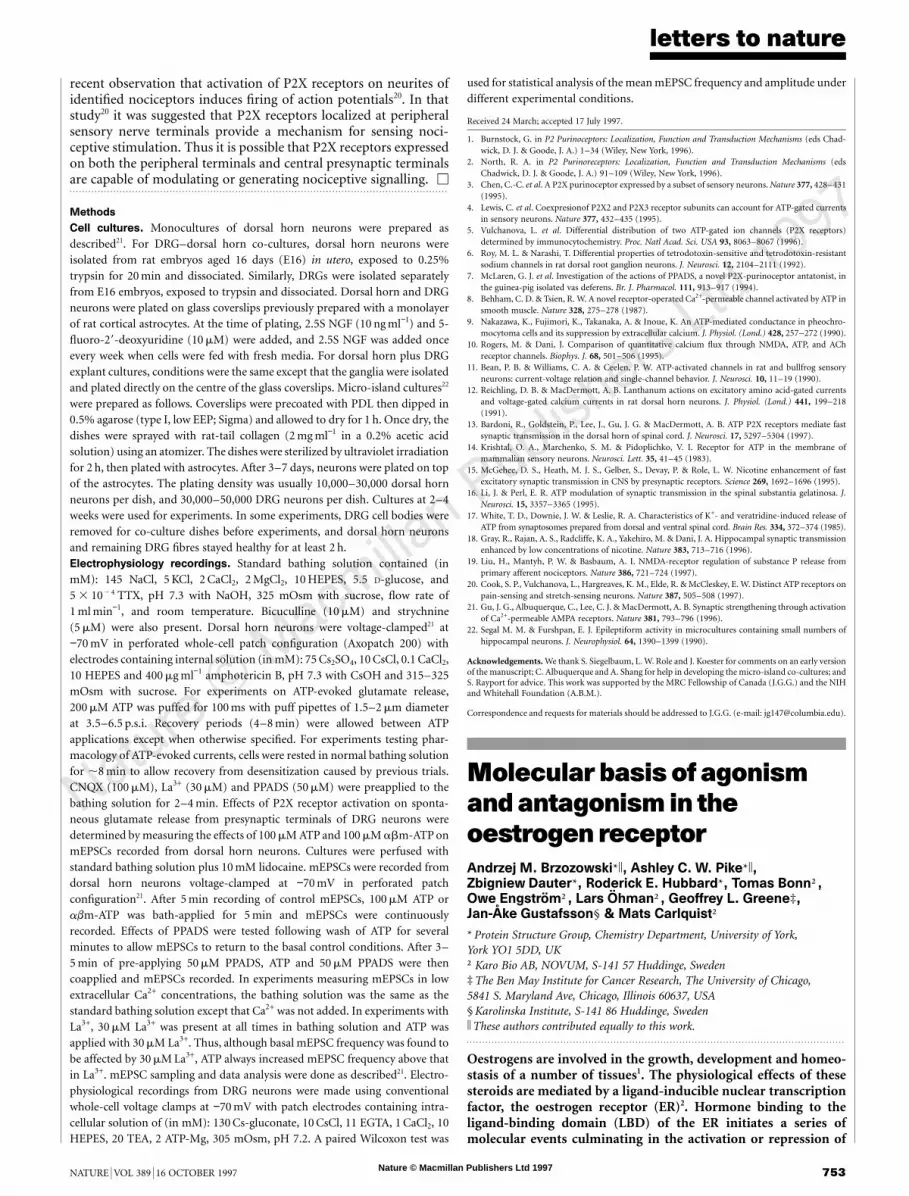
In the E2-liganded complex, H12 sits snugly over the ligand-binding cavity and is packed against H3, H5/6 and H11. Although itmakes no direct contact with E2, it forms the ‘lid’ of the bindingcavity and projects its inner hydrophobic surface towards thebound hormone. Its charged surface, comprising Asp 538, Asp545 and the highly conserved Glu 542, is directed away from thebody of the LBD on the side of the molecule lying perpendicularto the dimerization interface (Fig. 3a). This precise positioning ofH12, which is observed in all known structures of the ligandedforms of the LBD6,7, seems to be a prerequisite for transcriptionalactivation as, by sealing the ligand-binding cavity, it generates acompetent AF-2 that is capable of interacting with coactivators. Incontrast, the alignment of H12 over the cavity is prevented by RAL,and instead the helix lies in a groove formed by H5 and the carboxy-terminal end of H3. This antagonist-induced repositioning of H12involves a rotation of 1308 combined with a 10-A rigid-body shifttowards the amino terminus of the LBD compared with the agonist-induced conformation (Fig. 3b). The complementarity of thishydrophobic groove to the inner surface of H12 suggests that itspositioning in the RAL complex represents a real conformationrather than an artefact produced by the crystal lattice. A highlyconserved lysine residue (Lys 362), which is required for efficientE2-dependent recruitment of certain coactivators21, is located at oneend of this hydrophobic groove, and is partly buried by the reorientedhelix. Taken together, these observations provide compelling evidence
Figure 3 Positioning of helix H12. Position is shown in a, the ER LBD–E2 complex;
andb, the ERLBD–RAL complex. H12 is drawn asa cylinder and colouredblue (E2
complex) or green (RAL complex). The remainder of the ER LBD is shown in red.
Dotted lines indicate unmodelled regionsof the structures. Hydrophobic residues
located in the groove between H3 and H5 (yellow) and Lys 362 (K362, pink) are
depicted in space-filling form. The locations of Asp 538, Glu 542 and Asp 545 are
highlighted (brown spheres) along with the helices that interact with H12 in the
two complexes.

Nature © Macmillan Publishers Ltd 1997
letters to nature
NATURE | VOL 389 | 16 OCTOBER 1997 757
that the antagonistic properties of RAL are based on its ability toprevent the formation of a transcriptionally competent AF-2 con-formation. The movement of H12 clearly disrupts the overall surfacetopography of AF-2, but it is feasible that the tissue selectivity ofRAL may reside in its ability to occlude particular coactivatorrecruitment sites on the surface of the ER LBD.
Selective antagonism of the kind exhibited by RAL is a compli-cated phenomenon that arises through the interplay of a number offactors, such as differential ligand effects on the transactivationfunctionalities of the ER, the type of coactivator recruited, and thecell and promoter context3,4,22,23. Nevertheless, our data on thesestructures give valuable insights into the binding of ligands to thisreceptor, and provide the basis for the structure-based design ofimproved agonists and antagonists for the treatment of oestrogen-related diseases. M. . . . . . . . . . . . . . . . . . . . . . . . . . . . . . . . . . . . . . . . . . . . . . . . . . . . . . . . . . . . . . . . . . . . . . . . . . . . . . . . . . . . . . . . . . . . . . . . . . . . . . . . . . . . . . . . . . . . . . . . .
Methods
Protein purification and crystallization. The LBD of human ER-a (residuesSer 301 to Thr 553) was expressed, purified and carboxymethylated asdescribed24. ER LBD–E2 and LBD–RAL complexes were prepared by including75 mM of the respective ligand in the column elution buffer. The ER LBD isparticularly refractive to crystallization, and carboxymethylation of the freethiol groups was essential for growing crystals suitable for diffraction studies.Examination of the electron-density maps shows that Cys 381 is uniformlymodified and the remaining three cysteines are either unmodified (Cys 447) orin flexible regions of the structure. The ER LBD–RAL and LBD–E2 complexeswere crystallized using the hanging-drop technique at 18 8C. For the RALcomplex, the reservoir solution contained 12% (w/v) PEG 4000, 0.2 Mmagnesium chloride, 50 mM L-lysine, 0.1 M sucrose and 5% 1,4-dioxane in0.1 M Tris-HCl, pH 8.5. Hanging drops were composed of equal volumes ofprotein (7.2 mg ml−1) and reservoir solutions. Monoclinic crystals, belonging tothe space group C2 with unit cell dimensions a ¼ 104:53 A, b ¼ 53:68 A,c ¼ 102:71 A, b ¼ 116:798 and containing one ER LBD dimer per asymmetricunit, appeared within 2–4 weeks. Two other crystal forms were grown by subtlemanipulation of the crystallization conditions (C2, a ¼ 89:91 A, b ¼ 75:09 A,c ¼ 87:50 A, b ¼ 103:018; C2221, a ¼ 65:47 A, b ¼ 95:99 A, c ¼ 168:14 A). Forthe E2 complex, drops containing equal volumes of protein (7–13 mg ml−1) andreservoir solution were equilibrated against 0.1 M Tris-HCl, pH 8.1, 2.4 Mammonium formate and 8% dimethylsulphoxide. The E2 complex crystalsbelong to the space group P21, with unit cell dimensions a ¼ 61:48 A,b ¼ 115:16 A, c ¼ 137:38 A, b ¼ 98:88, and contain three ER LBD dimersper asymmetric unit.Data collection, phasing and refinement. For the ER LBD–RAL complex,native diffraction data were collected from a single frozen crystal (120 K) onbeamline X11 at EMBL (DESY, Hamburg). Heavy-atom derivatives werecollected in-house from flash-frozen crystals. Data were integrated and reducedusing the programs DENZO and SCALEPACK25. MIR analysis was performedusing the CCP4 suite of programs26. Diffraction data for the alternate C2 (York)and C2221 (DESY, Hamburg) crystal forms were collected to resolutions of 3.0and 3.1 A, respectively. Initial phases were calculated to 3 A using MLPHARE26
and subsequent two-fold averaging, non-crystallographic matrix refinementand phase extension were carried out using DM26. An initial polyalanine tracewas used to generate a dimeric search model which was correctly positioned inthe alternate C2 and C2221 crystal forms using molecular replacement(AMoRe26). Twenty cycles of cross-averaging between all three crystal formswere carried out with DMMULTI26, using only the MIR phase information. Theresultant electron-density map showed no bias towards the input model andenabled the unambiguous tracing of the remainder of the molecule and theassignment of most of the amino-acid sequence. Refinement was performedwith REFMAC27 using bulk solvent corrections and anisotropic scaling. All databetween 25 and 2.6 A were included with no sigma cut-offs. Tight non-crystallographic restraints were maintained during the initial cycles but wereloosened in the final stages of refinement. Phases from multicrystal averagingwere included at all stages and individual atomic temperature factors wererefined isotropically. The final model comprises residues 307–459, 470–528and 535–547. The missing regions correspond to flexible loops between helicesH9 and H10 (460–469) and H11 and H12 (529–534) and the chain termini.
Residues Tyr 331(A), Asp 332(A), His 377(B), Glu 397(AB), Lys 416(AB), Glu419(AB), Glu 423(B), Leu 469(B), Glu 470(AB), Glu 471(AB), Lys 472(AB),Arg 477(AB), Lys 492(A), Glu 542(A), Arg 548(B) and Leu 549(B) were poorlyresolved in the electron-density maps and not fully modelled.
For the ER LBD–E2 complex, diffraction data were collected at roomtemperature from a single ER LBD–E2 crystal on beamline X11 at EMBL(DESY, Hamburg). Initial phase estimates were obtained with AMoRe using therefined ER LBD–RAL dimer as a search model. The correct solution,corresponding to three ER LBD dimers, had a correlation coefficient of 69.8and an R-factor of 40.6 after AMoRe rigid-body refinement. Six-fold averagingwas performed using DM and the structure was refined with REFMAC usingtight non-crystallographic restraints, averaged phases from DM, bulk solventcorrections and anisotropic scaling. All data between 20 and 3.1 A wereincluded with no sigma cut-offs. A single, overall B-value was applied in theearly stages of refinement until the Rfree converged. Subsequent cycles usedtightly constrained, full isotropic B-value refinement. The final model for eachmonomer comprises residues 305–548 but includes two unmodelled loopsbetween residues 331–336 and 462–464. The first four (301–304) and last five(549–553) residues are disordered. The side chains of Leu 306, Leu 466, Leu469, Lys 492, Lys 531 and Leu 536 were poorly resolved in the electron-densitymaps and not modelled beyond their Cb atoms. All model building was carriedout using the graphics package QUANTA (Molecular Simulations Inc., SanDiego).Illustrations. Figures 1, 2a,b, 3 were prepared with QUANTA (MolecularSimulations Inc., San Diego); Fig. 2c, d was prepared with LIGPLOT28.
Received 9 June; accepted 8 September 1997.
1. Ciocca, D. R. & Roig, L. M. V. Estrogen-receptors in human nontarget tissues—Biological and clinicalimplications. Endocr. Rev. 16, 35–62 (1995).
2. Tsai, M.-J. & O’Malley, B. W. Molecular mechanisms of action of steroid/thyroid receptor superfamilymembers. Annu. Rev. Biochem. 63, 451–486 (1994).
3. Katzenellenbogen, J. A., O’Malley, B. W. & Katzenellenbogen, B. S. Tripartite steroid hormonereceptor pharmacology: Interaction with multiple effector sites as a basis for the cell- and promoter-specific action of these hormones. Mol. Endocrinol. 10, 119–131 (1996).
4. Beato, M. & Sanchez-Pacheco, A. Interaction of steroid hormone receptors with the transcriptioninitiation complex. Endocr. Rev. 17, 587–609 (1996).
5. Grese, T. A. et al. Structure-activity relationships of selective estrogen receptor modulators:Modifications to the 2-arylbenzothiophene core of raloxifene. J. Med. Chem. 40, 146–167 (1997).
6. Wagner, R. L. et al. A structural role for hormone in the thyroid hormone receptor. Nature 378, 690–697 (1995).
7. Renaud, J.-P. et al. Crystal structure of the RAR-g ligand-binding domain bound to all-trans retinoicacid. Nature 378, 681–689 (1995).
8. Bourguet, W., Ruff, M., Chambon, P., Gronemeyer, H. & Moras, D. Crystal structure of the ligand-binding domain of the human nuclear receptor RXR-a. Nature 375, 377–382 (1995).
9. Wurtz, J.-M. et al. A canonical structure for the ligand-binding domain of nuclear receptors. NatureStruct. Biol. 3, 87–94 (1996).
10. Kumar, V. & Chambon, P. The estrogen receptor binds tightly to its responsive element as a ligand-induced homodimer. Cell 55, 145–156 (1988).
11. Fawell, S. E., Lees, J. A., White, R. & Parker, M. G. Characterisation and colocalization of steroidbinding and dimerization activities in the mouse estrogen receptor. Cell 60, 953–962 (1990).
12. Anstead, G. M., Carlson, K. E. & Katzenellenbogen, J. A. The estradiol pharmacophore: Ligandstructure–estrogen receptor binding affinity relationships and a model for the receptor binding site.Steroids 62, 268–303 (1997).
13. Katzellenbogen, B. S. et al. Antiestrogens: Mechanisms and actions in target cells. J. Steroid Biochem.Mol. Biol. 53, 387–393 (1995).
14. Draper, M. W. et al. A controlled trial of raloxifene (LY139481) HCl: Impact on bone turnover andserum lipid profile in healthy postmenopausal women. J. Bone Miner. Res. 11, 835–842 (1996).
15. Ekena, K., Weis, K. E., Katzenellenbogen, J. A. & Katzenellenbogen, B. S. Different residues of thehuman estrogen receptor are involved in the recognition of structurally diverse estrogens andantiestrogens. J. Biol. Chem. 272, 5069–5075 (1997).
16. Cavailles, V., Dauvois, S., Danielian, P. S. & Parker, M. G. Interaction of proteins with transcriptionallyactive estrogen receptors. Proc. Natl Acad. Sci. USA 91, 10009–10013 (1994).
17. L’Horset, F., Dauvois, S., Heery, D. M., Cavailles, V. & Parker, M. G. RIP-140 interacts with multiplenuclear receptors by means of two distinct sites. Mol. Cell. Biol. 16, 6029–6036 (1996).
18. vom Baur, E. et al. Differential ligand-dependent interactions between the AF-2 activating domain ofnuclear receptors and the putative transcriptional intermediary factors mSUG1 and TIF1. EMBO J.15, 110–124 (1996).
19. Danielian, P. S., White, R., Lees, J. A. & Parker, M. G. Identification of a conserved region required forhormone dependent transcriptional activation by steroid hormone receptors. EMBO J. 11, 1025–1033(1992).
20. Pakdel, F., Reese, J. C. & Katzenellenbogen, B. S. Identification of charged residues in an N-terminalportion of the hormone-binding domain of the human estrogen receptor important in transcriptionalactivity of the receptor. Mol. Endocrinol. 7, 1408–1417 (1993).
21. Henttu, P. M. A., Kalkhoven, E. & Parker, M. G. AF-2 activity and recruitment of steroid receptorcoactivator 1 to the estrogen receptor depend on a lysine residue conserved in nuclear receptors. Mol.Cell. Biol. 17, 1832–1839 (1997).
22. McInerney, E. M. & Katzenellenbogen, B. S. Different regions in activation function-1 of the humanestrogen receptor required for antiestrogen- and estradiol-dependent transcriptional activation.J. Biol. Chem. 271, 24172–24178 (1996).
23. McInerney, E. M., Tsai, M.-J., O’Malley, B. W. & Katzenellenbogen, B. S. Analysis of estrogen receptortranscriptional enhancement by a nuclear hormone receptor coactivator. Proc. Natl Acad. Sci. USA 93,10069–10073 (1996).
24. Hegy, G. B. et al. Carboxymethylation of the human estrogen receptor ligand-binding domain-

Nature © Macmillan Publishers Ltd 1997
letters to nature
758 NATURE | VOL 389 | 16 OCTOBER 1997
estradiol complex: HPLC/ESMS peptide mapping shows that cysteine 447 does not react withiodoacetic acid. Steroids 61, 367–373 (1996).
25. Otwinowski, Z. & Minor, W. Processing X-ray diffraction data collected in oscillation mode. MethodsEnzymol. 276, 307–326 (1997).
26. Collaborative Computational Project No. 4. The CCP4 suite: programs for protein crystallography.Acta Crystallogr. D 50, 760–763 (1994).
27. Murshudov, G. N., Vagin, A. A. & Dodson, E. J. Refinement of macromolecular structures by themaximum-likelihood method. Acta Crystallogr. D 53, 240–255 (1997).
28. Wallace, A. C., Laskowski, R. A. & Thornton, J. M. LIGPLOT—A program to generate schematicdiagrams of protein ligand interactions. Prot. Eng. 8, 127–134 (1995).
29. Laskowski, R. A., MacArthur, M. W., Moss, D. S. & Thornton, J. M. PROCHECK: a programme tocheck the stereochemical quality of protein structure coordinates. J. Appl. Crystallogr. A 42, 140–149(1993).
Acknowledgements. We thank G. Murshudov for discussions on refinement strategy and J. Baxter,R. Fletterick, S. Nilsson and K. Koehler for comments on the manuscript. The Protein Structure Group atYork is supported by the BBSRC. We thank the European Union for support of the work at EMBL DESY/Hamburg through the HCMP access to large installations project.
Correspondence and requests for materials should be addressed to R.E.H. (e-mail: [email protected]). Coordinates have been deposited at the Brookhaven Protein Data Bank, accession codes 1ERE forthe oestradiol-liganded structure and 1ERR for the raloxifene-liganded structure.
Structureat1.65AofRhoAand itsGTPase-activatingprotein incomplexwitha transition-state analogueKatrin Rittinger*, Philip A. Walker*, John F. Eccleston,Stephen J. Smerdon & Steven J. Gamblin
National Institute for Medical Research, The Ridgeway, Mill Hill,London NW7 1AA, UK* These authors contributed equally to this work.. . . . . . . . . . . . . . . . . . . . . . . . . . . . . . . . . . . . . . . . . . . . . . . . . . . . . . . . . . . . . . . . . . . . . . . . . . . . . . . . . . . . . . . . . . . . . . . . . . . . . . . . . . . . . . . . . . . . . . . . .
Small G proteins of the Rho family, which includes Rho, Rac andCdc42Hs, regulate phosphorylation pathways that control a rangeof biological functions including cytoskeleton formation and cellproliferation1–7. They operate as molecular switches, cyclingbetween the biologically active GTP-bound form and the inactiveGDP-bound state. Their rate of hydrolysis of GTP to GDP byvirtue of their intrinsic GTPase activity is slow, but can beaccelerated by up to 105-fold through interaction with rhoGAP,a GTPase-activating protein that stimulates Rho-familyproteins8,9. As such, rhoGAP plays a crucial role in regulatingRho-mediated signalling pathways. Here we report the crystalstructure of RhoA and rhoGAP complexed with the transition-state analogue GDP.AlF−
4 at 1.65 A resolution. There is a rotationof 20 degrees between the Rho and rhoGAP proteins in thiscomplex when compared with the ground-state complexCdc42Hs.GMPPNP/rhoGAP, in which Cdc42Hs is bound to thenon-hydrolysable GTP analogue GMPPNP10. Consequently, in thetransition state complex but not in the ground state, the rhoGAPdomain contributes a residue, Arg 85GAP, directly into the activesite of the G protein. We propose that this residue acts to stabilizethe transition state of the GTPase reaction. RhoGAP also appearsto function by stabilizing several regions of RhoA that areimportant in signalling the hydrolysis of GTP.
It has been proposed that GAPs stimulate the intrinsic GTPaseactivity of the Ras superfamily of proteins either by contributingresidues that participate directly in catalysis or by performing anallosteric function (reviewed in ref. 11). We have investigated thisquestion by first determining the structure of p50rhoGAP alone12
and then as a complex with Cdc42Hs.GMPPNP10. From the formerstructure, we were able to identify residues that could be involved inG-protein binding and GTPase activation. Comparison of thisrhoGAP structure with that of p120rasGAP reveals that, althoughboth molecules are predominantly a-helical, there is no tertiarystructural similarity, which is consistent with the lack of anydetectable sequence homology between them10,13. From the
Cdc42Hs.GMPPNP/rhoGAP crystal structure, we were able toshow how these two proteins interact in the presence ofGMPPNP10. Although no interaction between the invariantArg 85GAP and the phosphate moiety of the nucleotide was evidentin that complex, we concluded that such an interaction could occurduring GTP hydrolysis. We anticipated that Arg 85GAP would con-tribute to catalysis by stabilizing the transfer of charge duringtransition-state formation, an idea supported by data obtainedfrom the transition-state analogue GDP.AlF−
4: binding ofp50rhoGAP to RhoA.GDP is enhanced 100-fold in the presenceof AlF−
4, and this increased binding is abolished if Arg 85GAP ismutated10. These results suggest that AlF−
4 acts in the presence ofp50rhoGAP and Rho.GDP in a manner similar to that seen in otherphospho-transferring enzymes. The crystal structures of severalsuch enzymes, including the G protein Gia1 (ref. 14), transducin15
and myosin S1 (ref. 16), have been analysed as complexes withnucleoside diphosphate and AlF−
4. These all reveal that the alu-minium ion is octahedrally coordinated (with four fluorine atomsdefining the equatorial plane), located at a site broadly equivalent tothe g-phosphate position, and coordinated at the apical positionsby a b-phosphate oxygen on one side and a water molecule on theother. This arrangement cannot exactly represent the trigonalbipyramidal transition state of a phosphoryl-transfer reaction,although it is probably a good approximation. To examine theproposed role of Arg 85GAP in transition-state stabilization, we havecrystallized and determined the structure of p50rhoGAP andRhoA.GDP in the presence of AlF−
4 (Table 1).The overall structure of the Rho.GDP.AlF−
4/rhoGAP complex isshown in a ribbons representation in Fig. 1a. Alignment of the G-protein components of the ground- and transition-state complexesreveals a substantial rearrangement between the G protein and itsGAP (Fig. 1b). The two complexes contain different G-proteinhomologues because we could not crystallize p50rhoGAP withCdc42Hs.GDP in the presence of AlF−
4. However, the residues thatcontribute to the interface with GAP are strictly conserved betweenCdc42Hs and RhoA, suggesting that it is the presence of thetransition-state analogue that causes rearrangement of the hetero-dimer. The movement is essentially a 208 rigid-body rotation ofrhoGAP about an axis that runs close to the phenolic hydroxyl ofTyr 66Rho. There is a small local change in the structure of the A–A1loop of GAP which, in combination with the rigid-body rotation,enables the invariant Arg 85GAP to interact with the nucleotide.Indeed, the movement of Arg 85GAP during the catalytic cycleappears to be the key to the function of p50rhoGAP.
Table 1 Data collection and refinement statistics
Crystal space group: P212121
Cell parameters (A): a ¼ 66:5, b ¼ 72:0, c ¼ 91:3.............................................................................................................................................................................Data processing.............................................................................................................................................................................Observations to 1.65 A 160,124Unique reflections 42,992Completeness (%) 80.5 (60.8)I/j 16.1 (2.3)Rmerge (%)* 6.5 (32.4).............................................................................................................................................................................Refinement.............................................................................................................................................................................Data range (A) 6.0–1.65Reflections (F . 0) 37,875Non-hydrogen atoms 2,991Solvent molecules 497R.m.s. D bond length (A)† 0.013R.m.s. D bond angles (deg)† 1.6R.m.s. DB-factors for bonded atoms† 2.0Rfree (%)‡ 21.5Rcryst (%)§ 16.9.............................................................................................................................................................................Values in parentheses correspond to the highest-resolution shell (1.76–1.65 A)*Rmerge ¼ o
jj〈 I 〉 2 IJj=o 〈 I 〉, where Ij is the observed intensity and 〈 I 〉 is the average intensity.
†Root-mean-squared deviation (R.m.s. D) are given from ideal values.‡Rfree is the same as Rcryst, but calculated on the 5% of data excluded from refinement.§Rcryst ¼ o j〈Fp 2 FpðcalcÞ j=o Fp for all reflections, where Fp and Fp(calc) are the observed andcalculated structure amplitudes respectively.


