Embed Size (px)
Citation preview

Accepted Manuscript
Title: Monitoring plasma voriconazole levels followingintravenous administration in critically ill patients: anobservational study
Authors: Pavlos Myrianthefs, Sophia L. Markantonis,Penelope Evaggelopoulou, Stratos Despotelis, Effimia Evodia,Dimitris Panidis, George Baltopoulos
PII: S0924-8579(10)00024-5DOI: doi:10.1016/j.ijantimicag.2009.12.021Reference: ANTAGE 3227
To appear in: International Journal of Antimicrobial Agents
Received date: 25-11-2009Revised date: 20-12-2009Accepted date: 23-12-2009
Please cite this article as: Myrianthefs P, Markantonis SL, EvaggelopoulouP, Despotelis S, Evodia E, Panidis D, Baltopoulos G, Monitoring plasmavoriconazole levels following intravenous administration in critically ill patients:an observational study, International Journal of Antimicrobial Agents (2008),doi:10.1016/j.ijantimicag.2009.12.021
This is a PDF file of an unedited manuscript that has been accepted for publication.As a service to our customers we are providing this early version of the manuscript.The manuscript will undergo copyediting, typesetting, and review of the resulting proofbefore it is published in its final form. Please note that during the production processerrors may be discovered which could affect the content, and all legal disclaimers thatapply to the journal pertain.
peer
-005
7829
1, v
ersi
on 1
- 19
Mar
201
1Author manuscript, published in "International Journal of Antimicrobial Agents 35, 5 (2010) 468"
DOI : 10.1016/j.ijantimicag.2009.12.021

Page 1 of 24
Accep
ted
Man
uscr
ipt
Monitoring plasma voriconazole levels following intravenous
administration in critically ill patients: an observational study
Pavlos Myrianthefs a, Sophia L. Markantonis b,*, Penelope Evaggelopoulou a, Stratos
Despotelis b, Effimia Evodia a, Dimitris Panidis b, George Baltopoulos a
a Intensive Care Unit, ‘KAT’ Hospital, School of Nursing, Athens University, Athens,
Greece
b Athens University, Faculty of Pharmacy, Laboratory of Biopharmaceutics and
Pharmacokinetics, Athens 157.71, Greece
ARTICLE INFO
Article history:
Received 25 November 2009
Accepted 23 December 2009
Keywords:
Voriconazole
Critically ill patients
Normal to moderate renal impairment
Plasma concentration monitoring
Pharmacokinetics
* Corresponding author. Present address: Faculty of Pharmacy, Department of
Pharmaceutical Technology, Laboratory of Biopharmaceutics and Pharmacokinetics,
Edited manuscriptpe
er-0
0578
291,
ver
sion
1 -
19 M
ar 2
011

Page 2 of 24
Accep
ted
Man
uscr
ipt
University of Athens, Panepistimiopolis, Athens 157.71, Greece. Tel.: +30 210 727
4676; fax: +30 210 727 4027.
E-mail address: [email protected] (S.L. Markantonis).
peer
-005
7829
1, v
ersi
on 1
- 19
Mar
201
1

Page 3 of 24
Accep
ted
Man
uscr
ipt
ABSTRACT
Data relating to the pharmacokinetics of voriconazole in critically ill patients are
lacking. A prospective observational study was conducted on 18 non-consecutive
critically ill patients aged 24–97 years, comprising 12 patients with normal renal
function (NRF) [creatinine clearance (CLCr) ≥60 mL/min] and 6 patients with
moderate renal impairment (MRI) (CLCr 40–55 mL/min), administered voriconazole
intravenously (6 mg/kg loading dose and 3–4 mg/kg twice daily thereafter) in order to
determine the suitability of these doses in this patient population. Steady-state blood
levels were monitored and liver and renal function were recorded throughout
treatment. Large variability in patient plasma levels was observed, ranging from 37%
at ≤1 mg/L (minimum inhibitory concentration at which, for most fungal pathogens,
90% of isolates are susceptible) to 19% at >5.5 mg/L. Moreover, maintaining trough
concentrations above clinical breakpoints was not consistently achieved because
16/30 (53%) were ≤1 mg/L. In a few MRI patients, average concentrations were
found to be significantly different compared with those of NRF patients administered
the same dose, however this difference was not noted in pharmacokinetic
parameters following dose normalisation. None of the patients experienced
deterioration in renal or liver function. Recommended voriconazole doses are
inadequate to achieve drug concentrations >1 g/mL over the entire dosing interval
in some critically ill patients.
peer
-005
7829
1, v
ersi
on 1
- 19
Mar
201
1

Page 4 of 24
Accep
ted
Man
uscr
ipt
1. Introduction
Fungal infections remain an important and serious infectious complication for
critically ill Intensive Care Unit (ICU) patients. These patients are particularly
susceptible to fungal infections because of physical barrier disruption, immune
system depression, excessive antibiotic use, poor gut motility and the application οf a
plethora of medical and surgical interventions including central venous catheter
placement and other intravascular devices as well as abdominal surgery. Several
antifungal treatment strategies are applied in ICU patients (prophylactic, empirical,
pre-emptive and definite treatment), but in the clinical setting the optimal timing,
dosage, duration and choice of antifungal agents largely remain a matter of
controversy [1,2].
Voriconazole, a widely used broad-spectrum triazole antifungal agent, is frequently
used in ICU patients with severe fungal infections. It is extensively metabolised
hepatically by the cytochrome P450 (CYP) system and <2% of an orally or
intravenously administered dose is excreted unchanged in the urine [3]. To date,
clinical studies have indicated that clearance of voriconazole is not influenced by
renal function [3]. However, accumulation of the potentially nephrotoxic solubilising
excipient sulfobutyl ether--cyclodextrin (SBECD) contained in its intravenous (i.v.)
formulation has been described in patients with moderate to severe renal impairment
[serum creatinine (SrCr) levels >2.5 mg/dL] due to a linear relationship between
clearance of the excipient and creatinine clearance (CLCr) [4,5]. Furthermore, whilst
receiving i.v. voriconazole, reversible elevations in SrCr from baseline were
documented in clinical trials on patients with impaired renal function [6,7]. Therefore,
in patients with reduced renal function (SrCr levels >2.5 mg/dL), oral voriconazole is
peer
-005
7829
1, v
ersi
on 1
- 19
Mar
201
1

Page 5 of 24
Accep
ted
Man
uscr
ipt
recommended unless assessment of the risk–benefit ratio justifies the use of i.v.
voriconazole [3].
Voriconazole exhibits ca. 100-fold variability in drug levels in individuals receiving the
same dosage [8]. Random concentrations <2.05 mg/L have been associated with
suboptimal therapeutic outcome, and high concentrations with elevated liver function
test values [9] as well as central nervous system [10], ocular and other potential
dose-related toxicities [11]. High voriconazole levels have been noted in patients with
critical illness [8]. Therefore, there is a need to establish what steady-state levels are
achieved in the critically ill following i.v. infusion of voriconazole and to interpret their
effect on outcome [8], liver function [9], renal function due to SBECD accumulation
[4–6] and other potential concentration-related toxicities [11] in order to provide
appropriate information to facilitate dose selection and dosage adjustment
requirements in these patients. Accordingly, the aim of this study was to measure
voriconazole plasma levels following i.v. administration to critically ill patients with or
without renal dysfunction and to investigate its safety profile in terms of adverse
effects on renal function.
2. Patients and methods
2.1. Study design
This was a prospective, open-label, uncontrolled observational study. The study
protocol submitted for review stated that only patients receiving voriconazole as
medically indicated according to the attending physician would be eligible for
participation and that eight blood samples would be collected from each patient to
peer
-005
7829
1, v
ersi
on 1
- 19
Mar
201
1

Page 6 of 24
Accep
ted
Man
uscr
ipt
monitor steady-state drug levels and to determine voriconazole pharmacokinetic
parameters. The Scientific and Ethics Committees of the ‘KAT’ Hospital (Athens,
Greece) and the Athens University School of Nursing deliberated over the
requirements of the protocol in light of the frequent blood sampling for routine
laboratory tests and cultures typically needed for optimal patient care in ICUs and the
intended naturalistic nature of the study and decided to approve the study protocol
waiving informed consent from each patient.
2.2. Study population
Patients were included in the study if they had an indication to receive voriconazole
as prophylactic, empirical, pre-emptive or definite treatment.
2.3. Inclusion criteria
Inclusion criteria were i.v. administration of voriconazole for 72 h, age >18 years,
normal hepatic function, and normal renal function (NRF) (CLCr ≥ 60 mL/min) up to
moderate renal impairment (MRI) (CLCr 40–55 mL/min).
2.4. Exclusion criteria
Exclusion criteria were administration of medications known to be inhibitors or
inducers of or to in any way interact with voriconazole and/or a history of
hypersensitivity to azoles.
peer
-005
7829
1, v
ersi
on 1
- 19
Mar
201
1
Page 7 of 24
Accep
ted
Man
uscr
ipt
2.5. Patient data collected and recorded
For each eligible patient, their age, sex, weight, height, CLCr, urea level, hepatic
function tests, disease severity at the time of admission to the ICU based on the
Acute Physiology and Chronic Health Evaluation (APACHE) II score, Simplified
Acute Physiology Score II (SAPS II), Sequential Organ Failure Assessment (SOFA)
scores and Glasgow scale, voriconazole dose and concomitant administration of
potentially nephrotoxic drugs such as aminoglycosides, colistin, vancomycin and
teicoplanin were recorded.
Patients were divided into two subgroups according to their renal function status, i.e.
NRF or MRI (see Inclusion criteria, Section 2.3).
Liver and renal function tests were followed up at baseline, Day 5, Day 10 and at the
end of therapy to identify possible adverse effects. Liver function tests included
serum alanine and aspartate aminotransferases, alkaline phosphatase, -glutamyl
transpeptidase, total bilirubin and conjugated bilirubin. To assess the impact of i.v.
voriconazole administration on renal and liver function: (i) renal damage due to
accumulation of the solvent vehicle SBECD in study patients with MRI was defined
as an increase of ≥2 times the initial SrCr level, or start of an extrarenal depuration
procedure during voriconazole therapy; and (ii) liver damage was defined as an
increase of ≥4 times the initial serum concentration of liver enzymes, or ≥2 times in
patients with previous impaired liver function, as previously characterised by Alvarez-
Lerma et al. [12].
peer
-005
7829
1, v
ersi
on 1
- 19
Mar
201
1

Page 8 of 24
Accep
ted
Man
uscr
ipt
2.6. Drug administration and collection and analysis of plasma samples
All patients were administered a loading dose of 6 mg/kg voriconazole as a 30-min
i.v. infusion followed by a maintenance dose of 3–4 mg/kg as a 30-min i.v. infusion
every 12 h for a period of at least 72 h.
Blood samples (5 mL) were collected from patients through an arterial catheter just
before the initiation of infusion, at the end of infusion and at 1.5, 2.5, 4, 6, 9 and 12 h
thereafter. All samples were taken when voriconazole blood levels were considered
to be at steady state. All collected samples were centrifuged immediately at 3500
rpm for 5 min at ca. 4 C and the acquired plasma was stored at –70 C until
analysis.
Voriconazole plasma concentrations were determined using a previously validated
high-performance liquid chromatography (HPLC) method [13]. Calibration curves for
voriconazole were linear over the range 200–10 000 ng/mL. The lower limit of
quantification was 50 ng/mL. Coefficients of variation (CVs) for intraday and interday
precision were 0.5–0.6% and 1.2–7.5%, respectively, at drug concentrations of 200,
600, 4000 and 10 000 ng/mL.
2.7. Statistical analysis
Quantitative variables are expressed as mean ± standard deviation (S.D.) for
normally distributed variables or as median and range when the distribution departed
from normality. Study variables (demographic data, APACHE II , SAPS II and SOFA
scores, use of potentially nephrotoxic drugs) in patients with NRF and those with MRI
were compared using Student’s t-test or Mann–Whitney U-test for continuous
peer
-005
7829
1, v
ersi
on 1
- 19
Mar
201
1

Page 9 of 24
Accep
ted
Man
uscr
ipt
variables or using Fisher’s exact test for categorical data. All reported P-values are
two-sided. A P-value of <0.05 was considered statistically significant. Statistical
processing and data analysis were performed with GraphPad Prism 4 software
(GraphPad Software Inc., La Jolla, CA).
2.8. Pharmacokinetic evaluations
Pharmacokinetic parameters for voriconazole in serum were estimated from the
concentration–time data of individual patients by non-compartmental, steady-state
analysis using the WinNonlin pharmacokinetic software package (Pharsight Corp.,
Mountain View, CA).
3. Results
In total, 18 ICU patients aged 24–97 years required antifungal therapy and
participated in the study between March 2006 and February 2008. Six of these
patients were characterised as having MRI and twelve as having NRF at the
beginning of voriconazole treatment. The demographic characteristics of the patients
are presented in Table 1. All patients required intubation and mechanical ventilation
for the reasons listed in Table 1. Laboratory values regarding white blood cell counts
and liver and renal function tests during voriconazole administration are shown in
Table 2. During the course of treatment with voriconazole, no clinically significant
renal or liver function deterioration/damage (as defined in Section 2.5) occurred in
any of the patients with or without renal impairment.
peer
-005
7829
1, v
ersi
on 1
- 19
Mar
201
1

Page 10 of 24
Accep
ted
Man
uscr
ipt
Fourteen patients received empirical antibiotic treatment, two patients received pre-
emptive treatment and two were treated for microbiologically documented
candidaemia. Voriconazole was administered on Day 14.8 ± 3.3 of ICU
hospitalisation for a mean duration of 11.0 ± 3.6 days. Mean length of ICU stay was
46.7 ± 22.5 days. Other co-administered antimicrobial agents were linezolid (4
patients), meropenem (14 patients), vancomycin (8 patients) and colistin (12
patients). All drugs were administered as clinically indicated by the attending
physician.
Blood sampling was performed on Day 3.8 ± 0.2. In total, 139 plasma samples were
measured (ca. 8 samples from each patient). For two patients (Patients 16 and 17)
only 12-h Cmin values were available, whilst in another patient (Patient 3) the
estimated elimination half-life (t1/2) was 68.4h so a comparison could not be made
(Table 3)The median (range) minimum plasma concentration (Cmin) was 0.79 mg/L
(0.08–5.62 mg/L) at time 0 and 0.80 mg/L (0.15–5.95 mg/L) at 12 h, indicating that
steady state had been achieved in the 13 patients for which both Cmin values were
determined..
No correlation was found between mean concentrations measured and voriconazole
doses administered in the 18 study patients (Table 3). Significant intersubject
variation in plasma concentrations was observed at each sampling time for those
patients administered 200 mg (n = 4) (CV 80–120%) and 240 mg (n = 4) (CV 96–
145%). An increase in dose from 200 mg (4 patients) to 300 mg (2 patients) to 400
mg (2 patients) did not achieve a 2.3–2.5-fold increase in mean steady-state plasma
concentration, as previously reported [3], with mean concentrations of 2.8 ± 2.4 mg/L,
peer
-005
7829
1, v
ersi
on 1
- 19
Mar
201
1

Page 11 of 24
Accep
ted
Man
uscr
ipt
2.9 ± 2.0 mg/L and 2.7 ± 2.3mg/L, respectively. Corresponding mean maximum
plasma concentration (Cmax) values of voriconazole were 5.2, 6.2 and 6.9 mg/L,
respectively.
In the subgroups of patients with and without renal function impairment, the mean
(S.D.) values for CLCr throughout voriconazole administration are shown in Table 2.
The number of patients in both groups administered potentially nephrotoxic drugs
concomitantly with voriconazole were: colistin (5) or gentamicin (1) or hydrocortisone
(1) alone; colistin with vancomycin (3) or hydrocortisone (2) or both (2); vancomycin
with hydrocortisone (2); and gentamicin with vancomycin (1). There were no
statistically significant differences between patients with normal renal function and
renal insufficiency at the start of voriconazole treatment with regard to demographic
data, underlying illnesses or concomitant administration of nephrotoxic drugs, with
the exception of age (P = 0.0267). Average steady-state concentrations in the MRI
compared with the NRF patients were significantly different following administration
of the 320 mg dose (P < 0.05) and 240 mg dose (P < 0.001), but were not significant
for the 200 mg and 300 mg doses. Steady-state pharmacokinetic parameters for
voriconazole, estimated from the concentration–time data for all 18 critically ill
patients with or without renal impairment, are presented in Table 3. Following dose
normalisation based on the mean administered voriconazole dose of 272 mg, median
(range) area under the curve (AUC) and apparent volume of distribution and
clearance at steady state (Vdapp,ss and CLapp,ss, respectively) values for NRF patients
were 12.9 mg h/L (2.4–100.6 mg h/L), 246.6 L (36.7–951.9 L) and 20.6 L/h (3.0–
113.2 L/h) and for MRI patients were 44.4 mg h/L (5.1–93.6 mg h/L), 198.1 L (28.8–
498.2 L) and 5.7 L/h (4–59.5 L/h), respectively (not statistically significant) (Table 3).
peer
-005
7829
1, v
ersi
on 1
- 19
Mar
201
1

Page 12 of 24
Accep
ted
Man
uscr
ipt
4. Discussion
In the present study, we found that the recommended voriconazole dose of 3–4
mg/kg twice daily was inadequate to achieve and maintain drug concentrations >1
g/mL over the entire dosing interval (trough level) in some of our critically ill patients.
Moreover, in accordance with our defined safety criteria, i.v. voriconazole treatment
was not associated with either renal or liver damage in NRF and MRI patients.
To our knowledge, this is the first study to describe the pharmacokinetics of
voriconazole in critically ill patients with or without renal insufficiency. Voriconazole
exhibits non-linear pharmacokinetics due to saturation of its metabolism and as a
result small changes in the i.v. dose may result in disproportionate changes in
plasma concentrations [14]. In addition, terminal half-life estimations are dependent
on the dose and are not indicative of accumulation or elimination of the drug. In the
study patients, mean plasma concentrations did not increase with increasing dose of
the drug from 200 mg to 400 mg. No correlation was found between administered
voriconazole dose and achieved plasma concentration. Standard doses of
voriconazole produced highly variable drug levels in plasma from <0.1 mg/L to 11.4
mg/L (Table 3). Multiple factors have been found to be associated with this large
variability: non-linear saturable pharmacokinetics; drug–drug interactions; liver
disease; patient age (in particular with respect to children); and genetic
polymorphism of the cytochrome CYP2C19 [15–18]. Some recent clinical
observations have suggested that underdosing and overdosing of voriconazole may
influence the efficacy and safety of therapy [11,19–22].
peer
-005
7829
1, v
ersi
on 1
- 19
Mar
201
1

Page 13 of 24
Accep
ted
Man
uscr
ipt
A few studies have attempted to evaluate the relationship between voriconazole
exposure and treatment efficacy. In vitro pharmacodynamic studies have shown the
maximum fungicidal activity of voriconazole is around two to three times the minimum
inhibitory concentration (MIC) [23,24]. Based on a review of laboratory and clinical
data, the Antifungal Susceptibility Subcommittee of the Clinical and Laboratory
Standards Institute have proposed interpretive MIC breakpoints for voriconazole and
Candida spp. as follows: susceptible ≤1 mg/L; susceptible dose-dependent, 2 mg/L;
and resistant ≥4 mg/L [25]. These recommendations suggest that voriconazole
concentrations should be maintained >1 mg/L over the entire dosing interval (trough
level). In addition, voriconazole trough blood levels >5.5 mg/L have been reported to
be possibly associated with toxicity [10]. Large variability in voriconazole levels was
observed in our patients, ranging from 37% at ≤1 mg/L (the MIC at which, for most
fungal pathogens, 90% of isolates are susceptible) to 19% at >5.5 mg/L. In fact, in 7
of the 18 study patients 80% of the voriconazole levels measured were ≤1 mg/L.
Sixteen (53%) of the thirty measured trough concentrations were ≤1 mg/L and only
6% were >5.5 mg/L.
The very limited literature pertinent to the administration of voriconazole in critically ill
patients did not allow direct comparisons to be made between our estimated
pharmacokinetic parameters and those of previous studies. In an earlier study in
eight critically ill patients administered voriconazole 200 mg or 250 mg twice daily,
mean ± S.D. plasma concentrations of voriconazole for trough and peak were,
respectively, 4.6 ± 2.8 mg/L and 6.4 ± 4.3 mg/L [26] compared with 1.65 ± 2.02 mg/L
and 5.2 ± 3.9 mg/L in our study patients administered 200–250 mg doses. In the
present study, the mean estimated Vdapp,ss value of 290.9 L or 4.5 L/kg following
peer
-005
7829
1, v
ersi
on 1
- 19
Mar
201
1

Page 14 of 24
Accep
ted
Man
uscr
ipt
dose normalisation (mean administered dose 272 mg) was similar to that reported
previously, i.e. 2–4.6 L/kg [27]. In contrast, our t1/2 estimations ranged from 5.8 h to
21.8 h compared with a reported t1/2 of ca. 6 h [27]. However, our estimations were
longer than the duration of sampling in three of the NRF patients (see Table 3) and
therefore must be regarded as only rough estimations.
The lack of influence of renal function on the pharmacokinetics of voriconazole has
been reported [3,7]. The mean voriconazole concentrations in our MRI patients
compared with NRF patients were found to be significantly different following
administration of 320 mg and 240 mg doses, but this finding was based on a very
limited number of patients, i.e. two NRF patients versus one MRI patient and three
NRF patients versus one MRI patient, respectively, so the results cannot be
considered definitive. Furthermore, pharmacokinetic parameters following dose
normalisation did not differ significantly between the study patients with and without
renal impairment.
5. Conclusions
The principal finding of this observational study was that i.v. administration of
voriconazole in 18 critically ill patients was associated with a 37% prevalence of
possibly inadequate plasma levels (i.e. ≤1 mg/L). No clear reason can be offered to
explain these low concentrations besides the possibility that certain patients may
have been homozygous extensive metabolisers, particularly since our patients were
not receiving concomitant medications that might have induced voriconazole
metabolism.
peer
-005
7829
1, v
ersi
on 1
- 19
Mar
201
1

Page 15 of 24
Accep
ted
Man
uscr
ipt
Similar to other voriconazole studies, a wide range of concentrations was observed.
A greater than proportional increase in exposure (AUC) was not observed with
increasing drug dose. Higher voriconazole plasma concentrations were observed in a
few patients with MRI compared with NRF, but despite probable SBECD
accumulation, deterioration of renal function was not noted in these patients. Also,
none of the patients experienced deterioration in liver function during voriconazole
administration.
This study had several limitations. The small sample size, unknown patient
genotypes and range of voriconazole doses administered limited the value of the
results. However, the findings indicate that administration of voriconazole in critically
ill patients needs to be studied further, as additional data are required to facilitate the
therapeutic drug monitoring of this antifungal agent in this patient population.
Funding
This research was funded entirely by the University of Athens.
Competing interests
None declared.
Ethical approval
Scientific and Ethics Committees of ‘KAT’ Hospital and the Athens University School
of Nursing (Athens, Greece).
peer
-005
7829
1, v
ersi
on 1
- 19
Mar
201
1

Page 16 of 24
Accep
ted
Man
uscr
ipt
References
[1] Blot S, Dimopoulos G, Rello J, Vogelaers D. Is Candida really a threat in the ICU?
Curr Opin Crit Care 2008;14:600–4.
[2] Rüping MJ, Vehreschild JJ, Cornely OA. Patients at high risk of invasive fungal
infections: when and how to treat. Drugs 2008;68:1941–62.
[3] FDA Antiviral Drugs Advisory Committee. Briefing document for voriconazole (oral
and intravenous formulations). FDA Antiviral Drugs Advisory Committee; 2001.
http://www.fda.gov/ohrms/dockets/ac/01/briefing/3792b2_01_Pfizer.pdf [accessed
20 January 2010].
[4] Tomaszewski K, Purkins L. The pharmacokinetics and safety of sulphobutylether-
-cyclodextrin (SBECD). In: Program and abstracts of the 41st Interscience
Conference on Antimicrobial Agents and Chemotherapy (ICAAC); 16–19
December 2001; Chicago, IL. Washington, DC: ASM Press; 2001. Abstract 23.
[5] Von Mach MA, Burhenne J, Weilemann LS. Accumulation of the solvent vehicle
sulphobutylether beta cyclodextrin sodium in critically ill patients treated with
intravenous voriconazole under renal replacement therapy. BMC Clin Pharmacol
2006;6:6.
[6] US Food and Drug Administration. Background document for the Antiviral Drug
Products Advisory Committee meeting. FDA; 2001.
http://www.fda.gov/ohrms/dockets/ac/01/briefing/3792b2_02_FDA-
voriconazole.htm [accessed 20 January 2010].
[7] Abel S, Allan R, Gandelman K, Tomaszewski K, Webb DJ, Wood ND.
Pharmacokinetics, safety and tolerance of voriconazole in renally impaired
subjects: two prospective, multicentre, open-label, parallel-group volunteer
studies. Clin Drug Invest 2008;28:409–20.
peer
-005
7829
1, v
ersi
on 1
- 19
Mar
201
1

Page 17 of 24
Accep
ted
Man
uscr
ipt
[8] Hope WW, Billaud EM, Lestner J, Denning DW. Therapeutic drug monitoring for
triazoles. Curr Opin Infect Dis 2008;21:580–6.
[9] Tan K, Brayshaw N, Tomaszewski K, Troke P, Wood N. Investigation of the
potential relationships between plasma voriconazole concentrations and visual
adverse events or liver function test abnormalities. J Clin Pharmacol
2006;46:235–43.
[10] Pascual A, Calandra T, Bolay S, Buclin T, Bille J, Marchetti O. Voriconazole
therapeutic drug monitoring in patients with invasive mycoses improves efficacy
and safety outcomes. Clin Infect Dis 2008;46:201–11.
[11] Boyd AE, Modi S, Howard SJ, Moore CB, Keevil BG, Denning DW. Adverse
reactions to voriconazole. Clin Infect Dis 2004;39:1241–4.
[12] Alvarez-Lerma F, Allepuz-Palau A, Garcia MP, Angeles Leon M, Navarro A,
Sanchez-Ruiz H, et al.; Voriconazole Study Group in Critically Ill Patients. Impact
of intravenous administration of voriconazole in critically ill patients with impaired
renal function. J Chemother 2008;20:93–100.
[13] Gage R, Stopher DA. A rapid HPLC assay for voriconazole in human plasma.
J Pharm Biomed Anal 1998;17:1449–53.
[14] Trifilio S, Pennick G, Pi J, Zook J, Golf M, Kaniecki K, et al. Monitoring plasma
voriconazole levels may be necessary to avoid subtherapeutic levels in
hematopoietic stem cell transplant recipients. Cancer 2007;109:1532–5.
[15] Johnson LB, Kauffman CA. Voriconazole: a new triazole antifungal agent. Clin
Infect Dis 2003;36:630–7.
[16] Dodds Ashley ES, Lewis R, Lewis JS, Martin C, Andes D. Pharmacology of
systemic antifungal agents. Clin Infect Dis 2006;43(Suppl 1):S28–39.
peer
-005
7829
1, v
ersi
on 1
- 19
Mar
201
1

Page 18 of 24
Accep
ted
Man
uscr
ipt
[17] Hyland R, Jones BC, Smith DA. Identification of the cytochrome P450
enzymes involved in the N-oxidation of voriconazole. Drug Metab Dispos
2003;31:540–7.
[18] Walsh TJ, Karlsson MO, Driscoll T, Arguedas AG, Adamson P, Saez-Llorens
X, et al. Pharmacokinetics and safety of intravenous voriconazole in children after
single- or multiple-dose administration. Antimicrob Agents Chemother
2004;48:2166–72.
[19] Smith J, Safdar N, Knasinski V, Simmons W, Bhavnani SM, Ambrose PG, et
al. Voriconazole therapeutic drug monitoring. Antimicrob Agents Chemother
2006;50:1570–2.
[20] Denning DW, Ribaud P, Milpied N, Caillot D, Herbrecht R, Thiel E, et al.
Efficacy and safety of voriconazole in the treatment of acute invasive
aspergillosis. Clin Infect Dis 2002;34:563–71.
[21] Imhof A, Schaer DJ, Schanz U, Schwarz U. Neurological adverse events to
voriconazole: evidence for therapeutic drug monitoring. Swiss Med Wkly
2006;136:739–42.
[22] Trifilio S, Ortiz R, Pennick G, Verma A, Pi J, Stosor V, et al. Voriconazole
therapeutic drug monitoring in allogeneic hematopoietic stem cell transplant
recipients. Bone Marrow Transplant 2005;35:509–13.
[23] Purkins L, Wood N, Ghahramani P, Greenhalgh K, Allen MJ, Kleinermans D.
Pharmacokinetics and safety of voriconazole following intravenous- to oral-dose
escalation regimens. Antimicrob Agents Chemother 2002;46:2546–53.
[24] Andes D, Marchillo K, Stamstad T, Conklin R. In vivo pharmacokinetics and
pharmacodynamics of a new triazole, voriconazole, in a murine candidiasis
model. Antimicrob Agents Chemother 2003;47:3165–9.
peer
-005
7829
1, v
ersi
on 1
- 19
Mar
201
1

Page 19 of 24
Accep
ted
Man
uscr
ipt
[25] Pfaller MA, Diekema DJ, Ostrosky-Zeichner L, Rex JH, Alexander BD, Andes
D, et al. Correlation of MIC with outcome for Candida species tested against
voriconazole: analysis and proposal for interpretive breakpoints. J Clin Microbiol
2006;44:819–26.
[26] Mohammedi I, Piens MA, Padoin C, Robert D. Plasma levels of voriconazole
administered via a nasogastric tube to critically ill patients. Eur J Clin Microbiol
Infect Dis 2005;24:358–60.
[27] Theuretzbacher U, Ihle F, Derendorf H. Pharmacokinetic/pharmacodynamic
profile of voriconazole. Clin Pharmacokinet 2006;45:649–63.
peer
-005
7829
1, v
ersi
on 1
- 19
Mar
201
1

Page 20 of 24
Accep
ted
Man
uscr
ipt
Table 1
Demographic characteristics of the study patients
Characteristic Mean ± S.D. a
Age (years) 62.3 ± 22
Sex (male/female) (n) 8/10
Weight (kg) 65 ± 10.2
Height (cm) 169.8 ± 9.5
Urea (mg/dL) 53.6 ± 41.2
Body temperature (C) 37.8 ± 0.8
ICU stay 46.7 ± 22.5
SOFA score [median (range)] 4 (0–19)
Admission diagnosis
Trauma 10
Medical 3
Intracerebral haemorrhage 3
Subarachnoid haemorrhage 2
SAPS II 47.2 ± 15.8
Predicted mortality 58.5 ± 27.2
APACHE II score 20.2 ± 7.1
Predicted mortality 23.4 ± 23.2
Observed mortality [n/N (%)] 6/18 (33.3)
S.D., standard deviation; ICU, Intensive Care Unit; SOFA, Sequential Organ Failure
Assessment; SAPS, Simplified Acute Physiology Score; APACHE, Acute Physiology
and Chronic Health Evaluation.
a Data are mean ± S.D. unless otherwise stated.
Edited Table 1pe
er-0
0578
291,
ver
sion
1 -
19 M
ar 2
011

Page 21 of 24
Accep
ted
Man
uscr
ipt
1
Table 2
Evolution of laboratory parameters
Baseline Day 5 Day 10 EOT
All patients
CLCr (mL/min) 112.2 ± 67.3 98.8 ± 57.8 109.4 ± 53.2 104.6 ± 52.6
WBC count (cells/L) 11221 ± 4838 10589 ± 4698 9107 ± 4368 9307 ± 4176
AST (U/L) 53.4 ± 54.5 45.4 ± 68.2 46.7 ± 22.7 80.1 ± 103.2
ALT (U/L) 81.0 ± 112.5 46.8 ± 37.2 57.91 ± 41.9 69.3 ± 81.5
ALP (U/L) 99.6 ± 58.9 103.4 ± 49.1 125.1 ± 44.8 132.3 ± 81.6
TBIL (mg/dL) 0.6 ± 0.4 0.9 ± 1.4 0.6 ± 0.7 1.7 ± 2.7
GGTP (U/L) 146.5 ± 193.3 171.9 ± 225.7 164.0 ± 122.1 248.8 ± 355.9
Patients with normal CLCr (>60 mL/min)
CLCr (mL/min) 140.1 ± 57.5 122.5 ± 53.7 129.4 ± 44.2 129.5 ± 44.2
WBC count (cells/L) 10314 ± 5252 9721 ± 3860 8004 ± 2197 7626 ± 3208
AST (U/L) 61.5 ± 61.7 30.5 ± 14.8 46.7 ± 25.2 72.3 ± 85.9
ALT (U/L) 95.71 ± 128.0 49.7 ± 44.5 54.7 ± 46.1 84.6 ± 104.8
ALP (U/L) 110.5 ± 66.0 101.4 ± 45.9 128.1 ± 49.2 134.9 ± 90.9
TBIL (mg/dL) 0.5 ± 0.2 0.5 ± 0.4 0.6 ± 0.5 0.6 ± 0.4
GGTP (U/L) 166.1 ± 214.3 128.5 ± 96.69 160.7± 124.6 196.3 ± 183.7
Patients with impaired CLCr (40–55 mL/min)
CLCr (mL/min) 39.6 ± 14.9 12498 ± 6237 56.0 ± 37.9 54.8 ± 25.2
Edited Table 2pe
er-0
0578
291,
ver
sion
1 -
19 M
ar 2
011

Page 22 of 24
Accep
ted
Man
uscr
ipt
2
WBC count (cells/L) 12122 ± 2379 12498 ± 6237 13520 ± 9447 12668 ± 4166
AST (U/L) 30.8 ± 10.2 78.2 ± 122.1 47.0 ± 9.9 91.0 ± 133.9
ALT (U/L) 39.8 ± 27.3 40.2 ± 12.1 72.5 ± 4.9 47.8 ± 28.2
ALP (U/L) 75.6 ± 32.4 107.8 ± 61.1 111.5 ± 16.3 128.2 ± 73.9
TBIL (mg/dL) 0.9 ± 0.5 2.1 ± 3.3 0.4 ± 0.0 2.2 ± 3.4
GGTP (U/L) 95.6 ± 128.7 267.6 ± 388.6 179.0 ± 155.6 332.8 ± 553.8
EOT, end of therapy; CLCr, creatinine clearance; WBC, white blood cell; AST, aspartate aminotransferase; ALT, alanine
aminotransferase; ALP, alkaline phosphatase; TBIL, total bilirubin; GGTP, -glutamyl transpeptidase.
peer
-005
7829
1, v
ersi
on 1
- 19
Mar
201
1
Page 23 of 24
Accep
ted
Man
uscr
ipt
1
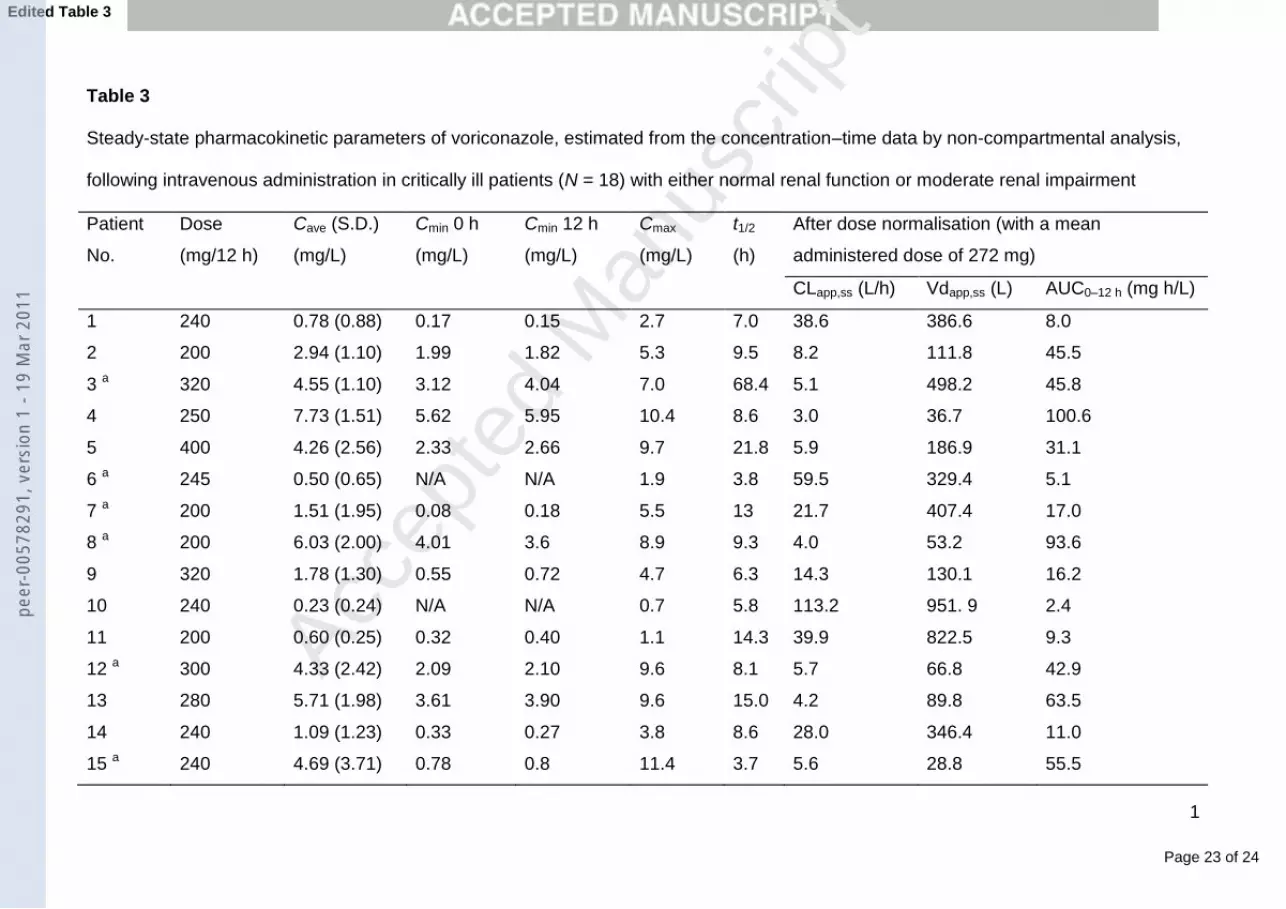
Table 3
Steady-state pharmacokinetic parameters of voriconazole, estimated from the concentration–time data by non-compartmental analysis,
following intravenous administration in critically ill patients (N = 18) with either normal renal function or moderate renal impairment
Patient
No.
Dose
(mg/12 h)
Cave (S.D.)
(mg/L)
Cmin 0 h
(mg/L)
Cmin 12 h
(mg/L)
Cmax
(mg/L)
t1/2
(h)
After dose normalisation (with a mean
administered dose of 272 mg)
CLapp,ss (L/h) Vdapp,ss (L) AUC0–12 h (mg h/L)
1 240 0.78 (0.88) 0.17 0.15 2.7 7.0 38.6 386.6 8.0
2 200 2.94 (1.10) 1.99 1.82 5.3 9.5 8.2 111.8 45.5
3 a 320 4.55 (1.10) 3.12 4.04 7.0 68.4 5.1 498.2 45.8
4 250 7.73 (1.51) 5.62 5.95 10.4 8.6 3.0 36.7 100.6
5 400 4.26 (2.56) 2.33 2.66 9.7 21.8 5.9 186.9 31.1
6 a 245 0.50 (0.65) N/A N/A 1.9 3.8 59.5 329.4 5.1
7 a 200 1.51 (1.95) 0.08 0.18 5.5 13 21.7 407.4 17.0
8 a 200 6.03 (2.00) 4.01 3.6 8.9 9.3 4.0 53.2 93.6
9 320 1.78 (1.30) 0.55 0.72 4.7 6.3 14.3 130.1 16.2
10 240 0.23 (0.24) N/A N/A 0.7 5.8 113.2 951. 9 2.4
11 200 0.60 (0.25) 0.32 0.40 1.1 14.3 39.9 822.5 9.3
12 a 300 4.33 (2.42) 2.09 2.10 9.6 8.1 5.7 66.8 42.9
13 280 5.71 (1.98) 3.61 3.90 9.6 15.0 4.2 89.8 63.5
14 240 1.09 (1.23) 0.33 0.27 3.8 8.6 28.0 346.4 11.0
15 a 240 4.69 (3.71) 0.78 0.8 11.4 3.7 5.6 28.8 55.5
Edited Table 3pe
er-0
0578
291,
ver
sion
1 -
19 M
ar 2
011

Page 24 of 24
Accep
ted
Man
uscr
ipt
2
16 400 1.05 (1.29) N/A 0.33 4.1 7.5 27.3 296.8 6.8
17 320 1.22 (1.89) N/A 0.44 5.9 8.1 24.4 283.6 9.5
18 300 1.49 (0.74) 0.79 0.69 2.7 8.7 16.8 209.5 14.7
a Patients with moderate renal impairment.
Cave, average concentration; S.D., standard deviation; Cmin 0 h, drug concentration at 0 h, i.e. the 12-h sample of the previous dose; Cmin
12 h, drug concentration at 12 h; Cmax, drug concentration at the end of infusion; t1/2, elimination half-life calculated as ln 2/z, where z is
the elimination rate constant estimated by log-linear regression of the terminal portion of the concentration–time curve (on the basis of
the last three data points); CLapp,ss, apparent clearance at steady state calculated as dose/AUC; Vdapp,ss, apparent volume of distribution
at steady state calculated as MRT CLapp,ss, where MRT is the mean residence time; AUC, area under the curve from the time of dosing
to the time of next dose; N/A, not applicable.
peer
-005
7829
1, v
ersi
on 1
- 19
Mar
201
1


