Embed Size (px)
Citation preview

�������� ����� ��
Morphometric analysis of lava flow units: Case study over LIDAR-derivedtopography at Mount Etna, Italy
Simone Tarquini, Massimiliano Favalli, Francesco Mazzarini, Ilaria Isola,Alessandro Fornaciai
PII: S0377-0273(12)00126-6DOI: doi: 10.1016/j.jvolgeores.2012.04.026Reference: VOLGEO 4897
To appear in: Journal of Volcanology and Geothermal Research
Received date: 17 February 2012Accepted date: 27 April 2012
Please cite this article as: Tarquini, Simone, Favalli, Massimiliano, Mazzarini, Francesco,Isola, Ilaria, Fornaciai, Alessandro, Morphometric analysis of lava flow units: Case studyover LIDAR-derived topography at Mount Etna, Italy, Journal of Volcanology and Geother-mal Research (2012), doi: 10.1016/j.jvolgeores.2012.04.026
This is a PDF file of an unedited manuscript that has been accepted for publication.As a service to our customers we are providing this early version of the manuscript.The manuscript will undergo copyediting, typesetting, and review of the resulting proofbefore it is published in its final form. Please note that during the production processerrors may be discovered which could affect the content, and all legal disclaimers thatapply to the journal pertain.

ACC
EPTE
D M
ANU
SCR
IPT
ACCEPTED MANUSCRIPT
Morphometric analysis of lava flow units: case study over LIDAR-derived
topography at Mount Etna, Italy
Simone Tarquini, Massimiliano Favalli, Francesco Mazzarini, Ilaria Isola, Alessandro Fornaciai Istituto Nazionale di Geofisica e Vulcanologia, Sezione di Pisa, Italy
High resolution, LIDAR-derived digital elevation models of volcanic areas can significantly
improve knowledge of lava flow morphology and emplacement mechanisms. Here we focus on
single flow units, presenting a new semi-automatic procedure which provides a quantitative analysis
of their shape. The method relies on the automatic processing of the elevation profiles obtained on
transects orthogonal to the flow unit axis. The initial phase of the Mount Etna flank eruption from
September 2004 is taken as test case, and the procedure is applied on an active lava flow, which was
emplaced on the eastern flank of the volcano. The main topographic dataset used is a 2-m-resolution
digital elevation model obtained from a LIDAR survey. Starting from the axis of a lava flow unit,
our method yields morphometric data on the flow unit at a 2 m spacing, calculating parameters
including flow width, channel width, the heights of the levees, inward and outward slope of levees,
and estimating pre-emplacement slope along the axis. The procedure is embedded in a customized
GIS, which allows easy processing, handling and display of data. The procedure has also been
applied to another flow unit emplaced during the October-November 1999 overflow from the Bocca
Nuova crater. Results show that the channel width seems to accommodate first order trends of the
pre-emplacement slope along the flow unit axis, while it is little affected by high frequency changes
in slope; in contrast, flow unit width and flow unit thickness are apparently influenced by small
scale changes in slope. The different emplacement conditions of the two flow units are reflected by
the overall contrasting morphologies, as shown by the different average thickness and by the
different ratios between (i) flow width vs. channel width and (ii) flow unit section area vs. channel
width. The new method provides an enhanced, systematic and thorough morphometric description
of flow units, which may improve the understanding of the emplacement mechanisms of lava flows
on Earth and other planets.

ACC
EPTE
D M
ANU
SCR
IPT
ACCEPTED MANUSCRIPT
1. Introduction
At basaltic volcanoes such as Mount Etna (Italy), persistent effusive activity has led to the
formation of complex flow fields (Walker, 1971; Frazzetta and Romano, 1984; Guest et al, 1987;
Calvari et al., 2002; Favalli et al., 2011; Tarquini and Favalli, 2011) whose global extent is a critical
parameter for understanding the associated hazards (Kilburn and Lopes, 1998; Behncke et al., 2005;
Andronico and Lodato, 2005).
Lava flow fields grow mainly by iterative emplacement of newly forming flow units.
According to Wadge (1978), a flow unit is a body of lava that flows and cools as a single entity.
Flow units fed over a sufficient time interval invariably tend to construct a channel bounded by
levees (Hulme, 1974). Sparks et al. (1976) explored this point providing the first classification of
levees observed in lava flows. Once a channelized flow is established, it may experience a variety
of dynamics such as overflow, blockage, levee breaching, bifurcation, roofing, etc. (e.g. Calvari and
Pinkerton, 1998; Harris et al., 2005, 2009; Bailey et al., 2006; Applegarth et al., 2010; Favalli et al.,
2010a; James et al., 2012). As the effusive activity continues and flow units lengthen, these
dynamics tend to transform/disrupt active channels until they are eventually abandoned (at least
partially) and new flow units form increasing the complexity of the flow field.
Lava flows consist of an unconfined multiphase and multicomponent stream whose
temperature, rheology, and emission-rate all vary with time and space. Given the relevance of the
evolution of flow units for hazard and risk assessment, their geometry and thermo-rheological
properties have been modeled over years (e.g. Wilson and Parfitt, 1993; Tallarico and Dragoni,
1999; Harris and Rowland, 2001; Valerio et al., 2008). Because of the intrinsic complexity of these
systems, similar studies need to be compared to the large spectrum of actual flow units to be
validated. An accurate and systematic collection of a similar wealth of morphometric data has been
lacking until recent years (e.g. Lipman and Banks, 1987; Calvari et al., 1994; Harris and Neri,

ACC
EPTE
D M
ANU
SCR
IPT
ACCEPTED MANUSCRIPT
2002), when new technologies such as airborne LIDAR, started to be applied over volcanic areas,
making very high resolution/high accuracy topographies available to volcanologists (Mazzarini et
al., 2005; Pyle and Elliot, 2006; Ventura and Vilardo, 2008; Csatho et al., 2008; Favalli et al., 2009,
2010a; Fornaciai et al., 2010). Appropriate methods to effectively collect and process reliable
morphometric data from digital elevation models (DEMs) become crucial.
Here we introduce a new semi-automatic method to improve and speed-up the acquisition of
morphometric measurements of channelized lava flow units from high resolution DEMs. The early
phase of the 2004 Mount Etna effusive activity imaged by the LIDAR survey presented by
Mazzarini et al. (2005) is used as test case. Afterwards, we apply the processing on a flow unit
emplaced westward from the rim of the Bocca Nuova crater during the 1999 Mount Etna eruption
(Harris and Neri, 2002), and discuss the results obtained in the two cases.
2. Case study
2.1. The Mount Etna effusive activity imaged on 16 September 2004
The 2004 Mount Etna flank eruption started on 7 September, when a fracture field opened on the
lower eastern flank of the South East Crater (SEC), from an elevation of 3000 m asl toward ESE
(Fig. 1). A first small lava flow formed emerging from a fissure at an elevation of 2920 m lasting
two days (Burton et al., 2005; Allard et al., 2006). Afterwards, fractures propagated further down
slope, and on 10 September new vents opened at 2620 and 2320 m asl. The effusive activity
continued from these two vents and eventually ceased on 8 March 2005 (Allard et al., 2006). In the
meantime, on 16th September 2004, an airborne LIDAR survey was carried out over a large portion
of Mount Etna (Mazzarini et al., 2005), imaging the 2004 Mount Etna eruption a few days after the
onset of the effusive activity, when two lava flows were emplaced simultaneously in the Valle del
ACC
EPTE
D M
ANU
SCR
IPT
ACCEPTED MANUSCRIPT
Bove from vents at 2620 and 2320 m asl (Mazzarini et al., 2005; Favalli et al., 2009). The
northernmost of the two flows already showed two major overflows originating from both sides of
the main flow unit.
2.2. Topographic datasets used
We use topographic data of the summit area of Mt. Etna acquired with an Optech ALTM 3033 laser
altimeter on 16th September 2004, from 7:00 to 8:30 a.m. LT. The LIDAR device emits 33,000
pulses per second and warrants an horizontal accuracy of 1/2000 × altitude and an elevation
accuracy of ±15 and ±35 cm at 1.2 and 3.0 km flight altitude (respectively, nominal specifications
of the instrument). Acquired data were processed to construct a 2 m-cell size DEM of the volcano in
grid format with an elevation accuracy of ±0.40 m, a horizontal accuracy of ±1.5 m (Mazzarini et
al., 2005; Fig. 1). For brevity, we call this LIDAR-derived DEM the 2004 DEM.
We also made use of the TINITALY/01 DEM (Tarquini et al., 2007; 2012), which covers the
whole of Italy. For Mount Etna, TINITALY/01 is built upon the digital cartography derived from an
aero-photogrammetric survey carried out on 1998 (Neri et al., 2008). This DEM was derived in a
triangular irregular network format (TIN) improved by the DEST algorithm (Favalli and Pareschi,
2004). Here we used a DEM in grid format derived from the TINITALY database, which was found
to have a root mean square error (RMSE) in elevation of 1.98 m (Neri et al., 2008). For brevity, we
refer to this DEM as the 1998 DEM. It served as an pre-emplacement topography for a large portion
of the northernmost flow unit (e.g. Allard et al., 2006).
2.3. Previous systematic morphometric analysis of a channelized lava flow unit
Based on the above LIDAR survey, Mazzarini et al. (2005) presented a set of data describing the
morphometry of the northernmost lava flow unit emplacing on 16 September 2004 at Mt Etna.

ACC
EPTE
D M
ANU
SCR
IPT
ACCEPTED MANUSCRIPT
Measurements were collected every 10 m downhill; widths were measured along a section
orthogonal to the flow axis, and heights as elevation differences. An elevation profile was traced for
each orthogonal section to visualize the morphology and support the analysis of collected results
(Fig. 2a, see also Figs. 2-3 in Mazzarini et al. 2005). Measurements were based on the
morphological features manually traced on shaded relief images and on the intensity map of
backscattered LIDAR pulses (Mazzarini et al., 2007; Tarquini and Favalli 2011). The latter map,
however, can help in locating flow-unit boundaries only under favorable conditions, and it cannot
support the detection of other features such as the top of the levees.
The subjective interpretation of morphological features was a significant source of
uncertainties. In Fig. 2, the hand-derived points of Mazzarini et al. (2005) are compared with
selected points of relative maximum curvature of the profile (either positive or negative, i.e.
concavities or convexities). This comparison suggested setting up a new procedure, which uses
relative maximum curvature points of elevation profiles as key points for the identification of
morphological features. These points are mathematically derived, hence they are not subjective by
definition and their accuracy depends essentially on the resolution of the DEM. Levees could have
been identified also by local maxima of the elevation profile, but the analysis of a large set of
different profiles revealed that, in most cases, the local maximum curvature is a more effective
marker (e.g. even in case of a brimful channel). In addition, curvature variations (in this case the
minimum) also work for the determination of flow width.
It was also evident that to collect, store, retrieve and analyze adequately a database of similar
morphometric measurements, the procedure had to be embedded in a customized geographic
information system (GIS).
In order to tackle the above issues, we introduce an improved methodology which
automatically traces profiles across the flow providing an extended set of morphometric
measurements and creating a GIS database to dynamically handle/process data for many flow units.

ACC
EPTE
D M
ANU
SCR
IPT
ACCEPTED MANUSCRIPT
3. Method
3.1. Mathematical processing of elevation profiles
The initial step of the new procedure is the tracing of the axis of the flow unit, which is usually
done by hand (Fig. 3). Sections orthogonal to the flow unit axis are then automatically traced every
2 m from the vent. A profile is derived from each section, and it is considered as a function in the
form y = f(x) where y is the elevation and x is the coordinate along the section (plots in Fig. 3). First
and second derivatives (f’ and f”) are then calculated over a densified and smoothed version of the
profile and points of relative minima and maxima in the second derivative are identified on the
original profile (Fig. 3). All these points are candidate “tie-points”, and some of these are then
selected to identify specific morphometric features on the considered profile.
All the elevation profiles are processed as in the case illustrated in Fig. 3, and are aligned one
below the other creating a customized reference system centered on the flow axis (Goff and
Nordfjord, 2004; Fig. 4). The vertical shift between two successive profiles, as a rule, is constant,
but locally it may increase to avoid intersections between profiles. The points of maxima and
minima of the second derivative are reported on each profile and are assigned with a color table to
rank absolute values of minima and maxima (Fig. 4c). These points are derived by a straightforward
mathematical processing of each profile and are used to obtain an optimal and objective tracing of
morphological features. Specific tools have been devised to easily draw such features by connecting
a series of homologous points on successive profiles (Fig. 4d). Fig. 5 illustrates the definition of a
first set of morphometric parameters measured through the described mathematical processing.
The proposed procedure also collects the heights of the left and right levees, allowing the
identification and quantification of asymmetry in the levee heights due, for example, to lateral

ACC
EPTE
D M
ANU
SCR
IPT
ACCEPTED MANUSCRIPT
overbanking at the flow bends (e.g. Harris and Neri, 2002). In addition, both the inward and the
outward slope of levees have been collected (Fig. 5).
Fig. 6 compares channel and flow widths measured by Mazzarini et al. (2005) with the ones
collected here. The two methods provide similar results: channel widths essentially coincide, while
flow widths show some local discrepancy, essentially due to the presence of two major overflows
which disrupted the geometry of the main flow unit.
3.2. Baseline interpolation
Some morphological parameters need a reference baseline (Fig. 2). Generally a pre-emplacement
topography is not available making approximations necessary. In Mazzarini et al. (2005) the
baseline was simply the straight line joining the left and right margins of the flow unit (Fig. 2).
Here, instead, we derive more realistic baselines based on a reconstruction of the pre-emplacement
profile from slope trends outside the flow (see Fig. 7). The nearest portions of the elevation profile
immediately outside the flow unit (on both sides) are processed to draw straight segments below the
flow. Reference points are then taken on these segments at given distances from the flow unit
boundaries, and further geometric constructions are used to obtain additional reference points that
are joined together to form a polyline (Fig. 7). This polyline is then smoothed using a spline
function to obtain a final candidate baseline (Fig. 7). Further automatic geometrical checks
guarantee the consistency of the result with respect to the input profile (e.g. intersections between
the baseline and the profile are not allowed but at the flow unit boundaries). This baseline relies on
the assumption of a relatively simple pre-emplacement topography. Obviously, a similar premise
may not be suitable for all cases, but in our test case the new baseline gives more reliable results
than the straight line used in Mazzarini et al. (2005).
The baseline is used for the measurement of additional morphometric parameters as defined
by Fig. 8. The envelope of all the baselines below the flow unit approximates a pre-lava flow

ACC
EPTE
D M
ANU
SCR
IPT
ACCEPTED MANUSCRIPT
emplacement surface on which it is possible to calculate the downflow slope along the flow axis, so
that, in cases where a pre-emplacement topography is not available, this procedure can be used as a
proxy for this crucial parameter. Fig. 9 compares the downflow slope considering the 1998 DEM as
pre-emplacement topography (as in Mazzarini et al., 2005) with the downflow slope obtained by
using the envelope of the baselines. Although the results are consistent, the two plots are not
coincident, because, in the first part of the diagram, the 1998 DEM is not actually the pre-
emplacement topography, owing to the emplacement of the 1999 and 2000-2001 flows (Allard et
al., 2006).
Fig. 10 compares the area of flow unit sections obtained by using the baselines calculated here
and the same area calculated by comparing the elevation profiles over the 1998 DEM and the 2004
DEM. Fig. 10 also shows 14 elevation profiles with relative baselines. By comparing profiles over
1998 DEM and 2004 DEM, a vertical offset (up to 3-4 m) between the two DEMs is observed,
especially in the terminal segment of the flow. The offset can be explained either as a local bias of
the 1998 DEM or as an effect of local accumulation of tephra between the two topographic surveys.
This offset explains the globally higher values of the flow section areas measured from DEM
comparisons with respect to the ones measured considering the baselines. This latter method
provides some peaks where the baselines overestimate the flow thickness (hence increasing the
section area). In the first quarter of the diagram, the two plots are far apart, due to the local
inadequacy of 1998 DEM as a pre-emplacement topography. A substantial inconsistency is also
obvious where the two overflows originate. Taking all this into account, the overall pattern of the
two plots is quite consistent, with a substantial conformity of the broad plot outline and of local
peaks. This evidence suggests that the baseline method may provide a reliable first-order
approximation of the flow unit section when only the post-emplacement topography is available.
3.3. Presentation of results and comparison with field-based measurements

ACC
EPTE
D M
ANU
SCR
IPT
ACCEPTED MANUSCRIPT
The new procedure yields a wealth of morphometric data. To support data analysis and the
interpretation of results, tools to plot data have been embedded in the customized GIS environment.
At first, a list of parameters to be plotted is selected, then the corresponding measurements are
automatically plotted in diagrams juxtaposed one above the other above the rectified image of the
flow. The image helps in linking data to features observed on the flow unit.
An example of the display of the data is provided in Fig. 11, which shows two series of data
obtained from two flow units: the northernmost 16 September 2004 flow unit and a flow unit
belonging to the 1999 flow field emplaced at Mount Etna in October-November 1999 westward
from the Bocca Nuova crater (Wright et al., 2001; Harris and Neri, 2002; Calvari et al., 2002;
Tarquini and Favalli, 2011; see also Fig. 1). The 1999 flow unit has been identified and processed
exactly in the same way as the already discussed 2004 flow unit, using the 2004 DEM.
In Fig. 12 a comprehensive picture of the processed 1999 flow unit is shown according to
observations of Wright et al. (2001), Harris and Neri (2002) and Tarquini and Favalli (2011). It is
clear that Harris and Neri, (2002) worked hard to glean a few morphometric measurements on the
field (“under intolerable conditions”) along the same flow unit processed here, belonging to the
flow field segment emplaced in 17 hours on 28 October 1999. The first 450-500 m of this flow unit,
downhill from the western rim of the crater, have probably been hidden by late evolutions of the
flow field, and are not recognizable on the basis of our DEM analysis. In Fig. 12e, f we selected the
10 elevation profiles that can be compared with measurements and sketches presented by those
authors. This comparison highlights a substantial agreement between the two datasets.
4. Results
Fig. 11 provides an inclusive illustration of flow units’ morphometry. The presented layout of data
allows straightforward analyses of the relationships between different parameters measured in the

ACC
EPTE
D M
ANU
SCR
IPT
ACCEPTED MANUSCRIPT
same flow unit as well as of the relationship of the same parameters measured in different flow
units. In this section the main features emerging from the whole dataset are outlined.
4.1. Channel width
Mazzarini et al. (2005), for the 2004 lava flow unit, found an average downhill increase of the
channel width together with opposite average decrease of the pre-emplacement slope. Given the
consistency of the two datasets, this pattern is confirmed here for the 2004 flow unit. A similar
pattern is consistent with a general negative correlation between slope and channel width. This
model is consistent also with the 1999 flow unit morphometry, especially in the first (measured)
portion of it (Fig. 12): between 100 and 500 m along-flow, the channel width decreases from 30-40
m to ~10 m, while the pre-emplacement slope increases from ~10° to 30°; afterwards, in the
remaining ~1000 m of channelized flow, channel width (while fluctuating by an amplitude of about
10 m) gradually increases up to 20-30 m, whereas the slope roughly decreases from an average of
30° to an average of 25°.
4.2. Flow unit width
In the second half of the 2004 flow unit, local maxima in flow width and local minima in pre-
emplacement slope are aligned, as well as local minima in flow width and local maxima in pre-
emplacement slope (e.g. relative maxima in slope at 1000, 1300, 1550 m; relative minima in slope
at 1150, 1400, 1620 m downflow). To a lesser extent, this pattern is also apparent in the final 500-
600 m of the 1999 flow unit (e.g. relative minima in slope at about 900 and 1250 m downflow), but
also at the beginning of the same flow unit (the minimum in slope at about 200 m downflow). The
average thickness of flow units is rather well correlated with its width, with main (and at times even
secondary) peaks located at the same downflow distance.

ACC
EPTE
D M
ANU
SCR
IPT
ACCEPTED MANUSCRIPT
4.3. Flow unit average thickness and flow section area
The flow section area can be obtained multiplying flow unit width times its average thickness,
hence it is not surprising that, given the above-mentioned correlation between average thickness and
width, the plot of the flow section area looks like a stretched version of the plot of the flow average
thickness (with minor exceptions). In any case, we show both plots, given the relevance of both
parameters.
As expected from the above, the second half of the flow section area diagram for the 2004 unit
shows positive peaks aligned with negative peaks in slope. A similar relation holds for the 1999
flow unit (i.e. peaks at 150, ~750, ~900, ~1250 m). Observing in more detail, it seems the positive
peaks in the section area somewhat precede the negative peaks in the slope by 20-30 m, with few
exceptions.
4.4. Levee heights
Levee heights measured over the flow baseline have a pattern that mimics the one of the average
flow unit thickness. Due to the typical flow unit geometry, when levees are well formed and the
lava stream is well constrained inside the channel, the tops of the levees tend to be the points of
maximum thickness, as occurs (with few exceptions) in the two cases shown. The record of heights
of left and right levees permits flow asymmetry investigation. As an example, a narrow bending at
about 150 m downflow in the 1999 flow unit originates a higher right levee, due to the “pile of
overflow units capping the levee at a bend” described by Harris and Neri (2002, see also Fig. 12).
Similarly, between 1300 and 1500 m along the 2004 unit, the higher right levee is probably linked
to the local gentle leftward bending. The measurements of levee heights, with reference to the

ACC
EPTE
D M
ANU
SCR
IPT
ACCEPTED MANUSCRIPT
height of the channel, are too sparse and the method and/or the resolution of the DEM need to be
improved to provide sound interpretations.
4.5. Levee slopes
The outward and inward average slopes of the levees are measured for each profile (Fig. 5). The
levee slopes appear to be particularly noisy; however, maximum values are very similar in both
cases (~30°).
Flow dynamics generate variations in this value, for example where small overflows widen
the flow locally (e.g. at ~1400 m downflow in the 2004 flow unit). When the levee heights are
comparable to the pixel size, the noise becomes more important. This also explain the very noisy
trend of inward slopes. In the latter case, in order to collect more accurate results, a higher
resolution DEM is necessary. In any case, our measurements suggest that the inward slope is higher
than the outward slope (Fig. 11).
5. Discussion
We will start the discussion by outlining the general morphometric patterns emerging from our data,
then we will highlight the different circumstances that led to the formation of the two flow units, we
will then relate morphological evidence to the emplacement history of the two cases, and finally we
will discuss the relevance of this technique in supporting lava flow modeling on Earth and other
planets.
5.1. General morphological patterns in flow units

ACC
EPTE
D M
ANU
SCR
IPT
ACCEPTED MANUSCRIPT
Overall, our data supports an inverse relation between slope and channel width (i.e. a decrease in
slope is associated with an increase in channel width). But this relation seems to hold only for the
large scale trend, while sudden changes in slopes within 100-200 m (e.g. at half length in 1999 flow
unit and in the distal portion of 2004 flow unit), which can attain up to 10° (Fig. 11), do not affect
channel width. On the other hand, similar high frequency changes seem to affect flow unit width
noticeably, which shows an inverse relation with slope especially in the second half of the flow. The
short wavelength component of the slope also shows an inverse relationship with flow unit average
thickness, flow unit section area, and levee heights. This relationship holds, with few exceptions,
throughout the whole flow unit.
This evidence suggests that the stream of lava, which builds up the channel and then flows
inside it, has enough inertia to overcome small-scale variations of boundary conditions such as
slope. Therefore, the “flow unit system” reacts to a sudden decrease in slope by increasing the
height of levees, which in turn results in widening the flow unit (the repose angle of levees being
roughly constant). The viscosity of the lava stream, when the downstream portion of the flow
decelerates due to a lower slope, propagates a deceleration wave in the flow uphill, which may
explain why the positive peaks in the section area tend to precede, by some tenths of meters, the
negative peaks in the slope.
5.2. Different effusive styles in 1999 Bocca Nuova and 2004 flank eruption
The processed 2004 flow unit represents the very early phase of a flank eruption which quietly
emplaced some 40 × 106 m
3 of lava over about six months (Allard et al., 2006). The relative
effusive regime is moderate and relatively constant, yielding on average some 2.5 m3 s
-1 (Tarquini
and Favalli, 2011). Burton et al. (2005) explained this eruption as a passive emission of degassed
lava from the very shallow plumbing system of the volcano. The 1999 effusive activity from the
Bocca Nuova crater, instead, is completely different, being characterized by 11 separate overflows

ACC
EPTE
D M
ANU
SCR
IPT
ACCEPTED MANUSCRIPT
spaced in time with pauses in lava emission (Harris and Neri, 2002). The emplacement of single
overflows lasted from hours to three days and was often accompanied by Strombolian paroxysms.
Overflows from the crater were sustained by vigorous lava supplies (up to ~90 m3 s
-1 , Harris and
Neri, 2002). Each overflow formed its own relatively thin, short-lived flow units, which
cumulatively originated a fairly thin flow field, even when flow units overlapped each other
(average thickness ~6 m, Tarquini and Favalli, 2010). The 2004 flow unit imaged on 16 September,
instead, was successively completely buried by the following activity which locally piled up a series
of lava flows up to 70 m thick (average thickness ~14 m, Tarquini and Favalli, 2010).
Overall, the two flow units processed here are a picture of two markedly different effusive
styles: (i) the mild discharge of lava drained from a lateral opening of the volcano imaged at the
beginning (September 2004), and (ii) the vigorous, intermittent overflow from a summit crater
(October-November 1999 Bocca Nuova activity) imaged after their complete emplacement.
5.3. Emplacement styles and morphological evidence
Wright et al. (2001) studied in detail the flow field segments emplaced on 27-28 October 1999 from
a remote-sensing perspective. These authors analyzed the short-wave infrared radiance (SWIR) of a
Landsat 7 Enhanced Thematic Mapper + (ETM+) image acquired on 28 October 1999 at
approximately 10:00 a.m. LT (Fig. 12). According to their work, in this image there are two
distinctive high temperature signals above the background: a moderately high value can be
attributed to fairly cooled flow units which already ceased to move (red hues in Fig. 12a, flows A
and B), while very high to saturated values can be ascribed to very hot, still emplacing flow units
(green hues and black in Fig. 12a, flow C). According to Harris and Neri (2002), A and B in Fig.
12a refer to episode 6, and emplaced on 27 October, while C refers to episode 7, and was still
emplacing at the time of image acquisition.
ACC
EPTE
D M
ANU
SCR
IPT
ACCEPTED MANUSCRIPT
The comparison between the Landsat image and the map of the final 1999 flow field presented
by Tarquini and Favalli (2011) shows that all the five flow unit fronts identified by the moderately
high SWIR values had actually ceased to move at the time of image acquisition (Fig. 12a, b; Fig.
13), confirming the correctness of the SWIR radiance analysis.
Wright et al. (2001) further expanded the implication of the observed cooling, and assuming a
sustained lava supply, they argued that it could have forced flow fronts to stop. But the sole
evidence of cooling is not enough to determine a cooling-limited flow. In fact, several authors, for
the above-mentioned Bocca Nuova effusive activity, described a pulsed (as opposed to sustained)
lava supply (Calvari et al., 2002; Calvari and Pinkerton, 2002; Harris and Neri, 2002; Behncke et
al., 2003). Harris and Neri (2002) estimated the lava supply for the 28 October effusive episode in
13-16 m3 s
-1, and Calvari et al. (2002) proposed that the observed effusive style led to the
emplacement of volume-limited flow units.
Harris et al. (2007), instead, implicitly assumed that the 2004 flow unit processed here is
cooling limited. Strictly speaking, as the flow was still active at that time, it was not even certain
that the front had already ceased to advance reaching its maximum extension downhill, either
because of cooling or because of an interrupted lava supply.
Certainly, flow morphology may provide a variety of clues to unravel the emplacement
conditions (Heslop et al., 1989; Wilson and Parfitt, 1993; Kauahikaua et al., 2002; Ventura and
Vilardo, 2008; Zimbelman et al., 2008; Harris et al. 2009; Favalli et al., 2010b; Stevenson et al.,
2012). With respect to cooling- or volume-limited flows, Pinkerton and Wilson (1994) pointed out
that volume limited flow units show a drained channel, while cooling-limited ones are characterized
by a thickened front. According to this view, both the processed flow units seem limited by an
interrupted lava supply, as the channels are well drained (apart from minor sectors of brimful
channel) and the flow fronts are not thickened (Fig. 11).
Although data for the first ~500 m of the 1999 flow unit is missing, Fig. 11 highlights
interesting differences between the two flow units. The 1999 flow is considerably thinner than the

ACC
EPTE
D M
ANU
SCR
IPT
ACCEPTED MANUSCRIPT
2004 one (3.8 and 7.2 m thick on average, respectively). Examining the data in greater detail, in the
2004 flow the thickness tends to increase downflow up to 1000-1100 m downhill, and then it tends
to decrease up to the flow front 700-800 m ahead. The thickness of the 1999 flow, instead, shows
no clear trend.
As discussed above (section 5.1), the width of the channel seems to be the leading parameter,
being less subject to changes in boundary conditions. In Fig. 14 we explore the relation between (i)
flow width vs. channel width and (ii) flow section area vs. channel width for the two flows. As
expected, the difference is evident. Indeed, the 2004 flow unit had the time (5-6 days) and the
moderate, relatively regular magma supply conditions (2-4 m3 s
-1, Harris et al. 2007) to grow in
height, while the 1999 flow unit emplaced quickly as a single, vigorous surge overflowing from a
crater experiencing a frantic activity (Calvari and Pinkerton, 2002; Harris and Neri, 2002; Behncke
et al., 2003). When both parameter ratios plotted in Fig. 14 are very high, a distinctive hung flow
unit is present in the 2004 flow, characterized by a narrow channel “suspended” up to 15-20 m
above the pre-emplacement topography (e.g. between 500 and 600 m downflow, just uphill from
the overflows). We propose that for the 2004 flow a similar hung flow unit is the morphological
evidence that a moderate, regular lava supply lasted for several days.
5.4. Detailed morphometry and flow modeling
The emplacement of lava flows on Earth and other planets is a very complicated phenomenon
which has stimulated a number of works (e.g. Guest et al., 1987; Lipman and Banks, 1987; Hon et
al., 2003; Glaze and Baloga, 2006; Harris et al., 2009). Some authors approached the problem of
lava flow behavior from an analytical point of view (e.g. Valerio et al. 2008, 2011), while others
start from the collection of actual morphometric data to apply simplified models (e.g. Baloga and
Glaze, 2008; Glaze et al., 2009). Both approaches provided insightful results which can contribute
to our understanding of the evolution of lava flows. A common assumption in these models is that

ACC
EPTE
D M
ANU
SCR
IPT
ACCEPTED MANUSCRIPT
of a steady state system (e.g. for lava supply). Nevertheless, it is clear that the typically unsteady
evolution with time of natural flows (e.g. Lautze et al., 2004; Baily et al., 2006; Favalli et al.,
2010a) tends to undermine or constrain the effectiveness of similar models. The continuous,
systematic collection of detailed morphometric measurements along lava flow units (such as shown
here in Fig. 11) provides the opportunity to improve significantly the calibration and validation of
similar computational models. In addition, the enhanced morphological data collection can also be
used to better configure the geometric boundary conditions in analytical models (e.g. channel width
and depth). The presented technique can therefore provide an improved benchmark or a precise
constraint for existing models for lava flow emplacement. Furthermore, the newly available data
can inspire, per se, new models and concepts for an enhanced understanding of lava flow behavior.
This point will be explored in future works.
6. Concluding remarks
We presented and validated a semi-automatic, GIS-based procedure for the morphometric analysis
of single lava flow units. Provided topography at the necessary resolution, this procedure yields a
thorough, detailed morphological description of lava flows expressed on a flow axis-reference
system. The systematic application of this procedure over a number of different flow units may
provide the necessary layout of data to better constrain numerical modeling of a complex
phenomenon such as lava flow emplacement.
We used this new procedure along with a LIDAR-derived, 2-m-resolution topography of
Mount Etna, to process two lava flow units: one formed during the October-November 1999
effusive activity from the Bocca Nuova crater; and another which was forming at the beginning of
the 2004-2005 flank eruption.

ACC
EPTE
D M
ANU
SCR
IPT
ACCEPTED MANUSCRIPT
The results obtained show that the width of the channel seems to accommodate first order
trends of the pre-emplacement slope along the flow unit axis, while it is hardly or not affected by
high frequency changes in slope. In contrast, flow unit width and flow unit thickness are clearly
influenced by small scale changes in slope.
The different emplacement histories of the two flow units, documented by the existing
literature and confirmed by our analyses, are reflected by two contrasting morphologies: the 1999
flow unit is relatively thin (3.8 m on average) and has a low ratio between flow unit width and
channel width (2.3 on average); while the 2004 flow unit is considerably thicker (7.2 m on average)
and has a higher ratio between flow unit width and channel width (3.2 on average).
The application of the presented procedure is promising, and can potentially contribute to a
better understanding of lava flow emplacement on Earth and other planets.
Acknowledgements
The authors wish to thank D. Pyle for the thorough review of the manuscript and L. Wilson
for kind, supportive editorial handling.
References
Allard , P., Behncke, B., D'Am ico , S., Ner i, M., Gam b ino , S., 2006. Moun t Et na 1993–2005:
anat om y o f an evo lving erup t ive cycle. Ear t h Science Review s 78, 85–114.
d o i:10.1016/j.earscirev.2006.04.002.
And ron ico , D., Lod at o , L., 2005. Ef f usive act iv it y at Moun t Et n a vo lcan o (It aly) d ur ing t he 20t h
cen t ur y: A con t r ib u t io n t o vo lcan ic h azard assessm en t . Nat ural Hazard s 36, 407 –443, d o i:
10.1007/s11069-005-1938-2.

ACC
EPTE
D M
ANU
SCR
IPT
ACCEPTED MANUSCRIPT
Ap p legar t h , L.J., Pin ker t on , H., Jam es, M.R., Calvar i, S., 2010. Morp ho logical com p lexit ies and
hazard s d ur ing t he em p lacem en t o f channel-f ed ` a` ā lava f low f ield s: A st ud y o f t he 2001
low er f low f ield on Et n a. Bull. Vo lcano l. 72, 641–656. d o i: 10.1007/s00445-010-0351-1.
Bailey, J.E., Har r is, A.J.L., Dehn , J., Calvar i, S., Ro w land , S.K., 2006. The chang ing m orp ho logy o f
an op en lava ch annel o n Mt . Et n a. Bull. Vo lcan o l. 68, 497–515.
Baloga, S.M., Glaze, L.S., 2008. A self -rep licat ion m od el f o r long chann elized lava f low s on t h e
Mars p lains. J. Geop hys. Res., 113, E05003, d o i:10.1029/2007JE002954.
Behncke, B., Ner i, M., Carn iel, R., 2003. An excep t ion al case o f end ogenous lava d om e grow t h
sp aw n ing p yroclast ic avalanches: t he 1999 Bocca Nuova erup t ion o f Mt . Et na (It aly). J.
Vo lcano l. Geo t herm . Res. 124, 115–128.
Behncke, B., Ner i, M., Nagay, A., 2005. Lava f lo w hazard at Moun t Et na (It aly): New d at a f rom a
GIS-b ased st ud y, in Manga, M., an d Ven t ura, G., ed s., Kin em at ics an d d yn am ics o f lava
f low s: Geo l. Soc. Am . Sp ec. Pap . 396, 189–208.
Bur t on , M.R., et al., 2005. Et n a 2004–2005: an archet yp e f o r geod ynam ically-con t ro lled
ef f usive erup t ions. Geo p hys. Res. Let t . 32, L09303. d o i:10.1029/2005GL022527.
Calvar i, S., Co lt elli, M., Ner i, M., Pom p ilio , M., Scr ib ano , V., 1994. The 1991–93 Et na erup t ion :
ch rono logy an d geo log ical ob servat ions. Act a Vulcano l. 4, 1–15.
Calvar i, S., Pin ker t on , H., 1998. Fo rm at ion o f lava t ub es and ext ensive f low f ield d ur ing t he
1991–93 erup t ion o f Moun t Et na. J. Geop hys. Res. 103, 27291–27302.
Calvar i, S., Pin ker t on , H., 2002. Inst ab ilit ies in t he sum m it region o f Moun t Et na d ur ing t he
1999 erup t ion . Bull. Vo lcano l. 63, 526–535.
Calvar i, S., Ner i, M., Pin ker t on , H., 2002. Ef f usion rat e est im at ions d ur in g t he 1999 sum m it
erup t ion on Moun t Et na, and grow t h o f t w o d ist inct lava f low f ield s. J. Vo lcano l.
Geo t herm . Res. 119, 107–123.
Csat ho , B., Schen k, T., Kyle, P., Wilson , T., Krab ille, W.B., 2008. Airb o rne laser sw at h m ap p ing o f
t he sum m it o f Ereb us vo lcano , An t arct ica: ap p licat ions t o geo logical m ap p ing o f a
vo lcano . J. Vo lcano l. Geo t herm . Res. 177, 531–548. d o i:10.1016/j.jvo lgeo res.2008.08.016.

ACC
EPTE
D M
ANU
SCR
IPT
ACCEPTED MANUSCRIPT
Favalli, M., Paresch i, M.T., 2004. Dig it al elevat ion m od el const ruct ion f rom st ruct ured
t op ograp h ic d at a: t he DEST algo r it hm . J. Geop hys. Res. 109, F04004.
d o i:10.1029/2004JF000150.
Favalli, M., Fo rn aciai, A., Paresch i, M.T., 2009. LIDAR st r ip ad just m en t : ap p licat ion t o vo lcan ic
areas. Geom orp ho logy 111, 123–135. d o i:10.1016/j.geom orp h .2009.04.010.
Favalli, M., Fo rnaciai, A., Mazzar in i, F., Har r is, A.J.L., Ner i, M., Behn cke, B., Paresch i, M. T.,
Tarq uin i, S., Bo sch i, E., 2010a. Evo lut ion o f an act ive lava f low f ield using a m ult it em p oral
LIDAR acq u isit ion , Journal o f Geo p hysical Research , 115, B11203. d o i:10.1029/2010JB007463.
Favalli, M., Har r is, A., Fo rnaciai, A., Paresch i, M.T., Mazzar in i, F., 2010b . The d ist al segm en t o f
Et na’s 2001 b asalt ic lava f low . Bullet in o f Vo lcano logy 72, 119-127. d o i:10.1007/s00445-009-
0300-z.
Favalli, M., Tarq u in i, S., Fo rnaciai, A., 2011. DOWNFLOW cod e and Lid ar t echno logy f o r lava
f low analysis an d hazard assessm en t at Moun t Et n a. Ann . Geop hys. 54, 552–566.
d o i:10.4401/ag -5339.
Fo rnaciai A., Behncke B., Favalli M., Ner i M., Tarq uin i S., Bosch i E. (2010). Det ect ing sho r t -t erm
evo lut ion o f Et nean sco r ia cones: a LIDAR-b ased ap p ro ach , Bullet in o f Vo lcano logy, 72,
1209–1222. d o i:10.1007/s00445-010-0394-3.
Frazzet t a, G., Rom ano , R., 1984. The 1983 Et n a erup t ion : even t ch rono logy and m orp ho log ical
evo lut ion o f t he lava f low . Bull. Vo lcano l. 47, 1079–1096.
Glaze, L.S., Baloga, S.M., 2006. Rheo logic in f erences f rom t he levees o f lava f low s on Mars. J.
Geop hys. Res., 111, E09006, d o i:10.1029/2005JE002585.
Glaze, L.S., Baloga, S.M., Gar r y, W.B., Fagen t s, S.A., Parchet a, C., 2009. A hyb r id m od el f o r
leveed lava f low s: Im p licat ions f o r erup t ion st yles on Mars. J. Geop h ys. Res., 114, E07001,
d o i:10.1029/2008JE003278.
Go f f , J.A., Nord f jo r d , S., 2004. In t erp o lat ion o f f luvial m orp ho logy usin g channel-o r ien t ed
coo rd in at e t r ansf o rm at ion : a case st ud y f rom New Jersey shelf . Mat h em at ical Geo logy 35,
643–658.
ACC
EPTE
D M
ANU
SCR
IPT
ACCEPTED MANUSCRIPT
Guest , J.E., Kilb urn , C.R.J., Pinker t on , H., Duncan , A.M., 1987. The evo lut ion o f lava f low fields:
Observations of the 1981 and 1983 eruptions o f Moun t Et na, Sicily . Bull. Vo lcano l., 49, 527–540.
Har r is, A.J.L., Row land , S.K., 2001. FLOWGO: a kinem at ic t herm o -rheo logical m o d el f o r lava
f low ing in a channel. Bull. Vo lcano l. 63, 20–44. d o i:10.1007/ s004450000120.
Har r is, A.J.L., Ner i, M., 2002. Vo lum et r ic ob servat ions d ur in g p aroxysm al erup t ions at Moun t
Et na: p ressur ized d rain age o f a sh allow cham b er o r p ulsed sup p ly? J. Vo lcano l. Geo t herm .
Res. 116, 79–95.
Har r is, A.J.L., Bailey, J., Calvar i, S., Dehn , J., 2005. Heat loss m easured at a lava channel and it s
im p licat ion s f o r d ow n -channel coo ling and rheo logy. Geo l. Soc. Am . Sp ec. Pap . 396, 125–
146.
Har r is, A.J.L., Favalli, M., Mazzar in i, F., Paresch i, M.T., 2007. Best -f it r esult s f rom ap p licat ion o f
a t herm o-rheo logical m od el f o r ch annelized lava f low t o h igh sp at ial reso lut ion
m orp ho logical d at a. Geop hys. Res. Let t . 34, L01301. d o i:10.1029/2006GL028126.
Har r is, A.J.L., Favalli, M., Mazzar in i, F., Ham ilt o n , C.W., 2009. Const ruct ion d yn am ics o f a lava
channel. Bull. Vo lcano l. 71, 459–474. d o i:10.1007/s00445-008-0238-6.
Heslop , S.E., Wilson , L., Pinker t on , H., Head , J.W. 1989. Dynam ics o f a con f ined lava f low on
Kilauea vo lcano , Haw aii. Bull . Vo lcano l. 51, 415–432.
Hon , K., Gansecki, C., Kauah ikaua, J., 2003. Th e t ran sit ion f rom ‘A’a t o p ahoehoe crust on
f low s em p laced d ur in g t he Pu’u ‘O’o -Kup aianaha erup t ion , in Th e Pu‘u ‘O’o -Kup aianah a
Erup t ion o f Kilauea Vo lcano , Haw ai‘i: The Fir st 20 Years, ed it ed b y C. Heliker , D. A. Sw anson ,
and T. J. Takahash i, U.S. Geo l. Surv. Pro f . Pap ., 1676, 89–103.
Hulm e, G., 1974. Th e in t erp ret at ion o f lava f lo w m orp ho logy, Geop h ys. J. R. Ast ron . Soc. 39,
361–383.
Jam es, M.R., Ap p legar t h , L.J., Pinker t on , H. 2012. Lava channel roo f ing, over f low s, b reaches
and sw it ch ing : insigh t s f rom t he 2008-2009 erup t ion o f Mt . Et n a. Bull. Vo lcano l. 74, 107–
117. d o i: 10.1007/s00445-011-0513-9.
Kauah ikaua, J., Cashm an , K.V., Clague, D.A., Ch am p ion , D., Hagst rum , J.T. 2002. Em p lacem en t
o f t he m o st recen t lava f low s on Huala–lai Vo lcano , Haw ai‘i. Bull. Vo lcano l. 64, 229–253.

ACC
EPTE
D M
ANU
SCR
IPT
ACCEPTED MANUSCRIPT
Kilb urn , C.R.J., Lop es R.M.C., 1988. The grow t h o f aa lava f low f ield s on Moun t Et n a, Sicily , J.
Geop hys. Res., 93, 14,759–14,772.
Laut ze, N.C., Har r is, A.J.L., Bailey, J.E., Rip ep e, M., Calvar i, S., Dehn , J., Row land , S., 2004. Pulsed
lava ef f usion at Moun t Et na d ur in g 2001. J. Vo lcano l. Geo t herm . Res. 137, 231 –246.
Lip m an , P.W., Ban ks, N.G., 1987. ‘a‘¯a f low d yn am ics,Maun a Loa 1984. In : Decker RW, Wr igh t ,
T.L., St auf f er , P.H. (ed s) Vo lcan ism in Haw aii, vo l 1350. US Geo l. Surv. Pro f . Pap ., 1527–1567.
Mazzar in i, F., Paresch i, M.T., Favalli, M., Iso la, I., Tarq uin i, S., Bosch i, E., 2005. Mo rp ho logy o f
b asalt ic lava channels d ur ing t he Mt . Et na Sep t em b er 2004 erup t io n f rom air b o rne laser
alt im et er d at a. Geop hys. Res. Let t 32, l04305. d o i:10.1029/2004Gl02181.
Mazzar in i, F., Paresch i, M.T., Favalli, M., Iso la, I., Tarq u in i, S., Bosch i, E., 2007. Lava f low
id en t if icat ion and ag ing b y m eans o f lid ar in t ensit y: Moun t Et n a case. J. Geop hys. Res. 112,
B02201. d o i:10.1029/2005JB004166
Ner i M., Mazzar in i F., Tarq uin i S., Bisson M., Iso la I., Behncke B., Paresch i M. T., 2008. The
changin g f ace o f Moun t Et na’s sum m it area d ocum en t ed w it h Lid ar t echno logy, Geop hys.
Res. Let t 35, L09305. d o i:10.1029/2008GL033740.
Pinker t on , H., Wilson , L., 1994. Fact o r s con t ro lling t he lengt hs o f channel -f ed lava f low s. Bull
Vo lcano l 56, 108–120.
Pyle, D.M., Ellio t t , J.R., 2006. Quan t it at ive m orp ho logy, recen t evo lu t ion , and f u t ure act iv it y
o f t he Kam en i Island s vo lcano , San t o r in i, Greece. Geosp here 2, 253–268.
d o i:10.1130/GES00028.1.
Sp arks, R.S.J., Pinker t o n , H., Hulm e, G., 1976. Classif icat ion and f o rm at ion o f lava levee on
Moun t Et n a Sicily . Geo logy 4, 269–271.
St evenson , J.A., Mit ch ell, N.C., Cassid y, M., Pinker t on , H. 2012. Wid sp read in f lat ion an d
d rain age o f a p ahoehoe f low f ield : t he Nesjah raun , Iingvellir , Icelan d . Bull. Vo lcano l. 74,
15–31. d o i:10.1007/s00445-011-0482-z.
Tallar ico , A., Dragon i, M., 1999. Viscous New t on ian lam in ar f low in a r ect angular channel:
Ap p licat ion t o Et n a lava f low s, Bull. Vo lcano l. 61, 40–47.

ACC
EPTE
D M
ANU
SCR
IPT
ACCEPTED MANUSCRIPT
Tarq uin i, S., Iso la, I., Favalli, M., Mazzar in i, F., Bisson , M., Paresch i, M.T., Bosch i, E., 2007.
TINITALY/01: a new t r ian gular ir regular net w ork o f It aly. Ann . Geop hys. 50, 407 –425.
Tarq uin i, S., Favalli, M., 2010. Changes o f t he su scep t ib ilit y t o lava f lo w invasion ind uced b y
m orp ho logical m o d if icat ions o f an act ive vo lcano : t he case o f Moun t Et n a, It aly. Nat ural
Hazard s 54, 537–546. d o i:10.1007/s11069-009-9484-y.
Tarq uin i S. and Favalli M., 2011. Map p ing and DOWNFLOW sim ulat ion o f recen t lava f low f ield s
at Mo un t Et n a, J. Vo lcano l. Geo t h . Res. 204, 27–39. d o i:10.1016/j.jvo lgeo res.2011.05.001.
Tarq uin i S., Vinci, S., Favalli M., Doum az, F., Fo rn aciai A., Nann ip ier i, L., 2012. Release o f a 10 -m -
reso lu t ion DEM f o r t he It alian t er r it o r y: Co m p ar ison w it h g lob al-coverage DEMs an d
anaglyp h -m od e exp lo rat ion via t he w eb . Com p ut ers & Geosciences 38, 168–170.
d o i:10.1016/j.cageo .2011.04.018.
Valer io , A., Tallar ico , A., Dragon i, M., 2008. Mechan ism s o f f o rm at ion o f lava t ub es. J. Geop hys.
Res., 113, B08209, d o i:10.1029/2007JB005435.
Valer io , A., Tallar ico , A., Dragon i, M., 2011. Ef f ect s o f t he curvat ure o f a lava ch annel on f low
d ynam ics and crust f o rm at ion . Geo p hys. J. In t . 187, 825-832. d o i:10.1111/j.1365-
246X.2011.05166.x.
Ven t ura, G., Vilard o , G., 2008. Em p lacem en t m echan ism o f gravit y f lo w s in f er red f rom h igh
reso lu t ion Lid ar d at a: t he 1944 Som m a–Vesuvius lava f low (It aly). Geom orp ho logy 95, 223–
235.
Wad ge, G., 1978. Ef f usion rat e and t he sh ap e o f aa lava f low -f ield s o n Moun t Et na. Geo logy 6,
503–506
Walker , G.P.L., 1971. Com p ound an d sim p le lava f low s an d f lood b asalt s. Bull. Vo lcano l. 35,
579–590.
Wilson , L., Par f it t , E.A., 1993. Th e f o rm at ion o f p erched lava p ond s on b asalt ic vo lcanoes: t he
in f luence o f f low geom et ry on coo ling -lim it ed lava f low lengt h s. J. Vo lcano l. Geo t h . Res.
56, 113–123.

ACC
EPTE
D M
ANU
SCR
IPT
ACCEPTED MANUSCRIPT
Wrigh t , R., Flynn , L.P., Har r is, A.J.L., 2001. Evo lut ion o f lava f low -f ield s at Moun t Et n a, 27–28
Oct ob er 1999, o b served b y Land sat 7 ETM+ . Bull. Vo lcano l. 63, 1 –7.
d o i:10.1007/s004450100124.
Zim b elm an , J.R., Gar r y, W.B., Johnst on , A.K., William s, S.H., 2008. Em p lacem en t o f t he 1907
Mauna Loa b asalt f low as d er ived f rom p recision t op o grap hy an d sat ellit e im ag ing. J.
Vo lcano l. Geo t h . Res. 177, 837–847. d o i:10.1016/j.jvo lgeo res.2008.01.042.
Figure captions
Fig. 1. Shaded relief of Mount Etna, Italy. Dark grey area shows the extent of the DEM obtained
from the 16 September 2004 LIDAR survey. Thick black contours show the coverage of: (i) the
flow field formed as a consequence of the overflow from the Bocca Nuova crater in October-
November 1999, and (ii) the flow field formed by the September 2004 – March 2005 flank eruption.
SC indicates Summit Craters, and VdB indicates the Valle del Bove valley. Projection, UTM zone
32N; Datum WGS84.
Fig. 2. Conceptual scheme and definitions of the flow-unit morphological quantities. (a) Definitions
after Mazzarini et al. (2005): arrows show the hand-traced points identifying the boundaries of the
flow and levee positions. Wc: distance between levee apexes; Dc: channel depth; Hl: levee heights
over the baseline; Tf: thickness of lava flow below the channel surface. (b) Conceptual scheme and
definitions introduced in this work. Points of maximum curvature, either concave (V) or convex (A)

ACC
EPTE
D M
ANU
SCR
IPT
ACCEPTED MANUSCRIPT
are selected on the profile. These points are used as key-points for morphological measurements
instead of the hand-traced points of scheme (a).
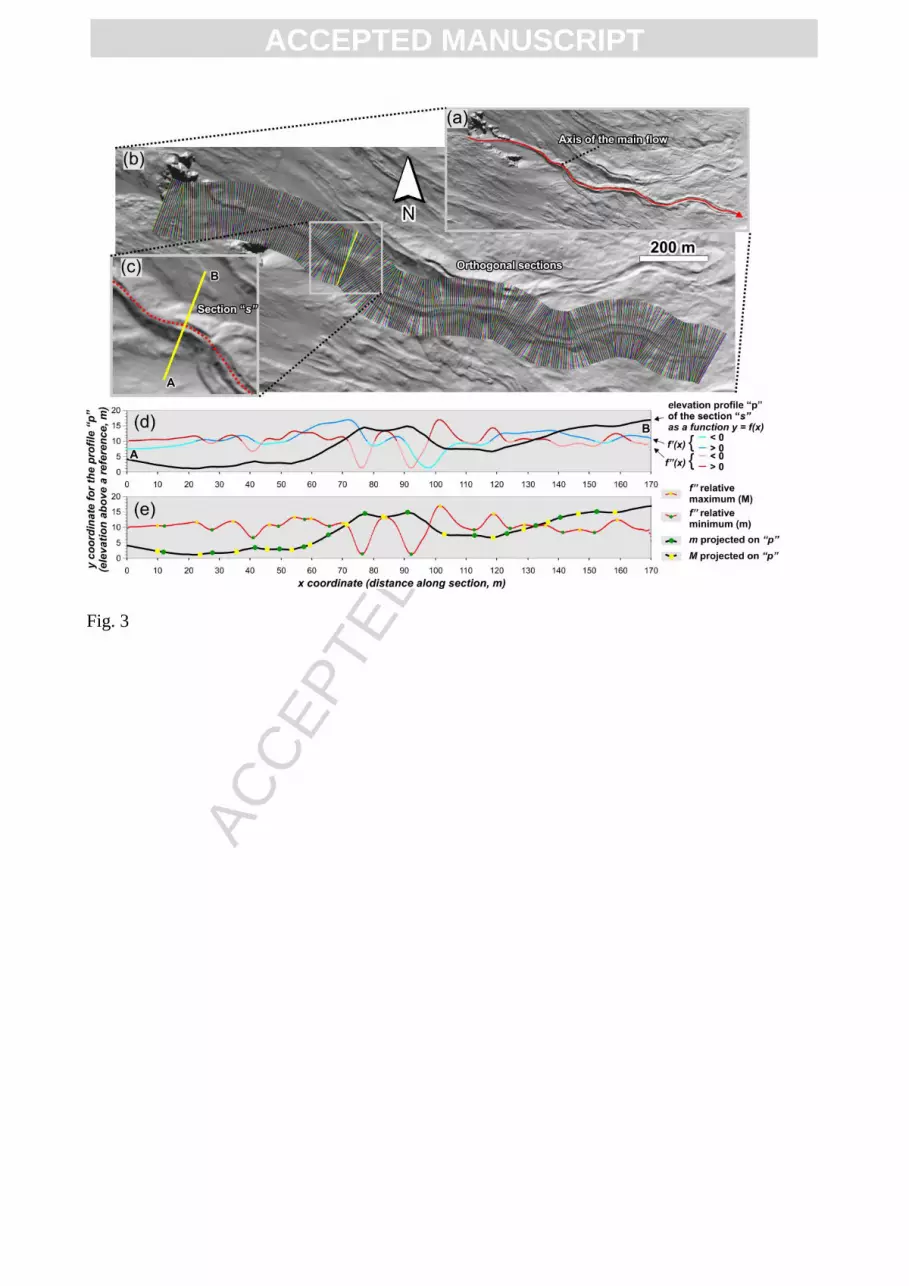
Fig. 3. From the flow axis to processed elevation profiles; (a) the hand-traced axis of the flow unit
(red line); (b) the whole set of sections traced orthogonally to the flow axis (every 2 m along flow);
(c) zoom in the selected section “s”; (d) profile: “p” (black line) derived from the section “s” in the
form of a function y = f(x), f’ (blue-light blue line), f’’ (pink-red line); (e) relative maxima (yellow
points) and minima (green points) of f’’ are set on the second derivative (red line) and then
projected onto the original profile (not densified, black line). Due to the noise intrinsically
introduced by the derivative operator, the derivative has been applied on a densified, splined profile.
This explains why a small shift at times exists between derivative peaks and their projection onto
the original nodes (not densified) of the profile.
Fig. 4. An example of the customized downflow reference system used to work with profiles: (a) all
the profiles obtained from a flow unit are aligned and displaced one below the other; (b) points of
relative maxima (yellow) and minima (green) of the second derivative are set on profiles; (c) the
points identified in (b) are assigned with a color code ranked according to maxima (concavity,
values increase from yellow to red) and minima (convexity, values increase from green to blue) of
the second derivative; (d) morphometric features of the flow unit are obtained by snapping together
selected tie-points on adjacent profiles. No vertical exaggeration is used.
Fig. 5. Morphometric parameters measured from the mathematical processing of the elevation
profile: Wc = channel width; Wf = flow width; Dc_r = channel depth (from the right levee); Dc_l =

ACC
EPTE
D M
ANU
SCR
IPT
ACCEPTED MANUSCRIPT
channel depth (from the left levee); So_r = outward slope of the right levee; Si_r = inward slope of
the right levee; So_l = outward slope of the left levee; Si_l = inward slope of the left levee. Left and
right are identified with respect to flow direction. Slopes are calculated as the absolute value of
arctan (Δy/Δx), where Δy and Δx are the elevation difference and the abscissa difference,
respectively between the two tie-points which limit the relative profile’s segment (different gray
level in figure).
Fig. 6. Channel and flow widths measured by Mazzarini et al. (2005) compared with the values
calculated here. To support the interpretation of the plots, a shaded relief image of the flow unit
obtained in an along-the-flow coordinate system is aligned with the plots. Colors show the thickness
of the flow unit calculated over the flow baselines (section 3.2); s1, s2, etc. refer to the position of
the profiles of Fig. 10. Data obtained in the present work is shown without any averaging or
smoothing.
Fig. 7. Scheme of baseline interpolation starting from an actual elevation profile (s7 in Fig. 9).
Arrows mark flow-unit margins (e1 and e2). From e1 and e2, straight lines are drawn, towards the
center of the flow unit, with the angular coefficient calculated from the best fit of the nearest
portions of the profile (i.e. from e1 and e2 outwards; (a)). The points k1 and k2 are taken over these
straight lines at 1/3 the distance between e1 and e2, from the two edges inwards. Additional points a1
and a2 are the midpoints of segments e1-k1 and e2-k2 (b). A further point a3 is taken as the midpoint
of the segment k1-k2 lowered to the minimum elevation between k1 and k2. The polyline e1, a1, k1,
a3, k2, a2, e1 is a preliminary baseline, which is then splined and, optionally, further modified to
derive the final baseline (c).

ACC
EPTE
D M
ANU
SCR
IPT
ACCEPTED MANUSCRIPT
Fig. 8. Main morphometric parameters based on the presence of the baseline: Hl_r = right levee
height; Hl_l = left levee height; Tf = thickness of the flow section below the lower point inside the
channel; gray area shows the whole section of the flow unit (between the baseline and the profile
itself).
Fig. 9. Downflow slopes computed along the flow axis over the 1998 DEM (Mazzarini et al., 2005)
compared with the slopes calculated here by using the obtained baselines. See caption of Fig. 6 for
the image at the bottom and related color table; s1, s2, etc. refer to the position of the profiles of Fig.
10.
Fig. 10. Flow unit’s section areas obtained by using baselines and DEMs comparison. The plot
shows the area of flow unit sections identified by the baselines calculated here and the area of the
flow section inferred from the elevation profiles over the 1998 and 2004 DEMs (i.e. the area
between the two profiles, dashed areas shown in profiles s1 and s7). See caption of Fig. 6 for the
image below the main plot and related color table; s1, s2, etc. refer to the position of the sections
used to obtain the 14 profiles shown below. See main text for discussion.
Fig. 11. Summary-plot of data obtained from the two processed flow units. See caption of Fig. 6 for
the images at the bottom and related color table.

ACC
EPTE
D M
ANU
SCR
IPT
ACCEPTED MANUSCRIPT
Fig. 12. The 28 October 1999 flow unit illustrated in previous works. (a) Landsat 7 ETM+ redrawn
after Fig. 1 in Wright et al. (2001). (b) the 1999 Bocca Nuova flow field mapped by Tarquini and
Favalli (2011, magenta line) is overlaid to the previous image, and the yellow arrows fA1, fA2, fA31,
fB1, fB2 point to the fronts of five different units identified in (a) by reddish colors (due to a
distinctive SWIR radiance); the thick white line identifies the axis of the 1999 flow unit selected for
processing in this work. (c) Zoom on the DEM difference map (2004 DEM – 1998 DEM) presented
by Tarquini and Favalli (2011), margins of the flow unit obtained here are in green. (d) Slope map
obtained from the 2004 DEM, red dotted line is the flow unit axis; sections a-k (white dashed lines)
identifies the profiles shown in (e). (e) Sketches redrawn after Harris and Neri (2002) compared
with elevation profiles over the 2004 DEM (red lines), green circles show the position of the
channel margins derived by applying the presented procedure. (f) Zoom in the first part of the
channel and flow widths plots presented in Fig. 11, where data from Harris and Neri (2002) have
been added for direct comparison (red circles).
Fig. 13. Zoom on the fronts of flow unit A of Fig. 12b. (a) The DEM difference map (2004 DEM –
1998 DEM) with the correction (green line) of an evident oversight in the map of the 1999 flow
field which overflowed from Bocca Nuova presented by Tarquini and Favalli (2011; black line).
The DEM difference map shows that fA1 ceased to move at the green line, which compares well
with the SWIR radiance map in (b).
Fig. 14. Ratios between morphometric parameters for the two analyzed flow units. High values of
both ratios (gray strips) highlight where a characteristic hang flow unit is present in the 2004 flow.
See caption of Fig. 6 for the images at the bottom and related color table.

ACC
EPTE
D M
ANU
SCR
IPT
ACCEPTED MANUSCRIPT
Fig. 1

ACC
EPTE
D M
ANU
SCR
IPT
ACCEPTED MANUSCRIPT
Fig. 2
ACC
EPTE
D M
ANU
SCR
IPT
ACCEPTED MANUSCRIPT
Fig. 3

ACC
EPTE
D M
ANU
SCR
IPT
ACCEPTED MANUSCRIPT
Fig. 4

ACC
EPTE
D M
ANU
SCR
IPT
ACCEPTED MANUSCRIPT
Fig. 5

ACC
EPTE
D M
ANU
SCR
IPT
ACCEPTED MANUSCRIPT
Fig. 6

ACC
EPTE
D M
ANU
SCR
IPT
ACCEPTED MANUSCRIPT
Fig. 7

ACC
EPTE
D M
ANU
SCR
IPT
ACCEPTED MANUSCRIPT
Fig. 8

ACC
EPTE
D M
ANU
SCR
IPT
ACCEPTED MANUSCRIPT
Fig. 9

ACC
EPTE
D M
ANU
SCR
IPT
ACCEPTED MANUSCRIPT
Fig. 10

ACC
EPTE
D M
ANU
SCR
IPT
ACCEPTED MANUSCRIPT
Fig. 11

ACC
EPTE
D M
ANU
SCR
IPT
ACCEPTED MANUSCRIPT
Fig. 12

ACC
EPTE
D M
ANU
SCR
IPT
ACCEPTED MANUSCRIPT
Fig. 13

ACC
EPTE
D M
ANU
SCR
IPT
ACCEPTED MANUSCRIPT
Fig. 14

ACC
EPTE
D M
ANU
SCR
IPT
ACCEPTED MANUSCRIPT
Highlights
LIDAR-derived DEM is used to improve the knowledge of lava flows’ morphology;
a semi-automatic procedure yields flow unit morphology every 2 m along the flow axis;
a thorough morphometric description of two Etnean flow units is presented;
obtained high resolution results provide clues to understand emplacement history;


