Embed Size (px)
Citation preview
ASSESSMENT OF RIVER NZOIA BASIN MORPHOMETRIC CHARACTERISTICS
AND FLOODING RISKS IN BUDALANG’I AREA, BUSIA COUNTY
BY
NABWIRE CELESTINE AGNES
A PROJECT REPORT SUBMITTED IN PARTIAL FULFILLMENT OF THE
REQUIREMENTS FOR THE DEGREE OF MASTER OF ARTS IN GEOMOPHOLOGY
IN THE DEPARTMENT OF GEOGRAPHY AND ENVIRONMENTAL STUDIES OF
THE UNIVERSITY OF NAIROBI.
April 2019
ii
DECLARATION
1, Celestine Agnes Nabwire declare that this research project is my original work and has not been
presented for the award of a degree or diploma in any other university, it contains no material
previously published or written by any other person except where due reference is made in the
work itself.
Signature………………………...................... Date…………………
CELESTINE AGNES NABWIRE
C50/72930/2014
This research project has been submitted for examination with our approval as the university
supervisors
Signature………………………...................... Date…………………
Prof. George O. Krhoda
Department of Geography and Environmental Studies
Signature………………………...................... Date…………………
Dr. Shadrack M. Kithiia
Department of Geography and Environmental Studies

iii
DEDICATION
To my parents: Mrs. Regina Nekesa Ouma, my Late Dad Mr. Gabriel Ouma Juma and my cousin
Mr. Norbert Abachi
iv
ACKNOWLEDGEMENT
I would like to express my gratitude towards my Mum and my relatives for their support.
I would like to thank my supervisors Professor Krhoda and Dr. Kithiia of the University of Nairobi
Department of Geography and Environmental Studies for their tireless support, patience,
encouragement and guidance throughout the study and for the invaluable time they invested in
shaping the outcome of my work
I am particularly grateful for the assistance given by residents of Budalangi, officials from Bulala
FM radio station and environmental researchers from the Ministry of Environment in Busia county
Above all, I thank God Almighty for His grace, strength and favor that He granted me throughout
the period of study.
v
ABSTRACT
Flooding continues to be a common environmental hazard in both developed and developing
countries. River Nzoia experiences perennial flooding in its lower reaches especially in Budalangi
area of Busia county. The mean annual discharge of the River Nzoia is estimated at 1777Mm3
/year. From a physiographic and land use point of view the basin has four distinct zones: a
mountain zone, plateau zone, transition zone and lowland zone. The mountain zone is forested
but suffers severe land degradation; the plateau zone is the major farming zone. Small scale
farming continues in the transition and flood prone lowland areas. The flood prone area is generally
flat and swampy. There are two rainfall peaks in the catchment; the first peak comes in the months
of April to June, while the other occurs in July to September. Comparatively to other parts in
Kenya, the basin receives high rainfalls, whose average annual values vary between 1,000 to 1,500
mm. Several studies (JICA, 1987; JICA, 1992; APFM, 2004; ADCL, 2006) have been carried out
in Nzoia basin with a view to characterizing the basin on the basis of climatic data and land use
information but none has incorporated landform parameters because geomorphologic studies have
not been attempted. River morphometric information is very important in any undertaking to
control incidence of flooding in an area. In Kenya Few studies have been carried out on River
morphometrics in relation to flooding. This study therefore seeks to analyze the characteristics of
River Nzoia basin and how they contribute to flooding of Budalang’i flood plains. The study was
guided by the following specific objectives; to examine the drainage basin morphometrics
characteristics of the River Nzoia, to determine the influence of rainfall intensity and duration on
flooding in Budalang’i flood plains and to assess approaches of managing floods in Budalang’i
flood plains. Descriptive research design was used for the study. The target population in this study
was drawn from two components of the unit of analysis, namely the geophysical (River Nzoia
basin) and the social (households). Simple random sampling technique was used to sample the
respondents for the study. A sample size of 71 respondents was sampled from the locations along
River Nzoia in Budalang’i flood plains. Interviews and observation were used as methods of data
collection. Qualitative data analysis techniques were used to analyze the data where thematic and
content analysis was carried out based on the study objectives. The major datasets that were used
for this study include Landsat Satellite Imageries, Digital Elevation Data (DEM) and Auxiliary
data that included Roads, administrative boundaries, ground truth data for land use land cover
classes and topographic map of the area. The study found out that high volumes in upper
catchment areas during heavy rains of long rain seasons are at higher velocity due to sudden change
of river gradient. This result in higher volumes received at the lower catchment areas known as
flood plains (in-flow) against that volume expected to be released to the lake (out flow). This
volume difference causes the river to break its normal banks in the lower zones. Land use land
cover analysis between 1986-2018 shows that there is an increase in size of the bare ground area
which is an indication of wetland degradation and a consequent replacement of wetland vegetation
with bare soil that is prone to erosion. Increased farming activities along the Nzoia River has
resulted to deforestation in search of cultivation areas increasing the vulnerability of the area to
flooding. The rapid expansion of urban centres in the lower parts of the catchment (Rwambwa,
Kakamega, and Bungoma) can be said to be a major contributing factor to the annual devastating
floods. Based on River morphometry, the study concluded that there is no consistent relationship
between relief ratio and basin order in this basin due to high variance in relief on the divide line.
However, high relief ratios of above 0.03 are observed as characteristics of upland sub-basins and
low value of about 0.01 for sub-basins at the lowlands. This change has explained the flooding
phenomena at the lowlands. The computation of bifurcation ratio shows that the values ranged
vi
from 1.5 and 3.4 which are within Strahler’s range. The average value of Bifurcation ratio is 2.2
which is closer to the lower value of 2. Based on bifurcation ratio, River Nzoia basin flows may
encounter delayed time to peak and this is a good characteristic for planning and conveying flood
forecasts. The drainage pattern of this basin can be classified as fern-shape. This presents a lower
concentration time, and it generates higher flow. The major flooding risks that were identified
during the study include; Displacement of households, Damage to Farmlands, Damage to Bridges
and Roads, Disruption of learning programmes, Economic and Environmental aspects.
Approaches to flood management will include both Community non-structural measures and
Structural measures for flood control. The study recommends that there is need to undertake further
research in land-use land cover changes, river morphometrics and review of the existing flood
control and /or mitigation measures
vii
TABLE OF CONTENTS
DECLARATION........................................................................................................................... ii
ACKNOWLEDGEMENT ........................................................................................................... iv
ABSTRACT ................................................................................................................................... v
LIST OF TABLES ........................................................................................................................ x
EQUATIONS................................................................................................................................. x
LIST OF FIGURES ..................................................................................................................... xi
ABBREVIATIONS AND ACRONYMS ................................................................................... xii
CHAPTER ONE: INTRODUCTION ......................................................................................... 1
1.0 Introduction ........................................................................................................................... 1
1.1 Background of the study ....................................................................................................... 1
1.2 Statement of the problem ...................................................................................................... 3
1.3 Research questions ................................................................................................................ 5
1.4 Research objectives ............................................................................................................... 5
1.5 Justification of the study ....................................................................................................... 5
1.6 Scope and the limitation of the study .................................................................................... 6
1.7 Definition of Terms and concepts ......................................................................................... 7
CHAPTER TWO: LITERATURE REVIEW ............................................................................ 8
2.0 Introduction ........................................................................................................................... 8
2.1 Basin morphometric and flooding ......................................................................................... 8
2.1.1 Drainage density (Dd) .................................................................................................. 10
2.1.2 Stream order (U) ........................................................................................................... 11
2.1.3 Basin shape ................................................................................................................... 12
2.1.4 Stream length (Sl))........................................................................................................ 12
2.1.5 Bifurcation ration (Rb) ................................................................................................. 12
2.1.6 Stream Number (Nu) .................................................................................................... 13
2.1.7 Slope ............................................................................................................................. 13
2.2 Rivers flooding .................................................................................................................... 13
2.3 Budalang’i flood plains ....................................................................................................... 20
viii
2.4 Flood management and control ........................................................................................... 21
2.5 Theoretical framework (Strahler’s 1952) ............................................................................ 24
2.6 Conceptual framework ........................................................................................................ 25
2.7 Gaps in the literature review ............................................................................................... 26
CHAPTER THREE: STUDY AREA ........................................................................................ 27
3.0 Geographical location and introduction to physical features of River Nzoia basin ............ 27
3.1 Location ............................................................................................................................... 27
3.2 Climate ................................................................................................................................ 29
3.3 Topography ......................................................................................................................... 29
3.4 Geology ............................................................................................................................... 30
3.5 Soils ..................................................................................................................................... 31
3.6 Demography and livelihoods .............................................................................................. 32
3.7 Drainage .............................................................................................................................. 32
CHAPTER FOUR: RESEARCH METHODOLOGY ............................................................ 35
4.0 Introduction ......................................................................................................................... 35
4.1 Research design ................................................................................................................... 35
4.2 Target population ................................................................................................................ 35
4.3 Sample design ..................................................................................................................... 35
4.3.1 Sample size ................................................................................................................... 35
4.3.2 Sampling procedure ...................................................................................................... 36
4.3 Data collection..................................................................................................................... 36
4.4 Data analysis ....................................................................................................................... 36
4.4.1 Stream numbers (sn) ..................................................................................................... 38
4.4.2 Stream length (sl).......................................................................................................... 38
4.4.3 Bifurcation ratio (Rb) ................................................................................................... 38
4.4.4 Relief Ratio (Rh) .......................................................................................................... 39
4.4.5 Drainage density (Dd) .................................................................................................. 39
CHAPTER FIVE: RESULTS AND DISCUSSIONS .............................................................. 40
ix
5.0 Results ................................................................................................................................. 40
5.1. Rainfall intensity and duration and flooding ...................................................................... 40
Source: RCMRD 2008 .............................................................................................................. 42
5.2 Morphometric characteristics .............................................................................................. 42
5.2.1 Stream order, stream number, stream Length and Bifurcation ratio ............................ 44
5.2.2 Drainage density ........................................................................................................... 46
5.2.3 Relief ratio .................................................................................................................... 48
5.3 Characteristics of River Nzoia in relation to flooding in Budalang’i ................................. 49
5.3.1. River gradient and increased meanders ....................................................................... 49
5.3.2 River Width .................................................................................................................. 50
5.3.3 Reduced River Velocity in Lower Catchment Areas ................................................... 50
5.3.4 Land use land cover changes ........................................................................................ 51
5.4 Questionnaire data review ................................................................................................... 59
5.4.1 Household characteristics ............................................................................................. 59
5.4.2 Flooding occurrence, risks and impacts on households ............................................... 60
5.4.3 Factors causing floods .................................................................................................. 63
5.4.4 Flooding risks in Budalang’i ........................................................................................ 63
5.5 Flood mitigation and control measures ............................................................................... 65
5.5.1 Community non-structural measures for flood control ................................................ 65
5.5.2 Sensitization activities would remain necessary .......................................................... 66
5.5.3 Methods shall be developed. ........................................................................................ 66
5.5.4 Structural measures for flood control ........................................................................... 66
CHAPTER SIX: SUMMARY, CONCLUSIONS AND RECOMMENDATION ................. 68
6.0 Introduction ......................................................................................................................... 68
6.1 Summary ............................................................................................................................. 68
6.2 Conclusion ........................................................................................................................... 69
6.3 Recommendations ............................................................................................................... 69
REFERENCES ............................................................................................................................ 70
x
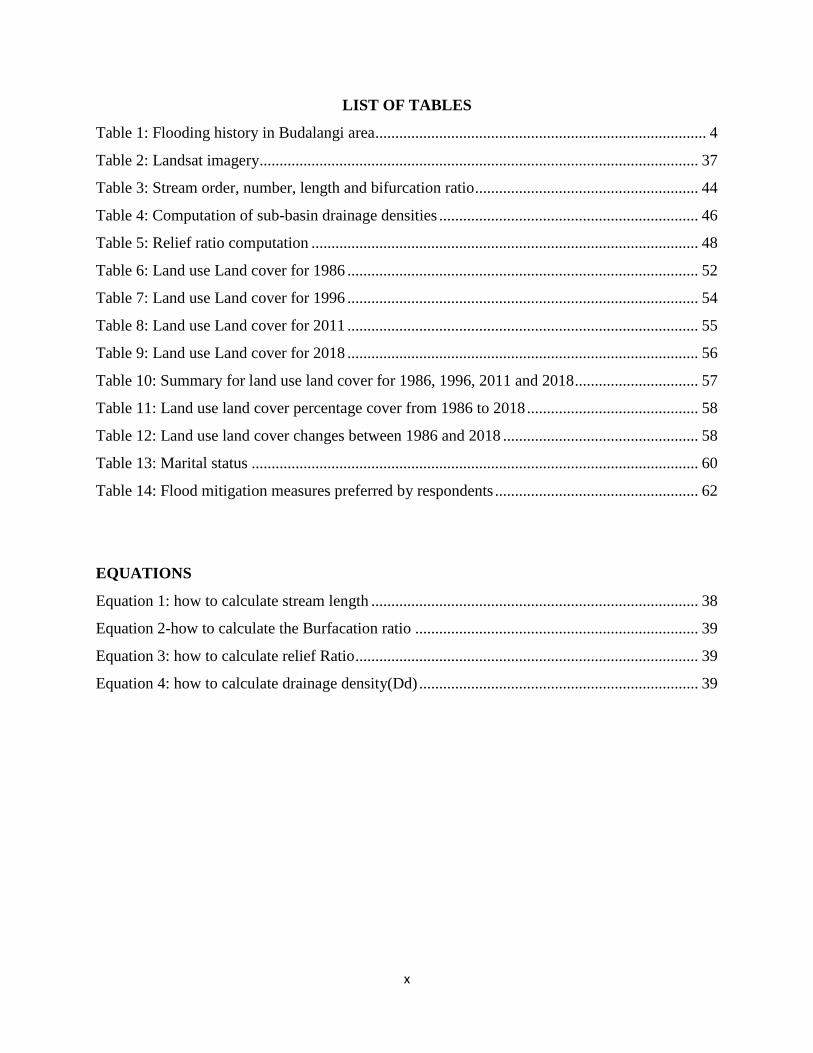
LIST OF TABLES
Table 1: Flooding history in Budalangi area ................................................................................... 4
Table 2: Landsat imagery.............................................................................................................. 37
Table 3: Stream order, number, length and bifurcation ratio ........................................................ 44
Table 4: Computation of sub-basin drainage densities ................................................................. 46
Table 5: Relief ratio computation ................................................................................................. 48
Table 6: Land use Land cover for 1986 ........................................................................................ 52
Table 7: Land use Land cover for 1996 ........................................................................................ 54
Table 8: Land use Land cover for 2011 ........................................................................................ 55
Table 9: Land use Land cover for 2018 ........................................................................................ 56
Table 10: Summary for land use land cover for 1986, 1996, 2011 and 2018 ............................... 57
Table 11: Land use land cover percentage cover from 1986 to 2018 ........................................... 58
Table 12: Land use land cover changes between 1986 and 2018 ................................................. 58
Table 13: Marital status ................................................................................................................ 60
Table 14: Flood mitigation measures preferred by respondents ................................................... 62
EQUATIONS
Equation 1: how to calculate stream length .................................................................................. 38
Equation 2-how to calculate the Burfacation ratio ....................................................................... 39
Equation 3: how to calculate relief Ratio ...................................................................................... 39
Equation 4: how to calculate drainage density(Dd) ...................................................................... 39
xi
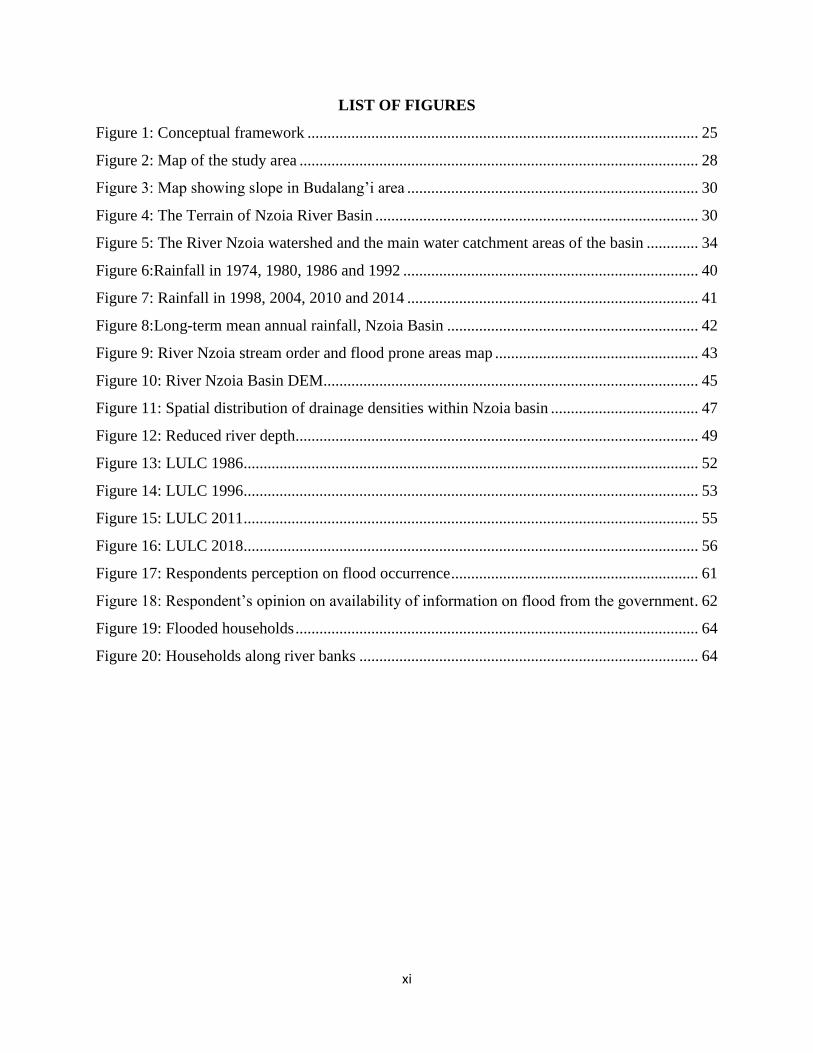
LIST OF FIGURES
Figure 1: Conceptual framework .................................................................................................. 25
Figure 2: Map of the study area .................................................................................................... 28
Figure 3: Map showing slope in Budalang’i area ......................................................................... 30
Figure 4: The Terrain of Nzoia River Basin ................................................................................. 30
Figure 5: The River Nzoia watershed and the main water catchment areas of the basin ............. 34
Figure 6:Rainfall in 1974, 1980, 1986 and 1992 .......................................................................... 40
Figure 7: Rainfall in 1998, 2004, 2010 and 2014 ......................................................................... 41
Figure 8:Long-term mean annual rainfall, Nzoia Basin ............................................................... 42
Figure 9: River Nzoia stream order and flood prone areas map ................................................... 43
Figure 10: River Nzoia Basin DEM.............................................................................................. 45
Figure 11: Spatial distribution of drainage densities within Nzoia basin ..................................... 47
Figure 12: Reduced river depth..................................................................................................... 49
Figure 13: LULC 1986.................................................................................................................. 52
Figure 14: LULC 1996.................................................................................................................. 53
Figure 15: LULC 2011.................................................................................................................. 55
Figure 16: LULC 2018.................................................................................................................. 56
Figure 17: Respondents perception on flood occurrence .............................................................. 61
Figure 18: Respondent’s opinion on availability of information on flood from the government. 62
Figure 19: Flooded households ..................................................................................................... 64
Figure 20: Households along river banks ..................................................................................... 64
xii
ABBREVIATIONS AND ACRONYMS
DEFRA Department for Environment, Food and Rural Affairs
EC European Commission
ENSO El Nino Southern Oscillation
FRC Flood Resilient City
GHA Greater Horn of Africa
LBDA Lake Basin Development Authority
SSA Sub-Saharan Africa
SWMP Surface Water Management Plans
LULC Land Use Land cover changes
RCMRD Regional center for mapping and resource development
1
CHAPTER ONE: INTRODUCTION
1.0 Introduction
This chapter gives the background, objectives and the concepts studied.
1.1 Background of the study
One of the global most environmental natural occurrences is river flooding. Flooding is a temporal
condition of partial or complete inundation of normally dry areas from overflow of inland or tidal
waters or from unusual and rapid accumulation or runoff” (Jeb & Aggarwal, 2008). As such, river
floods occur when water flows over the river banks into the adjacent land also known as flood
plains. Floods are triggered by anthropogenic activities such as increase in settlement areas,
expansion of agricultural areas, deforestations, alterations of natural drainage and river basin
patterns, and climate change (EC, 2007). Naturally, flooding can involve overflow of a river
because of prolonged seasonal rainfall, rainstorm, snowmelt, dam-breaks, accumulation of
rainwater in low-lying areas with a high-water table, or inadequate storm drainage. In addition,
floods can be caused by intrusion of sea water onto coast lands during cyclonic/tidal surges
(Lidstone & DeChano, 2004).
From a purely geomorphic perspective, high flows become floods when they provide large
quantities of sediments or alter the morphology of the river channel and floodplain. From a human
perspective, high flows become floods when they cause injury or death of people, or when they
result in relatively minor damage on property, belongings or source of livelihood. Small floods
result in relatively minor damage, but they may have higher cumulative cost because they are
frequent and occurs in many locations. Larger floods are rare and have the potential to cause heavy
loss of life and economic damage (WMO, 2006.)
According to Emergency Events Data Base (EM-DAT), floods comprised two-fifths of all
disasters in 2015 and were responsible for 25 per cent of the total economic damage and 37 per
cent of the total disaster affected population in Asia Pacific. EM-DAT further asserts that floods
occurred 63 times resulting to 1863 human deaths and affecting about 21.7 million people. EM-
DAT estimated an economic loss of about US$11.5 billion to the Asia Pacific countries. In South
America, Brazil alone has experienced a number of major floods in the past 30 years, in January
2011 floods killed 900 people and lead to a significant economic loss of approximately 1 billion
US dollar (Whitney et al. 2013).
2
In Fiji a great flood in 1993 brought on damages adding up to $ 100 million, 23 lives were lost,
and more than 120,000 individuals suffered losses thereby, ruinously impacting the national GDP
and the government’s advancement strategies and programs. Assets reserved for capital
improvement works were immediately diverted for help and recovery.
In Africa, it is estimated that floods fatalities and the accompanying economic losses have
increased over the past half‐century. In 2007 floods displaced more than a million people in
Burkina Faso, Togo, Mali and Niger, Uganda, Ethiopia, Sudan and claimed over 500 lives; while
in 2009 torrential rains resulted to floods that affected 600,000 people in 16 West African nations,
with the worse damages being recorded in Burkina Faso, Senegal, Ghana and Niger (United
Nations, 2009).
Conway (2002) conducted a study in sub-Saharan Africa and he noted that rainfall and river flows
in Africa displays high levels of variability across a range of spatial and temporal scales. Thought
out Africa, this variability brings significant implications for society and causes widespread acute
human suffering and economic damage. Examples of such variabilities include prolonged periods
of high flows for rivers draining large parts of East Africa and multi-decadal anomalies in river
flows regimes in parts of west Africa where long-term mean yields of freshwater into Atlantic
Ocean fell by 18% between 1951-70 and 1971-89 (Mahe’ and Olivry).
Floods are the leading hydro-meteorological disaster in East Africa. In Kenya, floods are emerging
as the most prevalent climatic disaster (RoK, 2007; ISDR). Perennial floods affect low-lying
regions of the country such as river valleys, swampy areas, lakeshores and the coastal strip that are
unevenly distributed in the country’s five drainage basins. Geographically, the western, northern,
eastern, central and south-eastern parts of the country are quite susceptible to seasonal floods in
the wet seasons of March-April May (MAM) and October-November-December (OND).
The Lake Victoria Basin in western Kenya is the most flood-prone region in the country (RoK,
2007). Western Kenya is characteristically wet throughout the year with no distinctive dry season.
High rainfall is received in the months of March to September, with significantly lower rainfall in
January and February (SoK, 2003 in WRI et al., 2007). Contrary to the bimodal rainfall pattern in
the rest of the country, a third rainfall season is experienced during the cold and dry months of
3
June-July-August (JJA). (ICPAC, 2007). The mean annual rainfall in western Kenya is above 1600
mm (WRI et al., 2007).
The prevalence rates of floods in Kenya stands at 27% and affects 5% of the population affected
by disasters. Floods related fatalities constitute a whopping 60% of disaster victims in Kenya
(UNEP, 2009). Flood occurrence trends in western Kenya is increasingly becoming a major
concern to the country’s socio-economic development due to the substantial economic and
financial losses incurred to respond to frequent flood disasters.
Riverine floods are the most dominant floods in Kenya and mostly occurs along floodplains as a
result of exceeded stream flow capacity leading to over spilling pf the natural banks or artificial
embankment (smith and Ward,1998). River that most experience flooding in kenya include: Nzoia,
Nyando, Tana, Athi, Yala, Sondu, Nairobi and Kuja. River floods in western kenya have high
frequency as compared to other parts of the country, making the communities of the region
vulnerable to flood risks especially frequent floods of River Nzoia in Budalangi floodplains
1.2 Statement of the problem
Natural disasters cause much misery, especially in developing countries where they cause great
stress among low-income economies. Approximately 70 per cent of all global disasters are linked
to hydrometeorological events. Flooding poses one of the greatest natural risks to sustainable
development. Flood losses reduce the asset base of households, communities and societies through
the destruction of standing crops, dwellings, infrastructure, machinery and buildings, quite apart
from the tragic loss of life. In some cases, the effect of extreme flooding is dramatic, not only at
the individual household level, but in the country. The global economic losses from flooding
exceeded $19 billion in 2012 and are rising rapidly globally (Munich Re 2013).
Flooding continues to be a common environmental hazard both in developed and developing
countries, like Kenya. Many parts of Kenya experience unexpectedly long rainfall in mid-April to
May and short rains in September to November. During the long rains, the Lake Victoria Basin,
which comprises of the Nzoia River basin among the other river basins busts its banks resulting to
floods.
The western region of Kenya is one of the regions most influenced by floods. Frequent flooding
occurs in parts of western Kenya particularly Budalang’i and Bunyala plains in the Nzoia river
4
basin. The Nzoia basin has a high incidence of poverty with a rich natural resource endowment.
While the Western Kenyan region is endowed with natural resources such as forests, rivers and
lakes, which should be adequate for poverty reduction, and vulnerability nonetheless afflict many
in the region. The communities in the Nzoia basin are confronted with flooding, disease, and
degradation of natural resources, especially land. The situation is aggravated by perennial flooding,
mismanagement of natural resources, and the HIV/AIDS pandemic.
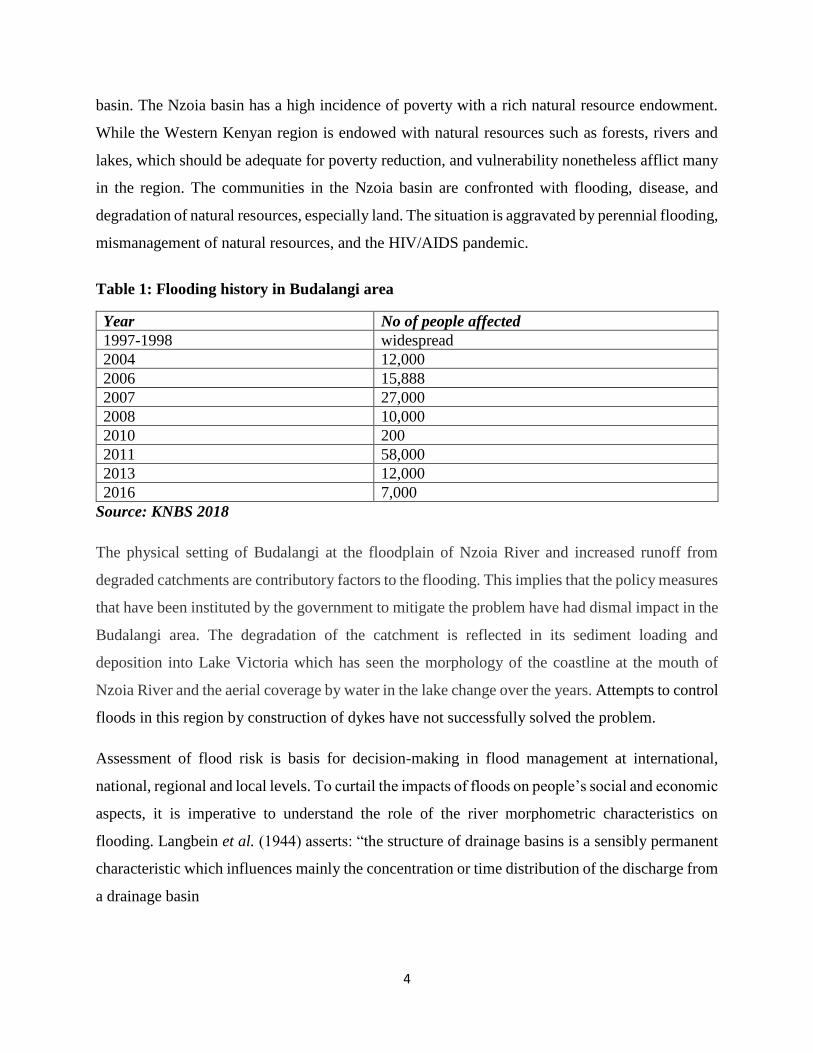
Table 1: Flooding history in Budalangi area
Year No of people affected
1997-1998 widespread
2004 12,000
2006 15,888
2007 27,000
2008 10,000
2010 200
2011 58,000
2013 12,000
2016 7,000
Source: KNBS 2018
The physical setting of Budalangi at the floodplain of Nzoia River and increased runoff from
degraded catchments are contributory factors to the flooding. This implies that the policy measures
that have been instituted by the government to mitigate the problem have had dismal impact in the
Budalangi area. The degradation of the catchment is reflected in its sediment loading and
deposition into Lake Victoria which has seen the morphology of the coastline at the mouth of
Nzoia River and the aerial coverage by water in the lake change over the years. Attempts to control
floods in this region by construction of dykes have not successfully solved the problem.
Assessment of flood risk is basis for decision-making in flood management at international,
national, regional and local levels. To curtail the impacts of floods on people’s social and economic
aspects, it is imperative to understand the role of the river morphometric characteristics on
flooding. Langbein et al. (1944) asserts: “the structure of drainage basins is a sensibly permanent
characteristic which influences mainly the concentration or time distribution of the discharge from
a drainage basin
5
Despite the concerted efforts by the Ministry of Water and Irrigation (MWI) to tame the floods by
the rehabilitation and raising of the dyke embankments, the solution has been elusive. (Mutiso
2007)
Previous studies in Budalangi focused on; Flood Disaster Preparedness, household and community
experiences and perceptions on climate change impacts due to floods but the morphometric aspects
of the river Nzoia basin in relation to flooding in Budalangi has been scantly studied.
In Kenya, River morphometry studies are few and thus scanty. Nzoia basin is no exception.
Therefore, this study will analyze the morphometric characteristics of River Nzoia basin and how
it contributes to flooding of Budalang’i flood plains as part of the early warning for floods and
additional knowledge on the ever-changing flooding characteristics.
1.3 Research questions
i. What is the effect of rainfall intensity and duration on flooding in Budalang’i flood basin?
ii. How does River Nzoia basin morphometry affect the flooding in Budalang’i floodplains?
iii. What are the suitable approaches for managing floods in Budalang’i?
1.4 Research objectives
The overall objective of the study is to assess River Nzoia basin morphometry and flooding risks
in Budalang’i flood plains.
The specific objectives are:
i. To determine the effect of rainfall intensity and duration on flooding in Budalang’i flood
basin
ii. To assess the effect of basin morphometry on flooding of Budalang’i flood plains
iii. To assess approaches of managing floods in Budalang’i flood plains.
1.5 Justification of the study
Flooding has been a persistent occurrence in Bunyala Sub County. The flooding impact in the area
has been immense despite modern and traditional mitigation approaches that have been taken in
addressing the flooding menace in the area. The government’s efforts to form task forces for the
mapping of flood prone areas and institutionalize Disaster Management Committees are yet to
produce any tangible results. This might be associated with modern technology on flood
6
management that has overlooked opinion and experience of the local residence as well as paying
minimal or no attention to the historical information likely to suggest probable factors that trigger
flooding
Nzoia River basin is the largest sub-basin in the Lake Victoria North basin of Kenya and yet, the
geomorphology as a component of the basin’s general physical characteristics and its linkage to
flooding has scantly been studied. River morphometric characteristics are dynamic and require
regular documentation in order to understand the flooding risks.
Recent government proposal to manage flood hazard in the basin by adoption of integrated flood
management strategy (ADCL, 2006) will need a comprehensive characterization of the basin on
the basis of all variables. The communities who live in the lowland zone of River Nzoia continue
to experience annual flood disasters due to failure of structural flood mitigation systems like earth
dykes in controlling high flows. Destruction of natural forest cover in the middle and upper zones
of Nzoia catchment continue unabated. The linkage between geomorphology and increased
incidences of flood disaster is poorly understood amongst planners and communities occupying
the basin. Therefore, the objective of this study is to establish geomorphic characteristic of Nzoia
basin with reference to a few commonly used morphometric parameters of relief ratio, bifurcation
ratio, and drainage density. The researcher understand that the full scope of geomorphology goes
beyond these three parameters but assumes that the four parameters will provide a basic
geomorphic understanding of the area for planners.
1.6 Scope and the limitation of the study
The study focused on assessing morphometric characteristics (stream order, stream number, stream
length, Burfacation ratio, Relief ratio, and Drainage density) within the catchment, rainfall
intensity and duration and land use Landcover changes as factors responsible for flooding and how
they affect the individual households. The study also identified and quantified key causes and
accelerators of flooding in River Nzoia catchment and assess seasonal variation of the same sinks
in terms of material composition, size and permanence as well as the interrelationship between
these sediment sinks and vegetation. Due to time and financial constraints field assessment and
measurements was not done to cover both the dry and rainy seasons.
7
1.7 Definition of Terms and concepts
Floods-an overflow of a large amount of water beyond its normal limits, especially over what is
normally dry land.
Flooding-a situation in which an area is covered with water, especially from rain
Basin Morphometry - is the mathematical measure of the shape and dimensions of the landform’s
geomorphic conditions and hydrological processes
Disaster-A disaster is a serious disruption, occurring over a relatively short time, of the
functioning of a community or a society involving widespread human, material, economic or
environmental loss and impacts, which exceeds the ability of the affected community or society to
cope using its own resources
Early Warning-An early warning system warns people that something bad is likely to happen
Flood prone areas-The regions along a waterway inclined to flooding and can be separated into
various zones, specifically the floodplain and floodway. (ISDR 2004; Wright 2008).
Watershed- an area or ridge of land that separates waters flowing to different rivers, basins, or
seas.
Risk – hazard is the likelihood that destructive outcomes or misfortune can happen because of
connections amongst normal and anthropogenically actuated dangers (ISDR 2010a). Hazard can
likewise be characterized as an element of risk, powerlessness and adapting limit (Baas et al. 2008;
Botha & Louw 2004; Boudreau 2009; Hossini 2008)
Mitigation- The reducing or constraint of the antagonistic effects of risks and related fiascos
(UNISDR, 2007)
8
CHAPTER TWO: LITERATURE REVIEW
2.0 Introduction
In this section, Basin morphometric, Rainfall Intensity and duration and flood management and
flood control aspects are discussed.
2.1 Basin morphometric and flooding
Morphometry refers to the geographical articulation of land by method for zone, incline, shape,
length, and so forth (Horton, 1932; Clarke, 1966). Therefore, the form and structure of drainage
basins and their associated drainage networks can be described by their morphometric parameters.
These parameters influence catchment stream flow design through their effect on fixation time
(Jones, 1999; Ajibade, Ifabiyi, Iroye, and Ogunteru, 2010). These landscape parameters are huge
on the grounds that stream flow can be communicated as a general capacity of geomorphology of
a watershed. Basins on Flood Vulnerability in Makurdi Town, Nigeria still stand legitimate after
(Jones, 1999; Jain and Sinha, 2003; Okoko and Olujinmi, 2003), announced that the morphometric
investigation of water basin gives a rich portrayal of the scene, as well as fills in as a ground-
breaking method for looking at the frame and procedure of seepage basin that might be generally
isolated in space and time.
Morphological studies of rivers are very important to study the behavior of a river, its
aggradations/degradation, shifting of the river course, flooding and erosion of river bank and to
plan remedial measure for erosion, flooding and other related problems (Oruonye, Ezekiel, Atiku,
Baba & Musa, 2016). A research done in Nigeria’s Kereke and Ukoghor basins showed the
influence of morphometric variables on flooding in drainage basins using GIS. Okoghor drainage
basin morphometric variables caused high peak flow and shorter duration concentration time
thereby inducing high magnitude flood within the basin compared with morphometric properties
of Kereke drainage basin (Oyatayo, Bello, Ndabula Godwill & Ademola, 2017). The influence
of morphometric factors on hydrological processes within a drainage basin. The study realized
that morphometric influence is however encouraged by other basin characteristics such as
climate, soil features and land use pattern which acts as contributory factors to flooding in
drainage basins (Oyatayo, Bello, Ndabula Godwill & Ademola, 2017).
9
The soils of the floodplain in the lower reaches of the Nzoia River are all alluvial. The river
meanders in the floodplain depositing silt during seasonal floods. The major parts of the
floodplain contain black cotton soils, while other areas have coarse textured sand silt mixture. In
some places, there exist saline soils (Oyugi et al. 2003).
The upper Nzoia Basin contains extensive seasonal swamp areas in the highland, medium rainfall
zones that are mainly utilized for grazing due to poor drainage. Once the river bursts its banks,
the resultant flooding displaces close to 30,000 persons every rainfall season. People are usually
evacuated to safer higher grounds during floods. Entire homesteads are swept away, property and
crops worth hundreds of thousands of shillings are lost and many people perish as rivers break
their banks, rendering large areas of land inaccessible. The floods enhance poverty, because crops
and businesses are destroyed, (Oyugi et al. 2003).
The lower reaches of River Nzoia are flat lands with low gradients. All the six locations in
Budalangi Division are perennially affected by flooding. These are; Bunyala East, West, South,
North and Central and Khajula location. Traditionally, the people have settled in the flood plain
and this has meant that people are directly affected by the perennial flooding. The April 2003
floods displaced 4000 families or about 24,000 people, covering an area of 60 km² with people
moved to camps on higher areas and relying on food relief (Paolo et al. 2013)
This situation has arisen after breaching of protection dykes that were constructed by the Ministry
of Water from 1977 to 1984. The works involved construction of 32.8 km of earthen dykes (16.6
km in the southern side and16.2 km) on the northern side that required a replacement of 690,000
m3 of soil. They were designed for 25-year flood protection of 750 m³/s. Now the dykes are
occasionally overgrown with vegetation, breached at 20 points and have outlived their life of 20
years. The budgetary maintenance requirements are therefore high and have been diminishing
annually.
A report given to the government in 1992 after the assessment of the area proposed an irrigation
scheme as the solution to the unending flood menace. In the report, it was proposed that a dam
be constructed to trap the excess water that overflows the river. This would be followed by the
construction of two canals, one in the northern riverbank measuring 40 km and the other on the
southern side measuring 35 km, draining water onto the flat farms for irrigation. ‘The project
10
could cost about $20 million if implemented’. It is evident that the present course of the river is
highly unstable and could change from one moment to the next after a flood, if no protective
works are provided (GoK, 2002)
The 2003 floods in Budalang’i saw nearly 24,000 out of a population of 56,000 people displaced
(IFRC, 2003). Some 10,000 people were accommodated in the District Officer camp,
necessitating health emergency measures to control possible outbreaks of waterborne diseases.
Scarcity of water sources and the contamination of pipes and borewells aggravated an already
acute problem. Fishing and farming are the major economic activities in Budalang’i. Due to the
floods and concentration in the camps, the economic activities are greatly disrupted
2.1.1 Drainage density (Dd)
Drainage density has for quite some time been perceived as topographic normal for crucial
noteworthiness. This emerge from that reality that drainage density is touchy parameter which
from numerous points of view gives the connection between the shape characteristics of the basin
and the procedures working along stream course (Gregory and Welling, 1973). It mirrors the land
use and influences penetration and the basin reaction time between precipitation and release. It
is additionally of geomorphological intrigue especially for the advancement of inclines. Drainage
basin with high Dd shows that an extensive extent of the precipitation keeps running off. Then
again, a low drainage density demonstrates the most precipitation penetrates the ground and few
channels are required to convey the spillover
(Roger, 1971). Dd is viewed as a vital file; it is communicated as the proportion of the aggregate
total of all channel fragments inside a basin to the basin territory i.e., the length of streams per
unit of drainage density. It is a measurement reverse of length (Horton, 1932). Dd is a proportion
of the surface of the system and demonstrates the harmony between the erosive intensity of
overland flow and the opposition of surface soils and shakes. The factors influencing drainage
density incorporate geography and density of vegetation. The vegetation density impacted
drainage density by restricting the surface layer and moderates down the rate of overland flow
and stores a portion of the water for brief timeframes. The impact of lithology on drainage density
is stamped. Porous rocks with a high penetration rate decrease overland flow, and therefore
drainage density is low.
11
The drainage density exerts on flood peaks significant controls which can be broadly divided
between direct and indirect effects (Merz and Bloschl, 2008; Bloschl, 2008). Among the most
significant direct effects there is the control associated with the length of the stream network and
hillslope paths. Because flow velocity is higher in the river network, Dd significantly affects the
concentration time and therefore the peak flow magnitude. It follows that an increasing drainage
density implies increasing flood peaks. Moreover, a long concentration time implies more
opportunities for water to infiltrate. Therefore, a decreasing Dd generally implies decreasing
flood volumes.
Murphey et al. (1977) analyzed the relationship among flood hydrograph characteristics, like rise
time, base time, mean peak discharge and flood volume, and basin parameters such as, among the
others, contributing area and drainage density. Plaut Berger and Entekhabi (2001) and Humbert
(1990) proved that drainage density is significantly related to the basin runoff coefficient. Gresillon
(1997) studied 100 African catchments and concluded that Dd and watershed area are two very
important variables to explain the shape of the recessing limb of the hydrograph, while in tropical
regions Dd is effective on the runoff coefficient during flood events. Yildiz (2004) carried out a
numerical simulation showing that streamflows simulated by a rainfall-runoff model steadily
increase with increasing Dd. Recently, Grauso et al. (2008) showed that Dd is a fundamental
explanatory variable in regression models for estimating the annual amount of suspended sediment
yield. The explaining capability of Dd was found to be extremely relevant, therefore suggesting
that a significant link indeed exists between Dd and the river flow regime. A recent and interesting
review is provided by Wharton (1994) who studied the usefulness of Dd in rainfall-runoff
modelling and runoff prediction.
2.1.2 Stream order (U)
There are four different system of ordering streams that are available Gravelius (1914), Horton
(1945), Strahler (1952) and Schideggar (1970). Strahler’s system, which is a slightly modified of
Hortons system, has been followed because of its straightforwardness. Where the smallest,
unbranched fingertip streams are designated as 1st order, the confluence of two 1st order channels
give a channel segments of 2nd order, two 2nd order streams join to form a segment of 3rd order
and so on. When two channels of different order join then the higher order is maintained. The
trunk stream is the stream segment of highest order.
12
2.1.3 Basin shape
The shape of the basin mainly directs the rate at which the water is provided to the main channel.
Shape will contribute to the speed with which the runoff reaches a river. A long thin catchment
will take longer to drain than a circular catchment. A circular shaped drainage basin leads to rapid
drainage whereas a long drainage basin will take time for the water to reach the river. The main
indices used to analyze basin shape and relief is the relief ratio.
2.1.3.2 Relief ratio
In accordance to Schumm (1956), the maximum relief to the horizontal distance along the largest
dimension of the basin parallel to the principal drainage line is termed as relief ratio. It computes
overall steepness of the drainage basin. Relief ratio is an indication of the intensity of erosional
process operating on slope of the basin (Schumm, 1956). On the basis of work carried out by
Shumm (1963), it is dimensionless height-length ratio equal to the tangent of angle formed by two
planes cross at the mouth of the basin, one exhibit the horizontal and the other passes through the
highest point of the basin (Singh, 1997). When the basement rock of the basin is resistance and
low degree of slope heralds or give rise to low value of relief ratio (Gottschalk, 1964) Relief ratio
is inversely proportional to the drainage area and the size of given drainage.
2.1.4 Stream length (Sl))
According to Horton (1945), the aggregate average lengths of stream segments of each of the
consecutive orders in a catchment tend closely to estimate a direct geometric series in which the
first term is the mean length of streams of the first order. The total length of singular stream
sections of each order is the stream length of that order. Stream length measures the average (or
mean) length of a stream in each order and is computed by dividing the total length of all streams
in a particular order by the quantity of streams in that order. The stream length in each order rises
exponentially with increasing stream order.
2.1.5 Bifurcation ration (Rb)
Bifurcation Ratio is the number of streams in a low order to the number of streams in the next high
order (Horton, 1945). The bifurcation ratio varies from a minimum of 2 in "gently sloping drainage
basins" to 3 or 4 in "mountainous or highly dissected drainage basins"; it is a parameter used in
equations giving the number of streams in a basin. The higher the bifurcation ratio, the shorter the
13
time taken for discharge to reach the outlet, and higher was the peak discharge – leading to a
greater probability of flooding. Bifurcation ratio correlates positively with drainage density i.e., a
high bifurcation ratio indicates a high drainage density. Higher Bifurcation ratios also suggest that
the area is tectonically active. The bifurcation ratio can also show which parts of a drainage basin
is more likely to flood, comparatively, by looking at the separate ratios. The bifurcation ratio varies
from a minimum of 2 in "flat or rolling drainage basins" to 3 or 4 in "hilly or highly dissected
drainage basins"
2.1.6 Stream Number (Nu)
The total number of stream sections existent in each order is the stream number (Nu). Nu is number
of streams of order u. The total number of stream sections is found to decline as the stream order
rises in most river basins Horton (1945).
2.1.7 Slope
Slope is very important in how quickly a drainage channel will convey water, and therefore, it
influences the sensitivity of a watershed to precipitation events of various time durations.
Watersheds with steep slopes will rapidly convey incoming rainfall, and if the rainfall is convective
(characterized by high intensity and relatively short duration), the watershed will respond very
quickly with the peak flow occurring shortly after the onset of precipitation. Steep slopes tend to
result in rapid runoff responses to local rainfall excess and consequently higher peak discharges
(WWAP, 2006). The runoff volume is also affected by slope. If the slope is very flat, the rainfall
will not be removed as rapidly. The process of infiltration will have more time to affect the rainfall
excess, thereby increasing the abstractions and resulting in a reduction of the total volume of
rainfall that appears directly as runoff (WWAP, 2006).
2.2 Rivers flooding
Asia continent is much affected by floods and countries like India, China, Philippines, Iran,
Bangladesh and Nepal are extremely vulnerable (WWAP, 2006). It indicates that the majority of
flood disasters’ victims are poor people of developing countries, who suffer most and are the first
casualty of such incidents. High relief, steep slopes, complex geological structures with active
tectonic processes and continued seismic activities, and a climate characterized by great
seasonality in rainfall, all combine to make Nepal natural disasters prone area, mainly earthquake,
water induced disaster such as flood, landslides, glacier lake outburst flood among others. About
14
6000 rivers and rivulets drain Nepal, with a combined total length exceeds 45,000 km, having a
total drainage area of 191,000 sq. km. They discharge more than 200 billion m³ of water annually.
As the river emerge into plain from steep and narrow mountains gorges, they spread out with an
abrupt gradient decrease that has three major consequences; deposition of bed load, changes in
river course, and frequent floods (Jollinger, 1979). The main cause of river flooding in the
Himalayan Region is the occurrence of heavy rainfall during the monsoon, mostly southern slopes
of Churia and Mahabharat receive more rainfall.
In the USA, the most significant floods occur on the Mississippi River, resulting from regional
rainfall and snowmelt events that cause slow rise on the rivers and extend for days or weeks. The
magnitude of flooding’s increases moving downstream from the headwaters to the mouth. Short,
intense rainfall events can cause flash floods or quick rise and fall floods on the tributaries but do
not normally affect the mainstream. Mississippi River floods and flood damages are significant
enough to merit regional or national attention occurred on the Mississippi in 1849, 1850, 1882,
1912, 1913, 1927, 1936 1950, 1973, 1993 and 2001. The largest flood flow recorded on the lower
Mississippi was 64,500 m3 s-1. The 1993 flood flow on the upper Mississippi exceeded 28,000
m3/s (Galloway, 2004).
In Kisangani in northern Democratic republic of Congo, the Tshepo and Congo rivers flooded their
banks in late 1997 and early 1998, forcing approximately 10,000 people from their homes.in some
villages along the rivers greater than 80 percent of homes were destroyed. the flooding was
accompanied by an outbreak of cholera that killed hundreds of people (UNDP REPORT)
In the year 2000 Mozambique was hit by the worst flood event in 50yrs, which caused enormous
destruction and losses and left a quarter of the population affected with around 540,000 people
displaced and one hundred killed. In the following year 2001, the country was flooded again in the
central region, as well as in 2003 in the northern region (UNDP report)
In Togo, flooding displaced more than 7,000 people and affected many more in the savannah
region of northeastern, which according to recent UN studies is the country’s poorest region with
“alarming” rates of acute child malnutrition. Floods are reported to have watershed out roads and
bridges, completely cutting access to about half of Kpendajal prefecture, which had a population
15
of an estimated 123,000. other affected are Oti, Tone and Tandjoure (IRIN, All Africa 6 September
2007)
Flooding, discharge of excessive water exceeding the channel capacity, and flash floods,
originating from thunderstorms are the most pervasive and costly natural hazards faced by the
Nepalese people. The problem of flood hazard is particularly prominent in the southern plains of
Nepal where the gradient of the river channel is very low. Apart from hydrological phenomenon,
the presence of natural or man-made obstructions in the flood path such as bridge piers, floating
debris, weirs, barrage, outburst of landslide dam, glacial lake, failure of different structures, etc.
causes flooding. Some of the rivers are dry during the winter season, while in the monsoon they
become active and cause immense damage (Dixit, 1999). Therefore, it is not uncommon to have
floods in a country having such large rivers and monsoon.
Flood occurrence in one country can affect neighboring countries. For instance, in the
Mozambique floods of 2000 was triggered by extremely heavy rain that lasted five weeks in South
Africa. Botswana received 75% of its annual rainfall in only three days, and Cyclone Eline hit,
bringing more heavy rainfall. The rain from Botswana and other Southern African countries
drained into the Limpopo, Zambezi and other rivers which flow through Mozambique to the sea.
These rivers eventually burst their banks, causing severe flooding in Mozambique. This resulted
to displacement of people, destruction of properties and outbreak of waterborne diseases. The
floods were linked to the rapid urbanization in South Africa (BBC, 2000).
Riverine floods are the most dominant floods in Kenya. River floods mostly occur along
floodplains or wash lands as a result of exceeded stream flow capacity leading to over spilling of
the natural banks or artificial embankments (Smith & Ward, 1998). Riverine floods include
extreme events like the El Niño flood of 1997-98 with a low flood probability of 35-40 years (Q
35-40) and the more frequent small floods with a high flood probability of up to five years (Q5).
Major rivers in the country such as Nzoia, Nyando, Yala, Athi, Nairobi and Tana experience
seasonal river floods emanating from the country’s highlands that receive high annual rainfall
ranging from 1600-2000mm. These rivers flooded during the 1997/98 rains (Smith & Ward,
1998).
16
An estimated 723,000 people were affected by devastating floods in kenya in November 2006
according to reports from the relief Web organization. The heavy rains caused rivers to overflow
their banks and inundate villages and farmland, produced landslides and increased the risk of
cholera and the other diseases that spread when water and sanitation systems were overwhelmed
by floods. The united Nations world food program estimates that emergency workers had been
unable to reach as many 150,000 affected people due to impassable roads (UN-
WFP,http:/col.gsfc.gov).
Heavy rains experienced during the latter part of 2009 resulted in flooding in the coastal regions
of Kenya which continued into January 2010 causing flooding incidences in Various parts of the
county. Rapid assessments in the affected regions indicated that at least 30 human deaths were
reported in various parts of the country, with some 30,000 people in the direct need of emergency
aid (Kenya Red cross society, 2010)
At the moment, kenya still lacks a comprehensive flood risk management policy and relies on
the existing flood risk reduction measures and strategies proposed in the draft national Disaster
management policy of 2007. The draft revised in 2009 proposes a continuum of measures such
as preparedness and prevention with the specific strategies such as flood risk vulnerability
assessment and mapping an integral flood management (IFM)projects and the strategy for flood
management in lake Victoria Basin of 2004 .However ,there are a number of sector specific
pieces of legislation that attempt to provide policy direction on flood management in kenya.
These include; the water Act, the environmental management in Kenya. These include the water
act among others (GOK, 2004, GOK, 2007; WMO) under the chiefs Act (CAP 128), power is
vested in the minister to call upon local chiefs to enlist the services of any able-bodied adult to
respond to an emergency such as floods (Draft National policy for Disaster management in
kenya, Feb 2009 national development process-including through
In 2002, kenya formulated a national policy on Disaster management to institutionalize
mechanism for addressing disaster (GOK, 2004b).The policy emphasizes preparedness on the
part of the government ,communities and other stakeholders in disaster risk reduction activities.it
aims to establish and strengthen disaster management institution ,partnerships, networking and
mainstreaming of disaster risk reduction in the development process so as to improve the
resilience of vulnerable groups to cope with potential disasters.it calls for the establishment of a
17
national Disaster Management Agency (NADIMA)through an act of parliament .The policy
integrates disaster risk reduction in the national development process-including through the
medium -Term expenditure framework, poverty reduction strategy paper (PRSP), National
Development Plan, National poverty eradication plan, economic recovery strategy for wealth and
employment creation
Riverine floods are the most dominant floods in Kenya. River floods mostly occur along
floodplains or wash lands as a result of exceeded stream flow capacity leading to over spilling of
the natural banks or artificial embankments (Smith & Ward, 1998). Riverine floods include
extreme events like the El Niño flood of 1997-98 with a low flood probability of 35-40 years (Q
35-40) and the more frequent small floods with a high flood probability of up to five years (Q5).
Major rivers in the country such as Nzoia, Nyando, Yala, Athi, Nairobi and Tana experience
seasonal river floods emanating from the country’s highlands that receive high annual rainfall
ranging from 1600-2000mm. These rivers flooded during the 1997/98 floods.
River floods affect both the rural and urban areas in form of flash and urban floods. Flash floods
have a characteristic short duration and steep rises and rapid falls of flood levels. They occur
abruptly without much warning as a result of an accelerated runoff or sudden dam failure and are
quite destructive due to their sudden occurrence. The arid and semi-arid lands of Kenya and urban
areas are particularly vulnerable to flash/sheet flooding. Urban floods result from over spilling
or surface ponding or when urban storm water drains become surcharged and over flow (Smith
& Ward, 1998).
Rainfall intensity, duration and flooding
Rainfall is the most important climatic variable in Kenya that supports most livelihoods, including
rain-fed agriculture. An annual rainfall pattern in the country indicates high spatial and temporal
variations with a strong bimodal seasonal trend across the country. The months of March-April-
May (MAM) and October-November-December (OND) record the highest rainfall peaks. The two
rainfall seasons are commonly referred to as the “long” and “short” rains respectively. Torrential
rainfall experienced during the wet months often translates into high stream/river flow (runoff) in
permanent and intermittent streams/rivers across the country resulting to seasonal floods. (Osbahr
and Viner 2006; WRI et al., 2007) indicate that rainfall seasons can be extremely wet and erratic
18
resulting to both large and small river devastating floods like the El Niño floods of 1997/98 with
significant socio-economic impacts.
Flood producing rains in Kenya are often driven by complex climatic variability phenomenon such
as the El Niño Southern Oscillation (ENSO)6 and tropical storms. Ogallo (1988; 1989, 1993) cited
in ICPAC (2007) notes that specific floods in Kenya have been associated with El Niño. Kenya
was amongst the 16 worst affected tropical and Pacific Rim countries during the 1997/98 El Niño
(Gadain et al., 2006, Glantz, 2001). The 1997-98 El Niño floods of the century as they have become
to known resulted in severe floods after major rivers in the country attained record peaks leading
to widespread riparian floods costly impacts. Kenya is one of the countries in the Greater Horn of
Africa (GHA) region that has been identified as having a strong ENSO signal (El Niño and La
Nina). The warm and cold ENSO cycles are often, but not always associated with above/below
average rainfall amounts that lead to floods and droughts respectively.
Riverine floods are the most dominant floods in Kenya. River floods mostly occur along
floodplains or wash lands as a result of exceeded stream flow capacity leading to over spilling of
the natural banks or artificial embankments (Smith and Ward, 1998). Riverine floods include
extreme events like the El Niño flood of 1997-98 with a low flood probability of 35-40 years and
the more frequent small floods with a high flood probability of up to five years. Major rivers in
the country such as Nzoia, Nyando, Yala, Athi, Nairobi and Tana experience seasonal river floods
emanating from the country’s highlands that receive high annual rainfall ranging from 1600-
2000mm. These rivers flooded during the 1997/98 floods. River floods affect both the rural and
urban areas in form of flash and urban floods.
Flash floods have a characteristic short duration and steep rises and rapid falls of flood levels. They
occur abruptly without much warning as a result of an accelerated runoff or sudden dam failure
and are quite destructive due to their sudden occurrence.
The arid and semi-arid lands of Kenya and urban areas are particularly vulnerable to flash/sheet
flooding. Urban floods result from over spilling or surface ponding or when urban storm water
drains become surcharged and over flow (Smith and Ward, 1998). Urban floods are common in
major cities and towns in Kenya including Nairobi, Mombasa, Kisumu, Nakuru, and Garissa.
19
Many of these urban areas experienced floods during the El Niño rains of 1997-98. The cause of
urban floods in Kenya is mainly poorly maintained drainage systems. Urban floods mainly affect
residents of informal settlements (slums) mushrooming in the country’s major cities. (ICPAC,
2007; UN/OCHA, 2006). The second largest city of Mombasa experienced severe flooding in
October 2006 that affected 60,000 people in the city and coastal region (Awuor et al; 2008). The
most recent urban floods occurred in Kisumu city between 20-21 September 2009 leaving 150
families displaced and 4 feared dead. This flood was linked to El Niño rains that were forecasted
by the Kenya Meteorological Department (KMD) during the short rain season of 2009.
Rainfall is the primary input to most hydrological systems, and a key issue for hydrological science
and practice is to assess the importance of the spatial structure of rainfall and its representation for
flood runoff generation. At the point when the waters of a flood emerge specifically from
precipitation, atmospheric factors can be distinguished as straightforwardly in charge of the
occasion (Doswell, 2003). That is, rainfalls happen that are well past the average qualities for the
influenced area. It is just when those rainfalls surpass the average that land which is generally dry
can be influenced; that is, a flood happens. In this way, the precipitation sums required for floods
can't be characterized in total terms (Doswell, 2003). A precipitation occasion that causes a flood
in one area may be well inside the limits of what is ordinary for another area. As a rule, the limit
for flood-delivering rainfalls increments as the yearly average precipitation for an area increment
(Doswell, 2003). Once more, hydrological factors regularly add to a river surge. While singular
thunderstorm systems can cause flash floods, river floods are typically the consequence of a
dormant concise scale climate pattern. Restricted substantial precipitation occasions happen
commonly amid a time of days or even months, each contributing a lot of precipitation to the
tributaries, which at that point release into the main stem of a river. The stream rises continuously
in light of all the information precipitation. The stream surge capability of a circumstance can be
expanded by simultaneous snow melts and different factors other than precipitation (Doswell,
2003).
In Kenya, rainfall is an important climatic variable that supports most livelihoods, including rain-
fed agriculture. An annual rainfall pattern in the country indicates high spatial and temporal
variations with a strong bimodal seasonal trend across the country. The months of March-May and
October-December record the highest rainfall peaks. The two rainfall seasons are commonly
20
referred to as the “long” and “short” rains respectively. Torrential rainfall experienced during the
wet months often translates into high stream/river flow (runoff) in permanent and intermittent
streams/rivers across the country resulting to seasonal floods. Rainfall seasons in Kenya can be
extremely wet and erratic resulting to both large and small river devastating floods like the El Niño
floods of 1997/98 with significant socio-economic impacts (Osbahr & Viner, 2006; WRI et al.
2007).
Rain that results to floods in Kenya are often driven by complex climatic variability phenomenon
such as the El Niño Southern Oscillation (ENSO) and tropical storms. Ogallo (1988; 1989, 1993)
cited in ICPAC (2007) notes that, specific floods in Kenya have been associated with El Niño.
As greenhouse gases increment in the environment, the climate system is warming on the grounds
that these gases trap more heat (Hartmann, Klein, Rusticucci, Alexander, Brönnimann, Charabi,
Dentener, Dlugokencky, Easterling, Kaplan, Soden, Thorne, Wild and Zhai, 2013). The large
water bodies are additionally warming, particularly at the surface, what's more, this is driving
higher evaporation rates that, thus, expands the measure of water vapor in the climate. A hotter
air can hold more water vapor, driving thus to more exceptional precipitation. The 1°C
temperature rise that has just happened, together with expanding evaporation, has prompted an
expansion of around 7% in the measure of water vapor in the climate (Hartmann et al. 2013).
Kenya was amongst the 16 worst affected tropical and Pacific Rim countries during the 1997/98
El Niño (Gadain et al. 2006). The 1997-98 El Niño floods of the century as they have become to
known resulted in severe floods after major rivers in the country attained record peaks leading to
widespread riparian floods costly impacts. Kenya is one of the countries in the Greater Horn of
Africa (GHA) region that has been identified as having a strong ENSO signal (El Niño and La
Nina). The warm and cold ENSO cycles are often, but not always associated with above/below
average rainfall amounts that lead to floods and droughts respectively. El Niño is already a major
concern to Kenya due to its adverse impacts including floods and droughts (GoK, 2002).
2.3 Budalang’i flood plains
Budalang’i flood plains lies to the north of Lake Victoria close to Kenya-Uganda border’s in
Busia County. The flood plains are mainly on the mouth of River Nzoia and partly on River Yala
(UNEP, 2013). The River Nzoia main streams flows from an elevation of about 2288 a.s.l of the
21
Elgeyo Escarpment and the Cherangani Hills. Its tributaries, which flow from the high slopes of
Mount Elgon, attain maximum elevation in the river’s basin and are estimated to be about 4300
m a.s.l. (Paolo et al. 2013).
The Budalang’i area is prone to flooding, and as a result dykes were constructed between the
years 1977-1984 to mitigate the floods. However, with the growing population large areas of
forests upstream were cleared for human settlement and crop farming. Consequently, erosion and
foreseeable soil slippage and landslides occurs on annual basis due to floods (UNEP, 2009). The
accumulation of many years of sediment in the river bed has made the channel of the river course
to be above the general level of the floodplain as a result overbank flow across the 400–600-m-
wide dykes causes massive flooding. The sediment accumulates and reduces the capacity of river
channel so that the river overflows the banks forming the delta (Paolo et al. 2013).
2.4 Flood management and control
The management of floods as problems in isolation almost necessarily results in a piecemeal,
localized approach. Integrated Flood Management calls for a paradigm shift from the traditional
fragmented approach and encourages the efficient use of the resources of the river basin,
employing strategies to maintain or augment the productivity of floodplains, while at the same
time providing protective measures against the losses due to flooding. Sustainable development
through Integrated Water Resources Management aims at the sustained improvement in the living
conditions of all citizens in an environment characterized by equity, security and freedom of
choice.
Integrated Water Resources Management necessitates the integration both of natural and human
systems and of land and water management. Both population growth and economic growth exert
considerable pressure on the natural resources of a system. Increased population pressure and
enhanced economic activities in floodplains, such as the construction of buildings and
infrastructure, further increase the risk of flooding. Floodplains provide excellent, technically easy
livelihood opportunities in many cases. In developing countries with primarily agricultural
economies, food security is synonymous with livelihood security.
The ecosystem approach is a strategy for the integrated management of land, water and living
resources, a strategy that promotes conservation and sustainable use in an equitable manner. Both
22
Integrated Water Resources Management and Integrated Flood Management encompass the main
principles of the ecosystem approach by considering the entire basin ecosystem as a unit and by
accounting for the effects of economic interventions in the basin.
Environmental sustainability of the flood management options is one of the prerequisites in IFM.
Sustainable and effective management of water resources demands a holistic approach, linking
social and economic development with the protection of natural ecosystems and providing
appropriate management links between land and water uses. Therefore, water related disasters,
such as floods and droughts, because they play an important part in determining sustainable
development, need to be integrated into water resources management.
As early as 2000-3000 BC the ancient civilization of Mesopotamia had a system consisting of
banks, channels and regulation constructions to ensure safe settlements and good working
agriculture (Haggstrom, 1999). Thus, flood control is not a new engineering field but has of course
evolved over history in both terms of technical solutions as well as in planning and operation.
Flood management is today a large field involving different competencies and many subjects, all
with their own difficulties and challenges. The two greatest are how to identify and understand
flood risk, and how to handle and reduce that risk by implementation of measures. An integrated
approach that combines the whole field is preferred and recommended (Jha et al. 2012).
In Netherlands a methodology applying spatial planning and changes in a wide range of parts of
strategy making has been utilized with the end goal that Instead of raising the level of the dykes,
dykes have been moved to open up floodplains. Swamps and surge water stockpiling regions have
been made to briefly store surge waters when required. Floodplains levels have been brought down
to take into account more prominent surge water stockpiling. Homes and families have been
migrated to take into consideration extended floodplains (Murray, 2017). North Yorkshire chose
to 'moderate the stream' by catchment scale demonstrating to focus on the usage of an extensive
variety of measures to diminish, moderate and store surge water in the scene and decrease the size
of surge age downstream. Following itemized hydrological displaying, directed measures have
been actualized in the correct areas along those tributaries and regions inside every one of the
catchments that offer ideal advantage for surge lessening (Murray, 2017). Dublin the legislature
brought down segments of parkland by the expulsion of very nearly 60 million liters of soil and
the arrangement of built wetlands (large stormwater retention ponds) comprised of five
23
disconnected lakes, controlled by weirs, were developed on the floodplain. The subsequent brought
down territories fill in as a holding territory to hold surge waters and enable them to be gradually
discharged once more into the waterway as the surge dies down (Murray, 2017).
Implementing non-structural measures such as operation of flood forecasting and warning system,
preparation of hazard maps, and development of evacuation and precaution, improves adaptive
capacity of related government agencies and communities.
Development of legal systems such as development regulation for the flood prone areas,
development regulation of upstream forest to retain water and farmlands to store flooded water,
improve adaptive capacity.
If adequate public information is implemented, and inhabitants are educated and responsive on
disaster and risk management issues, they would implement appropriate precautionary measures
and actions in times of disaster, hence, improving their adaptive capacity.
In Netherlands a methodology applying spatial planning and changes in a wide range of parts of
strategy making has been utilized with the end goal that Instead of raising the level of the dykes,
dykes have been moved to open up floodplains. Swamps and surge water stockpiling regions have
been made to briefly store surge waters when required. Floodplains levels have been brought down
to take into account more prominent surge water storage. Homes and families have been drifted to
take into consideration extended floodplains (Murray, 2017). North Yorkshire chose to 'moderate
the stream' by catchment scale demonstrating to focus on the usage of an extensive variety of
measures to diminish, moderate and store surge water in the scene and decrease the size of surge
age downstream. Dublin the legislature brought down segments of parkland by the expulsion of
very nearly 60 million liters of soil and the arrangement of built wetlands (large storm water
retention ponds) comprised of five disconnected lakes, controlled by weirs, were developed on the
floodplain. The subsequent brought down territories fill in as a holding territory to hold surge
waters and enable them to be gradually discharged once more into the waterway as the surge dies
down (Murray, 2017).
Check dams and diversion channels have been worked by the Ministry of Agriculture to offer
assurance to horticultural fields along River Nyando's flood plain. Just 8 km of dykes, 4 km on
24
either bank were set up in the lower spans of River Nyando continuously 2004. (WMO and GoK,
2004; Otiende, 2009). The Seven Forks Dam venture comprises of a progression of multipurpose
reservoirs in the upper catchment of Tana River. Notwithstanding filling in as flood control
measures, the dams were produced as a major aspect of the hydropower plot and for water system
utilize. The Radio and Internet (RANET) program offers an open door for dispersing flood
forecasts to vulnerable rustic networks in the flood inclined territories of Kenya. The
administration organizes flood crisis, help and recovery reaction measures through the Rapid-
Onset Disaster Committee and District Steering Committees. Philanthropic exercises are embraced
in the influenced locale with help from different organizations associated with compassionate
reaction, for example, the KRCS, UN offices and NGOs (UN-OCHA, 2006; Otiende, 2009).
Dykes are found along the tremendous system of changeless rivers in Lake Victoria Basin that
encounter regular flooding. The dykes on River Nzoia measure 36.4 km long with 16.2 km in the
northern and 18.4 km on the southern banks of the River. They offer assurance to inhabitants in
Busia and Budalang'i locale in western Kenya (GoK, 2007; Otiende, 2009). The development of
River Nzoia dykes started in 1977 and was finished in 1984 at an expense of Ksh 17 million (WMO
and GoK, 2004; Otiende, 2009).
2.5 Theoretical framework (Strahler’s 1952)
The study adopted Strahler’s (1952) stream ordering theory. In Strahler's ordering the main
channel is not determined; instead the ordering is based on the hierarchy of tributaries. The
ordering follows these rules:
1. if the node has no children, its Strahler order is 1.
2. if the node has one and only one tributary with Strahler greatest order i, and all other
tributaries have order less than i, then the order remains i.
3. if the node has two or more tributaries with greatest order i, then the Strahler order of the
node is i + 1.
Strahler's stream ordering starts in initial links which assigns order one. It proceeds downstream.
At every node it verifies that there are at least 2 equal tributaries with maximum order. If not, it
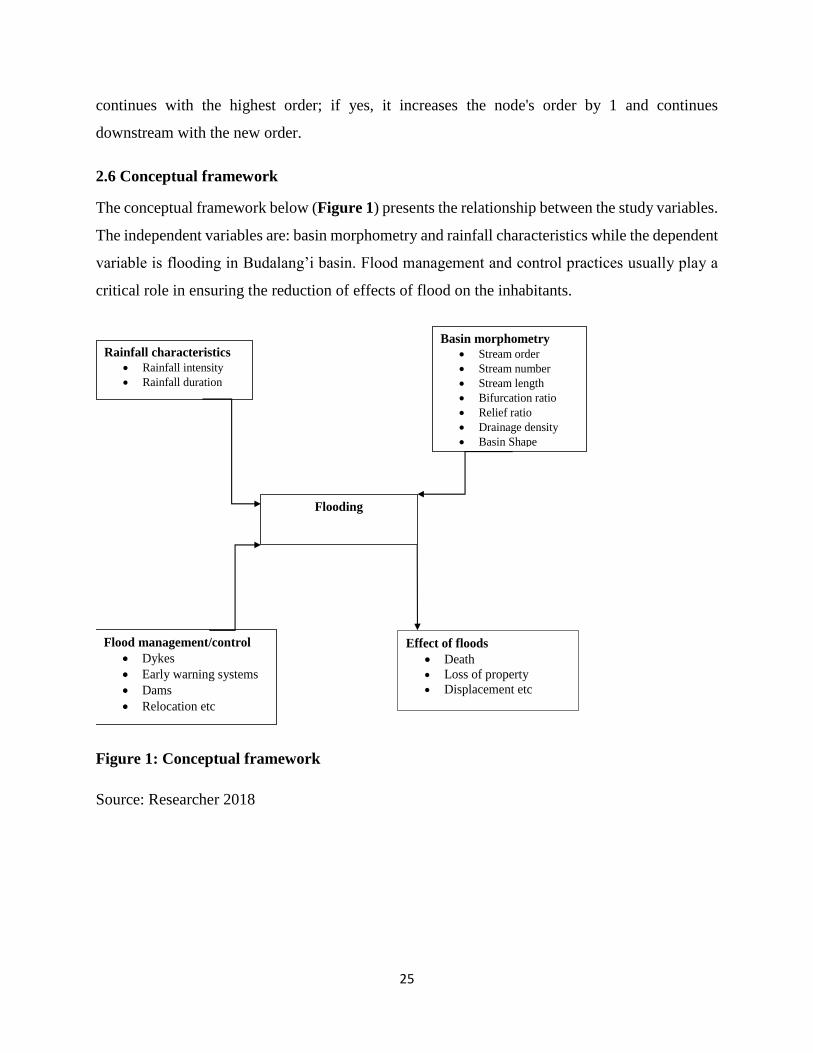
25
continues with the highest order; if yes, it increases the node's order by 1 and continues
downstream with the new order.
2.6 Conceptual framework
The conceptual framework below (Figure 1) presents the relationship between the study variables.
The independent variables are: basin morphometry and rainfall characteristics while the dependent
variable is flooding in Budalang’i basin. Flood management and control practices usually play a
critical role in ensuring the reduction of effects of flood on the inhabitants.
Figure 1: Conceptual framework
Source: Researcher 2018
Figure 1: Conceptual Framework: Flooding in Nzoia basin
Source: Researcher 2018
Flooding
Flood management/control
• Dykes
• Early warning systems
• Dams
• Relocation etc
Effect of floods
• Death
• Loss of property
• Displacement etc
Rainfall characteristics
• Rainfall intensity
• Rainfall duration
Basin morphometry
• Stream order
• Stream number
• Stream length
• Bifurcation ratio
• Relief ratio
• Drainage density
• Basin Shape

26
2.7 Gaps in the literature review
• There is no much documentation information existing on river morphometry and flooding
• River Nzoia basin morphometric characteristics in relation to flooding in Budalangi area
has been scantly studied
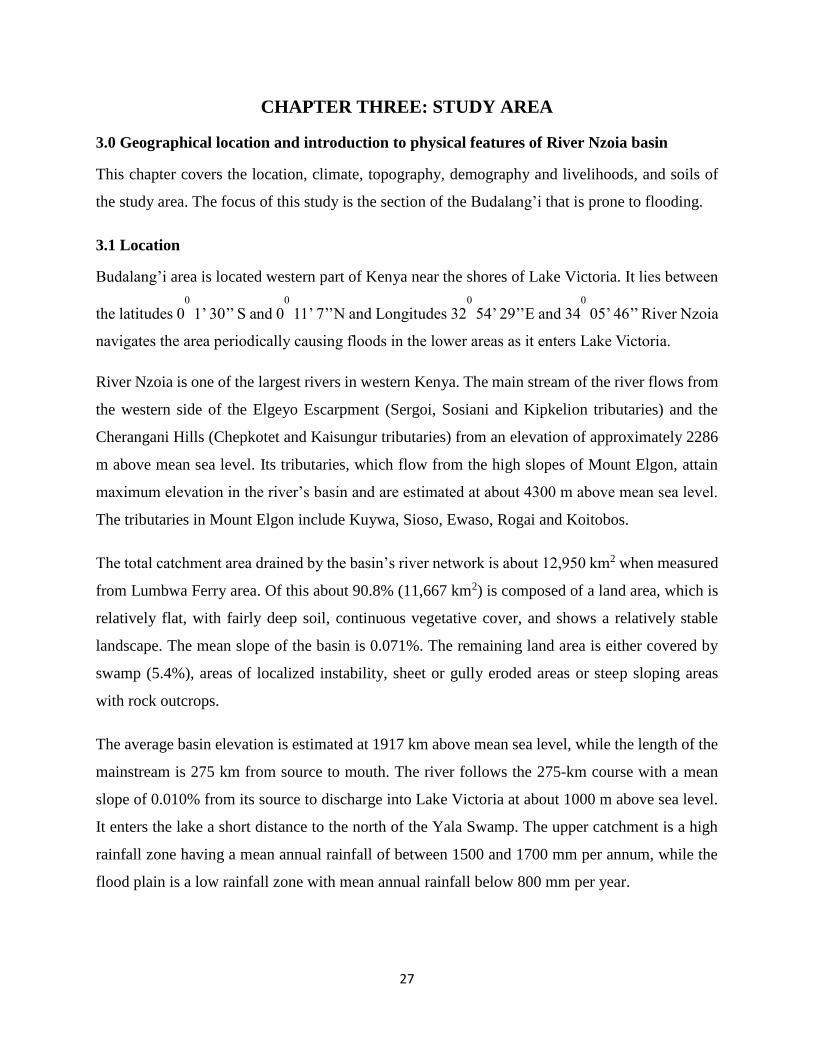
27
CHAPTER THREE: STUDY AREA
3.0 Geographical location and introduction to physical features of River Nzoia basin
This chapter covers the location, climate, topography, demography and livelihoods, and soils of
the study area. The focus of this study is the section of the Budalang’i that is prone to flooding.
3.1 Location
Budalang’i area is located western part of Kenya near the shores of Lake Victoria. It lies between
the latitudes 00
1’ 30’’ S and 00
11’ 7’’N and Longitudes 320
54’ 29’’E and 340
05’ 46’’ River Nzoia
navigates the area periodically causing floods in the lower areas as it enters Lake Victoria.
River Nzoia is one of the largest rivers in western Kenya. The main stream of the river flows from
the western side of the Elgeyo Escarpment (Sergoi, Sosiani and Kipkelion tributaries) and the
Cherangani Hills (Chepkotet and Kaisungur tributaries) from an elevation of approximately 2286
m above mean sea level. Its tributaries, which flow from the high slopes of Mount Elgon, attain
maximum elevation in the river’s basin and are estimated at about 4300 m above mean sea level.
The tributaries in Mount Elgon include Kuywa, Sioso, Ewaso, Rogai and Koitobos.
The total catchment area drained by the basin’s river network is about 12,950 km2 when measured
from Lumbwa Ferry area. Of this about 90.8% (11,667 km2) is composed of a land area, which is
relatively flat, with fairly deep soil, continuous vegetative cover, and shows a relatively stable
landscape. The mean slope of the basin is 0.071%. The remaining land area is either covered by
swamp (5.4%), areas of localized instability, sheet or gully eroded areas or steep sloping areas
with rock outcrops.
The average basin elevation is estimated at 1917 km above mean sea level, while the length of the
mainstream is 275 km from source to mouth. The river follows the 275-km course with a mean
slope of 0.010% from its source to discharge into Lake Victoria at about 1000 m above sea level.
It enters the lake a short distance to the north of the Yala Swamp. The upper catchment is a high
rainfall zone having a mean annual rainfall of between 1500 and 1700 mm per annum, while the
flood plain is a low rainfall zone with mean annual rainfall below 800 mm per year.
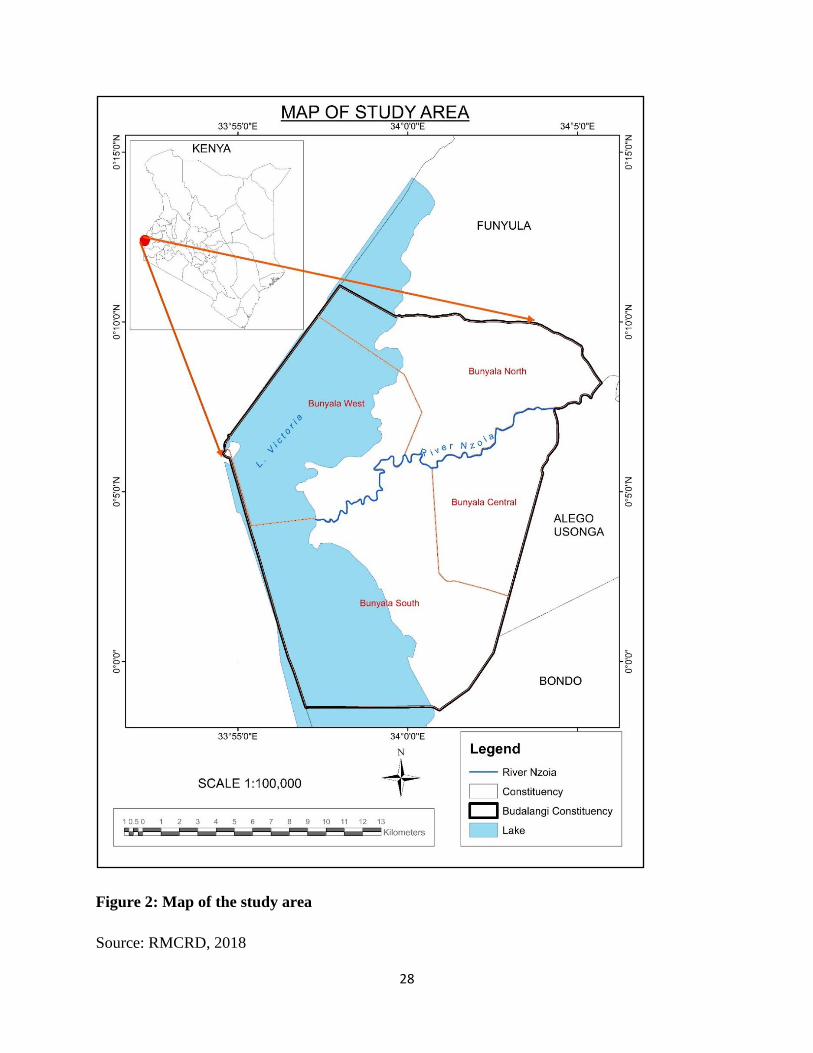
28
Figure 2: Map of the study area
Source: RMCRD, 2018
29
3.2 Climate
Climate is one of the main factors causing disasters due its abundant precipitation that leads to
dam breaks, flooding, soil erosion, water pollution, famine and outbreak of water-related diseases
(Odada et al., 2006).
The climate of Budalang’i area ranges from semi humid to semi-arid, semi humid and sub humid
characterized by mean annual temperatures of 20-220c, mean maximum temperature of 26-280c,
mean minimum temperature of 14-160c and absolute minimum temperature 6-80c (Kenya
metrological station). The area is classified as moderately warm in relation to temperature. The
area experiences four seasons in a year as a result of inter-tropical convergence zone (ITCZ). There
are two rainy seasons and two dry seasons; shorts rain which occurs from October to December)
and long Rains (March to May). The local relief and influences of the Lake Victoria modify the
weather patterns
3.3 Topography
Topography and size of the basin influences how much and how quickly rainwater reaches the
river network. Topographic characteristics that affect runoff response time include watershed
shape, drainage pattern, water shed slope and stream channel slope. The topography of a region
also determines land-use patterns and the patterns and intensity of erosion and landslides. It
influences the gradient of rivers such that in areas with steep slopes, water flows rapidly into river
channels. In such cases, the flood stage of a river is reached rapidly. In flat plains, the gentle slope
reduces the velocity of flow leading to formation of meanders and flood plains. Water in such areas
is not transported rapidly and tends to pile up making the low-lying zones more liable to flooding.
The topography determines land-use patterns and intensity of erosion and landslides. For instance,
there is a rapid flow of water in areas with steep slopes thereby causing the flood stage of a river
to be reached faster. On the other hand, the velocity of water flow is reduced in flat plains or in
areas with gentle slopes. This leads to formation of flood plains and meanders hence pile and
become more predisposed to flooding for example Kano Plains (Opere, 2013).
The Altitude of Budalang’i area ranges between 1100-1300 meters above sea level (3600-
4300feet). The topography of Budalang’i area is relatively flat, being mostly made up of the
alluvial plain of the Nzoia River. The ground generally slopes gently to the south west. A ridge
30
running north- eastward from Port Victoria prevents the north bank flood plain from draining
directly towards Lake Victoria (UNEP, 2006). When the water level in the river Nzoia rises to an
extent that it breaks its banks, it is most likely that the larger part of Budalang’i area floods due to
the prevailing nature of the land and the soil types
Figure 3: Map showing slope in Budalang’i area
Source: Researcher 2018
Figure 4: The Terrain of Nzoia River Basin
Source: RMCRD 2018
3.4 Geology
The geologic characteristics of an area are known to influence the drainage patterns, the nature of
soils and land-use patterns. For instance, heavy rainfall is more likely to cause flooding in low-
lying regions occupied with clay formations because clay formations have low infiltration
capacities and therefore surface run-off is generated rapidly. Heavy rainfall, for instance, causes
flooding in low-lying areas characterized by clay formations which has low penetration capacities
and hence rapid surface run-off (Opere, 2013).
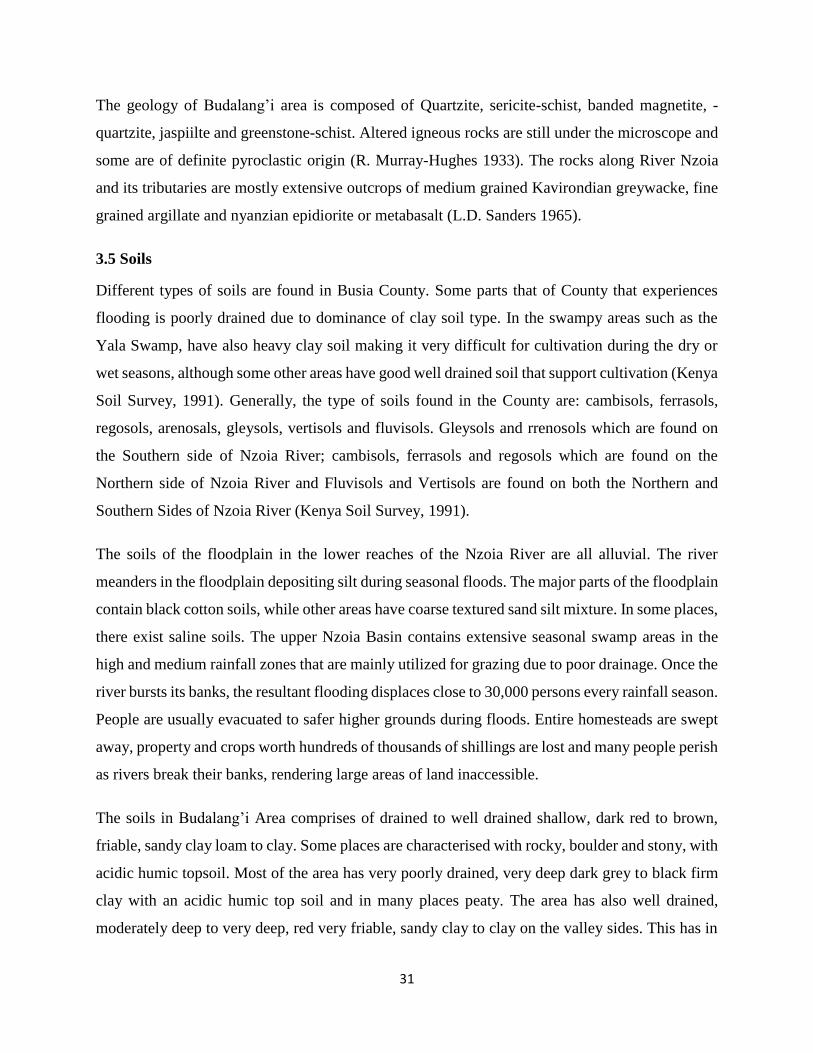
31
The geology of Budalang’i area is composed of Quartzite, sericite-schist, banded magnetite, -
quartzite, jaspiilte and greenstone-schist. Altered igneous rocks are still under the microscope and
some are of definite pyroclastic origin (R. Murray-Hughes 1933). The rocks along River Nzoia
and its tributaries are mostly extensive outcrops of medium grained Kavirondian greywacke, fine
grained argillate and nyanzian epidiorite or metabasalt (L.D. Sanders 1965).
3.5 Soils
Different types of soils are found in Busia County. Some parts that of County that experiences
flooding is poorly drained due to dominance of clay soil type. In the swampy areas such as the
Yala Swamp, have also heavy clay soil making it very difficult for cultivation during the dry or
wet seasons, although some other areas have good well drained soil that support cultivation (Kenya
Soil Survey, 1991). Generally, the type of soils found in the County are: cambisols, ferrasols,
regosols, arenosals, gleysols, vertisols and fluvisols. Gleysols and rrenosols which are found on
the Southern side of Nzoia River; cambisols, ferrasols and regosols which are found on the
Northern side of Nzoia River and Fluvisols and Vertisols are found on both the Northern and
Southern Sides of Nzoia River (Kenya Soil Survey, 1991).
The soils of the floodplain in the lower reaches of the Nzoia River are all alluvial. The river
meanders in the floodplain depositing silt during seasonal floods. The major parts of the floodplain
contain black cotton soils, while other areas have coarse textured sand silt mixture. In some places,
there exist saline soils. The upper Nzoia Basin contains extensive seasonal swamp areas in the
high and medium rainfall zones that are mainly utilized for grazing due to poor drainage. Once the
river bursts its banks, the resultant flooding displaces close to 30,000 persons every rainfall season.
People are usually evacuated to safer higher grounds during floods. Entire homesteads are swept
away, property and crops worth hundreds of thousands of shillings are lost and many people perish
as rivers break their banks, rendering large areas of land inaccessible.
The soils in Budalang’i Area comprises of drained to well drained shallow, dark red to brown,
friable, sandy clay loam to clay. Some places are characterised with rocky, boulder and stony, with
acidic humic topsoil. Most of the area has very poorly drained, very deep dark grey to black firm
clay with an acidic humic top soil and in many places peaty. The area has also well drained,
moderately deep to very deep, red very friable, sandy clay to clay on the valley sides. This has in
32
turn attracted farming activies along the river valleys. In case of a flood event, water takes longer
time stagnating in most of the area because of the clay soil that tend to retain water for long time.
The alluvial soils and annual rainfall of between 750 and 1,015 mm support small-scale agriculture
as well as livestock keeping (Bunyala District Report, 2008). The area is a host to the Bunyala
Irrigation Scheme, which cuts across the boundaries of Busia and Siaya counties and covers about
1,734 acres.
The basin has the potential for growing a wide variety of crops and producing livestock, due to its
good soil and gently sloping terrain. However, the high-water table in the floodplain renders the
area uninhabitable during much of the wet season. Population growth and pressure for land
however, continues to push people to these flood-prone areas. The search for more agricultural
land also spurs encroachment into Nzoia River wetlands. By settling in the flood plain areas, more
people and households in Bunyala are at risk of flood hazards (Onywere et. al. 2011; Bunyala
District Report, 2008).
3.6 Demography and livelihoods
According to the KNBS (2013), Budalang’i has a total population of about 63,000 people and
15245 households (2013 Census), who inhabit the region mostly affected by floods. Of this, 54%
of the total population is made up of women, while 60% is made up of children between 0 and 14
years. The entire Budalang’i has 4 county Assembly Wards with 6 locations and 18 sub-locations.
The areas affected by River Nzoia which divide Budalang’i into two sections, suffer a lot during
the over flooding of this river since the dykes no longer contain the floods as required. The
accumulation of many years of sediment in the river bed has made the channel of the river course
to be above the general level of the flood plain as a result overbank flow across the 400–600-m-
wide dykes causes massive flooding.
3.7 Drainage
The hydrology of lower Nzoia area lies in Lake Victoria drainage basin and number of significant
swampy areas exist in the area including Mundere Swamp to the north of the river and Yala Swamp
to the south. Yala Swamp is fed by River Yala and is one of the largest swamps in the area as it
drains into Lake Victoria via a number of small channels including Ndekwe stream, which also
carries drainage from Bunyala pilot irrigation scheme (UNEP, 2009). The River is about 315km
33
and drains a total catchment area of 12, 696km2. The size of Lower Nzoia basin is 2593km2. Along
the river the slope reduces from 0.5% in the upper reaches to 0.04% in the lower reaches over the
last 30km, which is in the area of the project (Paolo et al. 2013).
The total catchment area drained by the basin’s river network is about 12,950 km2 when measured
from Lumbwa Ferry area. Of this about 90.8% (11,667 km2) is composed of a land area, which is
relatively flat, with fairly deep soil, continuous vegetative cover, and shows a relatively stable
landscape. The mean slope of the basin is 0.071%. The remaining land area is either covered by
swamp (5.4%), areas of localized instability, sheet or gully eroded areas or steep sloping areas
with rock outcrops.
The average basin elevation is estimated at 1917 km above mean sea level, while the length of the
mainstream is 275 km from source to mouth. The river follows the 275 km course with a mean
slope of 0.010% from its source to discharge into Lake Victoria at about 1000 m above sea level.
It enters the lake a short distance to the north of the Yala Swamp. The upper catchment is a high
rainfall zone having a mean annual rainfall of between 1500 and 1700 mm per annum, while the
flood plain is a low rainfall zone with mean annual rainfall below 800 mm per year.
The width of the channel decreases gradually from about 50 m at 140 km inland to around 40 m
in the upper reaches of Kakamega, Bungoma, Trans Nzoia and Uasin Gishu Districts where the
altitude is high, and the slopes are steep. The sediment accumulates and reduces the capacity of
river channel so that the river overflows the banks forming the delta. The flow regime of the Nzoia
is varied and is occasionally as low as 20 m3/s and with extreme floods that may surpass 1100
m3/s, which is the proposed protection level for the dykes for a 25-year, return flood. Siltation is
heavy. Earlier estimates of siltation rates by Italconsult are in the order of 158 tonnes per day;
however, recent assessments by Lake Basin Development Authority (LBDA) for the period 2000–
2003 put it at 574 tonnes per day, which is thrice the value. The discharge varies from a low flow
of 2.8 m3/s to a 100-year flood flow of 930 m3/s.
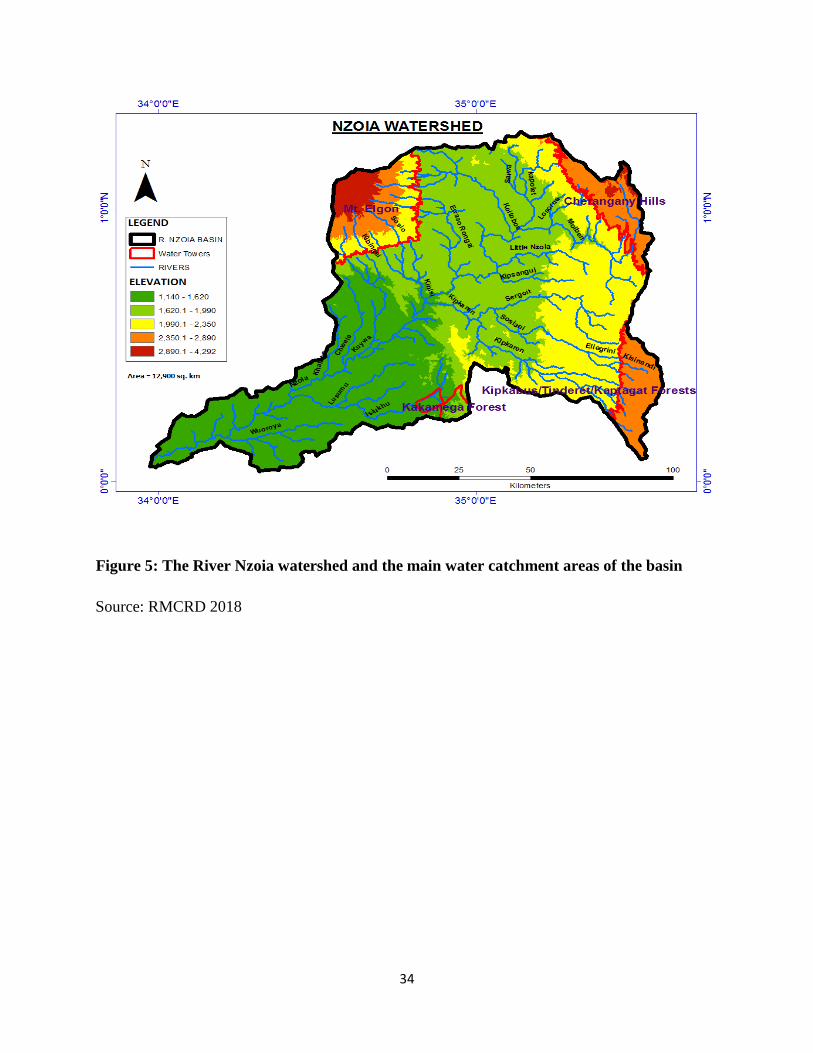
34
Figure 5: The River Nzoia watershed and the main water catchment areas of the basin
Source: RMCRD 2018
35
CHAPTER FOUR: RESEARCH METHODOLOGY
4.0 Introduction
This chapter presents the research methodology applied in conducting the study. It covers the
research design, target population, sampling design, data collection and data analysis techniques.
4.1 Research design
The study adopted a descriptive research design. Descriptive research collects data and makes
deductions about a population of interest at one point in time. A descriptive research design
describes people responses to questions about a phenomenon or situation with aim of
understanding respondent’s perceptions from which truism is constructed (Kim, 2009). The aim is
to gather data without manipulation of research context and deals with natural phenomena where
the researcher has no control over variables (Mugenda & Mugenda, 1999).
4.2 Target population
According to the KNBS (2013), Budalang’i has a total population of about 63,000 people and
15245 households (2013 Census), who inhabit the region mostly affected by floods. The target
population consisted of 237 households which were identified as living in the flood risk areas.
4.3 Sample design
4.3.1 Sample size
Using the following formula (Nassiuma, 2002)
Sample size (n) = {NCv2}/ {Cv
2+ (N-1) e2}
Where:
Cv = coefficient of variation (0.5)
e = tolerance at desired level of confidence (0.05) at 95% confidence level.
N = target population
Therefore: n =. {237*0.52}/ {0.52+ (236* 0.052}
=71 households
36
Households were the unit of analysis because of the governmental structure in the study area
because they represent the area with identical inhabitants with respect to population
physiognomies, economic status, and living conditions.
4.3.2 Sampling procedure
Simple random sampling was used to select the households to make sure that they provide a true
sample of the entire population and allow each household an equal chance of being selected. This
also ensured that accurate results are obtained for purposes of generalizing and inferences. A small
sample size of 70 households was used for the questionnaire administration.
4.3 Data collection
Primary data on human activities, distribution and seasonal variation of the river was obtained by
field observations and photography. Structure questionnaires were used to gather information on
flood risk management and flooding occurrences in the study area.
Secondary data was obtained on land use and morphometry from satellite images from Department
of Resource Surveys and Remote Sensing (DRSRS), rainfall intensity and duration from the
Meteorological Department and soil characteristics from the Soil Survey of Kenya.
Topographical maps of River Nzoia Basin on scale 1:50,000, published by survey of Kenya,
obtained from their offices were used as fundamental data source for computing morphometric
parameters. These maps are highly endorsed for a study of this nature (Ajibade et. al, 2010). The
hard copies of topographic maps of the study area were scanned and saved in GIS compatible
format; it was later exported to the ArcGIS 10.2 user interface where the maps were georeferenced
and brought to a common spatial reference system for better analysis.
4.4 Data analysis
The major datasets that were used for this study include: Landsat Satellite Imageries, Digital
Elevation Data (DEM) and Auxiliary data that included Roads, administrative boundaries, ground
truth data for land use land cover classes and topographic map of the area.
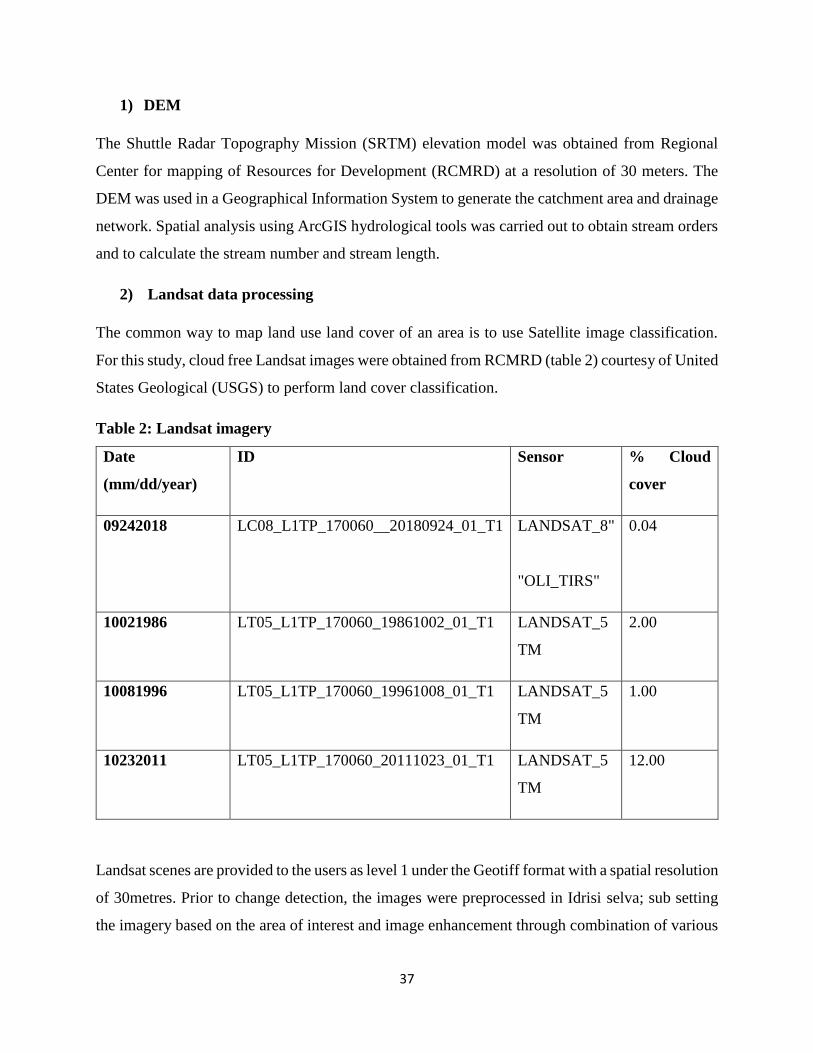
37
1) DEM
The Shuttle Radar Topography Mission (SRTM) elevation model was obtained from Regional
Center for mapping of Resources for Development (RCMRD) at a resolution of 30 meters. The
DEM was used in a Geographical Information System to generate the catchment area and drainage
network. Spatial analysis using ArcGIS hydrological tools was carried out to obtain stream orders
and to calculate the stream number and stream length.
2) Landsat data processing
The common way to map land use land cover of an area is to use Satellite image classification.
For this study, cloud free Landsat images were obtained from RCMRD (table 2) courtesy of United
States Geological (USGS) to perform land cover classification.
Table 2: Landsat imagery
Date
(mm/dd/year)
ID Sensor % Cloud
cover
09242018 LC08_L1TP_170060__20180924_01_T1 LANDSAT_8"
"OLI_TIRS"
0.04
10021986 LT05_L1TP_170060_19861002_01_T1 LANDSAT_5
TM
2.00
10081996 LT05_L1TP_170060_19961008_01_T1 LANDSAT_5
TM
1.00
10232011 LT05_L1TP_170060_20111023_01_T1 LANDSAT_5
TM
12.00
Landsat scenes are provided to the users as level 1 under the Geotiff format with a spatial resolution
of 30metres. Prior to change detection, the images were preprocessed in Idrisi selva; sub setting
the imagery based on the area of interest and image enhancement through combination of various
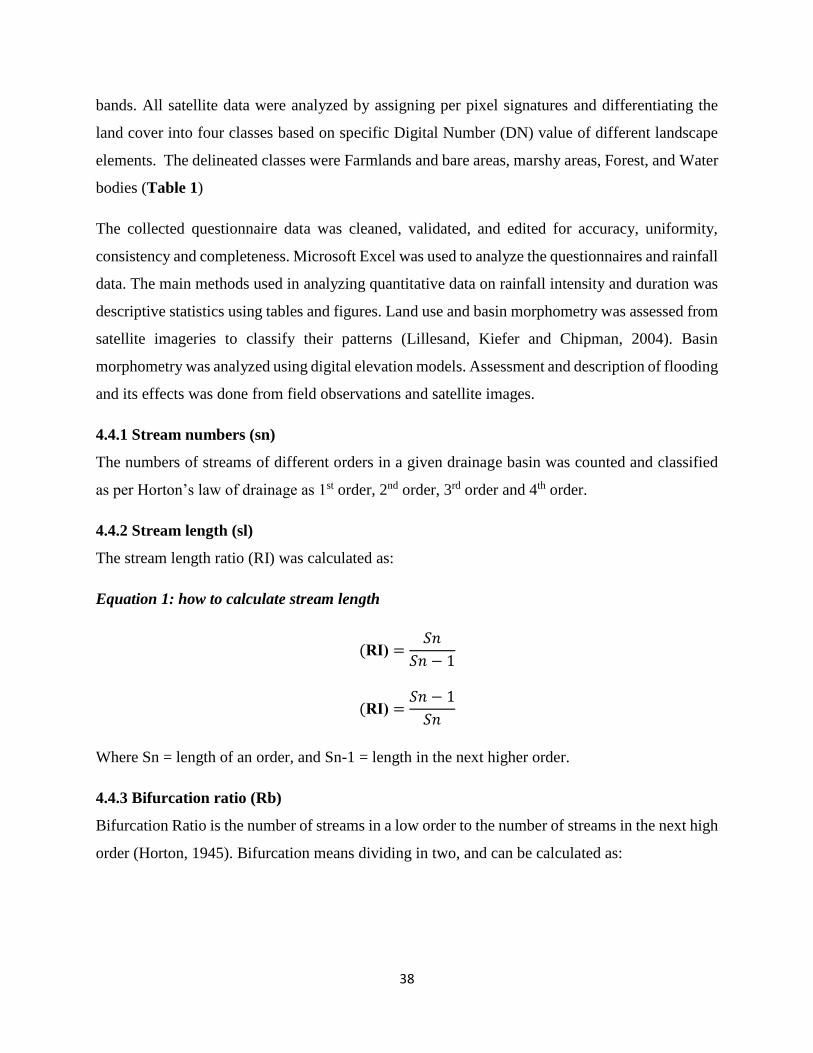
38
bands. All satellite data were analyzed by assigning per pixel signatures and differentiating the
land cover into four classes based on specific Digital Number (DN) value of different landscape
elements. The delineated classes were Farmlands and bare areas, marshy areas, Forest, and Water
bodies (Table 1)
The collected questionnaire data was cleaned, validated, and edited for accuracy, uniformity,
consistency and completeness. Microsoft Excel was used to analyze the questionnaires and rainfall
data. The main methods used in analyzing quantitative data on rainfall intensity and duration was
descriptive statistics using tables and figures. Land use and basin morphometry was assessed from
satellite imageries to classify their patterns (Lillesand, Kiefer and Chipman, 2004). Basin
morphometry was analyzed using digital elevation models. Assessment and description of flooding
and its effects was done from field observations and satellite images.
4.4.1 Stream numbers (sn)
The numbers of streams of different orders in a given drainage basin was counted and classified
as per Horton’s law of drainage as 1st order, 2nd order, 3rd order and 4th order.
4.4.2 Stream length (sl)
The stream length ratio (RI) was calculated as:
Equation 1: how to calculate stream length
(RI) =𝑆𝑛
𝑆𝑛 − 1
(RI) =𝑆𝑛 − 1
𝑆𝑛
Where Sn = length of an order, and Sn-1 = length in the next higher order.
4.4.3 Bifurcation ratio (Rb)
Bifurcation Ratio is the number of streams in a low order to the number of streams in the next high
order (Horton, 1945). Bifurcation means dividing in two, and can be calculated as:
39
Equation 2-how to calculate the Burfacation ratio
Rb =number of stream segment in a given order
Number of streams segments in the next highest order
4.4.4 Relief Ratio (Rh)
Equation 3: how to calculate relief Ratio
Relative Relief = Maximum basin relief
Maximum basin length
4.4.5 Drainage density (Dd)
Equation 4: how to calculate drainage density(Dd)
D = ratio of total channel-segment lengths
Basin area
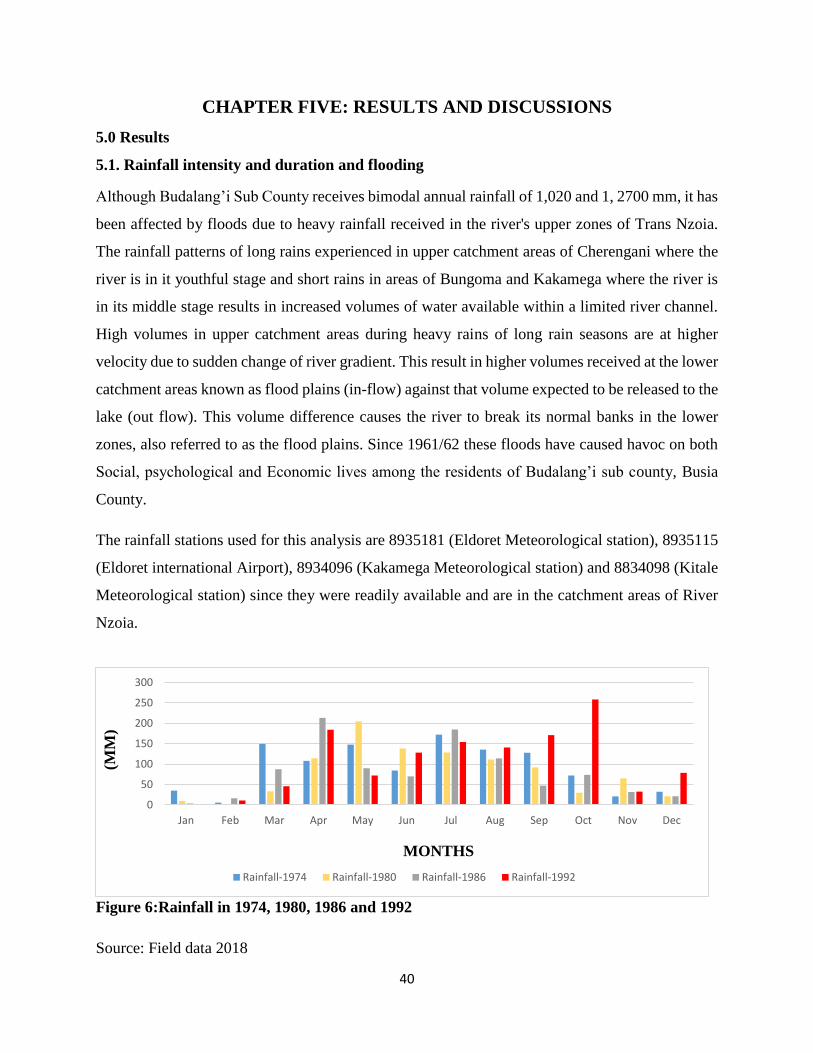
40
CHAPTER FIVE: RESULTS AND DISCUSSIONS
5.0 Results
5.1. Rainfall intensity and duration and flooding
Although Budalang’i Sub County receives bimodal annual rainfall of 1,020 and 1, 2700 mm, it has
been affected by floods due to heavy rainfall received in the river's upper zones of Trans Nzoia.
The rainfall patterns of long rains experienced in upper catchment areas of Cherengani where the
river is in it youthful stage and short rains in areas of Bungoma and Kakamega where the river is
in its middle stage results in increased volumes of water available within a limited river channel.
High volumes in upper catchment areas during heavy rains of long rain seasons are at higher
velocity due to sudden change of river gradient. This result in higher volumes received at the lower
catchment areas known as flood plains (in-flow) against that volume expected to be released to the
lake (out flow). This volume difference causes the river to break its normal banks in the lower
zones, also referred to as the flood plains. Since 1961/62 these floods have caused havoc on both
Social, psychological and Economic lives among the residents of Budalang’i sub county, Busia
County.
The rainfall stations used for this analysis are 8935181 (Eldoret Meteorological station), 8935115
(Eldoret international Airport), 8934096 (Kakamega Meteorological station) and 8834098 (Kitale
Meteorological station) since they were readily available and are in the catchment areas of River
Nzoia.
Figure 6:Rainfall in 1974, 1980, 1986 and 1992
Source: Field data 2018
0
50
100
150
200
250
300
Jan Feb Mar Apr May Jun Jul Aug Sep Oct Nov Dec
(MM
)
MONTHS
Rainfall-1974 Rainfall-1980 Rainfall-1986 Rainfall-1992
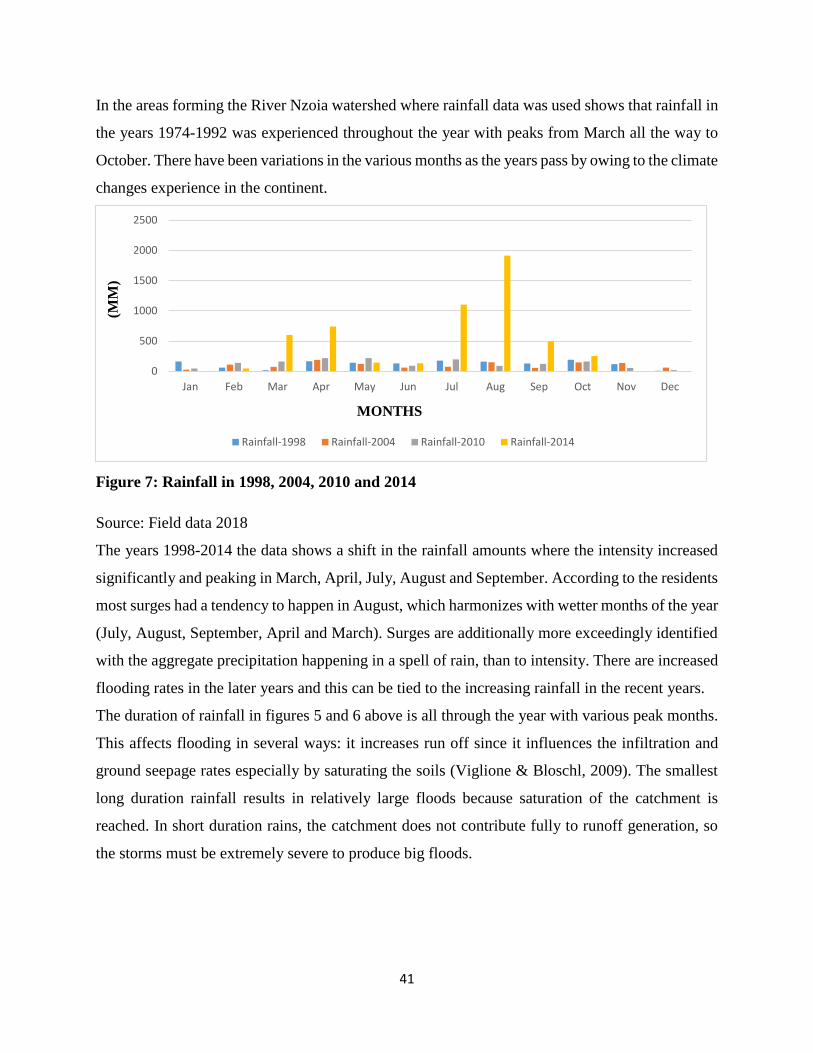
41
In the areas forming the River Nzoia watershed where rainfall data was used shows that rainfall in
the years 1974-1992 was experienced throughout the year with peaks from March all the way to
October. There have been variations in the various months as the years pass by owing to the climate
changes experience in the continent.
Figure 7: Rainfall in 1998, 2004, 2010 and 2014
Source: Field data 2018
The years 1998-2014 the data shows a shift in the rainfall amounts where the intensity increased
significantly and peaking in March, April, July, August and September. According to the residents
most surges had a tendency to happen in August, which harmonizes with wetter months of the year
(July, August, September, April and March). Surges are additionally more exceedingly identified
with the aggregate precipitation happening in a spell of rain, than to intensity. There are increased
flooding rates in the later years and this can be tied to the increasing rainfall in the recent years.
The duration of rainfall in figures 5 and 6 above is all through the year with various peak months.
This affects flooding in several ways: it increases run off since it influences the infiltration and
ground seepage rates especially by saturating the soils (Viglione & Bloschl, 2009). The smallest
long duration rainfall results in relatively large floods because saturation of the catchment is
reached. In short duration rains, the catchment does not contribute fully to runoff generation, so
the storms must be extremely severe to produce big floods.
0
500
1000
1500
2000
2500
Jan Feb Mar Apr May Jun Jul Aug Sep Oct Nov Dec
(MM
)
MONTHS
Rainfall-1998 Rainfall-2004 Rainfall-2010 Rainfall-2014
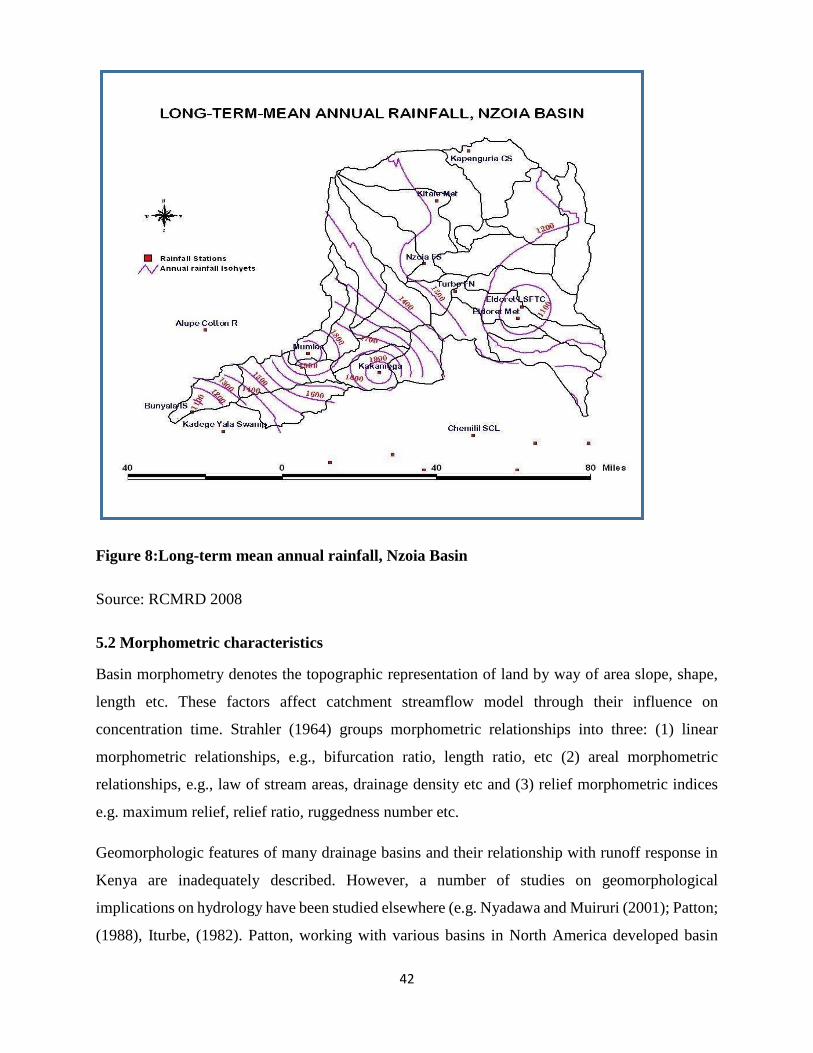
42
Figure 8:Long-term mean annual rainfall, Nzoia Basin
Source: RCMRD 2008
5.2 Morphometric characteristics
Basin morphometry denotes the topographic representation of land by way of area slope, shape,
length etc. These factors affect catchment streamflow model through their influence on
concentration time. Strahler (1964) groups morphometric relationships into three: (1) linear
morphometric relationships, e.g., bifurcation ratio, length ratio, etc (2) areal morphometric
relationships, e.g., law of stream areas, drainage density etc and (3) relief morphometric indices
e.g. maximum relief, relief ratio, ruggedness number etc.
Geomorphologic features of many drainage basins and their relationship with runoff response in
Kenya are inadequately described. However, a number of studies on geomorphological
implications on hydrology have been studied elsewhere (e.g. Nyadawa and Muiruri (2001); Patton;
(1988), Iturbe, (1982). Patton, working with various basins in North America developed basin
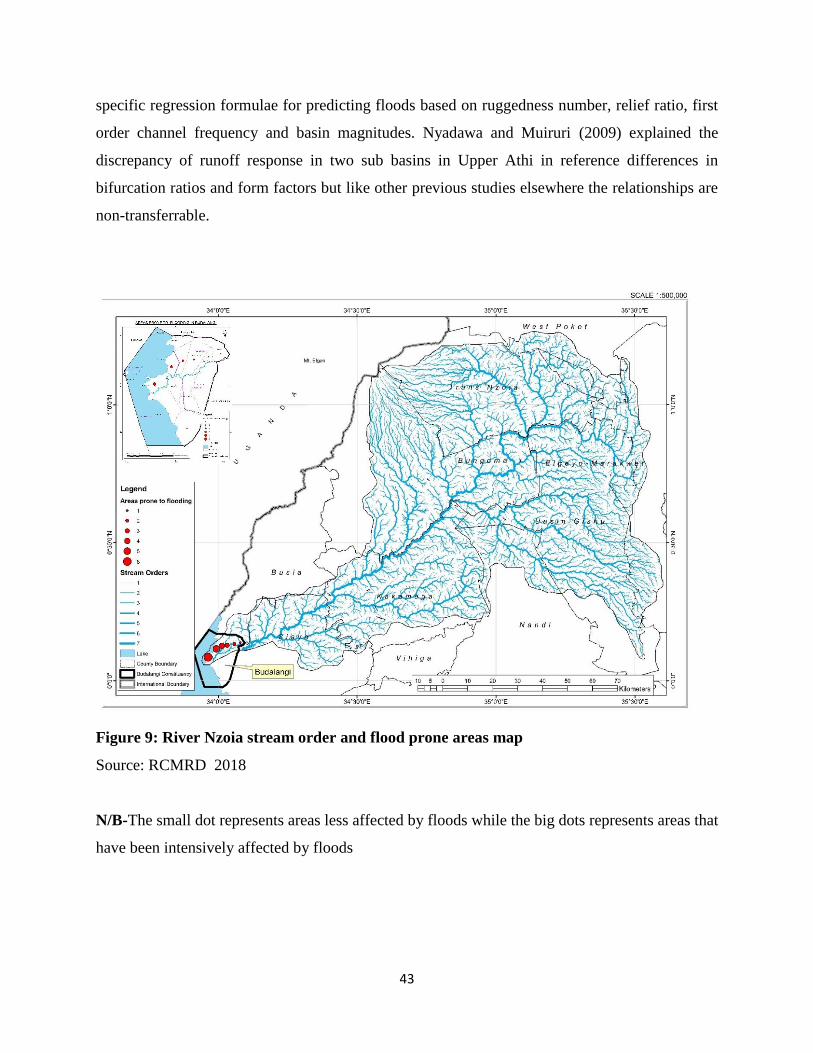
43
specific regression formulae for predicting floods based on ruggedness number, relief ratio, first
order channel frequency and basin magnitudes. Nyadawa and Muiruri (2009) explained the
discrepancy of runoff response in two sub basins in Upper Athi in reference differences in
bifurcation ratios and form factors but like other previous studies elsewhere the relationships are
non-transferrable.
Figure 9: River Nzoia stream order and flood prone areas map
Source: RCMRD 2018
N/B-The small dot represents areas less affected by floods while the big dots represents areas that
have been intensively affected by floods
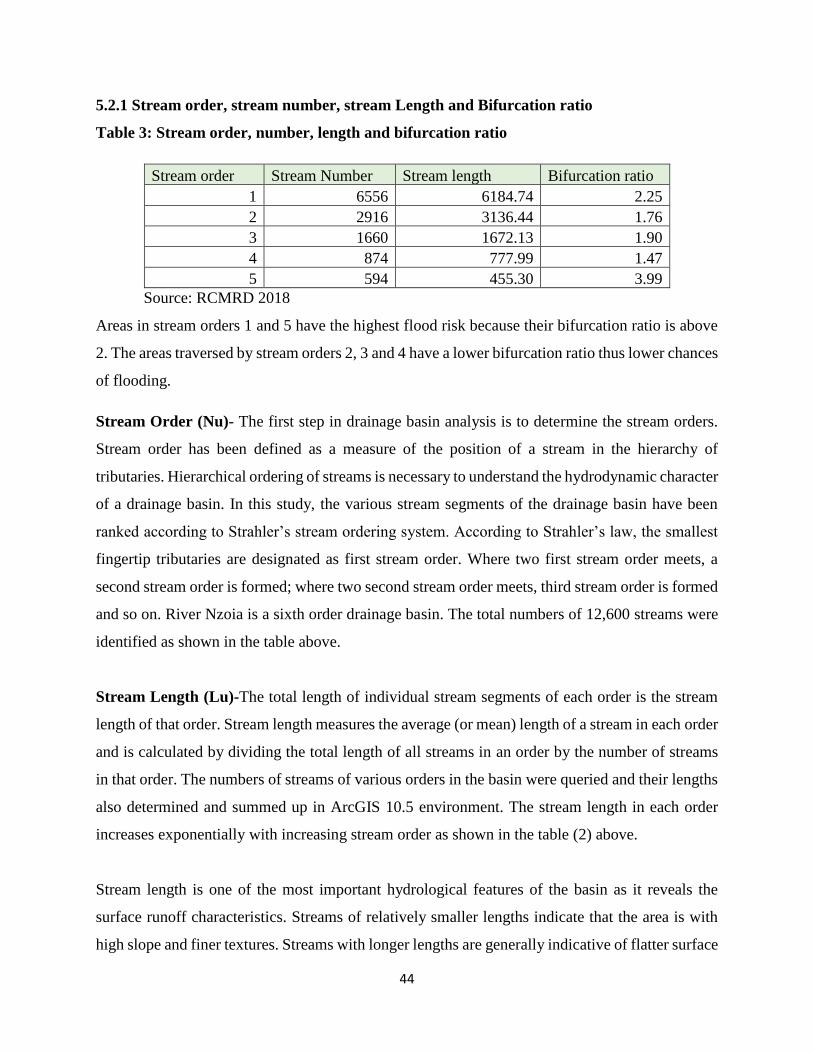
44
5.2.1 Stream order, stream number, stream Length and Bifurcation ratio
Table 3: Stream order, number, length and bifurcation ratio
Stream order Stream Number Stream length Bifurcation ratio
1 6556 6184.74 2.25
2 2916 3136.44 1.76
3 1660 1672.13 1.90
4 874 777.99 1.47
5 594 455.30 3.99
Source: RCMRD 2018
Areas in stream orders 1 and 5 have the highest flood risk because their bifurcation ratio is above
2. The areas traversed by stream orders 2, 3 and 4 have a lower bifurcation ratio thus lower chances
of flooding.
Stream Order (Nu)- The first step in drainage basin analysis is to determine the stream orders.
Stream order has been defined as a measure of the position of a stream in the hierarchy of
tributaries. Hierarchical ordering of streams is necessary to understand the hydrodynamic character
of a drainage basin. In this study, the various stream segments of the drainage basin have been
ranked according to Strahler’s stream ordering system. According to Strahler’s law, the smallest
fingertip tributaries are designated as first stream order. Where two first stream order meets, a
second stream order is formed; where two second stream order meets, third stream order is formed
and so on. River Nzoia is a sixth order drainage basin. The total numbers of 12,600 streams were
identified as shown in the table above.
Stream Length (Lu)-The total length of individual stream segments of each order is the stream
length of that order. Stream length measures the average (or mean) length of a stream in each order
and is calculated by dividing the total length of all streams in an order by the number of streams
in that order. The numbers of streams of various orders in the basin were queried and their lengths
also determined and summed up in ArcGIS 10.5 environment. The stream length in each order
increases exponentially with increasing stream order as shown in the table (2) above.
Stream length is one of the most important hydrological features of the basin as it reveals the
surface runoff characteristics. Streams of relatively smaller lengths indicate that the area is with
high slope and finer textures. Streams with longer lengths are generally indicative of flatter surface
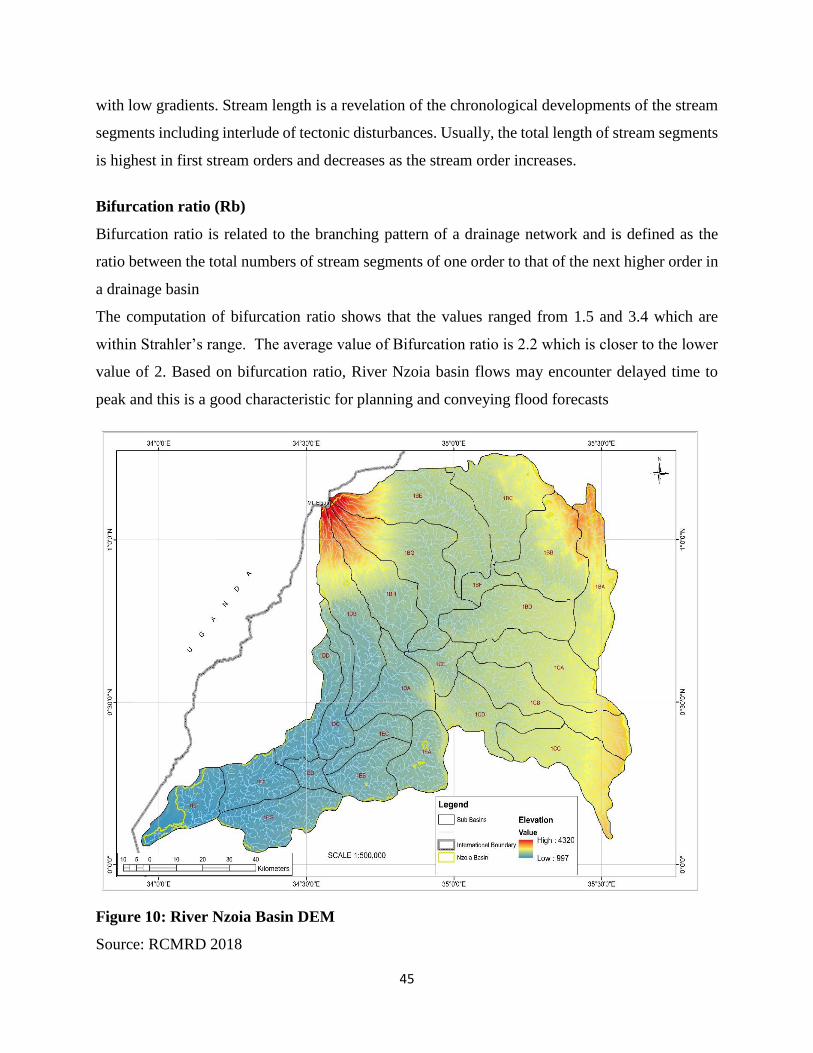
45
with low gradients. Stream length is a revelation of the chronological developments of the stream
segments including interlude of tectonic disturbances. Usually, the total length of stream segments
is highest in first stream orders and decreases as the stream order increases.
Bifurcation ratio (Rb)
Bifurcation ratio is related to the branching pattern of a drainage network and is defined as the
ratio between the total numbers of stream segments of one order to that of the next higher order in
a drainage basin
The computation of bifurcation ratio shows that the values ranged from 1.5 and 3.4 which are
within Strahler’s range. The average value of Bifurcation ratio is 2.2 which is closer to the lower
value of 2. Based on bifurcation ratio, River Nzoia basin flows may encounter delayed time to
peak and this is a good characteristic for planning and conveying flood forecasts
Figure 10: River Nzoia Basin DEM
Source: RCMRD 2018
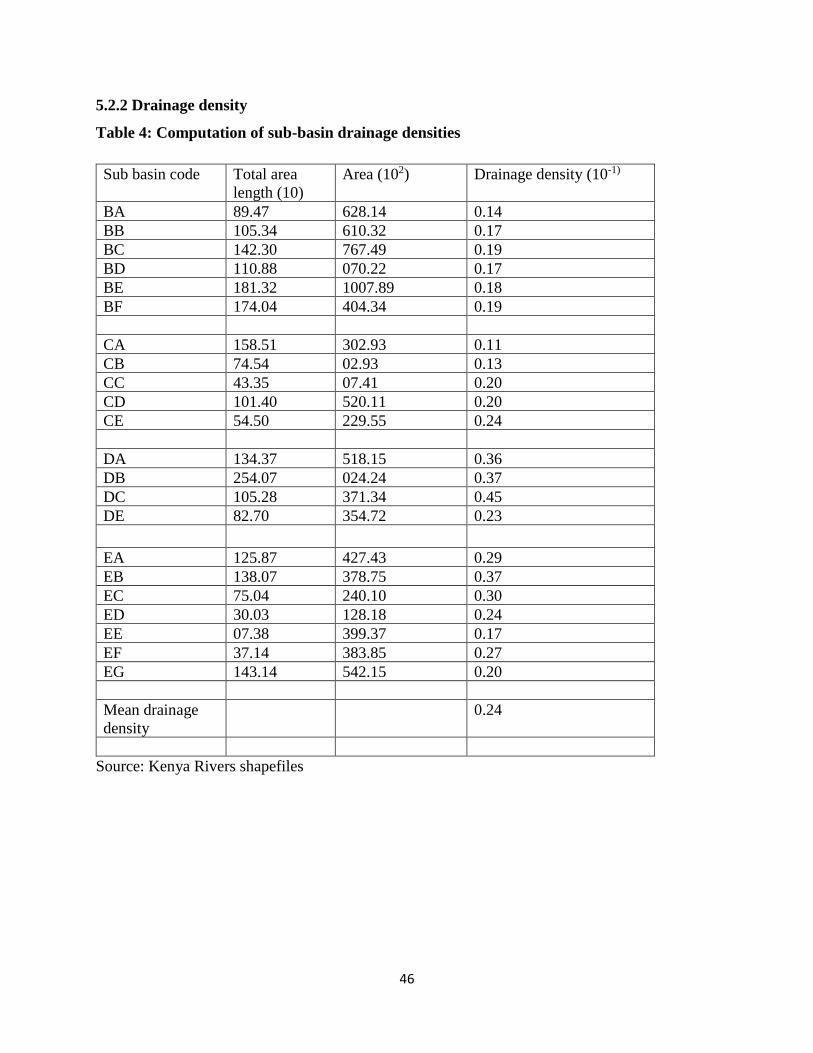
46
5.2.2 Drainage density
Table 4: Computation of sub-basin drainage densities
Sub basin code Total area
length (10)
Area (102) Drainage density (10-1)
BA 89.47 628.14 0.14
BB 105.34 610.32 0.17
BC 142.30 767.49 0.19
BD 110.88 070.22 0.17
BE 181.32 1007.89 0.18
BF 174.04 404.34 0.19
CA 158.51 302.93 0.11
CB 74.54 02.93 0.13
CC 43.35 07.41 0.20
CD 101.40 520.11 0.20
CE 54.50 229.55 0.24
DA 134.37 518.15 0.36
DB 254.07 024.24 0.37
DC 105.28 371.34 0.45
DE 82.70 354.72 0.23
EA 125.87 427.43 0.29
EB 138.07 378.75 0.37
EC 75.04 240.10 0.30
ED 30.03 128.18 0.24
EE 07.38 399.37 0.17
EF 37.14 383.85 0.27
EG 143.14 542.15 0.20
Mean drainage
density
0.24
Source: Kenya Rivers shapefiles
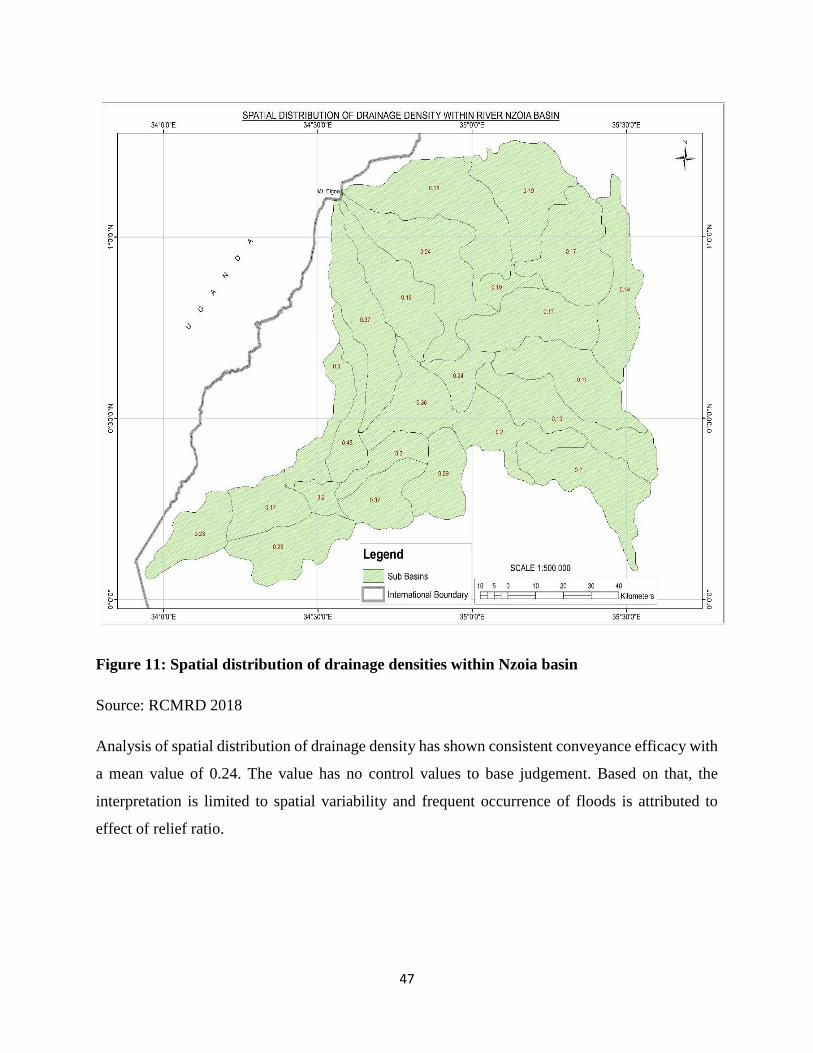
47
Figure 11: Spatial distribution of drainage densities within Nzoia basin
Source: RCMRD 2018
Analysis of spatial distribution of drainage density has shown consistent conveyance efficacy with
a mean value of 0.24. The value has no control values to base judgement. Based on that, the
interpretation is limited to spatial variability and frequent occurrence of floods is attributed to
effect of relief ratio.
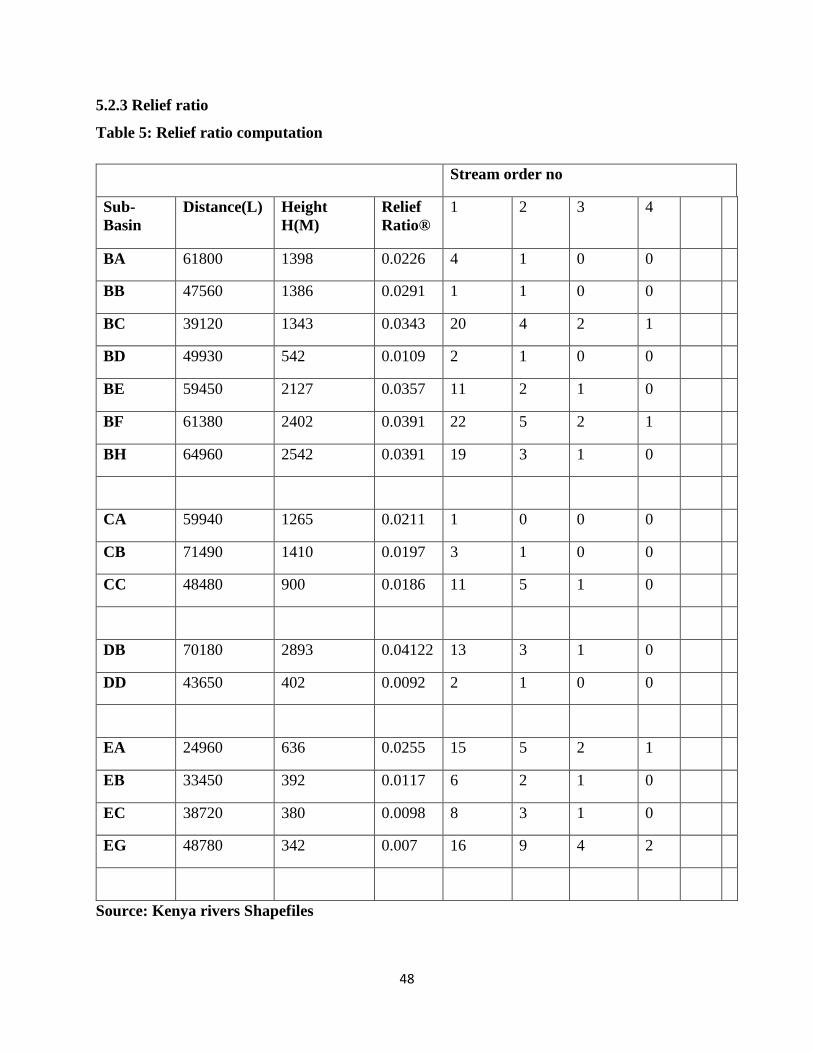
48
5.2.3 Relief ratio
Table 5: Relief ratio computation
Stream order no
Sub-
Basin
Distance(L) Height
H(M)
Relief
Ratio®
1 2 3 4
BA 61800 1398 0.0226 4 1 0 0
BB 47560 1386 0.0291 1 1 0 0
BC 39120 1343 0.0343 20 4 2 1
BD 49930 542 0.0109 2 1 0 0
BE 59450 2127 0.0357 11 2 1 0
BF 61380 2402 0.0391 22 5 2 1
BH 64960 2542 0.0391 19 3 1 0
CA 59940 1265 0.0211 1 0 0 0
CB 71490 1410 0.0197 3 1 0 0
CC 48480 900 0.0186 11 5 1 0
DB 70180 2893 0.04122 13 3 1 0
DD 43650 402 0.0092 2 1 0 0
EA 24960 636 0.0255 15 5 2 1
EB 33450 392 0.0117 6 2 1 0
EC 38720 380 0.0098 8 3 1 0
EG 48780 342 0.007 16 9 4 2
Source: Kenya rivers Shapefiles
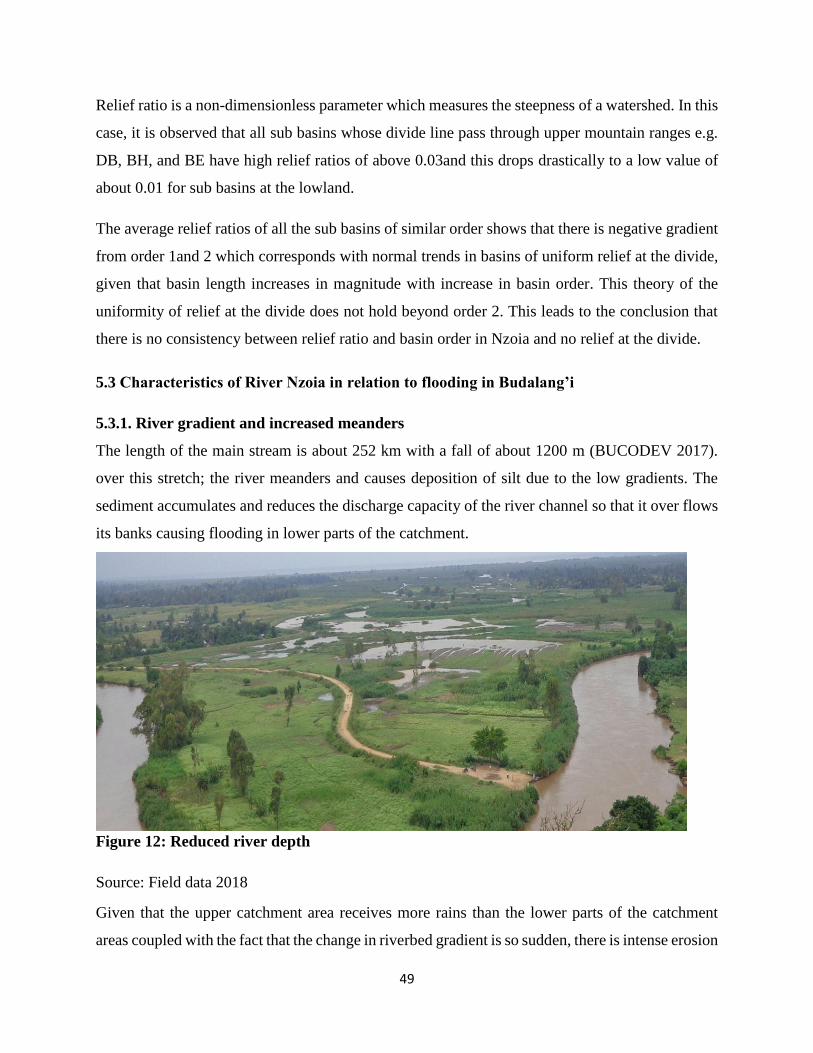
49
Relief ratio is a non-dimensionless parameter which measures the steepness of a watershed. In this
case, it is observed that all sub basins whose divide line pass through upper mountain ranges e.g.
DB, BH, and BE have high relief ratios of above 0.03and this drops drastically to a low value of
about 0.01 for sub basins at the lowland.
The average relief ratios of all the sub basins of similar order shows that there is negative gradient
from order 1and 2 which corresponds with normal trends in basins of uniform relief at the divide,
given that basin length increases in magnitude with increase in basin order. This theory of the
uniformity of relief at the divide does not hold beyond order 2. This leads to the conclusion that
there is no consistency between relief ratio and basin order in Nzoia and no relief at the divide.
5.3 Characteristics of River Nzoia in relation to flooding in Budalang’i
5.3.1. River gradient and increased meanders
The length of the main stream is about 252 km with a fall of about 1200 m (BUCODEV 2017).
over this stretch; the river meanders and causes deposition of silt due to the low gradients. The
sediment accumulates and reduces the discharge capacity of the river channel so that it over flows
its banks causing flooding in lower parts of the catchment.
Figure 12: Reduced river depth
Source: Field data 2018
Given that the upper catchment area receives more rains than the lower parts of the catchment
areas coupled with the fact that the change in riverbed gradient is so sudden, there is intense erosion
50
from the early stages of the river downstream. There is increased deposition on the old river stage
at lower catchment basin which results in reduced river depth. This contributes heavily to flooding
as high volumes surpasses the river banks and dykes.
5.3.2 River Width
The width of the channel decreases gradually from about 50 m at 140 km inland to around 40 m
in the upper reaches of Kakamega, Bungoma, Trans Nzoia and Uasin Gishu counties where the
altitude is high, and the slopes are steep. The sediment accumulates and reduces the capacity of
river channel so that the river overflows the banks forming the delta. This reduced width of the
channel affects the river’s capacity to contain high inflows from the upper catchment reaches
causing flooding.
5.3.3 Reduced River Velocity in Lower Catchment Areas
A sudden change in river gradient has caused a reduced river velocity. The reduced velocity
increases chances of deposition which consequently leads to the accumulation of many years of
sediment in the river bed has made the channel of the river course to be above the general level of
the flood plain as a result overbank flow across the 600–700-m-wide dykes causes massive
flooding. In A nutshell, the main factors contributing to increased incidence of floods especially
in the lower reaches of the river Nzoia are:
1. Reduced flood carrying capacity of the rivers due to excessive siltation of their bed.
2. Settlement of the dykes in some places reducing the effective height, thereby rendering the
dyke susceptible to over topping during floods.
3. Erosion of dykes due to river attacks making them susceptible to breaches even during
floods of lower magnitudes than the design flood.
4. Increase in flood discharges due to severe degradation of watersheds cause uncontrolled
and unregulated human activity, especially large-scale deforestation.
5. There is no programme / provision for routine maintenance of dykes.
6. The dykes are, at present, overgrown with trees and shrubs resulting in loosening and
cracking of the dykes.
7. Excessive encroachment of the flood plains by the people for agriculture and livestock
farming and fishery.
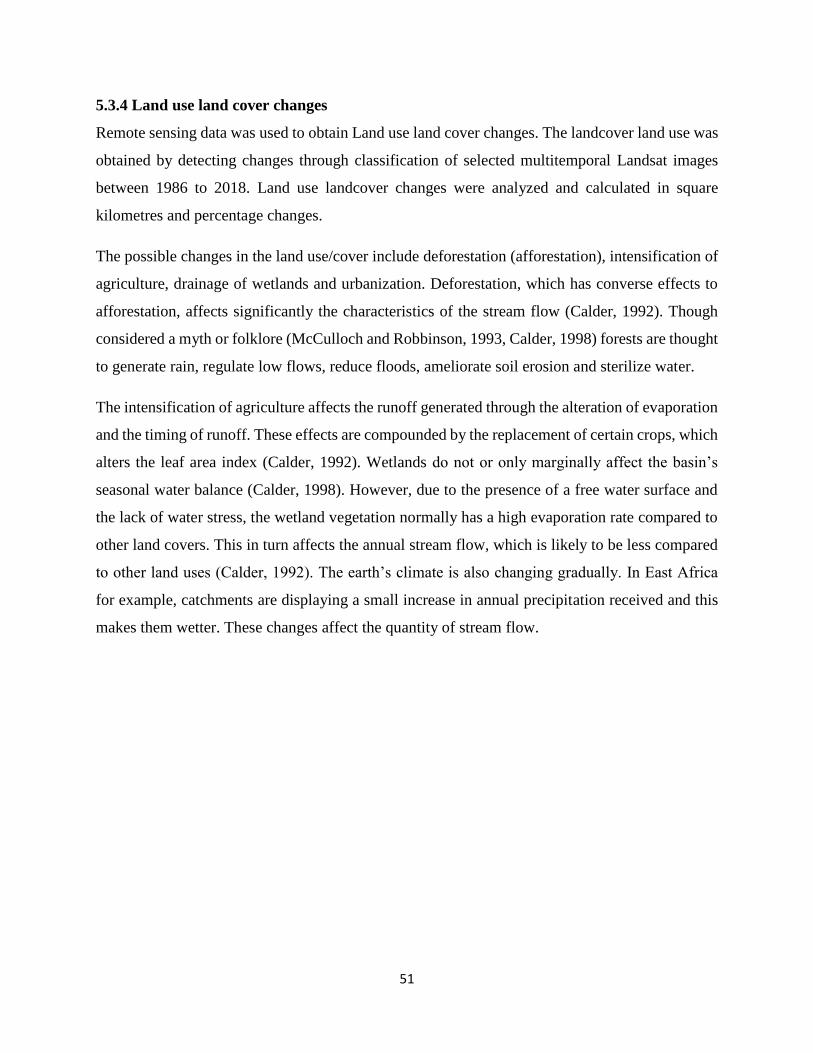
51
5.3.4 Land use land cover changes
Remote sensing data was used to obtain Land use land cover changes. The landcover land use was
obtained by detecting changes through classification of selected multitemporal Landsat images
between 1986 to 2018. Land use landcover changes were analyzed and calculated in square
kilometres and percentage changes.
The possible changes in the land use/cover include deforestation (afforestation), intensification of
agriculture, drainage of wetlands and urbanization. Deforestation, which has converse effects to
afforestation, affects significantly the characteristics of the stream flow (Calder, 1992). Though
considered a myth or folklore (McCulloch and Robbinson, 1993, Calder, 1998) forests are thought
to generate rain, regulate low flows, reduce floods, ameliorate soil erosion and sterilize water.
The intensification of agriculture affects the runoff generated through the alteration of evaporation
and the timing of runoff. These effects are compounded by the replacement of certain crops, which
alters the leaf area index (Calder, 1992). Wetlands do not or only marginally affect the basin’s
seasonal water balance (Calder, 1998). However, due to the presence of a free water surface and
the lack of water stress, the wetland vegetation normally has a high evaporation rate compared to
other land covers. This in turn affects the annual stream flow, which is likely to be less compared
to other land uses (Calder, 1992). The earth’s climate is also changing gradually. In East Africa
for example, catchments are displaying a small increase in annual precipitation received and this
makes them wetter. These changes affect the quantity of stream flow.
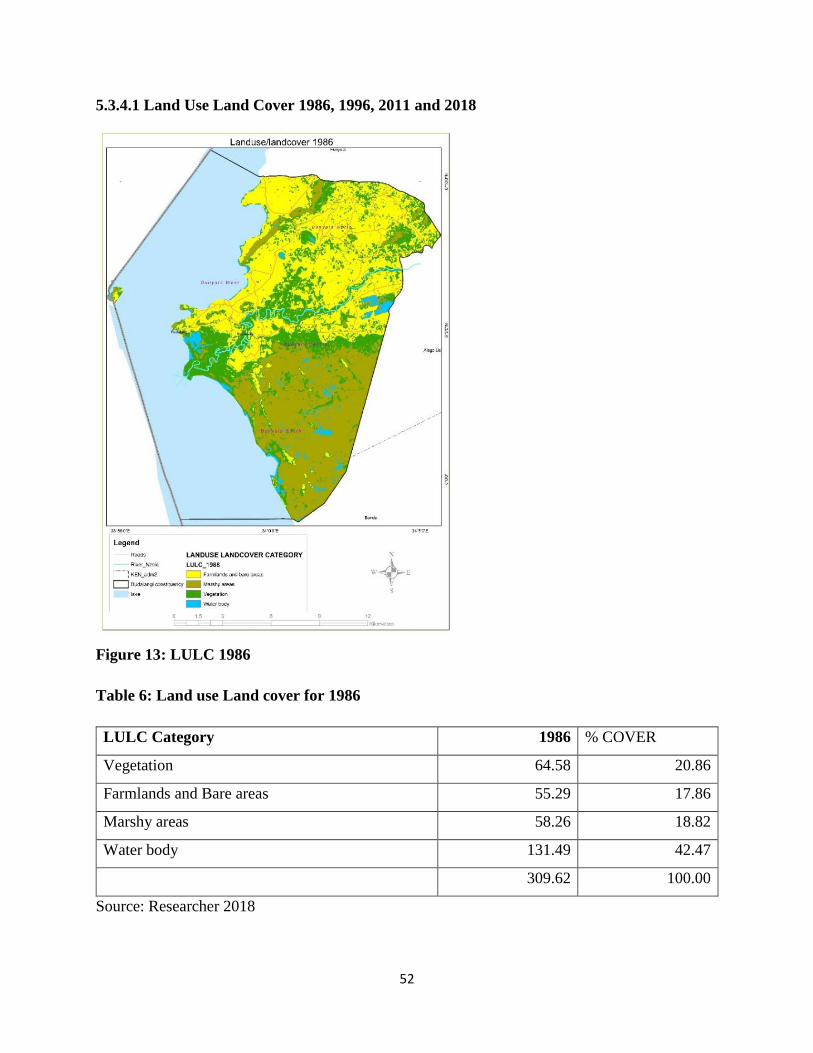
52
5.3.4.1 Land Use Land Cover 1986, 1996, 2011 and 2018
Figure 13: LULC 1986
Table 6: Land use Land cover for 1986
LULC Category 1986 % COVER
Vegetation 64.58 20.86
Farmlands and Bare areas 55.29 17.86
Marshy areas 58.26 18.82
Water body 131.49 42.47
309.62 100.00
Source: Researcher 2018
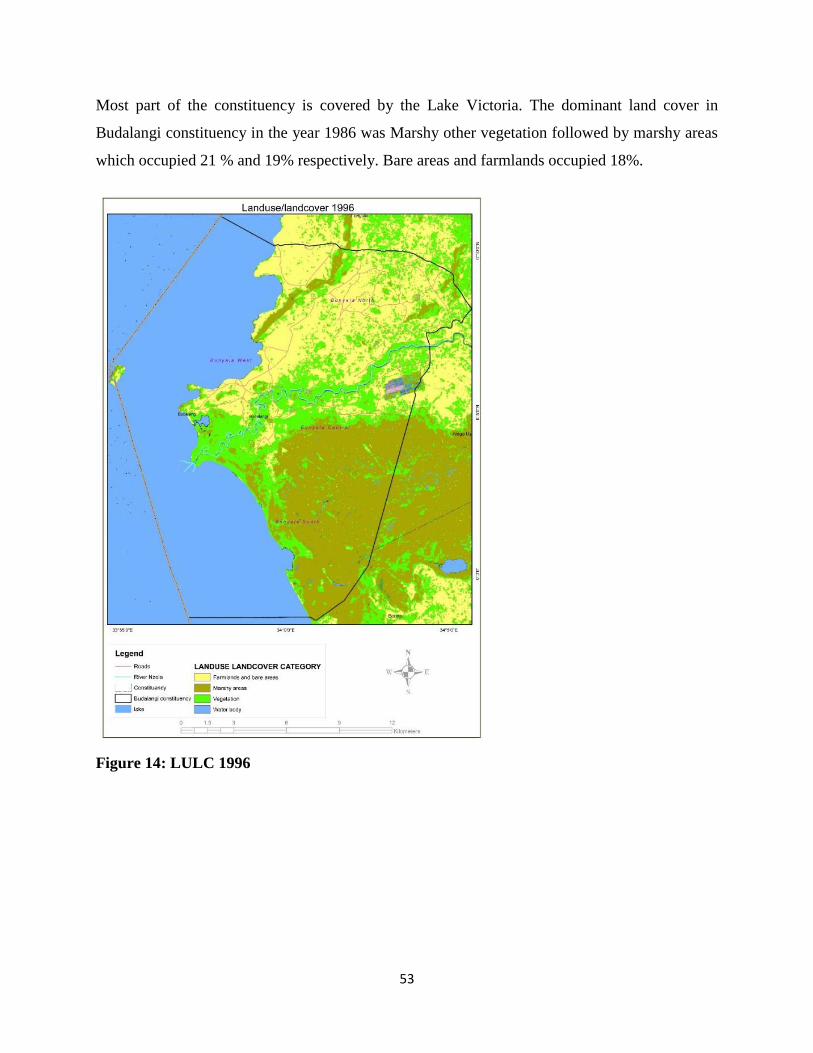
53
Most part of the constituency is covered by the Lake Victoria. The dominant land cover in
Budalangi constituency in the year 1986 was Marshy other vegetation followed by marshy areas
which occupied 21 % and 19% respectively. Bare areas and farmlands occupied 18%.
Figure 14: LULC 1996
54
Table 7: Land use Land cover for 1996
LULC Category 1996 % COVER
Vegetation 52.98 17.11
Farmlands and Bare areas 64.73 20.91
Marshy areas 62.23 20.10
Water body 129.68 41.88
309.62 100.00
Source: Researcher 2018
In the year 1996 Bare areas and farmlands occupied 21%, marshy areas 20% and vegetation 17%
of the total area.
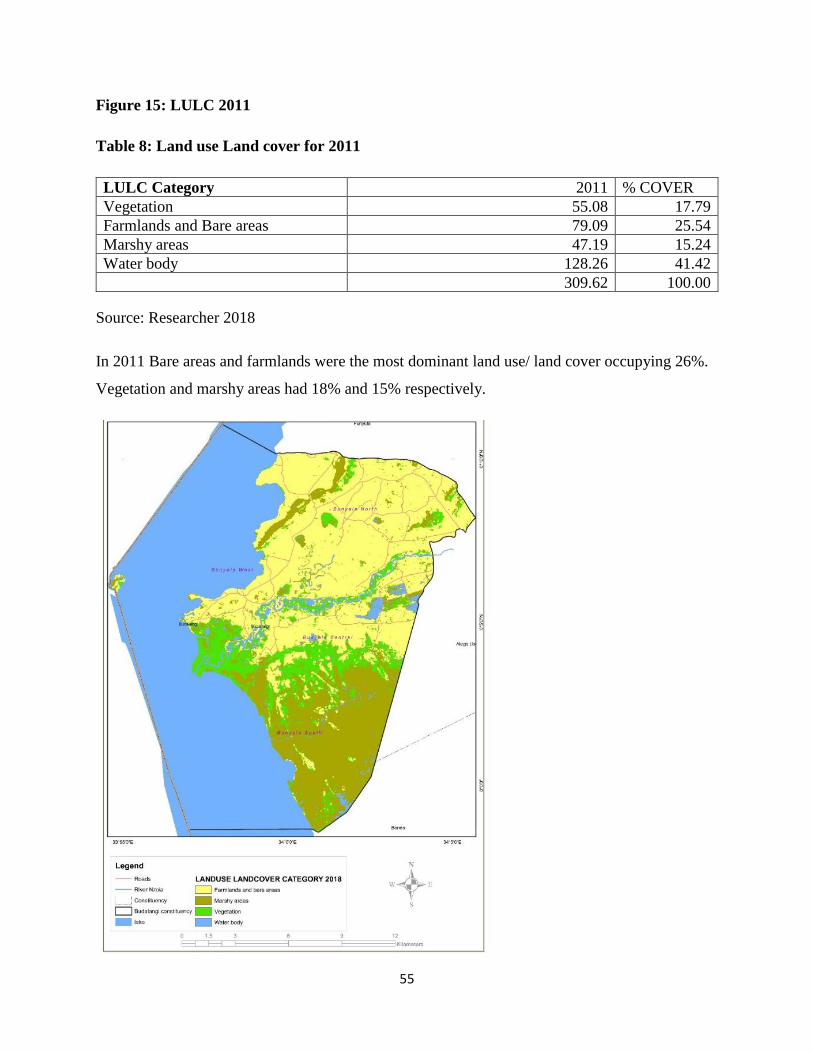
55
Figure 15: LULC 2011
Table 8: Land use Land cover for 2011
LULC Category 2011 % COVER
Vegetation 55.08 17.79
Farmlands and Bare areas 79.09 25.54
Marshy areas 47.19 15.24
Water body 128.26 41.42
309.62 100.00
Source: Researcher 2018
In 2011 Bare areas and farmlands were the most dominant land use/ land cover occupying 26%.
Vegetation and marshy areas had 18% and 15% respectively.
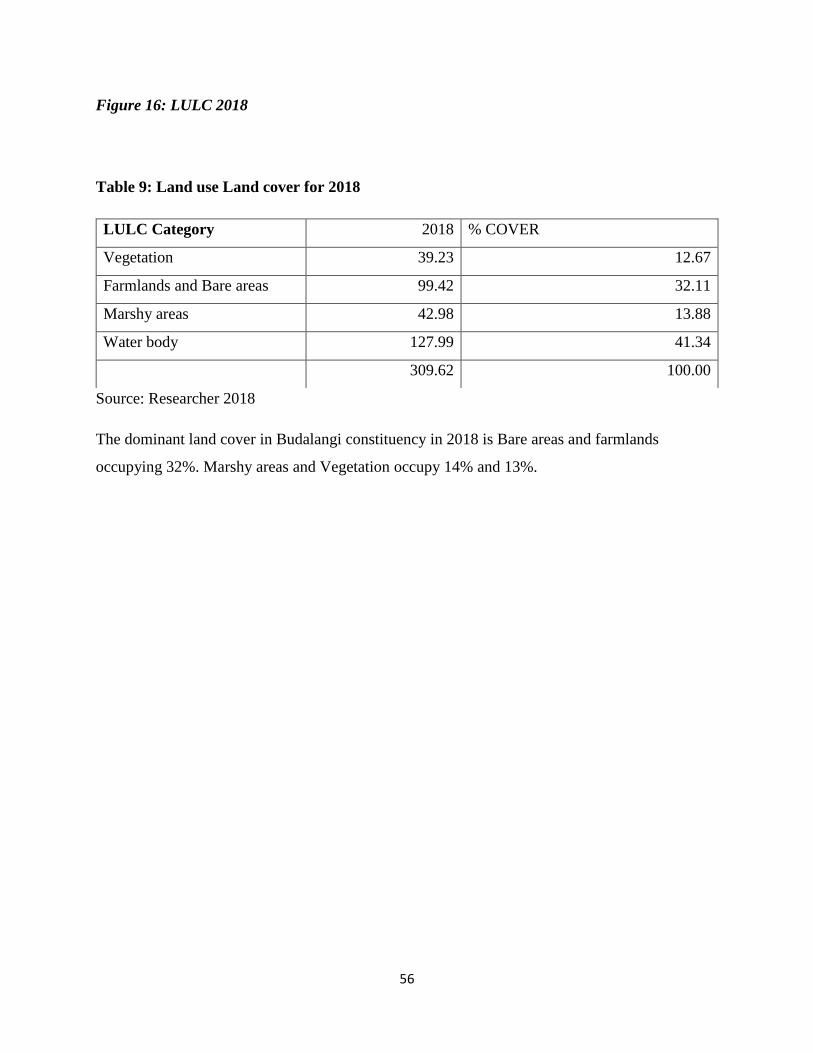
56
Figure 16: LULC 2018
Table 9: Land use Land cover for 2018
Source: Researcher 2018
The dominant land cover in Budalangi constituency in 2018 is Bare areas and farmlands
occupying 32%. Marshy areas and Vegetation occupy 14% and 13%.
LULC Category 2018 % COVER
Vegetation 39.23 12.67
Farmlands and Bare areas 99.42 32.11
Marshy areas 42.98 13.88
Water body 127.99 41.34
309.62 100.00
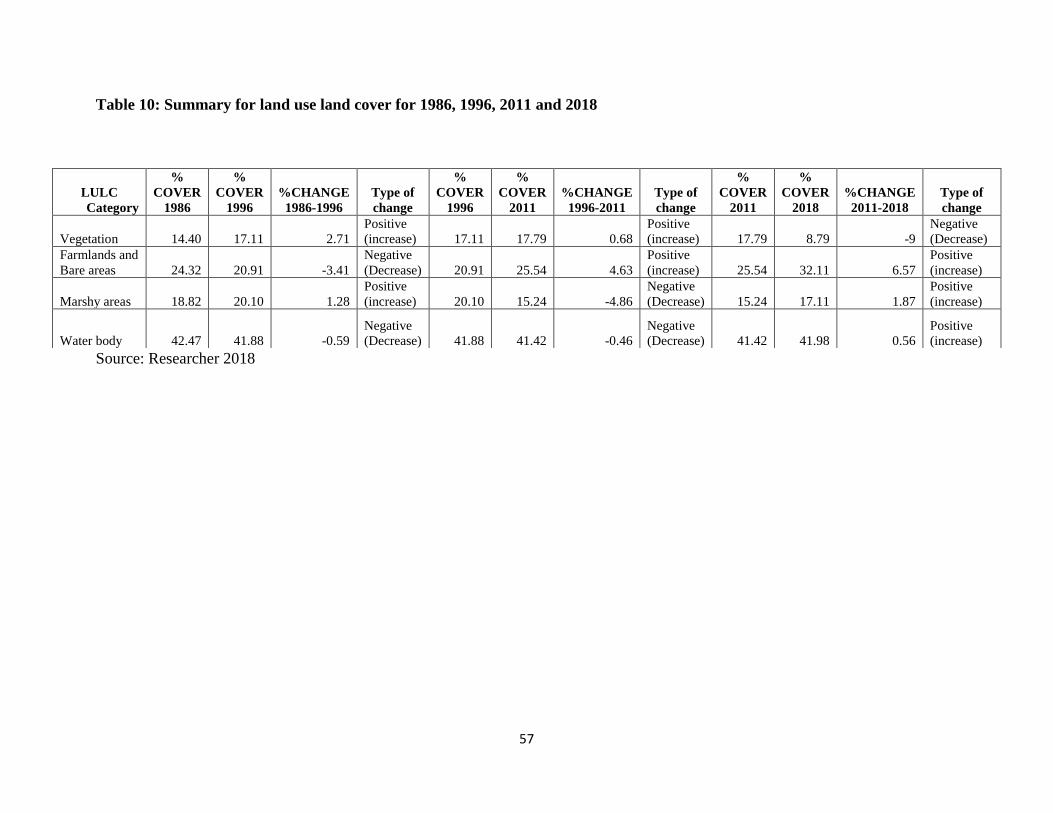
57
Table 10: Summary for land use land cover for 1986, 1996, 2011 and 2018
Source: Researcher 2018
LULC
Category
%
COVER
1986
%
COVER
1996
%CHANGE
1986-1996
Type of
change
%
COVER
1996
%
COVER
2011
%CHANGE
1996-2011
Type of
change
%
COVER
2011
%
COVER
2018
%CHANGE
2011-2018
Type of
change
Vegetation 14.40 17.11 2.71
Positive
(increase) 17.11 17.79 0.68
Positive
(increase) 17.79 8.79 -9
Negative
(Decrease)
Farmlands and
Bare areas 24.32 20.91 -3.41
Negative
(Decrease) 20.91 25.54 4.63
Positive
(increase) 25.54 32.11 6.57
Positive
(increase)
Marshy areas 18.82 20.10 1.28
Positive
(increase) 20.10 15.24 -4.86
Negative
(Decrease) 15.24 17.11 1.87
Positive
(increase)
Water body 42.47 41.88 -0.59
Negative
(Decrease) 41.88 41.42 -0.46
Negative
(Decrease) 41.42 41.98 0.56
Positive
(increase)
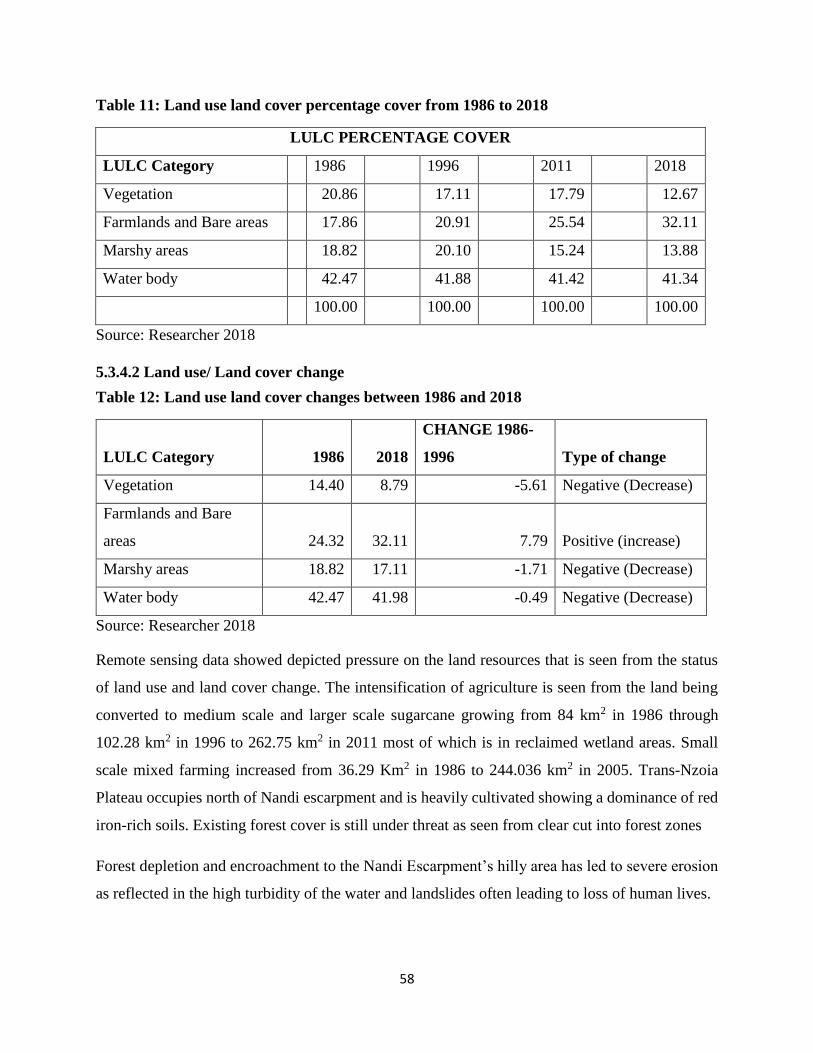
58
Table 11: Land use land cover percentage cover from 1986 to 2018
LULC PERCENTAGE COVER
LULC Category 1986 1996 2011 2018
Vegetation 20.86 17.11 17.79 12.67
Farmlands and Bare areas 17.86 20.91 25.54 32.11
Marshy areas 18.82 20.10 15.24 13.88
Water body 42.47 41.88 41.42 41.34
100.00 100.00 100.00 100.00
Source: Researcher 2018
5.3.4.2 Land use/ Land cover change
Table 12: Land use land cover changes between 1986 and 2018
LULC Category 1986 2018
CHANGE 1986-
1996 Type of change
Vegetation 14.40 8.79 -5.61 Negative (Decrease)
Farmlands and Bare
areas 24.32 32.11 7.79 Positive (increase)
Marshy areas 18.82 17.11 -1.71 Negative (Decrease)
Water body 42.47 41.98 -0.49 Negative (Decrease)
Source: Researcher 2018
Remote sensing data showed depicted pressure on the land resources that is seen from the status
of land use and land cover change. The intensification of agriculture is seen from the land being
converted to medium scale and larger scale sugarcane growing from 84 km2 in 1986 through
102.28 km2 in 1996 to 262.75 km2 in 2011 most of which is in reclaimed wetland areas. Small
scale mixed farming increased from 36.29 Km2 in 1986 to 244.036 km2 in 2005. Trans-Nzoia
Plateau occupies north of Nandi escarpment and is heavily cultivated showing a dominance of red
iron-rich soils. Existing forest cover is still under threat as seen from clear cut into forest zones
Forest depletion and encroachment to the Nandi Escarpment’s hilly area has led to severe erosion
as reflected in the high turbidity of the water and landslides often leading to loss of human lives.
59
The increase in size of the bare ground area is an indication of wetland degradation and a
consequent replacement of wetland vegetation with bare soil that is prone to erosion. This
contributes to the siltation of the lake thus increasing the lake’s water turbidity because the wetland
has lost its ability to filter off sediments in water entering the lake. From the satellite images, it
was evident that there were levees naturally developed along the riverbank for containment of the
river water. The reduction in marshland vegetation perhaps is attributed to the increased
intensification of dry land rice cultivation Analysis of the year 2005 images shows that cultivation
takes places in the wetland and there is complete drainage of wetland resulting in settlement and
cultivation extending to the levees and the flood plain.
The increase of the area under farming, the stream flow increases during the rainy seasons and
reduces during the dry seasons, whereas when the area under forest cover is increased the peak
stream flow reduces, but when the forest cover is reduced to almost nil there is an increased peak
and mean stream flow in the basin.
It is therefore worth perceiving that a decrease in surface runoff would be desirable, as this would
also decrease the devastating effects of floods; the rapid expansion of urban centres in the lower
parts of the catchment (Rwambwa, Kakamega, and Bungoma) can be said to be a major
contributing factor to the annual devastating floods.
The area under vegetation cover decreased between 1986,1996 and 2018 by 9.0% in Budalangi
area. But between the 2011 there was an increase in area under forest cover by 0.68%. Agricultural
land use showed an increase in areal coverage from 1986 to 2018 by 11.17%. Marshy areas
decreased since 1996 to 2018. This could be because of an expansion in riverine farming
In summary, some of the existing land use practices such as deforestation and urbanization enhance
flooding. For instance, increased urbanization and deforestation result in reduced infiltration with
increased run off in built and urban areas leading to flooding in the lower parts of the Nzoia basin.
5.4 Questionnaire data review
5.4.1 Household characteristics
Out of the 49 respondents, 59.18% were male and 40.82% were female. There was fair
representation of the gender in the study, and therefore the opinions gathered were not largely
skewed to either side. It also indicated that both men and women were willing to participate in the
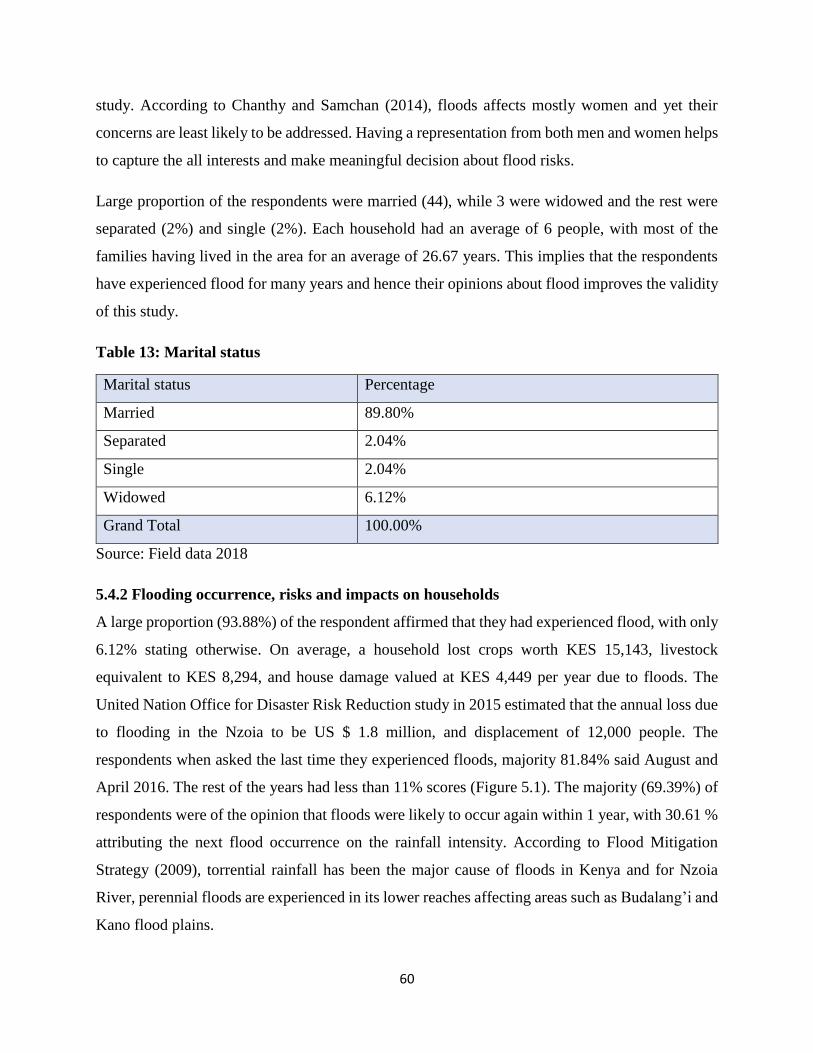
60
study. According to Chanthy and Samchan (2014), floods affects mostly women and yet their
concerns are least likely to be addressed. Having a representation from both men and women helps
to capture the all interests and make meaningful decision about flood risks.
Large proportion of the respondents were married (44), while 3 were widowed and the rest were
separated (2%) and single (2%). Each household had an average of 6 people, with most of the
families having lived in the area for an average of 26.67 years. This implies that the respondents
have experienced flood for many years and hence their opinions about flood improves the validity
of this study.
Table 13: Marital status
Marital status Percentage
Married 89.80%
Separated 2.04%
Single 2.04%
Widowed 6.12%
Grand Total 100.00%
Source: Field data 2018
5.4.2 Flooding occurrence, risks and impacts on households
A large proportion (93.88%) of the respondent affirmed that they had experienced flood, with only
6.12% stating otherwise. On average, a household lost crops worth KES 15,143, livestock
equivalent to KES 8,294, and house damage valued at KES 4,449 per year due to floods. The
United Nation Office for Disaster Risk Reduction study in 2015 estimated that the annual loss due
to flooding in the Nzoia to be US $ 1.8 million, and displacement of 12,000 people. The
respondents when asked the last time they experienced floods, majority 81.84% said August and
April 2016. The rest of the years had less than 11% scores (Figure 5.1). The majority (69.39%) of
respondents were of the opinion that floods were likely to occur again within 1 year, with 30.61 %
attributing the next flood occurrence on the rainfall intensity. According to Flood Mitigation
Strategy (2009), torrential rainfall has been the major cause of floods in Kenya and for Nzoia
River, perennial floods are experienced in its lower reaches affecting areas such as Budalang’i and
Kano flood plains.
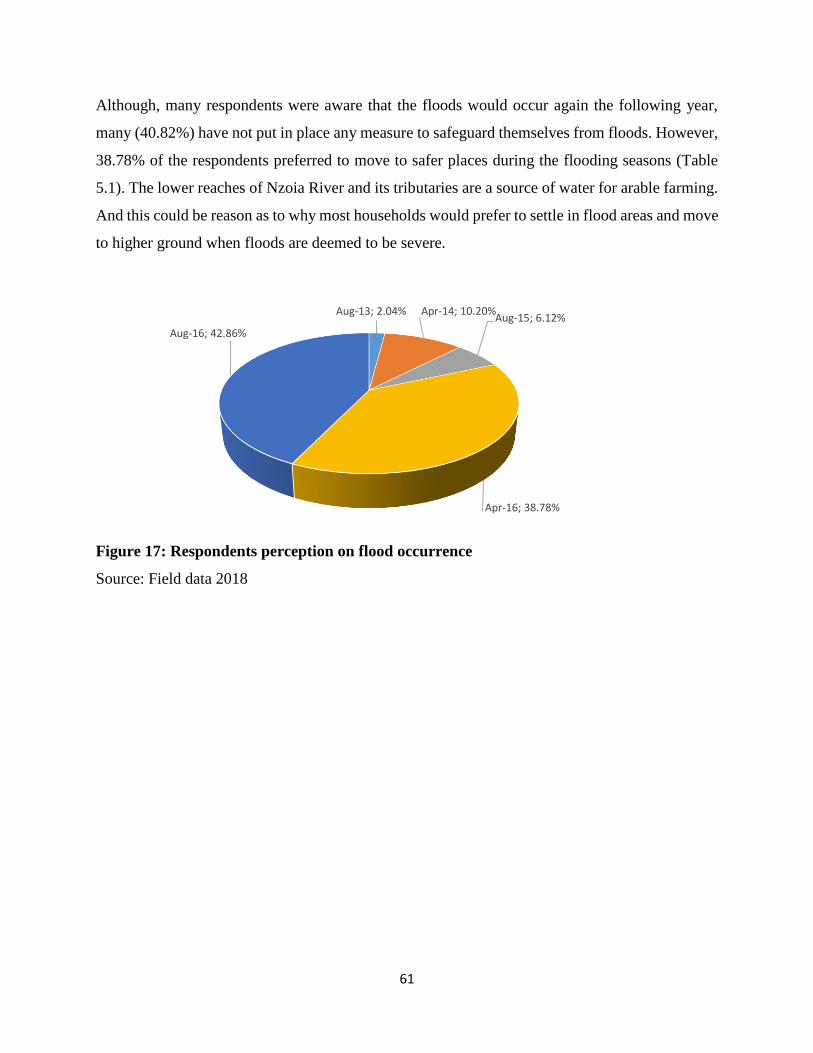
61
Although, many respondents were aware that the floods would occur again the following year,
many (40.82%) have not put in place any measure to safeguard themselves from floods. However,
38.78% of the respondents preferred to move to safer places during the flooding seasons (Table
5.1). The lower reaches of Nzoia River and its tributaries are a source of water for arable farming.
And this could be reason as to why most households would prefer to settle in flood areas and move
to higher ground when floods are deemed to be severe.
Figure 17: Respondents perception on flood occurrence
Source: Field data 2018
Aug-13; 2.04% Apr-14; 10.20%Aug-15; 6.12%
Apr-16; 38.78%
Aug-16; 42.86%
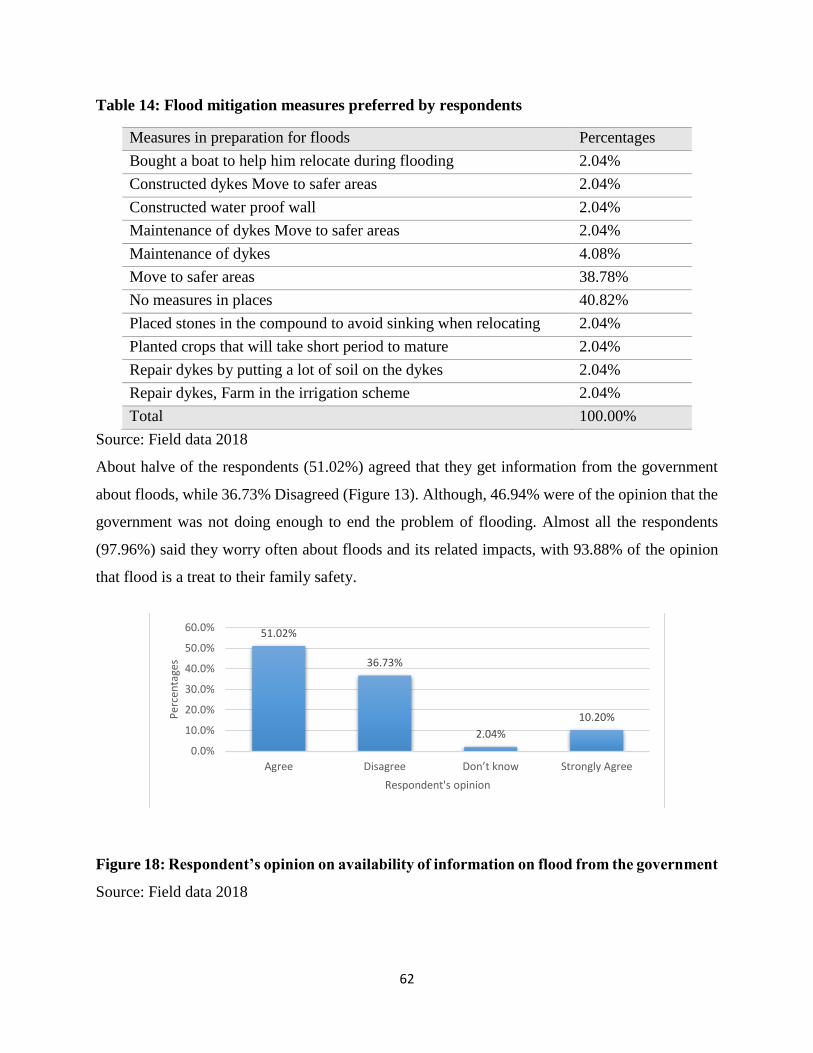
62
Table 14: Flood mitigation measures preferred by respondents
Measures in preparation for floods Percentages
Bought a boat to help him relocate during flooding 2.04%
Constructed dykes Move to safer areas 2.04%
Constructed water proof wall 2.04%
Maintenance of dykes Move to safer areas 2.04%
Maintenance of dykes 4.08%
Move to safer areas 38.78%
No measures in places 40.82%
Placed stones in the compound to avoid sinking when relocating 2.04%
Planted crops that will take short period to mature 2.04%
Repair dykes by putting a lot of soil on the dykes 2.04%
Repair dykes, Farm in the irrigation scheme 2.04%
Total 100.00%
Source: Field data 2018
About halve of the respondents (51.02%) agreed that they get information from the government
about floods, while 36.73% Disagreed (Figure 13). Although, 46.94% were of the opinion that the
government was not doing enough to end the problem of flooding. Almost all the respondents
(97.96%) said they worry often about floods and its related impacts, with 93.88% of the opinion
that flood is a treat to their family safety.
Figure 18: Respondent’s opinion on availability of information on flood from the government
Source: Field data 2018
51.02%
36.73%
2.04%
10.20%
0.0%
10.0%
20.0%
30.0%
40.0%
50.0%
60.0%
Agree Disagree Don’t know Strongly Agree
Per
cen
tage
s
Respondent's opinion
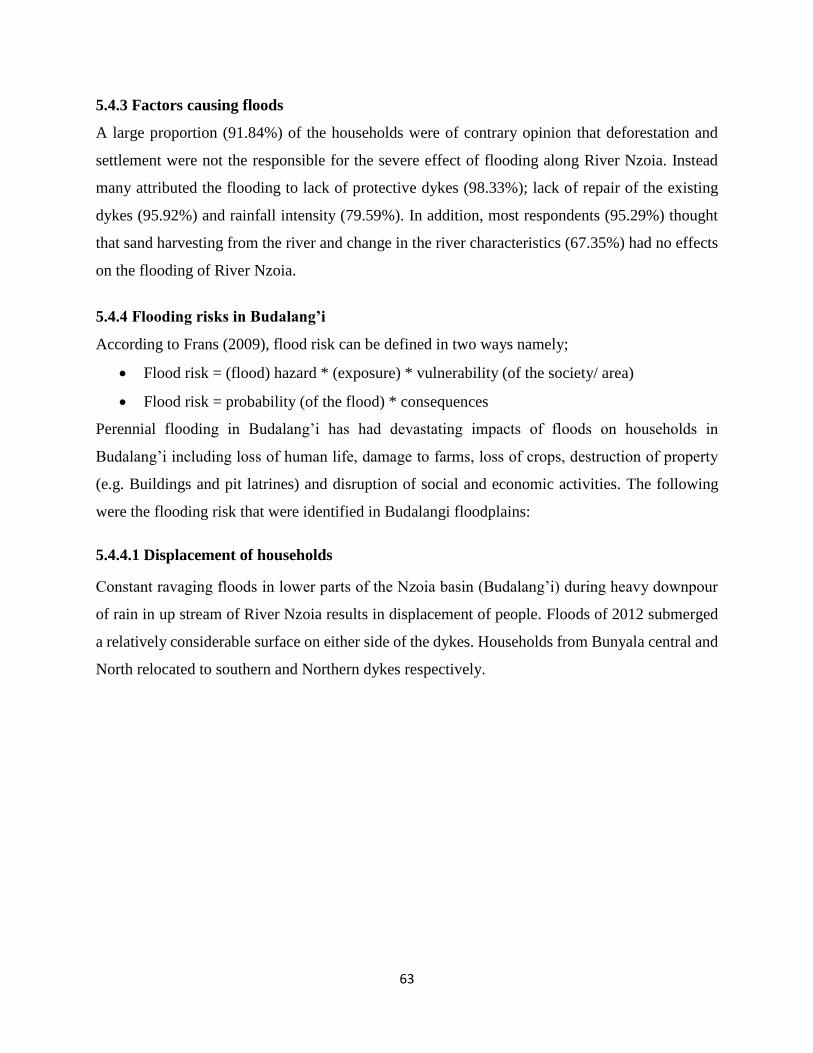
63
5.4.3 Factors causing floods
A large proportion (91.84%) of the households were of contrary opinion that deforestation and
settlement were not the responsible for the severe effect of flooding along River Nzoia. Instead
many attributed the flooding to lack of protective dykes (98.33%); lack of repair of the existing
dykes (95.92%) and rainfall intensity (79.59%). In addition, most respondents (95.29%) thought
that sand harvesting from the river and change in the river characteristics (67.35%) had no effects
on the flooding of River Nzoia.
5.4.4 Flooding risks in Budalang’i
According to Frans (2009), flood risk can be defined in two ways namely;
• Flood risk = (flood) hazard * (exposure) * vulnerability (of the society/ area)
• Flood risk = probability (of the flood) * consequences
Perennial flooding in Budalang’i has had devastating impacts of floods on households in
Budalang’i including loss of human life, damage to farms, loss of crops, destruction of property
(e.g. Buildings and pit latrines) and disruption of social and economic activities. The following
were the flooding risk that were identified in Budalangi floodplains:
5.4.4.1 Displacement of households
Constant ravaging floods in lower parts of the Nzoia basin (Budalang’i) during heavy downpour
of rain in up stream of River Nzoia results in displacement of people. Floods of 2012 submerged
a relatively considerable surface on either side of the dykes. Households from Bunyala central and
North relocated to southern and Northern dykes respectively.
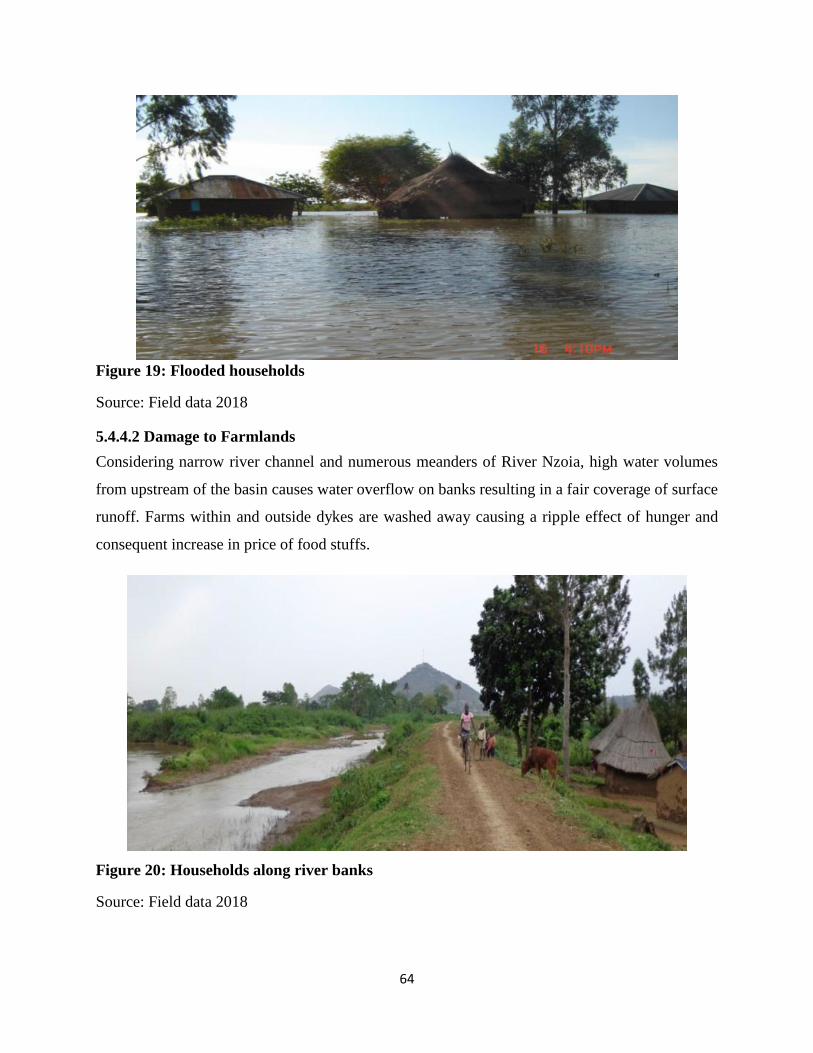
64
Figure 19: Flooded households
Source: Field data 2018
5.4.4.2 Damage to Farmlands
Considering narrow river channel and numerous meanders of River Nzoia, high water volumes
from upstream of the basin causes water overflow on banks resulting in a fair coverage of surface
runoff. Farms within and outside dykes are washed away causing a ripple effect of hunger and
consequent increase in price of food stuffs.
Figure 20: Households along river banks
Source: Field data 2018
65
5.4.4.3 Damage to Bridges and Roads
Owing to the floods of 2007, Ndekwe bridge which connected Mabinju and Rukala sublocations
of Bunyala sub county was swept away rendering locals helpless as far as transportation and
movement was concerned. Sections of roads within the area were destroyed eg. Rukala, magombe
Igigo and pathways along the dykes were also washed away disrupting road communication in
aforesaid areas.
5.4.4.4 Disruption of learning programmes
Frequent flooding in Bunyala has caused undesirable effects on learning programmes in many of
schools in the area. Floods of 2008 ravaged Makunda Secondary school during the time when
candidates were seating their national examination. The school had to take candidates to the
neighbouring school-St, Anne Bunyala girls to write their final exams.
5.4.4.5 Economic
During floods (especially flash floods), roads bridges, farms houses and automobiles are destroyed.
People become homeless. Additionally, resettlement of the displaced people come at a cost and
takes longer enough for business to normalise.
5.4.4.6 Environment
The environment is equally affected when chemicals and other hazardous substances end up in in
the water and eventually contaminate the water bodies that floods end up in. water hyacinth have
evaded the mouth of river Nzoia as it finds its way into the lake. These have caused blocking of
the channels of the major river and its tributaries including Ndekwe stream.
5.4.4.7 People and animals
Many people and animals die during floods as some are injured and others made homeless.
Electricity supply is partly affected in Budalang’i and its environs causing disruption of businesses.
Flooding too comes with disease such as malaria, typhoid, and dysentery among others.
5.5 Flood mitigation and control measures
5.5.1 Community non-structural measures for flood control
The other non-structural cause of flooding in Budalang’i is Poor on-farm activities including
wrong farming methods on areas closer to the main river channel and dykes has caused surface
erosion which consequently result in opened up flood plain making it vulnerable to flooding.
66
Cultivation on steep slopes without applying soil conservation measures promotes soil erosion and
rapid generation of surface runoff.
5.5.2 Sensitization activities would remain necessary
Early warning systems plays an important role in reducing flood damage. An attempt to use hazard
maps is erected at strategic sites on roads and walkways. However, these have the limitation of
being unsustainable as maintenance at these sites appeared costly to the communities at the
villages. Communities that have been given some evacuation drills and are informed on early
warning
5.5.3 Methods shall be developed.
Investment in structural flood control measures such as dams and dykes. This was achieved
through public/private investment in multipurpose dams for water harvesting, storage and
production of electricity. This is exploited for fish farming and small-scale irrigation projects that
target local communities in the study area; and conduct floodplain mapping, land use planning,
and enforcement of laws on land use, agriculture, and settlement. For example, homesteads should
not be constructed in the flood plains, near dykes, or along river banks.
Efforts are directed on training in disaster management, emergency communication and
establishment of disaster management plan. Such disaster management plans would best be
implemented through establishment and development of community-based flood management
organization.
5.5.4 Structural measures for flood control
Structural measures in flood management basically emphasize river bank protection and
harnessing for use, the flood waters. Damaged river banks are being rehabilitated. The drainage
systems are widened and desilted by the community. Maintenance of water canals and irrigation
channels has proven to be costly for government institutions such as the National Irrigation board.
Construction of dams on upper parts of the stream to harness river water at higher velocities for
other socio-economic use. It is apparent that a training and capacity building in water resource
management and flood.
67
The community identify prohibited areas with regards to sand exploitation from river bed near the
point of riverbank rehabilitation as hazard areas. It’s therefore necessary that areas of sand
exploitation should have the community trained on use of sandbags at riverbank for soil loss
prevention. The communities lack adequate information on regulations and use of dykes in river
bank management and therefore efforts to carry out. Along the banks of Nzoia River, part of the
dyke that had been constructed has been damaged by flood such as floods of 2008. The condition
of dykes showed a need of rehabilitation of both southern and northern parts owing to the fact that
there’re specific weak points on the dyke which are vulnerable to breach should water levels rise
beyond the main river channel. For instance, before 2008 floods, flooding frequency due to broken
dyke was so low but has gradually increased over time since then. This could be attributed to the
fact that many parts of the dyke are weak and therefore need for reinforcement or repair as this has
never been the case.
Coping strategies, disaster management training, training on maintenance of dykes, are in great
need. Agriculture technology that would avoid flood and drought damage to crops are still
necessary as non-structure measures in the management of flood water.
68
CHAPTER SIX: SUMMARY, CONCLUSIONS AND RECOMMENDATION
6.0 Introduction
This chapter presents a summary of the research results, conclusions and recommendations made
towards enhancing conservation and effective management of water catchment areas. The
conclusions are drawn from the research findings and discussions. Areas for further research have
also been proposed for exploring flooding problems facing water catchments so that they can be
addressed appropriately.
6.1 Summary
Rainfall duration and intensity affects flooding by increasing run off since it influences the
infiltration and ground seepage rates especially by saturating the soils. Most surges had a tendency
to happen in August, which harmonizes with wetter months of the year (July, August, September,
April and March) as per the rainfall data.
Morphometric characteristics show that areas with stream orders 1 and 5 have the highest flood
risk because their bifurcation ratio is above 2 (Table 2). The areas traversed by stream orders 2, 3,
4 and 6 have a lower bifurcation ratio thus lower chances of flooding. The computation of
bifurcation ratio shows that the values ranged from 1.5 and 3.4 which are within Strahler’s range.
The average value of Bifurcation ratio is 2.2 which is closer to the lower value of 2. Based on
bifurcation ratio, River Nzoia basin flows may encounter delayed time to peak and this is a good
characteristic for planning and conveying flood forecasts. Analysis of drainage density distribution
has shown uniform conveyance with a mean of 0.24-km. This value lacks control values to base
judgment. For this limitation the interpretation is limited to spatial variability and frequent
occurrence floods is attributed to effect off relief ratio Results on relief ratios and basin orders
shows that high relief ratios of above 0.03 are characteristics of upland sub basins and this drops
drastically to a low value of about 0.01 for sub basins at the lowlands by suggesting that this
reduction in relief indices can increase flow width as flow depth cannot be increased in this zone
of the basin due to topographic restrictions
The findings of the study indicate that there has been spatial change in land use over the years in
River Nzoia basin. Land use land cover analysis shows that there is increase in size of the bare
69
ground area which is an indication of wetland degradation and a consequent replacement of
wetland vegetation with bare soil that is prone to erosion. Increased farming activities along the
Nzoia River therefore have resulted to deforestation in search of cultivation areas increasing the
vulnerability of the area to flooding. The rapid expansion of urban centres in the lower parts of the
catchment (Rwambwa, Kakamega, and Bungoma) can be said to be a major contributing factor to
the annual devastating floods.
Various structural and non-structural measures have been put in place, but their efficiency is
lacking for various reasons like wear and tear of some dykes. 93.88% agreed to having experienced
floods. Although chances of reoccurrence of floods were evident only 40.82% had put in place
measures to cope. Only 51.02 % acquired information on floods from the government. Lack of
protective dykes (98.33%); lack of repair of the existing dykes (95.92%) and rainfall intensity
(79.59%) are the main causes of flooding.
6.2 Conclusion
We can reasonably say that, high rainfall intensity and prolonged duration of rainfall, LULC, and
high bifurcation ratio are factors that contribute to flooding. Without proper coping strategies,
disaster management training and training on maintenance of dykes results in adverse flood effects.
6.3 Recommendations
Policy makers
The national government should mobilize the community through the chiefs in public barazas and
create more awareness on flood management practices.
County government
The county government should link the communal groups and beneficiaries with other
stakeholders. In linking people to other societies, it is important to advance partnerships with
conjoint benefits where all parties are equal. Memorandums of understandings can be developed
to support such partnerships
Researchers
There is need for researchers to undertake periodic studies for land-use land cover changes in flood
prone areas of Nzoia catchment and propose appropriate actions
70
REFERENCES
Andreo, B., Jimenez, P., Duran, J.J., Carrasco, F.,Vadillo, I. and Mangin, A. (2006): Climatic and
hydrological variations during the last 117-166 years in the south of the Iberian Peninsula,
from spectral and correlation analyses and continuous wavelet analyses. Journal of
hydrology, vol.324, Issues 1-4, 24-29. Retrieved June 15, 2006, from Science direct
database.
Ajibade, L. T., Ifabiyi, I. P., Iroye, K. A., and Ogunteru, S. (2010). Morphomertic Analysis of
Ogunpa and Ogbere Drainage Basins, Ibadan, Nigeria. Ethiopean Journal of
Environmental Studies and Management, Vol. 3, number 1: 13-19.
Askew, A.J. (1999). Water in the International Decade for Natural Disaster Reduction. In:
Leavesley et al (Eds) Destructive Water: Water-caused Natural Disaster, their Abatement
and Control. IAHS Publication No. 239.
BBC (2000). Mozambique floods 2000: Full coverage. Available at:
http://news.bbc.co.uk/2/hi/africa/655510.stm. Accessed on 24th April 2017.
Botkin, D.B and Keller, E.A. (2003). Environmental Science. Earth as living planet, 4th edition.
John Wiley & Son inc, United Sates of America. 409-411pp.
Brooks. N, (2003). Vulnerability, risk and adaptation: A conceptual framework. Working Paper
38, Tyndall Centre for Climate Change Research. University of East Anglia: Norwich.
Butler, D. & Davies, J.W. (2004): Urban Drainage. 2nd ed. Spon Press, Oxon, 2004.
C A Doswell III (2003). Flooding. University of Oklahoma, Norman, OK, USA.
Clarke, J.I. (1966). “Morphometry from maps,” in Essays in Geomorphology, G. H. Dury, Ed.,
pp. 235–274, Elsevier, New York, NY, USA.
DEFRA. (2010). Surface Water Management Plan Technical Guidance. Department for
Environment, Food and Rural Affairs, Flood Management Division, London, March 2010.
Diplas, P., and Fripp, J. B. (1992). Properties of various sediment sampling procedures. J. Hydr.
Eng. ASCE , 118(7): 955–970.
71
European Commission (EC) (2007), “Directive 2007/60/EC of the European Parliament and of
the Council of 23 October, 2007 on the assessment and management of flood risks”,
Official Journal of the European Union, L288, pp 27-34.
Frans K. (2009) Flood risk assessment and flood risk management. Flood site, UK
Feyen, L. and Watkiss, P. (2011). Technical Policy Briefing Note 3. The Impacts and Economic
Costs of River Floods in Europe, and the Costs and Benefits of Adaptation. Results from
the EC RTD ClimateCost Project. In Watkiss, P (Editor), 2011. The ClimateCost Project.
Final Report. Published by the Stockholm Environment Institute, Sweden, 2011. ISBN.
978-91-86125-35-6.
FRC (2012): FRC – wp3 – alleviation. (Electronic). www.floodresiliencity.eu. Accessed
12.3.2012.
Gadain, H., M., Bidault, N., Stephen, L., Watkins, B., Dilley, M., and Mutunga, N. (2006), in
‘Natural Disaster Hotspots: Case Studies, Reducing the Impacts of Floods through Early
Warning and Preparedness: A Pilot Study for Kenya’, Disaster Risk Management Series
No. 6, (Washington DC: World Bank).
Galloway, G. (2004). USA: Flood Management - Mississippi River. WMO/GWP Associated
Programme on Flood Management. Available at:
http://www.floodmanagement.info/publications/casestudies/cs_usa_mississippi_full.pdf
Accessed on 19th April 2017.
Gregory, K.J. and Walling, D.E. (1973) Drainage Basin Form and Process: A Geomorphological
Approach. Wiley, New York.
Gottschalk, L.C. (1964). “Reservoir sedimentation in handbook of applied hydrology”. McGraw
Hill Book Company, New York (Section 7-1), 1964.
GoK (2013). Busia County Integrated Development Plan (2013-2017)
Government of Kenya [GoK] (2007). Western Kenya Community - Driven Development and Flood
Mitigation Project, Project Implementation Plan, August 2007, Nairobi: Ministry of State
for Special Programmes.
72
Government of Kenya [GoK] (2009). Flood Mitigation Strategy, Nairobi: Ministry of Water and
Irrigation.
Haggstrom, S. (1999): Hydraulik för V-Teknologer (Hydraulics for Civil Engineering students. In
Swedish). Department for Water Engineering, Chalmers University of Technology,
Gothenburg, August 1999.
Hansson, K., Hellman, F., Grauert, M. & Larsen, M. (2010): The Blue Spot Concept. Report 181-
2010, Road Directorate, Danish Road Institute, May 2010.
Hartmann DL, Klein Tank AMG, Rusticucci M, Alexander LV, Brönnimann S, Charabi Y,
Dentener FJ, Dlugokencky EJ, Easterling DR, Kaplan A, Soden BJ, Thorne PW, Wild M
and Zhai P (2013) Observations: Atmosphere and Surface in: Climate Change 2013: The
Physical Science Basis. Contribution of Working Group I to the Fifth Assessment Report
of the Intergovernmental Panel on Climate Change [Stocker TF, Qin D, Plannet G-K,
Tignor M, Allen SK, Boschung J, Nauels A, Xia Y, Bex V and Midgley PM (eds.)].
Cambridge University Press, Cambridge, United Kingdom and New York, NY, USA.
Hardy, R.J. (2005): Fluvial geomorphology: Progress in Physical Geography. Progress Reports.
(Available online).
Horton R.E. (1945). Erosional development of streams and their drainage basins: Hydrophysical
approach to quantitative morphology, Bulletin of Geological Society of America, 5, pp
275-370
Horton, R.E. (1932). “Drainage basin characteristics,” Transactions of American Geophysics
Union, vol. 13, pp. 350–361.
Houston, D., Werritty, A., Basset, D., Geddes, A., Hoolachan, A. and McMillian, M. (2011):
Pluval (rain-related) flooding in urban areas: the invisible hazard. University of Dundee,
Joseph Rowntree Foundation, York.
ICPAC, (2007), ‘Climate Change and Human Development in Africa: Assessing the Risks and
Vulnerability of Climate Change in Kenya, Malawi and Ethiopia’, (Nairobi: UNDP).
Jain, V. and Sinha, R. (2003) Evaluation of Geomorphic Control on Flood Hazard through
Geomorphic Instantaneous Unit Hydrograph. Current Science, 85 (11), 26-32.
73
Jones, J. A. A. (1999), Global Hydrology: Processes, Resources and Environmental Management,
Longman, 399 pp
John, J. A (2011), Flood disaster preparedness and management in schools; case study of
Budalangi
Jeb, D. N., and Aggarwal, S. P., (2008). “Flood inundation hazard modeling of the River Kaduna
using remote sensing and geographic information systems”, Journal of Applied Sciences
Research, 4 (12), pp 1822 -1833.
Jha, A.K., Bloch, R., and Lamond, J. (2012): Cities and Flooding - A Guide to Integrated Urban
Flood Risk Management for the 21st Century. The World Bank, Washington DC.
Kellerhals, R., and Bray, D. I. (1971). Sampling procedures for coarse fluvial sediments. J. Hydr.
Eng. Div. ASCE, 103(HYB), 1165–1180.
Kenya National Bureau of Statistics (KNBS) (2013). Statistical Abstract 2013, Nairobi.
Kenya Soil Survey. (1991). Land Use and Land Evaluation-Kenya Soil Survey 1991. Kenya
Livestock and Agricultural Research.
Langbein, W. B and Others. (1944). Topographic Characteristics of Drainage Basins. Geological
Survey Water-Supply Paper 968-C, USA.
Lidstone, J. and Dechano, L.M. (2004): International Perspectives on Natural Disasters:
Occurrence, Mitigation, and Consequences. Springer, New York.
Mukhopadhyay, S. (2010): “A Geo-Environmental Assessment of Flood Dynamics in Lower
Ajoy River Inducing Sand Splay Problem in Eastern India”. Ethiopian Journal of
Environmental Studies and Management, 3(2)
Murray, A. (2017). Natural Flood Management Adopting ecosystem approaches to managing
flood risk. Friends of the Earth, 9 Upper Mount Street, Dublin 2.
M.O Nyadawa and J.K. Mwangi (2010) Geomorphologic characteristics of Nzoia River Basin
National Environmental Monitoring Standards (2013). Open Channel Flow Measurement,
Processing and Archiving of Open Channel Flow Data Version: 1.1
74
Opondo, D.O. (2013). Loss and damage from flooding in Budalang’i District, Western Kenya.
Loss and Damage in Vulnerable Countries Initiative, case study report. Bonn: United
Nations University Institute for Environment and Human Security.
Okoko, E. E. and Olujinmi, J. A. B. (2003), The Role of Geomorphic Features in Urban Flooding:
The case of Ala River in Akure, Nigeria. Int. Journal of Environmental Issues, 1 (1), 192-
201
Oruonye, E. D., Ezekiel, B. B., Atiku, H. G., Baba, E. and Musa, N. I. (2016). Drainage basin
morphometric parameters of River Lamurde: Implication for hydrologic and Geomorphic
processes. Journal of Agriculture and Ecology Research International, 5 (2): 1-11.
Otiende, B. (2009). The economic impacts of climate change in Kenya: riparian flood impacts and
cost of adaptation. [Online] weadapt.org/knowledge-base/files/758/4e25a4b8c8bf61C-
kenya-riparian-floods-case-study.pdf. (Accessed May 20, 2017).
Oyatayo K. T, Bello I., Ndabula C., Godwill G. J. and Ademola S. J. (2017). A Comparative
Analysis of Drainage Morphometry on Hydrologic Characteristics of Kereke and Ukoghor
Basins on Flood Vulnerability in Makurdi Town, Nigeria.
Oyugi, A., Ong’ang’a, O., Awange, J.L., 2003. Poverty reduction: a challenge for Lake
Victoriabasin. Osienala, Kisumu, Kenya.
Paron, P., Olago, D.O., and Omuto, C.T. (2013). Kenya: A Natural Outlook. Geo-Environmental
Resource and Hazards. Elsevier. The Boulevard, Langford Lane, Kindlington, Oxford,
OX% 1 BG, UK Radarweg 29, P.O. Box 211, 100 AE Amsterdam, The Netherlands.
Republic of Kenya (2002), ‘National Policy on Disaster Management,’ (Nairobi: Ministry of
Special Programmes).
Schumm, S.A. (1956) Evaluation of Drainage System and Slopes in Badlands at Perth Amboy, New Jersey.
Geological Society of America Bulletin, 67, 597-646. http://dx.doi.org/10.1130/0016-
7606(1956)67[597:EODSAS]2.0.CO;2
Singh, M.C. S., “Morphometric analysis of kanhar river basin, National Geographical”, Jour. OF
India. 43(1): pp. 31-43., 1997.
Strahler, A.N. (1964) Quantitative Geomorphology of Drainage Basinsand Channel Networks. In: Chow,
V.T., Ed., Handbook of Applied Hydrology, McGraw Hill, New York, Section 4-11.
75
Smith, K., and Ward, R.C. (1998), ‘Floods: Physical Processes and Human Impacts’, (Chichester:
Wiley).
Sreedevi,P.D, P.D, P.D and P.D. Sreekanth(2013)” Drainage morphometry and its influence on
hydrology in semi-arid region
UNEP (2009), “Kenya: Atlas of Our Changing Environment.” Division of Early Warning and
Assessment (DEWA) United Nations Environment Programme (UNEP) P.O. Box 30552
Nairobi 00100, Kenya
UNEP. (2006). Lake Victoria Basin Environment Outlook: Environment and Development. UNEP,
Nairobi.
UNEP. (2009). “Kenya: Atlas of Our Changing Environment.” Division of Early Warning and
Assessment (DEWA) United Nations Environment Programme (UNEP) P.O. Box 30552
Nairobi 00100, Kenya.
United Nation Economic and Social Commission for Asia and the Pacific (UNESCAP) (2016).
Disasters in Asia and the Pacific: 2015 Year in Review. Available at:
http://www.unescap.org/sites/default/files/2015_Year%20in%20Review_final_PDF_1.pd
f Accessed on 19th Apr.il 2017
United Nations Office for the Coordination of Humanitarian Affairs (2006), ‘Kenya Floods:
OCHA Situation Report No. 2’. Ref: OCHA/GVA 2006/0243 Available at
http://www.reliefweb.int accessed on 27 March 2008
United Nation Disaster Risk Reduction (UNISDR) (2015). Scientific and Technical Advisory
Group Case Studies – 2015 Early Warning Science: A case of Flood Alert System, River
Nzoia, Western Kenya
United Nations. (2009). Water in a Changing World, 318 pp., UNESCO, Paris.
Viglione A. and Bloschl G. (2009). On the role of storm duration in the mapping of rainfall to
flood return periods. Institut fur Wasserbau und Ingenieurhydrologie, Technische
Universit ¨ at Wien, Austria.
Whitney, A., Malley, J., and Chitouze, M. (2013). Using open source data for flood risk mapping
and management in Brazil. Geophysical Research Abstracts Vol. 15, EGU2013-7829,
2013 EGU General Assembly 2013.
76
World Bank (2009) Making Development Climate Resilient: A World Bank strategy for Sub-
Saharan Africa, Report number 46947. Washington, DC: The World Bank.
World Bank Group (2012). KE restructuring Paper On a proposed project restoring of the western
Kenya community driven development and flood mitigation project (WKCDFMP), World
Bank Group, 70215.
WWAP (2006). UN World Water Development Report. World Water Assessment Programme
WWAP, Paris.


