Embed Size (px)
Citation preview
Morphometric analysis of subcortical structures in ProgressiveSupranuclear Palsy: in vivo evidence of neostriatal andmesencephalic atrophy
Jeffrey Chee Leong Looia,*,†, Matthew D. Macfarlanea,*, Mark Walterfangb,*, Martin Stynerc,Dennis Velakoulisb, Jimmy Lättd, Danielle van Westend,e, and Christer Nilssonf
aResearch Centre for the Neurosciences of Ageing, Academic Unit of Psychological Medicine,School of Clinical Medicine, Australian National University Medical School, Canberra, AustraliabMelbourne Neuropsychiatry Centre, Royal Melbourne Hospital and University of Melbourne,Melbourne, AustraliacDepartment of Psychiatry and Department of Computer Science, University of North Carolina,Chapel Hill, North Carolina, USAdCenter for Medical Imaging and Physiology, Skåne University Hospital, Lund, SwedeneDiagnostic Radiology, Department of Clinical Sciences, Lund University, Lund, SwedenfGeriatric Psychiatry, Department of Clinical Sciences, Lund University, Lund, Sweden
AbstractProgressive supranuclear palsy (PSP) is a neurodegenerative disease characterized by gait andpostural disturbance, gaze palsy, apathy, decreased verbal fluency and dysexecutive symptoms,with some of these clinical features potentially having origins in degeneration of frontostriatalcircuits and the mesencephalon. This hypothesis was investigated by manual segmentation of thecaudate and putamen on MRI scans, using previously published protocols, in 15 subjects with PSPand 15 healthy age-matched controls. Midbrain atrophy was assessed by measurement of mid-sagittal area of the midbrain and pons. Shape analysis of the caudate and putamen was performedusing spherical harmonics (SPHARM-PDM, University of North Carolina). The sagittal pons area/midbrain area ratio (P/M ratio) was significantly higher in the PSP group, consistent with previousfindings. Significantly smaller striatal volumes were found in the PSP group – putamina were 10%smaller and caudate volumes were 17% smaller than in controls after controlling for age andintracranial volume. Shape analysis revealed significant shape deflation in PSP in the striatum,
© 2011 Elsevier Ireland Ltd. All rights reserved.† Correspondence: Associate Professor Jeffrey Looi, Academic Unit of Psychological Medicine, ANU Medical School, Building 4,Level 2, Canberra Hospital, Garran A.C.T. 2605, [email protected].*Equal first co-authors – we assert that the first three authors contributed equally as first coauthorsContributors: JCLL designed, coordinated and is guarantor of the study, performed image and statistical analysis, and co-authored thefirst draft of the paper. MM performed all measurements on striatal volumes and the P/M ratios, performed statistical analysis and co-authored the first draft of the paper. MW coordinated and performed the spherical harmonic shape analysis, automated analysis todetermine intracranial volume, and co-authored the first draft of the paper. The first three authors assert they are equal first co-authorsof the paper on the basis of their contributions. MS designed SPHARM-PDM tools and assisted with analysis DV is a co-investigatorwith MW and provided image analysis infrastructure. JL and DvW performed image preprocessing. DvW read the MRI formorphological findings. CN was responsible for recruitment and diagnosis of patients and controls, and is the principal investigator.All authors contributed to the writing of the final paper.Publisher's Disclaimer: This is a PDF file of an unedited manuscript that has been accepted for publication. As a service to ourcustomers we are providing this early version of the manuscript. The manuscript will undergo copyediting, typesetting, and review ofthe resulting proof before it is published in its final citable form. Please note that during the production process errors may bediscovered which could affect the content, and all legal disclaimers that apply to the journal pertain.
NIH Public AccessAuthor ManuscriptPsychiatry Res. Author manuscript; available in PMC 2012 November 30.
Published in final edited form as:Psychiatry Res. 2011 November 30; 194(2): 163–175. doi:10.1016/j.pscychresns.2011.07.013.
NIH
-PA Author Manuscript
NIH
-PA Author Manuscript
NIH
-PA Author Manuscript
compared to controls; with regionally significant change relevant to frontostriatal andcorticostriatal circuits in the caudate. Thus, in a clinically diagnosed and biomarker-confirmedcohort with early PSP, we demonstrate that neostriatal volume and shape are significantly reducedin vivo. The findings suggest a neostriatal and mesencephalic structural basis for the clinicalfeatures of PSP leading to frontostriatal and mesocortical-striatal circuit disruption.
KeywordsNeostriatum; Caudate; Putamen; Mesencephalon; Magnetic Resonance Imaging
1. IntroductionProgressive supranuclear palsy (PSP) is a neurodegenerative disorder characterized bypostural instability and gait disturbance, bradykinesia and axial rigidity, vertical gaze palsyand bulbar palsy (Steele et al., 1964), in combination with neuropsychiatric symptoms suchas apathy and utilization behaviour. Cognitive and behavioral features in PSP involvefunctional domains ascribed neuroanatomically to the fronto-striato-pallido-thalamic-cortical (frontostriatal) re-entrant circuits (Alexander et al., 1986; Cummings, 1993). PSPhas a progressive and irreversible course, with disease duration usually between 6-12 years(Williams and Lees, 2009).
The molecular pathology of PSP is characterized by accumulation of tau protein andneuropil filaments within the pallidum, subthalamic nucleus, red nucleus, oculomotornucleus, dentate nucleus, medulla, ventral tegmentum and neostriatum (caudate andespecially putamen) (Williams and Lees, 2009). Macroscopic atrophy of the frontal cortex(Cordato et al., 2002) and subcortical structures (Schulz 1999; Schrag et al., 2000)distinguishes PSP from other parkinsonian syndromes on MRI. Subcortical atrophy in PSPaffects the midbrain (particularly the ventral tegmentum), neostriatum, mamillary bodies andthe superior cerebellar peduncle (Schrag et al., 2000), with the neostriatum and midbraininvolved in frontostriatal circuits. Hence, there is morphological evidence that frontostriatalpathways may be disrupted by PSP.
Given the strategic location of the neostriatum in frontostriatal circuits, there have beensurprisingly few attempts to quantify neostriatal atrophy as a structural basis for theneuropsychiatric clinical features of PSP. A post-mortem study of four patients with PSPfound non-significant reductions in the cross-sectional area of striatal structures (Mann etal., 1993). Another small (n=6) MRI study found significant reductions in striatal volume inPSP patients (Schulz et al., 1999). Cordato et al. (2002) identified 15% reduction in caudatevolume (normalized for intracranial volume) in a PSP sample (n=21), but this was notsignificant once corrected for whole brain size. The Schulz et al. (1999) study is thereforethe only study to our knowledge that has successfully quantified previously pathologicallyobserved striatal atrophy in PSP in vivo.
Previous morphometric research has demonstrated that neostriatal shape and volume changein vivo, assessed via MRI, is apparent in neurodegenerative disease that involves fronto- orcortico-striatal neuronal circuits such as frontotemporal lobar degeneration and subtypes,Alzheimer's disease, and choreoacanthocytosis (Looi et al., 2010: Looi et al., 2011; Madsenet al., 2010; Walterfang et al., 2011). The neuroanatomical correlates of such research yieldvolume and shape. Form or shape is closely related to function (Thompson, 1945), anddeformity to dysfunction in the neostriatum (Looi et al., 2010: Looi et al., 2011; Madsen etal., 2010; Walterfang et al., 2011). Medium size densely spiny projection neurons comprise90-95% of the neostriatum and virtually all the cortical mantle projects as inputs to the
Looi et al. Page 2
Psychiatry Res. Author manuscript; available in PMC 2012 November 30.
NIH
-PA Author Manuscript
NIH
-PA Author Manuscript
NIH
-PA Author Manuscript
neostriatum in a highly topographic pattern (Bolam et al., 2000). In turn, the outputprojections are directly to substantia nigra pars compacta and globus pallidus interna, andindirectly to globus pallidus externa (Bolam et al., 2000). In addition, the ventral tegmentalarea and substantia nigra pars compacta, both located in the midbrain, provide dopaminergicinputs to the neostriatum (Fields, 2007; Utter and Basso, 2008). Thus, the neostriatum servesas a topographically organized map of its cortical and subcortical connections (Haber, 2003;Draganski et al., 2008). Based upon the previous findings of neuropathologic and in vivostriatal atrophy in PSP and other neurodegenerative disease, we hypothesized that alteredneostriatal morphology should be evident in PSP.
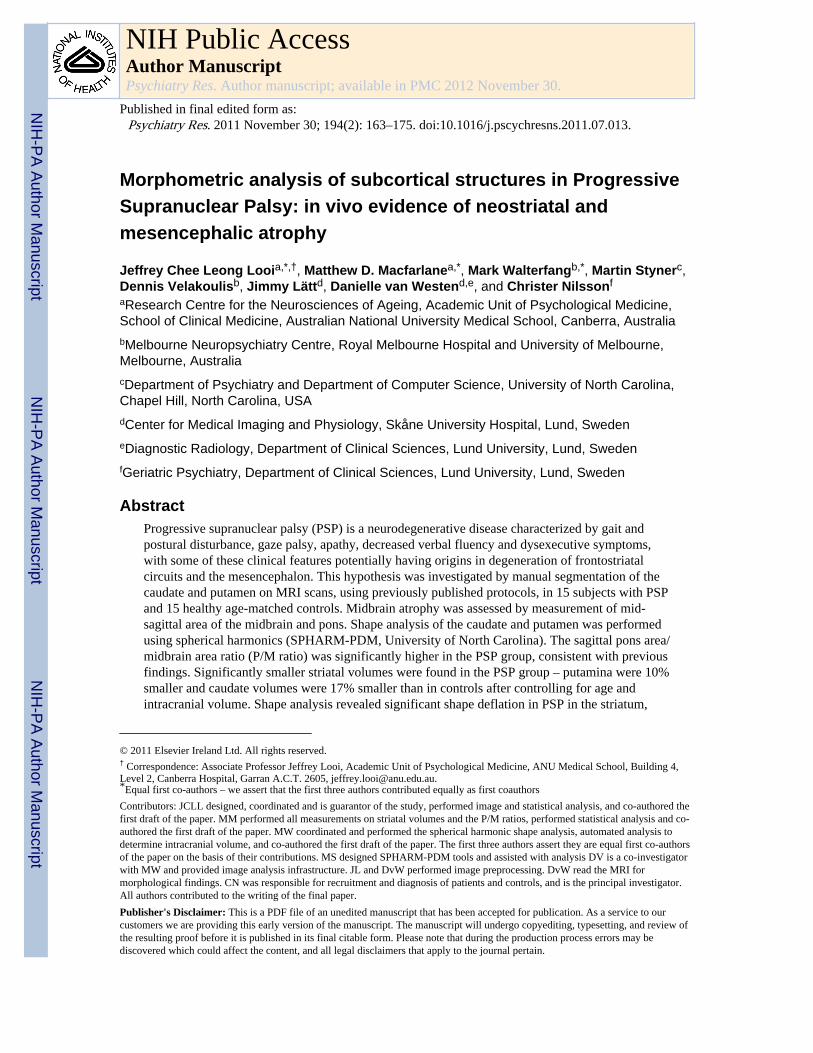
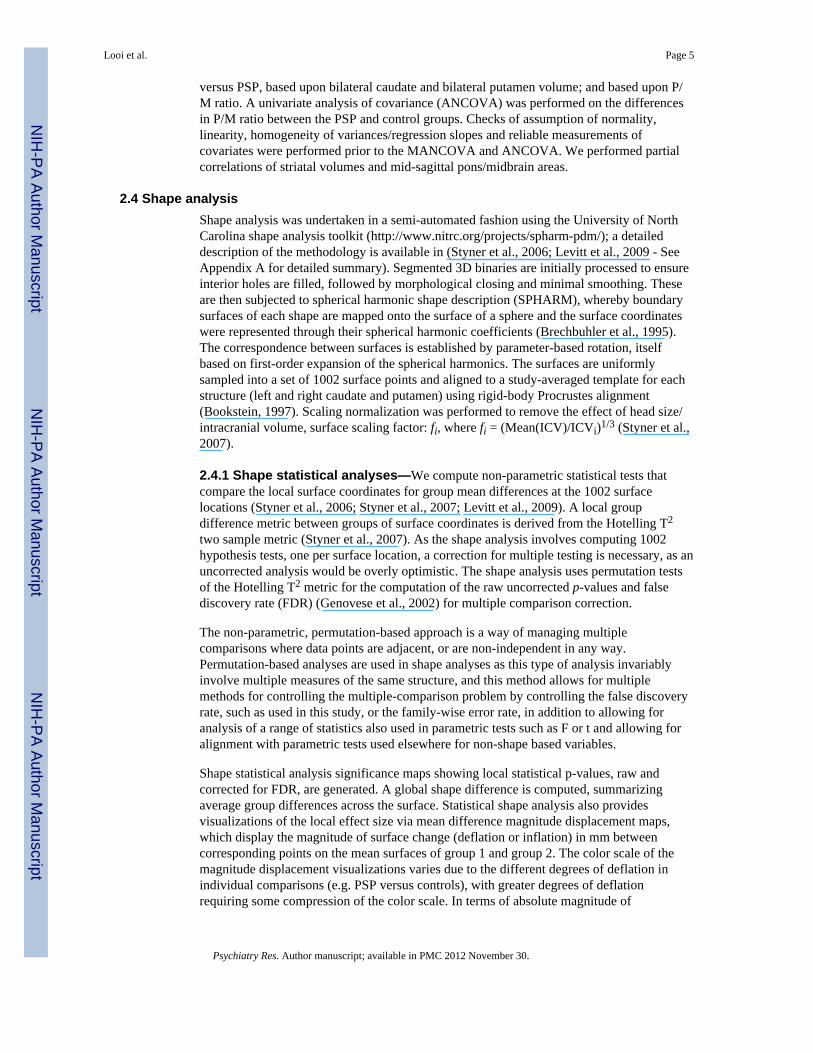
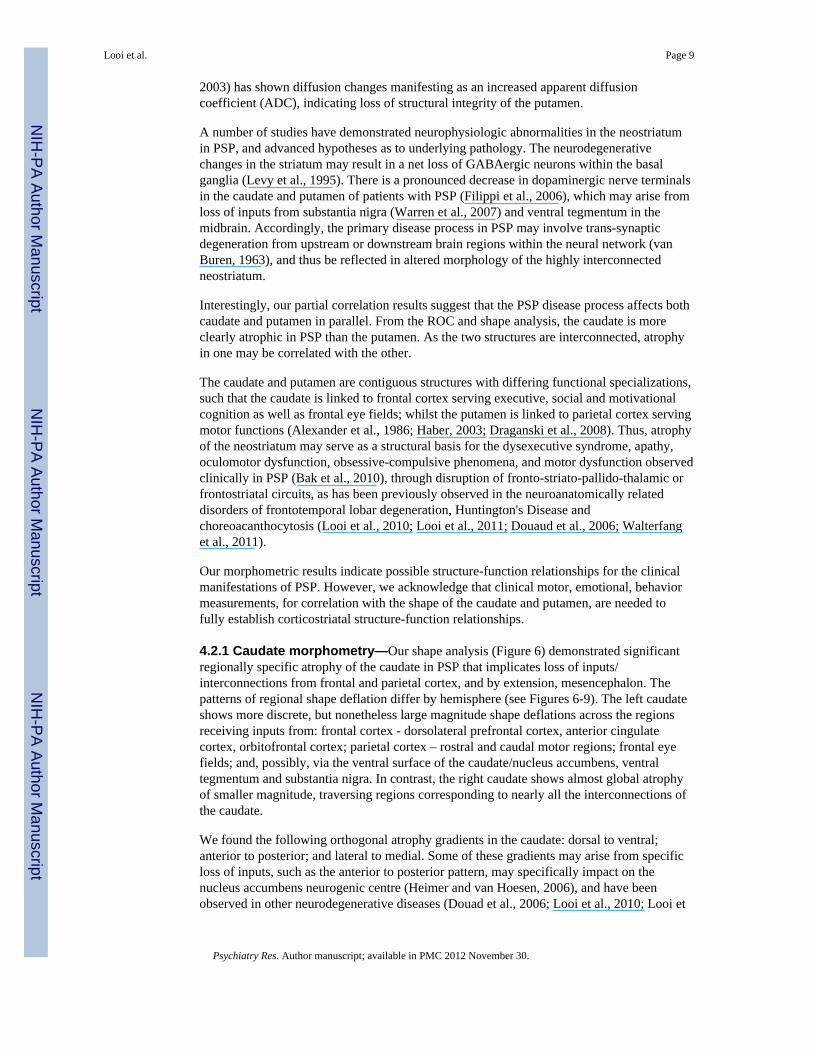
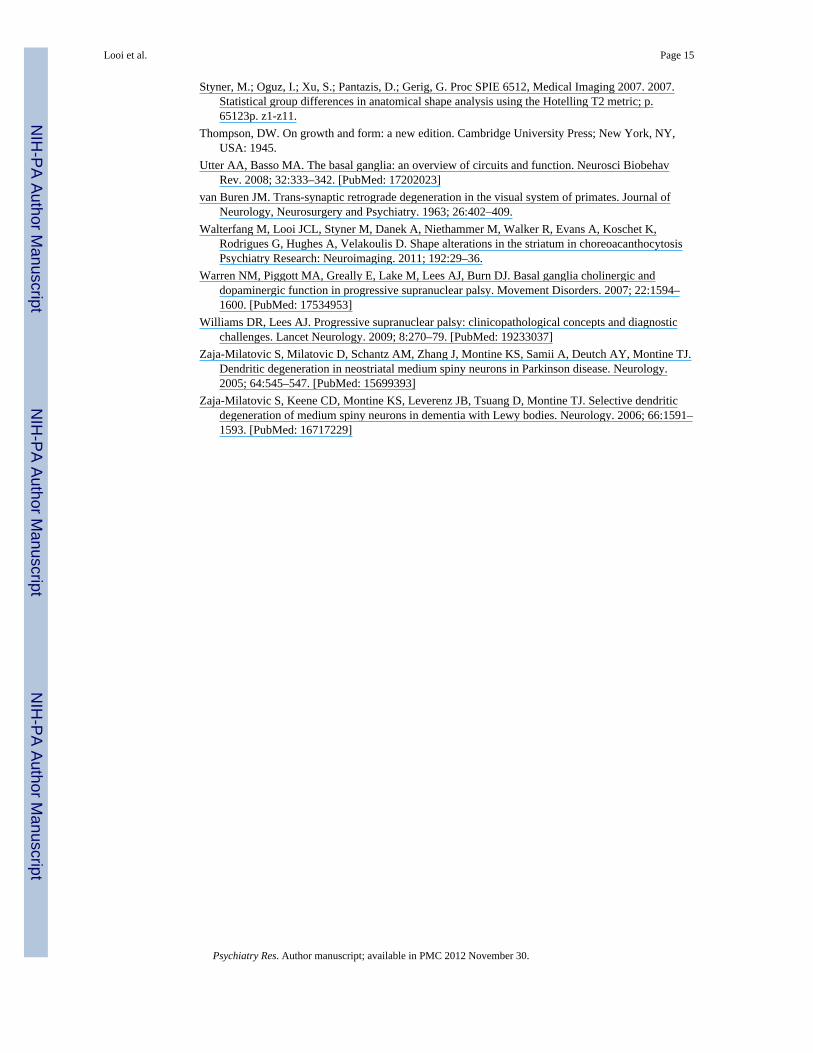
Previous clinical neuroimaging studies have confirmed the diagnostic accuracy of the‘penguin’ or colibri (hummingbird) MRI sign of mesencephalic atrophy (Schrag et al., 2000)which has been quantified by decreased pons area/midbrain area ratio from a mid-sagittalMRI image (Oba et al., 2005; Quattrone et al., 2008). Named for the silhouette appearanceof the pons and atrophic midbrain as a ‘standing penguin’ in cases of PSP, this sign mayserve as a useful in vivo biomarker (see Fig 1). Mesencephalic atrophy may also lead tomeso-cortical and meso-striatal disconnection, resulting in further frontostriatal dysfunction(Ikemoto, 2007; Fields, 2007; Sesack and Grace, 2010).
Given the implications of frontostriatal circuits, mesencephalic and neostriatal atrophy in theætiopathology of PSP, and, as dysfunction arises from deformation, we hypothesized thataltered neostriatal morphology should be evident in PSP. Our primary aim in this study wasto perform morphometric analysis on neostriatal structures in order to quantify differencesbetween patients with PSP and healthy age-matched controls measured as volume and shapeof the caudate and putamen. Secondly, we hypothesized that subcortical mesencephalicatrophy would be evident through quantitative assessment of the penguin sign, and thuswould serve as a confirmatory biomarker of PSP (Oba et al., 2005; Quattrone et al., 2008).
2. Method2.1 Participants
Fifteen patients with progressive supranuclear palsy (PSP) were recruited for the study,representing an expanded cohort (patients and controls) of a previous study (Kvickström etal., 2011). The diagnosis of probable PSP was made using established clinical criteria(Litvan et al., 2003) in combination with clinical investigations. The presence of fronto-subcortical symptoms (grouped into three categories: dysexecutive symptoms, apathy/lackof initiative and personality change) were recorded on the basis of clinical examination,review of medical records and interview with a caregiver. Disease severity wascharacterized by the Schwab and England (1969) scale for Parkinson's disease. The patientswere followed up for an average of three years (range 2-5), to improve the accuracy of theclinical diagnosis. All MRI scans were performed a maximum of four years after symptomonset according to patient and caregiver interview. Fifteen healthy age-matched controls,assessed via interview and clinical examination, were recruited for comparison. Patients andcontrols were recruited from Lund University Hospital and Landskrona Hospital, Sweden.All patients and controls gave written consent to participate in the study, which wasapproved by the Regional Ethics Committee for Research.
2.2 Image AnalysisMRI was performed using a 3.0 T Philips MR scanner, equipped with an eight-channel headcoil (Philips Achieva®, Philips Medical Systems, Best, The Netherlands). High resolutionanatomical images were acquired using a T1-weighted turbo field echo (T1 TFE) pulsesequence with parameters set as follows: TR 8 ms; TE 4 ms; TI 650 ms; FA 10º; NEX 2;
Looi et al. Page 3
Psychiatry Res. Author manuscript; available in PMC 2012 November 30.
NIH
-PA Author Manuscript
NIH
-PA Author Manuscript
NIH
-PA Author Manuscript
SENSE-factor 2.5; matrix 240 × 240; FOV 240; resulting voxel size 1 × 1 × 1 mm3. In total175 contiguous coronal slices were obtained. T2 FLAIR (TR / TE / TI / voxel size: 12000msec / 140 msec / 2850 / 0.63 mm × 0.83 mm × 5 mm) and diffusion weighted (TR / TE / b-values / voxel size: 2255 ms / 55 ms/ b= 0, 1000 / 0.9 mm × 0.9 mm × 5 mm) images wereused to assess the presence of focal lesions in the caudate nucleus and the putamen.
The T1-weighted images were anonymized, randomly coded to ensure blinding, andtransferred to a MacBook Pro (Apple Inc, Cupertino, California, USA) computer at theAustralia National University Medical School in Canberra, Australia.
Manual segmentation of striatal structures and area measurement (P/M ratio) was performedby a single investigator (MM) who was blind to clinical diagnosis for all measurements.Reliability of image analysis was performed by measuring intra-class correlations betweeninitial segmentation and random repeated segmentation of five subjects, and was calculatedin SPSS 17.0 (IBM Corporation, Somers, New York, USA). Inter-rater reliability of manualsegmentation was also calculated from a second experienced tracer (JCLL).
2.2.1 Mid-sagittal pons and midbrain area—Quantification of mesencephalic atrophywas performed by measuring the area of the midbrain and pons in the mid-sagittal slice foreach subject using ANALYZE 10.0b, by manual segmentation using a published protocol(Oba et al., 2005; Quattrone et al., 2008). Using these measures, we calculated the ratio ofpons area to midbrain area (P/M ratio) (Figure 1).
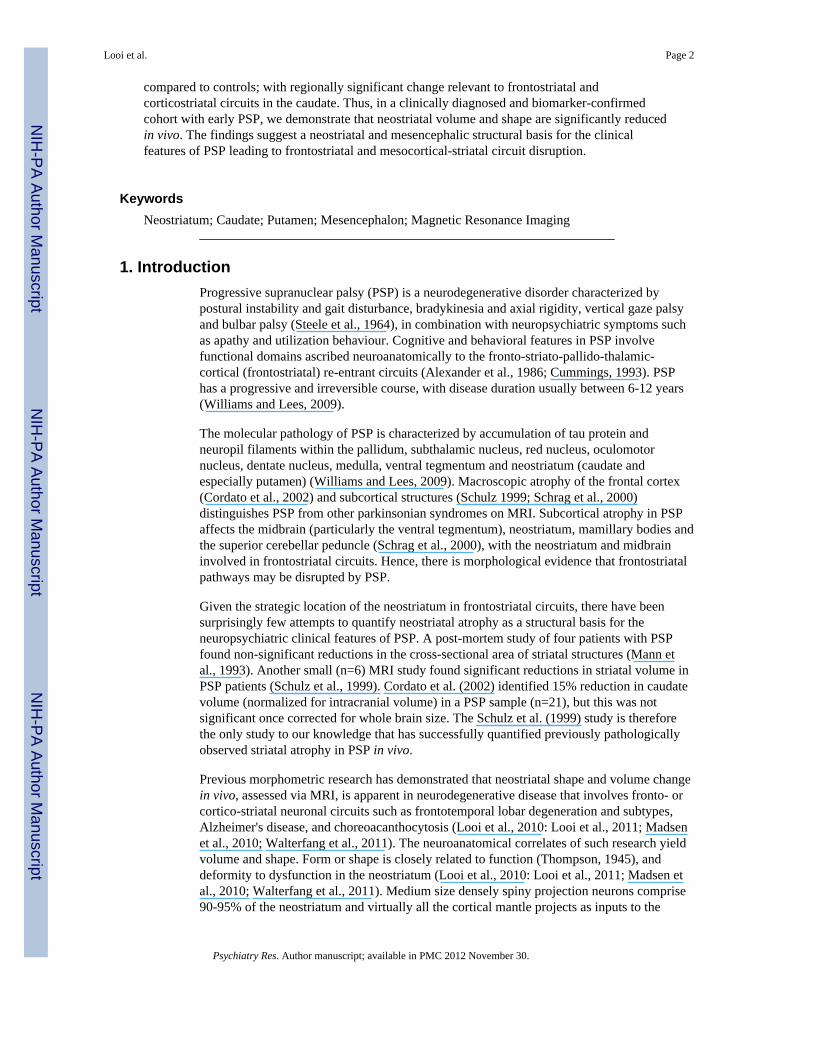
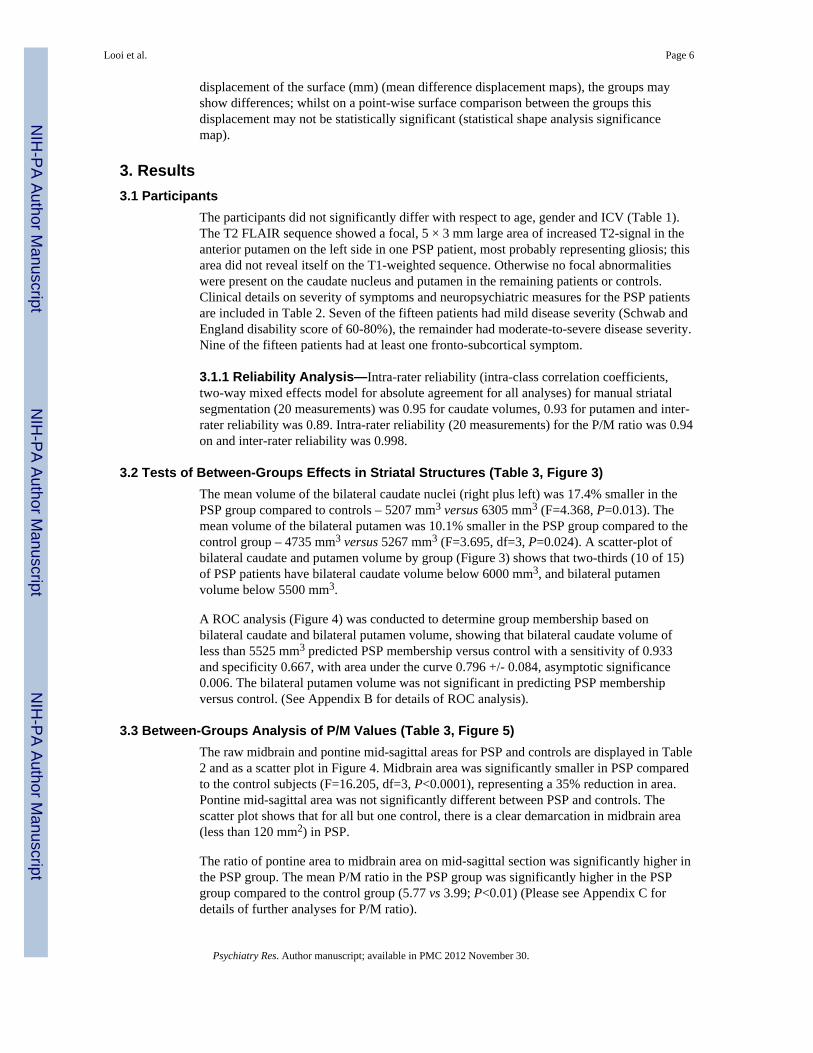
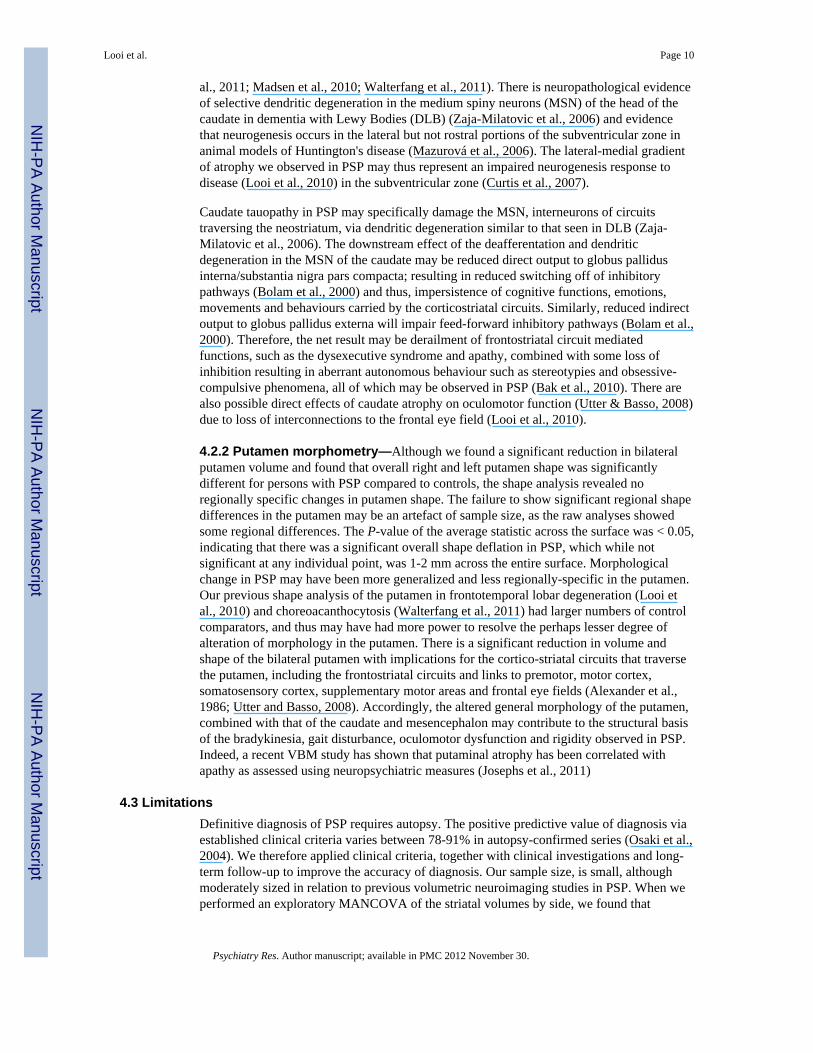
2.2.2 Striatal Volumetric Analysis—Volumetric analysis was performed on the caudatenucleus and putamen bilaterally according to previously published protocols (Looi et al.,2008, 2009). Briefly, this involved using ANALYZE 10.0b (Mayo BIR, Rochester, NewYork, USA) to manually trace the outline of the caudate nucleus and putamen bilaterallythrough successive axial slices, in this series with reference to sagittal and coronal views,editing as required in orthogonal planes, and measuring the volume thus delineated. The tailof the caudate and the nucleus accumbens below the axial plane of the inferior aspectanterior commissure were not included in the segmentations (Figure 2).
2.2.3 Intracranial volume measurement—The intracranial volume (ICV) wasdetermined in a semi-automated fashion using FSL software (FMRIB Group, Oxford). First,brains were skull-stripped with the Brain Extraction Tool (BET) and were then linearlyaligned to the MNI152 1mm T1-weighted template. The inverse of the determinant of theaffine transformation matrix was multiplied by the ICV of the MNI152 template to producea measure of ICV for use as a scaling factor, measured in cubic centimetres (ENIGMA,2011).
2.3 Statistical analysis for volumetric and area measurementsStatistical analysis was performed using SPSS 17.0. Demographics were assessed using anindependent-samples t-test, with gender distribution (equal proportions expected) assessedvia Chi-square analysis. Intra-rater reliability (intra-class correlation coefficients, two-waymixed effects model for absolute agreement for all analyses) were used to assess reliabilityfor manual striatal segmentation and measurement of PM ratio. Multivariate analysis of co-variance (MANCOVA) was used to assess the significance of any differences in bilateralcaudate volume and bilateral putamen volume (bilateral volumes were used, as due tosample size and unequal errors of variance, full analyses by right and left side could not beperformed using a MANCOVA) between the PSP and control groups; and between midbrainand pontine mid-sagittal area. Covariates were age and ICV. A receiver-operatingcharacteristics (ROC) analysis was conducted to determine group membership, controls
Looi et al. Page 4
Psychiatry Res. Author manuscript; available in PMC 2012 November 30.
NIH
-PA Author Manuscript
NIH
-PA Author Manuscript
NIH
-PA Author Manuscript
versus PSP, based upon bilateral caudate and bilateral putamen volume; and based upon P/M ratio. A univariate analysis of covariance (ANCOVA) was performed on the differencesin P/M ratio between the PSP and control groups. Checks of assumption of normality,linearity, homogeneity of variances/regression slopes and reliable measurements ofcovariates were performed prior to the MANCOVA and ANCOVA. We performed partialcorrelations of striatal volumes and mid-sagittal pons/midbrain areas.
2.4 Shape analysisShape analysis was undertaken in a semi-automated fashion using the University of NorthCarolina shape analysis toolkit (http://www.nitrc.org/projects/spharm-pdm/); a detaileddescription of the methodology is available in (Styner et al., 2006; Levitt et al., 2009 - SeeAppendix A for detailed summary). Segmented 3D binaries are initially processed to ensureinterior holes are filled, followed by morphological closing and minimal smoothing. Theseare then subjected to spherical harmonic shape description (SPHARM), whereby boundarysurfaces of each shape are mapped onto the surface of a sphere and the surface coordinateswere represented through their spherical harmonic coefficients (Brechbuhler et al., 1995).The correspondence between surfaces is established by parameter-based rotation, itselfbased on first-order expansion of the spherical harmonics. The surfaces are uniformlysampled into a set of 1002 surface points and aligned to a study-averaged template for eachstructure (left and right caudate and putamen) using rigid-body Procrustes alignment(Bookstein, 1997). Scaling normalization was performed to remove the effect of head size/intracranial volume, surface scaling factor: fi, where fi = (Mean(ICV)/ICVi)1/3 (Styner et al.,2007).
2.4.1 Shape statistical analyses—We compute non-parametric statistical tests thatcompare the local surface coordinates for group mean differences at the 1002 surfacelocations (Styner et al., 2006; Styner et al., 2007; Levitt et al., 2009). A local groupdifference metric between groups of surface coordinates is derived from the Hotelling T2
two sample metric (Styner et al., 2007). As the shape analysis involves computing 1002hypothesis tests, one per surface location, a correction for multiple testing is necessary, as anuncorrected analysis would be overly optimistic. The shape analysis uses permutation testsof the Hotelling T2 metric for the computation of the raw uncorrected p-values and falsediscovery rate (FDR) (Genovese et al., 2002) for multiple comparison correction.
The non-parametric, permutation-based approach is a way of managing multiplecomparisons where data points are adjacent, or are non-independent in any way.Permutation-based analyses are used in shape analyses as this type of analysis invariablyinvolve multiple measures of the same structure, and this method allows for multiplemethods for controlling the multiple-comparison problem by controlling the false discoveryrate, such as used in this study, or the family-wise error rate, in addition to allowing foranalysis of a range of statistics also used in parametric tests such as F or t and allowing foralignment with parametric tests used elsewhere for non-shape based variables.
Shape statistical analysis significance maps showing local statistical p-values, raw andcorrected for FDR, are generated. A global shape difference is computed, summarizingaverage group differences across the surface. Statistical shape analysis also providesvisualizations of the local effect size via mean difference magnitude displacement maps,which display the magnitude of surface change (deflation or inflation) in mm betweencorresponding points on the mean surfaces of group 1 and group 2. The color scale of themagnitude displacement visualizations varies due to the different degrees of deflation inindividual comparisons (e.g. PSP versus controls), with greater degrees of deflationrequiring some compression of the color scale. In terms of absolute magnitude of
Looi et al. Page 5
Psychiatry Res. Author manuscript; available in PMC 2012 November 30.
NIH
-PA Author Manuscript
NIH
-PA Author Manuscript
NIH
-PA Author Manuscript
displacement of the surface (mm) (mean difference displacement maps), the groups mayshow differences; whilst on a point-wise surface comparison between the groups thisdisplacement may not be statistically significant (statistical shape analysis significancemap).
3. Results3.1 Participants
The participants did not significantly differ with respect to age, gender and ICV (Table 1).The T2 FLAIR sequence showed a focal, 5 × 3 mm large area of increased T2-signal in theanterior putamen on the left side in one PSP patient, most probably representing gliosis; thisarea did not reveal itself on the T1-weighted sequence. Otherwise no focal abnormalitieswere present on the caudate nucleus and putamen in the remaining patients or controls.Clinical details on severity of symptoms and neuropsychiatric measures for the PSP patientsare included in Table 2. Seven of the fifteen patients had mild disease severity (Schwab andEngland disability score of 60-80%), the remainder had moderate-to-severe disease severity.Nine of the fifteen patients had at least one fronto-subcortical symptom.
3.1.1 Reliability Analysis—Intra-rater reliability (intra-class correlation coefficients,two-way mixed effects model for absolute agreement for all analyses) for manual striatalsegmentation (20 measurements) was 0.95 for caudate volumes, 0.93 for putamen and inter-rater reliability was 0.89. Intra-rater reliability (20 measurements) for the P/M ratio was 0.94on and inter-rater reliability was 0.998.
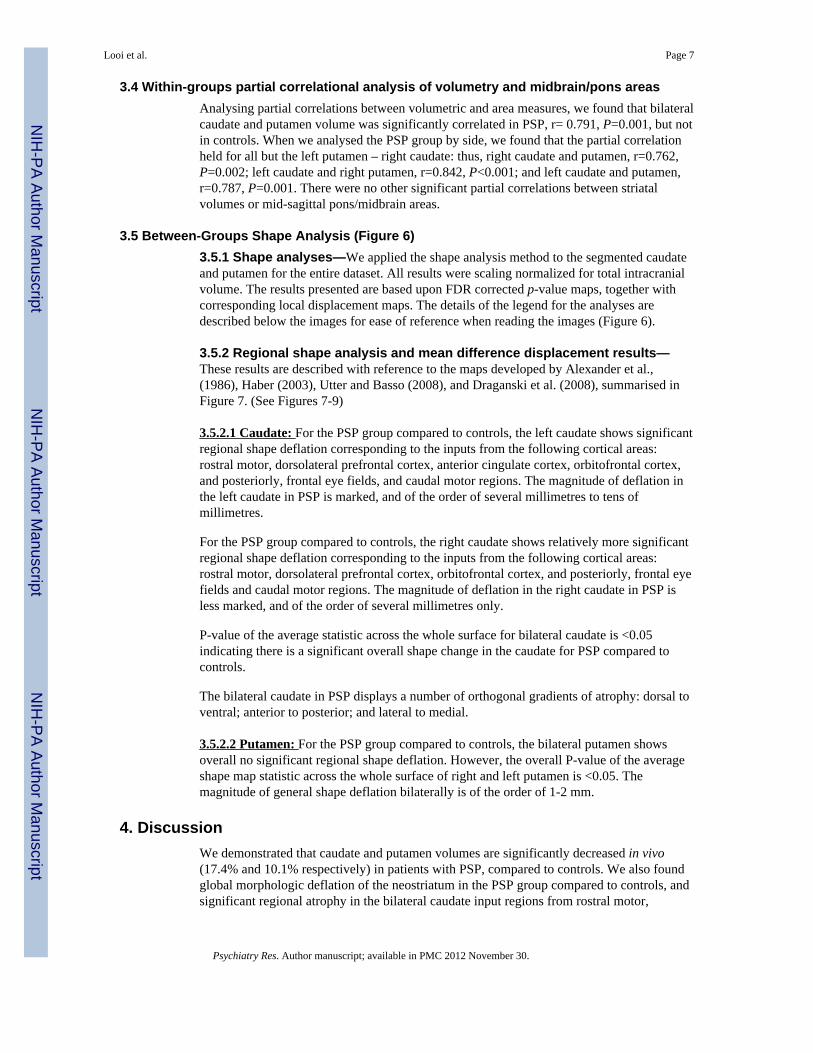
3.2 Tests of Between-Groups Effects in Striatal Structures (Table 3, Figure 3)The mean volume of the bilateral caudate nuclei (right plus left) was 17.4% smaller in thePSP group compared to controls – 5207 mm3 versus 6305 mm3 (F=4.368, P=0.013). Themean volume of the bilateral putamen was 10.1% smaller in the PSP group compared to thecontrol group – 4735 mm3 versus 5267 mm3 (F=3.695, df=3, P=0.024). A scatter-plot ofbilateral caudate and putamen volume by group (Figure 3) shows that two-thirds (10 of 15)of PSP patients have bilateral caudate volume below 6000 mm3, and bilateral putamenvolume below 5500 mm3.
A ROC analysis (Figure 4) was conducted to determine group membership based onbilateral caudate and bilateral putamen volume, showing that bilateral caudate volume ofless than 5525 mm3 predicted PSP membership versus control with a sensitivity of 0.933and specificity 0.667, with area under the curve 0.796 +/- 0.084, asymptotic significance0.006. The bilateral putamen volume was not significant in predicting PSP membershipversus control. (See Appendix B for details of ROC analysis).
3.3 Between-Groups Analysis of P/M Values (Table 3, Figure 5)The raw midbrain and pontine mid-sagittal areas for PSP and controls are displayed in Table2 and as a scatter plot in Figure 4. Midbrain area was significantly smaller in PSP comparedto the control subjects (F=16.205, df=3, P<0.0001), representing a 35% reduction in area.Pontine mid-sagittal area was not significantly different between PSP and controls. Thescatter plot shows that for all but one control, there is a clear demarcation in midbrain area(less than 120 mm2) in PSP.
The ratio of pontine area to midbrain area on mid-sagittal section was significantly higher inthe PSP group. The mean P/M ratio in the PSP group was significantly higher in the PSPgroup compared to the control group (5.77 vs 3.99; P<0.01) (Please see Appendix C fordetails of further analyses for P/M ratio).
Looi et al. Page 6
Psychiatry Res. Author manuscript; available in PMC 2012 November 30.
NIH
-PA Author Manuscript
NIH
-PA Author Manuscript
NIH
-PA Author Manuscript
3.4 Within-groups partial correlational analysis of volumetry and midbrain/pons areasAnalysing partial correlations between volumetric and area measures, we found that bilateralcaudate and putamen volume was significantly correlated in PSP, r= 0.791, P=0.001, but notin controls. When we analysed the PSP group by side, we found that the partial correlationheld for all but the left putamen – right caudate: thus, right caudate and putamen, r=0.762,P=0.002; left caudate and right putamen, r=0.842, P<0.001; and left caudate and putamen,r=0.787, P=0.001. There were no other significant partial correlations between striatalvolumes or mid-sagittal pons/midbrain areas.
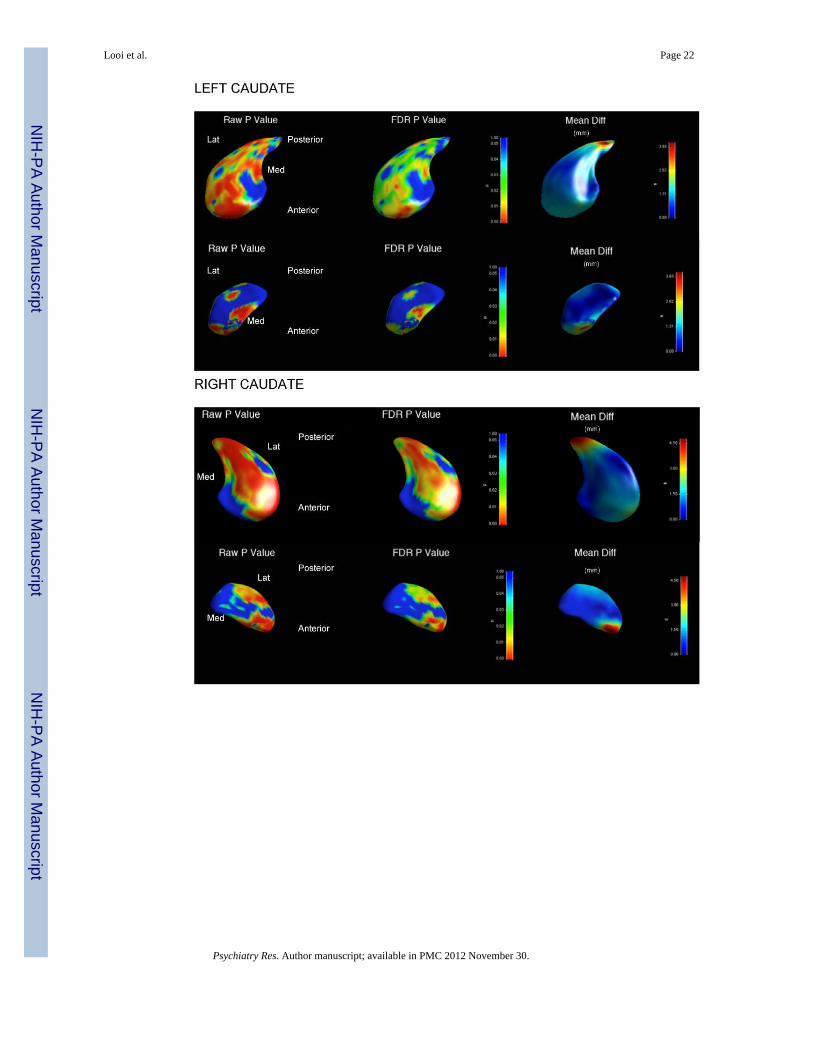
3.5 Between-Groups Shape Analysis (Figure 6)3.5.1 Shape analyses—We applied the shape analysis method to the segmented caudateand putamen for the entire dataset. All results were scaling normalized for total intracranialvolume. The results presented are based upon FDR corrected p-value maps, together withcorresponding local displacement maps. The details of the legend for the analyses aredescribed below the images for ease of reference when reading the images (Figure 6).
3.5.2 Regional shape analysis and mean difference displacement results—These results are described with reference to the maps developed by Alexander et al.,(1986), Haber (2003), Utter and Basso (2008), and Draganski et al. (2008), summarised inFigure 7. (See Figures 7-9)
3.5.2.1 Caudate: For the PSP group compared to controls, the left caudate shows significantregional shape deflation corresponding to the inputs from the following cortical areas:rostral motor, dorsolateral prefrontal cortex, anterior cingulate cortex, orbitofrontal cortex,and posteriorly, frontal eye fields, and caudal motor regions. The magnitude of deflation inthe left caudate in PSP is marked, and of the order of several millimetres to tens ofmillimetres.
For the PSP group compared to controls, the right caudate shows relatively more significantregional shape deflation corresponding to the inputs from the following cortical areas:rostral motor, dorsolateral prefrontal cortex, orbitofrontal cortex, and posteriorly, frontal eyefields and caudal motor regions. The magnitude of deflation in the right caudate in PSP isless marked, and of the order of several millimetres only.
P-value of the average statistic across the whole surface for bilateral caudate is <0.05indicating there is a significant overall shape change in the caudate for PSP compared tocontrols.
The bilateral caudate in PSP displays a number of orthogonal gradients of atrophy: dorsal toventral; anterior to posterior; and lateral to medial.
3.5.2.2 Putamen: For the PSP group compared to controls, the bilateral putamen showsoverall no significant regional shape deflation. However, the overall P-value of the averageshape map statistic across the whole surface of right and left putamen is <0.05. Themagnitude of general shape deflation bilaterally is of the order of 1-2 mm.
4. DiscussionWe demonstrated that caudate and putamen volumes are significantly decreased in vivo(17.4% and 10.1% respectively) in patients with PSP, compared to controls. We also foundglobal morphologic deflation of the neostriatum in the PSP group compared to controls, andsignificant regional atrophy in the bilateral caudate input regions from rostral motor,
Looi et al. Page 7
Psychiatry Res. Author manuscript; available in PMC 2012 November 30.
NIH
-PA Author Manuscript
NIH
-PA Author Manuscript
NIH
-PA Author Manuscript
dorsolateral prefrontal cortex, anterior cingulate cortex, orbitofrontal cortex, frontal eyefields, and caudal motor regions. In addition, we quantified mesencephalic atrophy via mid-sagittal midbrain area, and the pontine-to-midbrain ratio in PSP, confirming the clinicaldiagnosis with an in vivo biomarker (Oba et al., 2005; Quattrone et al., 2008). Thecombination of quantified altered morphology of the neostriatum and mesencephalon in PSPindicates a strong neuroanatomical subcortical basis for the clinical features of PSP.
4.1 Mesencephalic morphometryMidbrain atrophy in PSP has been quantified on structural MRI via different analysismethods. Using automated volumetry, one group demonstrated that midbrain atrophy wassignificant in PSP compared to controls (Gröschel et al., 2004). A voxel-basedmorphometric (VBM) study demonstrated that reduction in midbrain and pontine grey/whitematter density was present in PSP compared to controls (Boxer et al., 2006), whilst anotherfound reduced density in only thalamus and the colliculi, of the subcortical structures(Padovani et al., 2006).
Our study replicates the finding of Oba et al. (2005) and Quattrone et al. (2008) regardingthe validity of the penguin/colibri sign, and confirms that mesencephalic atrophy can besignificantly quantified in PSP compared to controls. The average midbrain mid-sagittal areain PSP was reduced by 35.5% compared to the area in controls. In our sample, the sensitivityof 86.7% and specificity of 93.3% for a cutoff of P/M 4.63 were similar to previous studies.This indicates that, in addition to satisfying established clinical criteria for PSP, subjects alsohad similar measurements to previous cohorts on an established biomarker for the disease.Other exploratory tests, looking for associations between mesencephalic area and striatalvolumes, showed no significant correlation between the two sets of data. Mesencephalicatrophy may involve the substantia nigra, causing deafferentation and thus, dendriticdegeneration of neostriatal medium spiny neurons, as has been demonstrated in Parkinson'sdisease (Zaja-Milatovic et al., 2005). Therefore, mesencephalic atrophy may result in alteredneostriatal morphology.
4.2 Neostriatal morphometryIn previous in vivo neuroimaging, there have been studies suggesting altered neostriatalmorphology in PSP. A previous structural MRI study with PSP (n=6) showed significantcaudate and putaminal atrophy (Schulz et al., 1999). A study using manual segmentation ofMRI in PSP (n=21) found a non-significant reduction of 15% in caudate volume, normalizedto ICV, compared to controls, additionally controlling for whole brain volume (Cordato etal., 2002). A VBM study in 13 persons with PSP showed reduced grey matter density ofcaudate and midbrain (Josephs et al., 2008). A further VBM study demonstrated reduction ingrey matter density in the caudate in 20 persons with PSP (Agosta et al., 2010); whilstmagnetization transfer imaging showed a significant magnetization transfer ratio differencein the caudate and putamen in PSP versus controls, indicating neuronal structural changes inthe disease (Eckert et al., 2004). Thus, our results are significant in quantifying themorphology of in vivo atrophy in both caudate and putamen, and concurring with previousimaging findings.
The neostriatal atrophy we observed is consistent with neuropathologic findings that thetauopathy of PSP shows a predilection for the neostriatum (Daniel et al., 1995; Williams andLees, 2009). Previous quantitative post-mortem neuropathologic studies of PSP have foundputaminal atrophy (Oyanagi et al., 1994), whilst others have found similar degrees ofcaudate (10-15%) and putaminal atrophy (5-12%) to that which we found in vivo (Mann etal., 1993). Diffusion-weighted imaging in the putamen of patients with PSP (Seppi et al.,
Looi et al. Page 8
Psychiatry Res. Author manuscript; available in PMC 2012 November 30.
NIH
-PA Author Manuscript
NIH
-PA Author Manuscript
NIH
-PA Author Manuscript
2003) has shown diffusion changes manifesting as an increased apparent diffusioncoefficient (ADC), indicating loss of structural integrity of the putamen.
A number of studies have demonstrated neurophysiologic abnormalities in the neostriatumin PSP, and advanced hypotheses as to underlying pathology. The neurodegenerativechanges in the striatum may result in a net loss of GABAergic neurons within the basalganglia (Levy et al., 1995). There is a pronounced decrease in dopaminergic nerve terminalsin the caudate and putamen of patients with PSP (Filippi et al., 2006), which may arise fromloss of inputs from substantia nigra (Warren et al., 2007) and ventral tegmentum in themidbrain. Accordingly, the primary disease process in PSP may involve trans-synapticdegeneration from upstream or downstream brain regions within the neural network (vanBuren, 1963), and thus be reflected in altered morphology of the highly interconnectedneostriatum.
Interestingly, our partial correlation results suggest that the PSP disease process affects bothcaudate and putamen in parallel. From the ROC and shape analysis, the caudate is moreclearly atrophic in PSP than the putamen. As the two structures are interconnected, atrophyin one may be correlated with the other.
The caudate and putamen are contiguous structures with differing functional specializations,such that the caudate is linked to frontal cortex serving executive, social and motivationalcognition as well as frontal eye fields; whilst the putamen is linked to parietal cortex servingmotor functions (Alexander et al., 1986; Haber, 2003; Draganski et al., 2008). Thus, atrophyof the neostriatum may serve as a structural basis for the dysexecutive syndrome, apathy,oculomotor dysfunction, obsessive-compulsive phenomena, and motor dysfunction observedclinically in PSP (Bak et al., 2010), through disruption of fronto-striato-pallido-thalamic orfrontostriatal circuits, as has been previously observed in the neuroanatomically relateddisorders of frontotemporal lobar degeneration, Huntington's Disease andchoreoacanthocytosis (Looi et al., 2010; Looi et al., 2011; Douaud et al., 2006; Walterfanget al., 2011).
Our morphometric results indicate possible structure-function relationships for the clinicalmanifestations of PSP. However, we acknowledge that clinical motor, emotional, behaviormeasurements, for correlation with the shape of the caudate and putamen, are needed tofully establish corticostriatal structure-function relationships.
4.2.1 Caudate morphometry—Our shape analysis (Figure 6) demonstrated significantregionally specific atrophy of the caudate in PSP that implicates loss of inputs/interconnections from frontal and parietal cortex, and by extension, mesencephalon. Thepatterns of regional shape deflation differ by hemisphere (see Figures 6-9). The left caudateshows more discrete, but nonetheless large magnitude shape deflations across the regionsreceiving inputs from: frontal cortex - dorsolateral prefrontal cortex, anterior cingulatecortex, orbitofrontal cortex; parietal cortex – rostral and caudal motor regions; frontal eyefields; and, possibly, via the ventral surface of the caudate/nucleus accumbens, ventraltegmentum and substantia nigra. In contrast, the right caudate shows almost global atrophyof smaller magnitude, traversing regions corresponding to nearly all the interconnections ofthe caudate.
We found the following orthogonal atrophy gradients in the caudate: dorsal to ventral;anterior to posterior; and lateral to medial. Some of these gradients may arise from specificloss of inputs, such as the anterior to posterior pattern, may specifically impact on thenucleus accumbens neurogenic centre (Heimer and van Hoesen, 2006), and have beenobserved in other neurodegenerative diseases (Douad et al., 2006; Looi et al., 2010; Looi et
Looi et al. Page 9
Psychiatry Res. Author manuscript; available in PMC 2012 November 30.
NIH
-PA Author Manuscript
NIH
-PA Author Manuscript
NIH
-PA Author Manuscript
al., 2011; Madsen et al., 2010; Walterfang et al., 2011). There is neuropathological evidenceof selective dendritic degeneration in the medium spiny neurons (MSN) of the head of thecaudate in dementia with Lewy Bodies (DLB) (Zaja-Milatovic et al., 2006) and evidencethat neurogenesis occurs in the lateral but not rostral portions of the subventricular zone inanimal models of Huntington's disease (Mazurová et al., 2006). The lateral-medial gradientof atrophy we observed in PSP may thus represent an impaired neurogenesis response todisease (Looi et al., 2010) in the subventricular zone (Curtis et al., 2007).
Caudate tauopathy in PSP may specifically damage the MSN, interneurons of circuitstraversing the neostriatum, via dendritic degeneration similar to that seen in DLB (Zaja-Milatovic et al., 2006). The downstream effect of the deafferentation and dendriticdegeneration in the MSN of the caudate may be reduced direct output to globus pallidusinterna/substantia nigra pars compacta; resulting in reduced switching off of inhibitorypathways (Bolam et al., 2000) and thus, impersistence of cognitive functions, emotions,movements and behaviours carried by the corticostriatal circuits. Similarly, reduced indirectoutput to globus pallidus externa will impair feed-forward inhibitory pathways (Bolam et al.,2000). Therefore, the net result may be derailment of frontostriatal circuit mediatedfunctions, such as the dysexecutive syndrome and apathy, combined with some loss ofinhibition resulting in aberrant autonomous behaviour such as stereotypies and obsessive-compulsive phenomena, all of which may be observed in PSP (Bak et al., 2010). There arealso possible direct effects of caudate atrophy on oculomotor function (Utter & Basso, 2008)due to loss of interconnections to the frontal eye field (Looi et al., 2010).
4.2.2 Putamen morphometry—Although we found a significant reduction in bilateralputamen volume and found that overall right and left putamen shape was significantlydifferent for persons with PSP compared to controls, the shape analysis revealed noregionally specific changes in putamen shape. The failure to show significant regional shapedifferences in the putamen may be an artefact of sample size, as the raw analyses showedsome regional differences. The P-value of the average statistic across the surface was < 0.05,indicating that there was a significant overall shape deflation in PSP, which while notsignificant at any individual point, was 1-2 mm across the entire surface. Morphologicalchange in PSP may have been more generalized and less regionally-specific in the putamen.Our previous shape analysis of the putamen in frontotemporal lobar degeneration (Looi etal., 2010) and choreoacanthocytosis (Walterfang et al., 2011) had larger numbers of controlcomparators, and thus may have had more power to resolve the perhaps lesser degree ofalteration of morphology in the putamen. There is a significant reduction in volume andshape of the bilateral putamen with implications for the cortico-striatal circuits that traversethe putamen, including the frontostriatal circuits and links to premotor, motor cortex,somatosensory cortex, supplementary motor areas and frontal eye fields (Alexander et al.,1986; Utter and Basso, 2008). Accordingly, the altered general morphology of the putamen,combined with that of the caudate and mesencephalon may contribute to the structural basisof the bradykinesia, gait disturbance, oculomotor dysfunction and rigidity observed in PSP.Indeed, a recent VBM study has shown that putaminal atrophy has been correlated withapathy as assessed using neuropsychiatric measures (Josephs et al., 2011)
4.3 LimitationsDefinitive diagnosis of PSP requires autopsy. The positive predictive value of diagnosis viaestablished clinical criteria varies between 78-91% in autopsy-confirmed series (Osaki et al.,2004). We therefore applied clinical criteria, together with clinical investigations and long-term follow-up to improve the accuracy of diagnosis. Our sample size, is small, althoughmoderately sized in relation to previous volumetric neuroimaging studies in PSP. When weperformed an exploratory MANCOVA of the striatal volumes by side, we found that
Looi et al. Page 10
Psychiatry Res. Author manuscript; available in PMC 2012 November 30.
NIH
-PA Author Manuscript
NIH
-PA Author Manuscript
NIH
-PA Author Manuscript
unequal error variance precluded full analysis, and thus we opted for a MANCOVA ofbilateral (combined right and left) striatal volume, deferring to the shape analysis to examinelateralized effects. Potentially there is heterogeneity in the degree of atrophy seen in the PSPgroup attributable to different symptom profiles and disease severity.
We used validated and reliable protocol for manual tracing, as opposed to automatedsegmentation. We acknowledge that tracing the images in the axial plane, albeit withreference to orthogonal views, may minimize differences in volume in this plane, and thusminimize differences between the groups overall. We used intracranial volume as acovariate (accepting that this is a proxy value for head size rather than brain volume) in theMANCOVA, and as a scaling factor in the shape analysis, allowing us to apply a consistentstandard for normalization of the striatal volumes, as has been undertaken in similar volume/shape analysis papers (Looi et al., 2009; Looi et al., 2010; Looi et al., 2011; Walterfang etal., 2011).
We did not directly compare volumetrics and area measurements with previousneuroimaging studies as variations in diagnostic criteria, methodology and demographicsmay contribute significantly to differences among studies. The failure to show significantregional shape differences in the putamen may be an artefact of sample size, and smallergroup size can be a limitation when an excess of controls (twice or more the number ofdisease subjects) is not available. Generally, larger samples are required for a shape analysisthan a volumetric analysis as the local effects are commonly smaller than the cumulativeeffect size across the whole structure. The ability to detect local differences depends on theeffect size and sample size. Given that the caudate differences in volume were clearly largerthan in putamen, it could be that the study was underpowered for showing differences inputamen, whilst it was well powered for showing differences in caudate shape. Indeed, wehave occasionally found that some similarly sized comparisons have not survived the false-discovery rate correction in prior studies (Looi et al., 2011).
We are unaware of any accepted tracing protocols for volumetry of mesencephalicstructures, which limited our investigation of this area to the mid-sagittal area measurementonly – analyses of relationships between the mesencephalon and neostriatum may have beenmore fruitful if volumetry and shape analysis were feasible for the midbrain and pons.
4.4 ConclusionIn conclusion, we have found that significant neostriatal and mesencephalic atrophy isevident in mild-moderate PSP, in contrast to healthy age-matched controls. Viamorphometric analysis, this atrophy has been demonstrated to map to regionalinterconnections from cortex and mesencephalon. The resultant disruption in frontostriataland mesocortical circuits potentially provides a structural basis for the neuropsychiatricmanifestations of PSP, such as the dysexecutive syndrome, gaze palsy, obsessive-compulsive phenomena and utilization behavior. Similarly, the structural basis of themovement disorders of PSP, bradykinesia, gait disturbance and rigidity, potentially arises, atleast in part, from altered morphology of the neostriatum and mesencephalon. Futureprospective studies with larger cohorts, of potential neural networks affected in PSP, shouldfocus on connections between the ventral tegmentum, the striatum and the frontal cortex, aswell as correlations with clinical features such as cognitive, motor and behavioralmeasurements. Such studies may further demonstrate structural-functional correlations ofstriatal shape and clinical features.
We have descried multum in parvo, via the neostriatum and the mesencephalon, a miniaturechart of neuronal atrophy in progressive supranuclear palsy.
Looi et al. Page 11
Psychiatry Res. Author manuscript; available in PMC 2012 November 30.
NIH
-PA Author Manuscript
NIH
-PA Author Manuscript
NIH
-PA Author Manuscript
Supplementary MaterialRefer to Web version on PubMed Central for supplementary material.
AcknowledgmentsJ.C.L. Looi self-funded travel expenses to develop this study with collaborators at Lund University and SkåneUniversity Hospital, Lund, Sweden, with support from Lund University for accommodation expenses. M. Styneracknowledges the National Alliance for Medical Image Computing (NA-MIC) NIH U54 EB005149. This studywas funded through grants from the Swedish Parkinson Fund and the Swedish Science Council (through the BasalGanglia Disease Linnæus Consortium).
ReferencesAlexander GE, Delong MR, Strick PL. Parallel organisation of functionally segregated circuits linking
basal ganglia and cortex. Annual Review of Neuroscience. 1986; 9:357–381.Agosta F, Kostic VS, Galantucci S, Mesaros S, Svetel M, Pagani E, Stefanova E, Filippi M. The in
vivo distribution of brain tissue loss in richardson's syndrome and PSP-parkinsonism: a VBM-DARTEL study. European Journal of Neuroscience. 2010; 32:640–647. [PubMed: 20597976]
Bak TH, Crawford LM, Berrios G, Hodges JR. Behavioural symptoms in progressive supranuclearpalsy and frontotemporal dementia. Journal of Neurology Neurosurgery and Psychiatry. 2010;81:1057–1059.
Bookstein FL. Shape and the information in medical images: a decade of the morphometric synthesis.Computer Vision and Image Understanding. 1997; 66:97–118.
Bolam JP, Hanley JJ, Booth PAC, Bevan MD. Synaptic organisation of the basal ganglia. Journal ofNeuroanatomy. 2000; 196:527–542.
Boxer AL, Geschwind MD, Belfor N, Gorno-Tempini ML, Scahuer GF, Miller BL, Weiner MW,Rosen HJ. Patterns of brain atrophy that differentiate corticobasal degeneration syndrome fromprogressive supranuclear palsy. Archives of Neurology. 2006; 63:81–86. [PubMed: 16401739]
Brechbuhler C, Gerig G, Kubler O. Parametrization of closed surfaces for 3-D shape description.Computer Vision, Graphics, Image Processing. 1995; 61:154–170.
Cordato NJ, Pantelis C, Halliday GM, Velakoulis D, Wood SJ, Stuart GW, Curries J, Soo M, OlivieriG, Broe GA, Morris JGL. Frontal atrophy correlates with behavioural changes in progressivesupranuclear palsy. Brain. 2002; 125:789–800. [PubMed: 11912112]
Cummings JL. Frontal subcortical circuits and human behaviour. Archives of Neurology. 1993; 5:873–880. [PubMed: 8352676]
Curtis MA, Faull RLM, Eriksson PS. The effect of neurodegenerative diseases on the subventricularzone. Nature Reviews Neuroscience. 2007; 8:712–723.
Daniel SE, de Bruin VMS, Lees AJ. The clinical and pathological spectrum of Steele-Richardson-Olszewski syndrome: progressive supranuclear palsy: a reappraisal. Brain. 1995; 118:759–770.[PubMed: 7600092]
Draganski B, Kherif F, Kloppel S, Cook PA, Alexander DC, Parker GJM, Deichmann R, Ashburner J,Frackowiak RSJ. Evidence for segregated and integrative connectivity patterns in the human basalganglia. Journal of Neuroscience. 2008; 28:7143–7152. [PubMed: 18614684]
Douaud G, Gaura V, Ribeiro MJ, Lethimonnier F, Maroy R, Verny C, Krystkowiak P, Damier P,Bachoud-Levi AC, Hantraye P, Remy P. Distribution of grey matter atrophy in Huntington'sdisease: a combined ROI and voxel-based morphometric study. NeuroImage. 2006; 32:1562–1575. [PubMed: 16875847]
Eckert T, Sailer M, Kaufmann J, Schrader C, Peschel T, Bodammer N, Heinze HJ, Schoenfeld MA.Differentiation of idiopathic Parkinson's disease, multiple system atrophy, progressivesupranuclear palsy and healthy controls using magnetisation transfer imaging. Neuroimage. 2004;21:221–235.
ENIGMA, 2011. Genome-wide association meta-analysis of hippocampal volume: results from theENIGMA consortium. Organization for Human Brain Mapping Meeting; June 2011; Quebec City,Canada. http://enigma.loni.ucla.edu/wpcontent/uploads/2011/01/EnigmaOHBMAbstract.pdf
Looi et al. Page 12
Psychiatry Res. Author manuscript; available in PMC 2012 November 30.
NIH
-PA Author Manuscript
NIH
-PA Author Manuscript
NIH
-PA Author Manuscript
Fields HL, Hjelmstad GO, Margolis EB, Nicola SM. Ventral tegmental area neurons in learnedappetitive behaviour and positive reinforcement. Annual Review of Neuroscience. 2007; 30:289–316.
Filippi L, Manni C, Pierantozzi M, Brusa L, Danieli R, Stanzione P, Schillaci O. 123I-FP-CIT inprogressive supranuclear palsy in Parkinson's disease: a SPECT semiquantitative study. NuclearMedicine Communications. 2006; 27:381–386. [PubMed: 16531926]
Genovese CR, Lazar NA, Nichols T. Thresholding of statistical maps in functional neuroimaging usingthe false discovery rate. NeuroImage. 2002; 15:870–878. [PubMed: 11906227]
Gröschel K, Hauser TK, Luft A, Patronas N, Dichgans J, Litvan IB, Schulz JB. Magnetic resonanceimaging-based volumetry differentiates progressive supranuclear palsy from corticobasaldegeneration. NeuroImage. 2004; 21:701–704. [PubMed: 14980572]
Haber SN. The primate basal ganglia: parallel and integrative networks. Journal of ChemicalNeuroanatomy. 2003; 26:317–330. [PubMed: 14729134]
Heimer L, Van Hoesen GW. The limbic lobe and its output channels: implications for emotionalfunction and adaptive behaviour. Neuroscience and Biobehavioral Reviews. 2006; 30:126–147.[PubMed: 16183121]
Ikemoto S. Dopamine reward circuitry: two projection systems from the ventral midbrain to thenucleus accumbens-olfactory tubercle complex. Brain Research Reviews. 2007; 56:27–78.[PubMed: 17574681]
Josephs KA, Whitwell JL, Dickson DW, Boeve BF, Knopman DS, Petersen RC, Parisi JE, Jack CR Jr.Voxel based morphometryin autopsy proven PSP and CBD. Neurobiology of Aging. 2008;29:280–289. [PubMed: 17097770]
Josephs KA, Whitwell JL, Eggers SD, Senjem ML, Jack CR Jr. Gray matter correlates of behavioralseverity in progressive supranuclear palsy. Movement Disorders. 201110.1002/mds.23471
Kvickström P, Eriksson B, van Westen D, Lätt J, Elfgren C, Nilsson C. Selective forntalneurodegeneration of the inferior fronto-occiptal fasciculus in progressive supranuclear palsy(PSP) demonstrated by diffusion tensor tractography. BMC Neurology. 2011; 11:13. [PubMed:21269463]
Levitt JJ, Styner M, Niethammer M, Bouix S, Koo MS, Voglmaier MM, Dickey CC, NiznikiewiczMA, Kikinis R, McCarley RW, Shenton ME. Shape abnormalities of caudate nucleus inschizotypal personality disorder. Schizophrenia Research. 2009; 100:127–139. [PubMed:19328654]
Levy R, Ruberg M, Herrero MT, Villares J, Havoy-Agid F, Agid Y, Hirsch EC. Alterations inGABAergic neurons in the basal ganglia of patients with progressive supranuclear palsy: An in-situ hybridization study of GAD67 messenger RNA. Neurology. 1995; 45:127–34. [PubMed:7824102]
Litvan I, Bhatia KP, Burn DJ, Goetz CG, Lang AE, McKeith I, Quinn N, Sethi KD, Shukts C,Wenning GK. Movement Disorder Society Scientific Issues Report: SIC Task Force Appraisal ofClinical Diagnostic Criteria for Parkinsonian Disorders. Movement Disorders. 2003; 18:467–486.[PubMed: 12722160]
Looi JCL, Lindberg O, Liberg B, Tatham V, Kumar R, Maller J, Millard E, Sachdev P, Högberg G,Pagani M, Botes L, Engman EL, Zhang Y, Svensson L, Wahlund LO. Volumetrics of the caudatenucleus: Reliability and validity of a new manual tracing protocol. Psychiatry Research:Neuroimaging. 2008; 163:279–288.
Looi JCL, Svensson L, Lindberg O, Zandbelt BB, Östberg P, Örndahl E, Wahlund LO. Putaminalvolume in frontotemporal lobar degeneration and Alzheimer's Disease – differential volumes insubtypes of FTLD, AD, and controls. AJNR American Journal of Neuroradiology. 2009; 30:1552–1560. [PubMed: 19497964]
Looi JCL, Walterfang M, Styner M, Svensson L, Lindberg O, Östberg P, Botes L, Örndahl E, Chua P,Kumar R, Velakoulis D, Wahlund LO. Shape analysis of the neostriatum in frontotemporal lobardegeneration, Alzheimer's disease and controls. NeuroImage. 2010; 51:970–986. [PubMed:20156566]
Looi JCL, Walterfang M, Styner M, Niethammer M, Svensson L, Lindberg O, Östberg P, Botes L,Örndahl E, Chua P, Velakoulis D, Wahlund LO. Shape analysis of the neostriatum in subtypes of
Looi et al. Page 13
Psychiatry Res. Author manuscript; available in PMC 2012 November 30.
NIH
-PA Author Manuscript
NIH
-PA Author Manuscript
NIH
-PA Author Manuscript
frontotemporal lobar degeneration: neuroanatomically significant regional morphologic change.Psychiatry Research Neuroimaging. 2011; 191:98–111.
Madsen SK, Ho AJ, Hua X, Saharan PS, Toga AW, Jack CR Jr, Weiner MW, Thompson PM, ADNI.3D maps localize caudate nucleus atrophy in 400 Alzheimer's disease, mild cognitive impairmentand healthy elderly subjects. Neurobiology of Aging. 2010; 31:1312–1325. [PubMed: 20538376]
Mann DM, Oliver R, Snowden JS. The topographic distribution of brain atrophy in Huntington'sdisease and progressive supranuclear palsy. Acta Neuropathologica. 1993; 85:553–559. [PubMed:8493863]
Mazurová Y, Rudolf E, Látr I, Österreicher J. Proliferation and differentiation of endogenous neuralstem cells in response to neurodegenerative response within the striatum. NeurodegenerativeDisease. 2006; 3:12–18.
Oba H, Yagishita A, Terada H, Barkovich AJ, Kutomi K, Yamauchi T, Furui S, Shimizu T, UchigataM, Matsumura K, Sonoo M, Sakai M, Takada K, Harasawa A, Takeshita K, Kohtakem H, TanakaH, Suzuki S. New and reliable MRI diagnosis for progressive supranuclear palsy. Neurology.2005; 64:2050–2055. [PubMed: 15985570]
Osaki Y, Ben-Schlomo Y, Lees AJ, Daniel SE, Colosimo C, Wenning GK, Quinn N. Accuracy ofclinical diagnosis of progressive supranuclear palsy. Movement Disorders. 2004; 19:181–189.[PubMed: 14978673]
Oyanagi K, Makifuchi T, Ohtoh T, Ikuta F, Chen KM, Chase TN, Gajdusek DC. Topographicinvestigation of brain atrophy in Parkinsonism-dementia complex of Guam: a comparison withAlzheimer's disease and progressive supranuclear palsy. Neurodegeneration. 1994; 3:301–304.[PubMed: 7842300]
Padovani A, Borroni B, Brambati SM, Agosti C, Broli M, Alonso R, Scifo P, Belleli D, Alberici A,Gasparotti R, Perani D. Diffusion tensor imaging and voxel-based morphometry in earlyprogressive supranuclear palsy. Journal of Neurology, Neurosurgery and Psychiatry. 2006;77:457–463.
Quattrone A, Nicoletti G, Messina D, Fera F, Condino F, Pugliese F, Lanza P, Barrone P, Morgatnte L,Zappio M, Aguglia U, Gallo O. MR imaging index for differentiation of progressive supranuclearpalsy from Parkinson disease and the Parkinson variant of multiple system atrophy. Radiology.2008; 246:214–21. [PubMed: 17991785]
Schrag A, Good CD, Miszkiel K, Morris HR, Mathias MD, Lees AJ, Quinn ND. Differentiation ofatypical parkinsonian syndromes with routine MRI. Neurology. 2000; 54:697–702. [PubMed:10680806]
Schulz JB, Skalej M, Wedekind D, Luft AR, Abele M, Voigt K, Dichgans J, Klockgether T. Magneticresonance imaging–based volumetry differentiates idiopathic Parkinson's syndrome from multiplesystem atrophy and progressive supranuclear palsy. Annals of Neurology. 1999; 45:65–74.[PubMed: 9894879]
Schwab, RS.; England, AC. Projection technique for evaluating surgery in Parkinson's disease. In:Gillingham, FJ.; Donaldson, IML., editors. Third symposium on Parkinson's disease. E & SLivingstone; Edinburgh, UK: 1969.
Seppi K, Schocke MF, Esterhammer R, Kremser C, Brenneis C, Mueller J, Boesch S, Jaschke W,Poewe W, Wenning GK. Diffusion-weighted imaging discriminates progressive supranuclearpalsy from PD, but not from the parkinson variant of multiple system atrophy. Neurology. 2003;60:922–927. [PubMed: 12654954]
Sesack SR, Grace AA. Cortico-basal ganglia reward network: microcircuitry.Neuropsychopharmacology Reviews. 2010; 35:27–47. [PubMed: 19675534]
Steele JC, Richardson JC, Olszewski J. Progressive supranuclear palsy. A heterogeneous degenerationinvolving the brain stem, basal ganglia and cerebellum with vertical supranuclear gaze andpseudobulbar palsy, nuchal dystonia and dementia. Archives of Neurology. 1964; 10:333–59.[PubMed: 14107684]
Styner M, Oguz I, Xu S, Brechbuhler C, Pantazis D, Levitt JJ, Shenton ME, Gerig G. Framework forthe statistical shape analysis of brain structures using SPHARM-PDM. Insight Journal. 2006:1–21.
Looi et al. Page 14
Psychiatry Res. Author manuscript; available in PMC 2012 November 30.
NIH
-PA Author Manuscript
NIH
-PA Author Manuscript
NIH
-PA Author Manuscript
Styner, M.; Oguz, I.; Xu, S.; Pantazis, D.; Gerig, G. Proc SPIE 6512, Medical Imaging 2007. 2007.Statistical group differences in anatomical shape analysis using the Hotelling T2 metric; p.65123p. z1-z11.
Thompson, DW. On growth and form: a new edition. Cambridge University Press; New York, NY,USA: 1945.
Utter AA, Basso MA. The basal ganglia: an overview of circuits and function. Neurosci BiobehavRev. 2008; 32:333–342. [PubMed: 17202023]
van Buren JM. Trans-synaptic retrograde degeneration in the visual system of primates. Journal ofNeurology, Neurosurgery and Psychiatry. 1963; 26:402–409.
Walterfang M, Looi JCL, Styner M, Danek A, Niethammer M, Walker R, Evans A, Koschet K,Rodrigues G, Hughes A, Velakoulis D. Shape alterations in the striatum in choreoacanthocytosisPsychiatry Research: Neuroimaging. 2011; 192:29–36.
Warren NM, Piggott MA, Greally E, Lake M, Lees AJ, Burn DJ. Basal ganglia cholinergic anddopaminergic function in progressive supranuclear palsy. Movement Disorders. 2007; 22:1594–1600. [PubMed: 17534953]
Williams DR, Lees AJ. Progressive supranuclear palsy: clinicopathological concepts and diagnosticchallenges. Lancet Neurology. 2009; 8:270–79. [PubMed: 19233037]
Zaja-Milatovic S, Milatovic D, Schantz AM, Zhang J, Montine KS, Samii A, Deutch AY, Montine TJ.Dendritic degeneration in neostriatal medium spiny neurons in Parkinson disease. Neurology.2005; 64:545–547. [PubMed: 15699393]
Zaja-Milatovic S, Keene CD, Montine KS, Leverenz JB, Tsuang D, Montine TJ. Selective dendriticdegeneration of medium spiny neurons in dementia with Lewy bodies. Neurology. 2006; 66:1591–1593. [PubMed: 16717229]
Looi et al. Page 15
Psychiatry Res. Author manuscript; available in PMC 2012 November 30.
NIH
-PA Author Manuscript
NIH
-PA Author Manuscript
NIH
-PA Author Manuscript
Looi et al. Page 16
Psychiatry Res. Author manuscript; available in PMC 2012 November 30.
NIH
-PA Author Manuscript
NIH
-PA Author Manuscript
NIH
-PA Author Manuscript

Figure 1. Mid-Sagittal view showing the penguin or Colibri silhouette of the midbrain and ponsSuperior red line = from superior pontine notch to inferior edge of quadrigeminal plate.Inferior red line = parallel to superior line, passing through inferior pontine notch. Both linesare partially obscured by object tracing in this image. Green area (“2”) = midbrain tracing,Yellow area (“3”) = pons tracing.Note the “penguin” or Colibri silhouette of the midbrain and pons, characterized by theatrophic midbrain region, which appears as a “beak”.Red, green and yellow areas represent the same technique as Fig 1 a).Note the more rotund “beak” comprising the midbrain, producing a broader “kookaburra”silhouette of the midbrain and pons.
Looi et al. Page 17
Psychiatry Res. Author manuscript; available in PMC 2012 November 30.
NIH
-PA Author Manuscript
NIH
-PA Author Manuscript
NIH
-PA Author Manuscript
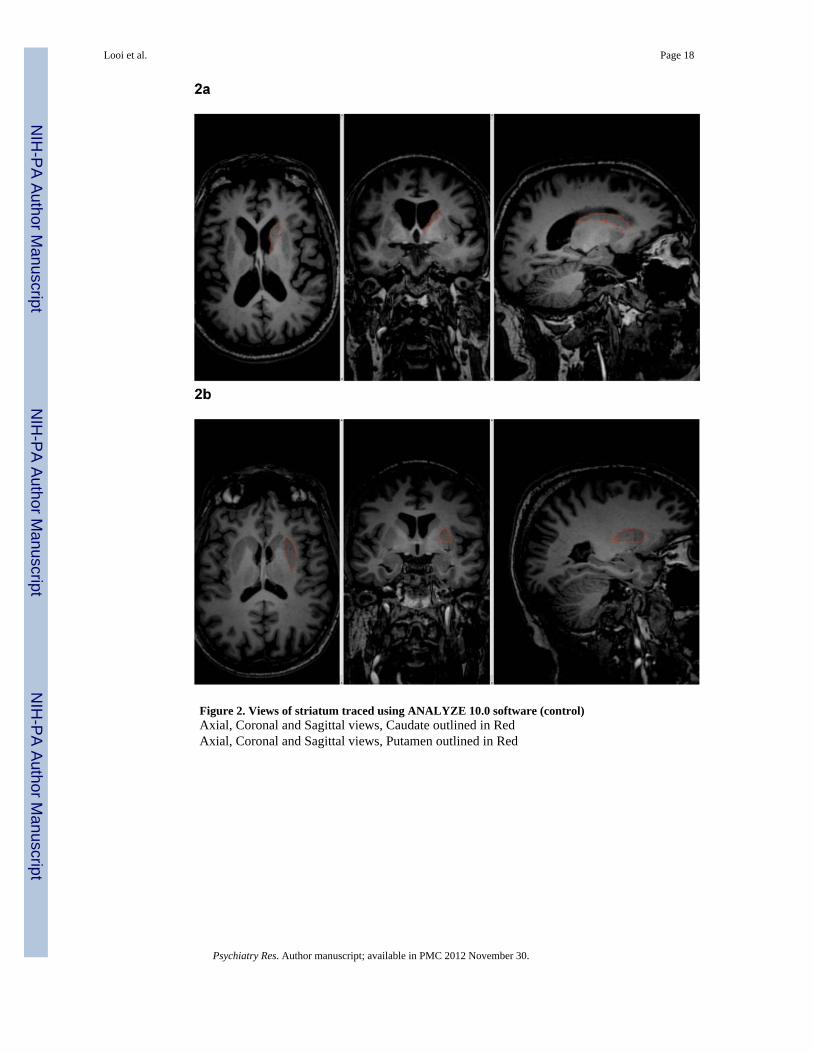
Figure 2. Views of striatum traced using ANALYZE 10.0 software (control)Axial, Coronal and Sagittal views, Caudate outlined in RedAxial, Coronal and Sagittal views, Putamen outlined in Red
Looi et al. Page 18
Psychiatry Res. Author manuscript; available in PMC 2012 November 30.
NIH
-PA Author Manuscript
NIH
-PA Author Manuscript
NIH
-PA Author Manuscript
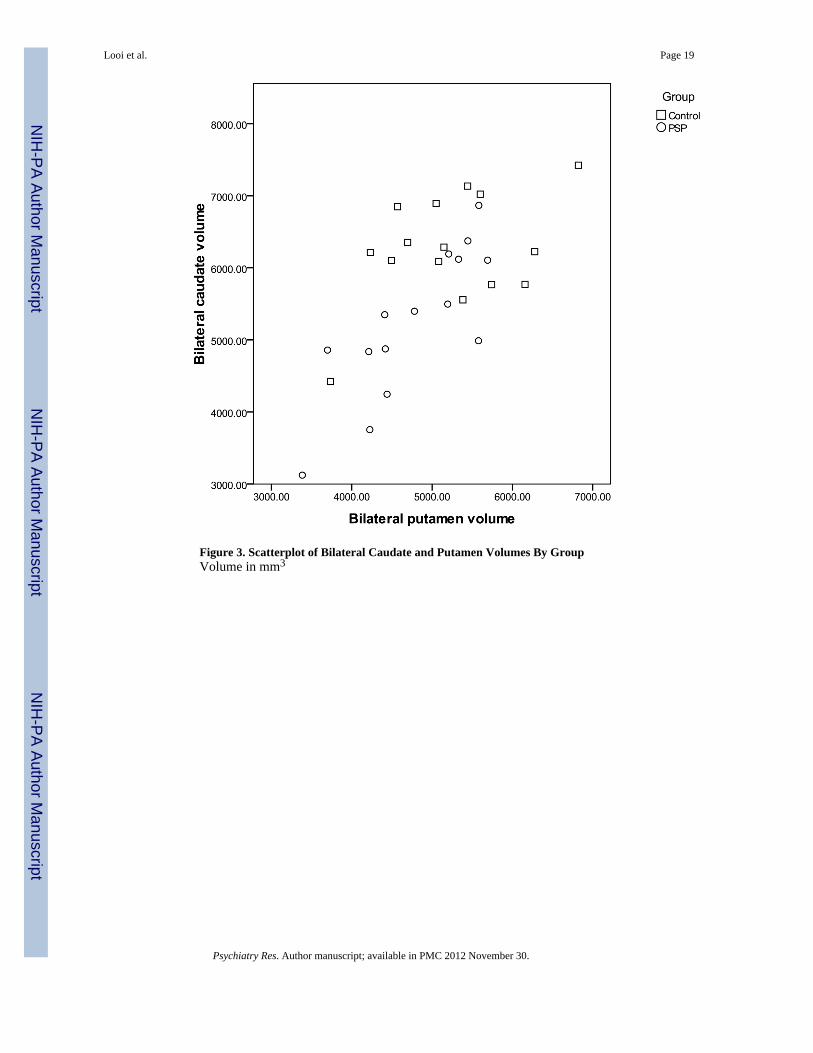
Figure 3. Scatterplot of Bilateral Caudate and Putamen Volumes By GroupVolume in mm3
Looi et al. Page 19
Psychiatry Res. Author manuscript; available in PMC 2012 November 30.
NIH
-PA Author Manuscript
NIH
-PA Author Manuscript
NIH
-PA Author Manuscript
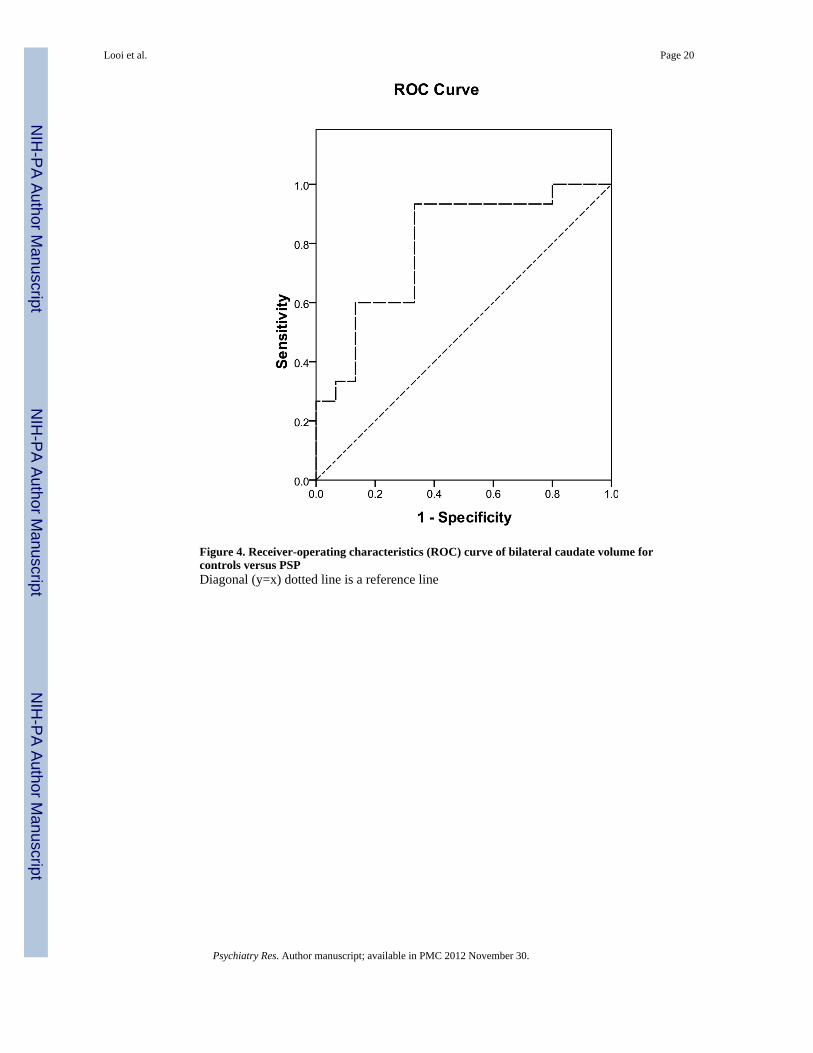
Figure 4. Receiver-operating characteristics (ROC) curve of bilateral caudate volume forcontrols versus PSPDiagonal (y=x) dotted line is a reference line
Looi et al. Page 20
Psychiatry Res. Author manuscript; available in PMC 2012 November 30.
NIH
-PA Author Manuscript
NIH
-PA Author Manuscript
NIH
-PA Author Manuscript
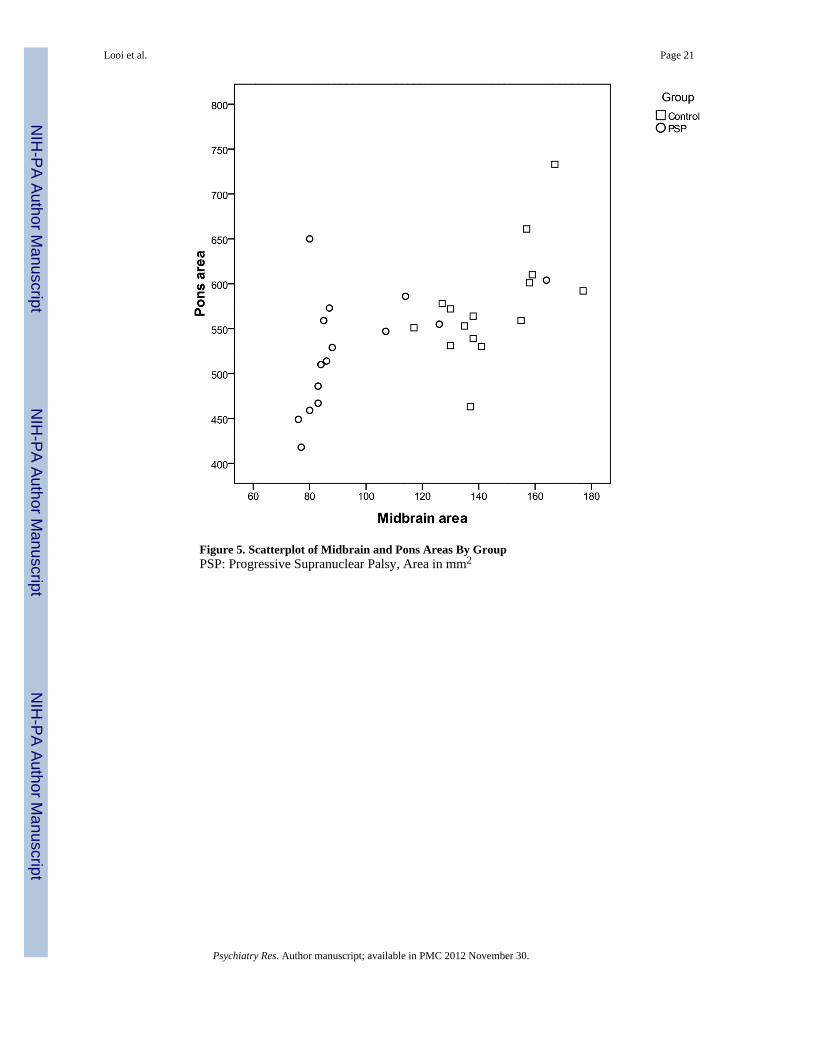
Figure 5. Scatterplot of Midbrain and Pons Areas By GroupPSP: Progressive Supranuclear Palsy, Area in mm2
Looi et al. Page 21
Psychiatry Res. Author manuscript; available in PMC 2012 November 30.
NIH
-PA Author Manuscript
NIH
-PA Author Manuscript
NIH
-PA Author Manuscript
Looi et al. Page 22
Psychiatry Res. Author manuscript; available in PMC 2012 November 30.
NIH
-PA Author Manuscript
NIH
-PA Author Manuscript
NIH
-PA Author Manuscript
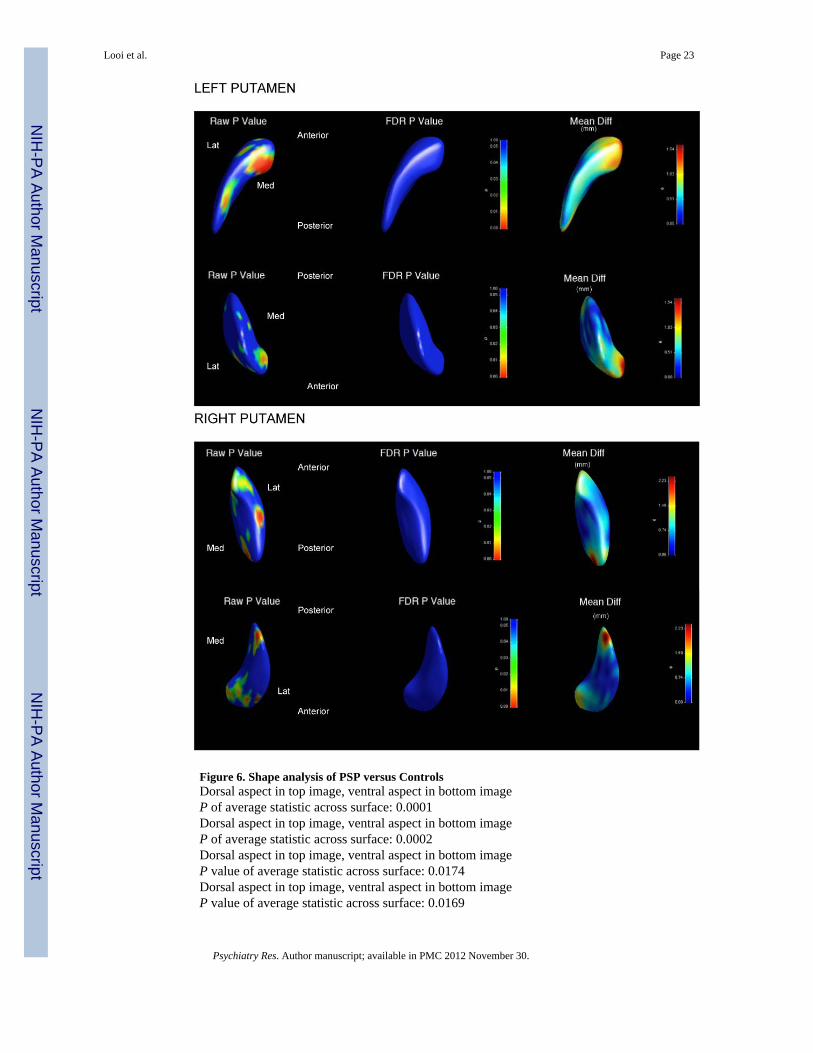
Figure 6. Shape analysis of PSP versus ControlsDorsal aspect in top image, ventral aspect in bottom imageP of average statistic across surface: 0.0001Dorsal aspect in top image, ventral aspect in bottom imageP of average statistic across surface: 0.0002Dorsal aspect in top image, ventral aspect in bottom imageP value of average statistic across surface: 0.0174Dorsal aspect in top image, ventral aspect in bottom imageP value of average statistic across surface: 0.0169
Looi et al. Page 23
Psychiatry Res. Author manuscript; available in PMC 2012 November 30.
NIH
-PA Author Manuscript
NIH
-PA Author Manuscript
NIH
-PA Author Manuscript
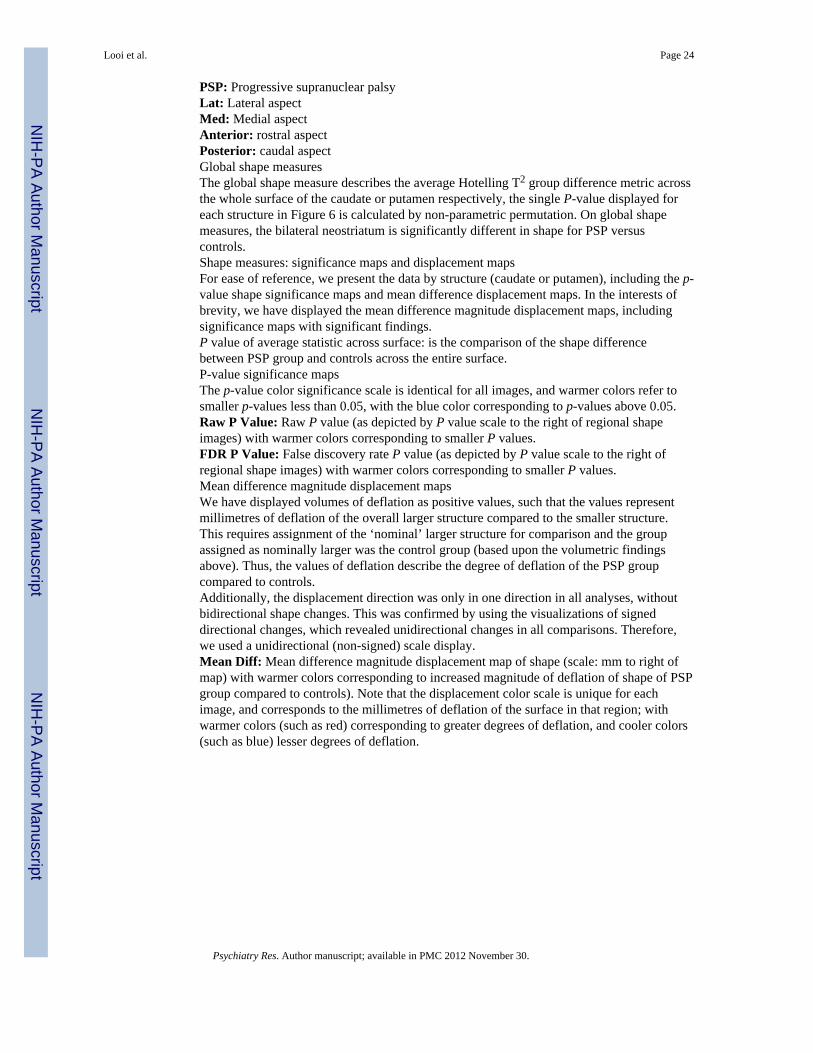
PSP: Progressive supranuclear palsyLat: Lateral aspectMed: Medial aspectAnterior: rostral aspectPosterior: caudal aspectGlobal shape measuresThe global shape measure describes the average Hotelling T2 group difference metric acrossthe whole surface of the caudate or putamen respectively, the single P-value displayed foreach structure in Figure 6 is calculated by non-parametric permutation. On global shapemeasures, the bilateral neostriatum is significantly different in shape for PSP versuscontrols.Shape measures: significance maps and displacement mapsFor ease of reference, we present the data by structure (caudate or putamen), including the p-value shape significance maps and mean difference displacement maps. In the interests ofbrevity, we have displayed the mean difference magnitude displacement maps, includingsignificance maps with significant findings.P value of average statistic across surface: is the comparison of the shape differencebetween PSP group and controls across the entire surface.P-value significance mapsThe p-value color significance scale is identical for all images, and warmer colors refer tosmaller p-values less than 0.05, with the blue color corresponding to p-values above 0.05.Raw P Value: Raw P value (as depicted by P value scale to the right of regional shapeimages) with warmer colors corresponding to smaller P values.FDR P Value: False discovery rate P value (as depicted by P value scale to the right ofregional shape images) with warmer colors corresponding to smaller P values.Mean difference magnitude displacement mapsWe have displayed volumes of deflation as positive values, such that the values representmillimetres of deflation of the overall larger structure compared to the smaller structure.This requires assignment of the ‘nominal’ larger structure for comparison and the groupassigned as nominally larger was the control group (based upon the volumetric findingsabove). Thus, the values of deflation describe the degree of deflation of the PSP groupcompared to controls.Additionally, the displacement direction was only in one direction in all analyses, withoutbidirectional shape changes. This was confirmed by using the visualizations of signeddirectional changes, which revealed unidirectional changes in all comparisons. Therefore,we used a unidirectional (non-signed) scale display.Mean Diff: Mean difference magnitude displacement map of shape (scale: mm to right ofmap) with warmer colors corresponding to increased magnitude of deflation of shape of PSPgroup compared to controls). Note that the displacement color scale is unique for eachimage, and corresponds to the millimetres of deflation of the surface in that region; withwarmer colors (such as red) corresponding to greater degrees of deflation, and cooler colors(such as blue) lesser degrees of deflation.
Looi et al. Page 24
Psychiatry Res. Author manuscript; available in PMC 2012 November 30.
NIH
-PA Author Manuscript
NIH
-PA Author Manuscript
NIH
-PA Author Manuscript
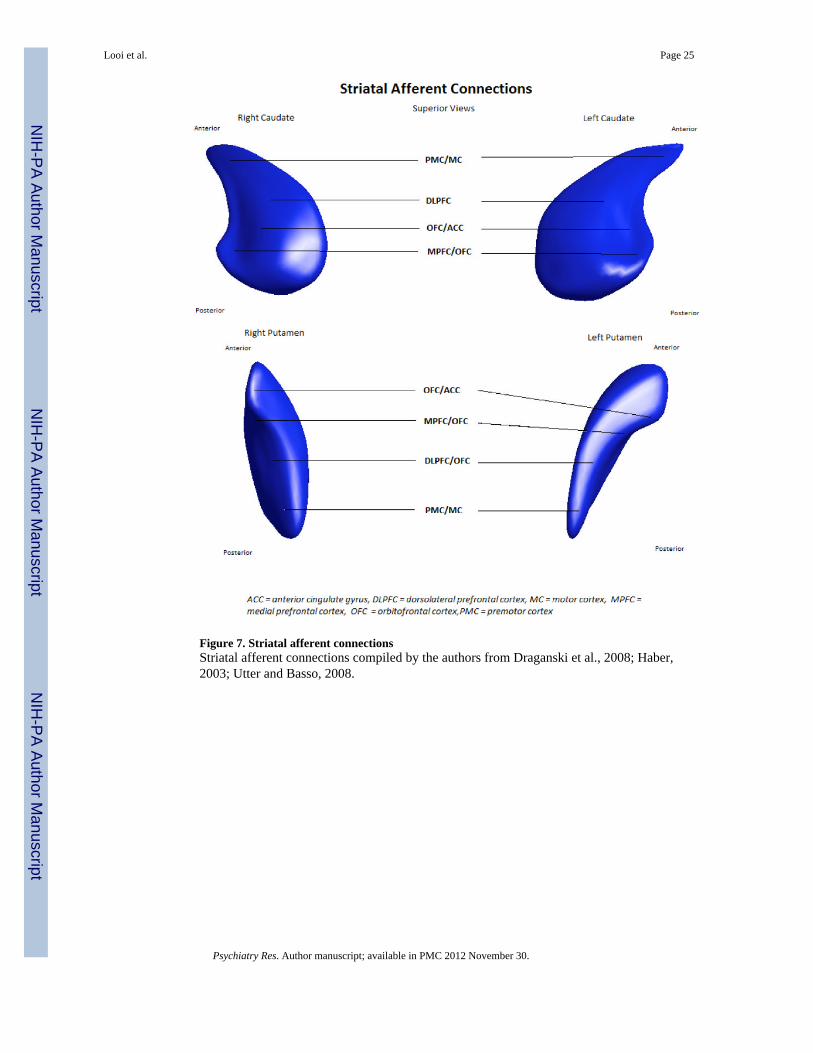
Figure 7. Striatal afferent connectionsStriatal afferent connections compiled by the authors from Draganski et al., 2008; Haber,2003; Utter and Basso, 2008.
Looi et al. Page 25
Psychiatry Res. Author manuscript; available in PMC 2012 November 30.
NIH
-PA Author Manuscript
NIH
-PA Author Manuscript
NIH
-PA Author Manuscript
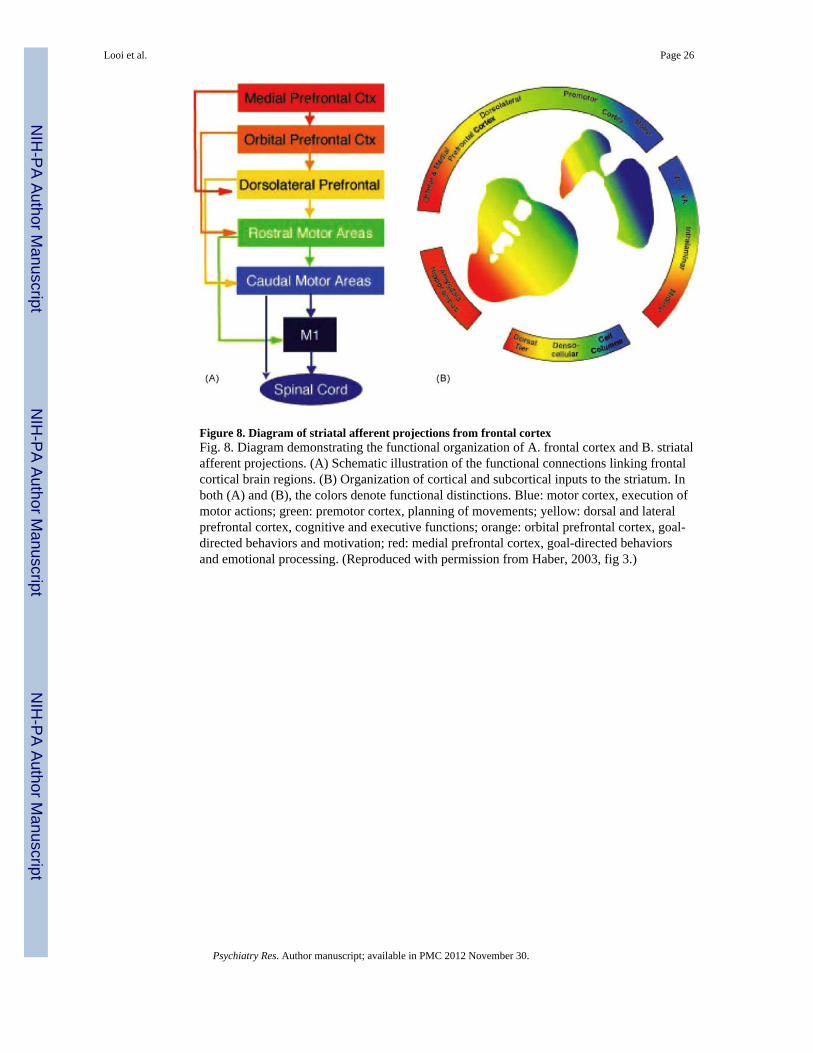
Figure 8. Diagram of striatal afferent projections from frontal cortexFig. 8. Diagram demonstrating the functional organization of A. frontal cortex and B. striatalafferent projections. (A) Schematic illustration of the functional connections linking frontalcortical brain regions. (B) Organization of cortical and subcortical inputs to the striatum. Inboth (A) and (B), the colors denote functional distinctions. Blue: motor cortex, execution ofmotor actions; green: premotor cortex, planning of movements; yellow: dorsal and lateralprefrontal cortex, cognitive and executive functions; orange: orbital prefrontal cortex, goal-directed behaviors and motivation; red: medial prefrontal cortex, goal-directed behaviorsand emotional processing. (Reproduced with permission from Haber, 2003, fig 3.)
Looi et al. Page 26
Psychiatry Res. Author manuscript; available in PMC 2012 November 30.
NIH
-PA Author Manuscript
NIH
-PA Author Manuscript
NIH
-PA Author Manuscript
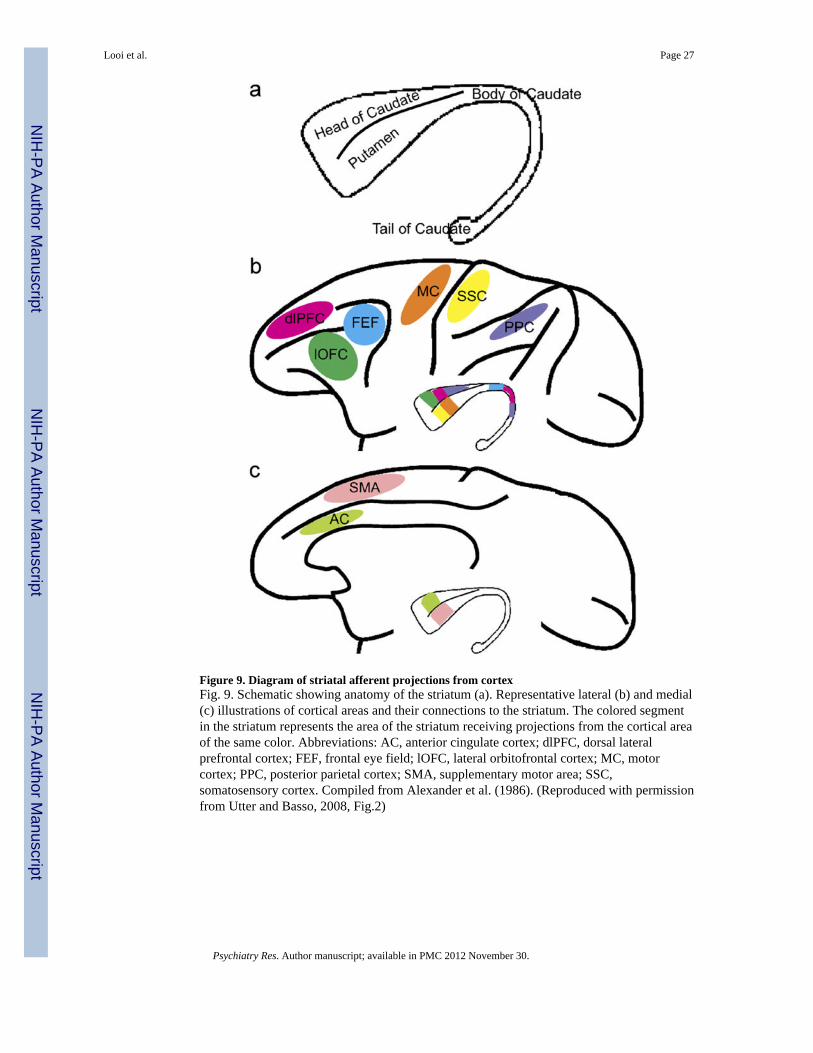
Figure 9. Diagram of striatal afferent projections from cortexFig. 9. Schematic showing anatomy of the striatum (a). Representative lateral (b) and medial(c) illustrations of cortical areas and their connections to the striatum. The colored segmentin the striatum represents the area of the striatum receiving projections from the cortical areaof the same color. Abbreviations: AC, anterior cingulate cortex; dlPFC, dorsal lateralprefrontal cortex; FEF, frontal eye field; lOFC, lateral orbitofrontal cortex; MC, motorcortex; PPC, posterior parietal cortex; SMA, supplementary motor area; SSC,somatosensory cortex. Compiled from Alexander et al. (1986). (Reproduced with permissionfrom Utter and Basso, 2008, Fig.2)
Looi et al. Page 27
Psychiatry Res. Author manuscript; available in PMC 2012 November 30.
NIH
-PA Author Manuscript
NIH
-PA Author Manuscript
NIH
-PA Author Manuscript

NIH
-PA Author Manuscript
NIH
-PA Author Manuscript
NIH
-PA Author Manuscript
Looi et al. Page 28
Tabl
e 1
Part
icip
ants
Gro
upn
Mea
n (S
D)
Diff
eren
ce (P
-val
ue)
Age
at S
tudy
PSP
1567
.8 (5
.84)
0.87
3
Con
trol
1568
.2 (7
.58)
Gen
der
PSP
8:7
0.79
6
(M:F
)
Con
trols
9:6
(M:F
)0.
439
ICV
PSP
1515
11.2
2 (2
47.9
8)0.
502
Con
trol
1514
62.3
8 (1
22.5
9)
P-va
lue
from
Inde
pend
ent S
ampl
es t-
test
, no
assu
mpt
ion
of e
qual
var
ianc
e; g
ende
r Chi
-squ
ared
val
ue b
ased
on
equa
l pro
porti
ons m
ale
and
fem
ale,
asy
mpt
otic
sign
ifica
nce
valu
e re
porte
d as
P-V
alue
; IC
V =
Intra
cran
ial V
olum
e (c
m3 )
; PSP
= P
rogr
essi
ve S
upra
nucl
ear P
alsy
, SD
= S
tand
ard
devi
atio
n
Psychiatry Res. Author manuscript; available in PMC 2012 November 30.
NIH
-PA Author Manuscript
NIH
-PA Author Manuscript
NIH
-PA Author Manuscript
Looi et al. Page 29
Tabl
e 2
Clin
ical
dat
a on
PSP
pat
ient
s
Patie
ntSe
x (M
/F)
Age
at M
RI
S &
E*
Dys
exec
utiv
eA
path
yPe
rson
ality
cha
nge
1M
7680
YY
Y
2M
6420
YY
Y
3F
6540
NN
N
4M
6860
YN
Y
5M
6430
YN
Y
6F
6040
NN
N
7F
7480
NN
N
8M
6080
NN
N
9M
7030
YN
N
10M
7080
NN
N
11M
8040
YN
N
12F
7040
YN
Y
13F
7180
NN
N
14F
6750
YY
Y
15F
6070
YN
N
* Schw
ab a
nd E
ngla
nd d
isab
ility
scal
e (p
erce
ntag
e), D
ysex
ecut
ive:
dys
exec
utiv
e sy
mpt
oms;
Apa
thy:
apa
thy/
loss
of i
nitia
tive
Psychiatry Res. Author manuscript; available in PMC 2012 November 30.

NIH
-PA Author Manuscript
NIH
-PA Author Manuscript
NIH
-PA Author Manuscript
Looi et al. Page 30
Tabl
e 3
Bet
wee
n G
roup
Diff
eren
ces –
Str
iata
l Vol
umes
, Mid
brai
n/Po
ns A
rea
and
Pons
/Mid
brai
n R
atio
Cau
date
Vol
ume
Puta
men
Vol
ume
Mid
brai
n A
rea
Pons
Are
aP/
M r
atio
PSP
5207
+/-
886
4735
+/-
708
93.8
+/-
20.1
525.
5 +/
- 61.
65.
77 +
/- 0.
8
Con
trol
6305
+/-
886
5267
+/-
708
145.
3 +/
- 20.
157
7.4
+/- 6
1.6
3.99
+/-
0.8
% d
iffer
ence
-17%
-10%
-35%
-9%
45%
P =
0.00
20.
024
< 0.
001
0.06
< 0.
001
PSP
= Pr
ogre
ssiv
e su
pran
ucle
ar p
alsy
, +/-
= St
anda
rd d
evia
tion,
Vol
ume
mea
sure
d in
mm
3 , A
rea
mea
sure
d in
mm
2 , %
Diff
eren
ce =
per
cent
age
diff
eren
ce o
f PSP
est
imat
ed m
argi
nal m
ean
com
pare
d to
Con
trol,
Sign
ifica
nt fi
ndin
gs in
bol
d ita
lics.
Psychiatry Res. Author manuscript; available in PMC 2012 November 30.


![Identification by [99mTc]ECD SPECT of anterior cingulate hypoperfusion in progressive supranuclear palsy, in comparison with Parkinson’s disease](https://img.pdfslide.net/doc/110x75/635bc7fda3fa66b45c0d9775/identification-by-99mtcecd-spect-of-anterior-cingulate-hypoperfusion-in-progressive.jpg)


![Chronic lithium administration alters behavioral recovery from nigrostriatal injury: Effects on neostriatal [3H]spiroperidol binding sites](https://img.pdfslide.net/doc/110x75/63556682922cbb7c550c91e1/chronic-lithium-administration-alters-behavioral-recovery-from-nigrostriatal-injury.jpg)


