Embed Size (px)
Citation preview
Inrernarional Journal of Cardiology, 29 (1990) 127-139
Elsevier 127
CARD10 01141
Morphometric data concerning the great arterial trunks and their branches
Luis Alvarez, Antonia Aranega, Roberto Saucedo, Jose A. Contreras, Franc&a L6pez
and Amelia Aranega
Department of Morphological Sciences, Basic Cardiovascular Research Seciion, School of Medicine, Unloersify of Granada,
Granada, Spain
(Received 30 March 1990; revision accepted 9 May 1990)
Alvarez L, Aranega A, Saucedo R, Contreras JA, Lopez F, Aranega A. Morphometric data concerning the great arterial trunks and their branches. Int J Cardiol 1990;29:127-139.
In a total of 4% fetuses and newborns ranging in body weight from 60 to 5000 g, we performed a morphometric study of the vasctdar complex, that is the orifices of the great arterial trunks, ascending aorta, aortic arch, vessels branching from the aortic arch, the aortic isthmus, descending aorta, pulmonary trunk, orifices of the pulmonary arteries and arterial duct. In all, 17 different parameters were measured in each specimen, using several new parameters in addition to the measurements classically used in the aortic isthmus, arterial duct and pulmonary trunk. Anatomogeometric models of these structures were developed, and stereometric formulas used to calculate the real volumes of the aortic isthmus, arterial duct and pulmonary trunk. The variations in the correlations between two measurable characteristics, that is, body weight and each of the morphometric parameters were analyzed, and the minimum, normal and maximum patterns of normality for each parameter were obtained with regression equations. The results show that the volume of the aortic isthmus increases by 0.03 ml for each millilitre increase in left ventricular volume. The isthmic volume increases by 0.32 ml for each millilitre increase in volume of the arterial duct and the volume of the pulmonary trunk increases by 6.4 ml for each increase of 1 millilitre in the volume of the aortic isthmus. The inner circumference of the aortic isthmus is greater than that of the arterial duct, whereas the former vessel is always shorter than the latter. We believe that these morphological data, when appropriately interpreted, have immediate clinical and surgical applications in the treatment of fetal and perinatal cardiovascular disorders.
Key words: Human fetal heart; Quantitative anatomy; Vascular complex
Introduction Correspondence to: Prof. Luis Alvarez, Depto. de Ciencias
Morfologicas. Seccibn de Investigaci6n&rsica Cardiovascular,
Facultad de Medicina, Universidad de Granada, Avda. de Madrid s/n, E-18071 Granada, Spain.
With the development of new methods for the prenatal diagnosis of congenital malformations, particularly congenital cardiac malformations, the
0167-5273/90/$03.50 0 1990 Elsevier Science Publishers B.V. (Biomedical Division)
128
last few years have seen a growing interest in data on the quantitative anatomy of the heart and the vascular complex (the ascending aorta, aortic arch,
aortic isthmus, descending aorta, pulmonary trunk, orifices of the pulmonary arteries, arterial duct
and arteries branching from the aortic arch). As put by Anderson [l], “knowledge of the develop-
ment of the heart can be a great aid to under- standing the morphology not only of the normal
heart but of congenitally malformed hearts. How- ever, there is no consensus regarding the events which occur during cardiac development.”
Numerous studies have dealt with this im- portant vascular intersection. Some have been car- ried out in vivo with conventional radiographic
[2], angiographic [3-51 or echocardiographic tech- niques [6-121, while other authors have based their work on autopsy findings [13-191.
Another factor which distinguishes many of
these studies is the age range investigated, some workers limiting themselves to adult hearts [10,19]
and others to fetal material [6,20,21], although the great majority of studies have involved extensive
age ranges. Toda [17], for example, studied speci- mens from 15 weeks of gestation to 90 years of
age. Most studies have only examined certain components of the cardiovascular complex [9- 11,18-20], and very few attempted to present find- ings for all the elements which make up this system [3,22].
Despite the considerable variety of approaches used in these earlier studies, which we have briefly
reviewed above, very few contributions allow us to set appropriate quantitative limits on patterns of
normality for the vascular structures named at the beginning of this introduction. Therefore, we ex- amined the quantitative anatomy of the normal cardiovascular complex in human fetal and peri- natal hearts.
Materials and Methods
The present study, carried out in the Basic Cardiovascular Research Section of the Depart- ment of Morphological Sciences, School of Medi- cine, University of Granada, was based on the analysis of 496 human cardiopulmonary blocks (including the outflow tracts of the great vessels,
TABLE 1
Distribution of weights, in 500 g intervals, of the 496 cases studied.
Body weight (g) No. of
cases
<500 32 501-1000 67
100-1500 91 1501-2000 54 2001-2500 62 2501-3ooO 54 3001-3500 63 3 501-4000 52 400-4500 13 4501-5000 8
ascending aorta, aortic arch, arteries branching from the aortic arch, aortic isthmus, descending aorta, pulmonary trunk, pulmonary branches and
arterial duct) from specimens in the fetal and
perinatal periods of development, ranging in body weight from 60 to 4984 g. Tables 1, 2 and 3
present the distribution of these specimens accord- ing to body weight, age and sex, respectively.
Internal and external anatomical malformations were ruled out in all hearts, which were diagnosed as normal. In no case was the cause of death
related to a congenital cardiac malformation. A set of linear measurements were taken (Fig.
1) in all hearts with a millimeter ruler and com- pass. When a curved surface made it impossible to use these tools, dampened string was lain across
the specimen between the two endpoints and then measured in millimeters.
TABLE 2
Body weight referred to age.
Body weight (g) Age (weeks)
<500 < 26
501-l 000 26-29
1001-l 500 29-33
1501-2000 33-36
200-2500 36-39
2501-3000 39-40 >3000 >40
129
TABLE 3
Postnatal survival in this last group ranged from 1 day to 30
days.
No. cases
Male 283
Female 213
Stillborns Live births
369 127
The following parameters were measured: the inner circumference of the arterial duct at its
origin, near the bifurcation of the pulmonary artery trunk (P,); the internal circumference of the
arterial duct at the point equidistant from its origin and its anastomosis with the aorta ( P2); the
inner circumference of the arterial duct at its anastomosis with the aorta ( P3); the length of the
arterial duct from its origin to its anastomosis with the aorta ( P4); the inner circumference of the
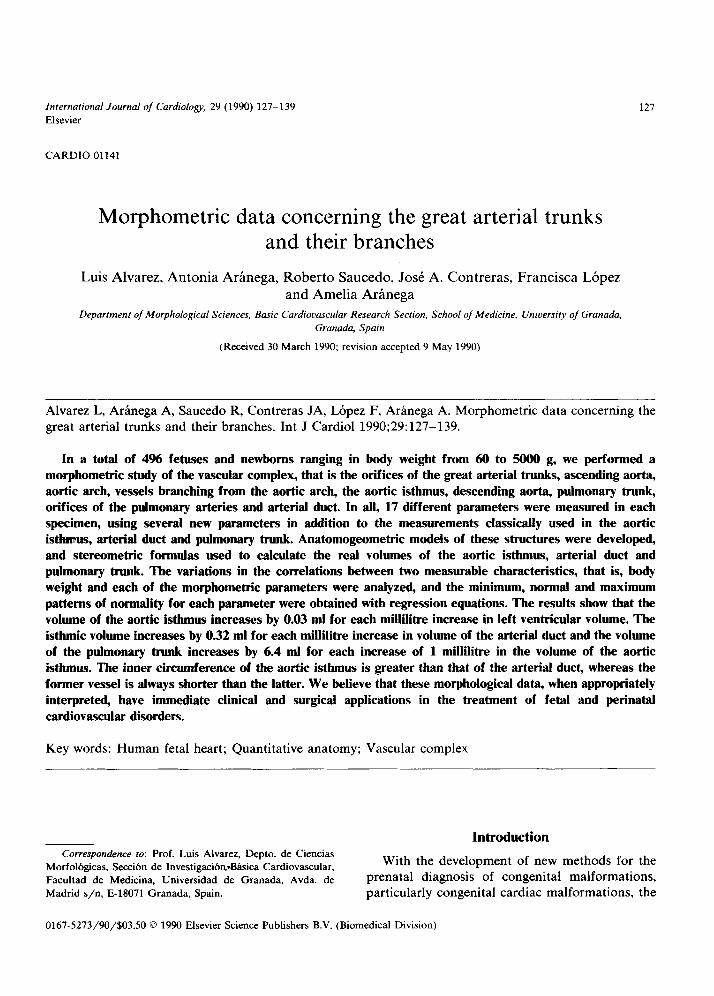
thoracic aorta at a point 1 cm distal to the anas- tomosis of the arterial duct (P,); the inner cir- cumference of the aortic isthmus at a point equidistant from the origin of the left subclavian artery and the anastomosis of the arterial duct with the aorta (P6); length of the aortic isthmus from the origin of the left subclavian artery to the anastomosis of the arterial duct with the aorta (P,); diameter of the orifice of the left subclavian
Fig. 1. Diagram of the linear measurements taken in the
vascular complex in human fetuses ranging in body weight
from 60 to 4984 g.
artery in the aortic arch (P,); diameter of the orifice of the primitive left carotid artery in the aortic arch (P,); diameter of the orifice of the branchiocephalic arterial trunk in the aortic arch
(P,,); inner circumference of the ascending aorta at a point 0.5 cm anterior to the branchiocephalic arterial trunk orifice (P,,); circumference of the
aortic valve (P,2); pulmonary valvar circumfer- ence ( P,3); diameter of the orifice of the right
pulmonary artery ( P14); diameter of the orifice of
the left pulmonary artery (P,,); inner cir- cumference of the pulmonary trunk immediately before its bifurcation (P,,); length of the
pulmonary trunk from its origin at the pulmonary valve to its bifurcation into the right and left pulmonary arteries (P,,).
Volumetric calculations
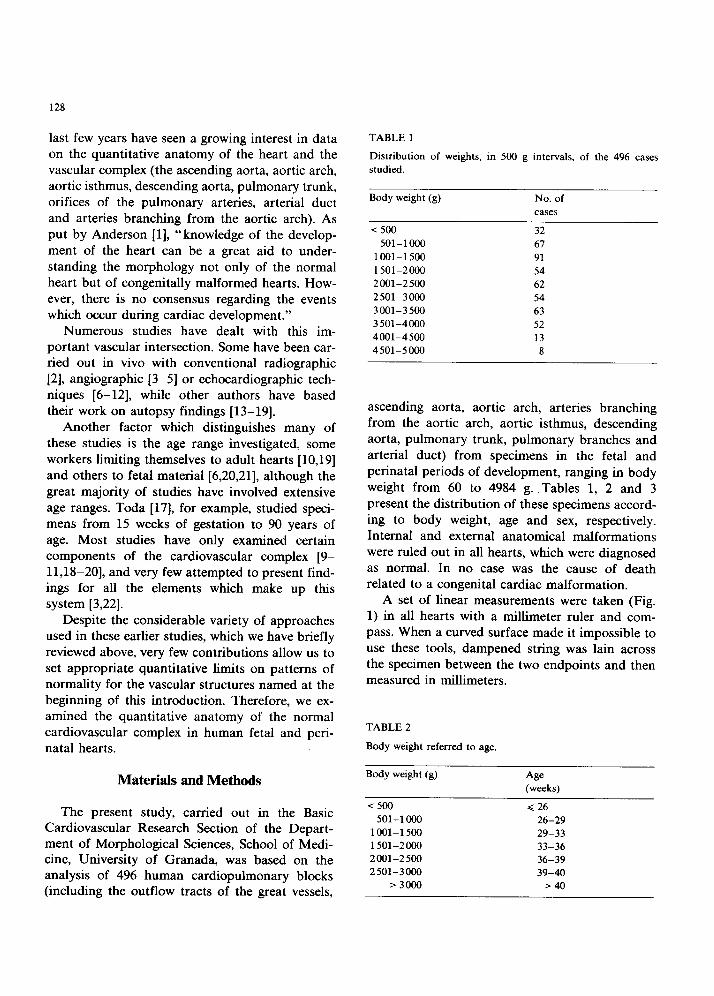
The volumes of the arterial duct, aortic isthmus and pulmonary trunk were calculated on the basis
of geometric models, as shown in Fig. 2. The suitability of the geometric form employed was previously confirmed in three-dimensional wax models. The arterial duct was assumed to have the shape of two truncated cones joined at their smaller bases, which were considered of equal diameter. The two figures were assumed to have
different heights, such that their corresponding
volumes could be calculated with the following formula:
v AD
= P‘,[P:+2P;+PjZ+(P,.PZ)+(3P.Pz)] 2477
where VA,, is the volume of the arterial duct. Similarly, the aortic isthmus was modeled on a
cylinder, hence its volume was calculated as:
where VA, is the volume of the aortic isthmus.
Finally, the pulmonary trunk was likened to a truncated cone, and its volume was calculated with the following equation:
V PAT = 12n
Fig. 2. Anatomogeometric scheme of the vascular complex.
where VpAT is the volume of the pulmonary trunk. After obtaining the values for all 17 parameters
in a sample of 496 fetal and perinatal hearts, we analyzed the correlation in search of joint varia- tions between two measurable characteristics, i.e., body weight and each of the parameters. No inter- vals were used in any of the parameters, rather,
each value was recorded exactly as measured. The table of normal values was prepared on the
basis of three different regression equations: the normal regression, and the maximum and mini-
mum regression, which determined the confidence limits of the corresponding regression lines. We should note that maximum and minimum correla- tions were calculated from the highest and lowest values for body weight within each 100 g interval.
Having obtained the patterns of normality for all 17 parameters, the formulas given above were used to calculate the normal, maximum and minimum volumes of the arterial duct, aortic
isthmus and pulmonary trunk for each 100 g inter- val of body weight.
Results
After taking the 17 linear measurements de- scribed above in all 496 cardiopulmonary blocks,
appropriate statistical analyses were used to ob- tain the intervals of normality for each parameter.
These values were used to calculate the intervals of normality for the volume of the arterial duct, aortic isthmus and pulmonary trunk. Rather than going into a lengthy and somewhat dry list of figures, it seemed to us more informative to pre-
sent separately our findings in each segment of the vascular complex, eventually to summarize the correlations between those parameters we consider
most important.
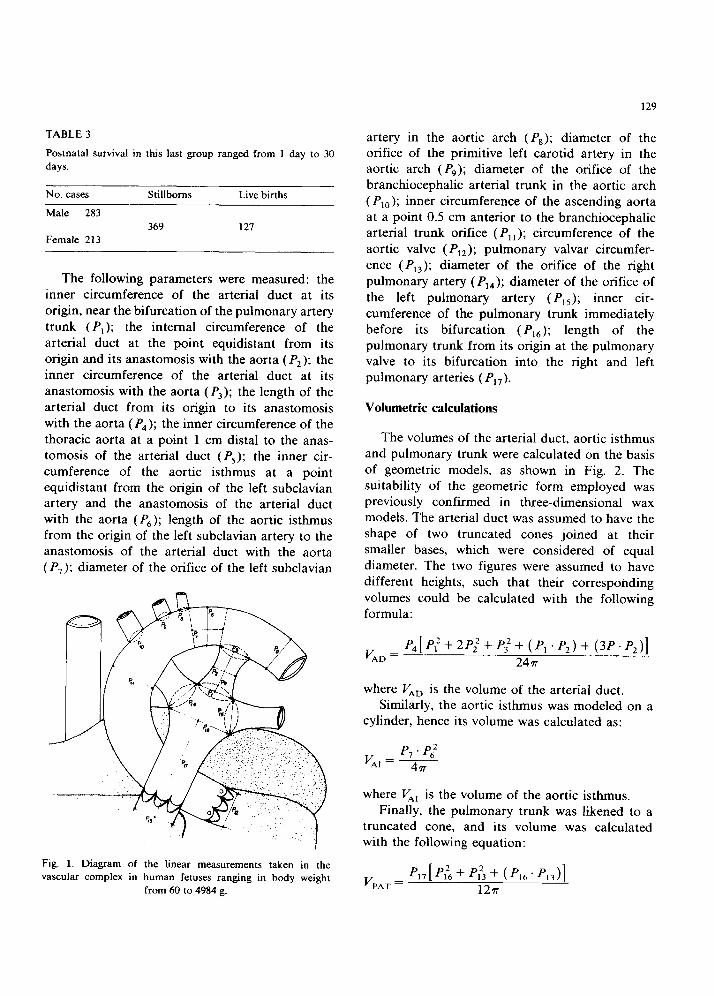
On measuring the inner circumference of the aortic isthmus halfway between the origin of the
left subclavian artery and the anastomosis of the
arterial duct with the aorta ( P6), we found mean normal values to range from 0.846 cm to 1.374 cm in specimens weighing from 101 to 5000 g, respec-
tively. As shown in Fig. 3, there was a statistically significant correlation (P < 0.0001) between fetal weight in kg and the inner circumference of the
aortic isthmus at this point. The regression equa- tion demonstrated that the inner circumference
increased an average of 0.17 cm per kg increase in body weight. The mean normal intervals for the length of the aortic isthmus, that is, the distance from the origin of the left subclavian artery to the anastomosis of the arterial duct with the aorta (PI,), ranged from 0.598 to 0.772 cm in fetuses weighing 101 to 5000 g. Fig. 4 illustrates the discrete but nonetheless significant correlation (P < 0.0001) between fetal weight in kg and the distance from the origin of the left subclavian
artery to the anastomosis of the arterial duct with the aorta (P,). This parameter showed an average increase of 0.06 cm per kg increase in body weight. Mean normal values for volume of the aortic isthmus, calculated on the basis of the cylindrical model described above, ranged from 0.034 to 0.115 ml in fetuses weighing 101 to 5000 g. The good statistical correlation between the volume of the aortic isthmus and body weight (P < 0.0001) is
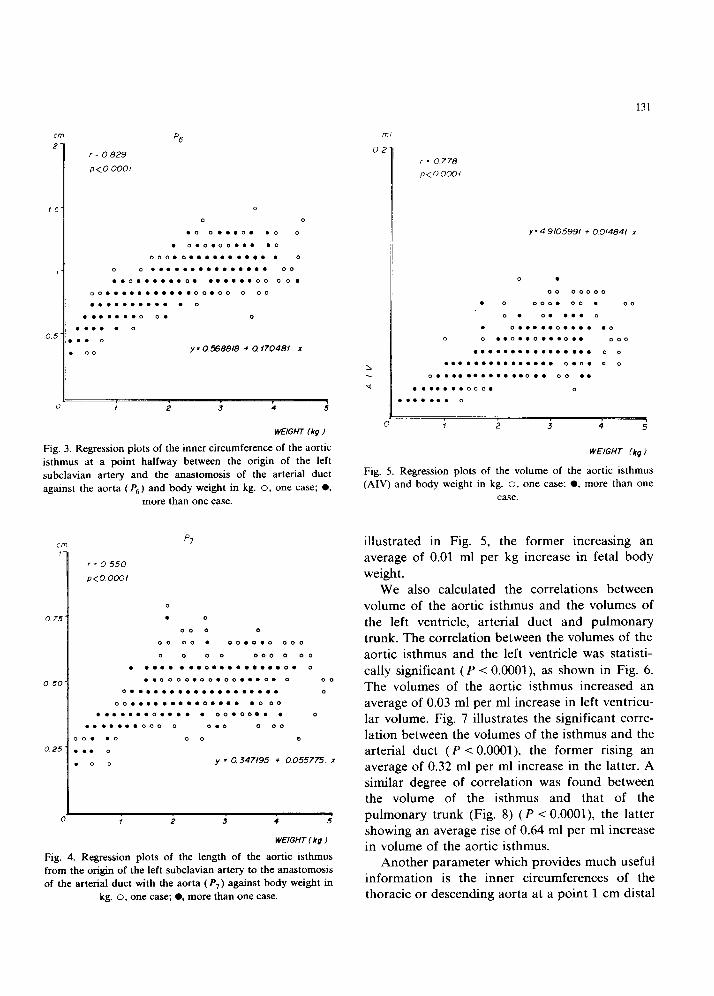
131
cm
2
15
I
0.5
i:
r = 0 829
p<o 0001
P6
0
0 0
.c. o...o. .O 0
. 0.0.00... .O
000.0 . . . . . . . . . . . 0
0 0 . . . . . . . . . . . . . . . 00
..o . . . . . . 0. . . . . . . 00 00.
cJ0...........00.00 0 00
. . . . . . . . . . . 0
. . . . . . . 0 0. 0
. . . . . 0
. . 0
“0 y = 0.5688b + 0. f70481, x
1 , 2 3 4 5
WE/G/f7 (kg I
Fig. 3. Regression plots of the inner circumference of the aortic
isthmus at a point halfway between the origin of the left
subclavian artery and the anastomosis of the arterial duct
against the aorta (P,) and body weight in kg. o, one case; 0, more than one case.
0 25
p7
r=o550
P<O 0001
‘
f 2 3 4 5
WEIGHT I kg I
Fig. 4. Regression plots of the length of the aortic isthmus
from the origin of the left subclavian artery to the anastomosis
of the arterial duct with the aorta (P,) against body weight in
kg. o, one case; 0, more than one case.
r = 0778
p<oooO/
y= 4.9105991 + 0.014841 x
0 .
00 00000
. 0 00 000. . 00
0. o....o
. 0 . . . . . 0 . . . . .O
0 0 ..o..o...o.. 000
. . . . . . . . . . . . . . . . 0 0
. . . . . . . . . . . . . . . 0.0. 0 0
0 . . . . . . . . . . . . 0.. 00 . .
. . . . . . . 000. 0
WEIGHT (kg I
Fig. 5. Regression plots of the volume of the aortic isthmus
(AIV) and body weight in kg. o, one case: 0, more than one
case.
illustrated in Fig. 5, the former increasing an average of 0.01 ml per kg increase in fetal body
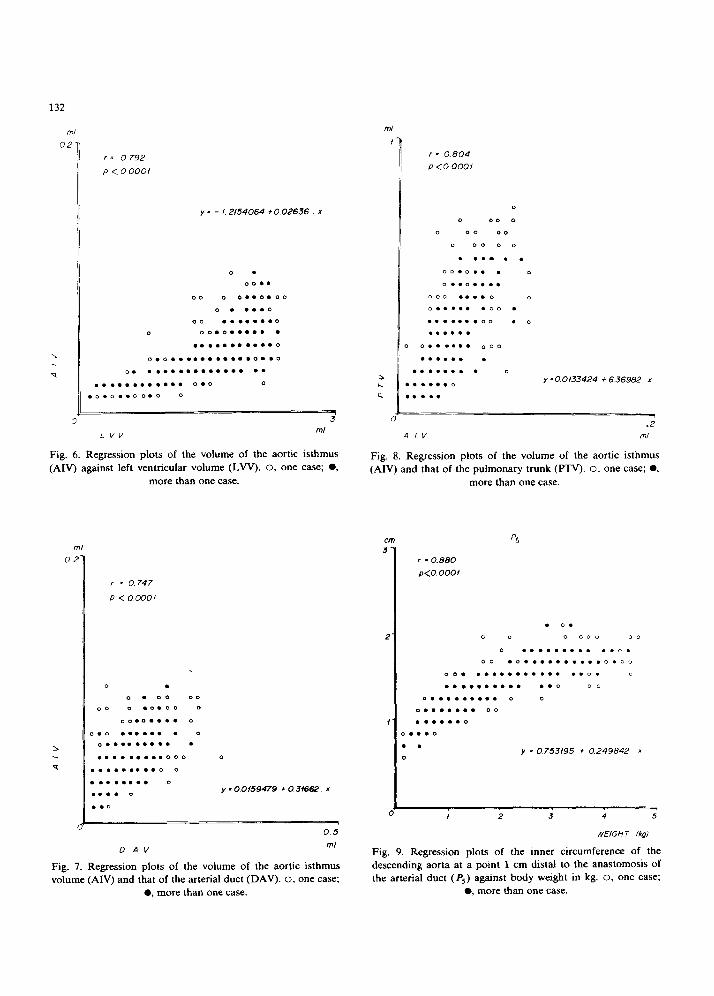
weight. We also calculated the correlations between
volume of the aortic isthmus and the volumes of
the left ventricle, arterial duct and pulmonary trunk. The correlation between the volumes of the aortic isthmus and the left ventricle was statisti-
cally significant (P < O.OOOl), as shown in Fig. 6.
The volumes of the aortic isthmus increased an average of 0.03 ml per ml increase in left ventricu-
lar volume. Fig. 7 illustrates the significant corre- lation between the volumes of the isthmus and the arterial duct (P < 0.0001). the former rising an average of 0.32 ml per ml increase in the latter. A similar degree of correlation was found between the volume of the isthmus and that of the
pulmonary trunk (Fig. 8) (P < O.OOOl), the latter showing an average rise of 0.64 ml per ml increase in volume of the aortic isthmus.
Another parameter which provides much useful information is the inner circumferences of the thoracic or descending aorta at a point 1 cm distal
132
I = 0 792
P <OOOOf
y = - I. 2154064 + 0.02636 x
0 .
00..
DO 0 O..D.OO
0 . . ..O
00 . . . . . . . 0
0 DO.O..... .
. . . . . . . . . . . 0
0.0 . . . . . . . . . . . 0..0
0. . . . . . . . . . . . . . . .
. . . . . . . . . . . . 0.0 a
‘“V ml
Fig. 6. Regression plots of the volume of the aortic isthmus
(AIV) against left ventricular volume (LVV). 0, one case; 0, more than one case.
A IV ml
Fig. 8. Regression plots of the volume of the aortic isthmus
(AIV) and that of the pulmonary trunk (ITV). O. one case; 0,
more than one case.
, = 0.747
P <ocOo1
00 0 .0.00 0
.x0.0.... 0
0.0 . . . . . . . 0
0 . . . . . . . . . .
. . . . . . . . . 000 0
l . . . . . . . . 0 0
. . . . . . . . 0
. . . . 0 y - 0.0159479 + 0.3f6t-2. x
1
0.5
r = 0.804
P <o 0001
0
0 00 0
0 00 00
0 00 0 0
. . . . . .
00.0.. . 0
o...a....
0 00 . . . . 0 0
0 . . . . . .OO .
. . . . . . . a0 . 0
. . . . . .
, o...... 0.30
. . . . . . .
. . . . . . . . 0
b.....O y -0 0133424 + 6.36982 x
I....
.2
I * 0.880
p<o.oooi
. 0.
0 0 0 00‘3 oc
0 . . . . . . . . . ..o.
00 .O..........O.O”
00. l . . . . . . . . . . ..o. 0
. . . . . . . . . . ..o 00
0.. . . . . . . . 0 0
D . . . . . . . 00
. . . . ..O
3...0
. . y = 0.753/95 + 0.249842 *
0
_ I 2 3 4 5
WEIGHT (kg)
0 AV ml
Fig. 7. Regression plots of the volume of the aortic isthmus
volume (AN) and that of the arterial duct (DAV). 0, one case; 0. more than one case.
Fig. 9. Regression plots of the inner circumference of the
descending aorta at a point 1 cm distal to the anastomosis of
the arterial duct (P,) against body weight in kg. 0, one case; l , more than one case.
133
I - 0 650
P<0.000f
pi2
0
0 00
0 0 .00 0
0 0 ..O . . . . . 0...00 00
00.0 . . . . . 0..000
00 0 . . . . . . . . . . 0 0
. . . . . . . . . . 0.0 0 0
0 . . . . . . . . . . . . . 0.
0. . . . . . . . . 0
. . . . ..o 0
. . . . . . 0
c,.. .
. . .
y = 0.949/i7 t 0 267235. x
- I 2 3 4 5
WEIGHT (kg I
Fig. 10. Regression plots of the circumference of the aortic
valve (P,,) against body weight in kg. 0, one case; 0, more
than one case.
93 cm
3
2.4
i.8
I.2
0.6
c
r = 0852
p<o.oooi D
0 0
0
DO 0 . 0.0 0.00. 00 0
0.. .O . . . . 0..0 oc
0 0 . . . . . . . . . . . . . ..O
O...O.O...U..Q. 00.
000 . . . . . . . . . . . . . . . 0.
0 0.0 . . . . . . 0 0..0
. . . . l . . . . 0.. 0 0
0 . . . . . . . . D .
0...... 0
0 . . . . 0
.0. D
. ..00 y = O 936259 + 0 32034E a
WEIGHT / kg I
Fig. 11. Regression plots of pulmonary valvar circumference
(P,,) against body weight in kg. o, one case; 0, more than one
case.
Pf2IcmI
Fig. 12. Regression plots of pulmonary valvar circumference
( P13) against aortic valvar circumference ( PI, ). 0. one case; 0,
more than one case.
D
r = 0942 0 0
0
P<O.cOOf . 0
. . . . .
. . ...00
. . . . . . 0
. . ...000
.O . . . .
. . ..O
. . . . . .
0.....000
. . . . .
0....0
. .
..O
0 Y * 00925550 + / f2650 x
to the anastomosis of the arterial duct ( P5). The intervals of normality for this parameter ranged from 1.078 cm in fetuses weighing 101 g to 1.854
cm in specimens weighing 5000 g. Fig. 9 shows the
clearly significant correlation (P < 0.0001) be- tween fetal body weight and the inner cir-
cumference of the thoracic or descending aorta at a point 1 cm distal to the anastomosis of the
arterial duct (P,), and the corresponding regres- sion equation further showed that the inner cir- cumference of the thoracic aorta increased an
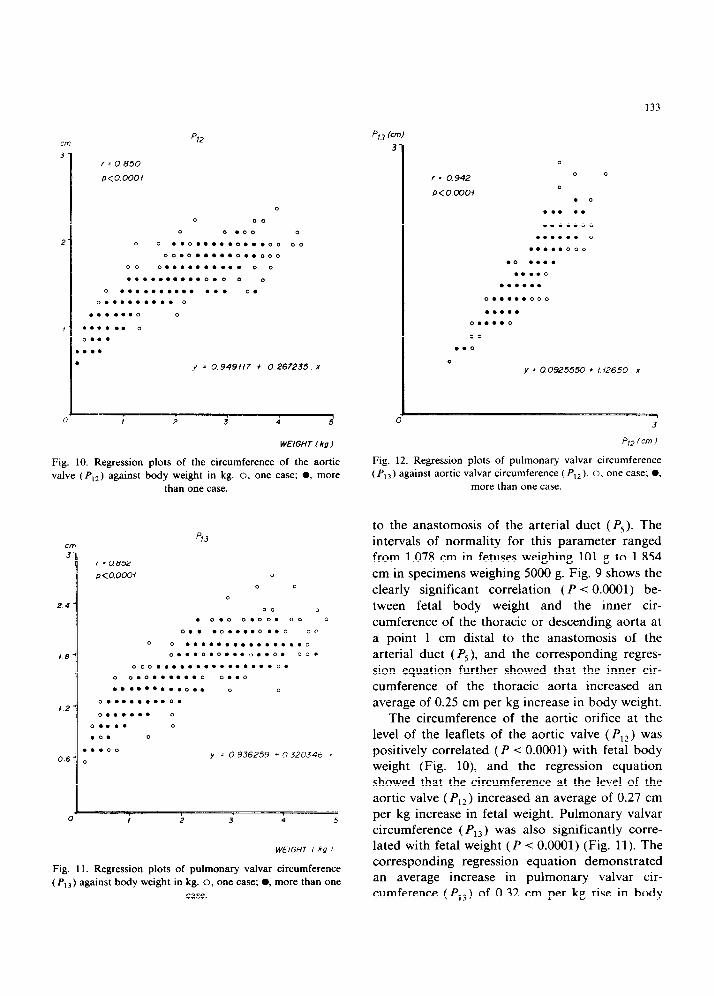
average of 0.25 cm per kg increase in body weight. The circumference of the aortic orifice at the
level of the leaflets of the aortic valve (P,?) was positively correlated (P -C 0.0001) with fetal body weight (Fig. lo), and the regression equation showed that the circumference at the level of the aortic valve ( P,2) increased an average of 0.27 cm per kg increase in fetal weight. Pulmonary valvar circumference ( P13) was also significantly corre- lated with fetal weight (P < 0.0001) (Fig. 11). The corresponding regression equation demonstrated an average increase in pulmonary valvar cir-
cumference (P,,) of 0.32 cm per kg rise in body
134
weight (Fig. 12). Aortic valvar circumference (I’,*) was also found to be significantly correlated with the circumference of the pulmonary valve (I’,,), as
shown in Fig. 12. The latter parameter showed an average increase of 1.13 cm per cm increase in the
former.
Discussion
Few studies to date have dealt with the quanti- tative anatomy during the fetal and perinatal
period in the vascular complex (orifices of the great arteries, ascending aorta, aortic arch and its branches, aortic isthmus, descending aorta, arterial duct, pulmonary trunk and orifices of the
pulmonary arteries) (Figs. 1 and 2). Van Meurs- Van Woezik et al. [13] studied 46 human hearts: 35 from fetuses weighing 4700 g or less, and 11 from subjects 6 to 36 kg, with ages ranging from
25 weeks’ gestation to 9 years. Using calibrated probes, these authors measured the diameters of
the aortic and pulmonary orifices, aortic isthmus
and descending aorta, and noted correlations be- tween these parameters and body length. The smail
sample size, together with the wide range of body weights and ages considered, make their data somewhat unreliable as a basis for establishing definitive intervals of normality. Likewise the use
of calibrated probes seems questionable, since these instruments can distend the vessels. String, by contrast, can be precisely adjusted to the curved or irregular inner surfaces of the vessel being measured once the lumen has been exposed with
scissors. This can then be transferred to a millime- ter scale, a technique which offers greater accu- racy.
Van Meurs-Van Woezik et al. [13] did not obtain patterns of normality for the parameters actually measured, as the diameter of the aortic isthmus, for example, was found to be 4 mm in different fetuses weighing 1080, 1450, 1950, 3050 and 3300 g. A similar situation presented itself in the diameters of the aortic and pulmonary orifices and the descending aorta. Our data for patterns of normality suggest that each parameter increases at a steady rate in relation to rising body weight. We, therefore, disagree with the values in the tables of Van Meurs-Van Woezik and her colleagues [13]
for these parameters. Although we agree that the pulmonary arterial orifice is larger than that of the aorta, this difference becomes obvious only in
fetuses of 2000 g body weight and over, and is not systematically evident in all phases of develop-
ment.
Based on their data for the aortic isthmus, Clarkson et al. [3] explain the presence or absence
of narrowing as evidenced by the index derived
from the area of the cross-section through its narrowest point. divided by the area of the cross section of the descending aorta through a point immediately distal to the arterial duct. If the re- sulting index is less than 0.81, a narrowing is said
to exist, whereas a figure equal to or greater than 0.81 proves the absence of narrowing. In the light of our observations, there appears to be no nar- rowing of the isthmus. Under normal cir- cumstances (Fig. 3) the inner circumference at the midpoint of the isthmus increases 0.17 cm per kg increase in fetal body weight. Clarkson et al. [3]
correlated their measurements with body length, a
parameter we consider of doubtful value. Like
Rakusan et al. [23], we found that increases in heart weight, and hence in heart size, were propor- tional to increases in body weight rather than body length. Thus, body weight is a more signifi-
cant determinant of heart growth in the course of development, an opinion shared by St. John Sut- ton et al. [25]. Our findings furthermore show a statistically significant correlation (P -c 0.0001) between these parameters and fetal body weight in kilograms.
We agree with Yousefzadeh et al. [2] in that the inner circumference of the descending aorta at a
point 1 cm distal to the anastomosis of the arterial duct is consistently larger than the inner cir- cumference of the aortic isthmus at its midpoint.
This feature, in radiological studies, can produce a picture similar to that seen in aortic coarctation and may, hence, give the misleading impression of a pathological aortic isthmus. Clarkson et al. [3] claimed that the aortic isthmus in 90% of all 3-month-old infants is of the same caliber as the descending aorta, whereas the former is much smaller in newborns due to the smaller volume of blood flowing through the isthmus during the fetal period. Our data in this regard are not compara-
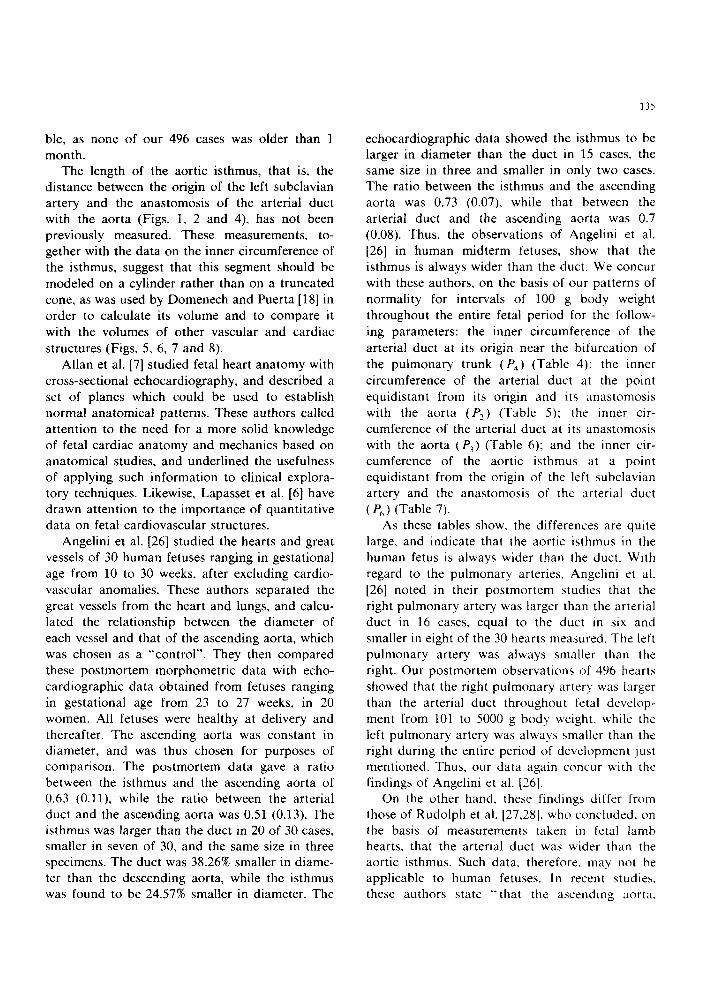
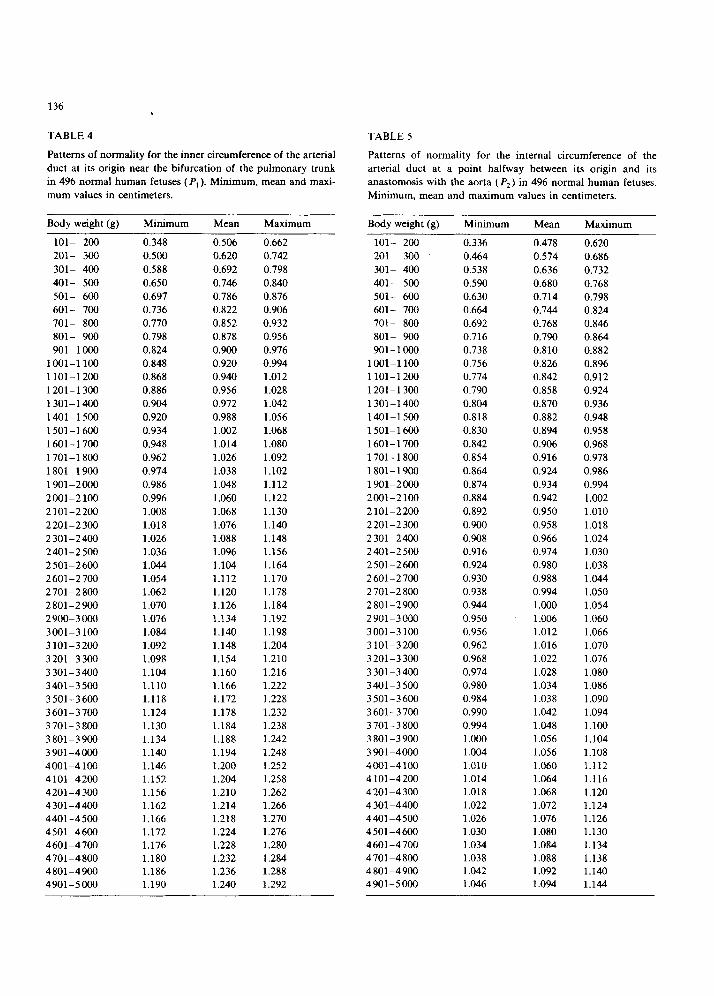
135
ble, as none of our 496 cases was older than 1
month. The length of the aortic isthmus, that is, the
distance between the origin of the left subclavian artery and the anastomosis of the arterial duct with the aorta (Figs. 1, 2 and 4). has not been
previously measured. These measurements, to- gether with the data on the inner circumference of
the isthmus, suggest that this segment should be modeled on a cylinder rather than on a truncated
cone, as was used by Domenech and Puerta [18] in order to calculate its volume and to compare it
with the volumes of other vascular and cardiac
structures (Figs. 5, 6, 7 and 8). Allan et al. [7] studied fetal heart anatomy with
cross-sectional echocardiography. and described a
set of planes which could be used to establish normal anatomical patterns. These authors called
attention to the need for a more solid knowledge of fetal cardiac anatomy and mechanics based on anatomical studies, and underlined the usefulness
of applying such information to clinical explora- tory techniques. Likewise, Lapasset et al. [6] have drawn attention to the importance of quantitative data on fetal cardiovascular structures.
Angelini et al. [26] studied the hearts and great vessels of 30 human fetuses ranging in gestational
age from 10 to 30 weeks, after excluding cardio- vascular anomalies. These authors separated the
great vessels from the heart and lungs, and calcu- lated the relationship between the diameter of
each vessel and that of the ascending aorta, which was chosen as a “control”. They then compared
these postmortem morphometric data with echo- cardiographic data obtained from fetuses ranging
in gestational age from 23 to 27 weeks, in 20 women. All fetuses were healthy at delivery and
thereafter. The ascending aorta was constant in diameter, and was thus chosen for purposes of comparison. The postmortem data gave a ratio between the isthmus and the ascending aorta of 0.63 (O.ll), while the ratio between the arterial duct and the ascending aorta was 0.51 (0.13). The isthmus was larger than the duct in 20 of 30 cases, smaller in seven of 30, and the same size in three specimens. The duct was 38.26% smaller in diame- ter than the descending aorta, while the isthmus was found to be 24.57% smaller in diameter. The
echocardiographic data showed the isthmus to be larger in diameter than the duct in 15 cases, the same size in three and smaller in only two cases. The ratio between the isthmus and the ascending aorta was 0.73 (0.07). while that between the
arterial duct and the ascending aorta was 0.7 (0.08). Thus, the observations of Angelini et al.
[26] in human midterm fetuses, show that the isthmus is always wider than the duct. We concur
with these authors, on the basis of our patterns of normality for intervals of 100 g body weight
throughout the entire fetal period for the follow-
ing parameters: the inner circumference of the
arterial duct at its origin near the bifurcation of
the pulmonary trunk ( P4) (Table 4); the inner
circumference of the arterial duct at the point
equidistant from its origin and its anastomosis with the aorta (P,) (Table 5); the inner cir-
cumference of the arterial duct at its anastomosis
with the aorta ( P3) (Table 6); and the inner cir- cumference of the aortic isthmus at a point equidistant from the origin of the left subclavian artery and the anastomosis of the arterial duct
(P,) (Table 7). As these tables show. the differences are quite
large. and indicate that the aortic isthmus in the human fetus is always wider than the duct. With
regard to the pulmonary arteries, Angelini et al.
[26] noted in their postmortem studies that the right pulmonary artery was larger than the arterial
duct in 16 cases, equal to the duct in six and smaller in eight of the 30 hearts measured. The left
pulmonary artery was always smaller than the right. Our postmortem observations of 496 hearts showed that the right pulmonary artery was larger
than the arterial duct throughout fetal develop-
ment from 101 to 5000 g body weight. while the left pulmonary artery was always smaller than the right during the entire period of development just mentioned. Thus, our data again concur with the findings of Angelini et al. [36].
On the other hand, these findings differ from those of Rudolph et al. [27.28]. who concluded. on the basis of measurements taken in fetal lamb hearts. that the arterial duct was wider than the aortic isthmus. Such data. therefore. may not be applicable to human fetuses. In recent studirh. these authors state “that the ascending ;mrta.
136 .
TABLE 4 TABLE 5
Patterns of normality for the inner circumference of the arterial duct at its origin near the bifurcation of the pulmonary trunk in 496 normal human fetuses (I’,). Minimum, mean and maxi- mum values in centimeters.
Patterns of normality for the internal circumference of the arterial duct at a point halfway between its origin and its anastomosis with the aorta ( P2) in 496 normal human fetuses. Minimum, mean and maximum values in centimeters.
Body weight (g) Minimum Mean Maximum
lOl- 2c4l 0.348 0.506 0.662 101- 200 ZOl- 300 0.500 0.620 0.742 201- 300 301- 400 0.588 0.692 0.798 301- 400 401- 500 0.650 0.746 0.840 401- 500 501- 600 0.697 0.786 0.876 501- 600 601- 700 0.736 0.822 0.906 601- 700 701- 800 0.770 0.852 0.932 701- 800 801- 900 0.798 0.878 0.956 801- 900 901-l WO 0.824 0.900 0.976 901-1000
100-l 100 0.848 0.920 0.994 100-l 100
1101-1200 0.868 0.940 1.012 1101-1200
1201-1300 0.886 0.956 1.028 1201-l 300
1301-1400 0.904 0.972 1.042 1301-l 400
140-1500 0.920 0.988 1.056 140-1500 1501-1600 0.934 1.002 1.068 1501-l 600 1601-1700 0.948 1.014 1.080 1601-1700
1701-l 800 0.962 1.026 1.092 1701-l 800
1801-1900 0.974 1.038 1.102 1801-1900
1901-2000 0.986 1.048 1.112 1901-2000
200-2100 0.996 1.060 1.122 2001-2100
2101-2200 1.008 1.068 1.130 2101-2200
2201-2300 1.018 1.076 1.140 2201-2300
2301-2400 1.026 1.088 1.148 2301-2400
2401-2500 1.036 1.096 1.156 2401-2500
2501-2600 1.044 1.104 1.164 2501-2600
2601-2700 1.054 1.112 1.170 2601-2700
2701-2800 1.062 1.120 1.178 2 701-2 800
2801-2900 1.070 1.126 1.184 2801-2900
290%3ooO 1.076 1.134 1.192 2901-3000
300-3 100 1.084 1.140 1.198 3001-3100
3 101-3200 1.092 1.148 1.204 3 101-3200
3201-3300 1.098 1.154 1.210 3201-3300
3301-3400 1.104 1.160 1.216 3301-3400
340-3500 1.110 1.166 1.222 340-3500
3501-3600 1.118 1.172 1.228 3501-3600
3601-3700 1.124 1.178 1.232 3601-3700
3701-3800 1.130 1.184 1.238 3701-3800
3801-3900 1.134 1.188 1.242 3801-3900
3901-4000 1.140 1.194 1.248 3901-4000
400-4100 1.146 1.200 1.252 4001-4100 4101-4200 1.152 1.204 1.258 4101-4200
4201-4300 1.156 1.210 1.262 4201-4300
4301-4400 1.162 1.214 1.266 4301-4400
4401-4500 1.166 1.218 1.270 4401-4500
4501-4600 1.172 1.224 1.276 4501-4600 4601-4700 1.176 1.228 1.280 4601-4700 4 701-4 800 1.180 1.232 1.284 4701-4800 4801-4900 1.186 1.236 1.288 4801-4900 4901-5000 1.190 1.240 1.292 4901-5000
Body weight (g) Minimum -
0.336
Mean
0.478
Maximum
0.620
0.686 0.732
0.768 0.798 0.824 0.846 0.864 0.882 0.896 0.912 0.924 0.936 0.948 0.958 0.968 0.978 0.986
0.994 1.002 1.010
1.018 1.024 1.030 1.038 1.044 1.050 1.054 1.060 1.066 1.070 1.076
1.080 1.086 1.090 1.094 1.100 1.104 1.108 1.112 1.116 1.120 1.124 1.126 1.130 1.134 1.138 1.140 1.144
0.464 0.574
0.538 0.636 0.590 0.680 0.630 0.714 0.664 0.744 0.692 0.768 0.716 0.790 0.738 0.810 0.756 0.826 0.774 0.842 0.790 0.858 0.804 0.870 0.818 0.882 0.830 0.894 0.842 0.906 0.854 0.916
0.864 0.924 0.874 0.934 0.884 0.942 0.892 0.950 0.900 0.958 0.908 0.966 0.916 0.974 0.924 0.980 0.930 0.988 0.938 0.994 0.944 1.000 0.950 1.006 0.956 1.012 0.962 1.016 0.968 1.022 0.974 1.028 0.980 1.034 0.984 1.038 0.990 1.042 0.994 1.048 1.000 1.056 1.004 1.056 1.010 1.060 1.014 1.064 1.018 1.068 1.022 1.072 1.026 1.076 1.030 1.080 1.034 1.084 1.038 1.088 1.042 1.092 1.046 1.094
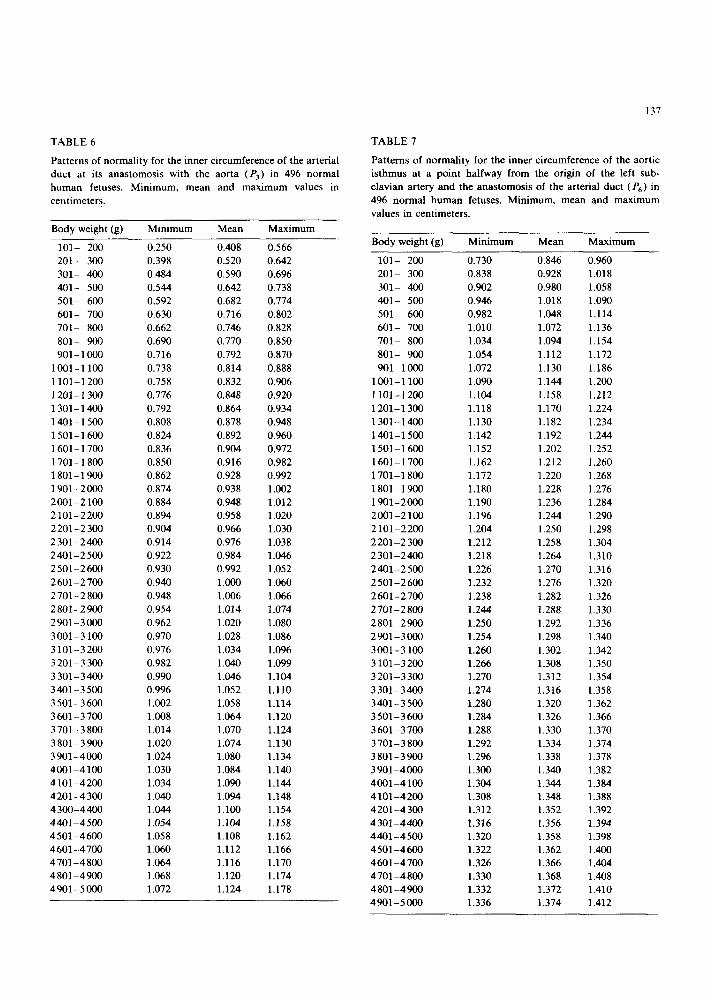
TABLE 6 TABLE 7
Patterns of normality for the inner circumference of the arterial duct at its anastomosis with the aorta (F’s) in 496 normal human fetuses. Minimum, mean and maximum values in
centimeters.
Patterns of normality for the inner circumference of the aortic isthmus at a point halfway from the origin of the left sub- clavian artery and the anastomosis of the arterial duct (P6) in 496 normal human fetuses. Minimum. mean and maximum values in centimeters.
Body weight (g) Minimum Mean Maximum
IOI- 200 0.250 0.408 0.566 201- 300 0.398 0.520 0.642 301- 400 0.484 0.590 0.696 401- 500 0.544 0.642 0.738 501- 600 0.592 0.682 0.774 601- 700 0.630 0.716 0.802 701- 800 0.662 0.746 0.828 801- 900 0.690 0.770 0.850 901-l 000 0.716 0.792 0.870
1001-l 100 0.738 0.814 0.888 1101-l 200 0.758 0.832 0.906 1201-1300 0.776 0.848 0.920 1301-1400 0.792 0.864 0.934 1401-1500 0.808 0.878 0.948 1501-1600 0.824 0.892 0.960 1601-1700 0.836 0.904 0.972 1701-l 800 0.850 0.916 0.982 1801-1900 0.862 0.928 0.992 1901-2000 0.874 0.938 1.002 200-2 100 0.884 0.948 1.012 2101-2200 0.894 0.958 1.020 2201-2300 0.904 0.966 1.030 2301-2400 0.914 0.976 1.038 2401-2500 0.922 0.984 1.046 2501-2600 0.930 0.992 1.052 2601-2700 0.940 1.000 1.060 2701-2800 0.948 1.006 1.066 2801-2900 0.954 1.014 1.074 2901-3000 0.962 1.020 1.080 3001-3100 0.970 1.028 1.086 3101-3200 0.976 1.034 1.096 3201-3300 0.982 1.040 1.099 3301-3400 0.990 I .046 1.104 340-3500 0.996 1.052 1.110 3501-3600 1.002 1.058 1.114 3601-3700 1.008 1.064 1.120 3701-3800 1.014 1.070 1.124 3801-3900 1.020 1.074 1.130 390-4000 1.024 1.080 1.134 4001-4100 1.030 1.084 1.140 4101-4200 1.034 1.090 1.144 4201-4300 1.040 1.094 1.148 4300-4400 1.044 1.100 1.154 440-4500 1.054 1.104 1.158 4501-4600 1.058 1.108 1.162 4601-4700 1.060 1.112 1.166 4701-4800 1.064 1.116 1.170 4801-4900 1.068 1.120 1.174 4901-5000 1.072 1.124 1.178
137
Body weight (g) Minimum Mean Maximum
lOl- 200 0.730 0.846 0.960 201- 300 0.838 0.928 1.018 301- 400 0.902 0.980 1.058 4O- 500 0.946 1.018 1.090 501- 600 0.982 1.048 1.114 601- 700 1.010 1.072 1.136 701- 800 1.034 1.094 1.154
801- 900 1.054 1.112 1.172 90-1000 1.072 1.130 1.186
100-1100 1.090 1.144 1.200 1101-l 200 1.104 1.158 1.212 1201-1300 1.118 1.170 1.224 1301-1400 1.130 1.182 1.234 140-1500 1.142 1.192 1.244 1501-1600 1.152 1.202 1.252 1601-1700 1.162 1.212 7.260 1701-1800 1.172 1.220 1.268 1801-1900 1.180 1.228 1.276 1901-2000 1.190 1.236 1.284 2001-2100 1.196 1.244 1.290 2101-2200 1.204 1.250 1.298 2201-2300 1.212 1.258 1.304 2301-2400 1.218 1.264 1.310 240-2500 1.226 1.270 1.316 2501-2600 1.232 1.276 1.320 2601-2700 1.238 1.282 1.326 2701-2800 1.244 1.288 1.330 2801-2900 1.250 1.292 1.336 2901-3000 1.254 1.298 1.340 3001-3100 1.260 1.302 1.342 3101-3200 1.266 1.308 1.350 3201-3300 1.270 1.312 1.354 3301-3400 1.274 1.316 1.358 3401-3500 1.280 1.320 1.362 3501-3600 1.284 1.326 1.366 3601-3700 1.288 1.330 1.370 3701-3800 1.292 1.334 1.374 3801-3900 1.296 1.338 1.378 3901-4000 1.300 1.340 1.382 400-4100 1.304 1.344 1.384 4101-4200 1.308 1.348 1.388 4201-4300 1.312 1.352 1.392 4301-4400 1.316 1.356 1.394 4401-4500 1.320 1.358 1.398 4501-4600 1.322 1.362 1.400 4601-4700 1.326 1.366 1.404 4701-4800 1.330 1.368 1.408 4801-4900 1.332 1.372 1.410 4901-5000 1.336 1.374 1.412
138
which carries 35-40% of the combined ventricular output, is similar in diameter to the descending
aorta, which is presumed to carry about 70% of the combined ventricular output.” We found that,
in human fetuses, the inner circumference of the ascending aorta at a point 0.5 cm anterior to the branchiocephalic arterial trunk orifice (P,,) was consistently larger than the inner circumference of
the thoracic (descending) aorta at a point 1 cm distal to the anastomosis of the arterial duct (P,) throughout fetal development. The inner cir-
cumference of the ascending aorta at a point 0.5 cm anterior to the branchiocephalic arterial trunk
orifice measured 1.136 cm in fetuses ranging in
body weight from 101-200 g, and 1.916 cm in
fetuses weighing 4901-5000 g, while the inner circumference of the descending aorta at a point 1
cm distal to the anastomosis of the arterial duct was 1.078 cm in fetuses weighing 101-200 g in
body weight, and 1.854 cm in fetuses of 2901-5000
g in body weight. We believe that data from animal models, such
as the fetal lamb, should be used with caution when attempting to extrapolate such findings to
human material. The concepts and methods described in the
present study, although they will need to be corre-
lated with data obtained with echocardiographic studies, have immediate clinical and surgical ap- plications, as well as opening new avenues to
morphological and functional research.
Acknowledgement
We thank Ms. Karen Shashok for translating the original manuscript into English.
References
Anderson RH, Becker AE. Cardiac anatomy. An integrated
text and colour atlas. London: Gower Medical Publishing,
1980;10.2-10.3.
Yousefzadeh DK, Chow KC, Franken EA. The aortic
isthmus. Radiology 1981;140:710-703. Clarkson P, Brandt PWT. Aortic diameters in infant and
young children: normative angiographic data. Pediat
Cardiol 1985;6:3-6.
Sievers H, Onmasch DGW, Lange PE, Bernhard A, Heint-
zen PH. Dimensions of the great arteries, semilunar valve
roots, and right ventricular outflow tract during growth:
5
6
7
8
9
10
11
12
13
14
15
16
17
18
19
20
21
22
23
normative angiocardiographic data. Pediat Cardiol 1983;4:
189-196.
Santos MA, Moll JN, Drummond C, Araujo WB, Romao
N, Reis NB. Development of the ductus arteriosus in right
ventricular outflow tract obstruction. Circulation 1980;62:818-822.
Lapasset M, De Geeter B, Renalud R. Echographic
quantitative du coeur foetal. Arch Ma1 Coeur 1985;5:627-
631.
Allan LD, Tynan MJ, Campbell S, Wilkinson JL, Anderson
RH. Echocardiographic and anatomical correlates in the
fetus. Br Heart J 1980;44:44-451.
Snider AR, Enderlein MA, Teitel DF, Juster RP. Two
dimensional echocardiographic determination of aortic and
pulmonary artery sizes from infancy to adulthood in nor-
mal subjects. Am J Cardiol 1984:53:218-224.
Epstein ML, Goldberg SJ, Allen HD, Konecke L. Wood J.
Great vessel, cardiac chamber, and wall growth patterns in
normal children. Circulation 1975;51:1124-1129.
Francis GS, Hagan AD, Oury J, O’Rourke RA. Accuracy
of echocardiography for assessing aortic root diameter. Br
Heart J 1974;37:376-378.
Nanda NC. Echocardiography of the aortic root. Am J
Med 1977;62:836-842.
Walter LH, Gardin JM, Ware J. Echocardiographic mea-
surements in normal subjects from infancy to old age.
Circulation 1980;62:1054-1061.
Van Meurs-Van Woezik H, Klein HW, Krediet P. Normal
internal calibres of ostia of great arteries and of aortic
isthmus in infants and children. Br Heart J 1977;39:86-865.
Van Meurs-Van Woezik H, Klein HW. Calibres of aorta
and pulmonary artery in hypoplastic left and right heart
syndromes: effects of abnormal blood flow? Virchows Arch
A 1974;364:357-364.
Van Meurs-Van Woezik H, Krediet P. Measurements of the
descending aorta in infants and children: Comparison with
other aortic dimensions. J Anat 1982;135:273-279.
Van Meurs-Van Woezik H. Krediet P. Changes after birth
in the tunica media and in internal diameter of the aortic
isthmus in normal newborns. J Anat 1982;134:573-581.
Toda T, Tsuda N, Takagi T, Nishimori I, Leszczynski D.
Kummerow F. Ultrastructure of developing human ductus
arteriosus. J Anat 1980:131:25-37.
Domenech JM, Puerta J. La region de1 istmo abrtica en el
period0 fetal. Rev Esp Cardiol 1976;29:173-178.
Wright NL. Dissection study and mensuration of the hu-
man aortic arch. J Anat 1969;104:377-385.
DeVore G, Sialli B, Platt L. M-mode measurements of the aortic root and aortic valve in second- and third-trimester normal human fetuses. Am J Obstet Gynecol 1985;July 1:543-550.
Shime J, Gresser RN, Rakowski H. Quantitative two-di-
mensional echocardiographic assessment of fetal cardiac
growth. Am J Obstet Gynecol 1986;154:294-300.
Heyman MA, Rudolph AM. Control of the ductus arterio-
sus. Physiol Rev 1975;55:62.
Rakusan K, Jelinek J, Korecky B, Soukupora M, Poupa 0. Postnatal development of muscle fibers and capillaries in
the rat heart. Physiol Bohemoslov 1965;14:32-37.

139
24 Long WA, Tooleg W. McNamara D. Fetal and neonatal
cardiology. London: WB Saunders. Harcourt Brace
Jovanovich, 1990;3-16.
25 St John Sutton MG. Gweitz MH, Shah B, et al. Quantita-
tive assessment of growth and function of the cardiac
chambers in the normal human fetus: a prospective longitu-
dinal echocardiographic study. Circulation 1984:69:645-
654.
26 Angelini A. Allan LD. Anderson RH. Crawford DC, Chita
DK. Yen Ho S. Measurements of the dimensions of the
aortic and pulmonary pathways in the human fetus: a
correlative echocardiographic and morphometric study. Br
Heart J 1988;60:221-226.
27 Rudolph AM. Heyman MA. Teramo KAW. Barret CT,
Raiha NCR. Studies on the circulation of the prviable
human fetus. Pediatr Res 1971:5:452-465.
28 Rudolph AM. Heyman MA. Spitnas U. Hemodynamic
considerations in the development of the narrowing of the
aorta. Am J Cardiol 1972;30:514-525.
29 Rudolph AM. Distribution and regulation of blood flow in
the fetal and neonatal lamb. Circulation 1985:57:811-X21.


