Embed Size (px)
Citation preview
1928 F. S. Segura et al.
Copyright © 2007 John Wiley & Sons, Ltd. Earth Surf. Process. Landforms 32, 1928–1946 (2007)DOI: 10.1002/esp
Earth Surface Processes and LandformsEarth Surf. Process. Landforms 32, 1928–1946 (2007)Published online 11 April 2007 in Wiley InterScience(www.interscience.wiley.com) DOI: 10.1002/esp.1506
Morphometric indices as indicators of tectonic,fluvial and karst processes in calcareous drainagebasins, South Menorca Island, SpainFrancesca S. Segura,1* Josep E. Pardo-Pascual,2 Vicenç M. Rosselló,1 Joan J. Fornós3 andBernadí Gelabert3
1 Department of Geography, Universitat de València, València, Spain2 Department of Cartographic Engineering, Geodesy and Photogrammetry, Universitat Politècnica de València, València, Spain3 Department of Earth Sciences, Universitat de les Illes Balears, Palma de Mallorca, Balearic Islands, Spain
AbstractThis study proposes using morphometric indices to discriminate the processes that shapecalcareous drainage basins. To illustrate this, a DEM of the southern part of Menorca Island(Migjorn) was created and basin slope, drainage density, hypsometric curve and integral,and the area occupied by open and closed dolines were extracted from it. These indices showan important dependence on tectonics, which govern the morphology of these drainagebasins and encourage the predominance of karst and/or fluvial processes in the differentsectors. The morphometric indices are clearly influenced by the geological Migjorn struc-ture, a carbonate Upper Miocene reef platform gently folded as an asymmetrical anticline.The hypsometric integral and curve discriminate the influence of tectonics and structurewhilst the drainage density and the proportion of open dolines are associated with basinswith more pronounced fluvial processes. A cluster analysis based on these indices discrimi-nated three sectors where different forms and processes are found. In the western andeastern sectors, rounded basins without major fractures predominate. The basins slope atless than 5°, and karst processes outweigh fluvial processes. The central sector, however, hassteeper slopes, a clearly defined drainage system, and a predominance of fluvial over karstprocesses. Greater uplift in this sector has facilitated the formation of elongated basins thatfollow the main fracture lines. Copyright © 2007 John Wiley & Sons, Ltd.
Keywords: morphometric indices; drainage basin processes; tectonics; geomorphometry;DEM
*Correspondence to:Dr. Francesca S. Segura,Department of Geography,Universitat de València,Avenida Blasco Ibáñez 28,46010 València, Spain.E-mail: [email protected]
Received 6 July 2006;Revised 10 January 2007;Accepted 29 January 2007
Introduction
The processes involved in landscape evolution can be difficult to detect and quantify. Since drainage basins are shapedby tectonic and erosional processes, the purpose of this study is to demonstrate the potential use of morphometricparameters extracted from DEMs to determine the relative importance of these processes. The study area is the southof Menorca Island, a carbonate Upper Miocene reef platform (Migjorn), which shows varied geomorphologicalevolution despite lithologic and climatic homogeneity. The lithologic and climatic uniformity of the Migjorn areaallows exclusion of these variables, facilitating the interpretation of the role other factors have had in shaping the riverbasins. Geomorphological photointerpretation (Rosselló, 2004), field work (Rosselló et al., 2004) and the morphometricanalysis of the entire area (Pardo and Porres, 2004), as well as sediment analyses of quaternary deposits of the ravines(Fornós and Segura, 2004) and wetlands (Segura et al., 1999; Pardo, 2003), have shown that there is an irregulardistribution of the tectonic, karst and fluvial processes in the study area. Until recently it has been difficult to establishchronological and causal relationships between these processes, as well as their relative degrees of significance for thedifferent drainage basins.
Morphometric indices as indicators of tectonic, fluvial and karst processes 1929
Copyright © 2007 John Wiley & Sons, Ltd. Earth Surf. Process. Landforms 32, 1928–1946 (2007)DOI: 10.1002/esp
In our recent research (Gelabert et al., 2005) we found that the higher elevation of the carbonate platform is afundamental element for the configuration of the Migjorn relief, as deduced from the orientation of the fractures andthe distribution of the fluvial network. To confirm this, we performed a geomorphological characterization based onbasin measurements that were statistically tested. The purpose was to objectively assess the importance of tectonics,karst and fluvial activity, as well as their interdependence. Consequently, a series of morphometric indices (slope,drainage density, hypsometric integral and curve, and percentage of closed and open dolines) were analysed to explainthe irregular distribution of fluvial, karst and tectonic processes detected in the study area. The first three morphometricindices were used to explain the formation of the drainage network and the degree of basin evolution; the latter twowere introduced to characterize the karst. The presence of tectonics can be deduced from most of the indices used.
Drainage density reflects the factors governing dissection of the basins. Numerous studies relate this index toclimate, vegetation (Gregory and Gardiner, 1975; Schumm, 1997) and lithology (Schumm, 1997; Tucker et al., 2001).More interesting for our work are the studies that show that drainage density is sensitive to slope. Some studiessuggest drainage density is higher on steep slopes with a predominance of overland flow (Dietrich et al., 1992, 1993;Montgomery and Dietrich, 1994). Other authors, however, have found a negative relation between slope and drainagedensity (Oguchi, 1997; Howard, 1997; Tucker and Bras, 1998). On a surface affected by progressive tilting, Tallingand Sowter (1999) conclude that drainage systems start to develop with slopes varying from 4·8 to 10° and thatdrainage density correlates positively with slope angle if overland flow is dominant, but negatively if shallow masswasting is dominant. Howard (1997) indicated that the drainage density and slope angle are negatively correlated inquickly eroding areas, whereas the opposite occurs in areas of slow erosion. Lin and Oguchi (2004) more recentlycontradict some of the above assertions, concluding that the relation between drainage density and slope does notdepend on the type of erosion but instead on the stage of channelization of the basin. This relation is positive if themain channel has a high degree of channelization and depends on the extension and integration of pre-existingchannels, as well as on the formation of low-order streams in response to base-level lowering.
The hypsometric integral and curve are non-dimensional measurements of the proportion of the basin that is locatedat a determined elevation. These parameters have been used to infer the stage of geomorphic development and tostudy the varying factors that influence basin topography (tectonics, lithology, climate). Thus, Schumm (1956) estab-lished a relation between hypsometry and the age of the basin, later corroborated by Strahler (1964), who classifiedthe basins as young or mature, depending on the decreasing value of the hypsometric integral. Willgoose and Hancock(1998) used a mathematical model to show that the hypsometric curve depends on the drainage network, the landscaperunoff processes and the basin’s geometry. Drainage basins dominated by fluvial sediment transport have a maturehypsometric curve only if they have equal width and length. By contrast, elongated basins produce hypsometric curvessimilar to Strahler’s monadnock form. Catchments dominated by diffuse transport show concave-downward hypsometriccurves. Lifton and Chase (1992) found that tectonic activity was strongly related to the hypsometric integral at broadscales (1000 km2), whilst a relation between tectonic activity and lithology was established in small basins (100 km2).Based on a mathematical model, they also deduced that the hypsometric integral would be positively correlated withuplift rate. Hurtrez et al. (1999), working in the French Central Massif, affirm that, tectonic context being the same,lithology is the prevailing variable controlling the shape of the hypsometric curve.
Study Area
Menorca Island, located in the Balearic archipelago (Figure 1), has a Mediterranean climate, with annual mean rainfallbetween 550 and 650 mm, but distributed unevenly (43% in Autumn, 31% in Winter, 20% in Spring and 6% inSummer). Rainfall is higher in the central, most elevated, part of the island and is lower in the South and on the coast.The annual mean temperature is between 16·5 and 17 °C, being slightly warmer on the eastern and southern sides(Pons and Gómez-Pujol, 2003).
Geologically and morphologically Menorca is divided into two parts (Figure 1): (a) the Migjorn (southern area),constituted by nearly horizontal Upper Miocene calcarenites and limestones, and (b) the Tramuntana (northern area),characterized by folded and faulted shales and sandstones of Paleozoic, Mesozoic and Oligocene age. The dominantstructure of these two morpho-structural units is a major normal fault, Upper Miocene in age, dipping SSW and withESE–WNW orientation. Tramuntana is the highest area of the island (the maximum altitude is El Toro, 361 m), andit forms the uplifted block. Tramuntana presents a wide lithological variety: it is made up of Paleozoic siliciclasticturbidites, Mesozoic sandstones, marls, micritic limestones and dolomites as well as a few outcrops of Oligoceneconglomerates. The Devonian, Carboniferous, Permian and Keuper materials have low permeability, whereas theMuschelkalk, Jurassic and Cretaceous limestones and dolomites have greater permeability (Bourrouilh, 1983; ITGE,1989).
1930 F. S. Segura et al.
Copyright © 2007 John Wiley & Sons, Ltd. Earth Surf. Process. Landforms 32, 1928–1946 (2007)DOI: 10.1002/esp
Figure 1. Location and geological map of Menorca Island.
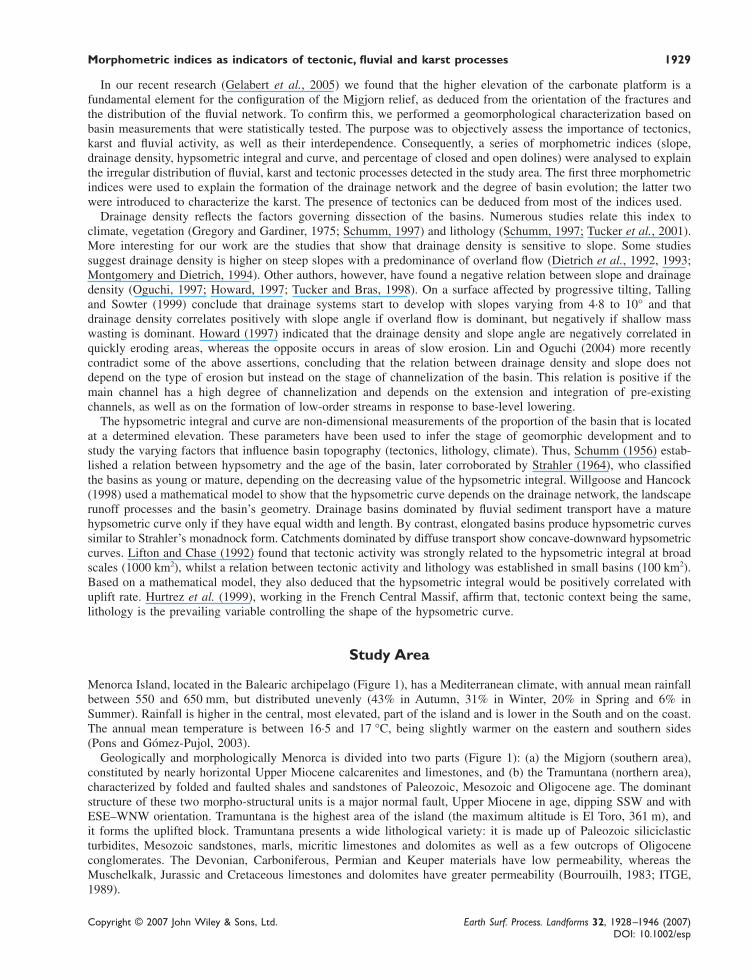
The downfaulted block is the Migjorn, a rugged platform incised by numerous streams. The Migjorn is lithologicallyuniform and is composed of Upper Miocene carbonate rocks ranging in age from Lower Tortonian to Lower Messinian.The deposition of the Upper Miocene sediments in the Migjorn was partly controlled by a normal NNE–SSWkilometric fault at Tramuntana (Figure 1). This fault was subsequently reactivated as a thrust, probably during Pliocenetimes, giving rise to a wide, gentle and asymmetrical anticline, which constitutes the most characteristic structuralfeature of the Migjorn (Figure 1). This anticline is post-Messinian in age and pre-Quaternary, since Quaternarysediments remain undeformed (Gelabert et al., 2005). The axis orientation of this anticline is NNE–SSW, parallel tothe above mentioned fault in Tramuntana (Figure 1). The crest of this gentle fold corresponds to the highest altitudesof the Migjorn. No active faults have been detected in Menorca; in fact, Menorca has no historical seismicity and inthe northern part of the Balearic Promontory seismicity is very low (Gelabert et al., 2005).
Morphometric indices as indicators of tectonic, fluvial and karst processes 1931
Copyright © 2007 John Wiley & Sons, Ltd. Earth Surf. Process. Landforms 32, 1928–1946 (2007)DOI: 10.1002/esp
Drainage Basin Geomorphology and Hydrology
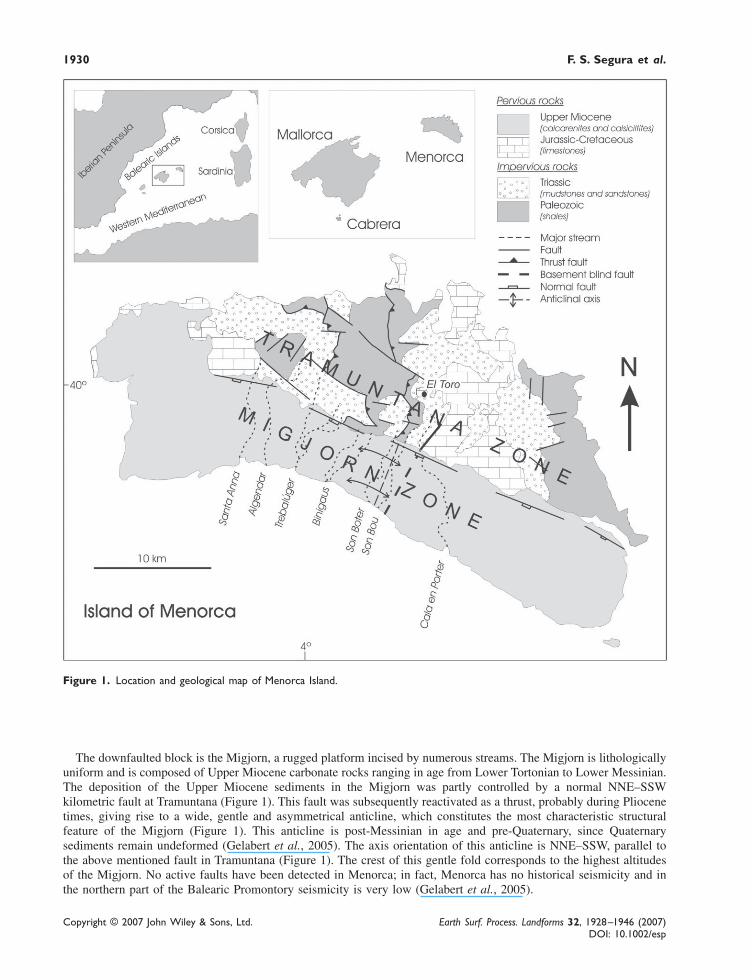
Since most basins do not have well defined channels (Segura et al., 2004), the Migjorn drainage system is not verywell developed. On the western and eastern sides, hierarchical networks alternate with discontinuous channels.Geomorphological analysis (Rosselló, 2004) shows the presence of an important exokarst (Figure 2) with numerousdolines, poljes and shafts (Ginés and Fornós, 2004), as well as numerous endokarst forms (Trías, 2004). Only thecentral sector (between basins 44 and 57) shows a well developed system of meandering valleys. These are powerfulfluvio-karst canyons over 100 m deep formed by the integration of karst features connected by fluvial streams (Seguraet al., 2004). The longitudinal profile of these streams reflects the lowering of base-level (probably related to theisotopic stage 2), and the Flandrian transgression that filled the stream mouths, giving rise to calas (small guardedbeaches) (Rosselló, 2004; Fornós and Segura, 2004; Fornós, 2004).
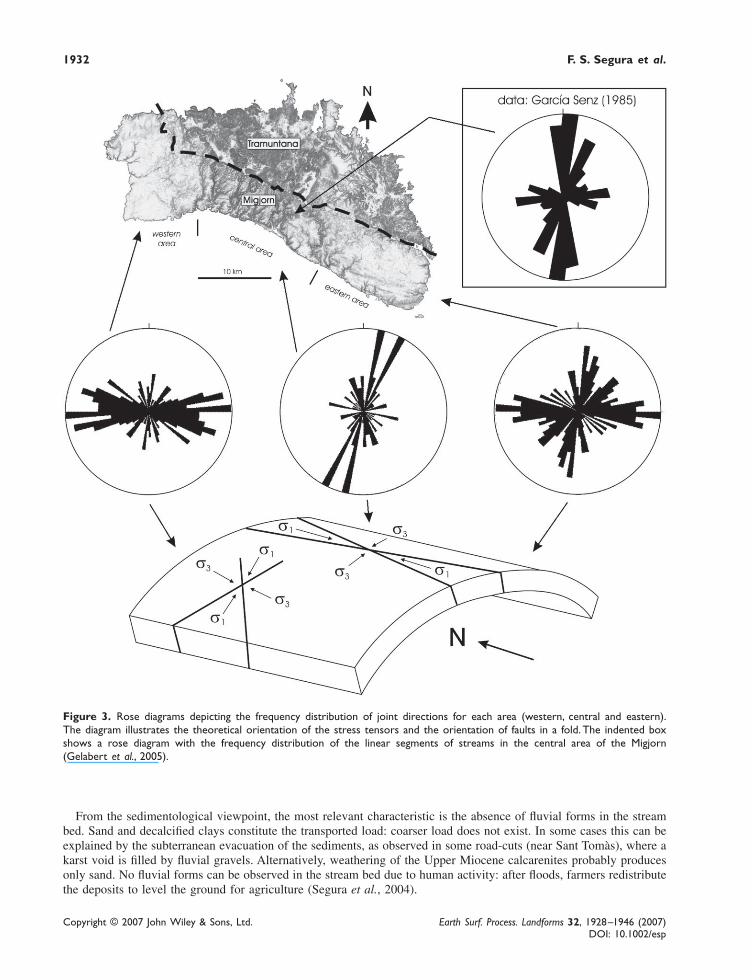
The direction of the drainage networks changes along the Migjorn and is clearly influenced by tectonics. The set ofjoints affecting the Upper Miocene carbonate rocks is the characteristic fault association developed during the genera-tion of an anticline (Gelabert et al., 2005). The strong relation between the orientation of the linear segments of thestreams and the prevalent direction of the fractures (Figure 3) demonstrates the control that the fractures and jointshave on the path of the streams (Gelabert et al., 2005).
Hydrologically, the streams are ephemeral and only the bigger streams (basins 45 and 47) of the central sector havecontinuous discharge near the mouths. The flows result largely from the discharge of Migjorn karst aquifers (Gelabertet al., 2004). It is also important to point out that some main streams of the central sector extend outside the Migjorn,their headwaters being located in the more impervious materials of Tramuntana.
Figure 2. Distribution of closed and open dolines in the Menorca Migjorn, based on geomorphological map of Rosselló et al.(2004). Numbers indicate the drainage basin. This figure is available in colour online at www.interscience.wiley.com/journal/espl
1932 F. S. Segura et al.
Copyright © 2007 John Wiley & Sons, Ltd. Earth Surf. Process. Landforms 32, 1928–1946 (2007)DOI: 10.1002/esp
Figure 3. Rose diagrams depicting the frequency distribution of joint directions for each area (western, central and eastern).The diagram illustrates the theoretical orientation of the stress tensors and the orientation of faults in a fold. The indented boxshows a rose diagram with the frequency distribution of the linear segments of streams in the central area of the Migjorn(Gelabert et al., 2005).
From the sedimentological viewpoint, the most relevant characteristic is the absence of fluvial forms in the streambed. Sand and decalcified clays constitute the transported load: coarser load does not exist. In some cases this can beexplained by the subterranean evacuation of the sediments, as observed in some road-cuts (near Sant Tomàs), where akarst void is filled by fluvial gravels. Alternatively, weathering of the Upper Miocene calcarenites probably producesonly sand. No fluvial forms can be observed in the stream bed due to human activity: after floods, farmers redistributethe deposits to level the ground for agriculture (Segura et al., 2004).
Morphometric indices as indicators of tectonic, fluvial and karst processes 1933
Copyright © 2007 John Wiley & Sons, Ltd. Earth Surf. Process. Landforms 32, 1928–1946 (2007)DOI: 10.1002/esp
Method
Parameter CalculationA digital elevation model (DEM) was compiled from the 113 topographic maps of the island at a scale of 1:5000. TheDEM was generated from 5 m contour lines, spot heights (with an approximate density of 80 points/km2) and the mainbreaklines (drainage channels and shoreline) using the Terrain Analyst module of ArcView®3·2. The partial elevationmodels in TIN format were transformed into a raster 10 m and combined to make a continuous DEM. A slope mapand automatic extraction of the drainage network were obtained using GIS tools (ArcView®3·2). To obtain the net-work, it is necessary to ensure hydraulic connection at the different channels; the algorithm of Jenson and Domingue(1988) was used to eliminate depressions in the DEM. A flow direction map was calculated based on the maximum-slope analysis, using the D8 algorithm (O’Callaghan and Mark, 1984). Based on the flow direction model, a minimumaccumulation area threshold (200 pixels) was established, with all pixels above this threshold considered to be channels.
In the case of the Menorca Migjorn the resulting drainage network does not correspond to the real stream network– especially in the eastern and western ends of the island – for two reasons: first, the extraction method has obviouslimitations associated with the use of a single threshold to determine channel initiation (Maestro et al., 2003); second,they are in a karst zone and real land depressions are not considered. Therefore, it was considered more appropriate touse a drainage system deduced from the photointerpretation and represented in a geomorphological map at a scale of1:50 000 (Rosselló et al., 2004).
After defining the drainage network, the contributing drainage area of every cell was computed and the catchmentswere defined and numbered to facilitate analysis (Figure 4). A series of geometric parameters (area, perimeter, slope)and morphometric parameters (drainage density, hypsometric integral) were then obtained for each basin (Table I).The spatial location of the basin is another important factor taken into consideration. Thus, the centroid of each basinand its XY position in the UTM projection were obtained. Since the greatest geographic variance of the study area isfound in the E–W direction, the X coordinate of the centroid was used to locate the different variables shown in thegraphs.
Other interesting geomorphological features in the Migjorn are the exokarst forms, particularly the partially openand closed dolines. Indeed, considering the geomorphological map of Rosselló et al. (2004), more than 300 closeddolines are differentiated and more than 500 are captured by the river system. To perform a quantitative analysis oftheir relation to the rest of the parameters, the percentage of area occupied by the dolines in each basin was calculated.Using a GIS tool, the lines defining open dolines were closed, forming polygons, then the same operations used withthe closed dolines were applied.
Selection of basinsAlthough the first database includes all basins on Menorca, we worked only with the calcareous platform of the island.This sector has 35 basins, all of them on Upper Miocene limestones, although eight extend into the Tramuntana sector,which has a more varied lithology and age. All basins are small (less than 50 km2) but vary in size. In preliminaryresearch much scatter in the data was observed, probably as a result of variability in lithology and scale betweenbasins. To explore this issue the same analysis was repeated with three different data sets:
(a) all of the Migjorn basins(b) Migjorn basins restricted to the calcareous platform. this cut affects basins 44, 45, 47, 49, 50, 52, 53, 57,
58 and 4(c) those basins restricted to the calcareous Migjorn that are larger than 2·5 km2.
Description
Dd was measured as length of stream channel per unit areaof drainage basin
The hypsometric curve represents the relative proportion of a basinarea that lies below a given height. The hypsometric integralrepresents the area under the hypsometric curve
Table I. Definition of morphometric parameters
Morphometric parameter
Drainage density
Hypsometric integral
Formula
Dd LA =
Inthyp
alt altalt alt
. min
max min
—
= −−
1934 F. S. Segura et al.
Copyright © 2007 John Wiley & Sons, Ltd. Earth Surf. Process. Landforms 32, 1928–1946 (2007)DOI: 10.1002/esp
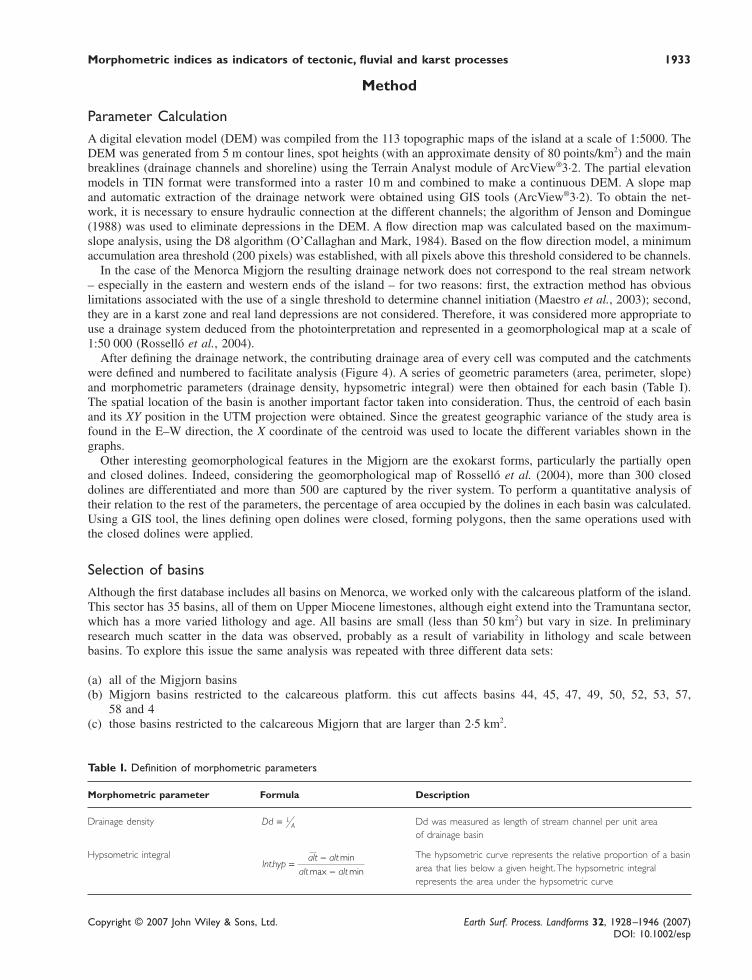
Figure 4. Drainage basin areas (case a) of Menorca island expressed in hectares. The numbers identify each basin. This figure isavailable in colour online at www.interscience.wiley.com/journal/espl
The first case includes even the smallest basins or those that have varied lithology at their headwaters. In the secondcase, restricting to only the limestone sector of the basins eliminates the lithological factor. In the third case, thesmallest basins are also eliminated (Table II).
Results and Interpretations
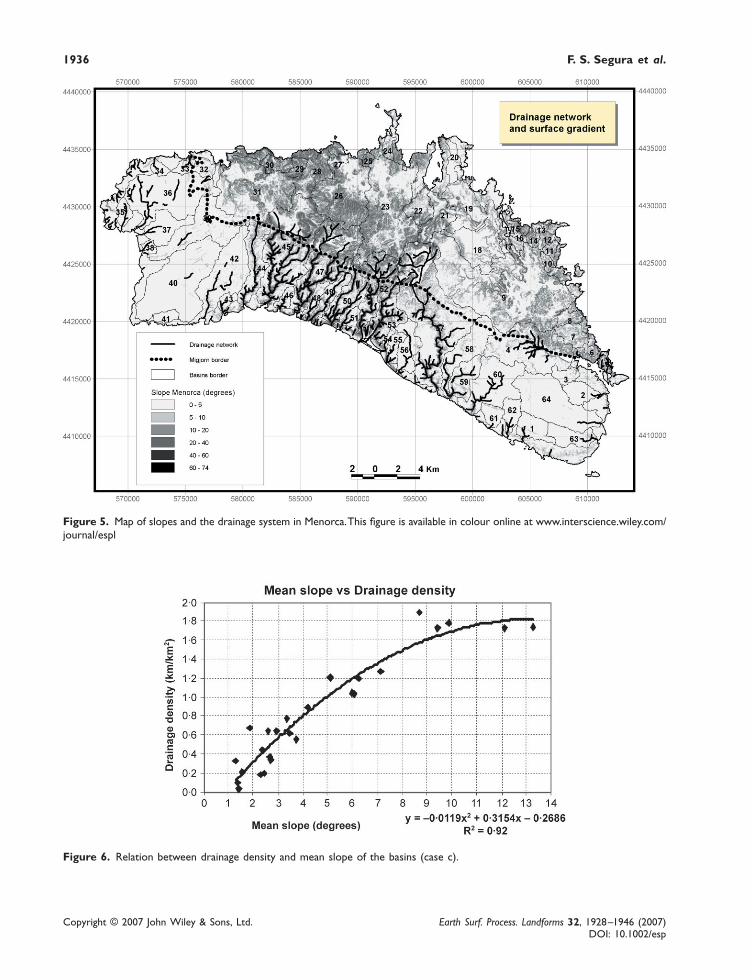
Basin drainage area and slope gradientThe Menorca drainage basins are very diverse (Figure 4), but are generally small. The smallest basins – many of themless than 2·5 km2 – form a fringe around the island and contain small, poorly incised streams sometimes located oncoastal cliffs. Of the 35 Migjorn basins analysed, the largest (basin 57) is 45 km2 and the steepest slopes are found inthe central part of the island (Figure 5).
Drainage density and surface gradientOne of the main peculiarities of the area studied is that its drainage system is discontinuous in some areas butcontinuous in others. In order to explain this distribution, the relation to the slope of the basins was analysed. Theslope and drainage system map (Figure 5) suggests that drainage develops when the slope exceeds 5°, a value verysimilar to that found by Talling and Sowter (1999). These authors suggest that slope and drainage density arepositively correlated if overland flow predominates, but are negatively correlated if there is a predominance of shallowmass wasting. To confirm the applicability of these assertions in the Migjorn area of Menorca we analysed relationsbetween drainage density, slope, exokarst forms and geographic position.
Morphometric indices as indicators of tectonic, fluvial and karst processes 1935
Copyright © 2007 John Wiley & Sons, Ltd. Earth Surf. Process. Landforms 32, 1928–1946 (2007)DOI: 10.1002/esp
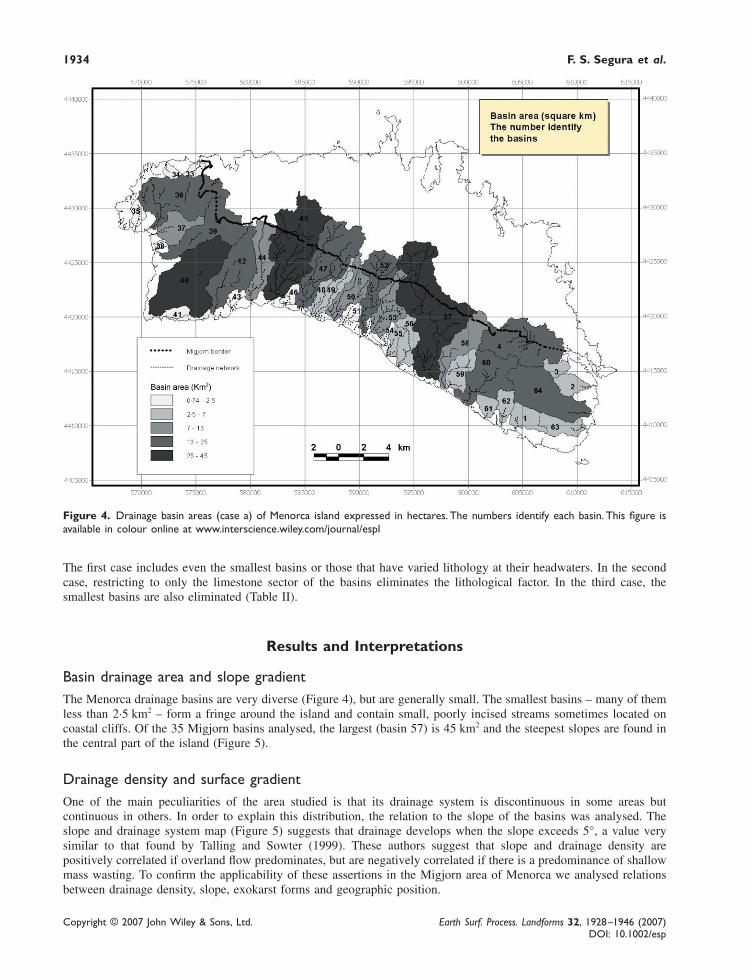
Consistent with the findings of other studies (Dietrich et al., 1992; Montgomery and Dietrich, 1994), drainagedensity presents a positive correlation with the mean slope of the basins. Figure 6 shows this relation for basinsexceeding 2·5 km2 (case c). The correlation is excellent, suggesting that mean slope might be the core factor explain-ing the drainage density of larger basins (more than 2·5 km2) with homogeneous lithology. On the other hand, therelation is poorer for the other cases (Table III). Basins smaller than 2·5 km2 have strongly distorted this correlation.
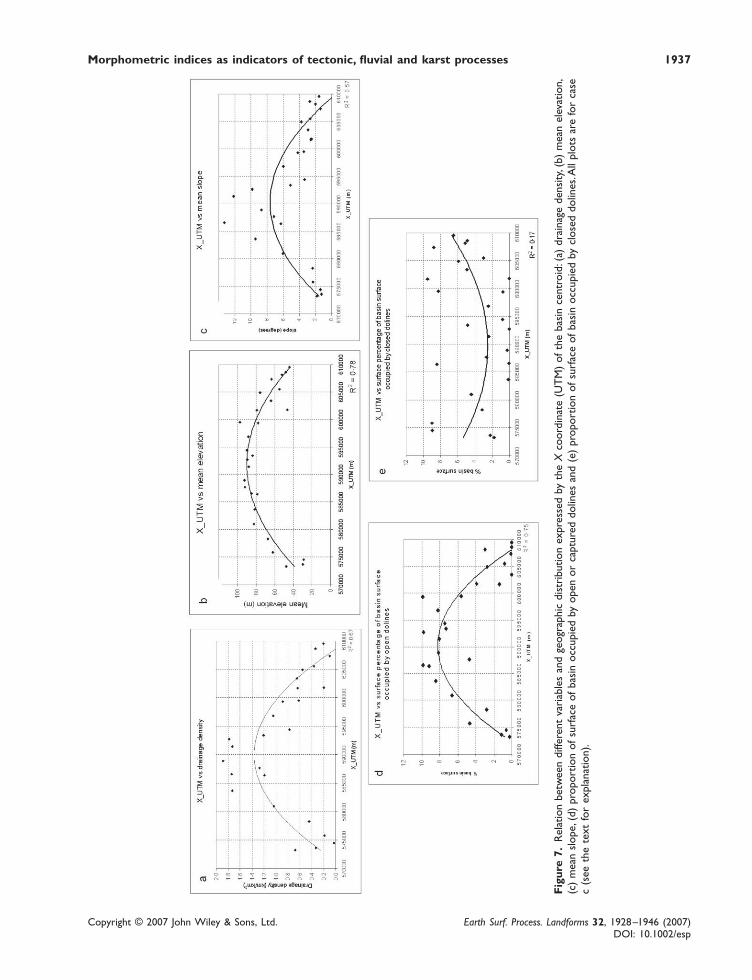
Spatial variation of drainage densityThe spatial distribution of drainage density is irregular. Figure 7 shows the correlation between the centroid Xcoordinate and different variables (case c). Second order polynomials have been used and their coefficients of determi-nation – r2 – appear in the figure. In all of the cases analysed, the p-values of the parameters of the adjusted functions
Table II. Values of the different parameters for each of the cases analysed
% surface % surfacebasin basin
Surface occupied occupiedBasin basin X_UTM Hypsometric Drainage density (Dd) Mean slope by closed by opennumber (km2) (m) integral (HI) (km/km2) (degrees) dolines dolines
case a case b case c case a case b cases c case a case b case c case c case c
35 2·29 569 710 0·39 0·39 – 1·46 1·46 – 2·60 2·60 – – –38 0·74 571 797 0·73 0·73 – 1·40 1·40 – 1·07 1·07 – – –34 1·55 572 863 0·76 0·76 – 0·75 0·75 – 2·27 2·26 – – –36 21·81 573 242 0·44 0·42 0·42 0·66 0·68 0·68 1·99 1·87 1·87 1·77 2·0041 1·88 573 291 0·46 0·46 – 0·00 0·00 – 0·82 0·83 – – –37 7·17 573 609 0·44 0·44 0·44 0·33 0·33 0·33 1·29 1·29 1·29 2·24 3·3740 30·19 574 460 0·26 0·26 0·26 0·03 0·03 0·03 1·41 1·41 1·41 8·95 9·5733 1·78 574 862 0·67 0·67 – 1·00 1·00 – 4·44 5·00 – – –39 13·99 575 795 0·50 0·47 0·47 0·17 0·18 0·18 2·31 2·29 2·29 8·96 13·6142 17·56 578 255 0·49 0·49 0·49 0·44 0·44 0·44 2·37 2·37 2·37 3·16 5·9543 1·67 578 685 0·73 0·73 – 0·98 0·98 – 2·55 2·55 – – –44 10·33 580 975 0·53 0·55 0·55 1·01 1·03 1·03 6·10 6·06 6·06 4·42 11·0446 1·96 583 602 0·61 0·61 – 1·22 1·22 – 6·08 6·07 – – –45 19·22 583 639 0·32 0·52 0·52 1·23 1·73 1·73 10·34 9·44 9·44 0·12 8·5648 2·56 586 385 0·69 0·69 0·69 1·19 1·19 1·19 6·27 6·26 6·26 8·40 17·6047 11·83 586 557 0·37 0·54 0·54 1·31 1·74 1·74 12·64 13·28 13·28 0·04 9·8649 4·79 587 691 0·50 0·62 0·62 1·20 1·27 1·27 7·34 7·13 7·13 2·63 7·3650 8·36 588 932 0·44 0·62 0·62 1·76 1·89 1·89 9·07 8·70 8·70 0·27 8·4151 2·45 589 308 0·63 0·63 – 1·20 1·20 – 5·70 5·69 – – –52 6·73 591 417 0·43 0·61 0·61 1·62 1·73 1·73 12·12 12·14 12·14 2·37 10·4454 0·90 592 660 0·70 0·70 – 1·34 1·34 – 4·79 4·77 – – –53 9·10 592 701 0·54 0·65 0·65 1·77 1·78 1·78 9·73 9·87 9·87 0·00 9·8055 2·65 593 412 0·64 0·64 0·64 1·21 1·21 1·21 5·11 5·11 5·11 4·84 12·1556 6·68 594 401 0·58 0·58 0·58 0·78 0·78 0·78 3·35 3·35 3·35 0·80 8·2257 28·95 596 826 0·31 0·61 0·61 0·95 1·05 1·05 6·30 5·98 5·98 2·43 10·6159 6·62 599 350 0·60 0·60 0·60 0·88 0·89 0·89 4·19 4·20 4·20 0·75 10·6458 10·27 599 510 0·71 0·68 0·68 0·55 0·62 0·62 3·41 3·47 3·47 8·24 13·8560 16·29 601 681 0·62 0·62 0·62 0·64 0·64 0·64 2·58 2·58 2·58 9·50 10·8761 2·89 601 760 0·53 0·53 0·53 0·20 0·20 0·20 2·44 2·45 2·45 0·00 3·9162 3·69 603 431 0·71 0·71 0·71 0·65 0·65 0·65 2·92 2·92 2·92 4·94 4·944 14·96 604 918 0·46 0·54 0·54 0·54 0·55 0·55 5·46 3·72 3·72 5·93 8·661 5·53 605 529 0·63 0·63 0·63 0·36 0·36 0·36 2·67 2·67 2·67 3·01 3·80
64 21·34 607 330 0·63 0·63 0·63 0·10 0·10 0·10 1·40 1·39 1·39 8·78 8·863 2·63 608 121 0·85 0·85 0·85 0·00 0·00 0·00 2·04 2·04 2·04 5·15 8·13
63 5·72 608 627 0·63 0·63 0·63 0·34 0·34 0·34 2·68 2·69 2·69 4·89 4·892 4·40 609 504 0·68 0·68 0·68 0·20 0·20 0·20 1·56 1·56 1·56 6·50 6·50
1936 F. S. Segura et al.
Copyright © 2007 John Wiley & Sons, Ltd. Earth Surf. Process. Landforms 32, 1928–1946 (2007)DOI: 10.1002/esp
Figure 5. Map of slopes and the drainage system in Menorca. This figure is available in colour online at www.interscience.wiley.com/journal/espl
Figure 6. Relation between drainage density and mean slope of the basins (case c).
Morphometric indices as indicators of tectonic, fluvial and karst processes 1937
Copyright © 2007 John Wiley & Sons, Ltd. Earth Surf. Process. Landforms 32, 1928–1946 (2007)DOI: 10.1002/esp
Fig
ure
7.R
elat
ion
betw
een
diffe
rent
var
iabl
es a
nd g
eogr
aphi
c di
stri
butio
n ex
pres
sed
by t
he X
coo
rdin
ate
(UT
M)
of t
he b
asin
cen
troi
d: (
a) d
rain
age
dens
ity, (
b) m
ean
elev
atio
n,(c
) m
ean
slop
e, (
d) p
ropo
rtio
n of
sur
face
of b
asin
occ
upie
d by
ope
n or
cap
ture
d do
lines
and
(e)
pro
port
ion
of s
urfa
ce o
f bas
in o
ccup
ied
by c
lose
d do
lines
. All
plot
s ar
e fo
r ca
sec
(see
the
tex
t fo
r ex
plan
atio
n).
1938 F. S. Segura et al.
Copyright © 2007 John Wiley & Sons, Ltd. Earth Surf. Process. Landforms 32, 1928–1946 (2007)DOI: 10.1002/esp
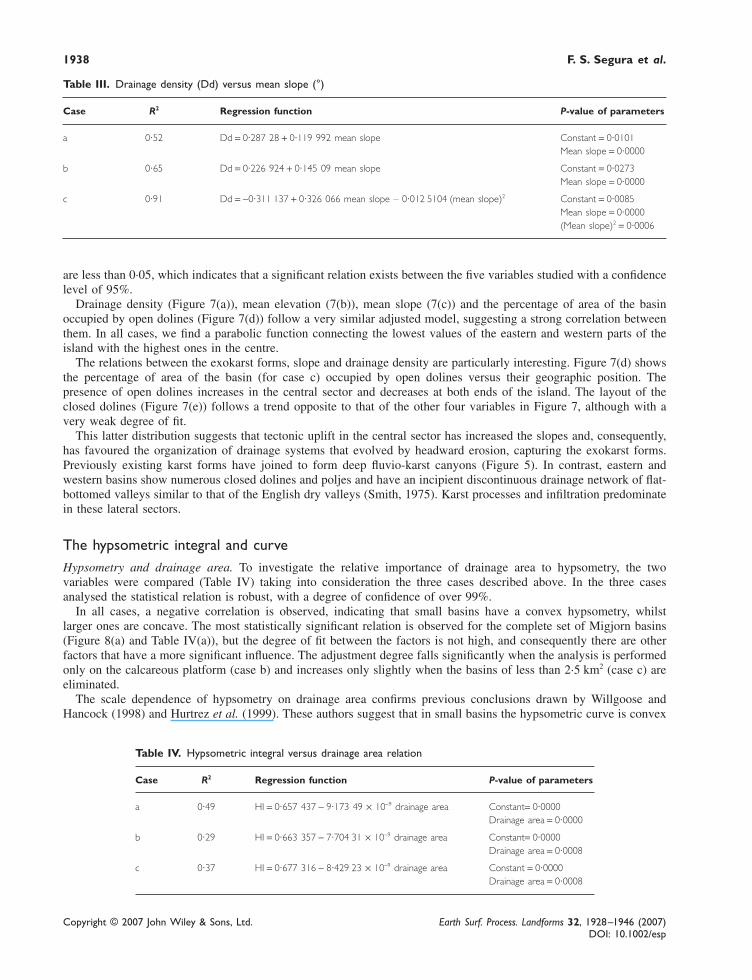
Table III. Drainage density (Dd) versus mean slope (°)
Case R2 Regression function P-value of parameters
a 0·52 Dd = 0·287 28 + 0·119 992 mean slope Constant = 0·0101Mean slope = 0·0000
b 0·65 Dd = 0·226 924 + 0·145 09 mean slope Constant = 0·0273Mean slope = 0·0000
c 0·91 Dd = −0·311 137 + 0·326 066 mean slope – 0·012 5104 (mean slope)2 Constant = 0·0085Mean slope = 0·0000(Mean slope)2 = 0·0006
Table IV. Hypsometric integral versus drainage area relation
Case R2 Regression function P-value of parameters
a 0·49 HI = 0·657 437 − 9·173 49 × 10−9 drainage area Constant= 0·0000Drainage area = 0·0000
b 0·29 HI = 0·663 357 − 7·704 31 × 10−9 drainage area Constant= 0·0000Drainage area = 0·0008
c 0·37 HI = 0·677 316 − 8·429 23 × 10−9 drainage area Constant = 0·0000Drainage area = 0·0008
are less than 0·05, which indicates that a significant relation exists between the five variables studied with a confidencelevel of 95%.
Drainage density (Figure 7(a)), mean elevation (7(b)), mean slope (7(c)) and the percentage of area of the basinoccupied by open dolines (Figure 7(d)) follow a very similar adjusted model, suggesting a strong correlation betweenthem. In all cases, we find a parabolic function connecting the lowest values of the eastern and western parts of theisland with the highest ones in the centre.
The relations between the exokarst forms, slope and drainage density are particularly interesting. Figure 7(d) showsthe percentage of area of the basin (for case c) occupied by open dolines versus their geographic position. Thepresence of open dolines increases in the central sector and decreases at both ends of the island. The layout of theclosed dolines (Figure 7(e)) follows a trend opposite to that of the other four variables in Figure 7, although with avery weak degree of fit.
This latter distribution suggests that tectonic uplift in the central sector has increased the slopes and, consequently,has favoured the organization of drainage systems that evolved by headward erosion, capturing the exokarst forms.Previously existing karst forms have joined to form deep fluvio-karst canyons (Figure 5). In contrast, eastern andwestern basins show numerous closed dolines and poljes and have an incipient discontinuous drainage network of flat-bottomed valleys similar to that of the English dry valleys (Smith, 1975). Karst processes and infiltration predominatein these lateral sectors.
The hypsometric integral and curveHypsometry and drainage area. To investigate the relative importance of drainage area to hypsometry, the twovariables were compared (Table IV) taking into consideration the three cases described above. In the three casesanalysed the statistical relation is robust, with a degree of confidence of over 99%.
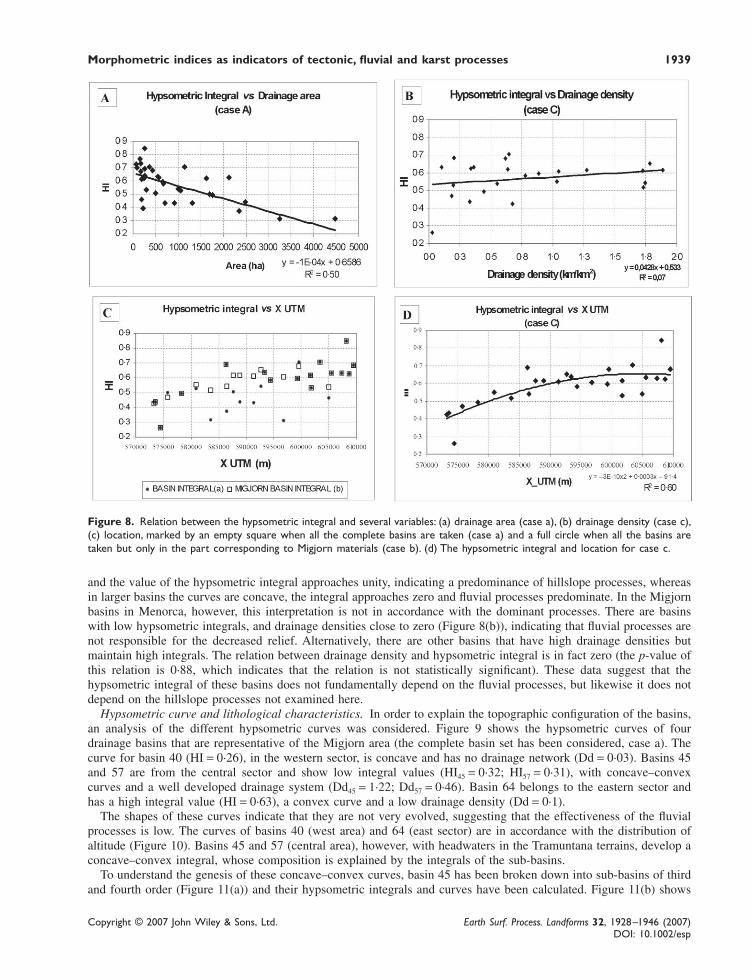
In all cases, a negative correlation is observed, indicating that small basins have a convex hypsometry, whilstlarger ones are concave. The most statistically significant relation is observed for the complete set of Migjorn basins(Figure 8(a) and Table IV(a)), but the degree of fit between the factors is not high, and consequently there are otherfactors that have a more significant influence. The adjustment degree falls significantly when the analysis is performedonly on the calcareous platform (case b) and increases only slightly when the basins of less than 2·5 km2 (case c) areeliminated.
The scale dependence of hypsometry on drainage area confirms previous conclusions drawn by Willgoose andHancock (1998) and Hurtrez et al. (1999). These authors suggest that in small basins the hypsometric curve is convex
Morphometric indices as indicators of tectonic, fluvial and karst processes 1939
Copyright © 2007 John Wiley & Sons, Ltd. Earth Surf. Process. Landforms 32, 1928–1946 (2007)DOI: 10.1002/esp
and the value of the hypsometric integral approaches unity, indicating a predominance of hillslope processes, whereasin larger basins the curves are concave, the integral approaches zero and fluvial processes predominate. In the Migjornbasins in Menorca, however, this interpretation is not in accordance with the dominant processes. There are basinswith low hypsometric integrals, and drainage densities close to zero (Figure 8(b)), indicating that fluvial processes arenot responsible for the decreased relief. Alternatively, there are other basins that have high drainage densities butmaintain high integrals. The relation between drainage density and hypsometric integral is in fact zero (the p-value ofthis relation is 0·88, which indicates that the relation is not statistically significant). These data suggest that thehypsometric integral of these basins does not fundamentally depend on the fluvial processes, but likewise it does notdepend on the hillslope processes not examined here.
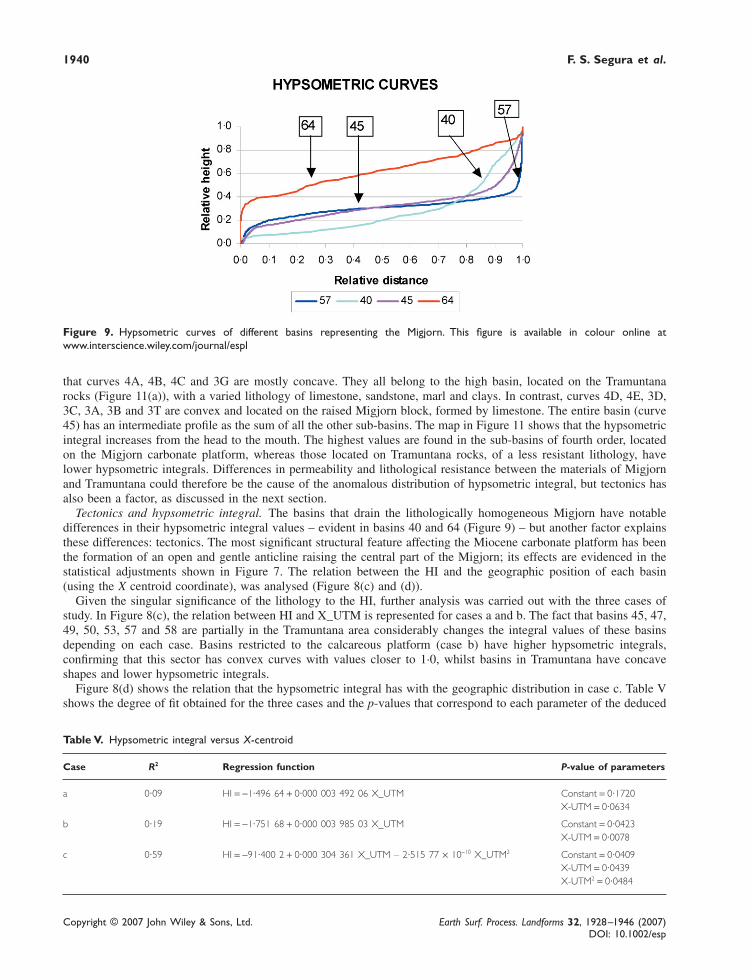
Hypsometric curve and lithological characteristics. In order to explain the topographic configuration of the basins,an analysis of the different hypsometric curves was considered. Figure 9 shows the hypsometric curves of fourdrainage basins that are representative of the Migjorn area (the complete basin set has been considered, case a). Thecurve for basin 40 (HI = 0·26), in the western sector, is concave and has no drainage network (Dd = 0·03). Basins 45and 57 are from the central sector and show low integral values (HI45 = 0·32; HI57 = 0·31), with concave–convexcurves and a well developed drainage system (Dd45 = 1·22; Dd57 = 0·46). Basin 64 belongs to the eastern sector andhas a high integral value (HI = 0·63), a convex curve and a low drainage density (Dd = 0·1).
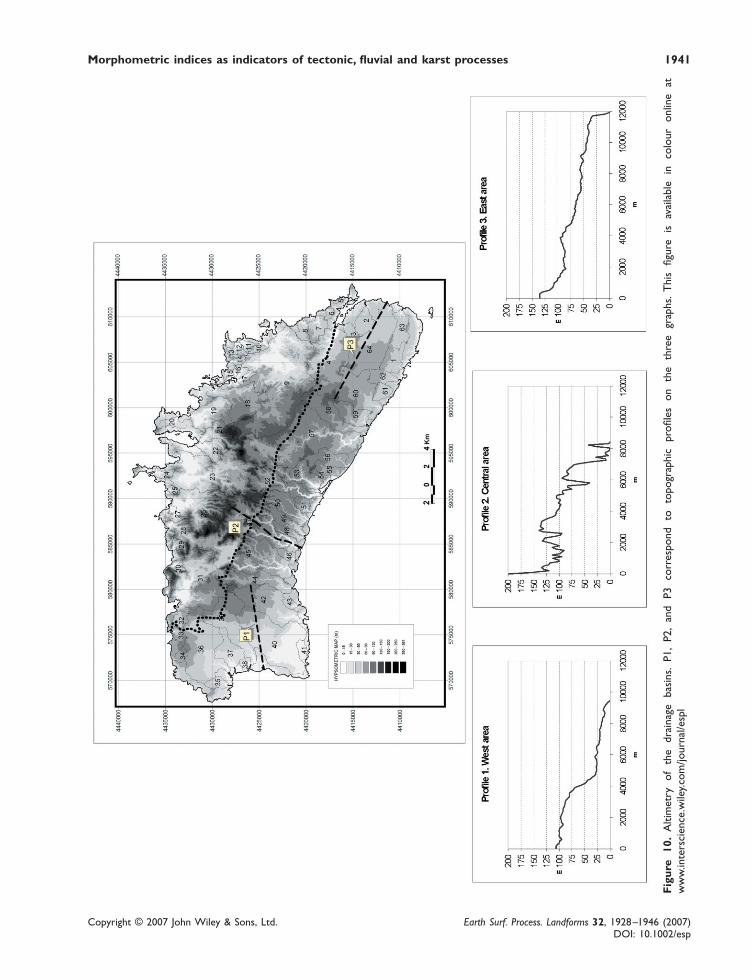
The shapes of these curves indicate that they are not very evolved, suggesting that the effectiveness of the fluvialprocesses is low. The curves of basins 40 (west area) and 64 (east sector) are in accordance with the distribution ofaltitude (Figure 10). Basins 45 and 57 (central area), however, with headwaters in the Tramuntana terrains, develop aconcave–convex integral, whose composition is explained by the integrals of the sub-basins.
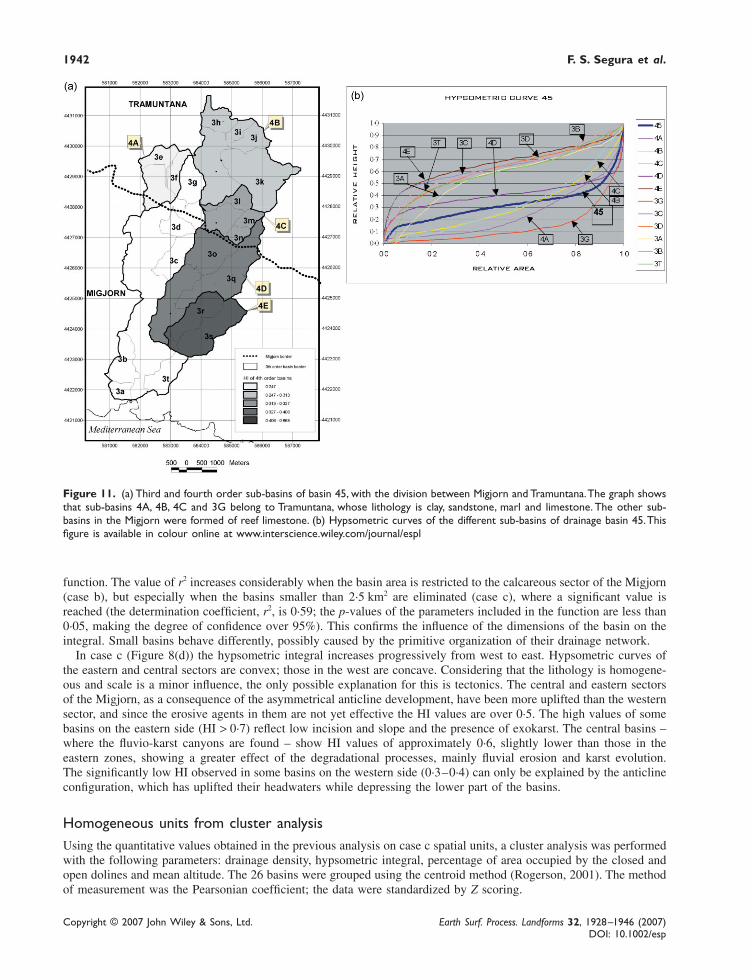
To understand the genesis of these concave–convex curves, basin 45 has been broken down into sub-basins of thirdand fourth order (Figure 11(a)) and their hypsometric integrals and curves have been calculated. Figure 11(b) shows
Figure 8. Relation between the hypsometric integral and several variables: (a) drainage area (case a), (b) drainage density (case c),(c) location, marked by an empty square when all the complete basins are taken (case a) and a full circle when all the basins aretaken but only in the part corresponding to Migjorn materials (case b). (d) The hypsometric integral and location for case c.
1940 F. S. Segura et al.
Copyright © 2007 John Wiley & Sons, Ltd. Earth Surf. Process. Landforms 32, 1928–1946 (2007)DOI: 10.1002/esp
that curves 4A, 4B, 4C and 3G are mostly concave. They all belong to the high basin, located on the Tramuntanarocks (Figure 11(a)), with a varied lithology of limestone, sandstone, marl and clays. In contrast, curves 4D, 4E, 3D,3C, 3A, 3B and 3T are convex and located on the raised Migjorn block, formed by limestone. The entire basin (curve45) has an intermediate profile as the sum of all the other sub-basins. The map in Figure 11 shows that the hypsometricintegral increases from the head to the mouth. The highest values are found in the sub-basins of fourth order, locatedon the Migjorn carbonate platform, whereas those located on Tramuntana rocks, of a less resistant lithology, havelower hypsometric integrals. Differences in permeability and lithological resistance between the materials of Migjornand Tramuntana could therefore be the cause of the anomalous distribution of hypsometric integral, but tectonics hasalso been a factor, as discussed in the next section.
Tectonics and hypsometric integral. The basins that drain the lithologically homogeneous Migjorn have notabledifferences in their hypsometric integral values – evident in basins 40 and 64 (Figure 9) – but another factor explainsthese differences: tectonics. The most significant structural feature affecting the Miocene carbonate platform has beenthe formation of an open and gentle anticline raising the central part of the Migjorn; its effects are evidenced in thestatistical adjustments shown in Figure 7. The relation between the HI and the geographic position of each basin(using the X centroid coordinate), was analysed (Figure 8(c) and (d)).
Given the singular significance of the lithology to the HI, further analysis was carried out with the three cases ofstudy. In Figure 8(c), the relation between HI and X_UTM is represented for cases a and b. The fact that basins 45, 47,49, 50, 53, 57 and 58 are partially in the Tramuntana area considerably changes the integral values of these basinsdepending on each case. Basins restricted to the calcareous platform (case b) have higher hypsometric integrals,confirming that this sector has convex curves with values closer to 1·0, whilst basins in Tramuntana have concaveshapes and lower hypsometric integrals.
Figure 8(d) shows the relation that the hypsometric integral has with the geographic distribution in case c. Table Vshows the degree of fit obtained for the three cases and the p-values that correspond to each parameter of the deduced
Figure 9. Hypsometric curves of different basins representing the Migjorn. This figure is available in colour online atwww.interscience.wiley.com/journal/espl
Table V. Hypsometric integral versus X-centroid
Case R2 Regression function P-value of parameters
a 0·09 HI = −1·496 64 + 0·000 003 492 06 X_UTM Constant = 0·1720X-UTM = 0·0634
b 0·19 HI = −1·751 68 + 0·000 003 985 03 X_UTM Constant = 0·0423X-UTM = 0·0078
c 0·59 HI = −91·400 2 + 0·000 304 361 X_UTM – 2·515 77 × 10−10 X_UTM2 Constant = 0·0409X-UTM = 0·0439X-UTM2 = 0·0484
Morphometric indices as indicators of tectonic, fluvial and karst processes 1941
Copyright © 2007 John Wiley & Sons, Ltd. Earth Surf. Process. Landforms 32, 1928–1946 (2007)DOI: 10.1002/esp
Fig
ure
10.
Alti
met
ry
of
the
drai
nage
ba
sins
. P1
, P2
, an
d P3
co
rres
pond
to
to
pogr
aphi
c pr
ofile
s on
th
e th
ree
grap
hs.
Thi
s fig
ure
is
avai
labl
e in
co
lour
on
line
atw
ww
.inte
rsci
ence
.wile
y.com
/jour
nal/e
spl
1942 F. S. Segura et al.
Copyright © 2007 John Wiley & Sons, Ltd. Earth Surf. Process. Landforms 32, 1928–1946 (2007)DOI: 10.1002/esp
Figure 11. (a) Third and fourth order sub-basins of basin 45, with the division between Migjorn and Tramuntana. The graph showsthat sub-basins 4A, 4B, 4C and 3G belong to Tramuntana, whose lithology is clay, sandstone, marl and limestone. The other sub-basins in the Migjorn were formed of reef limestone. (b) Hypsometric curves of the different sub-basins of drainage basin 45. Thisfigure is available in colour online at www.interscience.wiley.com/journal/espl
function. The value of r2 increases considerably when the basin area is restricted to the calcareous sector of the Migjorn(case b), but especially when the basins smaller than 2·5 km2 are eliminated (case c), where a significant value isreached (the determination coefficient, r2, is 0·59; the p-values of the parameters included in the function are less than0·05, making the degree of confidence over 95%). This confirms the influence of the dimensions of the basin on theintegral. Small basins behave differently, possibly caused by the primitive organization of their drainage network.
In case c (Figure 8(d)) the hypsometric integral increases progressively from west to east. Hypsometric curves ofthe eastern and central sectors are convex; those in the west are concave. Considering that the lithology is homogene-ous and scale is a minor influence, the only possible explanation for this is tectonics. The central and eastern sectorsof the Migjorn, as a consequence of the asymmetrical anticline development, have been more uplifted than the westernsector, and since the erosive agents in them are not yet effective the HI values are over 0·5. The high values of somebasins on the eastern side (HI > 0·7) reflect low incision and slope and the presence of exokarst. The central basins –where the fluvio-karst canyons are found – show HI values of approximately 0·6, slightly lower than those in theeastern zones, showing a greater effect of the degradational processes, mainly fluvial erosion and karst evolution.The significantly low HI observed in some basins on the western side (0·3–0·4) can only be explained by the anticlineconfiguration, which has uplifted their headwaters while depressing the lower part of the basins.
Homogeneous units from cluster analysisUsing the quantitative values obtained in the previous analysis on case c spatial units, a cluster analysis was performedwith the following parameters: drainage density, hypsometric integral, percentage of area occupied by the closed andopen dolines and mean altitude. The 26 basins were grouped using the centroid method (Rogerson, 2001). The methodof measurement was the Pearsonian coefficient; the data were standardized by Z scoring.
Morphometric indices as indicators of tectonic, fluvial and karst processes 1943
Copyright © 2007 John Wiley & Sons, Ltd. Earth Surf. Process. Landforms 32, 1928–1946 (2007)DOI: 10.1002/esp
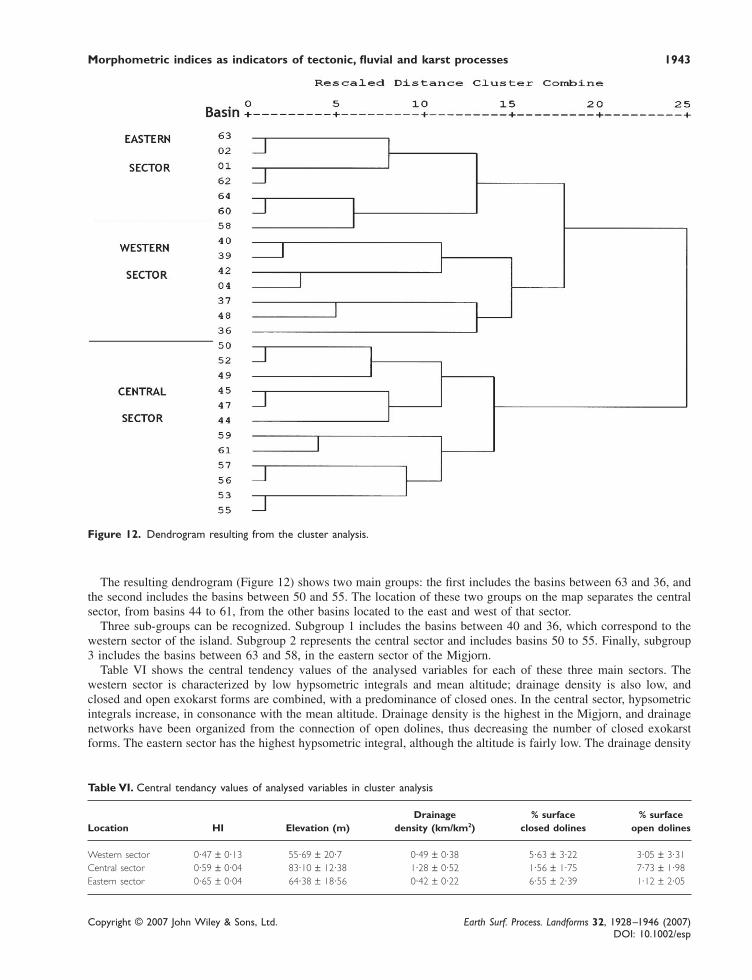
The resulting dendrogram (Figure 12) shows two main groups: the first includes the basins between 63 and 36, andthe second includes the basins between 50 and 55. The location of these two groups on the map separates the centralsector, from basins 44 to 61, from the other basins located to the east and west of that sector.
Three sub-groups can be recognized. Subgroup 1 includes the basins between 40 and 36, which correspond to thewestern sector of the island. Subgroup 2 represents the central sector and includes basins 50 to 55. Finally, subgroup3 includes the basins between 63 and 58, in the eastern sector of the Migjorn.
Table VI shows the central tendency values of the analysed variables for each of these three main sectors. Thewestern sector is characterized by low hypsometric integrals and mean altitude; drainage density is also low, andclosed and open exokarst forms are combined, with a predominance of closed ones. In the central sector, hypsometricintegrals increase, in consonance with the mean altitude. Drainage density is the highest in the Migjorn, and drainagenetworks have been organized from the connection of open dolines, thus decreasing the number of closed exokarstforms. The eastern sector has the highest hypsometric integral, although the altitude is fairly low. The drainage density
Figure 12. Dendrogram resulting from the cluster analysis.
Table VI. Central tendancy values of analysed variables in cluster analysis
Drainage % surface % surfaceLocation HI Elevation (m) density (km/km2) closed dolines open dolines
Western sector 0·47 ± 0·13 55·69 ± 20·7 0·49 ± 0·38 5·63 ± 3·22 3·05 ± 3·31Central sector 0·59 ± 0·04 83·10 ± 12·38 1·28 ± 0·52 1·56 ± 1·75 7·73 ± 1·98Eastern sector 0·65 ± 0·04 64·38 ± 18·56 0·42 ± 0·22 6·55 ± 2·39 1·12 ± 2·05
1944 F. S. Segura et al.
Copyright © 2007 John Wiley & Sons, Ltd. Earth Surf. Process. Landforms 32, 1928–1946 (2007)DOI: 10.1002/esp
is the lowest in the Migjorn, which coincides with a greater presence of closed exokarst forms and a minimumrepresentation of the open ones.
Discussion and Conclusions
The morphology of the Migjorn calcareous platform in Menorca is the result of the interaction between tectonic,fluvial and karst processes. Morphometric indices from the GIS analysis of a DEM have been used in characterizingthese processes. The results of these analyses indicate that the morphometric indices (HI, drainage density) applied tovery small basins (<2·5 km2) show erratic values, given that local variations acquire excessive importance.
The hypsometric integral is clearly influenced by tectonics, and the irregular behaviour in the Migjorn could beexplained by the presence of a slightly asymmetrical anticline. Our results confirm the influence that basin size has onthe hypsometric integral, as previously indicated by other authors (Hurtrez et al., 1999). The concave or convex natureof the hypsometric curves is not a function of fluvial processes but depends here on lithology and tectonics. In thiscase, therefore, the hypsometric curve cannot be used as an indicator of landscape evolution stages as proposed byStrahler (1964).
The integral and the hypsometric curve make clear that the tectonically elevated areas, with calcareous lithology,present high HI levels and convex curves. On the other hand, the tectonically depressed areas or those with soft andimpervious materials (Tramuntana) have low HI values and concave curves.
In other types of study, a positive relation has already been shown to exist between HI and the elevation, althoughthis was established for spatial units of a larger dimension (1000 km2) (Lifton and Chase, 1992). In the case of theMigjorn in Menorca, the influence of tectonic uplifting on the integral and hypsometric curve is clear even in verysmall basins (the average surface of the basins is 8·3 km2). This is probably explained by the karst provoking adecrease in the surface runoff and an increase in the subsurface and subterranean runoffs, because of which thesubaerial shape is of less importance. The great dependence that the hypsometric integral has on tectonics seems tosuggest that the uplifting was recent.
Drainage is positively correlated with slope: in the same lithology, slope is the dominating factor and uplift isresponsible for the different stages of basin incision. Drainage density is very low and shows a broad extension withslopes of less than 5°, coinciding with the results of other authors (Talling and Sowter, 1999). Our results show thatfluvial processes have not been the main determining factor in the morphogenesis of these calcareous basins. Incontrast, incision of the canyons in the central sector has followed a model where the collapse of the dolines and a fallin ground-water level has been accelerated by the uplift of the central sector. The drainage network has developed bycapturing exokarstic forms that are distributed following the break lines associated with the anticline. The risingerosion has facilitated the connection of karstic formations.
The karstic processes have been analysed using indices that take into account the area occupied by closed and opendolines. A negative relation between the karstic and fluvial processes has been observed. The drainage density ishigher in the sectors where there are captured dolines and progressively declines with an increase in closed dolines.All of this data suggests that karstification processes preceded the tectonic ones, which, when increasing the slopes,facilitated the organization of the drainage network.
Using the values of these indices, three major sectors of the Migjorn calcareous platform can be defined objectivelyby cluster analysis. In the eastern and western sectors there is a predominance of karstic processes, whereas in thecentral sector fluvial processes are dominant.
In conclusion, lithology and tectonics are the main factors explaining the current morphology of the south ofMenorca island. The lithology has facilitated karst development, and tectonics is responsible for the organization andformation of the drainage network.
AcknowledgementsThis work was funded by the Spanish Government projects BTE2002-04552-C03 and CGL2006-11242-C03. The authors are verygrateful to Dr. R. Pike for his careful revision of the original manuscript and his very useful suggestions. We would also like tothank two other anonymous referees for their comments.
References
Bourrouilh R. 1983. Stratigraphie, Sediméntologie et Tectonique de l’Ile de Minorque et du Nord-Est de Majorque (Baléares). La TerminaisonNord-Orientale des Cordillères Bétiques en Méditerranée Occidentale, Memorias del Instituto Geológico y Minero de España, Madrid.
Morphometric indices as indicators of tectonic, fluvial and karst processes 1945
Copyright © 2007 John Wiley & Sons, Ltd. Earth Surf. Process. Landforms 32, 1928–1946 (2007)DOI: 10.1002/esp
Dietrich WE, Wilson CJ, Montgomery DR, McKean J. 1993. Analysis of erosion thresholds, channel networks, and landscape morphologyusing a digital terrain model. The Journal of Geology 101: 259–278.
Dietrich WE, Wilson, CJ, Montgomery DR, McKean J, Bauer R. 1992. Erosion thresholds and land surface morphology. Geology 20: 675–679.
Fornós JJ. 2004. Morfologia costanera i processos litorals. El paper de la fracturació i el carst. In Història Natural del Migjorn de Menorca:el Medi Físic i l’Influx Humà, Fornós JJ, Obrador A, Rosselló VM (eds). Societat d’Història Natural de les Balears: Palma de Mallorca;201–212.
Fornós JJ, Segura FS. 2004. El rebliment holocènic dels barrancs del Migjorn. In Història Natural del Migjorn de Menorca: el Medi Físici l’Influx Humà, Fornós JJ, Obrador A, Rosselló VM (eds). Societat d’Història Natural de les Balears: Palma de Mallorca; 121–128.
Gelabert B, Fornós JJ, Pardo JE, Rosselló VM, Segura FS. 2005. Structurally controlled drainage basin development in the south ofMenorca (Western Mediterranean, Spain). Geomorphology 65:139–155.
Gelabert B, Giménez J, Barón A. 2004. Hidrologia subterrània del Migjorn. In Història Natural del Migjorn de Menorca: el Medi Físic il’Influx Humà, Fornós JJ, Obrador A, Rosselló VM (eds). Societat d’Història Natural de les Balears: Palma de Mallorca; 121–128.
Ginés J, Fornós JJ. 2004. Caracterització del carst del Migjorn: la seva contribució al modelat del territori. In Història Natural del Migjornde Menorca: el Medi Físic i l’Influx Humà, Fornós JJ, Obrador A, Rosselló VM (eds). Societat d’Història Natural de les Balears: Palmade Mallorca; 259–273.
Gregory KJ, Gardiner V. 1975. Drainage density and climate. Zeitschrift für Geomorphologie N.F. 19: 287–298.Howard AD. 1997. Badland morphology and evolution: interpretation using a simulation model. Earth Surface Processes and Landforms 22:
211–227.Hurtrez JE, Sol C, Lucazeau F. 1999. Effect of drainage area on hypsometry from an analysis of small-scale drainage basin in the Siwalik
Hills (Central Nepal). Earth Surface Processes and Landforms 24: 799–808.Jenson SK, Domingue JO. 1988. Extracting topographic structure from digital elevation data for geographical information systems analysis.
Photogrammetric Engineering and Remote Sensing 54: 1593–1600.ITGE. 1989. Mapa Geológico de España. Escala 1:25 000, Isla de Menorca. Instituto Tecnológico Geominero de España: Madrid.Lifton NA, Chase CG. 1992. Tectonic, climatic and lithologic influences on landscape fractal dimension on hypsometry: implications for
landscape evolution in the San Gabriel Mountains, California. Geomorphology 5: 77–114.Lin Z, Oguchi T. 2004. Drainage density, slope angle, and relative basin position in Japanese bare lands from high-resolution DEMs.
Geomorphology 63: 159–173.Maestro IC, Pardo JE, Porres, MJ. 2003. Mejoras en la extracción automática de redes de drenaje aplicando el modelo área-pendiente. In IX
Conferencia Ibereoamericana de SIG: de lo Local a lo Global. Nuevas Tecnologías de la Información Geográfica para el Desarrollo, 15.Montgomery DR, Dietrich WE. 1994. Landscape dissection and drainage area–slope thresholds. In Process Models in Theoretical
Geomorphology, Kirkby MJ (ed.). Wiley: New York; 417.O’Callaghan JF, Mark DA. 1984. The extraction of the drainage networks from digital elevation data. Computer Vision and Image Process-
ing 28: 323–44.Oguchi T. 1997. Drainage density and relative relief in humid steep mountains with frequent slope failure. Earth Surface Processes and
Landforms 22: 107–120.Pardo Pascual JE. 2003. La albufera de Son Bou. In Introducción a la Geografía Física de Menorca, Rosselló VM, Fornós JJ, Gómez-Pujol
Ll (eds). AGE, Universitat de València, Societat d’Història Natural de les Balears: Palma de Mallorca; 157–168.Pardo Pascual JE, Porres de la Haza MJ. 2004. Caracterització morfomètrica del Migjorn de Menorca. In Història Natural del Migjorn de
Menorca: el Medi Físic i l’Influx Humà, Fornós JJ, Obrador A, Rosselló VM (eds). Societat d’Història Natural de les Balears: Palma deMallorca; 157–168.
Pons GX, Gómez-Pujol Ll. 2003. Introducción al medio físico de Menorca (Illes Balears). In Història Natural del Migjorn de Menorca:el Medi Físic i l’Influx Humà, Fornós JJ, Obrador A, Rosselló VM (eds). Societat d’Història Natural de les Balears: Palma de Mallorca;105–120.
Rogerson PA. 2001. Statistical Methods for Geography. Sage: London; 236.Rosselló VM. 2004. El litoral i les cales. In Història Natural del Migjorn de Menorca: el Medi Físic i l’Influx Humà, Fornós JJ, Obrador A,
Rosselló VM (eds). Societat d’Història Natural de les Balears: Palma de Mallorca; 177–200.Rosselló VM, Pardo JE, Palomar JM, Riquelme J. 2004. Mapa geomorfològic del Migjorn de Menorca. In Història Natural del Migjorn de
Menorca: el Medi Físic i l’Influx Humà, Fornós JJ, Obrador A, Rosselló VM (eds). Societat d’Història Natural de les Balears: Palma deMallorca.
Schumm SA. 1956. Evolution of drainage systems and slopes in badlands at Perth Amboy, New Jersey. Bulletin of the Geological Society67: 597–696.
Schumm SA. 1997. Drainage density: problems of prediction. In Process and Form in Geomorphology, Stoddart DR (ed.). Routledge:London; 432.
Segura FS, Pardo Pascual JE, Palomar J. 2004. Els barrancs del Migjorn de Menorca. In Història Natural del Migjorn de Menorca: elMedi Físic i l’Influx Humà, Fornós JJ, Obrador A, Rosselló VM (eds). Societat d’Història Natural de les Balears: Palma de Mallorca;129–156.
Segura, FS, Pardo Pascual JE, Servera, J. 1999. Tectònica i carst al Migjorn de Menorca: el Prat de Son Bou. In Geoarqueologia iQuaternari Litoral, Rosselló VM (ed.). Universitat de València: València; 335–446.
Smith DI. 1975. The problems of limestone dry valleys. Implications of recent work in limestone hydrology. In Process in Physical andHuman Geography, Peel R, Chisholm M, Haggett P (eds). University of Bristol, Heineman: London; 131–147.

1946 F. S. Segura et al.
Copyright © 2007 John Wiley & Sons, Ltd. Earth Surf. Process. Landforms 32, 1928–1946 (2007)DOI: 10.1002/esp
Strahler AN. 1964. Quantitative geomorphology of drainage basins and channel networks. In Handbook of Applied Hydrology, Chow VT(ed.). McGraw-Hill: New York; 49.
Talling PJ, Sowter MJ. 1999. Drainage density on progressively tilted surfaces with different gradients, Wheeler Ridge, California. EarthSurface Processes and Landforms 24: 809–824.
Trías M. 2004. El paisatge subterrani meridional de Menorca. In Història Natural del Migjorn de Menorca: el Medi Físic i l’Influx Humà,Fornós JJ, Obrador A, Rosselló VM (eds). Societat d’Història Natural de les Balears: Palma de Mallorca; 121–128.
Tucker GE, Bras RL. 1998. Hillsope processes, drainage density, and landscape morphology. Water Resources Research 34: 2751–2764.Tucker GE, Catani F, Rinaldo A, Bras RL. 2001. Statistical analysis of drainage density from digital terrain data. Geomorphology 36:187–
202.Willgoose G, Hancock G. 1998. Revisiting the hypsometric curve as a indicator of form and process in transport-limited catchment. Earth
Surface Processes and Landforms 23: 611–623.


