Embed Size (px)
Citation preview
Benjamin C. P. Lee1,2
John B. Kneeland1
Patrick T. Cahill1 Michael D. F. Deck 1
Received April 9, 1984; accepted after revision March 7,1985.
1 Department of Radiology, New York HospitalComell Medical Center, 525 E. 68th St. , New York, NY 10021 .
2 Present address: Department of Radiology, University of California, Davis Medical Center, 4301 X St. , Sacramento, CA 98517. Address reprint requests to B. C. P. Lee.
AJNR 6:871-878, November/December 1985 0195-6108/85/0606-0871 © American Society of Neuroradiology
MR Recognition of Supratentorial Tumors
871
Eighty patients with intrinsic tumors of the cerebral hemispheres and thalami were studied with a 0.5 T superconducting system and third- or fourth-generation computed tomographic (CT) scanners. Twenty-eight patients had histologically verified gliomas, 34 were presumed to have primary brain tumors on clinical grounds, 13 had metastases, and five were postoperative. Lesions shown on CT were equally well demonstrated on magnetic resonance (MR) imaging; more metastases were seen on MR than on CT images. MR revealed abnormal signals in 10 cases in which CT findings were equivocal. It was not possible to differentiate edema from tumor in many cases using the MR imaging sequences currently available. The histologic types of the tumors could not be determined from the MR appearances.
Although computed tomographic (CT) scanning has proved to be an effective method for diagnosing supratentorial tumors, infiltrative lesions with attenuation similar to normal structure may not be imaged unless they are large enough to cause significant mass effect. Superficially situated tumors also are often obscured by artifacts caused by the calvaria. It is estimated that up to 11 .5% of hemispheric tumors are not demonstrated by CT [1-11]. Magnetic resonance (MR) imaging detects contrast by virtue of differences in proton density and the relaxation times of the protons, and it has proved to be more sensitive than CT in detecting many lesions of the central nervous system [12-21]. However, for any study to have validity it is essential that only images from third- or fourth-generation CT scanners be compared with MR scans. We report the results of a comparative study of the recognition of intrinsic supratentorial tumors by third- or fourth-generation CT scans and MR scans obtained from a superconducting scanner.
Subjects and Methods
Eighty patients with intrinsic tumors of the cerebral hemispheres and thalami were studied . Patients were selected according to clinical suspicion of tumor as manifested by seizures and usually progressive focal neurologic symptoms and signs. CT scans were obtained before MR images in 60 cases; both studies were evaluated independently and without clinical data. Twenty-eight patients were histologically proven to have gliomas or glioblastoma multiforme. Thirty-four were presumed to have primary intraaxial tumors on the basis of clinical history and CT and MR characteristics. These lesions were situated in locations where surgical biopsy would have produced unacceptable neurologic deficits. Thirteen patients were histologically proven to have metastases. Five cases were postoperative: two had clinical evidence of recurrence of tumor at the t ime of examination and three were asymptomatic. The locations of the tumors are listed in table 1 .
All CT scans, with one exception , were obtained with intravenous contrast material (42 g I). Negative cases and those that did not show contrast enhancement were restudied with a higher dose (82.3 g iodine): one-half the dose was administered 30 min before scanning; the rest immediately before scanning . All scans were obtained on third- or fourth-generation scanners; most scanners were GE 8800 or 9800. Contiguous axial 10-mm-thick sections at
872 LEE ET AL. AJNR:6, NovlDec 1985
TABLE 1: Locations of Supratentorial Tumors
No. of Patients Region
Primary Metastases Postoperative
Frontal . 28 6 3 Parietooccipital 10 9 2 Temporal . . . . . . . . 19 1 0 Thalamic . ...... . . 5 1 0
Total 62 17* 5
• Total number of locations in 13 patients.
150 to the orbitomeatal line were obtained routinely, and additional direct coronal views were obtained when indicated.
MR scans were obtained routinely in the axial plane on a Technicare 0.5 T superconducting system. Anisotropic volume imaging techniques were used in 30 cases. The other 50 cases were studied by the multi section technique. The spatial resolution, as determined by phantom studies , was 1.0-1 .3 mm [22]. Each section was 8 mm thick , with 8 mm between sections. A second series was obtained with spatial offset of 8 mm in order to image the spaces not imaged by the initial scans. Spin-echo (SE) with an echo delay time (TE) of 30 msec and repetition time (TR) of (500 msec) (SE 30/500) (T1-weighted images) and at least one additional SE sequence (SE 90/ 1000,1500, 2000) (T2-weighted images) were obtained in all cases. The latter sequence was performed with a single-echo technique in 25 cases and with multiecho (SE 30, 60, 90, 120) techniques in 30 cases. Additional single sections using the above technique and inversion-recovery (IR) with inversion time (TI) of 450 msec and TR of 1500 msec (IR 450/1500) were obtained to clarify lesions not well shown by the routine sequences. Scans in the sagittal and coronal planes were obtained in selected cases for further detailed delineation of the lesions.
Results
Primary Brain Tumors
CT scans in 52 cases were unequivocally abnormal: 40 showed low attenuation and mass effect, five lesions were cystic, three had increased attenuation, and only one was normal in density without contrast material; 31 cases showed enhancement after intravenous contrast administration. MR images were abnormal in all 52 cases (table 2). The tumors were best shown on T2-weighted SE 90/1500, 2000 sequences as regions of increased signal intensity (figs. 1 and 2) and on IR 450/1500 images as regions of decreased signal intensity (fig. 3). CT revealed no more lesions than did MR in any case.
In 32 cases the regions of abnormal MR signal were larger than the areas of abnormal attenuation shown on CT scans (fig. 4); it was not possible to differentiate the signal caused by tumor from that of surrounding edema in these cases (fig. 5). In nine cases, where CT showed regions of homogeneous low attenuation, MR revealed regions of normal intensity within much larger areas of high intensity on T2-weighted SE 90/1500, 2000 sequences (fig. 6) and discrete regions of low intensity on IR sequences (fig . 7). In one case there was increased signal within the body of the corpus callosum, indicating infiltration of the left frontoparietal tumor (fig. 8).
The cystic part of the tumor was distinguished from the
TABLE 2: MR Findings in Patients with Unequivocally Abnormal CT Scans
Tumor Characteristics
No. of Cases (n = 52)
SE 90/1500
Homogeneous .37 (increase)
Mixed .. .... . . . .. ... 11 Cystic . . . . . . . . . . 3 Normal . . . . . . . . . . . 1 Size > CT ... 32 Size = CT ..... . .... 20
Note.-The IR 450/1500 sequence was used in only 21 cases.
IR 450/1500
14 (decrease) 1 (increase) 3 3 o
11 10
surrounding signal in three cases on SE 30/500 and IR 450/ 1500 sequences (fig. 9). Absence of signal, with configurations compatible with tumor vascularity, was demonstrated in three cases (fig. 10). Calcification was distinguished from hematoma by absence of signal. Hematoma on the other hand had increased signal in all sequences (fig. 11).
Scans of five patients with previous surgical excision of tumors were abnormal. The sites of surgical intervention were shown as increased signal on T2-weighted SE 90/1500, 2000 images and decreased signal on T1-weighted SE 30/500 images and IR 450/1500 sequences. It was not possible to distinguish surgical defect from residual tumor, even in a case with surgically proved recurrence of a grade II glioma.
CT appearances in 10 cases were equivocally abnormal (table 3). CT scans were completely normal in four cases before and after intravenous contrast enhancement (figs. 12 and 13). Slightly decreased attenuation, with neither contrast enhancement nor mass effect, was seen in one case (fig. 14). Minimal ventricular or sulcal compression was seen in four more cases; in one case there were multiple poorly defined areas of contrast enhancement. Questionable enhancement of the gyri was seen in one case, that was normal before enhancement. MR was abnormal in all 10 cases and showed markedly increased signal on T2-weighted SE 90/1500, 2000 and decreased intensity on T1-weighted IR sequences.
Histologic Specificity of the MR Appearances (table 4)
Twenty-eight patients had low-grade gliomas and gangliogliomas. CT showed low attenuation in 20 cases; no enhancement was seen after administration of intravenous contrast material in 11 cases. MR was abnormal in all 28 cases: Only four cases had normal signal on T1-weighted SE 30/500 sequence, but all cases showed increased signal in T2-weighted SE 90/1500, 2000 sequences. The abnormal signal was often considerably larger than the altered attenuation and contrast enhancement shown on CT scans (fig. 4). Two cases had areas of low signal within the increased signal of T2- weighted images, suggesting the presence of calcium. In three cases multiple decreased-intensity areas were seen on IR images (fig. 7).
Eight patients had grades III and IV gliomas. CT demonstrated contrast enhancement in six cases. All cases had decreased signal on T1-weighted SE 30/500 images and increased signal on T2-weighted SE 90/1500, 2000 images. The appearances of the altered signal were similar to those
AJNR :6, Nov/Dec 1985 MR OF SUPRATENTORIAL TUMORS 873
A B
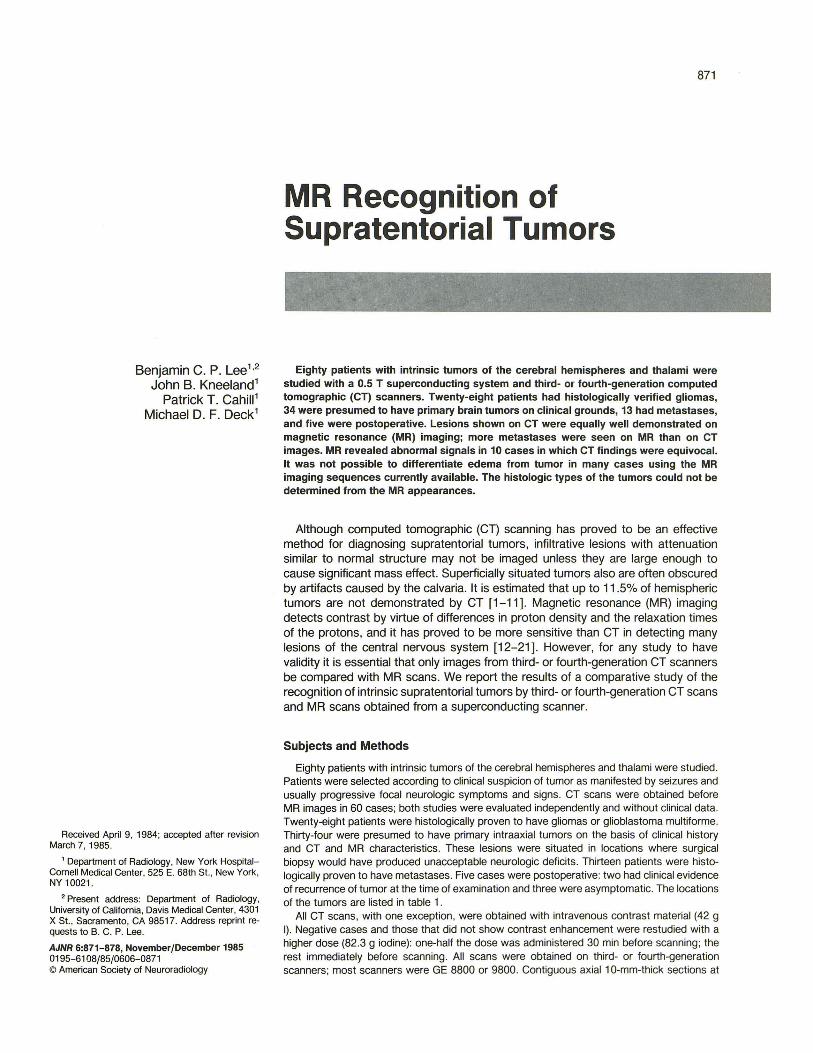
Fig. 1.-Grade II glioma. SE 90/1500 image. Homogeneous increased signal in anterior right hemisphere.
Fig. 2.-Grade II glioma. A, Contrast-enhanced CT scan. Slightly decreased attenuation in left frontal lobe with minimal midline shift, unchanged over 2 years. B, SE 90/1500 image. Large area of increased signal in same area.
A B
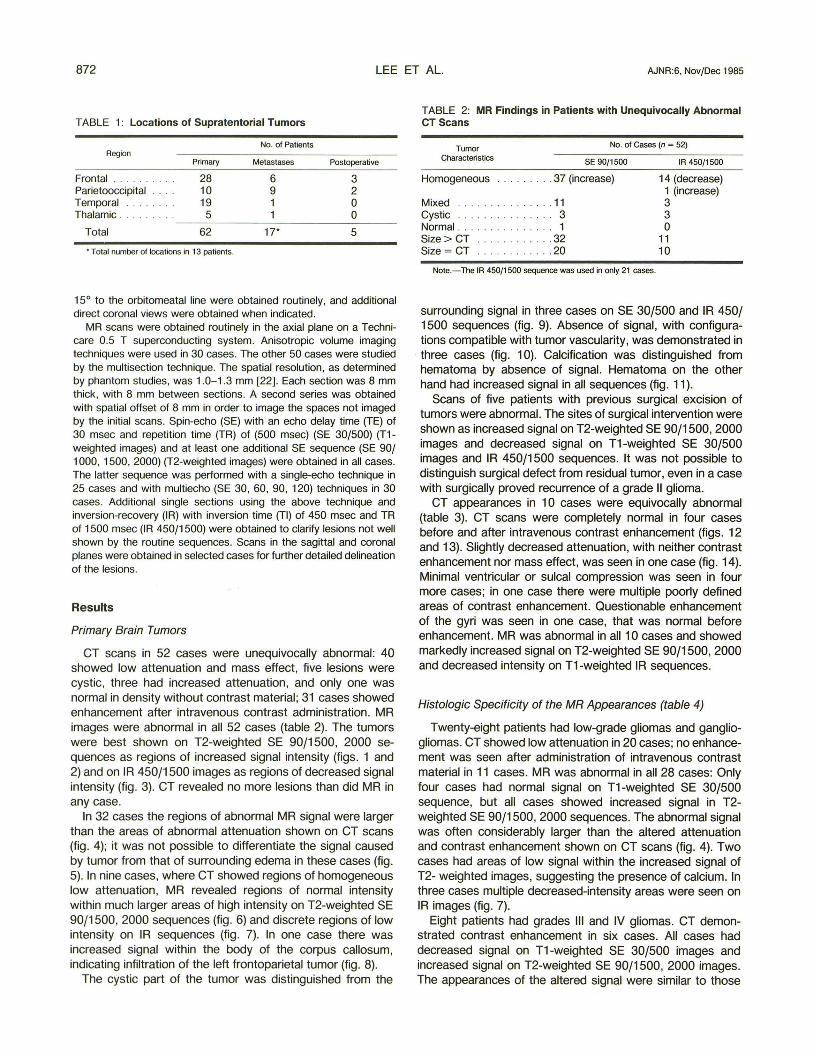
Fig. 3.-Glioma (clinical diagnosis). IR 450/1500 Fig. 4.-Grade I glioma. SE 90/1500 scan (A) shows area of increased signal intensity to be larger than image. Homogeneous decreased signal in right tem- decreased attenuation on CT scan (B). porallobe, with slight mass effect.
of more benign tumors. The intensity and configurations of the signal abnormality bore no relation to the histologic nature of the tumors.
Metastases
Seventeen metastases were demonstrated in 13 patients. The MR appearances of the tumors were indistinguishable from primary gliomas, except in one case in which signal characteristics compatible with hematoma suggested metastatic melanoma. MR demonstrated more numerous lesions than did CT in three cases and supported the diagnosis of
metastatic neoplasm because of the multiplicity of the abnormalities (fig. 15).
Discussion
Scanning Techniques
Our scanning techniques were selected after careful preliminary evaluation of a variety of lesions using SE techniques with different TE and TR settings and IR techniques using various TR settings. It was found that scanning with at least two imaging sequences is required for diagnosis and definition of abnormalities. Our results suggest that SE 30/500 is the
874 LEE ET AL. AJNR:6, Nov/Dec 1985
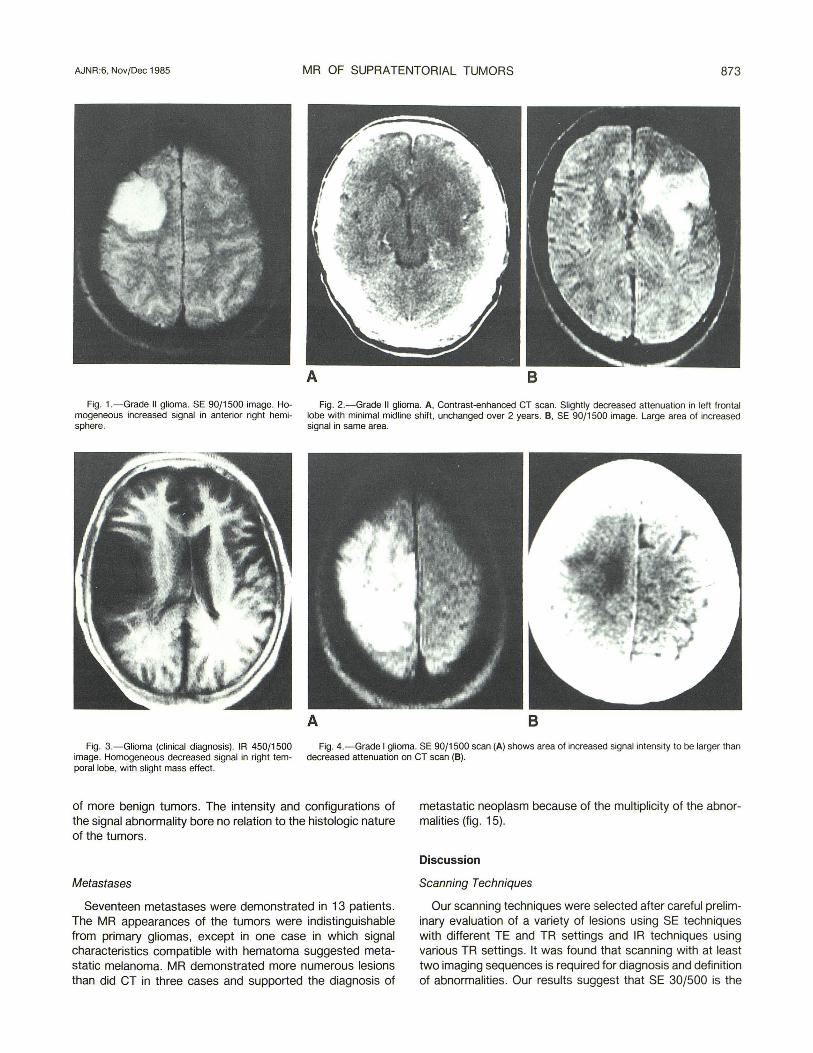
A B Fig. 5.- Glioma (clinical diagnosis). Sagittal SE 90/
1500 scan. Extension of homogeneous increased signal into parietal lobe. Note configuration of gyri (arrowheads).
Fig. 6.- Grade III glioma. A, SE 90/1500 scan. Edema with increased signal intensity surrounding tumor of normal intensity. B, Contrast-enhanced CT scan. Center of normal density with adjacent low attenuation corresponding to increased signal on MR.
A B Fig. 7.- Grade III glioma. IR 450/1500 scan (A) shows multiple discrete
areas of decreased signal (. ) relative to fairly homogeneous increased signal on SE 90/1500 sequence (B). C, Contrast-enhanced CT scan. Multiple, poorly
best technique for evaluating anatomic distortions and that SE with 90 msec TE is optimal for detecting abnormal signal characteristics of tumors. IR 450/1500 provides additional T1 contrast data in some cases, but is limited in anatomic evaluation because of the inability of our scanner to obtain simultaneous multiple sections. SE using 120 msec TE occasionally may reveal increased tumor signal not clearly seen on less strongly T2-weighted techniques.
Simultaneous multiple sections have spatial resolutions as fine as single sections and are superior to anisotropic techniques. SE images are preferably obtained by the multisection/multiecho techniques, which diminish examination time. Anisotropic technique is reserved for IR sequences, which
c defined areas of enhancement with slight compression of medial parts of lateral ventricles.
currently cannot be acquired as simultaneous multisections. Although it is possible to obtain contiguous multiple sections, such images are invariably degraded by noise induced by the neighboring sections. We found that noncontiguous sections with gaps of 3 mm or more are free of such defects. To avoid missing lesions with such noncontiguous techniques, we performed two sets of multiple sections with a spatial offset equivalent to the slice thickness of the section to image the entire cranial cavity.
Although axial sections were necessary for direct comparison with routine CT scans, supplementary sagittal and coronal sections were valuable for precise location of tumors. Currently these supplementary sections are not obtained in
AJNR:6, Nov/Dec 19B5 MR OF SUPRATENTORIAL TUMORS 875
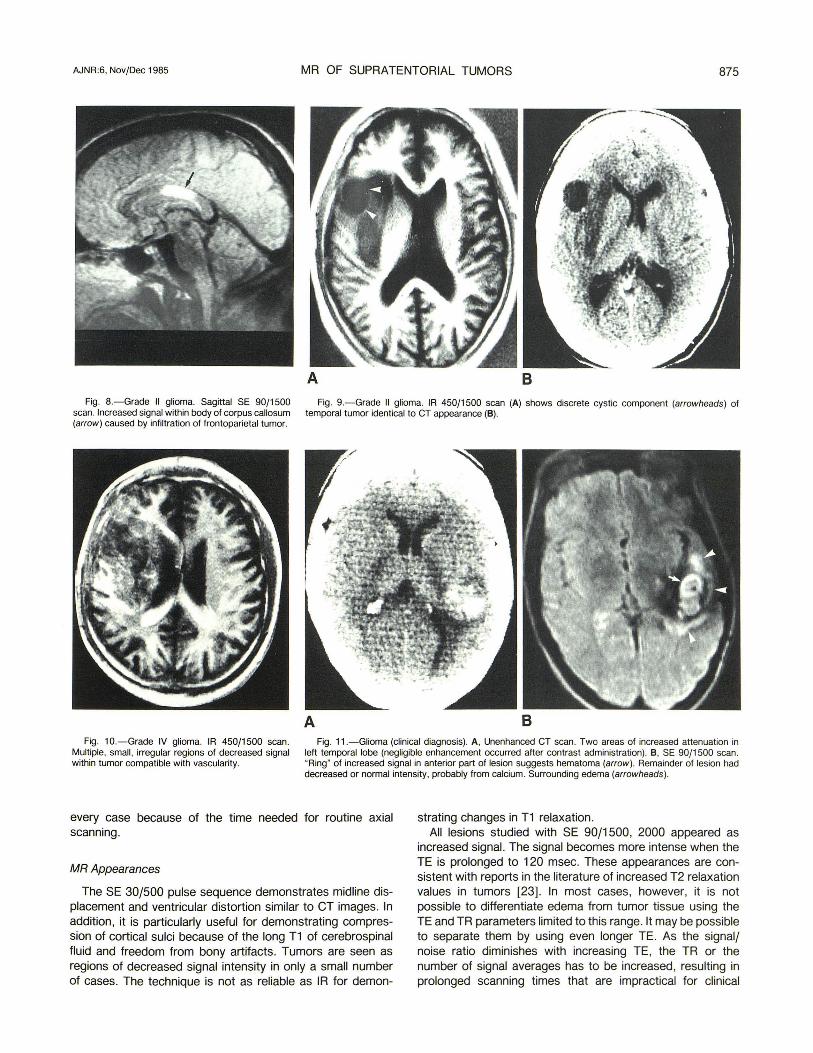
A B Fig. B.-Grade II glioma. Sagittal SE 90/1500 Fig. 9.-Grade II glioma. IR 450/1500 scan (A) shows discrete cystic component (arrowheads) of
scan. Increased signal within body of corpus callosum temporal tumor identical to CT appearance (8). (arrow) caused by infiltration of frontoparietal tumor.
A B Fig. 10.-Grade IV glioma. IR 450/1500 scan .
Multiple, small , irregular regions of decreased signal within tumor compatible with vascularity.
Fig . 11 .-Glioma (clinical diagnosis). A, Unenhanced CT scan. Two areas of increased attenuation in left temporal lobe (negligible enhancement occurred after contrast administration). 8 , SE 90/ 1500 scan. "Ring" of increased signal in anterior part of lesion suggests hematoma (arrow) . Remainder of lesion had decreased or normal intensity, probably from calcium. Surrounding edema (arrowheads).
every case because of the time needed for routine axial scanning .
MR Appearances
The SE 30/500 pulse sequence demonstrates midline displacement and ventricular distortion similar to CT images. In addition, it is particularly useful for demonstrating compression of cortical sulci because of the long T1 of cerebrospinal fluid and freedom from bony artifacts. Tumors are seen as regions of decreased signal intensity in only a small number of cases. The technique is not as reliable as IR for demon-
strating changes in T1 relaxation. All lesions studied with SE 90/1500, 2000 appeared as
increased signal. The signal becomes more intense when the TE is prolonged to 120 msec. These appearances are consistent with reports in the literature of increased T2 relaxation values in tumors [23] . In most cases, however, it is not possible to differentiate edema from tumor tissue using the TE and TR parameters limited to this range. It may be possible to separate them by using even longer TE. As the signal/ noise ratio diminishes with increasing TE, the TR or the number of signal averages has to be increased, resulting in prolonged scanning times that are impractical for clinical
876 LEE ET AL. AJNR:6. Nov/Dec 1985
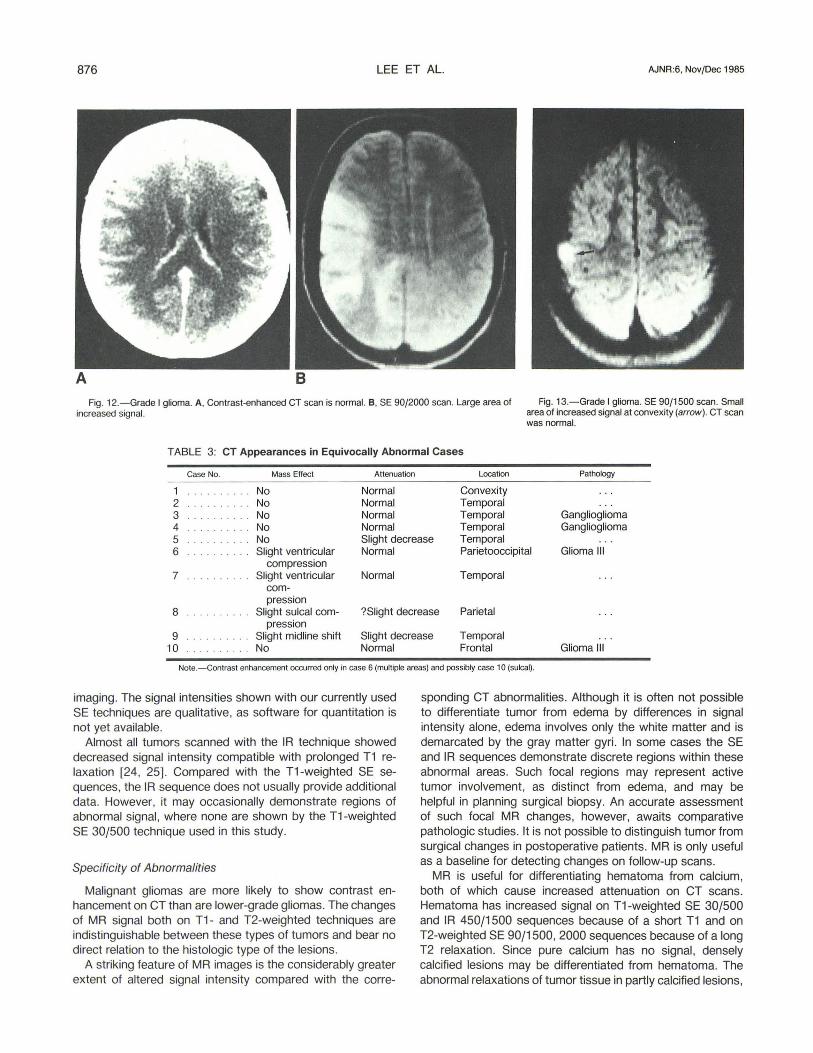
Fig. 12.- Grade I glioma. A. Contrast-enhanced CT scan is normal. B. SE 90/2000 scan. Large area of Fig. 13.-Grade I glioma. SE 90/1500 scan. Small increased signal. area of increased signal at convexity (arrow) . CT scan
was normal.
TABLE 3: CT Appearances in Equivocally Abnormal Cases
Case No. Mass Effect
1 No 2 . . . . . . . . . No 3 .. . .. .. . .. No 4 No
Attenuation
Normal Normal Normal Normal
Location
Convexity Temporal Temporal Temporal
Pathology
Ganglioglioma Ganglioglioma
5 ... ... . .. No Slight decrease Temporal 6 Slight ventricular Normal Parietooccipital Glioma III
compression 7 Slight ventricular Normal Temporal
com-pression
8 Slight sulcal com- ?Slight decrease Parietal pression
9 Slight midline shift Slight decrease Temporal 10 No Normal Frontal Glioma III
Note.-Contrast enhancement occurred only in case 6 (multiple areas) and possibly case 10 (sulcal).
imaging. The signal intensities shown with our currently used SE techniques are qualitative, as software for quantitation is not yet available.
Almost all tumors scanned with the IR technique showed decreased signal intensity compatible with prolonged T1 relaxation [24, 25]. Compared with the T1 -weighted SE sequences, the IR sequence does not usually provide additional data. However, it may occasionally demonstrate regions of abnormal signal, where none are shown by the T1-weighted SE 30/500 technique used in this study.
Specificity of Abnormalities
Malignant gliomas are more likely to show contrast enhancement on CT than are lower-grade gliomas. The changes of MR signal both on T1- and T2-weighted techniques are indistinguishable between these types of tumors and bear no direct relation to the histologic type of the lesions.
A striking feature of MR images is the considerably greater extent of altered signal intensity compared with the corre-
sponding CT abnormalities. Although it is often not possible to differentiate tumor from edema by differences in signal intensity alone, edema involves only the white matter and is demarcated by the gray matter gyri. In some cases the SE and IR sequences demonstrate discrete regions within these abnormal areas. Such focal regions may represent active tumor involvement, as distinct from edema, and may be helpful in planning surgical biopsy. An accurate assessment of such focal MR changes, however, awaits comparative pathologic studies. It is not possible to distinguish tumor from surgical changes in postoperative patients. MR is only useful as a baseline for detecting changes on follow-up scans.
MR is useful for differentiating hematoma from calcium, both of which cause increased attenuation on CT scans. Hematoma has increased signal on T1-weighted SE 30/500 and IR 450/1500 sequences because of a short T1 and on T2-weighted SE 90/1500, 2000 sequences because of a long T2 relaxation . Since pure calcium has no signal, densely calcified lesions may be differentiated from hematoma. The abnormal relaxations of tumor tissue in partly calcified lesions,
AJNR:6, Nov/Dec 1985 MR OF SUPRATENTORIAL TUMORS 877
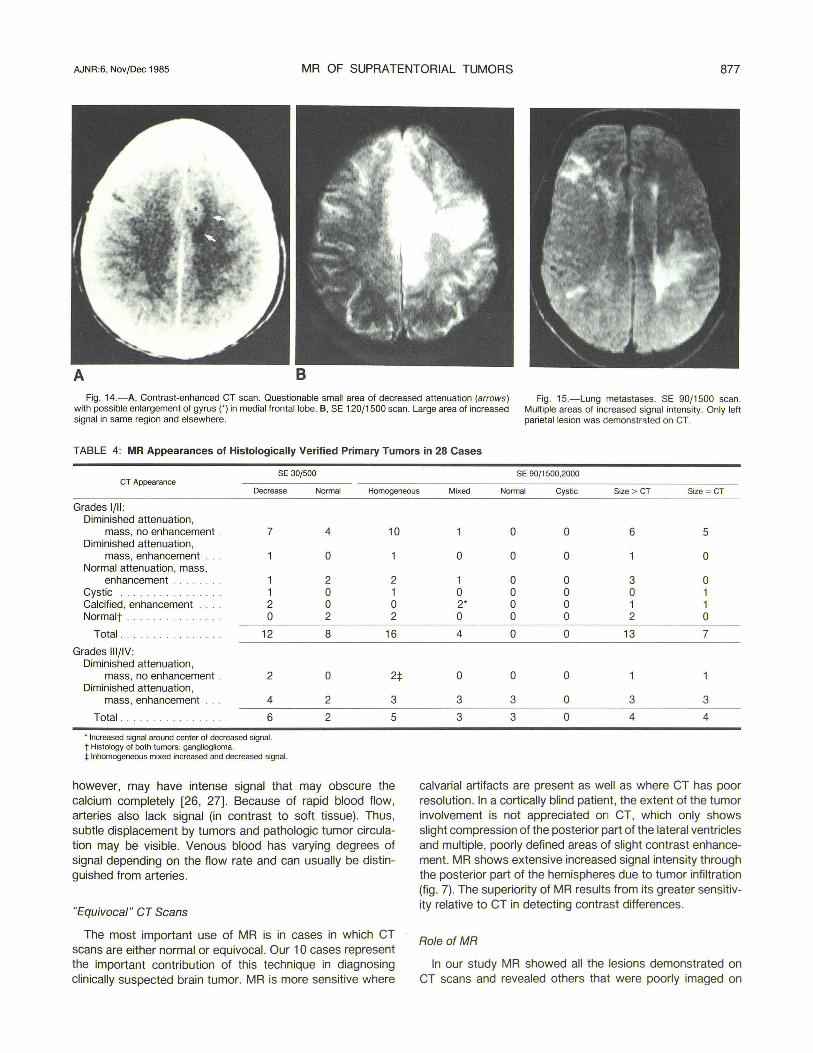
A B Fig. 14.-A, Contrast-enhanced CT scan. Questionable small area of decreased attenuation (arrows)
with possible enlargement of gyrus n in medial frontal lobe. e, SE 120/1500 scan. Large area of increased signal in same region and elsewhere.
Fig. 15.-Lung metastases. SE 90/1500 scan. Multiple areas of increased signal intensity. Only left parietal lesion was demonstr~ted on CT.
TABLE 4: MR Appearances of Histologically Verified Primary Tumors in 28 Cases
SE 301500 SE 90/1500,2000 CT Appearance
Decrease Normal Homogeneous Mixed Normal Cystic Size > CT Size ~ CT
Grades 1/11: Diminished attenuation,
mass, no enhancement . 7 Diminished attenuation,
mass, enhancement Normal attenuation, mass,
enhancement . 1 Cystic .............. .. 1 Calcified, enhancement 2 Normalt · 0
Total . .. .. . .... . .... 12
Grades III/IV: Diminished attenuation,
mass, no enhancement . 2 Diminished attenuation,
mass, enhancement 4
Total 6
, Increased signal around center of decreased signal. t Histology of Doth tumors: ganglioglioma. :I: Inhomogeneous mixed increased and decreased signal.
4 10
0
2 2 0 1 0 0 2 2
8 16
0 2:j:
2 3
2 5
however, may have intense signal that may obscure the calcium completely [26, 27]. Because of rapid blood flow, arteries also lack signal (in contrast to soft tissue). Thus, subtle displacement by tumors and pathologic tumor circulation may be visible. Venous blood has varying degrees of signal depending on the flow rate and can usually be distinguished from arteries.
"Equivocal" CT Scans
The most important use of MR is in cases in which CT scans are either normal or equivocal. Our 10 cases represent the important contribution of this technique in diagnosing clinically suspected brain tumor. MR is more sensitive where
0 0 6 5
0 0 0 0
1 0 0 3 0 0 0 0 0 1 2' 0 0 1 1 0 0 0 2 0
4 0 0 13 7
0 0 0
3 3 0 3 3
3 3 0 4 4
calvarial artifacts are present as well as where CT has poor resolution. In a cortically blind patient, the extent of the tumor involvement is not appreciated on CT, which only shows slight compression of the posterior part of the lateral ventricles and multiple, poorly defined areas of slight contrast enhancement. MR shows extensive increased signal intensity through the posterior part of the hemispheres due to tumor infiltration (fig. 7). The superiority of MR results from its greater sensitivity relative to CT in detecting contrast differences.
Role of MR
In our study MR showed all the lesions demonstrated on CT scans and revealed others that were poorly imaged on
CT scans. Diagnosis of brain tumor is dependent on spatial resolution and contrast sensitivity. The spatial resolution of the two techniques is very similar, and both are equally accurate for demonstrating distortion of ventricles and midline structures. Lesions near the surface of the brain are difficult to detect by CT because of calvarial artifacts and are much better studied with MR. The latter technique reveals subtle compression and distortion of the sulci by edema.
Contrast sensitivity of CT is relatively poor, so that intravenous contrast enhancement is routinely required to increase the visibility of the vascular and blood-brain barrier components of supratentorial tumors. However, MR is very sensitive in detecting differences in signal intensities between normal and abnormal structures and is able to demonstrate lesions that are invisible on CT scans. On the basis of our results, we believe that MR should be the initial screening method for evaluating suspected brain tumor.
Future MR scanners with stronger magnetic fields will undoubtedly have higher spatial resolution, which may reveal subtle displacement of normal structures [28]. Evidence from studies performed on tissues in vitro indicate that contrast differences diminish because of the convergence of T1 relaxation times with increasing field strength [28, 29]. If this is also true with detection of lesions, such higher-strength scanners may be less sensitive than current scanners in imaging infiltrative supratentorial tumors that have little or no mass effect. Final evaluation awaits further clinical comparison with scanners of different field strengths.
Metastases
The role of MR in evaluating metastases is unclear, since there were only a few cases in our study. On the basis of our limited experience MR reveals more lesions than does CT, although the signal characteristics are indistinguishable from those of primary tumors. A more definitive assessment awaits a comparative study of a larger number of cases.
REFERENCES
1. Ambrose J, Gooding MR, Richardson AE. An assessment of the accuracy of computerized transverse axial scanning (EM I scanner) in the diagnosis of intracranial tumour. Brain 1975;98 :569-582
2. New PF, Scott WR .. Schnur JA, Davis KR , Taveras JM, Hochberg FH. Computed tomography with the EMI scanner in the diagnosis of primary and metastatic intracranial neoplasm. Radiology 1975;114 :75-87
3. Thomson JLG. Computerised axial tomography and the diagnosis of 100 consecutive histologically proven cases. Clin Radiol 1976;27:431-441
4. Steinhoff H, Lanksch W, Kazner E, et al. Computed tomography in the diagnosis and differential diagnosis of glioblastomas. Neuroradiology 1977;14 : 193- 200
5. Wende S, Aulich A, Schindler E, et al. A German multicenter study of intracranial tumors. du Boulay GH , Moseley IF, eds. The First European Seminar on Computerised Axial Tomography in Clinical Practice. Berlin: Springer-Verlag, 1977: 123-140
6. Claveria LE, Kendall BE, du Boulay GH . Computerised axial tomography in supratentorial gliomas and metastases. In: du Boulay GH, Moseley IF, eds. The First European Seminar on Computerised Axial Tomography in Clinical Practice. Berlin : Springer-Verlag , 1977:204-222
7. Kendall BE, Jakubowski J, Pulicino P, Symon L. Difficulties in diagnosis of supratentorial gliomas by CAT scan. J Neurol Neurosurg Psychiatry 1979;42:485-492
8. Baker HL, Houser OW, Campbell JK. National Cancer Institute Study: evaluation of computed tomography in the diagnosis of intracranial neoplasm. Radiology 1980;136:91-96
9. Tentler RL, Palacio E. False-negative computerized tomography in brain tumor. JAMA 1977;238:339-340
10. Wulff JD, Proffitt PO, Panszi JG, Ziegler OK. False-negative CTs in astrocytomas: the value of repeated scanning. Neurology (NY) 1982;32:766-769
11 . Shalen PR, Hayman LA, Wallace S, Handel SF. Protocol for delayed contrast enhancement in computed tomography in cerebral neoplasia. Radiology 1981;139 :397-402
12. Bydder GM, Steiner RE. NMR imaging of the brain. Neuroradiology 1982;23 :231-240
13. Crooks L, Arakawa M, Hoenninger J, et al. Nuclear magnetic resonance whole body imager operating at 3.5 kGauss. Radiology 1982;143 :169-174
14. Bydder GM, Steiner RE, Young IR, et al. Clinical NMR imaging of the brain : 140 cases. AJNR 1982;3 :459-480, AJR 1982;139 :215-236
15. Young IR, Bailes DR, Burl M, et al. Initial clinical evaluation of the whole body nuclear magnetic resonance (NMR) tomograph. J Comput Assist Tomogr 1982;6 :1-18
16. Crooks LE, Ortendahl DA, Kaufman L, et al. Clinical efficiency of nuclear magnetic resonance imaging. Radiology 1983;146 :123-128
17. Steiner RE. The Hammersmith clinical experience with nuclear magnetic resonance. Clin Radio/1983;34: 13-23
18. Worthington BS. Clinical prospects of nuclear magnetic resonance. Clin Radio/1983;34 :3-12
19. Crooks LE, Mills CM, Davis PL, et al. Visualization of cerebral and vascular abnormalities by NMR imaging. The effects of imaging parameters on contrast. Radiology 1982;144:843-852
20. Brant-Zawadzki M, Davis PL, Crooks LE, et al. NMR demonstration of cerebral abnormalities: comparison with CT. AJNR 1983;4: 117-124, AJR 1983;140:847-854
21. Brant-Zawadzki M, Badami JP, Mills CM, Norman 0, Newton TH. Primary intracranial tumor imaging: a comparison of magnetic resonance and CT. Radiology 1984;150 :435-440
22. Kneeland JB, Knowles RJR, Cahill PT. Magnetic resonance imaging systems: optimization in clinical use. Radiology 1984;153:473-478
23. Le Bas JF, Leviel JL, Decorps M, Benabid AL. NMR relaxation times from serial stereotactic biopsy in human brain tumors. J Comput Assist Tomogr 1984;8 :1048-1057
24. Damadian R, Zaner K, Hor 0, et al. Human tumors by NMR. Physiol Chem Physics 1973;5 :381-401
25. Brady TJ, Buonanno FS, Pykett IL, et al. Preliminary clinical results of proton (1 H) imaging of cranial neoplasms: in vivo measurements of T1 and mobile proton density. AJNR 1983;4: 225-228
26. Peterman SB, Steiner RE, Bydder GM. Evaluation of brainstem tumor with MR imaging. In: Proceedings of the third annual meeting of the Society of Magnetic Resonance in Medicine. Berkeley, CA: Society of Magnetic Resonance in Medicine, 1984;581-582
27. Zimmerman RD, Fleming CA, Saint-Louis LA, Lee BCP, Manning JJ, Deck MDF. MR imaging of meningiomas. AJNR 1985;6: 149-157
28. Hart HR, Bottomley PA, Edelstein WA, et al. Nuclear magnetic resonance imaging: contrast-to-noise ratio as a function of strength of magnetic field. AJR 1983;141: 1195-1201
29. Koenig SH, Brown RD III , Adams 0 , Emerson 0 , Harrison CG. Magnetic field dependence of 1fT1 of proton in tissues. Invest Radio/1984;19 :76-81


![of [3H]PGF1x. - NCBI](https://img.pdfslide.net/doc/110x75/634d8ccba3f58bc38f088adc/of-3hpgf1x-ncbi.jpg)

