Embed Size (px)
Citation preview

Multi-modality in One-class Classification
Matthijs HovelynckCognitive Artificial Intelligence
Utrecht University, The [email protected]
Boris ChidlovskiiXerox Research Centre Europe
6, chemin de Maupertuis, Meylan, [email protected]
ABSTRACTWe propose a method for improving classification performance ina one-class setting by combining classifiers of different modalities.We apply the method to the problem of distinguishing responsivedocuments in a corpus of e-mails, like Enron Corpus. We extractthe social network of actors which is implicit in a large body ofelectronic communication and turn it into valuable features for clas-sifying the exchanged documents. Working in a one-class settingwe follow a semi-supervised approach based on the Mapping Con-vergence framework. We propose an alternative interpretation, thatallows for broader applicability when positive and negative itemsare not naturally separable. We propose an extension to the one-class evaluation framework in truly one-case cases when only somepositive training examples are available. We extent the one-classsetting to the co-training principle that enables us to take advan-tage of multiple views on the data. We report evaluation results ofthis extension on three different corpora including Enron Corpus.
Categories and Subject DescriptorsI.2.6 [Artificial Intelligence]: Learning; H.2.8 [Database Appli-cations]: Data Mining; H.4.3 [Communications Applications]:[Electronic mail]
General TermsAlgorithms, Measurement, Performance
KeywordsEnron, one-class classification, responsiveness, co-training
1. INTRODUCTIONIn a world where information becomes available in ever increas-
ing quantities, document classification plays an important role. Ob-vious applications range from search engines to spam filtering, butalso more specific tasks can be approached with the same tech-niques. In this paper we address a particular problem when thedocuments are reviewed by legal experts in large corporate litiga-tion cases.
In common law judiciary systems, during the pre-trial processof discovery, litigants are commanded by means of a subpoena tobring any relevant documents to the court. In cases involving largecorporations, this means that lawyers have to go through the records
Copyright is held by the International World Wide Web Conference Com-mittee (IW3C2). Distribution of these papers is limited to classroom use,and personal use by others.WWW 2010, April 26–30, 2010, Raleigh, North Carolina, USA.ACM 978-1-60558-799-8/10/04.
that those are obliged to keep and produce any responsive docu-ments (i.e. that could be of importance to the case). The number ofdocuments under review could easily run in the millions.
The review of documents has to be done by legal experts and isvery time-consuming. Even for human annotators the accuracy isnot very high; moreover an important mismatch usually exists be-tween annotations by different people. It turns out that both speedand accuracy of reviewers can be improved dramatically by group-ing and ordering documents.
Different technologies have been developed to support humanannotators that mine the corpus structure and present documents ina natural order [3, 13]. Some take into account the textual contentsof documents only. Obviously, other levels of description, such asthe group of people that worked on the document or the visual lay-out, could be of importance in distinguishing relevant items. Thisidea could be applied in a multitude of different tasks, but classifi-cation towards responsiveness provides an ideal testbed since doc-ument review intuitively takes different criteria into consideration,not just the textual contents.
The publicly available Enron Corpus consists of about 250,000e-mails from the accounts of 150 top managers of Enron Corpora-tion around the time of the collapse of this U.S. energy giant. Be-sides coming from a community that has been a subject to corporatelitigation, e-mails allow one to successfully construct an alternativerepresentation of documents. Considerable structure may be hid-den within a large body of e-mails from a community: the socialnetwork that is implicit in the group of people communicating oneto another. In the following, we will use the term of multi-modalityto refer to different levels of document description to aid classifica-tion tasks.
Considering responsive documents in the Enron Corpus, we tar-get improving classification performance in a one-class setting bycombining classifiers of different modalities. Being specifically ap-plied to the problem of distinguishing responsive documents in acorpus of e-mails, we hope that the same principles might be suc-cessfully applied to similar classification problems.
The contributions of this paper can be summarized as follows:
• Working in a one-class setting we adopt a semi-supervisedapproach based on the Mapping Convergence framework [31].For broader applicability we propose an alternative interpre-tation that allows to size down the requirement on the naturalseparability of positive and negative items.
• We propose an extension to the one-class evaluation frame-work which turns to be useful when a small number of posi-tive training examples are available and the ratio of positivesis unknown. We use UCI and INEX08 datasets to prove itsusefullness.
WWW 2010 • Full Paper April 26-30 • Raleigh • NC • USA
441

• We extent the one-class setting to the co-training [4] that en-ables us to take advantage of the availability of multiple re-dundant views on the data. We evaluate the Mapping Co-Convergence on the responsiveness task in Enron Corpus.
• We propose a way to turn the social network that is implicitin a large body of electronic communication into valuablefeatures for classifying the exchanged documents.
• We show that a combination of text-based and social network-based modalities does improve classification results.
The paper is organized as follows. In Section 2 we introducethe responsiveness task on the Enron Corpus, then we report on thecleaning steps required to preprocess the data set. In Section 3 wepresent the text-based representation of documents, and one basedon the implicit social network. Then in Section 4 we discuss theone-class setting and the Mapping Convergence principle. We ex-tend the one-class evaluation framework and describe how to com-bine multiple modalities by co-training. In Section 5 we presenta number of evaluation results obtained on the INEX08 and LetterRecognition datasets and the Enron Corpus. Section 7 enumeratesthe most important conclusions of our study.
2. THE ENRON CORPUSLarge bodies of documents, resembling the ones when review-
ing for corporate litigation, are very rare to appear in the publicdomain. Both privacy-related and legal issues make often such col-lections, in the rare case that they are assembled at all, unpublish-able. Consequently, the Enron Corpus is, with respect to its sheersize and completeness, unique in its kind. Containing all e-mailssent and received by some 150 accounts of the top managementof Enron and spanning a period of several years, the total num-ber of messages reaches about 250,000. Almost no censorship hasbeen applied to the contents, resulting in a vast variety of subjectsranging from business related topics to strictly personal messages.It is no wonder that the Enron Corpus opened up completely newpossibilities to the research, including subject classification [18],folder detection [3], social network analysis [27], hierarchy detec-tion [25], identity modeling [10], reconstruction of threading [30]and large (e-mail) network visualization [13].
Our approach is complementary to previous work in that we ex-plicitly use the multi-modality of e-mails for classification. E-mailsconsist of text, but also implicitly instantiates a social network ofpeople. We model these distinct levels and combine them to clas-sify towards responsiveness, whether or not the message is of in-terest with respect to a particular litigation trial. Intuitively such adecision requires an integration of different aspects: not only thetopic of an e-mail, but also the sender and receivers are relevant.
There exist several versions of the Enron Corpus available on-line. Besides the raw text corpus [8], a relational database versionis also available [27]. In this database, however, some importantinformation regarding the social network has been discarded. Thisinformation is very important in our approach, thus we construct adatabase from scratch.
2.1 Responsive documentsWhen large corporations get involved in litigation and receive a
subpoena to produce evidence regarding some case, they have togo through enormous amounts of data to obey the court order. Thenumber of documents to be taken into account can run in the mil-lions. Review has to be done by legal experts working at a rate of400-1000 documents per day, leading to enormous costs. The eco-nomic interest of speeding up and improving the process of finding
documents that are responsive (i.e. relevant) to the subpoena isconsiderable.
Different studies have shown that tools that group and order doc-uments yield good results. In order to support human documentreview one would require a large set of pre-annotated data. Sev-eral attempts have been made to manually annotate fragments ofthe Enron Corpus [3]. All of them are relatively small and typicallyannotated with subject, emotional tone or other primary properties.Annotation with responsiveness is tedious and expensive, requireslegal expertise and is usually not publicly available.
Our solution is to use the lists of government exhibits publishedon the website of the United States Department of Justice (DOJ) 1.More specifically we use the set of e-mails used in the trials againstthe two CEO’s of Enron, Ken Lay and Jeff Skilling; this set actuallyreflects the part of the corpus that has been found of interest.
From the DOJ we obtain a list of 186 e-mails. Being a very smallset compared to the size of the entire corpus, we expect that the setcovers most types of e-mails found to be relevant, yet we expectthat a lot of tokens did not make it there. The corpus potentiallycontains many practically identical messages that do not appear onthe exhibit list.
Working with the DOJ set means that we have to work in a one-class setting. The algorithm we will develop in the next sectionswill be specifically aimed at classifying items based on a very smallset of positive training examples and a large amount of unlabeleddata explicitly using multiple views of the objects.
2.2 Data cleaningThe Enron Corpus contains a large number of duplicate mes-
sages, ambiguous references to actors and other inconsistencies.The first problem is due to the automatic generation of the e-mailfolders (e.g. all documents, sent items) and e-mails copies appear-ing both in sender’s and receiver’s folders. We unify identical mes-sages using their titles and body digests.
The second problem is the existence of ambiguities and inconsis-tencies among the references in sender and receiver fields. To ex-tract the implicit social network, we identify the references whichare pointing to the same person. For example, ‘Richard Buy’, ‘RickBuy’, ‘Richard B. Buy’, ‘[email protected]’, ‘[email protected]’, ‘Buy-R’, etc. probably all refer to the same person.
We use regular expressions to extract firstname, lastname and,when available, e-mail address from all references. Ee first re-assemble references occuring in the headers of the same message.Then we relate them to references in other messages. An actor is acollection of references pointing to the same person. We use the e-mail address as a primary cue. Secondly, for each yet unidentifiedreference we search for possible matches in the set of actors withthe same last name based on first name, prefix, middle name and/ornicknames (from a list of common US English nicknames).
2.3 Resulting data setAfter the message deduplication and reference resolution, the
resulting database contains 248,155 messages and a network of114,986 different actors. Despite all our efforts, some ambiguityand inconsistency may still exist.
Key characteristics of the resulting set are displayed in Figure 1.In the first plot, we see that the frequency of words follows thepower law distribution. The second plot shows the distribution ofmessage sizes. The main peak is around 11 words, with most massfor lengths between 10 and 300 words. Importantly, the averagee-mail is a relatively short text, one more reason to try to use otherproperties in classification. The third plot shows that even though1http://www.usdoj.gov/enron/jury_trial.htm.
WWW 2010 • Full Paper April 26-30 • Raleigh • NC • USA
442

100
102
104
106
100
102
104
106
Average: 150.6
occurrences per word
word
# of
occ
urre
nces
100
101
102
103
104
0
1000
2000
3000
4000message size
# of words
# of
mes
sage
s
100
105
100
101
102
103
104
Average: 12.3
messages per sender
actor
# of
mes
sage
s
100
102
104
106
100
101
102
103
104
Average: 6.2
receivers per message
message
# of
rec
eive
rs
Figure 1: Characteristics of the resulting data set.
there are some very active actors in the network, most are sendingvery few e-mails. The number of receivers per message fits thepower law distribution; there are some e-mails with an enormousamount of receivers (up to 1000), but most communication is aimeda small group of recipients.
3. DOCUMENT REPRESENTATIONThe most obvious level of document representation is the textual
content. It includes the body and subject fields in a bag-of-wordsrepresentation, that has proven to be well suited for classification.The idea is to construct a vector where each feature represents aword in the lexicon and the feature values express some weight.
Then we propose a representation based on the role of sendersand receivers of the message in the network of people exchanginginformation. Intuitively this second level of description also playsa role for human annotators in deciding whether or not a documentis responsive to a subpoena.
3.1 Text representationWe generate the lexicon by applying a number of criteria, in par-
ticular, we choose terms with a minimum occurrence of 4 in theentire corpus and a minimum length of 3 characters. Also, all key-words are stemmed with a Porter stemmer and lowercased.
We then construct vectors with each feature representing oneword. The document frequency df of a word w is the number ofdocuments it occurs in, the term frequency tf is the number of wordoccurrences in a document d, N is the number of documents. Forthe experiments, we consider three different text representations:binary, frequency and tf-idf values, defined as follows:
binary(w,d) =
j1 if w occurs in d0 otherwise
frequency(w,d) = tf
tf-idf(w,d) = tf · log(N/df).
The feature set based on a bag-of-words representation are high-dimensional (around 105,000) and the feature vectors are very sparse.This makes it particularly suited for the SVM classification with alinear kernel [14]. There is a lot of redundancy in the feature vec-tor: a document typically has a large number of cues that signal aparticular classification.
Another problem with high-dimensional feature spaces for one-class classifier is the so-called curse of dimensionality [11]. It hasbeen observed that noise hurts performance significantly, especiallyin the case of learning from unbalanced data. To investigate this ef-fect, we test two alternative ways to reducing the feature space. Thefirst is based on the feature selection where we select a subset of Fwords the highest document frequency. The other way of reduc-ing the dimensionality is by semantic clustering of features. Weuse a soft clustering approach proposed in [2]. Maximal cliques inthe co-occurrence graph are clustered to obtain a score indicatingthe probability a word belongs to each cluster. Using this approach
we obtain feature vectors of length 6,522, where each feature rep-resents a certain semantic field. Ambiguous words contribute tomultiple features.
3.2 Implicit social networkNetwork structures have received a lot of attention in scientific
literature and have proven to be useful in diverse fields like soci-ology, biology, computer science and epidemiology [19]. With theadvent of techniques to handle large graphs and the emergence ofhuge, real-life linked structures on the internet, structure in socialnetworks has become a subject of intensive research.
The structure of a large e-mail corpus, like Enron, is not ho-mogeneous. The lines of communication implicitly instantiate anetwork of actors. By setting thresholds on the minimal numberof e-mails per connection, one can generate graphs with differentlevels of connectedness. We set this threshold to 2, making sureto keep the majority of the traffic while discarding any accidentallinks with no or little meaning. Due to the power law distributionof the connection strength, this reduces the number of actors con-siderably, without losing much of relevant information. We takethe largest connected component (95% of the actors) of this graph,resulting in a network of 30,094 actors.
We expect our social network features to represent the position/roleof correspondents in the corporate network. It has been shown thatcertain properties of nodes in a communication graph can servevery well to automatically detect the social role of actors in thenetwork [25]. We adopt and report below a set of commonly usedfeatures to represent key properties of actors [5, 25].
The communication network is a directed weighted graph G =〈V, E〉, where V contains n nodes and the weight w of edge (s, t) ∈E reflects the activity from s to t (the number of e-mails sent). Thefirst feature represents the activity of the actor in the network:
1. the number of e-mails sent, m(v) =P
(v,t)∈E w(v, t).
In hypertext classification two features, that represent the author-ity that is assigned to nodes by its peers, have proven to be veryvaluable. Nodes with a high number of incoming edges from hubsare considered to be authorities, nodes linking to a large number ofauthorities are hubs [15].
2. hub score h(v) is given by v-th element of the principaleigenvector of AAT where A is the adjacency matrix cor-responding to graph G;
3. authority score a(h) is given by v-th element of the principaleigenvector of AT A.
The next group is a set of different centrality measures to modelthe position of the node in network. These depend on a undirectedunweighted version G′ = 〈V, E′〉 of graph G. We calculate theshortest paths in G′ using a Matlab library for working with largegraphs [12]. We obtain the distance dst from node s to t and thenumber σst of paths from s to t. The number of paths from s to tvia v is denoted as σst(v):
WWW 2010 • Full Paper April 26-30 • Raleigh • NC • USA
443
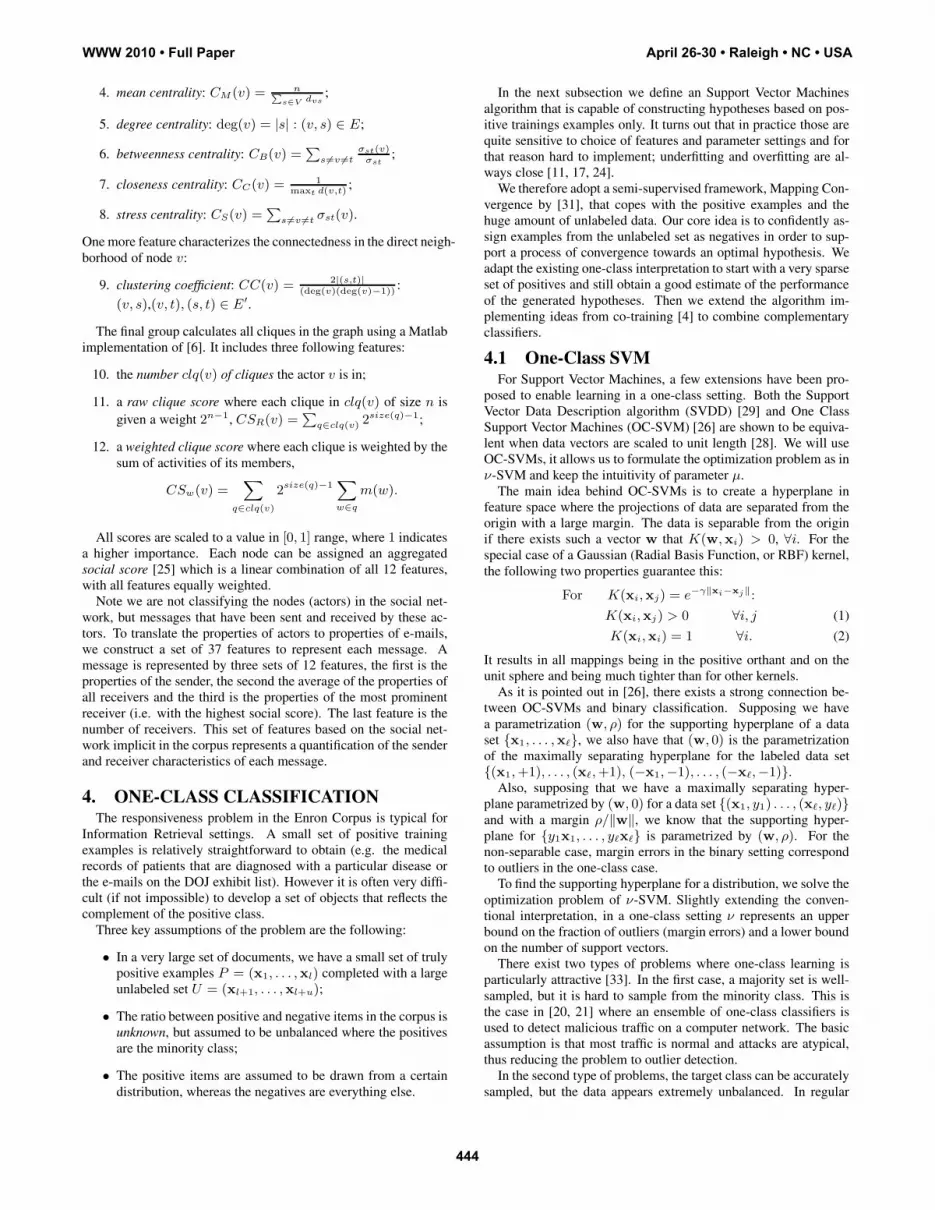
4. mean centrality: CM (v) = nPs∈V dvs
;
5. degree centrality: deg(v) = |s| : (v, s) ∈ E;
6. betweenness centrality: CB(v) =P
s�=v �=tσst(v)
σst;
7. closeness centrality: CC(v) = 1maxt d(v,t)
;
8. stress centrality: CS(v) =P
s�=v �=t σst(v).
One more feature characterizes the connectedness in the direct neigh-borhood of node v:
9. clustering coefficient: CC(v) = 2|(s,t)|(deg(v)(deg(v)−1))
:
(v, s),(v, t), (s, t) ∈ E′.
The final group calculates all cliques in the graph using a Matlabimplementation of [6]. It includes three following features:
10. the number clq(v) of cliques the actor v is in;
11. a raw clique score where each clique in clq(v) of size n isgiven a weight 2n−1, CSR(v) =
Pq∈clq(v) 2size(q)−1;
12. a weighted clique score where each clique is weighted by thesum of activities of its members,
CSw(v) =X
q∈clq(v)
2size(q)−1Xw∈q
m(w).
All scores are scaled to a value in [0, 1] range, where 1 indicatesa higher importance. Each node can be assigned an aggregatedsocial score [25] which is a linear combination of all 12 features,with all features equally weighted.
Note we are not classifying the nodes (actors) in the social net-work, but messages that have been sent and received by these ac-tors. To translate the properties of actors to properties of e-mails,we construct a set of 37 features to represent each message. Amessage is represented by three sets of 12 features, the first is theproperties of the sender, the second the average of the properties ofall receivers and the third is the properties of the most prominentreceiver (i.e. with the highest social score). The last feature is thenumber of receivers. This set of features based on the social net-work implicit in the corpus represents a quantification of the senderand receiver characteristics of each message.
4. ONE-CLASS CLASSIFICATIONThe responsiveness problem in the Enron Corpus is typical for
Information Retrieval settings. A small set of positive trainingexamples is relatively straightforward to obtain (e.g. the medicalrecords of patients that are diagnosed with a particular disease orthe e-mails on the DOJ exhibit list). However it is often very diffi-cult (if not impossible) to develop a set of objects that reflects thecomplement of the positive class.
Three key assumptions of the problem are the following:
• In a very large set of documents, we have a small set of trulypositive examples P = (x1, . . . ,xl) completed with a largeunlabeled set U = (xl+1, . . . ,xl+u);
• The ratio between positive and negative items in the corpus isunknown, but assumed to be unbalanced where the positivesare the minority class;
• The positive items are assumed to be drawn from a certaindistribution, whereas the negatives are everything else.
In the next subsection we define an Support Vector Machinesalgorithm that is capable of constructing hypotheses based on pos-itive trainings examples only. It turns out that in practice those arequite sensitive to choice of features and parameter settings and forthat reason hard to implement; underfitting and overfitting are al-ways close [11, 17, 24].
We therefore adopt a semi-supervised framework, Mapping Con-vergence by [31], that copes with the positive examples and thehuge amount of unlabeled data. Our core idea is to confidently as-sign examples from the unlabeled set as negatives in order to sup-port a process of convergence towards an optimal hypothesis. Weadapt the existing one-class interpretation to start with a very sparseset of positives and still obtain a good estimate of the performanceof the generated hypotheses. Then we extend the algorithm im-plementing ideas from co-training [4] to combine complementaryclassifiers.
4.1 One-Class SVMFor Support Vector Machines, a few extensions have been pro-
posed to enable learning in a one-class setting. Both the SupportVector Data Description algorithm (SVDD) [29] and One ClassSupport Vector Machines (OC-SVM) [26] are shown to be equiva-lent when data vectors are scaled to unit length [28]. We will useOC-SVMs, it allows us to formulate the optimization problem as inν-SVM and keep the intuitivity of parameter μ.
The main idea behind OC-SVMs is to create a hyperplane infeature space where the projections of data are separated from theorigin with a large margin. The data is separable from the originif there exists such a vector w that K(w, xi) > 0, ∀i. For thespecial case of a Gaussian (Radial Basis Function, or RBF) kernel,the following two properties guarantee this:
For K(xi,xj) = e−γ‖xi−xj‖:
K(xi,xj) > 0 ∀i, j (1)
K(xi,xi) = 1 ∀i. (2)
It results in all mappings being in the positive orthant and on theunit sphere and being much tighter than for other kernels.
As it is pointed out in [26], there exists a strong connection be-tween OC-SVMs and binary classification. Supposing we havea parametrization (w, ρ) for the supporting hyperplane of a dataset {x1, . . . ,x�}, we also have that (w, 0) is the parametrizationof the maximally separating hyperplane for the labeled data set{(x1, +1), . . . , (x�, +1), (−x1,−1), . . . , (−x�,−1)}.
Also, supposing that we have a maximally separating hyper-plane parametrized by (w, 0) for a data set {(x1, y1) . . . , (x�, y�)}and with a margin ρ/‖w‖, we know that the supporting hyper-plane for {y1x1, . . . , y�x�} is parametrized by (w, ρ). For thenon-separable case, margin errors in the binary setting correspondto outliers in the one-class case.
To find the supporting hyperplane for a distribution, we solve theoptimization problem of ν-SVM. Slightly extending the conven-tional interpretation, in a one-class setting ν represents an upperbound on the fraction of outliers (margin errors) and a lower boundon the number of support vectors.
There exist two types of problems where one-class learning isparticularly attractive [33]. In the first case, a majority set is well-sampled, but it is hard to sample from the minority class. This isthe case in [20, 21] where an ensemble of one-class classifiers isused to detect malicious traffic on a computer network. The basicassumption is that most traffic is normal and attacks are atypical,thus reducing the problem to outlier detection.
In the second type of problems, the target class can be accuratelysampled, but the data appears extremely unbalanced. In regular
WWW 2010 • Full Paper April 26-30 • Raleigh • NC • USA
444
bp b’p
h0 h1 h2 h3 hMCh’0h’1h’3h’n
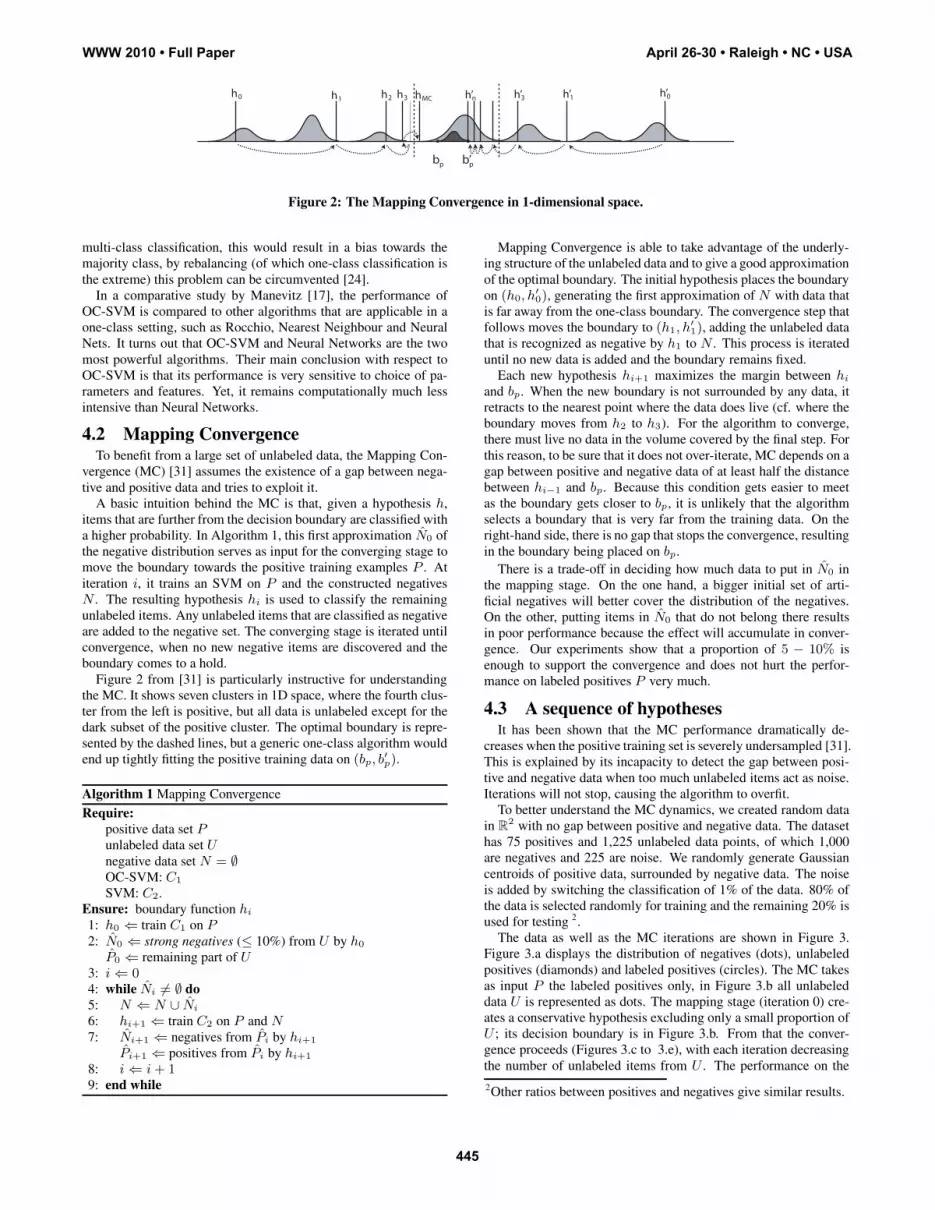
Figure 2: The Mapping Convergence in 1-dimensional space.
multi-class classification, this would result in a bias towards themajority class, by rebalancing (of which one-class classification isthe extreme) this problem can be circumvented [24].
In a comparative study by Manevitz [17], the performance ofOC-SVM is compared to other algorithms that are applicable in aone-class setting, such as Rocchio, Nearest Neighbour and NeuralNets. It turns out that OC-SVM and Neural Networks are the twomost powerful algorithms. Their main conclusion with respect toOC-SVM is that its performance is very sensitive to choice of pa-rameters and features. Yet, it remains computationally much lessintensive than Neural Networks.
4.2 Mapping ConvergenceTo benefit from a large set of unlabeled data, the Mapping Con-
vergence (MC) [31] assumes the existence of a gap between nega-tive and positive data and tries to exploit it.
A basic intuition behind the MC is that, given a hypothesis h,items that are further from the decision boundary are classified witha higher probability. In Algorithm 1, this first approximation N̂0 ofthe negative distribution serves as input for the converging stage tomove the boundary towards the positive training examples P . Atiteration i, it trains an SVM on P and the constructed negativesN . The resulting hypothesis hi is used to classify the remainingunlabeled items. Any unlabeled items that are classified as negativeare added to the negative set. The converging stage is iterated untilconvergence, when no new negative items are discovered and theboundary comes to a hold.
Figure 2 from [31] is particularly instructive for understandingthe MC. It shows seven clusters in 1D space, where the fourth clus-ter from the left is positive, but all data is unlabeled except for thedark subset of the positive cluster. The optimal boundary is repre-sented by the dashed lines, but a generic one-class algorithm wouldend up tightly fitting the positive training data on (bp, b′p).
Algorithm 1 Mapping ConvergenceRequire:
positive data set Punlabeled data set Unegative data set N = ∅OC-SVM: C1
SVM: C2.Ensure: boundary function hi
1: h0 ⇐ train C1 on P2: N̂0 ⇐ strong negatives (≤ 10%) from U by h0
P̂0 ⇐ remaining part of U3: i ⇐ 04: while N̂i = ∅ do5: N ⇐ N ∪ N̂i
6: hi+1 ⇐ train C2 on P and N7: N̂i+1 ⇐ negatives from P̂i by hi+1
P̂i+1 ⇐ positives from P̂i by hi+1
8: i ⇐ i + 19: end while
Mapping Convergence is able to take advantage of the underly-ing structure of the unlabeled data and to give a good approximationof the optimal boundary. The initial hypothesis places the boundaryon (h0, h
′0), generating the first approximation of N with data that
is far away from the one-class boundary. The convergence step thatfollows moves the boundary to (h1, h
′1), adding the unlabeled data
that is recognized as negative by h1 to N . This process is iterateduntil no new data is added and the boundary remains fixed.
Each new hypothesis hi+1 maximizes the margin between hi
and bp. When the new boundary is not surrounded by any data, itretracts to the nearest point where the data does live (cf. where theboundary moves from h2 to h3). For the algorithm to converge,there must live no data in the volume covered by the final step. Forthis reason, to be sure that it does not over-iterate, MC depends on agap between positive and negative data of at least half the distancebetween hi−1 and bp. Because this condition gets easier to meetas the boundary gets closer to bp, it is unlikely that the algorithmselects a boundary that is very far from the training data. On theright-hand side, there is no gap that stops the convergence, resultingin the boundary being placed on bp.
There is a trade-off in deciding how much data to put in N̂0 inthe mapping stage. On the one hand, a bigger initial set of arti-ficial negatives will better cover the distribution of the negatives.On the other, putting items in N̂0 that do not belong there resultsin poor performance because the effect will accumulate in conver-gence. Our experiments show that a proportion of 5 − 10% isenough to support the convergence and does not hurt the perfor-mance on labeled positives P very much.
4.3 A sequence of hypothesesIt has been shown that the MC performance dramatically de-
creases when the positive training set is severely undersampled [31].This is explained by its incapacity to detect the gap between posi-tive and negative data when too much unlabeled items act as noise.Iterations will not stop, causing the algorithm to overfit.
To better understand the MC dynamics, we created random datain R
2 with no gap between positive and negative data. The datasethas 75 positives and 1,225 unlabeled data points, of which 1,000are negatives and 225 are noise. We randomly generate Gaussiancentroids of positive data, surrounded by negative data. The noiseis added by switching the classification of 1% of the data. 80% ofthe data is selected randomly for training and the remaining 20% isused for testing 2.
The data as well as the MC iterations are shown in Figure 3.Figure 3.a displays the distribution of negatives (dots), unlabeledpositives (diamonds) and labeled positives (circles). The MC takesas input P the labeled positives only, in Figure 3.b all unlabeleddata U is represented as dots. The mapping stage (iteration 0) cre-ates a conservative hypothesis excluding only a small proportion ofU ; its decision boundary is in Figure 3.b. From that the conver-gence proceeds (Figures 3.c to 3.e), with each iteration decreasingthe number of unlabeled items from U . The performance on the
2Other ratios between positives and negatives give similar results.
WWW 2010 • Full Paper April 26-30 • Raleigh • NC • USA
445

a. the data b. 0: mapping c. 2: converging. . .
d. 5: optimal e. 15: overfitting f. performance curve
10 20 30 40 50 60 70 80 90 1000
10
20
30
40
50
60
70
80
90
100
convergence
15
5 2 0
Figure 3: Random data in R2: representation of Mapping Convergence and the P̂P performance curve.
positives P starts decreasing, until 15-th iteration where overfittingtakes place, as shown in Figure 3.e. Meanwhile, the fifth iterationproduces the classifier with a fairly accurate description of the data.
Finally, the plot in Figure 3.f shows how the hypotheses hi,i = 0, 1, 2, . . . are performing on separating out a small propor-tion of the entire data set (x-axis), while maintaining performanceon the positive subset (y-axis). This novel performance measure isformally defined in the following section. Unlike the standard mea-sures like precision/recall used on fully annotated data, the mainadvantage of the novel measure is its applicability in the truly one-class setting, when the true labels of U are unknown.
When working in the one-class setting, like the responsivenessin the Enron Corpus, we want to know when to stop the iterationsbefore overfitting occurs. We will consider the convergence as asequence of hypotheses, where each step is represented as a deci-sion boundary in the feature space, and identify the hypothesis hi
that maximizes some performance measure. The key idea is thathi should address a small part of U that retains a large part of thepositive items from P . In that way we will find a hypothesis thatstrikes a good bias-variance balance.
4.4 P̂P measureIn the following, we use curves like the one in Figure 3.f to track
the distinguishing power of a classifier. The MC produces a se-quence of classifiers hi, i = 0, 1, 2, . . .. For each hi, we ploton x-axis the percentage of the entire data set classified positively,P̂i/|U |. On the y-axis, we plot the percentage of the positives thatis found within that space, |P ∩ h+
i (P )|/|P |. We call it P̂P mea-sure. The one-class classifier h0 used in the mapping phase pro-duces the first (unconnected) point in the plane. Then we construct
the curve, starting from the right-top with the mapping hypothesisand moving left and down with each step.
The curve of P̂P measures can be interpreted in a ROC-likefashion. The upper left corner represents a perfect classifier, pointson the diagonal are random selection from U . On each iterationstep of MC, a classifier is generated that gives a point on a curvelike Figure 3.f. The first point in the convergence will be close tothe upper right corner: the mapping stage is about selecting a smallpart of the data set containing only near-certain negatives. Fromthere each iteration will lead to a smaller selection (it moves left),but potentially also a lower performance on the true positives (itmoves down). A large step leftwards corresponds to a large step inthe convergence: a lot of unlabeled data is identified as negative. Alarge step downwards signals a big loss in performance.
Contrary to a genuine ROC curve, the PP̂ -curve is not continu-ous, but a sequence of points (xi, yi), on the plane. Points (0,0)an (100,100) refer to the two naive decisions of retaining noneor all data in P and U . The first choice of the measuring is tobuild a piece-wise linear function induced by points (0,0), (xi, yi),(100,100). Unfortunately, the step-like behaviour of points (xi, yi)is not guaranteed. As we will see in Section 5, they may have anerratic behavior that makes impossible to calculate the area underthe curve (AUC).
An alternative to the AUC is to identify the point in the PP̂ -curve that discard most of data in U , while keeping a large part ofthe positive data P to be classified correctly. The point on the curvethat is closest to (0, 100) is considered as the best classifier. Thedistance measure can be weighted to assign more importance torecall or precision, in this paper we will use the Euclidean distance.
WWW 2010 • Full Paper April 26-30 • Raleigh • NC • USA
446

4.5 Generating hypotheses from unlabeled dataWhen applying the framework described above to the Enron case,
we should estimate the percentage of positives returned by each hy-pothesis hi when no labels are available for the largest part of thedata set. To calculate the percentage of data that is returned, we cansimply leave out part of the unlabeled data in the training phase anduse a prediction on that to estimate the performance.
As a solution, we introduce a cross-validation step in the algo-rithm. Each step in MC process is carried out with a 5-fold splitover the positive data P . We train a hypothesis on 4 parts, andpredict on the remaining fifth part and the entire unlabeled set U .This results in exactly one prediction per item in P , and then weaggregate the five predictions for the items in U to obtain a solidestimate of the performance of the hypothesis.
Note that LIBSVM by default predicts class labels it can produceprobability estimates for each of the classes, using a method byPlatt [22] that fits a logistic function to the output of an SVM togenerate posterior probabilities. This algorithm presumes that theequal distribution of positives and negatives in training and test sets.This is not the case in a one-class setting, nor in the convergencesteps where the distribution in the training set actually changes oneach step and converges to the actual one.
Therefore we altered the LIBSVM code to directly output thedistance to the decision plane and use it as a measure of the con-fidence of prediction. After scaling to (0,1) we can aggregate thepredictions of multiple classifiers, for example by taking averages.A more advanced way of capturing the confidence of predictionsmight be subject of future research.
Note that the introduction of a random five-way split in all stagesof the convergence introduces some irregularities in the outcome ofthe algorithm. Using a higher cross-validation will solve this, but ahigher computational cost.
4.6 Combining classifiersIn Section 2 we defined two complementary views of documents
in the Enron Corpus. Combining different classifiers to improveoverall performance is known as ensemble learning [9]. In thissection we propose to combine the MC algorithm with the idea ofco-training.
First we consider a naïve way of combining predictions. Whenthe MC algorithm produces a sequence of classifiers, we can gen-erate predictions on a test set on each of the steps. In fact this is ex-actly what we will do to determine the position in the performanceplane, using cross-validation for the positive examples.
Now suppose that we take one classifier based on view A and asecond based on view B. Both have classified all items in the testsets, but potentially have made errors. The idea is that when one ofthe two has made an error, it can be corrected by the second. Sinceeach prediction is a number in the [0,1] range and represents theconfidence, we can average these predictions over multiple classi-fiers. The classifier that is most certain will ‘win’ and, in case of anerror, correct the other.
An improvement of the performance will be easily recognized asa movement up or left (or both) in P̂P measure. Moving left inthe performance plane means a smaller part of U , while moving upcorresponds to retaining more positives from P . As we will see inSection 5, combining classifiers in this way results in exactly theseeffects.
If we can establish that combining the predictions of multipleclassifiers representing different modalities does indeed aid classi-fication, it would be interesting to see if we can adapt the MC algo-rithm to take the different views into account on each of the steps.We will have different classifiers cooperating in a way that closely
Algorithm 2 Mapping Co-ConvergenceRequire:
n views of the positive data set P (1), . . . , P (n)
n views of the unlabeled data set U (1), . . . , U (n)
n views of the negative data set N (1) = ∅, . . . , N (n) = ∅OC-SVM: C1
SVM: C2
Aggregation function: Agg.Ensure: boundary functions h
(1)i , . . . , h
(n)i
1: h(k)0 ⇐ train C1 on P (k) ∀k ∈ [1, . . . , n]
2: pred(k)0 ⇐ predict with h
(k)0 on U (k) ∀k ∈ [1, . . . , n]
3: N̂(k)0 ⇐ strong negatives (≤ 10%) in U (k) by
Agg(pred(0)0 , . . . , pred(n)
0 )
P̂(k)0 ⇐ remaining part of U (k) ∀k ∈ [1, . . . , n]
4: i ⇐ 05: while N̂
(k)i = ∅ ∀k ∈ [1, . . . , n] do
6: N (k) ⇐ N (k) ∪ N̂(k)i ∀k ∈ [1, . . . , n]
7: h(k)i+1 ⇐ train C2 on P (k) and N (k) ∀k ∈ [1, . . . , n]
8: pred(k)i+1 ⇐ predict with h
(k)i+1 on P̂
(k)i ∀k ∈ [1, . . . , n]
9: N̂(k)i+1 ⇐ strong negatives (≤ 5%) in P̂
(k)i by
Agg(pred(0)i+1, . . . , pred(n)
i+1)
P̂(k)i+1 ⇐ remaining part of P̂
(k)i ∀k ∈ [1, . . . , n]
10: i ⇐ i + 111: end while
resembles the concept of co-training [4]. On each step of the itera-tion the more confident classifier will be able to overrule the other.Predictions are aggregated and a fixed percentage of the items islabeled as negative. The Mapping Co-Convergence we propose isdepicted as Algorithm 2.
There are three important differences between Algorithm 2 andAlgorithm 1 discussed in Section 4.2. First, it starts with not onebut n different views of the data. Second, the views interact bymeans of the aggregation function that combines the predictions toselect the next items to label. Finally, in the convergence phase, notall items recognized as negative are added to N , but only the onesthat are agreed upon with the highest certainty are labeled, limitedto 5% of the entire data set.
Note that the two-step assemble learning is not a unique way tocombine different modalities. In Web page classification [23], thereexist other techniques to take both content and links structure intoaccount. Simple approaches convert one type of information to theother. For example, in spam blog classification, Kolari et al. [16]concatenate outlink features with the content features of the blog.Other techniques [32] try to jointly process all modalities. Theyuse the same set of latent concepts to simultaneously capture thepairwise relationships between modalities. One-class classificationwith the joint modeling of different modalities may be a subject offurther research.
5. RESULTS AND ANALYSISWe develop our framework in Python, and use the LIBSVM li-
brary [7]. We use the linear kernel for the text-based feature setsand the Gaussian kernel with the social network-based sets. An im-portant parameter for both is ν, that bounds the number of marginerrors or outliers. By picking a small value, we ensure that the al-gorithm is forced to come up with algorithms that stay true as muchas possible to the training data we gave it. We pick ν = 0.1 for allexperiments. For the Gaussian kernel we also have the γ parameter,
WWW 2010 • Full Paper April 26-30 • Raleigh • NC • USA
447

10 20 30 40 50 60 70 80 90 1000
10
20
30
40
50
60
70
80
90
100INEX08: Removing data
100%50%25%12.5%6.25%
10 20 30 40 50 60 70 80 90 1000
10
20
30
40
50
60
70
80
90
100LETTER RECOGNITION: Removing data
100%50%25%12.5%6.25%
Figure 4: P̂P curves for different sizes of positive data. a)INEX08, b) Letter recognition.
10 20 30 40 50 60 70 80 90 1000
10
20
30
40
50
60
70
80
90
100INEX08: Number of features
78412100001000100
10 20 30 40 50 60 70 80 90 1000
10
20
30
40
50
60
70
80
90
100LETTER RECOGNITION: Gamma
0.50.10.010.001
Figure 5: P̂P curves. a) Feature selection in INEX08, b) γvalues in Letter Recognition.
controlling the smoothness of the decision boundary. In all experi-ments we use the same sets of 186 positive examples obtained fromthe DOJ exhibit list and 10,000 randomly selected unlabeled docu-ments. For testing on the positives we use 5-fold cross-validation,for testing on unlabeled items we hold out 500 items.
5.1 Two reference corporaWe first report some P̂P curves on two reference corpora: the
INEX08 Wikipedia challenge corpus [1], containing text files withsubject class labels and the Letter Recognition dataset from the UCIML repository, containing samples of handwriting classified withthe correct symbol. The INEX08 corpus contains 11,437 objectsdescribed by 78,412 features representing a BOW representationwith tf-idf values. The vectors are very sparse (at an average of 103non-zero values per document), so we will use the linear kernel.We use classes 8 and 6 as positives (21%), while all others are neg-ative. The Letter Recognition data set contains 20,000 instances,described by 16 features. Since these vectors are not sparse, theGaussian kernel is the best option. We use classes 0, 1, 2, 3 and 4as positives (20%) and the rest as negatives.
In both cases we use 80% of the data to train a hypothesis and theremaining 20% to test it. Figure 4 shows the influence of remov-ing positive training data on both corpora. We start with all posi-tive data as known positives and all of the negatives as unlabeleditems. We then remove part of the positives (50%, 25%, 12.5% and6.25%) and observe that performance degrades: larger steps andconversion to (0,0) in the extreme cases.
Figure 5.a shows the influence of reducing the number of fea-tures for INEX08 set. We remove words with low document fre-quencies. We perform the experiment with 12.5% of the positivesand 50% as noise (ratio 1/4). Some reduction seems to be useful(10.000 features), but too much reduction leads to overfitting (100
features). The final experiment in Figure 5.b shows the influenceof the γ parameter of a Gaussian kernel on the Letter Recognitiondata. We perform the experiment with 12.5% of the positives and50% as noise (ratio 1/4). Large values of γ give larger steps, even-tually jumping to (0,0) immediately. Small values give overfitting,evidenced by erratic behaviour.
5.2 Classifying EnronNow we present our experiments on classifying the Enron corpus
using different representations discussed in Section 3. First we tryto get the optimal setting of parameters to obtain good classifiersfor each modality, before we will try to combine their predictions.
Text-based representations. For the text-based representations,we first determine what type of feature values performs better. Asshown in Figure 6.a, The performance curve in Figure 6.a showsthat both binary and tf-idf values give similar results, with tf-idfbeing slightly better and more stable. We can see that during theconvergence performance degrades slowly, with a drop at the end.The key is to select a classifier that is just before the drop. Notethat the algorithm is clearly beating OC-SVM. The algorithm takesa huge first step in the convergence, yielding a hypotheses that sep-arates out 75.8% of the positives in 16.8% of the data.
Because we use a one-class classifier, the dimension of the fea-ture space might be important. Even though with our referencecorpus we had a slight increase in performance by reducing thenumber of features, no such thing happens with this one. In Fig-ure 6.b we even see that the OC-SVM performs considerably worsewith less features. The convergence itself however is not hurt. Alsothe reduction of features using semantic clustering does not seemto improve anything.
Social network-based representations. When classifying withthe social network features, we have a lot less tuning to do. Thefeature values are not sparse and reducing the number of featuresis not considered. However, with the RBF kernel we have an ad-ditional γ parameter. Bigger values lead to underfitting becauseof large steps in the convergence. Smaller values lead to underfit-ting: good performance until a certain point, and erratic behaviourthereafter. The best and most stable performance is obtained withγ = 0.1, see Figure 6.c. Optimally we select 71.5% of the positivesin 9.4% of the data.
5.3 Combining classifiersFinally we present the results of combining the classifiers from
the previous section. It turns out that in both cases best resultsare obtained using the bag-of-words representation with all featuresand tf-idf values with the social network feature set.
Naïve method. The simplest way of combining two classifiersis to take their predictions, aggregate those (in some way) and mea-sure the performance. For an aggregation function we simply takethe average of the predictions. In Figure 7.a, we combine the clas-sifiers we get at the 12th and 13th steps on the social network curveand the 2nd and 3rd steps on the text curve respectively. The factthat we observe a movement towards the left-top means that weget a classification that takes less data while retrieving more of thepositives.
Mapping Co-Convergence. This approach combines the dif-ferent views on the data on each convergence step. Every timea limited number of objects that is classified as negative with thehighest certainty by the two classifiers combined is labeled. Thehypotheses appearing on the curve are based on a small part of thedata. The performance as shown in Figure 7.b is very satisfactory,retaining 93% of the positives while discarding 90% of the unla-beled data.
WWW 2010 • Full Paper April 26-30 • Raleigh • NC • USA
448

10 20 30 40 50 60 70 80 90 1000
10
20
30
40
50
60
70
80
90
100ENRON − TEXT: Feature values
all tf−idfall binall freq
OC−SVM
10 20 30 40 50 60 70 80 90 1000
10
20
30
40
50
60
70
80
90
100ENRON − TEXT: Number of features
all65221000500
OC−SVM
10 20 30 40 50 60 70 80 90 1000
10
20
30
40
50
60
70
80
90
100ENRON − SOCIAL NETWORK: Gamma
50.10.01
Figure 6: Classifying Enron Corpus. a) text-based, b) social network-based, c) γ values.
classifier part of U part of P distancetext (bow tf-idf) 24.19 16.80 29.45social network 29.49 9.40 30.00text + social (naïve) 18.38 9.22 20.56text + social (MCC) 9.68 6.40 11.60
Table 1: Comparison of the different classifiers.
As explained before, we represent any curve by its “best” classi-fier. We take the Euclidian distance to the perfect classifier (0,100),to be compare different classifiers. Table 1 reports the best clas-sifiers of all curves discussed in this section. We can see that thecombination of social network-based and text-based feature sets al-lows to achieve the best performance.
6. ACKNOWLEDGMENTWe would like to thank Virginia Dignum from Utrecht University
for early discussions and feedback on the preliminary report. Thiswork is partially supported by the FRAGRANCE Project co-fundedby the French Association on Research and Technology (ANRT).
7. CONCLUSIONFrom the results presented above we can conclude that our ap-
proach to document classification by using multiple levels of de-scription does yield excellent results. Implementing ideas from co-training within the Mapping Convergence framework has enabledus to dramatically improve classification results. First we discusssome crucial observations with respect to our framework.
Initialization of Mapping Convergence. It appears that themapping phase of the framework is crucial for a good result. Anybad classifications made will have a snowball effect and impedeperformance severely. It is however necessary to include enoughdata in hte first approximation of the negative set to support con-vergence. From our experiments, labeling 5-10% with a one-classclassifier is usually enough to keep the convergence going.
Dependency on parameter selection. Even though the numberof parameters is not huge, the algorithms are somewhat sensitive tothe selection of parameters. Some of them we have been able toselect by looking at its properties, for others however this is not soeasy to do. As can be seen from the test results on the referencecorpora their influence is sometimes quite substantial.
Instability as a result of random cross-validation. We intro-duced a cross-validation step to be able to work with a corpus which
does not contain labels for much of the data. This is however an-other source of instability. The split is randomly made on everystep in the convergence. After several runs we have picked aver-age results, but there sometimes was a discrepancy of about 10%between runs. This could be reduced by using 10-fold crossvalida-tion or higher, at a computational cost.
Lack of training data. From our tests it appears that the sizeof the initial positive set is of capital importance. Reducing thenumber of positive training examples has a striking effect on theoverall results. In Enron we have a very small set of positivelylabeled items, that we used with a random subset of the rest of thecorpus. Using it with the entire corpus might cause the unlabeleddata to flood the positives after all. It might be that the combinationof different views in Mapping Co-Convergence partly handles thisproblem, but that has to be verified.
Confidence measure for SVM. Research on ways to assign aconfidence measure to the predictions of Support Vector Machinesis an active field. A well-known approach by Platt [22] is actuallyimplemented in the LIBSVM toolkit [7] we used. Unfortunately,because of an assumption made by this approach it is not applicablein our case. We decided to use a scaled version of the distance tothe decision plane as an indicator of confidence. This is definatelya point that can be improved.
Aggregation function. Also the way we combine the predictionof different classifiers is quite naïve. In fact we take the average ofthe predictions. It is clear that this is an approximation and lackssolid theoretical support, but future research is necessary to comeup with a better solution.
8. REFERENCES[1] INEX08 Wikipedia Challenge Corpus.
http://xmlmining.lip6.fr/, 2008.[2] Julien Ah-Pine and Guillaume Jacquet. Clique-based
clustering for improving named entity recognition systems.In EACL, pages 51–59, 2009.
[3] Ron Bekkerman, Andrew McCallum, and Gary Huang.Automatic categorization of email in folders: benchmarkexperiments on Enron and SRI corpora. Technical ReportIR-418, CIIR, 2004.
[4] Avrim Blum and Tom Mitchell. Combining labeled andunlabeled data with co-training. In Proc. Workshop on Comp.Learning Theory. Morgan Kaufmann Publishers, 1998.
[5] Ulrik Brandes. A faster algorithm for betweenness centrality.Journal of Mathematical Sociology, 25:163–177, 2001.
WWW 2010 • Full Paper April 26-30 • Raleigh • NC • USA
449

10 20 30 40 50 60 70 80 90 1000
10
20
30
40
50
60
70
80
90
100
social networktext
10 20 30 40 50 60 70 80 90 1000
10
20
30
40
50
60
70
80
90
100
text + social network
Figure 7: Enron classifiers combination: a) naïve combination; b) Mapping Co-Convergence framework.
[6] Coen Bron and Joep Kerbosch. Algorithm 457: finding allcliques of an undirected graph. CACM, 16(9):575–577, 1973.
[7] Chih-Chung Chang and Chih-Jen Lin. LIBSVM: a library forSupport Vector Machines, 2001. Software available athttp://www.csie.ntu.edu.tw/~cjlin/libsvm.
[8] William Cohen. http://www.cs.cmu.edu/~enron/.[9] Thomas G. Dietterich. Ensemble methods in Machine
Learning. In J. Kittler and F. Roli, editors, Proc. MultipleClassifier Systems, 2000, volume 1857, pages 1–15, 2000.
[10] Tamer Elsayed and Douglas Oard. Modeling identity inarchival collections of email: a preliminary study. InConference on Email and Anti-Spam, 2006.
[11] Paul F. Evangelista, Mark J. Embrechts, and Boleslaw K.Szymanski. Taming the curse of dimensionality in kernelsand novelty detection. In Advances in Soft Computing : TheChallenge of Complexity, pages 425–438, 2006.
[12] David Gleich. MatlabBGL: a Matlab graph library.http://www.stanford.edu/\~dgleich/programs/matlab\_bgl/, 2008.
[13] Jeffrey Heer. Exploring Enron: Visual data mining of e-mail.http://www.jheer.org/enron/, 2005.
[14] Thorsten Joachims. A statistical learning model of textclassification for Support Vector Machines. In Proc. ACMSIGIR Conf., pages 128–136, 2001.
[15] Jon M. Kleinberg. Authoritative sources in a hyperlinkedenvironment. Journal of the ACM, 46(5):604–632, 1999.
[16] Pranam Kolari, Tim Finin, and Anupam Joshi. Svms for theblogosphere: Blog identification and splog detection. InAAAI Spring Symp. CAAW, 2006.
[17] Larry M. Manevitz and Malik Yousef. One-class SVMs fordocument classification. Journal of Machine LearningResearch, 2:139–154, 2001.
[18] Andrew McCallum, Xuerui Wang, and AndresCorrada-Emmanuel. Topic and role discovery in socialnetworks with experiments on enron and academic email. J.Artificial Intelligence Research, 30:249–272, 2007.
[19] M. E. J. Newman. The structure and function of complexnetworks. SIAM Review, 45:167–256, 2003.
[20] Roberto Perdisci, Davide Ariu, Prahlad Fogla, GiorgioGiacinto, and Wenke Lee. Mcpad: A multiple classifiersystem for accurate payload-based anomaly detection.Computer Networks, 53(6):864–881, 2009.
[21] Roberto Perdisci, Guofei Gu, and Wenke Lee. Using anensemble of One-class SVM classifiers to hardenpayload-based anomaly detection systems. In ICDM ’06:Proc. Sixth Intern. Conf. Data Mining, pages 488–498, 2006.
[22] John C. Platt. Probabilistic outputs for support vectormachines and comparisons to regularized likelihoodmethods. In Advances in Large Margin Classifiers, pages61–74. MIT Press, 1999.
[23] Xiaoguang Qi and Brian D. Davison. Web pageclassification: Features and algorithms. ACM Comput. Surv.,41(2):1–31, 2009.
[24] Bhavani Raskutti and Adam Kowalczyk. Extremere-balancing for SVMs: a case study. SIGKDD Explorations,6(1):60–69, 2004.
[25] Ryan Rowe, German Creamer, Shlomo Hershkop, andSalvatore J. Stolfo. Automated social hierarchy detectionthrough email network analysis. In Proc. Workshop on WebMining and Social Network Analysis, pages 109–117, 2007.
[26] Bernhard Scholkopf, John C. Platt, John Shawe-Taylor,Alex J. Smola, and Robert C. Williamson. Estimating thesupport of a high-dimensional distribution. NeuralComputation, 13(7):1443–1471, 2001.
[27] Jitesh Shetty and Jafar Adibi. Discovering important nodesthrough graph entropy the case of Enron email database. InLinkKDD ’05: Proc. 3rd International Workshop on LinkDiscovery, pages 74–81, 2005.
[28] David M. J. Tax. One-class Classification. PhD thesis, DelftUniversity of Technology, The Netherlands, June 2001.
[29] David M. J. Tax and Robert P. W. Duin. Support VectorDomain Description. Pattern Recogn. Lett.,20(11-13):1191–1199, 1999.
[30] Jen-Yuan Yeh and Aaron Harnly. Email thread reassemblyusing similarity matching. In Conference on Email andAnti-Spam, 2006.
[31] Hwanjo Yu. Single-class classification with MappingConvergence. Machine Learning, 61(1-3):49–69, 2005.
[32] Shenghuo Zhu, Kai Yu, Yun Chi, and Yihong Gong.Combining content and link for classification using matrixfactorization. In ACM SIGIR Conf., pages 487–494, 2007.
[33] Lin Zhuang and Honghua Dai. Parameter optimization ofkernel-based one-class classifier on imbalance learning.Journal of Computers, 1(7):32–40, 2006.
WWW 2010 • Full Paper April 26-30 • Raleigh • NC • USA
450


