Embed Size (px)
Citation preview

arX
iv:a
stro
-ph/
0101
493v
1 2
7 Ja
n 20
01
Multicolor Photometry of the Uranus Irregular Satellites Sycorax
and Caliban1
Michele Maris
Osservatorio Astronomico di Trieste - Via G.B. Tiepolo, 11 - I 34131 - Trieste - Italy
Giovanni Carraro
Dipartimento di Astronomia, Universita di Padova - Vicolo dell’Osservatorio, 5 - I 35122 -
Padova - Italy
Gabriele Cremonese
Osservatorio Astronomico di Padova - Vicolo dell’Osservatorio, 5 - I 35122 - Padova - Italy
and
Marco Fulle
Osservatorio Astronomico di Trieste - Via G.B. Tiepolo, 11 - I 34131 - Trieste - Italy
Received ; accepted
Not to appear in Nonlearned J., 45.

– 2 –
ABSTRACT
We report on accurate BVRI photometry for the two Uranus irregular satel-
lites Sycorax and Caliban. We derive colours, showing that Sycorax is bluer than
Caliban. Our data allows us to detect a significant variability in the Caliban’s
light-curve, which suggests an estimated period of about 3 hours. Despite it is
the brighter of the two bodies, Sycorax does not display a strong statistically
significant variability. However our data seem to suggest a period of about 4
hours.
Subject headings: Planets and satellites: general — Planets and satellites:
individual: Caliban —Planets and satellites: individual: Sycorax
1. Introduction
A couple of new Uranus satellites, named Sycorax (S/1997 U1) and Caliban (S/1997
U2), with an orbital semimajor axis of 253 and 305 uranian radii, respectively, were
discovered in 1997 by Gladman et.al. (1998). This solved the apparent Uranus peculiarity
known up to that time to be the only giant planet in the Solar System without irregular
satellites, despite accurate search carried out in the past (Christie (1930), Kuiper (1961),
Smith (1984), Cruikshank & Brown (1986)).
Giant gaseous planets are characterized by a complex system of dust rings and
satellites. From the point of view of orbital dynamics, the satellites of the giant gaseous
planets belong to two classes: regular and irregular. The former are characterized by
1Based on observations carried out at ESO La Silla (Chile)

– 3 –
orbits with a small eccentricity, very close to the planet equatorial plane and always show
a prograde motion. The latter follow orbits which may have a large ellipticity, semimajor
axis, and inclination. Moreover they may follow both prograde and retrograde motions.
According to Pollack et al. (1979) the two classes of satellites suggest a quite different
evolution. Regular satellites are supposed to be born in the same subnebula from which
the planet originated. On the other hand irregular satellites might be planetesimals felt
inside the planet subnebula by gas drag just before the subnebula collapse. Eventually the
captured planetesimals were fragmented by dynamical pressure due to the gas drag and
were dispersed by collisions with other objects already present in the subnebula (Pollack
et al. (1979)). Following this scheme, it is evident that the study of irregular satellites is
important in the context of the Solar System origin. In particular, it could be interesting to
compare the newly discovered uranian irregular satellites with other classes of minor bodies
in the outer Solar System, i.e. Kuiper Belt and Centaurus objects.
The faintness of the new satellites (Gladman et al. (1998) report RSycorax ≈ 20.4 mag,
RCaliban ≈ 21.9 mag) made it difficult to determine their photometric properties. Colors
are reported by Gladman et al. (1998) with 0.1 mag accuracy, suggesting that Sycorax
and Caliban are reddened with respect to the Sun, in contrast with Uranus and its regular
satellites. Moreover, the low photometric accuracy (∼ 0.1 mag) prevented them from
obtaining a light-curve and hence an estimate of the rotation period for both satellites.
To improve the present knowledge, Sycorax and Caliban has been observed with the
NTT ESO telescope. We obtained magnitudes in the B, V, R, I bands with accuracy of
0.03 mag and we obtain color and light-curves.
The paper is organized as follows: section 2 describes the data acquisition and
reduction, section 3 the colors, and section 4 the light curve. Final remarks and conclusions
are given in section 5.

– 4 –
2. Data acquisition and reduction
Observations were conducted at La Silla on 1999 October 8 and 9, using the Tektronix
2024× 2024 pixel CCD # 36 mounted in the red EMMI arm of the 3.6-m ESO NTT
telescope. The first night was photometric with an average seeing of 1.0 arcsec, whereas
the second one was not photometric. The scale on the chip is 0.27 arcsec per pixel, and
the array covers about 9×9 arcmin2 in the sky. Details of the observing run for the two
satellites are given in Tables 1 and 2.
Pre-processing, which includes bias and flat-field corrections, has been done by using
standard routines in the ESO MIDAS package.
Instrumental magnitudes have been extracted at the Padova University using the
DAOPHOT and accompanying ALLSTAR package (Stetson (1991)) in the MIDAS
environment. The errors in Tables 1 and 2 are assumed to be normally distributed and are
1σ.
The instrumental b, v, r and i have been transformed into standard Jonhson B, V and
Cousin R and I magnitudes using fitting coefficients (colour term and zero point) derived
from observations of the standard field T-Phoenix and MarkA stars from Landolt (1992) at
the beginning and the end of the night, after including exposure time normalization and
airmass corrections. Aperture correction has also been applied. The transformations are
given by the following equations:
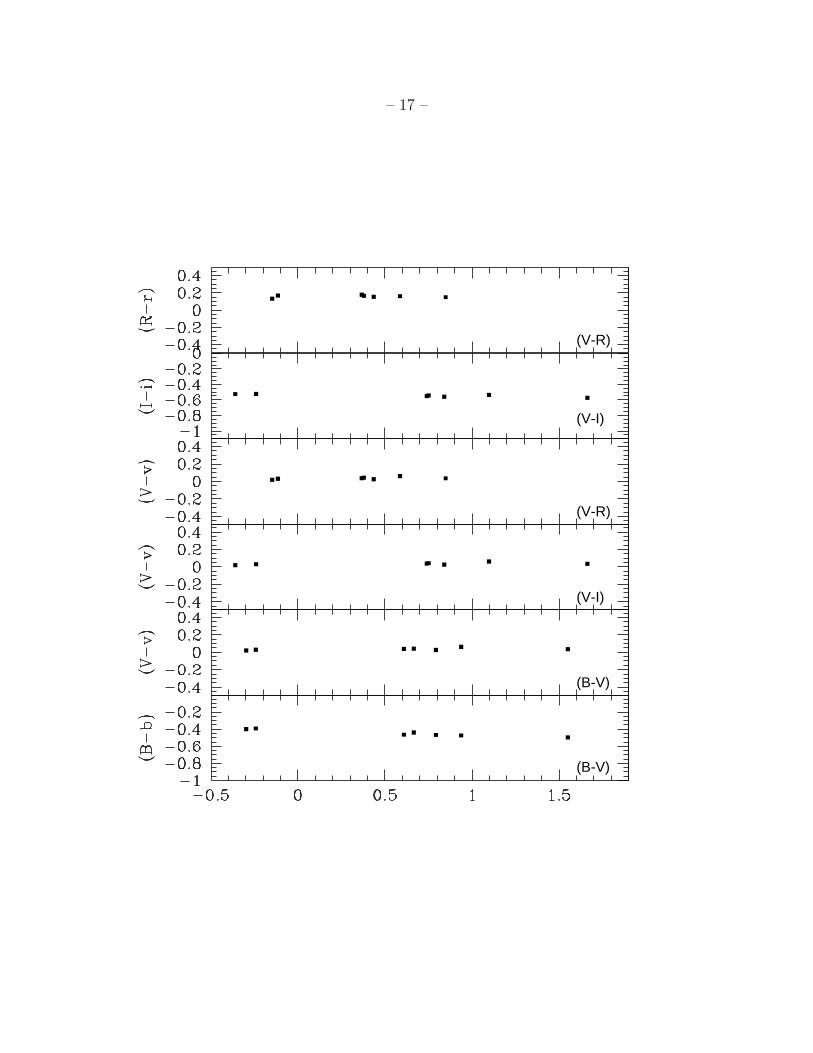
(B − b) = −0.050 × (B − V ) − 0.414 (1)
(V − v) = 0.010 × (B − V ) + 0.030 (2)
(B − V ) = 0.994 × (b − v) − 0.437 (3)
(V − v) = 0.010 × (V − I) + 0.029 (4)

– 5 –
(V − I) = 1.003 × (v − i) + 0.551 (5)
(V − v) = 0.020 × (V − R) − 0.029 (6)
(R − r) = 0.01 × (V − R) + 0.157 (7)
(V − R) = 1.010 × (v − r) − 0.101 (8)
and are plotted in Fig. 1. The errors affecting this calibration are expected to be of the
order of 0.03 mag. All the magnitudes obtained in the second night were translated into
the first night through the comparison of a group of common field stars in the same frames
of the satellites.
3. Colors
The observations allowed us to obtain the colors of both satellites with an excellent
accuracy and we reported them in Table 3 together with corresponding error bars. The
colors are almost similar for both satellites, even if Sycorax appears to be bluer than
Caliban looking at (B-V), and we can make a comparison with other minor bodies of the
Solar System. They clearly appear less red than most of the Kuiper Belt objects as it
can be seen on the histogram of V-R reported by Luu & Jewit (1996), while there is an
interesting similarity with some Centaurs, 1995 GO, 1997 CU26 and 1995 DW2, as it is well
shown in the Table V of Davies et al. (1998).
However, it is difficult to provide even a rough interpretation of the colors measured
for Sycorax and Caliban. Looking at the histograms of Luu & Jewitt (1996) the V-R values
of the satellites could be considered as the bluest Kuiper Belt objects or the reddest Near
Earth Asteroids, not neglecting that 0.5 is the value found for most of the comet nuclei and
the Trojans. The small number of Centaurus observed up to now shows a broad range of
V-R values and it might be too much easy to associate Sycorax and Caliban to this group,

– 6 –
even if the heliocentric distance of Uranus is closer to their semi-major axis.
4. Light Curves
Light-curves have been obtained in the R band with exposure times of 600 - 800 sec
for Caliban, 80 - 200 sec for Sycorax. The time dependent part of the light curves together
with a sinusoidal fit described below, are plotted in Fig. 2.
The first night only has been photometric, but for both satellites the first night alone is
not sufficient to say anything of conclusive about the time variability even applying simple
models. So the data of the second night have been translated to the first night by matching
the magnitude of common stars in the frames. The chosen stars do not exhibit significant
brightness variations, however this procedure may left some residual systematic calibration
error within a 1σ level (≈ 0.03 mag) equivalent to a shift in the zero point of the magnitude
scale for the second night relatively to the scale of the first night. Since data generally are
not evenly distributed about the mean, it is not possible to remove this shift, subtracting
from the data of each night their average. As a consequence, a possible small shift in the
zero point of the magnitude scale between different nights must be accounted for by the fit
itself adding a further degree of freedom to the model. So the fit is:
R(t) = R0 + ∆ U(t − t0) + A sin
(
2π
P(t − t0) + φ
)
(9)
whose four free parameters are: the average magnitude R0, the amplitude A, the period
P , and the phase φ. The origin of time t0 is assumed to be October 8, 2000 at UT 00:00.
The step function U is null during the first night and +1 during the second one. The free
parameter ∆ accounts for the possible shift in the zero point between the two nights. If
this is the case, ∆ will assume values significantly different from zero. The fit is performed
twice by weighted least squares. The first time imposing ∆ ≡ 0 and the second time leaving

– 7 –
it as a fifth free parameter. The results of the two fits are then compared. As shown
below Sycorax data requires a significant shift between the first and the second night, while
Caliban does not. In principle more sophisticated methods could be used, but our limited
data set does not justify their application. As a consequences the lightcurve parameters,
and particularly their periods, shall be considered just as indicative estimates rather than
firm results.
In the first night Caliban does not display a large variation (∆R = 0.057 ± 0.032 mag,
i.e. less than 2 σ), while in the second one it shows ∆R = 0.237± 0.045 mag, corresponding
to a ≈ 5σ level. The first concern was to verify whether such variability may be explained
by random fluctuations due to noise or not. The χ2 test rejected the hypothesis of random
fluctuations. In fact taking into account the data of both nights, the significativity level
for this hypothesis is less than 0.005%. In the case of Caliban no significant shift is
required between the magnitude zero points of first and second nights. Leaving the shift
∆ as a free parameter does not improve the fit, but it reduces the number of degrees of
freedom and so the significativity level for the fit. Then we imposed ∆ ≡ 0 obtaining the
best fit for P = 2.6624 ± 0.0130 hours, φ = 4.2607 ± 0.1637 rad, A = 0.1169 ± 0.0102
mag, R0 = 21.9128 ± 0.0112 mag, with χ2 = 2.6331 equivalent to a significativity level
SL = 75.63%.
Indeed most of the information in this estimate is based on the data of the second
night. As a comparison the best fit obtained considering the second night data only is
obtained for P = 2.7011 ± 0.0093 hours, φ = 5.1269 ± 0.1061 rad, A = 0.1342 ± 0.0128
mag, R0 = 21.9126 ± 0.0120 mag, with χ2 = 0.1739 equivalent to a significativity level
SL = 98.17%. It would be noted how a better fit is obtained for the second night data than
for the full data set, the worst behaving point being the last of the first night. If this point is
removed we obtain P = 2.6678±0.0119 hours, φ = 4.4204±0.1428 rad, A = 0.1268±0.0171

– 8 –
mag, R0 = 21.9037 ± 0.0120 mag, with χ2 = 0.6860 equivalent to a significativity level
SL = 98.37%. This fact suggests either a residual mismatch in the zero point calibration
between the two nights or that the light curve is not properly represented by a sinusoidal
time dependence. However it is not possible to discriminate between these two possibilities
from the data as none of the related CCD frames display evident peculiarities. So the
difference between the two results will be regarded as an estimate of the systematic errors
in the light curve parameters determination.
In conclusion our best estimates are: P = 2.66+0.04−0.00 ± 0.01 hours, φ = 4.26+0.87
−0.00 ± 0.16
rad, A = 0.134+0.000−0.008 ± 0.010 mag, R0 = 21.913+0.000
−0.000 ± 0.011 mag. Where the first error
refers to the systematic error and the second to the random (1σ) error.
For Sycorax, we had more data, better distributed in time than for Caliban, but
relatively to the errors the photometric variation was smaller. The first night Sycorax
displayed ∆R = 0.076 ± 0.027 mag, while in the second one ∆R = 0.067 ± 0.026 mag, both
below 3σ level. So we cannot claim for a safe positive detection of significant brightness
variation in the Sycorax data, and any attempt to estimate a period would be considered
as tentative, although during the second night the data hinted at a possible sinusoidal
variation. Indeed, the hypothesis of random fluctuation over a time constant brightness as
an explanation of the observed light curve, fits Sycorax data better than Caliban ones, but
the significativity level for such a fit is only 55.6%, making this hypothesis hard to support.
Moreover, the R magnitudes for the reference stars in the Sycorax frames for the first night
are stable, with an RMS better than 0.005 mag and a significativity level for the hypothesis
of a constant magnitude better than 99.99%. Both these observations support (but do not
proof) the hypothesis that the detected variability in Sycorax data could be physically
significant. So we applied the sinusoidal fit shown in Fig. 2.
In the case of Sycorax a not null shift ∆ = (−2.6 ± 1.3) × 10−2 mag shall be allowed

– 9 –
in order to have a good fit, which is consistent with the average photometrical error of the
tabulated measures ≈ 0.027 mag. On the contrary the imposition of ∆ ≡ 0 reduces the
significativity level for the fit of about a factor three. Apart from the method described
here, we attempted different ways to get rid of this shift, all producing similar results about
the estimate of the period, phase and amplitude for the light curve. Our conclusion is that
the shift must be considered as a relevant parameter in what regard the minimization of χ2
only. Of course, since it affects in the same way all the data taken in the same night, the
shift is not relevant for the colour determination, since colours are obtained by neighbor
data.
Taking the data of both nights into account, the best fit was obtained for
P = 4.1156 ± 0.0416 hours, φ = 4.8750 ± 0.2594 radians, A = 0.0308 ± 0.0084 mag,
R0 = 20.4566 ± 0.0103 mag with a χ2 = 4.9796 and SL = 97.6%. This represents our best
guess for the Sycorax period. The repetition of the fit using the second night data only
gives instead P = 3.6841 ± 0.0406 hours, φ = 0.1679 ± 0.3303 radians, A = 0.0320 ± 0.0083
mag, with a χ2 = 2.3487 and SL = 88.5%. Note that A is not affected by the change which
instead affects period and phase. In addition the significativity is higher when all the data
are used to perform the fit, suggesting that all the data have the same statistical significance.
At last R0 from the second night data only is: R0 = 20.4322 ± 0.0053 mag whose difference
from the R0 obtained from the full night is dominated by ∆. After correction of this
shift and adding in square the two random errors we obtain: R0 = 20.4062 ± 0.0140
mag. In conclusion for Sycorax: P = 4.12+0.00−0.43 ± 0.04 hours, φ = 4.88+0.00
−4.71 ± 0.25 radians,
A = 0.032+0.001−0.000 ± 0.008 mag, R0 = 20.457+0.000
−0.001 ± 0.010 mag.

– 10 –
5. Conclusions
In the nights between October 8 and 9, 1999 we carried out accurate multicolor
observations of Uranus’ irregular satellites Sycorax (S/1997 U1) and Caliban (S/1997 U2),
providing magnitudes in B, V, R, I bands.
The colors we obtained confirm the values suggested by Gladman et al. (1998). They
are redder than Uranus and its regular satellites, and Sycorax appears to be bluer than
Caliban and most of the Kuiper Belt objects.
We obtained light-curves in the R band for both satellites, and we estimated periods
and amplitudes by fitting the data with a sinusoid. Caliban’s light curve displayed
significant fluctuations (5σ), which were not evident in the Sycorax data.
For Caliban, we suggest a light curve period of about 2.7 hour with an amplitude of
about 0.13 mag, which is compatible with the rotation periods of the Kuiper-belt objects
(Romanishin & Tegler (1999)). However, the limited number of points and time coverage
coupled with calibration uncertainties, suggest to be conservative and to consider this result
just as a first estimate requiring further observations to be confirmed.
Although the data for Sycorax did not show a so large photometric variation, we
tentatively provide an estimate of the light-curve period and amplitude, which also has to
be considered preliminary, amounting at about 3.7 ÷ 4.1 hours and 0.03 mag respectively.
Better time coverage together with very accurate photometry may help to unravel a safer
light-curve period for Sycorax.

– 11 –
6. Acknowledgements
The authors wish to acknowledge the unknown referee for valuable suggestions and
comments.

– 12 –
REFERENCES
Asteroid Properties Database, 1993,
http://pdssbn.astro.umd.edu/sbnhtml/
Brown Warren R., Luu Jane X., 1997, Icarus 126, 218
Caso C., et al., 1998, Review of Particle Physics The European Physical Journal C3 (1998),
also at: http://pdg.lbl.gov/
Christie, W., (1930), Publ. Astron. Soc. Pacif., 42, 253
Cruikshank, D.P., & Brown, R.H., (1986), in Sastellites (eds Burns, J.A. & Matthews,
M.S.) 836-873 (Univ. Arizona Press, Tucson)
Davies J.K. et al., 1998, Icarus 134, 213
Gladman B. J., Nicholson P. D., Burns J. A., Kavelars J. J., Marsden B. G., Williams G.
V., Offut B. W., 1998 Nature, 392, 897
Kuiper, G., (1961), in Planets and Satellites (eds Kuiper, G. & Middlehurst, B.M.) 575 -
591 (Univ. Chicago Press, Chicago, 1961)
Landolt A. U., 1992, AJ 104, 320
Luu J., Jewit D., 1996, AJ 112, 2310
Magnuson P, Lagerkvist C.-I., Dahlgren M., Erikson A., 1993, Proceeding Asteroids,
Comets, Meteors A. Milani et al. (eds.), 1994 IAU, Netherlands, pag. 471-476
Pollack, J.M., Burns, J.A., Tauber, M.E., (1979) Icarus, 37, 587
Press W. H., Teukolsky S. A., Vetterling W. T., Flannery B. P., 1986 Numerical Recipes:
1st edition, (Cambridge University Press)

– 13 –
Romanischin W., Tegler S. C., 1999, Nature 398, 129
Smith, B., (1984), in Uranus and Neptune (ed. Bergstralh, J.T.) 213 - 221 (CCP-2330,
NASA, Washington SC, 1984)
Stellingwerf R. F., 1978, Ap.J. 224, 953
Stetson, P. B., 1991, Daophot II Users Manual
This manuscript was prepared with the AAS LATEX macros v5.0.

– 14 –
Fig. 1.— Colour Equations for the night October 8, 1999
Fig. 2.— Caliban and Sycorax lightcurves. The non-sinusoidal terms of eq. (9) have been
subtracted from both the lightcurves to evidence the time variability. Therefore R0 has been
removed from the Caliban’s lightcurve, while R0 + ∆ U(t − t0) has been removed from the
Sycorax lightcurve.

– 15 –
Table 1: Log of the observations for Sycorax.
Date Filter Exp. time U.T. airmass magnitude
(sec) hh:mm:ss.sss
October 8, 1999 R 80 23:41:37.210 1.052 20.404±0.026
R 80 00:04:30.130 1.033 20.447±0.022
R 70 00:27:03.560 1.023 20.432±0.022
B 300 00:31:39.030 1.022 21.764±0.029
V 80 00:39:10.840 1.021 20.752±0.025
I 80 00:44:14.550 1.021 19.815±0.021
R 70 00:49:21.380 1.022 20.447±0.020
R 70 02:45:36.780 1.161 20.480±0.031
B 300 02:50:14.170 1.173 21.812±0.030
V 80 02:57:38.700 1.193 20.800±0.022
I 80 03:02:37.590 1.208 19.863±0.021
R 70 03:07:28.890 1.223 20.448±0.025
R 80 03:47:31.370 1.386 20.421±0.036
R 80 04:07:50.470 1.501 20.436±0.033
October 9, 1999 R 120 23:43:27.090 1.047 20.458±0.035
R 120 00:06:17.240 1.030 20.407±0.029
R 120 00:28:17.050 1.022 20.419±0.046
R 120 00:53:16.650 1.023 20.391±0.020
R 120 01:17:19.370 1.034 20.433±0.024
R 200 01:40:47.210 1.054 20.471±0.025
B 500 01:47:33.150 1.062 21.915±0.031
V 150 01:58:24.400 1.076 20.903±0.025
I 150 02:04:32.810 1.086 19.966±0.022
R 200 02:10:43.380 1.096 20.457±0.016
R 200 03:00:34.960 1.214 20.450±0.017

– 16 –
Table 2: Log of the observations for Caliban.
Date Filter Exp. time U.T. airmass magnitude
(sec) hh:mm:ss.sss
October 8, 1999 R 600 00:59:10.500 1.024 21.949±0.024
B 1200 01:22:37.740 1.029 23.659±0.049
V 800 01:35:08.840 1.046 22.423±0.033
R 600 01:52:00.450 1.064 21.954±0.036
I 800 02:05:33.450 1.083 21.440±0.024
R 600 02:22:24.310 1.113 21.897±0.036
October 9, 1999 R 800 00:34:52.990 1.021 21.832±0.053
R 800 00:59:19.070 1.025 21.970±0.045
R 800 01:23:16.540 1.039 22.039±0.039
R 800 02:18:08.040 1.112 21.821±0.038
R 800 03:07:55.570 1.243 21.802±0.036
R 800 03:32:22.580 1.339 21.924±0.040
R 800 03:56:58.850 1.468 22.004±0.063
Table 3: Colors of Sycorax and Caliban
Satellite B-V V-R R-I B-R V-I
Sycorax 1.012±0.038 0.482±0.042 0.455±0.030 1.494±0.036 0.937±0.031
Caliban 1.236±0.059 0.473±0.048 0.510±0.043 1.709±0.054 0.983±0.041
– 17 –
(B-V)
(B-V)
(V-I)
(V-R)
(V-I)
(V-R)

– 18 –
−0.15
−0.10
−0.05
0.00
+0.05
+0.10
+0.15
R −
R0 (
mag
)
Caliban
October 8 October 9
0 6 12 18 0
−0.05
0.00
+0.05
UT (hours)
R −
∆ U
(t−
t 0) −
R0 (
mag
) Sycorax