Embed Size (px)
Citation preview

Multielemental analysis and characterization of fine aerosols
at several key ACE-Asia sites
David D. Cohen,1 David Garton,1 Eduard Stelcer,1 Olga Hawas,1 Tao Wang,2
Steven Poon,2 Jiyoung Kim,3 Byoung Cheol Choi,3 Sung Nam Oh,3 Hye-Jung Shin,3
Mi Young Ko,3 and Mitsuo Uematsu4
Received 6 March 2003; revised 17 June 2003; accepted 16 July 2003; published 5 August 2004.
[1] PM2.5 and PM10 particle size fractions were measured every Wednesday and Sundayfor an 18-month period from 1 January 2001 at three key ACE-Asia sites: Hong Kong,Cheju Island in southern Korea, and Sado Island in Japan. Median 24 hour PM2.5 massloadings of 29, 16, and 9.1 mg/m3 and coarse mass loadings of 33, 14, and 11 mg/m3 weremeasured at Hong Kong, Cheju, and Sado Island sites, respectively, during the studyperiod. The corresponding maximum PM2.5 and coarse mass values for the three siteswere 109, 81, and 78 mg/m3 and 101, 162, and 253 mg/m3, respectively. Accelerator-basedion beam analysis (IBA) techniques were used to quantify major components as wellas significant trace elements. These included total hydrogen, black carbon, F, Na, Al, Si, P,S, Cl, K, Ca, Ti, V, Cr, Mn, Fe, Co, Ni, Cu, Zn, Br, and Pb, with detection limits close to orbelow 1 ng/m3. The average PM2.5 percentage composition by weight across the threesites was estimated to be around (8.4 ± 4)% black carbon, (7.7 ± 7)% soil, (43 ± 14)%ammonium sulfate, (11 ± 16)% organic matter, (10 ± 12)% salinity, and (0.6 ± 0.3)% traceelements. Soil fingerprints for the east Asian region were generated using oxides ofmeasured Al, Si, K, Ca, Ti, Mn, and Fe concentrations. The coarse fraction was dominatedby wind blown soil (23%) and sea salts (48%). [PM10/PM2.5] mass ratios were typically(2.1 ± 0.4) averaged across all sites for the whole year. [PM10/PM2.5] mass ratios forthe 21 IBA elements analyzed were also provided. This quantitative data providing bothmasses and dates over an 18-month period provide useful input for aerosol transportmodeling for the east Asia region. INDEX TERMS: 0305 Atmospheric Composition and Structure:
Aerosols and particles (0345, 4801); 0345 Atmospheric Composition and Structure: Pollution—urban and
regional (0305); 0399 Atmospheric Composition and Structure: General or miscellaneous; 1610 Global
Change: Atmosphere (0315, 0325); 1620 Global Change: Climate dynamics (3309); KEYWORDS: PM2.5,
PM10, aerosols, fine particle characterization, Asian region, ACE-Asia, IBA techniques
Citation: Cohen, D. D., et al. (2004), Multielemental analysis and characterization of fine aerosols at several key ACE-Asia sites,
J. Geophys. Res., 109, D19S12, doi:10.1029/2003JD003569.
1. Introduction
[2] The scattering and absorption of light by fine airborneparticles directly affects Earth’s radiative balance. Thesesame particles also have indirect effects by acting as cloudcondensation nuclei, influencing the albedo, lifetime, andextent of clouds. The extent of the direct radiative forcingdue to anthropogenic particles in the atmosphere was clearlyidentified and estimated in 1996 by the IntergovernmentalPanel on Climate Change [IPCC, 1996] to be between
�0.25 and �1.0 Wm�2 and the indirect aerosol contributionat between 0 and �1.5 Wm�2. This was shown to becomparable but opposite in sign to forcing due to wellmixed greenhouse gases (+2.1 to +2.8 Wm�2). Since thenthe IPCC has released another report [IPCC, 2001] con-firming the negative radiative forcing effects of atmosphericaerosols. The latter report also showed the level of scientificunderstanding was significantly lower for aerosols thangreenhouse gases.[3] The global distribution of particles tends to be ex-
tremely inhomogeneous resulting in different radiative forc-ing consequences in different regions of the globe. TheInternational Global Atmospheric Chemistry Project(IGAC), recognizing this, has planned a series of AerosolCharacterization Experiments (ACE) that integrate in situmeasurements, satellite observations, and models to reducethe uncertainty in estimates of the climate forcing due toaerosols [Bates et al., 1998]. ACE-Asia is the fourth inthis series of experiments and is focused on eastern China,Korea and Japan [Huebert et al., 2003]. The objectives of
JOURNAL OF GEOPHYSICAL RESEARCH, VOL. 109, D19S12, doi:10.1029/2003JD003569, 2004
1Australian Nuclear Science and Technology Organisation, Menai, NewSouth Wales, Australia.
2Department of Civil and Structural Engineering, Hong KongPolytechnical University, Kowloon, Hong Kong, China.
3Meteorological Research Institute, Seoul, Korea.4Centre for International Cooperation, Ocean Research Institute,
University of Tokyo, Tokyo, Japan.
Copyright 2004 by the American Geophysical Union.0148-0227/04/2003JD003569
D19S12 1 of 18

ACE-Asia study are stated in the ACE-Asia Prospectusof February 2001 (see http://saga.pmel.noaa.gov/aceasia/prospectus/prospectus022601.html). The Asian aerosolsource composition is different to that of Europe and NorthAmerica, much more coal and vegetation are burnt in Asia,adding more absorbing soot and organic aerosol to parts ofthe Asian and Pacific atmosphere [Chameides et al., 1999].Aerosols in the ACE-Asia region will likely be a complexmixture of sea-salt, combustion derived ionic, organic andsoot particles, mineral dust and biogenic non-sea salt sulfateand organic species [Carmichael et al., 1996; Kim et al.,1998; Wang et al., 2003].[4] According to Arndt et al., [1998] China produces
around 11 Tg S/yr of sulfur emissions but only 6.1 Tg S/yrare deposited in China itself the rest is transported out of theregion generally in an easterly direction. This mass transportof sulfur is 2.5 times higher in the winter and spring, thanthe summer and autumn months. In contrast, in summerwhen on shore winds predominate, sulfur from Japan isdeposited on South Korea. Model calculations by Xiao et al.[1997] suggested that between 20% to 40% of the totalsulfur production rate in the Asian Pacific regions in earlyspring was due to chemical conversion of SO2 to sulfate inthe presence of mineral dust and anthropogenic aerosols.This is one of the reasons for measuring sulfur as well asmineral dust present in the fine mass fraction at ACE Asiasites. Chang et al. [1996] and Kim et al. [2003] bothshowed that windblown soil, was an important feature ofAsian dust. The key fine particles of interest in the Asianregion are sulfates, black carbon and organics from suchhuman activities as fossil fuel combustion, biomass burningand industrial production in the study region and soil andsea salt from natural sources [Lee et al., 2001; Mori et al.,2002; Huebert et al., 2003; Wang et al., 2003].[5] This study contributes to these ACE-Asia project
goals by further quantifying and characterizing the chemicalproperties of fine (PM2.5) particles at recognized keyACE-Asia sites in Hong Kong, Korea and Japan over an18-month period from January 2001. These longer-termground station studies are an integral part of the ACE-Asiaproject (see http://saga.pmel.noaa.gov/aceasia/prospectus/prospectus022601.html), providing information on spatialvariability of aerosol chemical and physical properties aswell as seasonal and longer-term trends in these properties.The quantitative data sets presented here are important forverifying transport models such as the Navy AerosolAnalysis and Prediction System (NAAPS) at the NavalResearch Laboratory, Monterey, CA, USA [Benkovitz etal., 1996] which currently uses uncertain emission inven-tories, and for putting the ACE-Asia chemical results in abroader global context.
2. Site Location and Sampling
[6] Here we report on data from three ACE Asian siteslocated on Hong Kong Island off the Chinese mainland,Cheju Island off the southern tip of Korea and Sado Islandoff the west coast of Japan. The location of each of thesesites is shown in Figure 1.[7] The Hong Kong site was located on Cape D’Aguilar
(Hok Tsui) at the southeastern end of Hong Kong Island at22.22�N, 114.25�E atop a 60 m cliff facing the South China
Sea. The population density of Cape D’Aguilar is relativelylow and the nearest major urban/industrial town of ChaiWan is 10 km away. A detailed description of the site and itssurroundings has been given in the work of Wang et al.[1997, 2001] and Lam et al. [2001]. For this study samplingof aerosols commenced at this site on 3 January 2001.[8] The Kosan site on Cheju Island was located at the
western tip of the island at 33.30�N, 126.15�E on a cliff70 m above sea level and faced the Chinese mainland acrossthe Yellow Sea. The island is approximately 480 km southof Seoul. Sampling commenced on 30 March 2001. Kim etal. [1998] stated that Cheju Island was one of the cleanestareas in Korea and an ideal site to monitor long-rangetransport of air pollution from China [Lee et al., 2001].[9] The Sado island site was located on the north western
coast of the island off the west coast of Japan’s HonshuIsland at 38.20�N, 138.35�E atop a 90 m cliff facing theKorean mainland across the Sea of Japan. The site wasapproximately 304 km north west of Tokyo. Samplingcommenced somewhat later than the other two sites on16 September 2001.[10] Two different types of sampling unit were used at
each site in this study, the ASP PM2.5 fine sampler [Cohenet al., 1996], based on the U.S. IMPROVE cyclone system[Malm et al., 1994] and the GENT stacked filter unit (SFU)with a coarse (8mm pore size) and a fine (0.4 mm pore size)47 mm diameter Nuclepore polycarbonate filter [Hopke etal., 1997; Maenhaut et al., 1994]. The coarse Nucleporefilter was Fomblin coated to reduce particle bounce effects.The ASP sampler used a 25 mm stretched Teflon filter andhad a nominal flow rate of 22 l/min to collect particles withaerodynamic diameters less than 2.5mm (PM2.5). The GENTsampler used a nominal flow rate of 16 l/min and simulta-neously collected a fine (PM2.5) fraction and a coarsefraction (2.5mm to 10mm). The effective collection areasof the Teflon and Nuclepore filters were 2.27 cm2 and11.95 cm2, respectively.[11] The ASP PM2.5 cyclone unit was specially designed
for use with the multielemental ion beam analysis methods
Figure 1. Map of the ACE-Asia region showing thelocation of the three sampling sites, Hong Kong, ChejuIsland, and Sado Island used in this study.
D19S12 COHEN ET AL.: MULTIELEMENTAL ANALYSIS OF AEROSOLS
2 of 18
D19S12

described in detail elsewhere [Cohen, 1993]. The very thin(nominal 230 mg/cm2) smaller diameter Teflon substrate[(CF2)n], was ideally suited to provide good ‘‘mass closure’’and allowed for a fairly complete interference free aerosolcharacterization [Cohen et al., 1996; Cohen, 1998; Cohen etal., 2002a]. Average site temperatures, sampling times, flowrates and masses for both sampling systems during the studyperiod for each of the three ACE-Asia sampling sites aregiven in Table 1.[12] Filters were weighed to ±1mg before and after
exposure in a temperature and humidity controlled labo-ratory where the temperature was 22�C and the relativehumidity less than 50%. Where possible filters weregenerally collected over a 24-hour period from midnightto midnight every Wednesday and Sunday throughout theyear. For optimum analysis conditions it was important totry to keep the mass/unit area of material collected on thefilters comparable to, or larger than, the mass/unit area ofthe filter itself. The average fine particle mass/unit areacollected on the Teflon filter was between 160 mg/cm2
and 290 mg/cm2 which was comparable to the averageTeflon filter thickness. For the Nuclepore filter, thickness�1 mg/cm2 (more than 4 times thicker than the Teflonfilter), the collected fine particulate mass/unit area wasbetween 21 mg/cm2 and 32 mg/cm2, significantly lowerthan on the Teflon filters. This lead to significantly poorermass detection limits for trace elements measured onNuclepore filters than equivalent measurements on Teflonfilters. For some sites during heavily polluted periodssamplers were operated on a two hours on two hours offbasis over the 24-hour collection period to minimizereduced flow rate and filter clogging problems.[13] The larger diameter (47 mm) and thicker (1 mg/cm2)
Nuclepore polycarbonate [H14C16O3] filters used in theGENT sampling system tended to produce poorer ‘‘massclosure’’ because total deposited hydrogen could not bemeasured accurately on a filter which contained largeamounts of hydrogen. Hence the GENT system was usedmainly to obtain the coarse and fine mass and elementalratios.
3. Filter Analysis Methods
[14] Accelerator-based ion beam analysis (IBA) methodshave been applied throughout this study [Cohen et al.,
1996; Cohen, 1998; Cohen et al., 2002a; Maenhaut et al.,1997]. In particular, the three simultaneous IBA techniquesof particle induced X-ray emission (PIXE), particle inducedgamma ray emission (PIGE) and proton elastic scatteringanalysis (PESA) have been used. They are ideally suited tothe multielemental analysis of fine particulate matter on theappropriate filter media. They cover a wide range ofelements in the periodic table from hydrogen to uranium,they have (mg/g) detection limits, they have short analysistimes (typically 5 min per sample) and are nondestructive.[15] The combination of these three IBAmethods provided
data on the following 21 elements, H, F, Na, Al, Si, P, S, Cl,K, Ca, Ti, V, Cr, Mn, Fe, Co, Cu, Ni, Zn, Br and Pb. Typicalminimum detectable limits (MDLs) range down to less than 1ng/m3 of air sampled and experimental errors were around±7% to ±15% for most of the elements listed. A comprehen-sive discussion of MDLs and errors related to these IBAtechniques has been presented by Cohen et al. [2002b].
3.1. Black Carbon Estimates
[16] Black carbon (BC) is the light absorbing part of thecarbonaceous aerosol while elemental carbon (EC) is defineby its thermal behavior and has an operational definitionrequiring temperatures above 340 �C and as high as 650 �Cto volatilize. Petzold and Niessner [1995] describe andcompare several different black carbon and elementalcarbon (EC) measurement techniques. All measurementsreported here are related to black carbon and not elementalcarbon.[17] Black carbon on the Teflon filters was estimated by
measuring the transmission of [He/Ne] laser light (wave-length 0.633 mm) through the filters before and afterexposure. That is, BC0 (mg/m3) = [100*A/(�V)] ln[I0/I]where A in cm2 was the filter collection area, V in m3
was the total sampled volume, I0 was the pre-exposure and Iwas the post-exposure laser intensity. Generally for particlesproduced by combustion processes the aerodynamic diam-eters are less than a micron and values of the massabsorption coefficient e ranging from 5 to 10 m2/g areappropriate for black carbon estimates [Fuller et al., 1999].Literature values of the black carbon mass absorptioncoefficient range from 4 to 20 m2/g with 10 m2/g previouslybeing used as the accepted value for black carbon fromdiesel smoke. However, Fuller et al. [1999] suggest that thisvalue for diesel smoke maybe as much as 50% too high.[18] The mass absorption coefficient is a function of the
wavelength as well as the absorbing particle diameter anddensity [Horvath, 1993, 1997]. For absorbing particles withdiameters much less than the [He/Ne] laser wavelength, themass absorption coefficient � is a slowly varying function ofparticle diameter and can be considered as constant forparticles of similar density. Calibration measurements byCohen et al. [2000b] on smoke from acetylene flames andcandle soot showed � = 7 m2/g to be a good value for blackcarbon estimates on fine particles collected on Teflon filterswhere the particle diameters were less than 0.6 mm. Malm etal. [1994] used a similar laser absorption technique forblack carbon estimates and made a small correction forabsorption effects due to the soil component. They usedthe following factor for the black carbon estimates, [BC] =[BC0]�0.11*[Soil], where the [ ] brackets denote themass/unit volume concentration of that species and BC
Table 1. Average Sampling Parameters for the Study Period at
Each of the Three ACE-Asia Sampling Sites for Both the ASP and
the GENT Samplers
ASP and GENTSampling Parameters
Hong KongMean ± SD
Cheju IslandMean ± SD
SadoMean ± SD
Tmax, �C 38 ± 8 21 ± 6 27 ± 8Tmin, �C 20 ± 5 13 ± 6 5 ± 5ASP sampling time, hours 20 ± 5 24 ± 3 24 ± 3ASP flow, 1/min 19 ± 4 21 ± 2 20 ± 2ASP volume, m3 23 ± 7 31 ± 3 29 ± 4ASP mass/filter, mg 665 ± 389 638 ± 417 362 ± 310Teflon thickness, mg/cm2 239 ± 55 229 ± 61 232 ± 54GENT sampling time, hours 17 ± 6 24 ± 3 24 ± 3GENT flow rate, l/min 15 ± 3 17 ± 2 17 ± 2GENT volume, m3 15 ± 4 24 ± 4 24 ± 3GENT fine mass/filter, mg 387 ± 208 347 ± 193 252 ± 126GENT coarse mass/filter, mg 547 ± 348 574 ± 592 409 ± 686
D19S12 COHEN ET AL.: MULTIELEMENTAL ANALYSIS OF AEROSOLS
3 of 18
D19S12

is the soil corrected black carbon estimate. All blackcarbon estimates in this paper have been performed usingthis soil correction.
3.2. Sulfate Estimates
[19] Sulfur was one of the major elemental componentsmeasured by IBA techniques in fine particulate matter. Itsorigin is mainly anthropogenic being produced by burningof fossil fuels by industry, in cars and for power production.[20] Airborne sulfur rarely occurs as the pure element it is
usually produced as SO2 gas which readily converts tosulfate (SO4
2�) ions under normal atmospheric conditions.The sulfate ions can exist in the atmosphere as sulfuric acidproducing acid rain or be partially neutralized to ammoniumbisulfate or fully neutralized to ammonium sulfate [Leeet al., 2001]. If we assume that sulfur occurs in theatmosphere in one of these three forms then clearly thesulfur concentrations can be used to estimate the concen-tration of any of these sulfate species [Malm et al., 1994].That is for the sulfate ion [SO4
2�] = 3*[S], for acidic sulfate[H2SO4] = 3.063*[S], for partially neutralized sulfate[NH4HSO4] = 3.594*[S] and for the fully neutralizedsulfate [(NH4)2SO4] = 4.125*[S]. Where the bracketsdenote the concentration of that species.
3.3. S, K, and Ca Non-Sea Salt Estimates
[21] Sulfur, potassium and calcium occur naturally in seaspray. For seawater the generally accepted sulfur, potassiumand calcium mass ratios relative to sodium are 0.084, 0.036and 0.038, respectively [Weast and Astle, 1982]. Studiesover seven years of the sulfur, potassium and calciumassociated with sea spray in the PM2.5 size fraction at theglobal base line station at Cape Grim in Tasmania, Australia[Cohen et al., 2000a] found the [S/Na] = 0.092 ± 0.085,[K/Na] = 0.032 ± 0.013 and [Ca/Na] = 0.038 ± 0.025 in goodagreement with Weast and Astle [1982]. Cape Grim sea salt(NaCl) accounted for 65% of the total PM2.5 mass so this wasan excellent site to measure these elemental ratios. Theseawater values of Weast and Astle [1982] have been usedto calculate non-sea salt sulfur (nss-S), potassium (nss-K) andcalcium (nss-Ca) throughout this work.
3.4. Total Hydrogen and Organic Matter Estimates
[22] Hydrogen has three primary sources, hydrogen inammonium associated with sulfate and nitrate ions, hydro-gen in organic matter and hydrogen associated with watervapor. The ion beam analysis (IBA) technique of protonelastic scattering (PESA) [Cohen, 1993] provides uniqueinformation on the total hydrogen content of the PM2.5
fraction collected on Teflon filters. This analysis wasperformed in vacuum and hence loosely bound water vaporwas generally lost, also nitrates were not well held on Teflonfilters [Malm et al., 1994]. Hence ammonium sulfate andorganic matter were the only two measurable major sourcesof hydrogen considered here.[23] Malm et al. [1994] gives the average composition of
organic matter in the PM2.5 size fraction as 9% hydrogen,20% oxygen and 71% carbon. We have tested this assump-tion using Rutherford backscattering (RBS) methods tomeasure total carbon and oxygen and PESA to measure totalhydrogen [Cohen, 1993; Cohen et al., 1996; Cohen, 1998]and agree with their organic composition to within ±25% for
each of these three components. Assuming the averageorganic particle was 9% hydrogen we can estimate theaverage organic content in our PM2.5 size fraction from themeasured total hydrogen and sulfur through the followingexpression, [Organics] = {[Htot]� [0.25*S]}/0.09, where thesquare brackets indicate the concentration (mg/m3) of thatspecies. Note we again assume that the sulfate ion was fullyneutralized to ammonium sulfate. This may not always be thecase [Malm et al., 1994; Lee et al., 2001].
3.5. Total Salinity Estimates
[24] Salinity was an estimate of the total sea saltcontent on the filter. It included salts of the seven mostanions and cations which make up 99.7% of the salinityfound in seawater, namely Na+, Mg+, Ca2+, K+, Cl�,SO4
2� and HCO3� [Weast and Astle, 1982]. Sodium
chloride is the most abundant salt in seawater accountingfor about 86% of the total salinity. For this work totalsalinity was estimated by 3.25*[Na] and the sodiumchloride estimate, sometimes referred to as sea salt, wasestimated by 2.54*[Na]. It was assumed that the majorityof the measured sodium mass was associated with seaspray at each of the three sites. This was a reasonableassumption since the sodium associated with crustalmaterial is typically much less than 3% by weight[Mason and Moore, 1982] and sea salt and soil were ofcomparable mass concentrations in the PM2.5 mass frac-tion at the ACE Asia sites [Cohen et al., 2002c]. In thecoarse fraction (2.5 mm to 10 mm) sea salt was typically 4to 5 times the soil concentration; hence the effects ofsodium in soil on total salinity estimates were minimal.
4. PM2.5 Fine Mass
[25] The 24-hour averaged PM2.5 mass fraction results forthe Hong Kong site are plotted in Figure 2 as monthly boxand whisker plot. The shaded box represents 25% to 75% ofthe distribution of all points; the upper and lower whiskersrepresent 1.5 times the distribution shown by the box. Thehorizontal bar in the box indicates the median and the plussign the mean of the distribution for that month. All pointslying outside the range defined by the whiskers (extremeevents) are plotted as outlier dots. The horizontal date axis isrepresented as year and month with, for example, 200204being the month of April 2002.
Figure 2. Monthly averaged box and whisker plot for thefine mass measurements at the Hong Kong site during thestudy period.
D19S12 COHEN ET AL.: MULTIELEMENTAL ANALYSIS OF AEROSOLS
4 of 18
D19S12
[26] At the Hong Kong site the PM2.5 cyclone sampledon 170 days between the 3 January 2001 and 30 June2002. Average 24-hour fine mass values ranged frombelow 10 mg/m3 to over 100 mg/m3 with a median valueof 29 mg/m3.[27] The median values of Figure 2 show that May to
August inclusive (approximate summer period) were rela-tively low fine mass months and November through toMarch(approximate winter-spring period) were significantly highermonths for the Hong Kong site. The prevailing winds wereeasterly and southeasterly in the summer period. During thewinter season the prevailing winds in Hong Kong are fromthe north and northeast bringing in industrial pollution fromthe eastern Chinese mainland north of Hong Kong [Cheng etal., 2000; Lam et al., 2001; Wang et al., 2003]. Clearly therewere selected periods of the year when the mass concen-trations were particularly high. These periods have beenidentified in previous studies also and were related tosignificant international events such as dust emissions fromdesert regions in China as well as favorable meteorologicalconditions bringing pollution from eastern China into HongKong [Arndt et al., 1998; Benkovitz et al., 1996; Zhang et al.,1997; Mori et al., 2002].[28] Figure 3 is similar plot to Figure 2 for PM2.5 particle
mass at the Cheju Island sampling site. Filters were collectedon 121 days between the 30 March 2001 and 30 June 2002.[29] The Cheju Island fine mass data were generally
lower than the Hong Kong data but still showed largeranges in the daily data from below 10 mg/m3 to well above50 mg/m3. The seasonal trends at Cheju Island site were notas strongly developed as at the Hong Kong site. Howeverthe spring (March and April) highs as identified by otherstudies [Carmichael et al., 1996; Kim et al., 1998; Lee etal., 2001] were also present in this study.[30] At the Sado Island site the PM2.5 cyclone sampled on
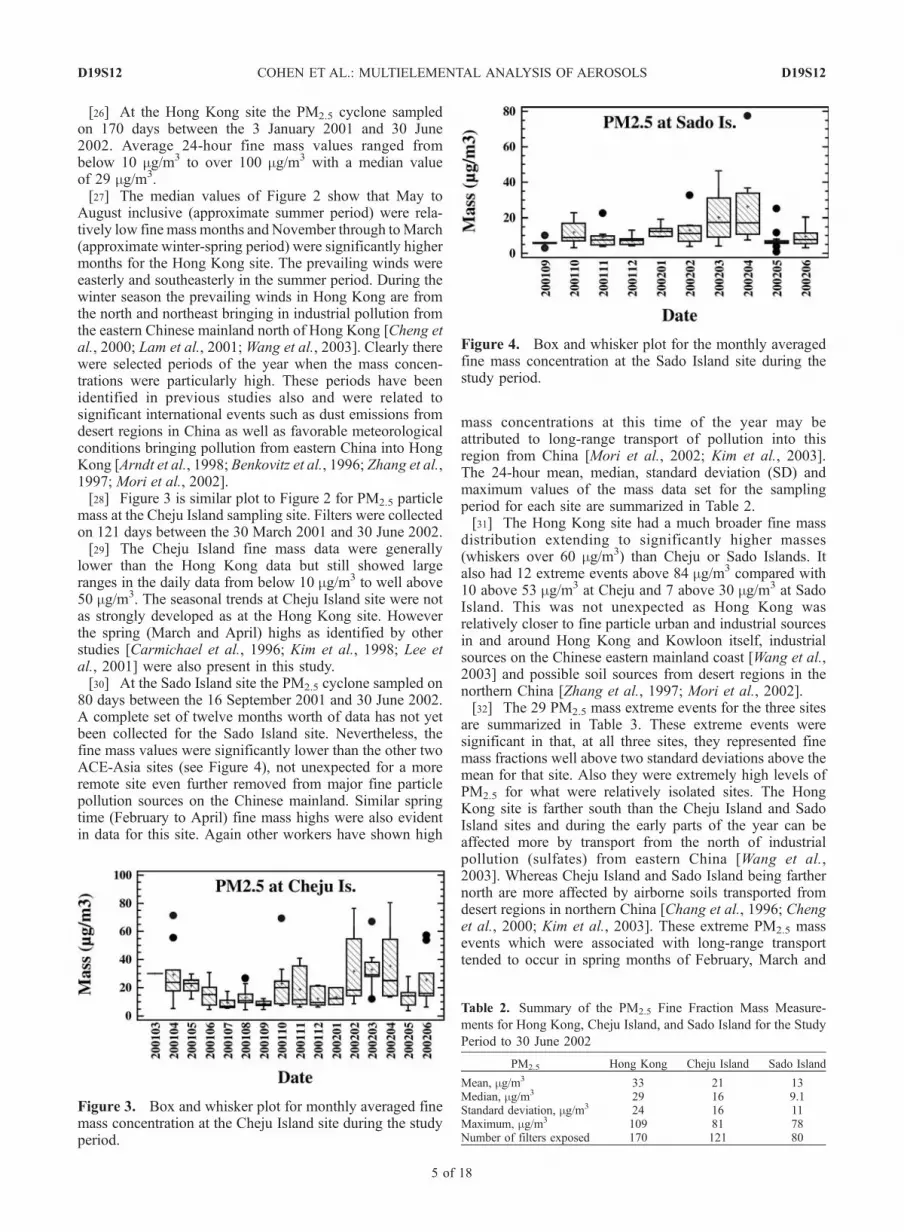
80 days between the 16 September 2001 and 30 June 2002.A complete set of twelve months worth of data has not yetbeen collected for the Sado Island site. Nevertheless, thefine mass values were significantly lower than the other twoACE-Asia sites (see Figure 4), not unexpected for a moreremote site even further removed from major fine particlepollution sources on the Chinese mainland. Similar springtime (February to April) fine mass highs were also evidentin data for this site. Again other workers have shown high
mass concentrations at this time of the year may beattributed to long-range transport of pollution into thisregion from China [Mori et al., 2002; Kim et al., 2003].The 24-hour mean, median, standard deviation (SD) andmaximum values of the mass data set for the samplingperiod for each site are summarized in Table 2.[31] The Hong Kong site had a much broader fine mass
distribution extending to significantly higher masses(whiskers over 60 mg/m3) than Cheju or Sado Islands. Italso had 12 extreme events above 84 mg/m3 compared with10 above 53 mg/m3 at Cheju and 7 above 30 mg/m3 at SadoIsland. This was not unexpected as Hong Kong wasrelatively closer to fine particle urban and industrial sourcesin and around Hong Kong and Kowloon itself, industrialsources on the Chinese eastern mainland coast [Wang et al.,2003] and possible soil sources from desert regions in thenorthern China [Zhang et al., 1997; Mori et al., 2002].[32] The 29 PM2.5 mass extreme events for the three sites
are summarized in Table 3. These extreme events weresignificant in that, at all three sites, they represented finemass fractions well above two standard deviations above themean for that site. Also they were extremely high levels ofPM2.5 for what were relatively isolated sites. The HongKong site is farther south than the Cheju Island and SadoIsland sites and during the early parts of the year can beaffected more by transport from the north of industrialpollution (sulfates) from eastern China [Wang et al.,2003]. Whereas Cheju Island and Sado Island being farthernorth are more affected by airborne soils transported fromdesert regions in northern China [Chang et al., 1996; Chenget al., 2000; Kim et al., 2003]. These extreme PM2.5 massevents which were associated with long-range transporttended to occur in spring months of February, March and
Figure 3. Box and whisker plot for monthly averaged finemass concentration at the Cheju Island site during the studyperiod.
Figure 4. Box and whisker plot for the monthly averagedfine mass concentration at the Sado Island site during thestudy period.
Table 2. Summary of the PM2.5 Fine Fraction Mass Measure-
ments for Hong Kong, Cheju Island, and Sado Island for the Study
Period to 30 June 2002
PM2.5 Hong Kong Cheju Island Sado Island
Mean, mg/m3 33 21 13Median, mg/m3 29 16 9.1Standard deviation, mg/m3 24 16 11Maximum, mg/m3 109 81 78Number of filters exposed 170 121 80
D19S12 COHEN ET AL.: MULTIELEMENTAL ANALYSIS OF AEROSOLS
5 of 18
D19S12

April at all three sites. Whether these high fine mass eventswere dominated by high soil, sulfate or black carbon isdiscussed further below when the contributions to thePM2.5 mass are presented.
5. Fine Soil Estimates
[33] Soil has previously been identified as a significantcomponent of the Asian aerosol in our study region[Carmichael et al., 1996; Chang et al., 1996; Holmes andZoller, 1996; Kim et al., 1998; Cheng et al., 2000; Hien etal., 2002; Jaffe et al., 1999]. Kim et al. [2003] found thatduring the spring of 2001, Asian dust events were theprominent sources of major crustal components in the finefraction of particulate matter. In order to obtain a reliableestimate of the fine soil mass associated with the totalPM2.5 mass measured at each site, Principal ComponentsAnalysis (PCA) was used to identify major elements asso-ciated with the soil fingerprints for the region [Cohen et al.,1996; Cohen, 1998; Cheng et al., 2000]. This was done foreach site separately and for the combined data for all threesites. Table 4 shows the factor loadings from a PCA analysisof 371 PM2.5 Teflon filters for the combined data for allthree sites.[34] Factors with two or more elements with factor
loadings above 0.5 have been highlighted. Four factorswere required to explain 86% of the sample variance. Factorloadings near 1.0 demonstrate that the element has a strongassociation with that individual factor. Elements with com-munalities below 0.5 (e.g., Co) were excluded from theanalysis.[35] Factor 1 in Table 4 explained 54% of the variance and
included the elements Al, Si, Ti, K, Ca, Mn and Fe, whichwere recognized as typical soil indicators [Chang et al.,1996; Kim et al., 1998; Cohen et al., 2002c]. Factor 2explained 17% of the sample variance and was labeledautos/industry as it included high factor loadings for S, Pb,Zn, black carbon and H, typical of car and industry emis-sions [Cohen et al., 1996; Cohen, 1998]. Factors 3 and 4explained 7% to 8% of the variance each and contained onlytwo key elements. These were labeled oil/diesel [Cheng etal., 2000] and Sea salt [Cohen et al., 2000a, 2002c],respectively. Also the factor loadings for Na were higherin the sea salt factor 4 than the soil factor 1 demonstrating
most of the data set variability for Na was associated with seasalt rather than soil in the fine mass fraction as discussedpreviously.[36] The seven elements, Al, Si, K, Ca, Ti, Mn, and Fe
were common to the soil factor for each site and for thecombined site data shown in Table 4. However, there was arange of other trace elements that were associated with thesoil factors at selected sites. For example copper wasassociated with the soil factors at the Cheju and Sado Islandsites (factor loadings > 0.5) but not at the Hong Kong siteand hence appeared in the soil factor of the combined dataof Table 4. Close inspection of the individual site data forcopper showed that this association with the soil factor wasdue mainly to 11 out of the 121 points at Cheju Island and6 out of the 81 points at Sado Island having copper concen-trations in excess of twice the average values for each of thesesites during the study period. Each site will generally have itsown unique trace elements associated with local sources,soils and conditions. These trace elements, although impor-tant for source fingerprinting, have little influence whenestimating the soil mass contributions and the sum of theseven selected elements listed above dominated the total soilmass estimates.[37] It is important not to include elements in a soil
estimate that may have significant contributions from sour-ces other than soil, as inclusion of these will tend to overestimate the soil component. We have attempted to mini-mize this problem in two ways, firstly by removing knowncomponents of elemental concentrations from sources otherthan soil. For example, by removing the sea salt componentfrom the total potassium and calcium estimates through aknowledge of the [K/Na] and [Ca/Na] ratios in seawater[Weast and Astle, 1982]. Secondly, by plotting each elementagainst silicon, the major soil component measured in thisstudy, we obtain the minimum least squares fitted gradientthat excludes excess contributions of this element not
Table 3. Summary of the Extreme PM2.5 Mass Events for the
Hong Kong, Cheju Island, and Sado Island Sampling Sites for the
Study Period to 30 June 2002
Hong Kong Cheju Isand Sado Island
DateMass,mg/m3 Date
Mass,mg/m3 Date
Mass,mg/m3
28-Feb-01 94 13-Apr-01 71 20-Feb-02 3310-Mar-01 103 27-Apr-01 55 10-Mar-02 4611-Mar-01 94 24-Oct-01 69 17-Mar-02 3126-Sep-01 91 03-Feb-02 76 24-Mar-02 3511-Nov-01 91 06-Feb-02 54 03-Apr-02 7826-Dec-01 109 31-Mar-02 67 07-Apr-02 3130-Dec-01 100 10-Apr-02 80 10-Apr-02 3708-Jan-02 93 17-Apr-02 5409-Jan-02 87 05-Jun-02 5425-Jan-02 91 12-Jun-02 5701-Feb-02 10910-Feb-02 84
Table 4. Principal Components Analysis (PCA) With Varimax
Rotation for all PM2.5 Data From Hong Kong, Cheju Island, and
Sado Island to 30 June 2002
Element Soil 1Autos/
Industry 2Oil/
Diesel 3SeaSalt 4 Communality
Al 0.976 0.073 0.134 0.002 0.975K 0.969 0.182 0.128 0.037 0.99Fe 0.969 0.181 0.128 0.037 0.99Si 0.968 0.159 0.095 0.034 0.973Ti 0.908 0.321 0.118 0.012 0.942Ca 0.906 0.259 �0.004 0.122 0.902Mn 0.785 0.511 �0.003 0.114 0.892Cu 0.703 0.364 0.392 0.088 0.788S 0.186 0.899 0.099 �0.057 0.856Pb 0.287 0.892 0.087 0.146 0.906Zn 0.292 0.875 0.137 0.172 0.899BC 0.188 0.848 0.176 0.085 0.792H 0.215 0.815 0.17 0.047 0.742Br 0.222 0.788 0.18 0.354 0.827P 0.022 0.747 0.18 �0.346 0.711Cr 0.449 0.693 �0.074 �0.035 0.689V 0.238 0.089 0.911 0.033 0.896Ni 0.111 0.47 0.807 �0.016 0.884Cl �0.014 �0.079 0.063 0.896 0.813Na 0.223 0.455 �0.064 0.673 0.714
Variance, % 54 17 7.80 6.90 total: 86Eigenvalue 10.9 3.4 1.6 1.4
D19S12 COHEN ET AL.: MULTIELEMENTAL ANALYSIS OF AEROSOLS
6 of 18
D19S12

associated with silicon. In this way a soil fingerprint basedon silicon can be readily constructed.[38] A good example of this problem was potassium.
Potassium has three possible primary sources, smoke frombiomass burning, sea salts and windblown soil. This mayhave been the reason that Malm et al. [1994] excluded Kfrom their soil estimates. If we remove the sea salt compo-nent of potassium by considering nss-K then a standard plotof nss-K against silicon will allow us to separate the smokefrom the soil source and hence estimate the potassiumcontent of the soil.[39] This technique is well demonstrated by Figure 5
where the plot for the nss-K at Cheju Island shows twodistinct groupings, low potassium associated with silicon insoil and higher potassium concentrations with lower siliconconcentrations not associated with soil. This techniqueallowed us to extract an estimate of the potassium associ-ated with soil alone from the measured total potassiumconcentration. The gradient of fits to data similar to the plotsto Figure 5 at each site allowed the fraction of potassiumrelative to silicon in the soil fingerprints to be estimatedwith reasonable confidence.[40] The element Mn was included in our soil fingerprint
but not in soil estimates of Malm et al. [1994]. Table 4shows that Mn had significant factor loadings for soil(factor 1) as well as for cars and industry (factor 2). Hencelike potassium it too had several possible sources. In similartreatments to that described in Figure 5, a Mn factor in soilwas extracted by considering the appropriate minimumgradient correlation plots with Si and ignoring some higherMn concentrations above about 50 ng/m3 which were notassociated with soil.[41] Finally the seven elements Al, Si, K, Ca, Ti, Mn
and Fe in their oxide form were used to define a universalACE-Asia soil fingerprint. The gradient of least squaresfits for silicon to each of the above elements is given inTable 5 together with the standard error (SE) of the fit, thecorrelation coefficient (R2) of the fit, and the number ofpoints used for each fit. The oxygen content was calcu-lated by assuming each of the seven elements in the soilfingerprint occurred in its most abundant natural oxidestate.
[42] The techniques used to obtain the gradients ofTable 5 enabled us to define a fingerprint for soil at eachof the sampling sites and across all three sampling sites.Figure 6 is such a plot. It shows the elemental fractions forsoil at Hong Kong, Cheju Island, Sado Island and all threesites together.[43] When the errors were considered there was very little
difference between the major element soil fingerprints atHong Kong, Cheju Island and Sado Island. This wasexpected considering the methods used to obtain thesefingerprints. The main differences were slightly increasedAl and K and decreased Ca at Sado Island and reduced Aland increased Ca and Mn at Hong Kong.[44] Table 6 gives the fractions of each of the seven
elements and their oxides for the universal ACE-Asia soilfingerprint shown in Figure 6. The average Earth’s crustalvalues taken from Mason and Moore [1982] have beenincluded for comparison purposes. The agreement was quitegood considering the variability of crustal material and soilsaround the world. Also the sum of the eight Mason andMoore elements for crustal material accounts for 99.97% oftheir total crustal mass. Demonstrating that the oxides ofthese seven elements account for the vast bulk of the crustalsoil mass.
Figure 5. Correlation plot for silicon versus non-sea saltpotassium at Cheju Island for the study period to 30 June2002.
Table 5. Gradient, Standard Error (SE), and Correlation Coeffi-
cient (R2) of the Correlation Plots Relative to Silicon for Each Soil
Element Identified by PCA for All Data From Three ACE-Asia
Sites Over the Total Study Period
Element Gradient ± SE R2Numberof Points Comments
Al 0.323 ± 0.002 0.98 369 Al < 1600 ng/m3
K 0.190 ± 0.001 0.98 334 K < 1000 ng/m3
Ca 0.213 ± 0.003 0.92 368 Ca < 900 ng/m3
Ti 0.034 ± 0.0005 0.93 371Mn 0.014 ± 0.0004 0.79 365 Mn < 50 ng/m3
Fe 0.317 ± 0.002 0.98 368 Fe < 1600 ng/m3
O 2.55 ± 0.006 0.99 371 assumes common oxide form
Figure 6. Calculated elemental fractions in soil for theHong Kong, Cheju Island, Sado Island, and all sitestogether using the seven elements fingerprint.
D19S12 COHEN ET AL.: MULTIELEMENTAL ANALYSIS OF AEROSOLS
7 of 18
D19S12

[45] Figures 7, 8, and 9 show monthly box and whiskerplots for the fine PM2.5 soil estimates for the Hong Kong,Cheju Island and Sado Island for the study period to 30 June2002. The main feature of all three plots was the high soilevents associated with the months February, March andApril. Hong Kong and Cheju Island showed relatively lowersoil concentrations during June, July and August than atother times of the year. Not enough data have been collectedyet to observe similar summer trends for the Sado Islandsite.[46] When compared with the total fine mass plots of
Figures 2–4 we see that the median percentage fine soilvalues at the three sampling sites are very similar all beingbelow about 10% of the fine mass. The Hong Kong site had14 extreme soil events with 14% or more of the fine mass assoil, the Cheju island site had 11 extreme events with thesoil content above 21% and Sado Island 9 such events withsoil above 17% during the sampling period to 30 June 2002.High percentage soil events at each site tended to occur inthe same periods as the high mass events (see Table 3), thatis, mainly in February, March and April of each year. Thiswas consistent with fine soil being transported from theChinese mainland to Korean and Japanese sites as reportedby others [Uematsu et al., 1985; Carmichael et al., 1996;Zhang et al., 1997; Kim et al., 2003].[47] Table 7 is a summary table showing the mean,
median, standard deviation and maximum PM2.5 soilconcentrations and percentages at three ACE-Asia sam-pling sites during the study period to 30 June 2002. Themedian values were highest in Hong Kong and lowest atSado Island as expected. However for extreme situations
the soil concentrations at Sado Island were not toodifferent to Hong Kong or Cheju Island reaching levelsup to 26 mg/m3 and contributing more than 35% to thetotal PM2.5 mass fraction.[48] The ACE-Asia soil fingerprints of Figure 6 showed
slight differences in the Ca and Al fractions at differentsampling sites. It is expected that there are significantdifferences in soil compositions across China. ChinaNational Environmental Monitoring Centre [1994] giveshigher Ca values in the northwestern regions and higherAl values in the southeastern regions with widely ranging(Ca/Al) ratios from the southeast to the northwest.Carmichael et al. [1996] and Chang et al. [1996] bothdiscuss wind blown soils from arid regions in central andeastern China rich in calcium being transported across ourcurrent study region.[49] Figure 10 is a plot of the (nss-Ca/Al) ratio against the
percentage of soil in the fine PM2.5 size fraction for each ofthe three sites. The data split into two distinct groups withno clear differences between the three sites.[50] The first group was the high percentage soil (Soil >
5%) with the (nss-Ca/Al) ratio less than 2 and the secondgroup was the low percentage soil (Soi l < 5%) with the(Ca/Al) ratio greater 2. The high (nss-Ca/Al) ratio eventscould be associated with local soils or local Ca sourcessuch as cement production impacting each site. Whereasthe high percentage soil events with relatively constant(nss-Ca/Al) ratios around unity were more likely to be dueto long-range windblown soils transported from the Chinesemainland [Carmichael et al., 1996; Holmes and Zoller,
Table 6. Mean Elemental Fractions in Soil From All ACE-Asia
Sites Obtained From Least Squares Fits to Each Element Relative
to Silicon and Assumig Each Element Occurs as Its Common
Oxide
Element Fraction ± SD Crustal Materiala
Al 0.069 ± 0.010 0.086Si 0.215 ± 0.039 0.294K 0.041 ± 0.006 0.027Ca 0.046 ± 0.014 0.039Ti 0.0074 ± 0.002 0.0047Mn 0.0030 ± 0.002 0.001Fe 0.068 ± 0.010 0.053O 0.550 ± 0.027 0.495aFrom Mason and Moore [1982].
Figure 7. PM2.5 soil estimates for Hong Kong during thestudy period to 30 June 2002.
Figure 8. PM2.5 soil estimates for Cheju Island during thestudy period to 30 June 2002.
Figure 9. PM2.5 soil estimates for Sado Island during thestudy period to 30 June 2002.
D19S12 COHEN ET AL.: MULTIELEMENTAL ANALYSIS OF AEROSOLS
8 of 18
D19S12

1996; Zhang et al., 1997]. Average coarse dust [Al/Ca] ratiosof (1.3 ± 1.2) measured by Holmes and Zoller [1996] forAsia dust over the Mauna Loa observatory on Hawaii arealso consistent with this argument. Consideration of backtrajectories and meteorological data would help resolvethis problem and will be considered further in a futurepublication when we look in detail at source fingerprinting,source apportionment and transport using this data set.[51] Large variations may occur in the (nss-Ca/Al) com-
position of Chinese mainland soils measured on the groundat different sites across China but these differences do notappear to be showing up in the fine airborne soil contribu-tions blown thousands of kilometers across the Koreanpeninsula and into Japan. This was an important finding,consistent with findings of Holmes and Zoller [1996] whofound that transported mineral aerosol first lofted and thenexperiencing mixing and fallout during transport no longerhad an elemental fingerprint resembling that of the bulk soilfrom which it was originally derived.
6. Sulfur and Sulfate
[52] Sulfur was one of the major elemental componentsmeasured on all filters during this study. Using a [S/Na]ratio of 0.084 for seawater [Weast and Astle, 1982] weestimated that, for the PM2.5 fraction, at all three ACE-Asiasites in this study, the sea-salt related sulfur component of
the total sulfur mass accounted for less than (3 ± 5)% byweight. Hence the bulk of the sulfur was probably anthro-pogenic in origin.[53] Figures 11, 12, and 13 are the monthly averaged box
and whisker plots for the total PM2.5 sulfur mass at theHong Kong, Cheju Island and Sado Island sites. The medianpercentage sulfur mass concentrations and the seasonalvariations were quite similar for all three sites. Sulfur valuestended to be higher in the winter months. The maindifference being that Hong Kong had more extreme eventswith total sulfur above 6 mg/m3 than the other two sites.[54] The box and whisker plot of Figure 14 shows that the
estimated percentage sulfate (SO42�) concentrations present
in the fine mass fraction at the Hong Kong, Cheju Island,and Sado Island sites were very consistent, with medianvalues between 25% and 35% of the total fine mass. Thesevalues were consistent with average sulfate ion concentra-tions measured by Kim et al. [1998], ranging from 30% to50% of the total PM2.5 mass fraction at the Cheju Island sitein the summer of 1994. They were also comparable with theannual measured and model calculation of estimates ofArndt et al. [1998] for the average annual sulfate concen-trations (2 mg/m3�10 mg/m3) at 16 locations across Japan,Korea and eastern China. Lee et al. [2001] report sulfateconcentrations, at selected times in 1996 and 1997 at ChejuIsland, between 4 mg/m3 and 6 mg/m3 which represented21% to 35% of the total PM2.5 mass measured. Again
Table 7. Mean, Median, Standard Deviation, and Maximum
PM2.5 Soil Concentrations and Percentages at Three ACE-Asia
Sampling Sites
PM2.5 Hong Kong Cheju Island Sado Island
Soil, mg/m3
Mean, mg/m3 2.6 2.3 1.5Median, mg/m3 1.4 0.92 0.49Standard deviation, mg/m3 2.9 3.7 3.5Maximum, mg/m3 17 22 26
Soil, %Mean, % 7 8.7 7.7Median, % 5.2 5.4 5.8Standard deviation, % 5.8 8.3 6.6Maximum, % 36 43 35
Figure 10. Plot of the nssCa/Al ratio for all three ACE-Asia sites during the study period to 30 June 2002.
Figure 11. Monthly averaged box and whisker plot for thefine sulfur measurements at the Hong Kong site during thestudy period.
Figure 12. Monthly averaged box and whisker plot for thefine sulfur measurements at the Cheju Island site during thestudy period.
D19S12 COHEN ET AL.: MULTIELEMENTAL ANALYSIS OF AEROSOLS
9 of 18
D19S12
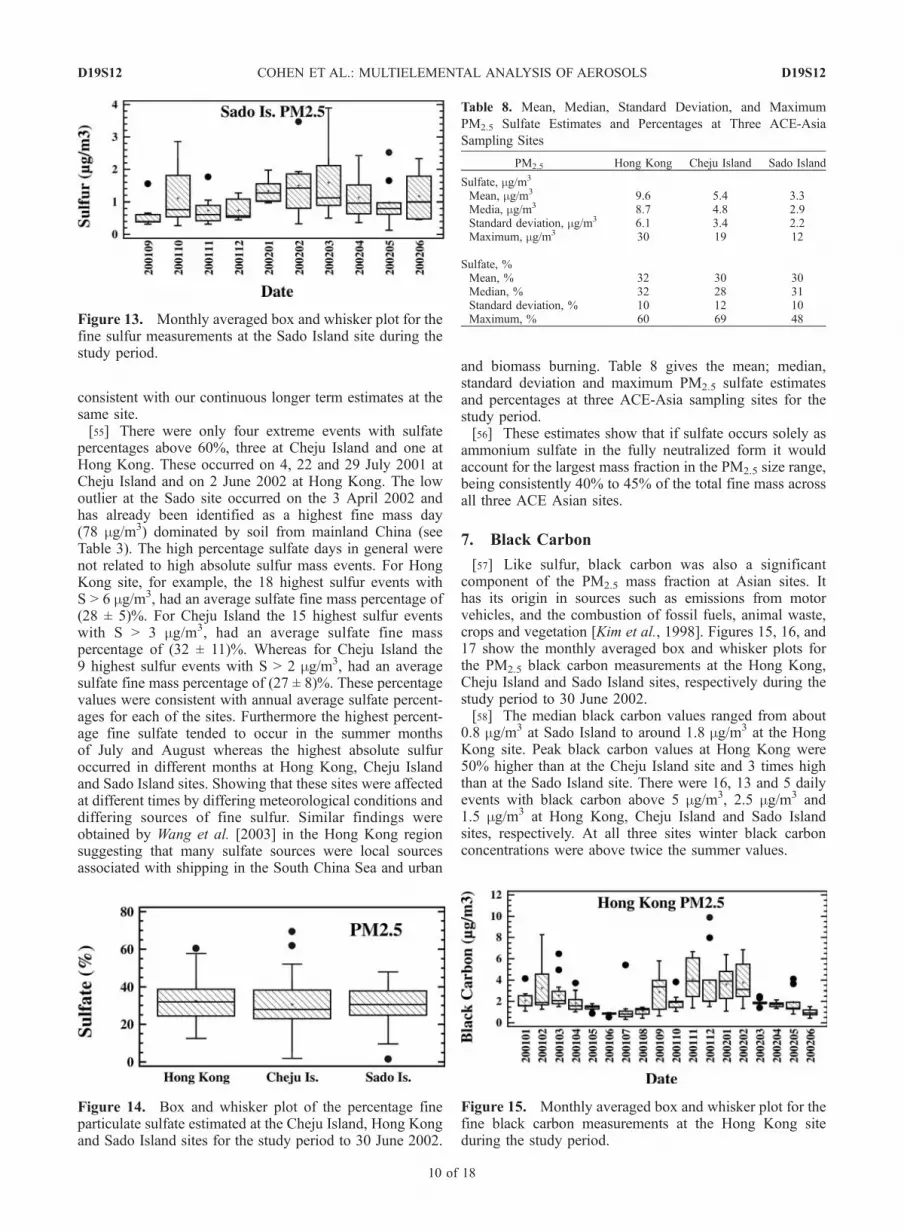
consistent with our continuous longer term estimates at thesame site.[55] There were only four extreme events with sulfate
percentages above 60%, three at Cheju Island and one atHong Kong. These occurred on 4, 22 and 29 July 2001 atCheju Island and on 2 June 2002 at Hong Kong. The lowoutlier at the Sado site occurred on the 3 April 2002 andhas already been identified as a highest fine mass day(78 mg/m3) dominated by soil from mainland China (seeTable 3). The high percentage sulfate days in general werenot related to high absolute sulfur mass events. For HongKong site, for example, the 18 highest sulfur events withS > 6 mg/m3, had an average sulfate fine mass percentage of(28 ± 5)%. For Cheju Island the 15 highest sulfur eventswith S > 3 mg/m3, had an average sulfate fine masspercentage of (32 ± 11)%. Whereas for Cheju Island the9 highest sulfur events with S > 2 mg/m3, had an averagesulfate fine mass percentage of (27 ± 8)%. These percentagevalues were consistent with annual average sulfate percent-ages for each of the sites. Furthermore the highest percent-age fine sulfate tended to occur in the summer monthsof July and August whereas the highest absolute sulfuroccurred in different months at Hong Kong, Cheju Islandand Sado Island sites. Showing that these sites were affectedat different times by differing meteorological conditions anddiffering sources of fine sulfur. Similar findings wereobtained by Wang et al. [2003] in the Hong Kong regionsuggesting that many sulfate sources were local sourcesassociated with shipping in the South China Sea and urban
and biomass burning. Table 8 gives the mean; median,standard deviation and maximum PM2.5 sulfate estimatesand percentages at three ACE-Asia sampling sites for thestudy period.[56] These estimates show that if sulfate occurs solely as
ammonium sulfate in the fully neutralized form it wouldaccount for the largest mass fraction in the PM2.5 size range,being consistently 40% to 45% of the total fine mass acrossall three ACE Asian sites.
7. Black Carbon
[57] Like sulfur, black carbon was also a significantcomponent of the PM2.5 mass fraction at Asian sites. Ithas its origin in sources such as emissions from motorvehicles, and the combustion of fossil fuels, animal waste,crops and vegetation [Kim et al., 1998]. Figures 15, 16, and17 show the monthly averaged box and whisker plots forthe PM2.5 black carbon measurements at the Hong Kong,Cheju Island and Sado Island sites, respectively during thestudy period to 30 June 2002.[58] The median black carbon values ranged from about
0.8 mg/m3 at Sado Island to around 1.8 mg/m3 at the HongKong site. Peak black carbon values at Hong Kong were50% higher than at the Cheju Island site and 3 times highthan at the Sado Island site. There were 16, 13 and 5 dailyevents with black carbon above 5 mg/m3, 2.5 mg/m3 and1.5 mg/m3 at Hong Kong, Cheju Island and Sado Islandsites, respectively. At all three sites winter black carbonconcentrations were above twice the summer values.
Figure 13. Monthly averaged box and whisker plot for thefine sulfur measurements at the Sado Island site during thestudy period.
Figure 14. Box and whisker plot of the percentage fineparticulate sulfate estimated at the Cheju Island, Hong Kongand Sado Island sites for the study period to 30 June 2002.
Figure 15. Monthly averaged box and whisker plot for thefine black carbon measurements at the Hong Kong siteduring the study period.
Table 8. Mean, Median, Standard Deviation, and Maximum
PM2.5 Sulfate Estimates and Percentages at Three ACE-Asia
Sampling Sites
PM2.5 Hong Kong Cheju Island Sado Island
Sulfate, mg/m3
Mean, mg/m3 9.6 5.4 3.3Media, mg/m3 8.7 4.8 2.9Standard deviation, mg/m3 6.1 3.4 2.2Maximum, mg/m3 30 19 12
Sulfate, %Mean, % 32 30 30Median, % 32 28 31Standard deviation, % 10 12 10Maximum, % 60 69 48
D19S12 COHEN ET AL.: MULTIELEMENTAL ANALYSIS OF AEROSOLS
10 of 18
D19S12

[59] A comparison with the extreme soil events showedthat only on one occasion at Cheju Island, on 13 April 2001,and one occasion at Sado Island, on 7 April 2002, did anextreme soil event correspond with an extreme black carbonevent at the same site. There were no such occurrences at allfor the Hong Kong site. This was strong evidence for thesoil and black carbon at each of the ACE Asia sites, duringextreme events, having different source locations.[60] Table 9 summarizes the measured fine black carbon
masses and their percentages for the three sampling sitesduring the study period. The average percentage blackcarbon at the three sites was similar at around 8% to 9%of the total PM2.5 mass with maximum percentages rangingfrom 23% to 31% of the fine mass.[61] Kim et al. [1998] measured fine elemental carbon
(note this is not the same as black carbon, Petzold andNiessner [1995] at Cheju Island in July to August 1994 ataround 1% of the total fine mass and ranging from 0.01 to0.80 mg/m3. This was less than the present black carbonestimates of (7 ± 3)% ranging from 0.15 to 1.5 mg/m3 forthese same summer months in 2001–02 when values weretraditionally lower.[62] Extreme events with a high percentage black carbon
do not correspond well with absolutely high black carbonevents of Figures 15–17. For Cheju Island there were onlythree extreme event days, the 7 and 14 October 2001 and the7 November 2001 with black carbon above 20% of the totalfine mass. Sado Island had only one such day, 1 May 2002.
While Hong Kong had 10 extreme event days with blackcarbon above 15% of the total fine mass. For Cheju Islandthe 14 October 2001 was the only high percentage blackcarbon day with black carbon greater than 2.5 mg/m3. ForHong Kong and Sado Island none of the high percentageextreme events had absolute black carbon masses above2.5 mg/m3. This showed that extreme absolute black carbonevents at all three sites tended to occur when the percentageblack carbon was typical of the mean percentage value(around 8% to 9%). Extreme percentage black carbon eventstended to occur when the total fine mass was significantlyless than the median value for that site. That is, during outstudy period high percentage black carbon was not associ-ated with absolutely high black carbon and was mainlyproduced by other components such as sulfate and soil beingrelatively lower, thus reducing the total fine mass.[63] The PCA techniques of Table 4 showed that, across
all sites, both black carbon and sulfur were stronglyassociated (factor loadings > 0.84) with the source assignedto automobiles and industry (factor 2). Figure 18 shows thatthese two elements do indeed correlate fairly well (R2 =0.50) particularly for black carbon concentrations belowabout 2 mg/m3. The points to the right of the least squaresfitted line represent higher black carbon values not associ-ated with sulfur and were probably associated with smoke
Figure 16. Monthly averaged box and whisker plot for thefine black carbon measurements at the Cheju Island siteduring the study period.
Figure 17. Monthly averaged box and whisker plot for thefine black carbon measurements at the Sado Island siteduring the study period.
Table 9. Mean, Median, Standard Deviation, and Maximum
PM2.5 black Carbon Concentrations and Percentages at Three
ACE-Asia Sampling Sites During the Study Period
PM2.5 Hong Kong Cheju Island Sado Island
Black Carbon, mg/m3
Mean, mg/m3 2.3 1.5 0.87Median, mg/m3 1.8 1.1 0.77Standard deviation, mg/m3 1.7 1.2 0.46Maximum, mg/m3 9.9 6.6 2.7
Black Carbon, %Mean, % 8.2 8.4 9Median, % 7 7.4 8.3Standard deviation, % 3.6 4.5 4.2Maximum, % 23 25 31
Figure 18. Black carbon-sulfur correlation plot for all thePM2.5 data from the Hong Kong site for the study period to30 June 2002.
D19S12 COHEN ET AL.: MULTIELEMENTAL ANALYSIS OF AEROSOLS
11 of 18
D19S12

sources from biomass burning. Whereas points to the left ofthe line represented fine particle sources such as fossil fuelburning with relatively higher sulfur and lower black carboncomponents [Cohen et al., 2002c]. Similar sulfur and blackcarbon correlations were also observed for the Cheju andSado Island sites during the study period.
8. Total Hydrogen and Organic Matter
[64] As discussed previously ammonium ions and organicmatter were the two major sources contributing to the totalmeasured hydrogen considered here. Figures 19, 20, and 21are monthly averaged box and whisker plots for the PM2.5
total hydrogen measurements at the Hong Kong, ChejuIsland and Sado Island sites during the study period up to30 June 2002. Hong Kong showed the strongest seasonalvariations being higher in the winter and lower in thesummer months. The Cheju and Sado sites showed rela-tively higher total hydrogen in the months of February,March and April.[65] Table 10 summarizes the total hydrogen mass mea-
surements for the data shown in Figures 19–21. Hydrogenwas typically 3% to 4% of the total fine mass, but this couldrise to 10% to 12% if the sulfate and organic componentsincreased significantly.[66] Comparisons of Figures 19 to 21 with Figures 11 to
13 for sulfur show that the total hydrogen follows the totalsulfur content having similar seasonal variations. Also high
hydrogen tended to correlate with high sulfur. For example,the extreme events plotted as dots on 4 July 2001 and1 February 2002 at Hong Kong, 3 June 2001 and 31 March2002 at Cheju Island and 24 October 2001 and 15 May2002 at Sado Island were all high sulfur and high hydrogendays at each of the sites.[67] This hydrogen-sulfur correlation is further demon-
strated in Figure 22, where the total hydrogen is plottedagainst the total sulfur mass for the Hong Kong site for thestudy period to June 2002. The solid line, [S] = 4*[H], is theline expected for fully neutralized ammonium sulfate. Pointsto the left of this line (reduced hydrogen) represent partiallyneutralized sulfate ions or acidic aerosols [Malm et al., 1994;Lee et al., 2001] and points to the right represent the higherhydrogen concentration events not associated with sulfur,that is hydrogen in organic matter. Total hydrogen concen-trations below 1 mg/m3 at the Hong Kong site tended to beassociated with fully neutralized ammonium sulfate andrelatively small organic matter content, whereas for totalhydrogen above 1.5 mg/m3, significantly more organic matterwas present.[68] Figure 23 is a box and whisker plot for estimated fine
organic matter at the three sites. The median organic mattercontents were 2.1 mg/m3, 1.2 mg/m3, and 0.65 mg/m3 at theHong Kong, Cheju Island, and Sado sites, respectively forthe study period. The seasonal trends for estimated organicmatter were the same as for total hydrogen.[69] There were 8 extreme organic matter events above
20 mg/m3 at Hong Kong, 12 extreme events above 10 mg/m3
Figure 19. Monthly averaged box and whisker plot for thefine hydrogen measurements at the Hong Kong site duringthe study period.
Figure 20. Monthly averaged box and whisker plot for thefine hydrogen measurements at the Cheju Island site duringthe study period.
Figure 21. Monthly averaged box and whisker plot for thefine hydrogen measurements at the Sado Island site duringthe study period.
Table 10. Mean, Median, Standard Deviation, and Maximum
PM2.5 Hydrogen Concentrations and Percentages at Three ACE-
Asia Sampling Sites During the Study Period
PM2.5 Hong Kong Cheju Island Sado Island
Hydrogen, mg/m3
Mean, mg/m3 1.3 0.73 0.41Median, mg/m3 0.96 0.56 0.29Standard deviation, mg/m3 1 0.61 0.4Maximum, mg/m3 5.7 2.9 2.6
Hydrogen, %Mean, % 3.8 3.7 3.2Median, % 3.6 3.4 3Standard deviation, % 1.5 1.6 1.2Maximum, % 9.6 12 10
D19S12 COHEN ET AL.: MULTIELEMENTAL ANALYSIS OF AEROSOLS
12 of 18
D19S12

at Cheju Island and 10 extreme events above 4 mg/m3 atSado. 50% of these events at Hong Kong and Cheju Islandand 70% of these events at Sado Island had both high sulfurand high organic matter concentrations at the same time.Further comparison with extreme black carbon eventsshowed that 25% of the extreme organic matter events atHong Kong, and 30% at Cheju and Sado Islands had highorganic matter, high black carbon and high sulfur all withindays of each other. That is, these three sites were impactedby similar sulfate, black carbon and organic sources on thesame days. Strong evidence for significant PM2.5 pollutiontransported from mainland China affecting all three sitesduring the study period [Arndt et al., 1998; Mori et al.,2002; Kim et al., 2003].
9. PM2.5 Composition
[70] The IBA analysis techniques provided informationon over 20 different chemical species in the PM2.5 massfraction. Table 11 provides the mean, standard deviation(SD) and minimum and maximum concentrations for spe-cies measured and estimated at the Hong Kong, Cheju Islandand Sado Island sites for all data collected over the studyperiod to 30 June 2002. Generally elemental and chemicalspecies quoted in previous tables have not been included.Except for the mass and the percentage reconstructed mass(%RCM) all values are quoted in (ng/m3) rounded to nomore than three significant digits. The large standard devia-tions for many values reflect the non-Gaussian nature of thedistribution and the large seasonal variations in the data andnot the measurement errors. Measurement errors were typ-ically of the order of ±7% to ±15% for most speciesdetermined and have been fully quantified elsewhere [Cohenet al., 2002b].[71] Aluminum and silicon were highly correlated (see
Table 5), as expected, through their association with soil.The aluminum-silicon ratio for each site was between 0.30and 0.34, having an average value of (0.32 ± 0.04) consistentwith the Mason and Moore [1982] value of 0.29 for crustalmaterial.
[72] The average sea salt component of sulfur was lessthan 2% for all three sites, demonstrating that most of thesulfur and hence the sulfates in the PM2.5 fraction wereanthropogenic in nature. This is consistent with the findingsof Kim et al. [1998] and Lee et al. [2001] who measuredsimilar contributions of around 1% to 3% for selectedmonths during 1996 and 1997 at the Cheju Island site.[73] For fine potassium the average sea salt component
was less than 7% of the total potassium mass for all threesites, the difference being made up mainly from potassiumassociated with windblown soil and smoke from biomassburning. The nonsoil, non-sea salt potassium was an excel-lent indicator of smoke from biomass burning [Malm et al.,1994; Cohen et al., 1996]. For all sites the average finepotassium associated with smoke was more than the sum ofthe sea salt and soil components together. The Hong Kongsite was more affected by smoke from biomass burning thaneither the Cheju Island or Sado Island sites.[74] For fine calcium the bulk of the non-sea salt com-
ponent was associated with windblown soil as discussedabove. The non-sea salt calcium (nss-Ca) was between 77%and 85% of the total calcium for all three sites.[75] Cobalt was measured by particle induced X-ray
emission (PIXE) techniques [Cohen, 1993] as having anaverage value of 1 to 2 ng/m3 this was generally above theminimum detectable limit. However, there maybe signifi-cant adjacent inter-element interferences associated with themeasurement of these small amounts of cobalt in thepresence of larger amounts of iron using this technique.Hence this estimate of the cobalt concentration should beconsidered as an absolute upper estimate only.[76] Chrome, copper, zinc and lead were associated with
automobiles and industry (see PCA results of Table 4) andhad the highest median values and extreme events at theHong Kong site. Nickel and vanadium were also highest atthe Hong Kong site and were probably associated withdiesel and heavy oil burning for power generation andshipping [Cheng et al., 2000; Wang et al., 2003].[77] The BC0(nosoil) component was the black carbon
measurement without the 11% soil correction [Malm et al.,1994]. This correction to the black carbon estimatesamounted to (10 ± 23)%, (13 ± 13)% and (11 ± 14)%reduction for the Hong Kong, Cheju and Sado Island sites,respectively.
Figure 22. Correlation plot for PM2.5 total hydrogenversus total sulfur at the Hong Kong site for all data from1 January 2001 to 30 June 2002. The solid line representsthe fully neutralized ammonium sulfate line.
Figure 23. Box and whisker plot for the estimate PM2.5
organic matter at the three study sites for the period to30 June 2002.
D19S12 COHEN ET AL.: MULTIELEMENTAL ANALYSIS OF AEROSOLS
13 of 18
D19S12

[78] Organic carbon was estimated by assuming theaverage organic matter composition was 71% carbon [Malmet al., 1994] as discussed above and was not included in thepercentage reconstructed mass (%RCM) as it was alreadyincluded through the total organic matter estimates.[79] The total trace element concentration was define as
the sum of the concentrations of P, V, Cr, Co, Ni, Cu, Zn, Brand Pb and the percentage trace element masses weregenerally much less than 1% of the total fine mass. Theextensive range of trace elements measured on filters will bemost useful in distinguishing source fingerprints and forperforming source apportionment studies using data fromthese sites. This work is planned for a future publication.[80] The total PM2.5 mass was largest at the Hong Kong
site as expected as this was significantly impacted byanthropogenic pollution from local sources in suburbanHong Kong as well as longer-range transport from mainlandChina to the north [Wang et al., 2001, 2003]. Kim et al.[1998] also observed an average PM2.5 mass for the periodfrom July to August 1994 of (21 ± 4) mg/m3, similar to our18-month average to 30 June 2002 of (21 ± 16) mg/m3 atCheju Island.[81] The%RCM was the percentage reconstructed mass
calculated by following the procedure of Malm et al. [1994]and adding together all the measured components andcomparing this sum with the measured gravimetric mass.The missing percentage mass was mainly due to water vaporand nitrates which were not measured and are generally notwell held on Teflon filters. The high%RCM estimates reflectthe relatively good ‘‘mass closure’’ obtained in this studyusing Teflon filters.
[82] Although the absolute PM2.5 masses were signifi-cantly different at the three sites the percentage composi-tions for the major components were remarkably similar.All three sites, being coastal sites, had similar percentagesalinity components. The percentage soil components atCheju and Sado Islands tended to be higher than at HongKong. The average PM2.5 mass loadings at Cheju and SadoIslands were affected more by soil from mainland Chinathan at the Hong Kong site over the study period. Thefraction of fine organic matter measured at Sado Island wasconsistently lower than either Hong Kong or Cheju Islandsites.[83] Loss of chlorine was observed at each of the three
sites being (88 ± 22)%, (92 ± 15)% and (72 ± 32)% at theHong Kong, Cheju Island and Sado Island sites, respec-tively. The percentage chlorine loss was calculated assum-ing all the sodium was associated with sea salt (NaCl) andcomparing the measured total chlorine with the expectedsea salt chlorine from the sodium concentrations. Chenget al. [2000] also observed 15% to 20% chlorine losses inTSP and PM10 size fractions at the Hong Kong site. Thiswas much lower than that observed here for the PM2.5
size fraction. This difference may be expected for thefiner size fractions containing a relatively higher sulfatecomponent.
10. Coarse Component
[84] The GENT stacked filter sampler provided a PM2.5
mass estimate and a coarse mass (2.5 mm to 10 mm) estimate.The PM2.5 mass estimates from the ASP and GENTsamplers
Table 11. PM2.5 Means and Standard Deviations for All Measured and Estimated Species Over the Study Period From 1 January to
30 June 2002 at Each of the ACE-Asia Sites
Average PM2.5
Value, ng/m3
Hong Kong Cheju Island Sado Island
Mean ± SD Min to Max Mean ± SD Min to Max Mean ± SD Min to Max
Na 935 ± 828 0–3970 438 ± 439 0–2360 309 ± 456 0–2330Al 170 ± 217 0–1200 160 ± 292 0–1830 113 ± 293 0–2270Si 571 ± 657 11–3600 511 ± 805 20–4640 333 ± 762 11–5670P 50 ± 46 0–296 22 ± 20 0–101 18 ± 15 0–67S total 3210 ± 2040 336–10,100 1800 ± 1150 343–6400 1110 ± 740 124–3900S non-sea salt 3140 ± 2000 197–9890 1760 ± 1150 290–6350 1090 ± 738 124–3870Cl 182 ± 342 0–2250 59 ± 171 0–1390 173 ± 314 0–1730K total 539 ± 573 10–2730 300 ± 349 18–1910 153 ± 185 7–1090K non-sea salt 505 ± 558 0–2640 284 ± 346 0–1913 142 ± 180 5–1070K nonsoil 427 ± 487 8–2470 196 ± 269 0–1820 89 ± 97 0–465Ca 157 ± 186 12–1450 114 ± 203 3–1630 71 ± 122 2–840Ca non–sea salt 121 ± 173 0–1370 97 ± 197 0–1540 60 ± 117 0–817Ti 23 ± 23 0–114 18 ± 26 0–154 11 ± 25 0–190V 9 ± 9 0–45 2 ± 5 0–39 1.2 ± 5 0–43Cr 4 ± 6 0–38 3 ± 4 0–23 1.1 ± 2 0–12Mn 11 ± 13 0–68 8 ± 10 0–75 5 ± 8 0–58Fe 187 ± 215 0–1270 173 ± 282 8–1870 106 ± 279 2–2250Co 2 ± 4 0–34 2 ± 4 0–32 1.1 ± 4 0–33Ni 4 ± 4 0–32 1.2 ± 1 0–7 0.8 ± 2 0–18Cu 6 ± 8 0–58 4 ± 8 0–67 3 ± 10 0–89Zn 116 ± 125 0–577 32 ± 35 1–215 16 ± 18 0–83Br 12 ± 12 0–70 6 ± 4 0–21 5 ± 3 0–15Pb 70 ± 78 0–386 24 ± 27 0–148 10 ± 11 0–62BC0 (nosoil) 2590 ± 1850 363–10,430 1670 ± 1330 174–7000 1028 ± 630 273–3220Organic carbon 3770 ± 5120 0–27,890 2260 ± 3090 0–13,660 1490 ± 2,360 0–15,130Ammonium sulfate 13,260 ± 8400 1390–41,660 7430 ± 4730 1410–26,400 4590 ± 3,050 510–16,080Organics matter 5190 ± 7310 0–39,290 3090 ± 4430 0–19,240 1460 ± 3,090 0–21,300Salinity 3040 ± 2690 0–12,910 1420 ± 1430 0–7670 1530 ± 1,220 0–7570Traces 273 ± 256 1330–1320 95 ± 83 11–470 55 ± 50 8–248Mass, mg/m3 32.7 ± 24 3–109 20.4 ± 16 4–80 12.6 ± 11 1–78Percent RCM 83 ± 15 81 ± 16 75 ± 12
D19S12 COHEN ET AL.: MULTIELEMENTAL ANALYSIS OF AEROSOLS
14 of 18
D19S12

have been favorably compared elsewhere [Hopke et al.,1997] and will not be repeated here. Figures 24, 25, and26 are box and whisker plots for the average monthlycoarse mass for the Hong Kong, Cheju Island and SadoIsland sites, respectively. Median coarse mass loadings of33 mg/m3, 14 mg/m3 and 11 mg/m3, were measured at HongKong, Cheju and Sado Island sites, respectively during thestudy period. Comparison of Figure 24 and Figure 2 forHong Kong site shows that coarse and PM2.5 showedsimilar seasonal trends, being higher in the October toMarch period than in the July to September period. Similarpatterns were also evident at the Cheju Island and SadoIsland sites.[85] Unlike the fine fraction, the coarse size fraction was
dominated by two noncombustion source contributions,namely wind blown soil and sea spray. Figure 27 is a boxand whisker plot of the percentage soil in the coarse sizefraction at the three sites. On average, soil accounted forabout (13 ± 8)% at the Hong Kong site, (23 ± 13)% at theCheju Island site, and (15 ± 9)% at the Sado site of the totalcoarse mass fraction. For some extreme events in springcoarse soil accounted for more than 25% at Hong Kong,40% at Cheju Island and 25% at Sado Island of the totalmeasured mass.[86] All three ACE-Asia sites were on the coast and hence
strongly influenced by sea spray. Figure 28 is a box andwhisker plot for the percentage salinity in the coarse
fraction. Salinity was estimated by assuming all sodiumoriginated from sea spray as described earlier. For thesecoastal sites this was not an unreasonable assumption as theonly other possible significant source of coarse sodium wasfrom windblown soil. Mason and Moore [1982] give the(Na/Si) = 0.10 for crustal material, this was significantlyless than our median measured coarse value for all ACE-Asia sites of (Na/Si) = 6.1. Demonstrating a large sodiumsource not associated with soil. Furthermore PCA techni-ques showed that coarse sodium was strongly correlatedwith coarse chlorine at all three sites (as indeed was the finemass fraction see Table 4) and plots of sodium versussilicon for the coarse mass fraction showed little or nocorrelation demonstrating that sea spray at our sites was thedominant sodium source for the coarse mass fraction.[87] The median salinity was 68% at the Hong Kong site,
47% at the Cheju Island site and 65% at the Sado site of thetotal coarse mass fraction. Addition of the fine and coarsemeasured masses gave the PM10 size fraction for eachsampling day. Table 12 is a summary of the PM10 massfraction measurements for the three ACE-Asia sites for thestudy period to 30 June 2002.[88] A comparison of the PM2.5 mass data from Table 2
with the data of Table 12 shows that PM2.5 was a significantpercentage of the PM10 size fraction. Figure 29 is a plot ofthe PM10 mass against the PM2.5 mass for the data collectedat all three sites. PM10 and PM2.5 mass fractions were wellcorrelated, with the ratio (PM10/PM2.5) = (2.1 ± 0.4),
Figure 24. Box and whisker plot for the average monthlycoarse mass fraction for the Hong Kong site during thestudy period to 30 June 2002.
Figure 25. Box and whisker plot for the average monthlycoarse mass fraction for the Cheju Island site during thestudy period to 30 June 2002.
Figure 26. Box and whisker plot for the average monthlycoarse mass fraction for the Sado Island site during thestudy period to 30 June 2002.
Figure 27. Box and whisker plot for percentage coarsesoil at Hong Kong, Cheju Island, and Sado Island during thestudy period to 30 June 2002.
D19S12 COHEN ET AL.: MULTIELEMENTAL ANALYSIS OF AEROSOLS
15 of 18
D19S12

demonstrating that on average, across all sites, the PM2.5
fraction represented about half of the total PM10 mass.[89] Points to the left of the least squares fitted line
(reduced PM2.5) represent events having a higher percent-age of coarse particles, such as sea salt and soil. Whilepoints to the right represent higher fractions of PM2.5
particles originating from combustion sources.[90] Ion Beam Analysis (IBA) was performed on all
filters obtained using GENT stacked filter units as well.This enabled (PM10/PM2.5) ratios to be measured for manyof the elements obtained in this study. Figure 30 shows sucha plot sorted with increasing ratios from left to right.[91] Elements associated with combustion sources such
as black carbon, sulfur, lead, zinc etc clustered near unity,demonstrating the low coarse and high fine fraction.Whereas elements associated with sources having highcoarse and low fine components such as soil and sea saltcluster to the right well above unity. The element chlorinehad the highest measured (PM10/PM2.5) ratio, again con-firming that this element was associated with coarser seaspray sources rather than fine combustion sources such asmotor vehicles or biomass burning.
11. Summary
[92] This study provides, for the first time, total mass aswell as chemical composition of fine (PM2.5) particles,sampled on the same days, at three key ACE Asia studysites spanning an eighteen month period. The sites were atHong Kong, Cheju Island off South Korea and Sado Islandoff the west coast of Japan. Fine particles were measuredtwice weekly at each of these three sites and more oftenduring extreme pollution events related to particulate mattertransported from mainland China. Median 24 hour PM2.5
mass loadings of 29 mg/m3, 16 mg/m3 and 9.1 mg/m3 were
measured at Hong Kong, Cheju and Sado Islands during thestudy period. The corresponding maximum PM2.5 values forthe three sites were 109 mg/m3, 81 mg/m3 and 78 mg/m3,respectively.[93] Ion beam analysis, together with laser absorption
techniques, was used to quantify over twenty differentchemical species for the PM2.5 size fraction. These included,total hydrogen, black carbon, F, Na, Al, Si, P, S, Cl, K, Ca,Ti, V, Cr, Mn, Fe, Co, Ni, Cu, Zn, Br, and Pb with minimumdetection limits close to or below 1 ng/m3. The key speciesof interest in the ACE Asia project were windblown soils,ammonium sulfate and black carbon emissions all of whichwere directly measured or estimated from the above suite ofelements.[94] Wind blown soil at the three sampled sites was
typically 7% to 9% of the PM2.5 total mass and wasrepresented by the sum of Al (6.9%), Si(22%), K(4.1%),Ca(4.6%), Ti(0.74%), Mn(0.30%) and Fe(6.8%) with oxy-gen representing the remaining fraction at 55%. All threesites were impacted by significant fine soil events during thestudy period with PM2.5 soil concentrations up to 26 mg/m3
or 35% of the fine mass. These high soil days were most
Figure 28. Box and whisker plot for percentage coarsesalinity at Hong Kong, Cheju Island, and Sado Island duringthe study period to 30 June 2002.
Figure 29. Correlation plot of PM10 versus PM2.5 massfractions for all ACE-Asia sites for the 18-month studyperiod.
Figure 30. The [PM10/PM2.5] ratio versus elementmeasured for all sites for the 18-month study period.
Table 12. Summary of the PM10 Mass Measurements for Hong
Kong, Cheju Island, and Sado Island for the Study Period to
30 June 2002
PM10 Mass Hong Kong Cheju Island Sado Island
Mean, mg/m3 64 39 28Median, mg/m3 62 29 21Standard deviation, mg/m3 32 30 32Maximum, mg/m3 152 176 276
D19S12 COHEN ET AL.: MULTIELEMENTAL ANALYSIS OF AEROSOLS
16 of 18
D19S12

likely to occur in spring and were due to soil transportedthousands of kilometers from the Chinese mainland [Zhanget al., 1997; Mori et al., 2002; Kim et al., 2003].[95] Sulfate was predominantly anthropogenic (98%) and
estimated from the measured sulfur concentrations withmedian values of 8.7 mg/m3, 4.8 mg/m3 and 2.9 mg/m3 forthe Hong Kong, Cheju Island and Sado Island sites, respec-tively during the study. There were significant seasonalvariations, particularly at the Hong Kong site, concentrationsbeing higher in the winter months. The correspondingmaximum PM2.5 sulfate values for the three sites were30 mg/m3, 19 mg/m3 and 12 mg/m3, respectively. The averagesulfate composition was fairly consistent across all three sitesranging from 30% to 32% of the total fine mass.[96] Black carbon was estimated using [He/Ne] laser
absorption techniques and assuming a mass absorptioncoefficient of 7 m2/g for laser light. There were strongseasonal variations being several times larger in the winterthan the summer months with median values or 1.8 mg/m3,1.1 mg/m3 and 0.77 mg/m3 for the Hong Kong, Cheju Islandand Sado Island sites, respectively during the study period.This represented a fairly consistent 8% to 9% of the totalfine mass across all three sites. The average PM2.5 percent-age composition by weight, across the three sites wasestimated to be around (8.4 ± 4)% black carbon, (7.7 ±7)% soil, (43 ± 14)% ammonium sulfate, (11 ± 16)%organic matter, (10 ± 12)% salinity and (0.6 ± 0.3)% traceelements. The remainder was mainly composed of watervapor and nitrates not measured in this experiment.[97] The PM10 size fraction was approximately equally
split between the fine and coarse size fractions with theaverage [PM10/PM2.5] mass ratio being (2.1 ± 0.4) across allsites for the study period. The coarse fraction, across allthree sites, was dominated by sea salts (59 ± 25)% andwindblown soil (17 ± 11)% as expected.[98] This quantitative data on chemical and physical
composition of fine particulates over an 18-month periodcollected on the same days at three different Asian sitesfulfils one of the goals of the ACE Asia project andprovides useful unique input for aerosol chemical charac-terization and climatic modeling studies for the east Asiaregion.
[99] Acknowledgments. We would like to acknowledge the help oflocal staff at each of the sampling site locations for regular filter changesthroughout this 18-month study. We are also indebted to all the 3 MV Vande Graaff accelerator staff at ANSTO for assistance with all the IBAmeasurements. This research was supported by the ANSTO, Hong KongPolytechnic University, the Research Grants Council of the Hong KongSpecial Administrative Region (project 5063/01E) and the NRL project ofKorea Ministry of Science and Technology (project M1-0001-00-0018).
ReferencesArndt, R. L., G. R. Carmichael, and J. M. Roorda (1998), Seasonal source-receptor relationships in Asia, Atmos, Environ., 32, 1397–1406.
Bates, T. S., B. J. Huebert, J. L. Gras, B. Griffiths, and P. A. Durkee (1998),The International Global Atmospheric Chemistry (IGAC) Project’s FirstAerosol Characterization Experiment (ACE 1): Overview, J. Geophys.Res., 103, 16,297–16,318.
Benkovitz, C. M., T. Scholtz, L. Pacyna, L. Tarrson, J. Dignon, E. Voldner,P. A. Spiro, and T. E. Graedel (1996), Global gridded inventories ofanthrogenic emission of sulfur and nitrogen, J. Geophys. Res., 101,29,239–29,253.
Carmichael, G. R., Y. Zhang, L. Chen, M. Sun, and H. Ueda (1996),Seasonal variations of aerosol composition at Cheju Island, Korea,Atmos. Environ., 13, 2407–2416.
Chameides, W. L., et al. (1999), Case study of the effects of atmosphericaerosols and regional haze on agriculture: An opportunity to enhancecrop yields in China through emission controls, Proc. Natl. Acad. Sci.USA, 96, 13,626–13,633.
Chang, Y. S., R. L. Arndt, and G. R. Carmichael (1996), Mineral bas-cationdeposition in Asia, Atmos. Environ., 13, 2417–2427.
Cheng, Z. L., K. S. Lam, L. Y. Chan, T. Wang, and K. K. Cheng (2000),Chemical characteristics of aerosols at coastal station in Hong Kong.I. Seasonal variation of major ions, halogens and mineral dusts between1995 and 1996, Atmos. Environ., 34, 2771–2783.
China National Environmental Monitoring Centre (1994), Atlas of SoilEnvironmental Background Value in the People’s Republic of China,China Environ. Sci. Press, Beijing.
Cohen, D. D. (1993), Applications of simultaneous IBA techniques toaerosol analysis, Nucl. Instrum. Methods, B79, 385–388.
Cohen, D. D. (1998), Characterization of atmospheric fine particle usingIBA techniques, Nucl. Instrum. Methods, 136B, 14–22.
Cohen, D. D., G. M. Bailey, and R. Kondepudi (1996), Elemental analysisby PIXE and other IBA techniques and their application to source finger-printing of atmospheric fine particle pollution, Nucl. Instrum. Methods,B109, 218–226.
Cohen, D. D., D. Garton, and E. Stelcer (2000a), Multi-elemental methodsfor fine particle source apportionment at global baseline station at CapeGrim, Tasmania, Nucl. Instrum. Methods, 161, 775–779.
Cohen, D. D., G. Taha, E. Stelcer, D. Garton, and G. Box (2000b), Themeasurement and sources of fine particle elemental carbon at several keysites in NSW over the past eight years, in Proceedings of 15th Interna-tional Clean Air and Environment Conference, pp. 485–490, Clean AirSoc. of Austr. and New Zealand, Mitcham, Vict., Australia.
Cohen, D. D., E. Stelcer, and D. Garton (2002a), Ion beam methods todetermine trace heavy metals concentrations and sources in urban air-sheds, Nucl. Instrum. Methods, B190, 466–470.
Cohen, D. D., R. Siegele, O. Ivo, and E. Stelcer (2002b), Long-term accu-racy and precision of PIXE and PIGE measurements for thin and thicksample analyses, Nucl. Instrum. Methods, B189, 81–85.
Cohen, D. D., et al. (2002c), Characterization of PM2. 5 and PM10 fineparticle pollution in several Asian regions, in Proceedings of 16th Inter-national Clean Air and Environment Conference, pp. 153–158, CleanAir Soc. of Austr. and New Zealand, Mitcham, Vict., Australia.
Fuller, K. A., W. Malm, and S. M. Kriedenweis (1999), Effects of mixingon extinction by carbonaceous particles, J. Geophys. Res., 104, 15,941–15,954.
Hien, P. D., V. Bac, H. C. Tham, and L. D. Vinh (2002), PM2. 5 and PM2.5–10 in southeast Asia monsoon conditions: A case study, Hanoi, Viet-nam, Atmos. Environ., 36, 3434–3484.
Holmes, J., and W. Zoller (1996), The elemental signature of transportedAsia dust at Mauna Loa observatory, Tellus, Ser. B, 48, 83–92.
Hopke, P. K., S. Biegalski, S. Landsberger, W. Maenhaut, P. Artaxo, andD. Cohen (1997), Characterization of the GENT PM10 sampler, AerosolSci. Technol., 27, 726–735.
Horvath, H. (1993), Atmospheric light absorption: A review, Atmos.Environ., Part A, 27, 293–317.
Horvath, H. (1997), Experimental calibration for aerosol light absorptionmeasurements using the integrating plate method: Summary of the data,Aerosol Sci., 28, 1149–1161.
Huebert, B. J., T. Bates, P. B. Russell, G. Shi, Y. J. Kim, K. Kawamura,G. Carmichael, and T. Nakajima (2003), An overview of ACE-Asia:Strategies for quantifying the relationships between Asian aerosols andtheir climatic impacts, J. Geophys. Res., 108(D23), 8633, doi:10.1029/2003JD003550.
IPCC (1996), Climate Change: The Science of Climate Change, edited byJ. T. Houghton et al., Cambridge Univ. Press, New York.
IPCC (2001), The Third Assessment Report of Working Group I of the Inter-governmental Panel on Climate Change: Technical Summary, edited byD. L. Albritton and L. G. Meira Filho, Cambridge Univ. Press, New York.
Jaffe, D., et al. (1999), Transport of Asian air pollution to North America,Geophys. Res. Lett., 26, 711–714.
Kim, Y. P., J. H. Lee, N. J. Baik, J. Y. Kim, S. G. Shim, and C. H. Kang(1998), Summertime characteristics of aerosol composition at ChejuIsland, Korea, Atmos. Environ., 32, 3905–3915.
Kim, K.-H., G.-H. Choi, C.-H. Kang, J.-H. Lee, J. Kim, Y.-H. Youn, andS.-R. Lee (2003), The chemical composition of fine and coarse particlesin relation with the Asian dust events, Atmos. Environ., 37, 753–765.
Lam, K. S., T. J. Wang, L. Y. Chan, T. Wang, and J. Harris (2001), Flowpatterns influencing the seasonal behaviours of surface ozone and carbonmonoxide at a coastal site near Hong Kong, Atmos. Environ., 35, 3121–3135.
Lee, J. H., Y. P. Kim, K. C. Moon, H. K. Kim, and C. B. Lee (2001), Fineparticle measurements at two background sites in Korea between 1996and 1997, Atmos. Environ., 35, 635–643.
D19S12 COHEN ET AL.: MULTIELEMENTAL ANALYSIS OF AEROSOLS
17 of 18
D19S12

Maenhaut, W., F. Francois, and J. Cafmeyer (1994), The GENT stackedfilter unit sampler for collection of atmospheric aerosols in two sizefractions, Rep. IAEA NAHRES-19, 249–263 pp., Int. Atom. EnergyAgency, Vienna.
Maenhaut, W., R. Salomonovic, J. Ptasinski, and G. W. Grime (1997),Nuclear microprobe analysis of atmospheric aerosol samples: Compari-son with bulk measurements and analyses of individual particles, Nucl.Instrum. Methods, B130, 576–581.
Malm, W. C., J. F. Sisler, D. Huffman, R. A. Eldred, and T. A. Cahill(1994), Spatial and seasonal trends in particle concentration and opticalextinction in the United States, J. Geophys. Res., 99, 1347–1370.
Mason, B., and C. B. Moore (1982), Principle of Geochemistry, 4th ed.,John Wiley, Hoboken, N. J.
Mori, I., M. Nishikawa, H. Quan, and M. Morita (2002), Estimation of theconcentration and chemical composition of Kosa aerosols at their origin,Atmos. Environ., 36, 4569–4575.
Petzold, A., and R. Niessner (1995), Method comparison study on soot-selective techniques, Mikrochim. Acta, 117, 215–237.
Uematsu, M., R. A. Duce, and J. M. Prospero (1985), Deposition of atmo-spheric mineral particles, J. Atmos. Chem., 3, 123–138.
Wang, T., K. S. Lam, L. Y. Chan, M. A. Carroll, and A. S. Y. Lee (1997),Trace gas measurements in coastal Hong Kong during the PEM-West B,J. Geophys. Res., 102, 28,575–28,588.
Wang, T., T. F. Cheung, K. S. Lam, G. L. Kok, and J. M. Harris (2001), Thecharacteristics of O3 and related compounds in the boundary later ofthe south China coast: Temporal and vertical variations during autumnseason, Atmos. Environ., 35, 2735–2746.
Wang, T., A. J. Ding, D. R. Blake, W. Zahorowski, C. N. Poon, and Y. S. Li(2003), Chemical characterization of the boundary layer outflow of airpollution to Hong Kong during February–April 2001, J. Geophys. Res.,108(D20), 8787, doi:10.1029/2002JD003272.
Weast, R. C., and M. J. Astle (1982), CRC Handbook of Chemistry andPhysics, 63rd ed., CRC Press, Boca Raton, Fla.
Xiao, H., G. R. Carmichael, and J. Durchenwald (1997), Long-range trans-port of SOx and dust in east Asia during the PEM B experiment,J. Geophys. Res., 102, 28,589–28,612.
Zhang, D. W., R. Arimoto, and Z. S. An (1997), Dust emission fromChinese desert sources linked to variations in atmospheric circulation,J. Geophys. Res., 102, 28,041–28,047.
�����������������������B. C. Choi, J. Kim, M. Y. Ko, S. N. Oh, and H.-J. Shin, Meteorological
Research Institute, KMA460-18, Sindaebang-dong, Dongjak-gu, Seoul156-720, Korea. ([email protected]; [email protected])D. D. Cohen, D. Garton, O. Hawas, and E. Stelcer, Australian Nuclear
Science and Technology Organisation, PMB1,Menai, NSW 2234, Australia.([email protected]; [email protected]; [email protected]; [email protected])S. Poon and T. Wang, Department of Civil and Structural Engineering,
Hong Kong Polytechnical University, Kowloon, Hong Kong, China.([email protected]; [email protected])M. Uematsu, Centre for International Cooperation, Ocean Research
Institute, University of Tokyo, 1-15-1 Minamidai, Nakano-ku, Tokyo 164-8639, Japan. ([email protected])
D19S12 COHEN ET AL.: MULTIELEMENTAL ANALYSIS OF AEROSOLS
18 of 18
D19S12


