Embed Size (px)
Citation preview

Seediscussions,stats,andauthorprofilesforthispublicationat:https://www.researchgate.net/publication/40906687
MultistageGenomewideAssociationStudyIdentifiesaLocusat1q41AssociatedwithRateofHIV‐1DiseaseProgressiontoClinicalAIDS
ARTICLEinTHEJOURNALOFINFECTIOUSDISEASES·FEBRUARY2010
ImpactFactor:6·DOI:10.1086/649842·Source:PubMed
CITATIONS
45
READS
41
20AUTHORS,INCLUDING:
JoshuaHerbeck
UniversityofWashingtonSeattle
37PUBLICATIONS951CITATIONS
SEEPROFILE
GeorgeNelson
FrederickNationalLaboratoryforCancerRes…
73PUBLICATIONS6,257CITATIONS
SEEPROFILE
BaileyDouglasKessing
LeidosBiomedicalResearch,Inc.
34PUBLICATIONS2,370CITATIONS
SEEPROFILE
JeremyJamesMartinson
UniversityofPittsburgh
59PUBLICATIONS3,002CITATIONS
SEEPROFILE
Availablefrom:BaileyDouglasKessing
Retrievedon:04February2016

Multistage Genomewide Association Study Identifies a Locus at1q41 Associated with Rate of HIV-1 Disease Progression toClinical AIDS
Joshua T. Herbeck1, Geoffrey S. Gottlieb2, Cheryl A. Winkler3, George W. Nelson3, PingAn3, Brandon S. Maust1, Kim G. Wong1, Jennifer L. Troyer3, James J. Goedert5, Bailey D.Kessing3, Roger Detels8, Steven M. Wolinsky10, Jeremy Martinson11, Susan Buchbinder9,Gregory D. Kirk6, Lisa P. Jacobson6, Joseph B. Margolick7, Richard A. Kaslow12, StephenJ. O’Brien4, and James I. Mullins1,2
1 Department of Microbiology, University of Washington School of Medicine, Seattle 2 Departmentof Medicine, University of Washington School of Medicine, Seattle 3 Laboratory of GenomicDiversity Basic Research Program, SAIC-Frederick, Frederick 4 Laboratory of Genomic Diversity,National Cancer Institute–Frederick, Frederick 5 Infections and Immunoepidemiology Branch,Division of Cancer Epidemiology and Genetics, National Cancer Institute, Rockville 6 Departmentof Epidemiology, Johns Hopkins Bloomberg School of Public Health, Baltimore, Maryland 7Department of Molecular Microbiology and Immunology, Johns Hopkins Bloomberg School ofPublic Health, Baltimore, Maryland 8 Department of Epidemiology, School of Public Health,University of California, Los Angeles 9 San Francisco Department of Public Health, HIV ResearchSection, San Francisco 10 Division of Infectious Diseases, Feinberg School of Medicine,Northwestern University, Chicago, Illinois 11 Department of Infectious Diseases and Microbiology,University of Pittsburgh, Pittsburgh, Pennsylvania 12 Department of Epidemiology, University ofAlabama at Birmingham, Birmingham
AbstractBackground—A mean of 9–10 years of human immunodeficiency virus type 1 (HIV-1)infection elapse before clinical AIDS develops in untreated persons, but this rate of diseaseprogression varies substantially among individuals. To investigate host genetic determinants of therate of progression to clinical AIDS, we performed a multistage genomewide association study.
Methods—The discovery stage comprised 156 individuals from the Multicenter AIDS CohortStudy, enriched with rapid and long-term nonprogressors to increase statistical power. This wasfollowed by replication tests of putatively associated genotypes in an independent population of590 HIV-1–infected seroconverters.
Results—Significant associations with delayed AIDS progression were observed in a haplotypelocated at 1q41, 36 kb upstream of PROX1 on chromosome 1 (relative hazard ratio, 0.69; Fisher’scombined P = 6.23 × 10⁻⁷). This association was replicated further in an analysis stratified bytransmission mode, with the effect consistent in sexual or mucosal and parenteral transmission(relative hazard ratios, 0.72 and 0.63, respectively; combined P = 1.63 × 10⁻⁶).
Reprints or correspondence: Dr Herbeck, Dept of Microbiology, University of Washington School of Medicine, Seattle, WA 98195–8070 ([email protected]).Presented in part: 16th Conference on Retroviruses and Opportunistic Infections, Montreal, Quebec, February 2009 (poster 544).Potential conflicts of interest: none reported.
NIH Public AccessAuthor ManuscriptJ Infect Dis. Author manuscript; available in PMC 2010 August 26.
Published in final edited form as:J Infect Dis. 2010 February 15; 201(4): 618–626. doi:10.1086/649842.
NIH
-PA Author Manuscript
NIH
-PA Author Manuscript
NIH
-PA Author Manuscript

Conclusions—This study identified and replicated a locus upstream of PROX1 that is associatedwith delayed progression to clinical AIDS. PROX1 is a negative regulator of interferon-γexpression in T cells and also mitigates the advancement of vascular neoplasms, such as Kaposisarcoma, a common AIDS-defining malignancy. This study adds to the cumulative polygenic hostcomponent that effectively regulates the progression to clinical AIDS among HIV-1–infectedindividuals, raising prospects for potential new avenues for therapy and improvements in AIDSprognosis.
Polymorphisms in numerous human genes have been reported to confer differentialsusceptibility to human immunodeficiency virus (HIV) infection and rates of progression toAIDS [1,2]. Genes encoding the major HIV-1 coreceptor chemokine (C-C motif) receptor 5(CCR5), its ligands, and HLA class I genes are well documented and consistently replicatedAIDS restriction genes. Homozygosity for the CCR5 Δ32 allele provides near absoluteprotection against HIV-1 infection, whereas Δ32 heterozygosity delays progression toclinical AIDS [3]. Certain HLA-B alleles are variously associated with increased ordecreased rates of progression [3]. For example, B★5701 is strongly and consistentlyassociated with slower disease progression [4,5] and elite viral control [6].
Recent genomewide association studies (GWAS) involving HIV-infected individuals thatuse Illumina genotyping platforms have confirmed the strong associations between variationin HLA genes and the surrogate markers of plasma viral load and CD4+ T cell count [7–9].However, the statistical noise introduced by a large number of tests generally require Pvalues ≤5 × 10⁻⁸ for genomewide significance; in GWAS, true-positive signals with Pvalues above this threshold cannot be distinguished from false-positive signals by purelystatistical methods. This was observed in the failure of early HIV-related GWAS to identifypreviously identified AIDS restriction genes, such as CCR5 Δ32 or RANTES (CCL5).However, the effects of CCR5 Δ32 on disease progression were confirmed in a meta-analysis [10]. Approaches using replication or meta-analysis of GWAS results can helpovercome these problems [11].
Although HIV-1 load is a robust prognostic marker for clinical disease progression, studiesshow that viral load explains <50% of the variation in time from primary infection to thedevelopment of clinical AIDS [12–14]. Therefore, it is important to assess the direct hostgenetic contribution to the actual clinical end point of HIV infection: AIDS or AIDS-relateddeath. To address the potential differences between the virologic and clinical end points, weused a 2-stage strategy to identify host common genetic polymorphisms associated withvariation among HIV-infected individuals in their rate of progression to clinical AIDS(Centers for Disease Control and Prevention [CDC] 1987 definition). First, we conducted aGWAS involving a population of HIV-1–infected men from the Multicenter AIDS CohortStudy (MACS) who were chosen to be enriched with participants representing the extremeends of phenotypic distribution rates of HIV-1 disease progression to clinical AIDS: rapidprogressors and long-term nonprogressors. A focus on extreme genotypes improves ourpower to detect differences between these readily discernible groups [15,16], as seenelsewhere with AIDS phenotypes [17,18]. Second, we selected the top-ranking single-nucleotide polymorphisms (SNPs) from the initial GWAS for replication tests in anindependent cohort of 590 HIV-1 seroconverters. Third, we stratified the replication cohortby transmission mode (sexual or parenteral) and tested for consistent effects across thesedistinct populations.
Herbeck et al. Page 2
J Infect Dis. Author manuscript; available in PMC 2010 August 26.
NIH
-PA Author Manuscript
NIH
-PA Author Manuscript
NIH
-PA Author Manuscript

SUBJECTS AND METHODSStage 1 GWAS population
In stage 1 of the study (discover stage), we conducted a GWAS involving HIV-1–infectedunrelated men who have sex with men from the MACS, a longitudinal prospective cohortconducted since 1984 in 4 US cities: Baltimore, Chicago, Los Angeles, and Pittsburgh [19].A total of 6973 men have been enrolled. From April 1984 through March 1985, 4954 menwere enrolled; 668 more men were enrolled from April 1987 through September 1991. Athird enrollment of 1351 men occurred from October 2001 through August 2003. Theoverwhelming majority, if not all, of the participants in our study were infected with HIV-1subtype B, and they were eligible for inclusion if they were naive to highly activeantiretroviral therapy (HAART) or treated only with zidovudine monotherapy.
Progression to clinical AIDS phenotypeWe attempted to select equal numbers of individuals in 3 distinct categories of AIDS-freeinterval: 51 rapid progressors, 57 moderate progressors, and 48 long-term nonprogressors(Table 1). Study participants were chosen to be enriched with those who had HIV-1 diseaseprogression rates from the extreme ends of this phenotypic distribution (rapid progressorsand long-term non-progressors), because inclusion of extreme participants has been shownto increase power in genetic association analyses [15–18]. Rapid progressors wereseroconverters for whom the interval from the estimated date of seroconversion to the dateof the first clinical AIDS diagnosis or death due to an AIDS-related disease [20] was <5years; it is estimated that ~10% of the MACS participants are rapid progressors [21].Moderate progressors were seroconverters for whom this interval was close to the medianAIDS-free interval of 9.2 years [21]. Long-term nonprogressors included seronconvertersand those already infected at entry in the cohort. These individuals had no 2 consecutiveCD4+ T cell counts <500 cells/mm3, no AIDS diagnosis, and no HAART use for ≥14.8years after seroconversion (or after enrollment, if they were seropositive at entry). Dates ofseroconversion were estimated as the midpoint between the last seronegative visit and thefirst seropositive visit; only seroconverters with <1 year between these visits were includedin our study. For long-term nonprogressors, the end point was defined as the date of the lastfollow-up visit or the date of first HAART treatment, if applicable. Approximately 10% ofthe MACS participants are long-term nonprogressors [21]. These phenotype criteria yielded194 individuals for genotyping.
GenotypingFor the stage 1 discovery analysis, we successfully genotyped 189 individuals with use ofthe Affymetrix GeneChip Human Mapping 500K Array Set (http://www.affymetrix.com; 5individuals either did not pass the minimal call rate threshold [>95%] or were found to havepotential sample errors in subsequent quality control). DNA was obtained from peripheralblood mononuclear cells (PBMCs) for 118 individuals and from lymphoblastoid cell linesfor 71 individuals with limited PBMC availability. Genotypic fidelity between PBMCs andlymphoblastoid cell lines genotypes was validated using paired genotypic samples from 16individuals [22]. SNP genotypes were called using the Affymetrix BRLMM algorithm [23];the mean call rate for all SNPs was 98.5%. For SNP quality assurance, we repeated thegenotyping of 471,000 SNPs for 151 individuals with use of the Affymetrix Genome-WideHuman SNP Array (version 6.0; J.L.T., in preparation) in a different laboratory (Laboratoryof Genomic Diversity, National Cancer Institute) and achieved >99.5% genotypingconcordance between the genotype calls for the 2 laboratories (unfiltered for SNP call rate;71,121,000 genotypes were compared).
Herbeck et al. Page 3
J Infect Dis. Author manuscript; available in PMC 2010 August 26.
NIH
-PA Author Manuscript
NIH
-PA Author Manuscript
NIH
-PA Author Manuscript

Correction for potential population stratificationThe stage 1 discovery study population included individuals of 4 self-reported ethnicities:white, non-Hispanic; black, non-Hispanic; white, Hispanic; and Asian or Pacific Islander.To confirm ancestries, we combined our 189 sample genotypes with 30 HapMap referencesamples [24] were also genotyped on Affymetrix 500K arrays, including 10 individuals fromeach of the following populations: Yoruba in Ibadan, Nigeria; Japanese in Tokyo, Japan, andChinese in Beijing, China; and Utah residents with ancestry from northern and westernEurope. Using this combined data set, and after removing regions of known high linkagedisequilibrium, we estimated identity-by-state pairwise distances with the genomewideassociation software PLINK (version 1.07) [25]; we used these estimates formultidimensional scaling analysis. Among the 189 MACS participants analyzed, self-reported ethnicities were consistent with observed HapMap ancestry in all but 2 instances.To avoid spurious associations resulting from population stratification, we restrictedsubsequent genomewide association analyses to 156 individuals whose MACS samples weregrouped with the HapMap European American population (51 rapid progressors, 57moderate progressors, and 48 long-term nonprogressors) (Table 2). In this population, wealso corrected for potential population stratification with use of a modified Eigenstratmethod [26]; 14 significant principal component axes were identified and included ascovariates in the regression models described below. Q-Q plots testing the normality of theP value distribution after SNP filtering and Eigenstrat correction showed no significantdeviations from what would be expected with a null hypothesis (λ = 1.0056; λ = 1.0 isexpected with a null hypothesis), indicating little effect of population stratification.
Stage 1 statistical analysisWe tested for associations between individual SNP genotypes and phenotypes for time toclinical AIDS by using 2 approaches: implemented with PLINK software [25]. First, weused logistic regression and an additive genetic model and included as covariates age atseroconversion and the 14 significant principal component axes identified by the Eigenstratmethod. In this categorical approach, phenotypes were coded as follows: rapid progression(3), moderate progression (2), long-term nonprogression (1). Next, we used quantitativeprogression phenotypes (log10 transformed) in a linear regression model (with the samegenetic model and 15 covariates). Results were overlapping for both analyses; only theresults for logistic regression (categorical progression phenotypes) are shown. To avoidexcessive artifacts of small samples and for quality control screening of genotypes beforetesting, we excluded all SNPs with minor allele frequencies of <5% (n = 113,205), all SNPsthat deviated from Hardy-Weinberg equilibrium at a significance level of P < .001 (n =4459), and all SNPs that yielded unambiguous genotype calls in <95% of samples (n =54,739). These quality control measures yielded 345,926 SNPs. We located SNPs in a geneor gene region with use of the Ensembl database [27], implemented with WGA-Viewersoftware (version 1.25) [28]; SNPs were mapped to 5′ upstream, 5′ untranslated, coding,intronic, 3′ untranslated, or 3′ downstream gene regions, as well as intergenic regions. TheAffymetrix signal intensity plots for all top-ranking SNPs were examined to confirmgenotype calls. We show P values corrected using the false discovery rate procedure [29].
Stage 2 replication study populationFrom the stage 1 analysis, we selected the 25 top-ranking SNPs with P values of <1 ×10⁻⁵
and q values <.70, representing 15 loci with SNPs with r2 values >0.90, to test forreplication in an independent replication cohort of 590 seroconverters. These stage 2participants were enrolled in 5 natural history cohorts of patients with HIV infection orAIDS: AIDS Link to the Intravenous Experience (n = 13) [30], MACS (n = 291, excludingthe 156 MACS individuals used in our stage 1 GWAS) [19], the San Francisco City ClinicCohort Study (n = 76) [31], and the Multicenter Hemophilia Cohort Study (n = 169) [32].
Herbeck et al. Page 4
J Infect Dis. Author manuscript; available in PMC 2010 August 26.
NIH
-PA Author Manuscript
NIH
-PA Author Manuscript
NIH
-PA Author Manuscript

Details of these cohorts have been described elsewhere [33]. The date of seroconversionafter study enrollment was estimated as the midpoint between the last seronegative and thefirst seropositive HIV-1 antibody test result; only individuals of European ancestry with <2years between the 2 tests were included. The censoring date was either the date of the lastfollow-up visit or 31 December 1995, the date HAART became the standard of care, toavoid potential confounding by virus-suppressive therapy. Genotyping was performed usingthe Affymetrix Genome-Wide Human SNP Array, version 6.0.
Replication study statistical analysisIn the stage 2 analysis, we analyzed the 25 top-ranking stage 1 SNPs for genotypicassociation with progression to clinical AIDS (CDC 1987 definition), time to AIDS-relateddeath, and time to CD4+ T cell count <200 cells/mm3. Cox model P values were subjectedto a Bonferroni correction for 15 independent tests, representing all SNPs tested forreplication and pruned for linkage disequilibrium at r2 > 0.9 (25 SNPs in 15 loci). Next, westratified the replication cohort by viral transmission mode and tested the significantassociations in each resulting population. The 2 discrete populations represented sexualtransmission (men who have sex with men; n = 405) and parenteral transmission(hemophiliacs and injection drug users; n = 182).
RESULTSAssociation between locus upstream of PROX1 on chromosome 1 and progression rate
Our discovery-stage genomewide association analysis of 345,926 validated SNPs with rateof progression to clinical AIDS resulted in 25 SNPs with statistically significant associationsat P < 1 ×10⁻⁵ and corrected P values of <.70 (q values, corrected for false discovery rate)(Table 3). These SNPs were tested for replication in an independent cohort of 590seroconverters. In this replication population, results with an additive (codominant) geneticmodel revealed a single haplotype segment including 3 linked SNPs (r2 > 0.9) 36 kbupstream of PROX1 on chromosome 1, with minor alleles that were associated with delayedprogression to AIDS diagnosis as well as AIDS-related death (Figure 1) after Bonferronicorrection (rs17762192; discovery-stage, P = 7.13 ×10⁻⁵; replication-stage, P = 4.8 ×10⁻⁴
and P = 7.2 ×10⁻³ [corrected]; relative hazard ratio, 0.69; Fisher’s combined P = 6.23×10⁻⁷) (Table 2). Effects were consistent in the replication analysis stratified by HIV-1transmission mode, in which equivalent relative hazard ratios for AIDS diagnosis werefound in the sexual and parenteral transmission populations (relative hazard ratios, 0.72 forsexual and 0.63 for parenteral transmission; Fisher’s combined P = 1.63 ×10⁻⁶) (Table 2).
The 3 associated SNPs were examined for linkage disequilibrium in relation to PROX1.There was a strong backbone of linkage around the associated SNPs, and for 2 SNPs, thelinkage disequilibrium extended, albeit weakly, into the PROX1 coding region (Figure 2,which appear only in the electronic version of the Journal). We are presently dissecting thehaplotype structure of the region, which includes genotyping additional SNPs andresequencing the region, to further refine the association with progression to clinical AIDS.
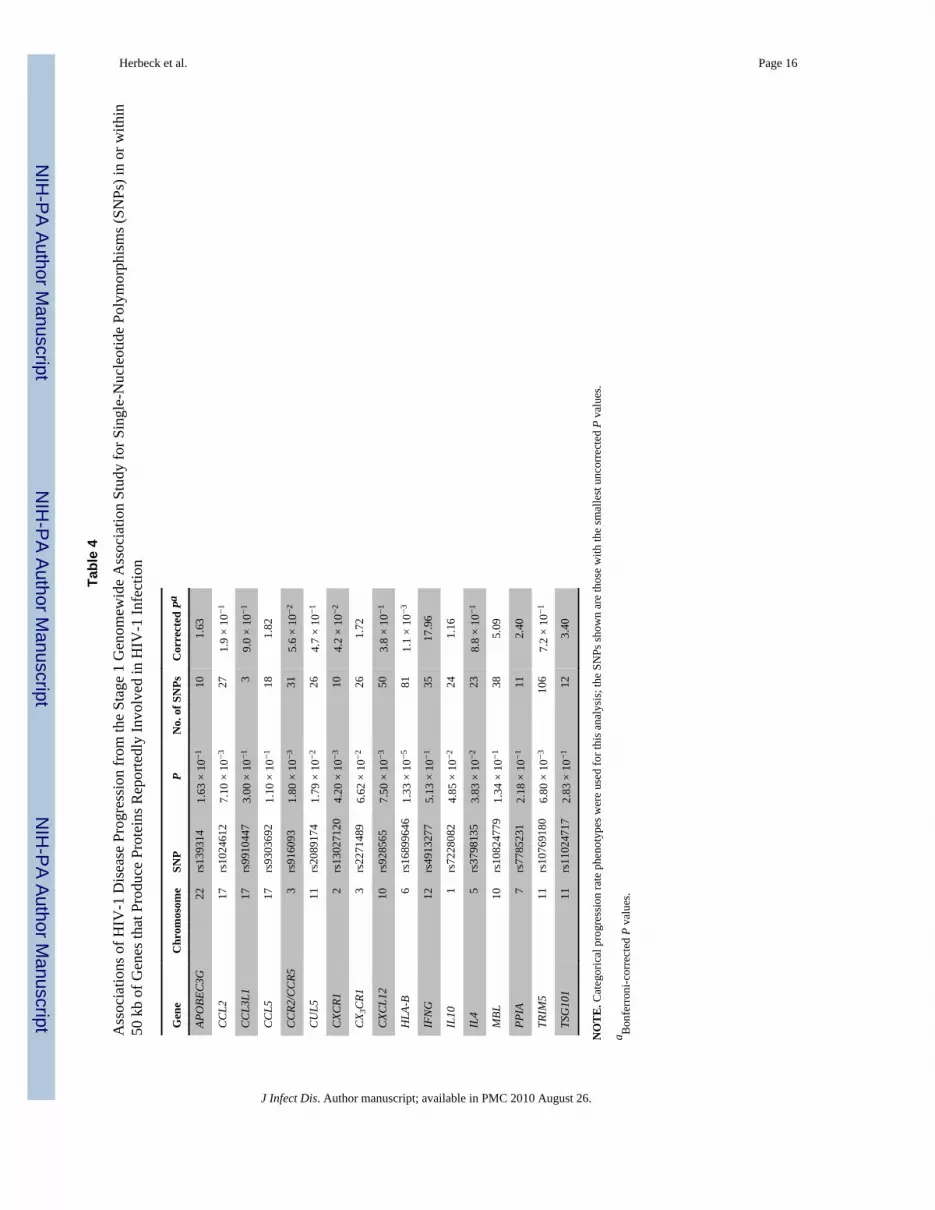
Replication of previously identified genes associated with AIDS progressionOur stage 1 genomewide association analysis provides an opportunity to replicate previouslyidentified candidate AIDS restriction genes in these cohorts. In the analysis of progression toclinical AIDS, we found clear associations for SNPs within 50 kb of HLA-B (the mostsignificant was rs16899646; P = 1.33 ×10⁻⁵). Likewise, we found associations for SNPswithin or in linkage disequilibrium with SNPs within the following genes, reportedelsewhere to influence AIDS progression: CCR2/CCR5 (rs916093; P = 1.8 ×10⁻³) andCXCR1 (Table 4).
Herbeck et al. Page 5
J Infect Dis. Author manuscript; available in PMC 2010 August 26.
NIH
-PA Author Manuscript
NIH
-PA Author Manuscript
NIH
-PA Author Manuscript

The associations found by Fellay et al [7] between RNF39 and ZNRD1 and diseaseprogression were not replicated in our stage 1 analysis (assessing the SNPs in strong linkagedisequilibrium with those identified by Fellay and colleagues). The discrepancies betweenthese 2 progression GWAS may reflect small sample sizes (n = 486 in the study by Fellay etal [7] and n = 156 in the present study) or the differences in disease progression phenotypes.Fellay et al used time from seroconversion to the start of antiretroviral treatment or time tothe predicted or observed first CD4+ T cell count <350 cells/mm3, whereas both stage 1(discovery) and stage 2 (replication) of our study tracked time from seroconversion to aclinical AIDS diagnosis or AIDS-related death.
Replication of previously identified genes associated with viral loadBecause recent HIV-related GWAS have focused on viral load phenotypes [7–9], we soughtto replicate these associations with use of viral load measurements for the 156 individualsfrom stage 1. Set point viral load was calculated according to the methods of Fellay et al [7]as the mean of log10-transformed viral load (measured in viral RNA copies per milliliter)from 6 months to 3 years after the first visit with a positive HIV-1 antibody test result,including only visits before any antiretroviral therapy. To avoid measurements obtainedduring the initial peak viremia or during the accelerating phase of chronic diseasecharacterized by increasing viral load, we removed all measurements > 0.5 log10 higher orlower than the mean viral load during visits from 6 months to 3 years after seroconversion,according to the methods of Fellay et al [7].
We tested for associations between SNP genotypes and viral load phenotypes with use of theaforementioned SNP filtering and linear regression methods. Fellay et al [7] examined viralRNA set point in 486 European individuals and found 2 SNPs strongly associated with setpoint HIV-1 load. One polymorphism was found in a nonsynonymous coding nucleotide ofHLA complex P5 (HCP5); this SNP is in high linkage disequilibrium with HLA-B★5701 onchromosome 6. The other SNP was found in the 5′ region of HLA-C. Although there wasminimal overlap in SNPs tested between our genotyping platform (Affymetrix 500K) andthat used by Fellay and colleagues (Illumina 550K), certain relationships were replicated(Table 5) and reaffirmed the dominant role of the HLA in controlling viral load. Forexample, SNP rs2248462, intergenic to HCP5 on chromosome 6 and associated with viralset point by Fellay and colleagues (P = 3.61 ×10⁻⁶) [7], was also significantly associatedwith viral set point in our study (P = 4.15 ×10⁻⁴; corrected, P = 1.16 ×10⁻²); this SNP is instrong linkage disequilibrium (r2 = 1) with 2 other associated SNPs from our study:rs2516422 (P = 5.12 ×10⁻⁴) and rs2395034 (P = 5.13 ×10⁻⁴). The minor alleles of these 3SNPs were associated with decreased viral set point. SNP rs9348876, 7.8 kb upstream ofAIF1 on chromosome 6, was significantly associated with viral set point both by Fellay et al[7] (P = 4.09 ×10⁻⁵) and in our data set (P = 1.3 ×10⁻³; corrected, P = 3.75 ×10⁻²).
DISCUSSIONIn our stage 1 GWAS of viral set point, we observed significant associations with HIV-1load for several SNPs in the HLA region, as reported elsewhere [7]. This portion of ourstudy confirms the dominant role of HLA genes in controlling viral load.
In our 2-stage association study of host genetic polymorphisms and rate of progression toclinical AIDS, we found SNPs near the transcription factor PROX1 that were confirmed inreplication tests, with use of a larger and independent set of seroconverters. Human PROX1is involved in biologic functions closely tied to HIV infection, most notably as a negativeregulator of interferon (IFN) γ expression in T cells [35]. IFN-γ plays an important role inHIV disease progression through its activity as a regulatory cytokine and inflammatoryeffector. Furthermore, PROX1 encodes a transcription factor in which differential expression
Herbeck et al. Page 6
J Infect Dis. Author manuscript; available in PMC 2010 August 26.
NIH
-PA Author Manuscript
NIH
-PA Author Manuscript
NIH
-PA Author Manuscript

has been shown to mediate the progression of Kaposi sarcoma [36], a common sequela ofHIV-1 infection. The exact role of this locus in HIV disease progression is unclear, althoughthe regulation of IFN-γ in T cells by PROX1 presents a possible mechanism of action. In ourstage 1 population, the association between this locus and disease progression is notexplained by an association with Kaposi sarcoma as the AIDS-defining illness. Additionalstudies will be necessary to determine the association between these SNPs and differentiallevels of expression of PROX1 and/or IFN-γ.
These data suggest that, beyond the major role of HLA in viral control, a cumulativepolygenic host component may be involved in the regulation of rate of progression toclinical AIDS. Our results should prove to be valuable in informing larger host geneticsstudies of HIV-1 and progression to AIDS and in guiding future replication and follow-upstudies in other cohorts and populations.
Supplementary MaterialRefer to Web version on PubMed Central for supplementary material.
AcknowledgmentsWe thank Rob Hall, Trevor King, and Roger Bumgarner at the Center for Array Technologies, University ofWashington; Janet Schollenberger at the Center for the Analysis of MACS Data, Johns Hopkins University; and allthe individuals who participated in the cohorts used for this study.
Financial support: National Institutes of Health (NIH; R37 AI47734 to J.I.M. and T32 AI07140 to J.T.H.) andUniversity of Washington Center for AIDS Research Genomics Core (P30 AI27757 to J.T.H. and J.I.M.). TheMulticenter AIDS Cohort Study is funded by the National Institute of Allergy and Infectious Diseases, withadditional supplemental funding from the National Cancer Institute (NCI) and the National Heart, Lung and BloodInstitute (UO1 AI35042, 5MO1 RR00722 [GCRC], UO1 AI35043, UO1 AI37984, UO1 AI35039, UO1 AI35040,UO1 AI37613, and UO1 AI35041); partial support was provided by the Intramural Research Program, NCI, NIH.The AIDS Link to the Intravenous Experience study was supported by the National Institute on Drug Abuse (R01-DA04334 and R01–12586). The San Francisco City Clinic Cohort Study was supported by the Centers for DiseaseControl and Prevention (U64/CCU900523–08).
References1. O’Brien SJ, Nelson GW. Human genes that limit AIDS. Nat Genet. 2004; 36:565–574. [PubMed:
15167933]2. O’Brien, T.; Welzel, TM.; Kaslow, RA. HIV-1 and AIDS. In: Kaslow, RA.; McNicholl, J.; Hill,
AVS., editors. Genetic susceptibility to infectious diseases. New York: Oxford; 2008.3. Dean M, Carrington M, Winkler C, et al. Genetic restriction of HIV-1 infection and progression to
AIDS by a deletion allele of the CKR5 structural gene. Science. 1996; 273:1856–1862. [PubMed:8791590]
4. Kaslow RA, Carrington M, Apple R, et al. Influence of combinations of human majorhistocompatibility complex genes on the course of HIV-1 infection. Nat Med. 1996; 2:405–411.[PubMed: 8597949]
5. Carrington M, O’Brien SJ. The influence of HLA genotype on AIDS. Annu Rev Med. 2003;54:535–551. [PubMed: 12525683]
6. Migueles SA, Sabbaghian MS, Shupert WL, et al. HLA B★5701 is highly associated withrestriction of virus replication in a subgroup of HIV-infected long term nonprogressors. Proc NatlAcad Sci USA. 2000; 97:2709–2714. [PubMed: 10694578]
7. Fellay J, Shianna KV, Ge D, et al. A whole-genome association study of major determinants for hostcontrol of HIV-1. Science. 2007; 317:944–947. [PubMed: 17641165]
8. Limou S, Le Clerc S, Coulonges C, et al. Genomewide association study of an AIDS-nonprogression cohort emphasizes the role played by HLA genes (ANRS Genomewide AssociationStudy 02). J Infect Dis. 2009; 199:419–426. [PubMed: 19115949]
Herbeck et al. Page 7
J Infect Dis. Author manuscript; available in PMC 2010 August 26.
NIH
-PA Author Manuscript
NIH
-PA Author Manuscript
NIH
-PA Author Manuscript

9. de Bakker, PI.; Pereyra, F.; Jia, X., et al. A genome-wide association study in HIV-1 controllers.Presented at: Conference on Retroviruses and Opportunistic Infections; 2009; Montreal.
10. Ioannidis JP, Rosenberg PS, Goedert JJ, et al. Effects of CCR5-Delta32, CCR2–64I, and SDF-13′A alleles on HIV-1 disease progression: an international meta-analysis of individual-patient data.Ann Intern Med. 2001; 135:782–795. [PubMed: 11694103]
11. Chanock SJ, Manolio T, Boehnke M, et al. Replicating genotype-phenotype associations. Nature.2007; 447:655–660. [PubMed: 17554299]
12. Mellors JW, Rinaldo CR Jr, Gupta P, White RM, Todd JA, Kingsley LA. Prognosis in HIV-1infection predicted by the quantity of virus in plasma [published correction appears in Science1997; 275(5296): 14]. Science. 1996; 272(5265):1167–1170. [PubMed: 8638160]
13. Mellors JW, Margolick JB, Phair JP, et al. Prognostic value of HIV-1 RNA, CD4 cell count, andCD4 cell count slope for progression to AIDS and death in untreated HIV-1 infection. JAMA.2007; 297:2349–2350. [PubMed: 17551128]
14. Mellors JW, Kingsley LA, Rinaldo CR Jr, et al. Quantitation of HIV-1 RNA in plasma predictsoutcome after seroconversion. Ann Intern Med. 1995; 122:573–579. [PubMed: 7887550]
15. Van Gestel S, Houwing-Duistermaat JJ, Adolfsson R, van Duijn CM, Van Broeckhoven C. Powerof selective genotyping in genetic association analyses of quantitative traits. Behav Genet. 2000;30:141–146. [PubMed: 10979604]
16. Huang BE, Lin DY. Efficient association mapping of quantitative trait loci with selectivegenotyping. Am J Hum Genet. 2007; 80:567–576. [PubMed: 17273979]
17. Rappaport J, Cho YY, Hendel H, Schwartz EJ, Schachter F, Zagury JF. 32 bp CCR-5 gene deletionand resistance to fast progression in HIV-1 infected heterozygotes. Lancet. 1997; 349:922–923.[PubMed: 9093257]
18. Hendel H, Caillat-Zucman S, Lebuanec H, et al. New class I and II HLA alleles strongly associatedwith opposite patterns of progression to AIDS. J Immunol. 1999; 162:6942–6946. [PubMed:10352317]
19. Kaslow RA, Ostrow DG, Detels R, Phair JP, Polk BF, Rinaldo CR Jr. The Multicenter AIDSCohort Study: rationale, organization, and selected characteristics of the participants. Am JEpidemiol. 1987; 126:310–318. [PubMed: 3300281]
20. Centers for Disease Control and Prevention. 1993 revised classification system for HIV infectionand expanded surveillance case definition for AIDS among adolescents and adults. MMWRRecomm Rep. 1992; 41:1–19.
21. Muñoz A, Sabin CA, Phillips AN. The incubation period of AIDS. AIDS. 1997; 11:S69–S76.[PubMed: 9451969]
22. Herbeck JT, Gottlieb GS, Wong K, et al. Fidelity of SNP array genotyping using Epstein Barrvirus-transformed B-lymphocyte cell lines: implications for genome-wide association studies.PLoS ONE. 2009; 4(9):e6915. [PubMed: 19730697]
23. Affymetrix. BRLMM: an improved genotype calling method for the GeneChip human mapping500K array set. 2007 [Accessed 1 July 2009]. Published 14 April 2006. Available at:http://www.affymetrix.com/support/technical/whitepapers/brlmm_whitepaper.pdf
24. International HapMap Project. [Accessed 1 July 2009]. Available at: http://www.hapmap.org25. Purcell S, Neale B, Todd-Brown K, et al. PLINK: a tool set for whole-genome association and
population-based linkage analyses. Am J Hum Genet. 2007; 81:559–575. [PubMed: 17701901]26. Price AL, Patterson NJ, Plenge RM, Weinblatt ME, Shadick NA, Reich D. Principal components
analysis corrects for stratification in genome-wide association studies. Nat Genet. 2006; 38:904–909. [PubMed: 16862161]
27. Hubbard TJ, Aken BL, Beal K, et al. Ensembl 2007. Nucleic Acids Res. 2007; 35:D610–D617.[PubMed: 17148474]
28. Ge D, Zhang K, Need AC, et al. WGAViewer: software for genomic annotation of whole genomeassociation studies. Genome Res. 2008; 18:640–643. [PubMed: 18256235]
29. Benjamini Y, Hochberg Y. Controlling the false discovery rate: a practical and powerful approachto multiple testing. J R Stat Soc Ser B. 1995; 57:289–300.
Herbeck et al. Page 8
J Infect Dis. Author manuscript; available in PMC 2010 August 26.
NIH
-PA Author Manuscript
NIH
-PA Author Manuscript
NIH
-PA Author Manuscript

30. Vlahov D, Graham N, Hoover D, et al. Prognostic indicators for AIDS and infectious disease deathin HIV-infected injection drug users: plasma viral load and CD4+ cell count. JAMA. 1998;279:35–40. [PubMed: 9424041]
31. Buchbinder SP, Katz MH, Hessol NA, O’Malley PM, Holmberg SD. Long-term HIV-1 infectionwithout immunologic progression. AIDS. 1994; 8:1123–1128. [PubMed: 7986410]
32. Goedert JJ, Kessler CM, Aledort LM, et al. A prospective study of human immunodeficiency virustype 1 infection and the development of AIDS in subjects with hemophilia. N Engl J Med. 1989;321:1141–1148. [PubMed: 2477702]
33. O’Brien SJ, Nelson GW, Winkler CA, Smith MW. Polygenic and multifactorial disease geneassociation in man: lessons from AIDS. Annu Rev Genet. 2000; 34:563–591. [PubMed:11092839]
34. Barrett JC, Fry B, Maller J, Daly MJ. Haploview: analysis and visualization of LD and haplotypemaps. Bioinformatics. 2005; 21(2):263–265. [PubMed: 15297300]
35. Wang L, Zhu J, Shan S, et al. Repression of interferon-gamma expression in T cells by Prospero-related homeobox protein. Cell Res. 2008; 18:911–920. [PubMed: 19160541]
36. Dadras SS, Skrzypek A, Nguyen L, et al. Prox-1 promotes invasion of kaposiformhemangioendotheliomas. J Invest Dermatol. 2008; 128(12):2798–2806. [PubMed: 18580962]
Herbeck et al. Page 9
J Infect Dis. Author manuscript; available in PMC 2010 August 26.
NIH
-PA Author Manuscript
NIH
-PA Author Manuscript
NIH
-PA Author Manuscript

Figure 1.Survival analysis of a locus associated with delayed progression to AIDS. Kaplan-Meiersurvival curves for genotypes of single-nucleotide polymorphism rs17762192, representinga haplotype located 36 kb upstream of PROX1 on chromosome 1, showing strongassociations with differing rates of progression to clinical AIDS (see Table 3 for P valuesand genomic location). This analysis incorporates seroconverters from the stage 2replication analysis that were typed for rs17762192 (n = 587). GG, GC, and CC genotypecounts are shown for the independent replication cohort (A) and the independent replicationcohort combined with the cohort used in the stage 1 discovery genomewide associationstudy (B). RH, relative hazard.
Herbeck et al. Page 10
J Infect Dis. Author manuscript; available in PMC 2010 August 26.
NIH
-PA Author Manuscript
NIH
-PA Author Manuscript
NIH
-PA Author Manuscript

Figure 2.Location of the 3 single-nucleotide polymorphisms (SNPs) in the upstream region of thePROX1 gene (1q32) and linkage disequilibrium matrix; the linkage disequilibrium matrixwas shown by Haploview for the HapMap Utah European population. The intensity of thered color in each box is proportional to the strength of the linkage disequilibrium estimates(D′) for the SNP pair. Linkage disequilibrium blocks depicted by black triangles were basedon 95% confidence interval criteria [34].
Herbeck et al. Page 11
J Infect Dis. Author manuscript; available in PMC 2010 August 26.
NIH
-PA Author Manuscript
NIH
-PA Author Manuscript
NIH
-PA Author Manuscript

NIH
-PA Author Manuscript
NIH
-PA Author Manuscript
NIH
-PA Author Manuscript
Herbeck et al. Page 12
Table 1
Distributions of Age and HIV-1 Disease Phenotypes among the 156 Multicenter AIDS Cohort StudyParticipants of European Descent Included in This Study
Characteristic All RPs (n = 51) MPs (n = 57) LTNPs (n = 48)
Age, years
Mean ± SD 32.8 ± 6.1 34.6 ± 5.8 31.1 ± 6.5 33.0 ± 5.6
Range 19.1–47.6 19.1–47.6 19.5–45.9 22.5–46.8
Time from seroconversion to AIDS, years
Mean ± SD 10.4 ± 6.9 3.3 ± 1.1 8.4 ± 1.3 18.2 ± 1.7
Range 0.7–21.2 0.7–4.9 6.5–11.3 13.4–21.2
Viral set point, log10 RNA copies/mL plasma
Mean ± SD 3.9 ± 0.8 4.9 ± 0.7 4.3 ± 0.5 3.2 ± 0.7
Range 1.6–6.4 1.6–6.4 2.6–5.1 2.1–4.9
NOTE. The time of progression to AIDS for rapid progressors (RPs) and moderate progressors (MPs) was calculated as the interval from theestimated date of seroconversion to the first clinical AIDS diagnosis or death from an AIDS-related disease. Disease end points for long-termnonprogressors (LTNPs) were defined as the interval from the date of seroconversion or enrollment to the date of the last follow-up visit or start ofhighly active antiretroviral therapy(if applicable). SD, standard deviation.
J Infect Dis. Author manuscript; available in PMC 2010 August 26.

NIH
-PA Author Manuscript
NIH
-PA Author Manuscript
NIH
-PA Author Manuscript
Herbeck et al. Page 13
Table 2
Multistage Analysis of the Association with Delayed Progression to Clinical AIDS Diagnosis and AIDS-Related Death for 4 Linked Single-Nucleotide Polymorphisms (SNPs) 36 kb Upstream of PROX1 onChromosome 1
SNP (minor allele)
Variable rs17762192 (C) rs1367951 (G) rs17762150 (T)
Stage 1 (discovery): AIDS in 1987, P 7.13 × 10⁻⁵ 6.69 × 10⁻⁵ 3.64 × 10⁻⁵
Stage 2 (replication): AIDS in 1987
Overall
P 4.80 × 10⁻⁴ 5.90 × 10⁻⁴ 8.30 × 10⁻⁴
Corrected Pa 7.20 × 10⁻³ 8.85 × 10⁻³ 1.25 × 10⁻²
RH 0.69 0.69 0.7
Sexual transmission
P 1.7 × 10⁻²
RH 0.72 … …
Parenteral transmission
P 7.0 × 10⁻³
RH 0.63 … …
AIDS death
P 2.00 × 10⁻³ 2.00 × 10⁻³ 3.00 × 10⁻³
RH 0.68 0.69 0.69
CD4+ T cell count <200 cells/mm3
P 4.50 × 10⁻² 5.40 × 10⁻² 8.20 × 10⁻²
RH 0.82 0.83 0.84
NOTE. For the 4 linked SNPs, r2 > 0.9. In stage 1, n = 156; in stage 2, n = 590; for sexual transmission, n = 405; and for parenteral transmission, n= 182. RH, relative hazard.
aCorrected for 15 tests with use of the Bonferroni correction.
J Infect Dis. Author manuscript; available in PMC 2010 August 26.

NIH
-PA Author Manuscript
NIH
-PA Author Manuscript
NIH
-PA Author Manuscript
Herbeck et al. Page 14
Tabl
e 3
Fifte
en T
op-R
anki
ng A
ssoc
iatio
ns o
f Loc
i with
Rat
e of
Pro
gres
sion
to C
linic
al A
IDS
(25
Sing
le-N
ucle
otid
e Po
lym
orph
ism
s [SN
Ps])
from
the
Dis
cove
ry-
Stag
e G
enom
ewid
e A
ssoc
iatio
n St
udy
(Sta
ge 1
)
SNP
Ran
kP
qaR
eplic
atio
n Pb
Chr
omos
ome
Posi
tion,
bas
e pa
irT
ype
Anc
estr
al a
llele
Clo
sest
gen
e
rs69
8436
81
8.76
× 1
0−6
.683
4.1
588
8205
5464
Intro
nic
GPA
G1
rs70
0610
122
4.81
× 1
0−5
.710
56.
58 ×
10−
28
8205
9755
Syno
nym
ous
CPA
G1
rs16
8996
462
1.33
× 1
0−5
.683
4.1
146
3152
4899
Inte
rgen
icC
HC
P5
rs16
9194
63
1.70
× 1
0−5
.683
4.9
9510
2920
0463
Intro
nic
GC
10or
f126
rs17
7592
97
2.69
× 1
0−5
.683
4.8
8110
2919
9354
Intro
nic
TC
10or
f126
rs16
9194
38
2.69
× 1
0−5
.683
4.8
8110
2920
0842
Intro
nic
GC
10or
f126
rs17
7593
311
3.10
× 1
0−5
.683
4.8
4410
2920
0882
Intro
nic
GC
10or
f126
rs11
6486
864
1.78
× 1
0−5
.683
4.1
7516
5095
0897
Inte
rgen
icG
TOX3
rs48
0082
05
2.20
× 1
0−5
.683
4.7
1018
2363
0471
Inte
rgen
icT
CD
H2
rs99
5770
89
2.71
× 1
0−5
.683
4.5
2318
2363
3388
Inte
rgen
icA
CD
H2
rs71
0240
76
2.32
× 1
0−5
.683
4.8
2811
9512
693
Inte
rgen
icC
ZNF1
43
rs10
0826
8538
7.89
× 1
0−5
.718
5.4
6011
9500
492
Intro
nic
GZN
F143
rs49
1046
639
8.28
× 1
0−5
.726
34.
79 ×
10−
211
9465
928
Intro
nic
GZN
F143
rs12
3326
9410
2.71
× 1
0−5
.683
4.9
425
7937
7745
Intro
nic
CTH
BS4
rs77
5095
123.
20 ×
10−
5.6
834
.346
2015
9170
77In
troni
cT
MAC
ROD
2
rs49
1005
213
3.31
× 1
0−5
.683
41.
50 ×
10−
211
9411
950
Syno
nym
ous
TIP
O7
rs36
0483
7514
3.31
× 1
0−5
.683
41.
49 ×
10−
211
9419
893
Intro
nic
GIP
O7
rs79
8375
115
3.37
× 1
0−5
.683
4.6
7313
2999
2021
Intro
nic
TH
MG
B1
rs11
6225
0516
3.46
× 1
0−5
.683
4.9
8014
9238
7319
Inte
rgen
icA
GO
LGA5
rs17
7621
5017
3.64
× 1
0−5
.683
48.
30 ×
10−
41
2121
9144
1In
terg
enic
CPR
OX1
rs13
6795
130
6.69
× 1
0−5
.710
55.
90 ×
10−
41
2121
9213
6In
terg
enic
APR
OX1
rs17
7621
9234
7.13
× 1
0−5
.710
54.
80 ×
10−
41
2121
9175
0In
terg
enic
GPR
OX1
rs22
6742
018
3.73
× 1
0−5
.683
4.2
2022
3867
8466
Intro
nic
AG
RAP2
rs49
8280
193.
84 ×
10−
5.6
834
7.88
× 1
0−2
710
5188
251
3′_u
trC
ATXN
7L1
rs17
0502
0620
3.95
× 1
0−5
.683
4.7
004
1393
7206
8In
troni
cC
SLC
7A11
NO
TE
. Bol
dfac
e ty
pe S
NPs
in a
djac
ent r
ows r
epre
sent
link
ed S
NPs
(r2
> 0.
09).
J Infect Dis. Author manuscript; available in PMC 2010 August 26.

NIH
-PA Author Manuscript
NIH
-PA Author Manuscript
NIH
-PA Author Manuscript
Herbeck et al. Page 15a P
valu
es c
orre
cted
for f
alse
dis
cove
ry ra
te (q
val
ues)
.
b P va
lues
for A
IDS
1987
dia
gnos
es in
the
repl
icat
ion
coho
rt, u
ncor
rect
ed fo
r mul
tiple
test
s.
J Infect Dis. Author manuscript; available in PMC 2010 August 26.
NIH
-PA Author Manuscript
NIH
-PA Author Manuscript
NIH
-PA Author Manuscript
Herbeck et al. Page 16
Tabl
e 4
Ass
ocia
tions
of H
IV-1
Dis
ease
Pro
gres
sion
from
the
Stag
e 1
Gen
omew
ide
Ass
ocia
tion
Stud
y fo
r Sin
gle-
Nuc
leot
ide
Poly
mor
phis
ms (
SNPs
) in
or w
ithin
50 k
b of
Gen
es th
at P
rodu
ce P
rote
ins R
epor
tedl
y In
volv
ed in
HIV
-1 In
fect
ion
Gen
eC
hrom
osom
eSN
PP
No.
of S
NPs
Cor
rect
ed P
a
APO
BEC
3G22
rs13
9314
1.63
× 1
0−1
101.
63
CC
L217
rs10
2461
27.
10 ×
10−
327
1.9
× 10
−1
CC
L3L1
17rs
9910
447
3.00
× 1
0−1
39.
0 ×
10−
1
CC
L517
rs93
0369
21.
10 ×
10−
118
1.82
CC
R2/C
CR5
3rs
9160
931.
80 ×
10−
331
5.6
× 10
−2
CU
L511
rs20
8917
41.
79 ×
10−
226
4.7
× 10
−1
CXC
R12
rs13
0271
204.
20 ×
10−
310
4.2
× 10
−2
CX 3
CR1
3rs
2271
489
6.62
× 1
0−2
261.
72
CXC
L12
10rs
9285
657.
50 ×
10−
350
3.8
× 10
−1
HLA
-B6
rs16
8996
461.
33 ×
10−
581
1.1
× 10
−3
IFN
G12
rs49
1327
75.
13 ×
10−
135
17.9
6
IL10
1rs
7228
082
4.85
× 1
0−2
241.
16
IL4
5rs
3798
135
3.83
× 1
0−2
238.
8 ×
10−
1
MBL
10rs
1082
4779
1.34
× 1
0−1
385.
09
PPIA
7rs
7785
231
2.18
× 1
0−1
112.
40
TRIM
511
rs10
7691
806.
80 ×
10−
310
67.
2 ×
10−
1
TSG
101
11rs
1102
4717
2.83
× 1
0−1
123.
40
NO
TE
. Cat
egor
ical
pro
gres
sion
rate
phe
noty
pes w
ere
used
for t
his a
naly
sis;
the
SNPs
show
n ar
e th
ose
with
the
smal
lest
unc
orre
cted
P v
alue
s.
a Bon
ferr
oni-c
orre
cted
P v
alue
s.
J Infect Dis. Author manuscript; available in PMC 2010 August 26.

NIH
-PA Author Manuscript
NIH
-PA Author Manuscript
NIH
-PA Author Manuscript
Herbeck et al. Page 17
Tabl
e 5
Ass
ocia
tion
Ana
lysi
s of S
et P
oint
HIV
-1 L
oad
in th
e St
age
1 G
enom
ewid
e A
ssoc
iatio
n St
udy
(GW
AS)
Pop
ulat
ion
HIV
load
set p
oint
in G
WA
S by
Fel
lay
et a
l [7]
Cur
rent
stud
y
SNP
Ran
kP
Chr
omos
ome
Clo
sest
gen
eP
Cor
rect
ed P
a
rs22
4846
210
3.61
× 1
0−6
6H
CP5
4.51
× 1
0−4
1.16
× 1
0−2
rs92
6371
517
7.08
× 1
0−6
6PS
ORS
1C1
4.00
× 1
0−2
1.12
rs93
4887
651
4.09
× 1
0−5
6AI
F11.
34 ×
10−
33.
75 ×
10−
2
rs10
7368
6253
4.24
× 1
0−5
9AS
S5.
55 ×
10−
115
.54
rs91
9214
747.
02 ×
10−
512
GN
PTAB
5.10
× 1
0−1
14.2
8
rs78
9458
279
7.41
× 1
0−5
10N
HLR
C2
7.31
× 1
0−1
20.4
7
rs10
7383
7783
7.78
× 1
0−5
9FR
EM1
7.29
× 1
0−1
20.4
1
rs12
0375
8388
8.26
× 1
0−5
1TN
R1.
81 ×
10−
25.
07 ×
10−
1
rs37
4997
190
8.32
× 1
0−5
6O
R12D
33.
08 ×
10−
18.
62
rs22
4861
797
9.23
× 1
0−5
6H
CP5
1.62
× 1
0−1
4.54
rs66
7443
810
61.
00 ×
10−
41
GN
G4
6.78
× 1
0−1
18.9
8
rs63
3265
109
1.00
× 1
0−4
18M
C4R
6.87
× 1
0−1
19.2
4
rs11
1991
111
11.
00 ×
10−
413
RXFP
27.
96 ×
10−
22.
23
rs23
2643
412
01.
00 ×
10−
48
DEP
DC
63.
09 ×
10−
18.
65
rs23
5516
412
11.
00 ×
10−
42
UPP
24.
64 ×
10−
112
.99
rs19
8036
012
81.
00 ×
10−
44
SCD
58.
36 ×
10−
123
.41
rs46
2641
613
41.
00 ×
10−
46
NA
5.54
× 1
0−1
15.5
1
rs28
6097
514
11.
00 ×
10−
410
CYP
2C8
7.74
× 1
0−1
21.6
7
rs10
1049
7315
12.
00 ×
10−
48
CO
L14A
19.
81 ×
10−
127
.47
rs14
2019
816
02.
00 ×
10−
416
TOX3
8.24
× 1
0−1
23.0
7
rs10
0871
5116
82.
00 ×
10−
48
CO
L14A
18.
55 ×
10−
123
.94
rs15
4414
917
12.
00 ×
10−
41
SMYD
34.
81 ×
10−
113
.47
rs69
1018
317
32.
00 ×
10−
46
THBS
21.
99 ×
10−
15.
57
rs11
7728
3217
72.
00 ×
10−
47
CN
OT4
2.52
× 1
0−1
7.06
rs92
6640
918
72.
00 ×
10−
46
Q5S
S58_
HU
MA
N8.
35 ×
10−
32.
34 ×
10−
1
rs60
0130
193
2.00
× 1
0−4
9FB
P22.
29 ×
10−
16.
41
J Infect Dis. Author manuscript; available in PMC 2010 August 26.

NIH
-PA Author Manuscript
NIH
-PA Author Manuscript
NIH
-PA Author Manuscript
Herbeck et al. Page 18
HIV
load
set p
oint
in G
WA
S by
Fel
lay
et a
l [7]
Cur
rent
stud
y
SNP
Ran
kP
Chr
omos
ome
Clo
sest
gen
eP
Cor
rect
ed P
a
rs31
3054
419
42.
00 ×
10−
46
C6o
rf15
7.01
× 1
0−2
1.96
rs10
5096
8919
82.
00 ×
10−
410
ALD
H18
A14.
56 ×
10−
11.
96
NO
TE
. Bol
dfac
e ty
pe si
ngle
nuc
leot
ide
poly
mor
phis
ms (
SNPs
) are
SN
Ps fo
und
in th
e to
p 20
0 by
Fel
lay
et a
l [7]
that
wer
e al
so te
sted
in th
is st
udy
(dire
ct o
verla
p be
twee
n Ill
umin
a H
ap55
0 an
d A
ffym
etrix
500K
arr
ays)
. NA
, not
ava
ilabl
e.
a Bon
ferr
oni-c
orre
cted
P v
alue
s.
J Infect Dis. Author manuscript; available in PMC 2010 August 26.


