Embed Size (px)
Citation preview

Journal of Neurochemistry Raven Press, Ltd., New York 0 1989 International Society for Neurochemistry
Myelin Membrane Structure and Composition Correlated: A Phylogenetic Study
Daniel A. Kirschner, Hideyo Inouye, Allen L. Ganser, and Vicki Mann
Neurology Research, Children S Hospital, and Department of Neurology, Harvard Medical School, Boston, Massachusetts, U.S.A.
Abstract: We have correlated myelin membrane structure with biochemical composition in the CNS and PNS of a phy- logenetic series of animals, including elasmobranchs, teleosts, amphibians, and mammals. X-ray diffraction patterns were recorded from freshly dissected, unfixed tissue and used to determine the thicknesses of the lipid bilayer and the widths of the spaces between membranes at their cytoplasmic and extracellular appositions. The lipid and protein compositions of myelinated tissue from selected animals were determined by TLC and sodium dodecyl sulfate-polyacrylamide gel elec- trophoresis/immunoblotting, respectively. We found that ( 1) there were considerable differences in lipid (particularly gly- colipid) composition, but no apparent phylogenetic trends; (2) the lipid composition did not seem to affect either the bilayer thickness, which was relatively constant, or the mem- brane separation; (3) the CNS of elasmobranch and teleost and the PNS of all four classes contained polypeptides that were recognized by antibodies against myelin Po glycoprotein; (4) antibodies against proteolipid protein (PLP) were recog- nized only by amphibian and mammalian CNS; (5) wide extracellular spaces (ranging from 36 to 48 A) always cor-
Ideas about the structural organization of lipids, proteins, and water in the myelin membrane derive from diffraction analysis of myelin structure in CNS and PNS tissues from a variety of species (Kirschner et al., 1984; Blaurock, 1986). These studies provide evidence that proteins are the major determinants of the membrane packing and separation at both the ex- tracellular and cytoplasmic appositions. To test ideas that particular proteins determine membrane packing in myelin, we have attempted to correlate our x-ray measurements of the intermembrane spaces with ob- servations on myelin protein and lipid composition in the same animals. The results of recent phylogenetic studies of myelin protein composition have suggested
related with the presence of Po-immunoreactive protein; (6) the narrowest extracellular spaces (- 3 1 A) were observed only in PLP-containing myelin;*( 7) the cytoplasmic space in PLP-containing myelin (- 3 1 A) averaged - 5 A less than that in Po-cont$ning myelin; (8) even narrower cytoplasmic spaces (-24 A) were measured when both Po and 11-13- kilodalton basic protein were detected; (9) proteins immu- noreactive to antibodies against myelin Pz basic protein were present in elasmobranch and teleost CNS and/or PNS, and in mammalian PNS, but not in amphibian tissues; and (10) among mammalian PNS myelins, the major difference in structure was a variation in membrane separation at the cy- toplasmic apposition. These findings demonstrate which fea- tures of myelin structure have remained constant and which have become specifically altered as myelin composition changed during evolutionary development. Key Words: X-ray diffraction-Teleost-Elasmobranch-Garfish- Proteins-Lipids. Kirschner D. A. et al. Myelin membrane structure and composition correlated: A phylogenetic study. J. Neurochem. 53, 1599-1609 (1989).
the usefulness of such an approach in relating com- position to structure. For example, in teleosts (bony fish) and elasmobranchs (cartilaginous fish) the major CNS myelin proteins are glycoproteins that immu- noreact with polyclonal antibodies raised against mammalian Po but not against proteolipid protein (PLP) (reviewed by Waehneldt et al., 1986). The pres- ence of glycosylated proteins in elasmobranch CNS myelin correlates at the electron microscopic level with double intraperiod lines (Waehneldt et al., 1984). In our current study, we included elasmobranchs, fresh water teleosts, amphibians, and mammals. Some of our results have been reported in abstract form (Kirschner et al., 1986; Inouye et al., 1985).
Received January 23, 1989; revised manuscript received April 14, 1989; accepted May 2, 1989.
Address correspondence and reprint requests to Dr. D. A. Kirschner at Neurology Research, Children’s Hospital, 300 Longwood Avenue, Boston, MA 021 15, U.S.A.
Abbreviations used: kDa, kilodalton; MBP, myelin basic protein; PA, phosphatidic acid; PC, phosphatidylcholine; PE, phosphatidyl- ethanolamine; PI, phosphatidylinositol; PLP, proteolipid protein; PS, phosphatidylserine; SDS, sodium dodecyl sulfate; SDS-PAGE, SDS- polyacrylamide gel electrophoresis.
1599

1600 D. ‘4. KIRSCHNER ET .4L.
MATERIALS AND METHODS Specimens
Elasmobranch fish [electric ray (Torpedo nobiliuna) and dogfish shark (Squalus acanthius)] were purchased from Bio- fish Associates (Georgetown, MA, U.S.A.) and the Marine Biological Laboratory (Woods Hole, MA, U.S.A.), respec- tively. Teleost fish, including garfish (Lrpisosteza tristoechus), trout (Safmo gairdneri), goldfish (Carrassius auratiis), carp (Cyprinus carpio Linnaeus), and “Jack Dempsey” (Cichlu- soma octafasciaturn), were purchased from local commercial aquaria. Mudpuppy salamanders (Necturzis macirlosus) were purchased from Nasco Corporation (Fort Atkinson, WI, U.S.A.), and frogs (Rana pipiens) and bullfrogs (Rana cate-y- beiuna) from Lembergen Co. (Oshkosh, WI, U.S.A.). Our inhouse animal facility provided mice. rats, and rabbits. Guinea pigs and hamsters were purchased from local com- mercial suppliers. Tissue specimens from the remaining an- imals (cat, dog, bovine, and monkey) were obtained as fresh material from local researchers. CNS specimens were either optic nerve or spinal cord; PNS specimens were sciatic nerve (amphibian, higher vertebrates), intradural root (bovine). branchial nerve (Torpedo, dogfish). or lateral line nerve (te- leost fish).
For x-ray diffraction, the tissues were dissected ou t and immediately sealed into thin-wall capillary tubes containing appropriate media. Elasmobranch medium consisted of 248 mM NaCI, 5.3 mM KCI, 0.34 m M NaH2P04. 0.44 mM KH2P04, 5.8 mMglucose, 4.2 mMNaHCO,, and 383 m M urea, at pH 7.1 (Richardson et al., 1981); amphibian medium was 1 15 m M NaCl and 10 m M cacodylate. at pH 7. I : and the medium for teleost and mammals, which have similar ion compositions and osmolarity in their body fluids (Prosser. 1973; Inouye, 1979), was 154 m M NaCl and 10 mM caco- dylate, at pH 7.1. Some specimens were incubated in hy- potonic salt solutions (ionic strength = 0.06) at different pH levels. Buffer salts were as previously described (Inouye and Kirschner, 1988~). For protein and lipid analyses. CNS and PNS tissues were dissected from a phylogenetic series of fish (which consisted of Torpedo or dogfish, garfish, trout. goldfish. and “Jack Dempsey”), and from mudpuppy and mouse. Tis- sues were rinsed in saline, frozen in liquid nitrogen, and stored at -80°C. Sciatic nerve was lyophilized before analysis to facilitate further handling. In contrast with previous studies. this survey analyzed whole tissue rather than isolated myelin.
X-ray diffraction Experiments were carried out using nickel-filtered and ei-
ther single- or double-mirror focused CuKn radiation from
FIG. 1. Schematic of electron density distribution calculated from the x-ray diffraction data showing the structural parameters that were compared among the phylogenetic series. Electron density is displayed on the vertical axis and distance on the horizontal.
FIG. 2. X-ray diffraction patterns from myelinated tissues from a phylogenetic series. For each species, the CNS myelin pattern is on the left, and the PNS pattern is on the right. a: Mouse optic and sciatic nerves; b mudpuppy spinal cord and sciatic nerve; c: carp optic nerve and goldfish lateral line nerve; d: trout spinal cord and lateral line nerve; e: garfish optic and lateral line nerves; f: Torpedo optic and branchial nerves. The very weak pattern for Torpedo PNS is from the transient native structure, before it swells. In amphibians and mammals, the CNS and PNS myelin diffraction patterns are readily distinguished from each other, whereas in te- leosts and elasmobranchs. the distinction is less clear. In addition, garfish CNS and PNS patterns more closely resemble the corre- sponding patterns from elasmobranchs than those from teleosts, with which garfish is classified phylogenetically. For periods, refer to Fig. 3.
a Rigaku x-ray generator (40 kV, 20 mA) or an Elliott GX- 20 rotating-anode generator (35 kV, 40 mA; 200-pm focal spot). The specimen-to-film distances were 190-210 m m for the line-collimated patterns, and 80-170 m m for the point- focus patterns. The diffraction patterns were recorded with Kodak No-Screen or Direct Exposure x-ray films. Short ex- posures of I h immediately after dissection were usually re- corded before long exposures ( 16-24 h) in order to monitor possible structural changes in the specimen during the long exposure. The myelin period d was determined directly from the spacings of the diffraction spectra measured off the x-ray films viewed at X6 magnification. The absorbances of the films were determined on an Optronics Photoscan P-1000 microdensitometer (Optronics International, Inc., Chelms- ford, MA. U.S.A.) using a 25-wm raster. The integrated in-
J. Neurochem.. Vol 53. No 5. 1989
PHYLOGENETIC STUDY OF NERVE MYELIN 1601
Mouse Bu 1 1 f r o g
Frog-- Mud p u pp y
tensity Z(h) for each order h, the structure amplitudes F(h), and the electron density profiles of the membrane pairs were determined as previously described (Inouye and Kirschner, 1984). The bilayer thickness (lpg) and the widths of the in- terbilayer spaces ( 2 4 d - 224; cyt, ext) were measured from the electron density profiles (Fig. 1). For each of these struc- tural parameters, we calculated the mean value, the sample standard deviation (SD), and the percentage deviation (SD/ mean X 100%).
Protein analysis Tissues from the dogfish, teleost fish (see above), mud-
puppy, and mouse were homogenized in 5% sodium dodecyl sulfate (SDS) and 0.1% aprotinin to a final concentration of 10% (wt/vol). Aliquots of 5 pl, corresponding to 25-50 pg of protein, were applied to each lane of the gel apparatus, and the proteins were separated by SDS-polyacrylamide gel elec- trophoresis (PAGE) using a linear gradient of 8- 18% acryl- amide (Maizel, 197 1) for PLP and Po or using 10% acrylamide and urea (Swank and Munkres, 197 1) for myelin basic protein (MBP) and Pz . The separated polypeptides were electropho- retically transferred to nitrocellulose paper and detected using immunoperoxidase staining (Towbin et al., 1979), and the proteins remaining in the gel were stained with Coomassie Brilliant Blue (Fairbanks et al., 197 1). The first antibody was rabbit antisera to one of the myelin proteins. The second antibody was horseradish peroxidase-conjugated goat anti- rabbit immunoglobulin G (Cappel Laboratories, Cochran- ville, PA, U.S.A.). Protein bands were visualized using 4- chloro- 1-naphthol (Bio-Rad, Richmond, CA, U.S.A.) as the color development reagent. The blots were rinsed with dis- tilled water, dried between filter paper, and photographed. Rabbit antisera to the following myelin proteins were used: mouse 14-kilodalton (kDa) MBP (prepared by Dr. A.-L. Kerner in the laboratory of Dr. J. C. Carson, University of Connecticut Health Center, Farmington, CT, U.S.A.), which recognizes all four low molecular weight MBP forms in rodent CNS and PNS; bovine PLP (provided by Dr. W. B. Macklin, UCLA Medical Center, Los Angeles, CA, U.S.A.); bovine PLP residues 109-126 (provided by Drs. R. A. Lazzarini and L. Hudson, NIH, Bethesda, MD, U.S.A.); bovine PO (provided by Dr. D. R. Colman, Columbia University, New York, NY, U.S.A.); and bovine P2 (provided by Drs. M. J. Weise and S. Brostoff, Medical University of South Carolina, Charleston, SC, U.S.A.). Lipid analysis
Lipids were analyzed in CNS and PNS tissues from Tor- pedo, teleost fish (see above), mudpuppy, and mouse. The methods used to extract lipids from the tissues, separate the polar and neutral lipids by one-dimensional high-perfor- mance TLC, and visualize them by charring have been de- scribed in detail (Ganser et al., 1988).
_ _ .......... D ........................................ .................... _- _ _ ............................................... A... ........................... _ _ ......... A. .............................. .......................... -_ _ _ ...... 0 ............ ......... .............................. ~
RESULTS AND INTERPRETATION
Overview of myelin structure in a phylogenetic series X-ray diffraction patterns from the phylogenetic se-
ries of vertebrates that we have examined showed a number of common features (Fig. 2). Typically, strong scattering intensity was observed from both CNS and PNS tissues to a spacing of -30 A, with the second and fourth Brag orders being the most prominent. In mammals and amphibians, the odd orders were sig- nificantly weaker in CNS than in PNS myelin. In te-
Trout
D o g f i s h Topped o-- .
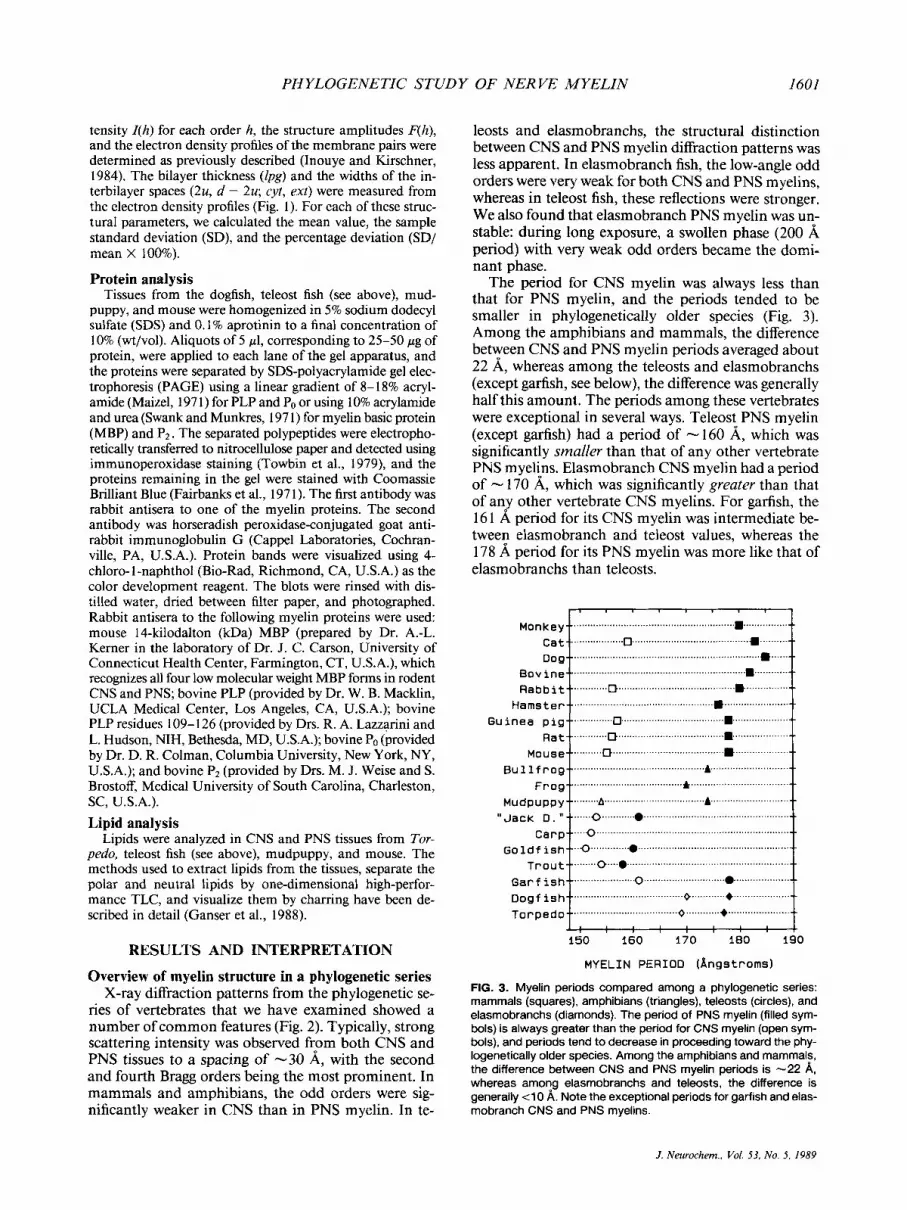
leosts and elasmobranchs, the structural distinction between CNS and PNS myelin diffraction patterns was less apparent. In elasmobranch fish, the low-angle odd orders were very weak for both CNS and PNS myelins, whereas in teleost fish, these reflections were stronger. We also found that elasmobranch PNS myelin was un- stable: during long exposure, a swollen phase (200 A period) with very weak odd orders became the domi- nant phase.
The period for CNS myelin was always less than that for PNS myelin, and the periods tended to be smaller in phylogenetically older species (Fig. 3) . Among the amphibians and mammals, the difference between CNS and PNS myelin periods averaged about 22 A, whereas among the teleosts and elasmobranchs (except garfish, see below), the difference was generally half this amount. The periods among these vertebrates were exceptional in several ways. Teleost PNS myelin (except garfish) had a period of - 160 A, which was significantly srnalZer than that of any other vertebrate PNS myelins. Elasmobranch CNS myelin had a period of - 170 A, which was significantly greater than that of any other vertebrate CNS myelins. For garfish, the 16 1 A period for its CNS myelin was intermediate be- tween elasmobranch and teleost values, whereas the 178 A period for its PNS myelin was more like that of elasmobranchs than teleosts.
_ _ ........ 0 .... @. ......................................................... _ _ _ _ ...................... 0 ............................. _ _ ....................................... 0 ............ + ..................... ~
.................................... Q ............ + r
J. Neurochem., Vol. 53, No. 5 , 1989

1602 D. A . KIRSCHNER ET .4L.
......................................... - Monkey- C a t _ _ ......................... m... ..... Dog _ _ ....................................................
B o v i n e _ _ ................................................. R a b b i t .................... @... .......
R a t _ ........................ .@.. .
Hamster - .................................. Guinea pig - - .........................
Mouse - ..................... [7...
Bu 1 1 f r o g _ _ ....................................................... _ Frog _ ...................................
Mu dp u p p y _ _ ........ . . . . . . . . . . . .A ......... ....A .............. “Jack 0 . b ) Q .................................. ..........
Car ?-- ........ 0 ............................. Go 1 d f i sh-- ........... 0 .....................
T r o u t _ _ ................................. +
Structure of mammalian myelin The structure amplitudes F(h) for PNS myelins
closely mapped (to 15 A spacing) onto a single contin- uous transform for membrane pairs that are calculated relative to the extracellular rather than the cytoplasmic apposition. This indicates that the separation of mem- branes across the extracellular apposition is less variable than across the cytoplasmic apposition, and that the different membrane bilayers among the mammals have a relatively constant structure. Measurements from the calculated electron density profiles confirmed this (Fig. 4). The mean values (* SD; percentage deviation) for the structural parameters 211, d - 221, cjr, lpg, and ext were 82.9 A (2.2 A; 2.7%), 97.1 A (1.8 A; 1.8%), 36.1
(2.0 A; 5.5%), 48.3 A (0.9 A; 1.9’70), and 47.2 A (1.0 A; 2.1 %), respectively. Although the extracellular packing appeared to be relatively constant among all the mammals, the value for the cytoplasmic packing tended to be somewhat lower for rodents (hamster, guinea pig, rat, and mouse) than for the higher mam- mals. We also compared the sets of structure factors for CNS myelins from five different mammalian spe- cies. The data indicated that there was no preferred constant pairing of membranes across either the cy- toplasmic or extracellular appositions (Fig. 4). The mean values (+ SD; percentage deviation) for 211, d - 214 cyt, lpg and ext were 77.4 A ( 1 . 1 A; 1.5%). 79.2 A (0.8 A; l.O%), 31.2 A (0.4 A; 1.3%), 46.6 A (1.5 A: 3.2%), and 32.2 A (1.6 A; 5.0%), respectively. Com- paring these mean values between CNS and PNS my- elin (from the same species) indicates that their -22 A difference in period is accounted for by increases of 15.6 A k 2.8 A (n = 5) and 4.2 A f 1.9 A in the widths of the extracellular and cytoplasmic spaces, respec-
-
._
- - -
~
_ _ _ _
~
~
~
~
tively. There were no significant differences in their bilayer widths (lpg).
_ _ ............................... .n ................. _- ........................ .m ........................ ........ --
_ .............................. 0 .............. ............- - _ _ ........................ .......a .......... .. ............ -- _ _ . . . . . . . . . . . . . . . . . . . . . . . . . ...a .................. a ..........- -
. . . . . . . . . ...a . . . . . . . . . . . . . . . .................... 0 ....................... . . . . . . . . . . . . . . . ......a .... ....................a L
_..,. ........................ 17 . . . . . . . . . . . . . . . . . . . . . . . . . . . . . . . . . . . & . . . . . . . . . . . . . . . .................... A ........................
. . . . . . . . . . . . . . . . . . .&. ........... .......&.. ............... _- _ _ . . . . . .Q .. . . . . . . . . . . . . . . . . . . . . . . . . . . . .
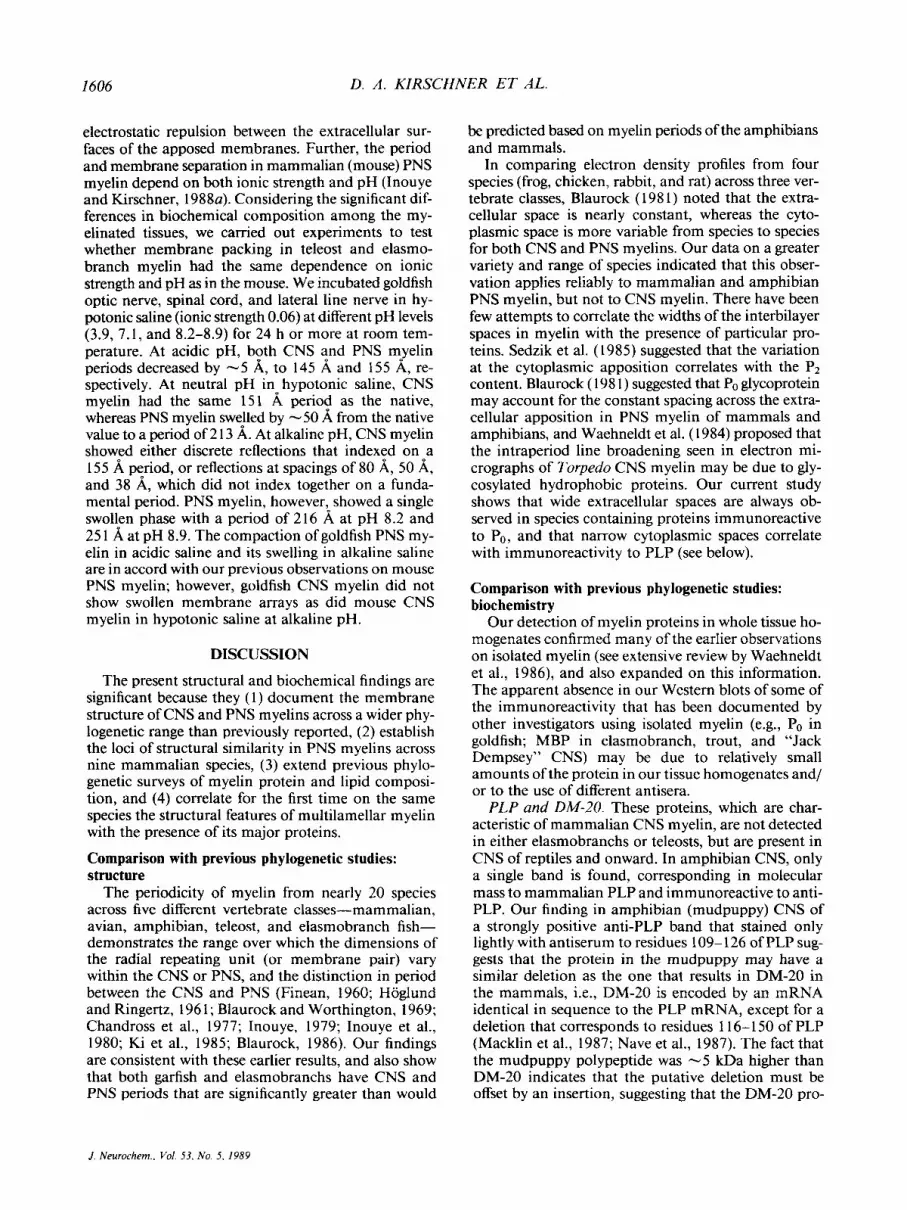
Myelin structure in nonmammalian vertebrates The electron density profiles were generally quite
similar to those calculated for the mammals; however, measurement of the profiles revealed certain differences and apparent trends when compared phylogenetically (Fig. 4).
Ainp/zibian. The smaller periods of amphibian my- elin compared with values of mammalian myelin were accounted for by differences in the widths of the in- terbilayer spaces (c-vt, ext) and in the thickness of the lipid bilayer (lpg). Compared with mammalian CNS, mudpuppy CNS showed 2 A narrower cyt and lpg, and a - 5 A wider ext. In PNS myelin, cyt and lpg were up to - 3 A less than in mammals, whereas ext was about the same.
Teleost. Teleost CNS myelin (except garfish), com- pared with mammalian CNS myelin, had an 8 A nar- rower cj.t, a 2 A narrower lpg, and a 6 A wider ext. Garfish CNS myelin was exceptional: cyt was like that of mammals and ext was intermediate to the values for mammals and the other teleosts. The appreciable decrease in period for PNS myelin compared with mammalian and amphibian PNS myelins was due in part to the 2 A decrease in lpg, but mostly to the - 10 A decrease in cyt. Garfish PNS was exceptional among teleosts in having cyt like that of mammalian PNS my- elin and ext - 10 A narrower than that of amphibians and mammals.
Ela.vnohranch. The CNS myelin showed an extra- cellular space that was intermediate in width between those of mammalian CNS and PNS myelins, i.e., -6
Torpedo- -
PNS
............................... Q .... ...+..
FIG. 4. The width of the cytoplasmic (open symbols) and extracellular spaces (filled symbols) in CNS (left) and PNS (right) myelin from a phylo- genetic series. The widths were mea- sured from the electron density pro- files.
. . . . ............................. ................... . . . . . ................................................... 0 I Q ,.a
. . . . . . . . . . . . . . . . . . . . . . . ........................... ..a ........................... ..@. ............................... ......................... o* ..............................
20 30 40 50
WIDTH OF SPACE ( A )
J Neurochm , L’ol 53. No 5 , 1989

PHYLOGENETIC STUDY OF NERVE MYELIN 1603
FIG. 5. SDS-PAGE of CNS (C) and PNS (P) tissue homogenates for selected nonmammalian species compared with mouse. The positions of the major myelin proteins in mouse CNS (PLP, arrowhead; 14-kDa MBP, arrow) and PNS myelins (Po glycoprotein, arrowhead; 14-kDa MBP, arrow) are indicated. Molecular mass markers are designated on the left. Major bands are seen in the region corresponding to mouse PLP and Po proteins (molecular mass -21-30 kDa), and MBP and P2 (molecular mass -13-21 kDa).
A wider than CNS but -9 A narrower than PNS. This widened extracellular space accounts for the double intraperiod line observed in fixed Torpedo CNS (Waehneldt et al., 1984). The cytoplasmic space in elasmobranch CNS was wider by -4 A than that in mammalian CNS, and nearly the same as that in mammalian PNS myelin. The width of the bilayer (lpg) of elasmobranch CNS myelin was in the range mea- sured for mammalian myelins. Elasmobranch PNS myelin had an extracellular space that also was inter- mediate in width between those of mammalian CNS and PNS myelins, i.e., -5 A wider than that of CNS and - 10 A narrower than that of PNS. The cyto- plasmic space in elasmobranch PNS myelin was about 5 A greater than that for mammalian CNS myelin, but within the range for cyt of mammalian PNS myelin, and lpg was - 3 A greater than that for mamma- lian PNS.
Myelin protein composition in phylogenetic series The major myelin proteins of mammalian CNS and
PNS (PLP, MBP, Po, P2) have apparent molecular masses in the range 13-30 kDa. Coomassie Blue- stained gels of the proteins from neural tissue homog- enates of animals in the phylogenetic series also showed major bands in this range (Fig. 5). Western blots in- dicated the extent to which these bands were immu- noreactive to antisera to the major myelin proteins (Fig. 6 ) .
Po glycoprotein. In both CNS and PNS tissue ho- mogenates of dogfish, garfish, trout, and “Jack Demp-
sey”, and in PNS of mudpuppy, there was a pro- nounced singlet band, or more often a doublet, at 25- 30 kDa that was immunoreactive to anti-bovine Po glycoprotein; however, neither the CNS nor PNS of goldfish showed anti-Po immunoreactivity, even though a corresponding doublet was clearly apparent in Coo- massie Blue-stained gels.
PLP. The strongest immunoreactivity to anti-bovine PLP was shown by mudpuppy CNS, and this was com- parable to and at the same molecular mass as that of mouse CNS. Although there was no staining at the molecular mass level of DM-20, which is about 5 kDa less than PLP, there was very weak staining at a higher molecular mass, similar to that in the mouse. In elas- mobranch and teleost, immunoreactivity to anti-PLP was either absent or extremely weak, and usually at higher molecular mass values than mouse PLP. Mouse CNS showed strong immunoreactivity to the antiserum raised against the synthetic polypeptide (residues 109- 126 of PLP). Weak staining to this antiserum was seen in dogfish PNS (which had not immunoreacted against anti-bovine PLP) and also in mudpuppy CNS (which had shown strong immunoreactivity to the bovine antiserum). As expected, mouse DM-20 was not re- vealed with this antiserum, which had been raised against a portion of the PLP sequence that is mostly deleted from DM-20 (Macklin et al., 1987; Nave et al., 1987).
MBP. Immunoreactivity to anti-14-kDa mouse MBP was strongest in garfish CNS, and in goldfish and mudpuppy CNS and PNS, whereas weak staining was
J. Neurochem., Vol. 53, No. 5, 1989

1604 D. A . KIRSCHNER ET A L
FIG. 6. Western blot identification of myelin proteins in whole tissue homogenates for mouse (M), dogfish (l), garfish (2), trout (3). goldfish (4), “Jack Dempsey” (5). and mudpuppy (6). For each pair of lanes for 1-6, CNS is to the left, and PNS is to the right. a: Anti-Po glycoprotein. lmmunostaining at about the same molecular mass value of mouse PNS Po (M, arrowhead) is seen for both CNS and PNS of dogfish and teleost (except goldfish) and for only PNS of mudpuppy. b Anti-PLP. lmmunostaining corresponding to that for mouse CNS (PLP, arrowhead; DM-20, open arrowhead) is seen only for CNS of mudpuppy. c: Antiserum to synthetic peptide corresponding to residues 109-126 of bovine PLP. Strong immunostaining is seen for mouse PLP (M. arrowhead) but not DM-20, and weak staining is seen only for dogfish PNS (1, arrow) and mudpuppy CNS (6, arrow). d: Anti-1 4-kDa MBP, which reveals the four MBP species in the mouse CNS (M, arrowheads) at 21.5, 18.5.17, and 14 kDa. For species 2-5. three samples were run: one CNS to the left, and two PNS to the right (with the rightmost one at higher concentration). Compared with mouse, the strongest immunostaining is seen for CNS of garfish, and for CNS and PNS of goldfish and mudpuppy; weak or absent immunoreactivity is seen in the others. e: Anti-Pp. Staining intensity comparable to that of mouse PNS Pz (M. arrowhead) but at higher molecular mass is seen for CNS and PNS of dogfish and garfish, and for CNS of trout, goldfish, and “Jack Dempsey”; weak immunoreactivity is seen for CNS of mudpuppy. f: Anti-Pp (left) and anti-MBP (right) run on identical halves of the same immunoblot. The staining shows that these antisera are not crossreactive and that goldfish P2 immunoreactivity is seen in CNS whereas M5P immunoreactivity is seen in both CNS and PNS.
seen in garfish PNS and “Jack Dempsey” CNS and PNS. The apparent molecular masses of the MBP-pos- itive bands were 18 kDa in garfish CNS and PNS, 14 and 8- 10 kDa in goldfish CNS and PNS, respectively, 12 and 8 kDa in “Jack Dempsey” CNS, 14 kDa in “Jack Dempsey” PNS, and 20 kDa in mudpuppy CNS and PNS. Pz. Strong immunoreactivity to anti-bovine P2 was
observed in the CNS and PNS of dogfish and garfish, and in the CNS of trout, goldfish, and “Jack Dempsey”, and weak staining was seen in mudpuppy CNS. In all cases, however, the P2-positive bands were 2-4 kDa higher than mouse P2. To resolve possible immuno- logic cross-reactivity for PZ and MBP among the bands
running in the 10- 14-kDa region in goldfish tissues, we ran identical samples on the two halves of a gel, elec- troblotted, and then treated half the nitrocellulose paper with anti-P2 and the other half with anti-MBP. The results (Fig. 6f) clearly indicate that there were three separate proteins in the 10- 14-kDa region in goldfish, and no cross-reactivity among them for the antisera.
Neural tissue lipids in phylogenetic series from Torpedo to mudpuppy
Chromatograms of the polar lipids (Fig. 7) extracted from whole CNS and PNS tissues showed significant differences among the teleosts as well as among the different phylogenetic classes. Although the same major
J. Neurochem., Vol. 53, No 5 , 1989

PHYLOGENETIC STUDY OF NERVE MYELIN 1605
FIG. 7. One-dimensional high performance TLC of polar lipids in CNS (A) and PNS (B) myelinated tissues. (a) Mouse control run with b; (b) Torpedo; (c) garfish; (d) trout; (e) goldfish; (f) “Jack Dempsey”; (9) mudpuppy; (h) mouse control run with c-g. The aliquots spotted on the plates were 4 ~ 1 , except for panel A(b), which was 2 pl. The positions of standard lipids, determined independently (Ganser et al., 1988), are indicated along the left. Abbreviations: CN, nonhydroxycerebroside; CH, hydroxycerebroside; SN, nonhydroxysulfatide; SH, hydroxysulfatide; PE, phosphatidylethanolamine; PA, phosphatidic acid; PI, phosphatidylinositol; PS, phosphatidylserine; PC, phosphati- dylcholine; SM, sphingomyelin; OR, origin. Although the same major phospholipid and glycolipid classes were present, there were some striking differences, particularly among the glycolipids.
phospholipid classes were present, the relative levels were different. The differences in glycolipid composi- tion were even more striking. Chromatograms of the neutral lipids (not shown) showed little or no differ- ences among them or compared with the mouse.
CNS (Fig. 7A). In the mouse, the major polar lipids are hydroxycerebroside, phosphatidylethanolamine (PE), and phosphatidylcholine (PC), with smaller amounts of nonhydroxycerebroside, sulfatides, and phosphatidylserine (PS), and only trace amounts of phosphatidic acid (PA), phosphatidylinositol (PI), and sphingomyelin. Compared with the mouse, the phos- pholipids PE, PS, and PC in the elasmobranch (Tor- pedo) were elevated and sphingomyelin was reduced, the glycolipid nonhydroxysulfatide was substantially elevated, hydroxysulfatide was absent, and hydroxy- cerebroside was greatly reduced. Except for PA, which was undetected, the garfish showed a pattern of lipids similar to the mouse. In the other teleosts and the mudpuppy, the major polar lipids were PE and PC, with the glycolipids present in smaller relative amounts. An exception was “Jack Dempsey”, in which cerebro- sides, particularly the nonhydroxy form, were abun- dant. Among the glycolipids, hydroxysulfatide was ab- sent or nearly undetected in trout, goldfish, “Jack Dempsey”, and mudpuppy, but hydroxycerebroside was absent only from mudpuppy. Among the phos- pholipids, PI was increased in trout and goldfish, PA was increased in “Jack Dempsey” but not detected in mudpuppy, and sphingomyelin was increased in trout and especially in mudpuppy. Cholesterol was the major neutral lipid detected throughout the phylogenetic se-
ries examined, and the typical trace levels of cholesterol ester appeared to be slightly elevated in both trout and mud puppy.
PNS (Fig. 7B). In the mouse, the major polar lipids were hydroxy- and nonhydroxycerebrosides, PE, PS, PC, and sphingomyelin. Smaller amounts of the sul- fatides were present, and only trace amounts of PA and PI were detected. In the Torpedo, except for the smaller amount of nonhydroxycerebroside and the larger amount of sphingomyelin, the lipid composition was like that of its CNS (Fig. 7A). Again, the abundance of nonhydroxysulfatide compared with levels in the mouse was striking. Garfish and mudpuppy had phos- pholipid compositions that very closely resembled those in the mouse, whereas trout, goldfish, and “Jack Dempsey” showed PE and PC as the major phospho- lipids, and PS as a consistent minor lipid. In these three teleosts, PI and PA were present at low or trace levels, and sphingomyelin increased, in relative amount, from very low in trout to appreciable in “Jack Dempsey”. Among the glycolipids, the hydroxy forms were absent from trout, “Jack Dempsey”, and mudpuppy, but were present in garfish and goldfish. Of the nonhydroxy forms of the glycolipids, there generally appeared to be more sulfatide than cerebroside present, which is op- posite to their relative levels in the CNS of these ani- mals. Like its abundance in CNS tissues, cholesterol was the major neutral lipid present. Cholesterol ester was apparent at trace levels in garfish and also in trout. Stability of myelin packing in teleost fish
PNS myelin from amphibians and mammals swells when counter-ions are washed out due to increased
J. Neurochem.. Vol. 53, No. 5 , 19x9
1606 D. A . KIRSCHNER ET AL.
electrostatic repulsion between the extracellular sur- faces of the apposed membranes. Further, the period and membrane separation in mammalian (mouse) PNS myelin depend on both ionic strength and pH (Inouye and Kirschner, 1988~). Considering the significant dif- ferences in biochemical composition among the my- elinated tissues, we camed out experiments to test whether membrane packing in teleost and elasmo- branch myelin had the same dependence on ionic strength and pH as in the mouse. We incubated goldfish optic nerve, spinal cord, and lateral line nerve in hy- potonic saline (ionic strength 0.06) at different pH levels (3.9, 7.1, and 8.2-8.9) for 24 h or more at room tem- perature. At acidic pH, both CNS and PNS myelin periods decreased by -5 A, to 145 A and 155 A, re- spectively. At neutral pH in* hypotonic saline, CNS myelin had the same 151 A period as the native, whereas PNS myelin swejled by - 50 A from the native value to a period of 2 13 A. At alkaline pH, CNS myelin showed either discrete reflections that indexed on a 155 A period, or reflections at spacings of 80 A, 50 A, and 38 A, which did not index together on a funda- mental period. PNS myelin, however, showed a single swollen phase with a period of 216 A at pH 8.2 and 25 1 A at pH 8.9. The compaction of goldfish PNS my- elin in acidic saline and its swelling in alkaline saline are in accord with our previous observations on mouse PNS myelin; however, goldfish CNS myelin did not show swollen membrane arrays as did mouse CNS myelin in hypotonic saline at alkaline pH.
DISCUSSION
The present structural and biochemical findings are significant because they (1 ) document the membrane structure of CNS and PNS myelins across a wider phy- logenetic range than previously reported, (2) establish the loci of structural similarity in PNS myelins across nine mammalian species, (3) extend previous phylo- genetic surveys of myelin protein and lipid composi- tion, and (4) correlate for the first time on the same species the structural features of multilamellar myelin with the presence of its major proteins.
Comparison with previous phylogenetic studies: structure
The periodicity of myelin from nearly 20 species across five different vertebrate classes-mammalian, avian, amphibian, teleost, and elasmobranch fish- demonstrates the range over which the dimensions of the radial repeating unit (or membrane pair) vary within the CNS or PNS, and the distinction in period between the CNS and PNS (Finean, 1960; Hoglund and Ringertz, 196 1; Blaurock and Worthington, 1969; Chandross et al., 1977; Inouye, 1979; Inouye et al., 1980; Ki et al., 1985; Blaurock, 1986). Our findings are consistent with these earlier results, and also show that both garfish and elasmobranchs have CNS and PNS periods that are significantly greater than would
be predicted based on myelin periods of the amphibians and mammals.
In comparing electron density profiles from four species (frog, chicken, rabbit, and rat) across three ver- tebrate classes, Blaurock (198 1) noted that the extra- cellular space is nearly constant, whereas the cyto- plasmic space is more variable from species to species for both CNS and PNS myelins. Our data on a greater variety and range of species indicated that this obser- vation applies reliably to mammalian and amphibian PNS myelin, but not to CNS myelin. There have been few attempts to correlate the widths of the interbilayer spaces in myelin with the presence of particular pro- teins. Sedzik et al. (1985) suggested that the variation at the cytoplasmic apposition correlates with the PZ content. Blaurock ( 198 1) suggested that Po glycoprotein may account for the constant spacing across the extra- cellular apposition in PNS myelin of mammals and amphibians, and Waehneldt et al. (1984) proposed that the intraperiod line broadening seen in electron mi- crographs of Torpedo CNS myelin may be due to gly- cosylated hydrophobic proteins. Our current study shows that wide extracellular spaces are always ob- served in species containing proteins immunoreactive to Po, and that narrow cytoplasmic spaces correlate with immunoreactivity to PLP (see below).
Comparison with previous phylogenetic studies: biochemistry
Our detection of myelin proteins in whole tissue ho- mogenates confirmed many of the earlier observations on isolated myelin (see extensive review by Waehneldt et al., 1986), and also expanded on this information. The apparent absence in our Western blots of some of the immunoreactivity that has been documented by other investigators using isolated myelin (e.g., Po in goldfish; MBP in elasmobranch, trout, and “Jack Dempsey” CNS) may be due to relatively small amounts of the protein in our tissue homogenates and/ or to the use of different antisera.
PLP and DM-20. These proteins, which are char- acteristic of mammalian CNS myelin, are not detected in either elasmobranchs or teleosts, but are present in CNS of reptiles and onward. In amphibian CNS, only a single band is found, corresponding in molecular mass to mammalian PLP and immunoreactive to anti- PLP. Our finding in amphibian (mudpuppy) CNS of a strongly positive anti-PLP band that stained only lightly with antiserum to residues 109-126 of PLP sug- gests that the protein in the mudpuppy may have a similar deletion as the one that results in DM-20 in the mammals, i.e., DM-20 is encoded by an mRNA identical in sequence to the PLP mRNA, except for a deletion that corresponds to residues 1 16- 150 of PLP (Macklin et al., 1987; Nave et al., 1987). The fact that the mudpuppy polypeptide was -5 kDa higher than DM-20 indicates that the putative deletion must be offset by an insertion, suggesting that the DM-20 pro-
J . Neurochem.. Vol. 53, No s> 1989

PHYLOGENETIC STUDY OF NERVE MYELIN 1607
tein appeared earlier phylogenetically than thought, possibly before PLP. A simpler explanation of our re- sult is that the sequence 109- 126 in mudpuppy may be sufficiently different from that of the mammalian epitope that it is not well recognized by the antibodies to the synthetic peptide. Clearly, the development of the PLP gene from teleost to reptiles merits further study, perhaps by immunoblotting with antisera raised against DM-20 (rather than PLP) and the deleted se- quence, and by isolating and sequencing the amphibian PLP gene. Po glycoprotein. This protein, which is characteristic
of amphibian and mammalian PNS myelin, is seen (usually as a doublet) in both CNS and PNS of elas- mobranchs and teleosts. We have now observed that in garfish the immunoreactivity to anti-Po is mostly in single rather than double bands and at a molecular mass corresponding to the upper band of the other teleosts.
MBP. Polypeptides recognized by anti-MBP were ubiquitous throughout phylogeny, though the molec- ular masses vaned widely from -8 to 20 kDa. Even when immunoblots were negative, putative MBP bands were visible in the Coomassie Blue-stained gels. In gar- fish, this band was at a higher molecular mass than in the other teleosts.
Pr basic protein. Previous investigators did not detect P2 in the myelin isolated from elasmobranch, teleost, or amphibian, whereas we did observe an immunc- reactive band in elasmobranch and garfish CNS and
PNS, in teleost CNS, and possibly also in amphibian CNS. One explanation for this difference is that the anti-bovine P2 antiserum used in previous studies rec- ognizes different epitopes of P2 than does our anti- serum. Another explanation is that the P2-immuno- reactive polypeptides of whole tissue homogenates are from portions of the nervous system that were removed during isolation of multilamellar myelin. Finally, per- haps Pz protein is actually present in the compact my- elin of the lower vertebrates, but, because it is an ex- trinsic membrane protein, it may be washed out during the membrane isolation procedures.
36-kDa protein. This protein has been shown to be unique to teleost CNS, and it is not recognized by an- tisera to PLP, Po, MBP, or P2. Our Coomassie Blue- stained gels confirmed the presence of a prominent protein in teleost CNS between 31 and 45 kDa, and further showed that this band is not present in garfish.
Lipid Composition. Our data are in close agreement with previous investigations on myelin lipids in elas- mobranch, teleost (including garfish), and amphibian (Hofteig et al., 1981; Saito and Tamai, 1983; Biirgisser et al., 1986). Overall, unlike the findings with myelin proteins, there were no apparent phylogenetic trends. Lipid composition did not appear to significantly in- fluence the intermembrane spacing. Moreover, the thickness of the lipid bilayer measured from the x-ray diffraction analysis was relatively constant despite ap- preciable differences in lipid (particularly glycolipid) composition.
TABLE 1. Width of cytoplasmic space (cyt) correlated with protein composition
Protein’
MBP cyt 36 kDa Po “P,,” PLP p2
Sampleb (A) 36‘ 30 30-23 25 21 18 14 13-11 15-13
Teleost (CNS) Teleost (PNS) Amphibian (CNS) Garfish (CNS) Rodent (CNS) Mammal (CNS) Amphibian (PNS) Rodent (PNS) shifshi (PNS) Elasmo (CNS) Elasmo (PNS) Mammal (PNS) Gar (PNS)
23 25 29 31 31 31 34 34 35 36 37 38 39
* * *
*
* * *
* *
* *
* * * *
* * - - *
* * * * * *
* * * *
* * * * -
* - * *
- * *
* *
Major proteins tabulated from current study and reviews of published data: Lees and Brostoff (1984), Norton and Cammer (1984), and Waehneldt et al. (1986). * indicates presence of protein, - indicates trace; “P;’ denotes proteins immunoreactive to the mammalian anti-Po glycoprotein.
Mammal (CNS): cat, rabbit; mammal (PNS): monkey, cat, dog, rabbit, bovine; rodent (CNS): guinea pig, rat, mouse; rodent (PNS): guinea pig, hamster, rat, mouse; amphibian (CNS): salamander; amphibian (PNS): salamander, bullfrog, frog; teleost (CNS): “Jack Dempsey”, carp, goldfish teleost (PNS): “Jack Dempsey”, goldfish elasmo (CNS) and elasmo (PNS): Torpedo, dogfish; shifshi, shiverer mouse mutant. To facilitate comparison between CNS and PNS, the CNS data are in boldface.
Molecular mass in kDa.
J. Neurochem., Vol. 53, No. 5. 1989

1608 D. A . KIRSCHNER ET .4L.
TABLE 2. WTdth of’ex~rucellirlar space (ext) correlated with protein cornposition
Protein
MBP est 36 kDa Po “Po” PLP PZ
Sample (A) 36 30 30-23 25 21 18 14 13-11 15-13
Mammal (CNS) 32 * * Rodent (CNS) 33 * * * * Garfish (CNS) 36 * * * Elasmo (PNS) 37 * * Amphibian (CNS) 37 * * - - * Elasmo (CNS) 38 * * * Garfish (PNS) 39 * Teleost (CNS) 39 * * * * * Teleost (PNS) 42 * * * Amphibian (PNS) 46 - Rodent (PNS) 47 * * * * * shi/shi (PNS) 47 * * Mammal (PNS) 48 * * *
* -
- * *
See Table 1 legend for details
Correlation of protein composition with widths of spaces
Previous studies provide evidence that proteins are the major determinants of membrane packing at both the cytoplasmic and extracellular appositions (see re- view by Kirschner et al., 1984; Inouye and Kirschner, 19888). In the current report, our extensive structural and biochemical findings from diverse sources of my- elin demonstrate in detail the effects of specific proteins on the packing of the membranes. The data summa- rized in Tables 1 and 2 include both the results of the current study and biochemical findings of other inves- tigators on similar species. At the c~*tuplnsmic cipposi- tion, the width of the space varied from 23 A (which is 8 A wider than the interbilayer space of myelin lipid multilayers; see above) to 39 A (Table 1). The narrowest apposition (in the teleost fish) correlated with the pres- ence of a very low molecular mass basic protein. As this apposition widened, the 1 1 - 1 3-kDa protein was gradually replaced by higher molecular mass basic pro- teins. In amphibians and mammals, the cytoplasmic separation was narrower for myelin containing PLP than for myelin containing Po. This finding is consistent with the inferred compact structure of PLP (Laursen et al., 1984; Stoffel et al., 1984; Inouye and Kirschner. 1989). At the extracellular apposition, the width of the space varied from 32 A to 48 A (Table 2) . Myelin con- taining protein immunoreactive to PLP showed the narrowest separations, and myelin containing protein immunoreactive to Po glycoprotein or identified as Po showed wider separations. The slightly smaller sepa- ration at the membrane appositions in teleost CNS myelin compared with teleost PNS myelin could be due to the 36-kDa protein unique to its CNS. This protein could also account for the resistance to regular swelling of teleost CNS myelin compared with its PNS myelin. We expect that a more precise correlation of
structure and composition will derive from quantitative biochemistry and x-ray structural analysis performed in parallel on aliquots of isolated myelin prepared from some of these species.
Acknowledgment: We thank Drs. S. Brostoff, D. R. Col- man, L. Hudson, A.-L. Kerner, R. A. Lazzarini, W. B. Mack- lin. and M. J. Weise for generously providing antisera to the myelin proteins, and W. P. Mclntosh for photographic ser- vices. V.M. thanks Dr. A.-L. Kerner for instruction in meth- ods of biochemical analyses. The research was supported by NIH grant NS 20824 (to D.A.K.) from the National Institute of Neurological and Communicative Disorders and Stroke. The work was camed out in the Mental Retardation Research Center. Children’s Hospital, which is supported by NIH Core Grant H D 06276. A portion of this work was submitted by V.M. as a thesis in partial fulfillment of the requirements for the degree of Bachelor of Arts with Honors a t Harvard Uni- versity.
REFERENCES
Blaurock A. E. ( 198 I ) The spaces between membrane bilayers within PNS myelin as characterized by x-ray diffraction. Brain Res. 210,383-387.
Blaurock A. E. (1986) X-ray and neutron diffraction by membranes: how great is the potential for defining the molecular interactions? Prog. Pmrein-Lipid Interactions 2, 1-43.
Blaurock A. E. and Worthington C. R. (1969) Low-angle x-ray dif- fraction patterns from a variety of myelinated nerves. Biochirn. Biophys. Acta 173, 419-426.
Biirgisser P.. Matthieu J.-M.. Jeserich G., and Waehneldt T. V. (1986) Myelin lipids: a phylogenetic study. Neurochern. Res. 11, 1261- 1272.
Chandross R. J.. Bear R. S., and Montgomery R. L. (1977) An x-ray diffraction comparison of myelins from the human nervous sys- tem. J. Citmp. Neiirol. 177, 1-10.
Fairbanks G.. Steck T. L., and Wallach D. H. H. (1971) Electropho- retic analysis of the major polypeptides of the human erythrocyte membrane. Biochemistry 101, 2606-2617.
Finean J. B. (1960) X-ray diffraction analysis of nerve myelin, in
J. Neirrochem., Vol. 53. No 5. 1989

PHYLOGENETIC STUDY OF NERVE MYELIN 1609
Modern Aspects of Neurology: Histochemistry and Chemistry of the Nervous System (Cumings J. N., ed), pp. 232-254. Edward Arnold,
Ganser A. L., Kemer A,-L., Brown B. J., Davisson M. T., and Kirschner D. A. (1988) A survey of neurological mutant mice. 1. Lipid composition of myelinated tissue in known myelin mu- tants. Dev. Neurosci. 10, 99- 122.
Hofteig J . H., Mendell J . R., and Yates A. J. (1981) Chemical and morphological studies on garfish peripheral nerve. J. Comp. Neurol. 198,265-274.
Hoglund G. and Ringertz H. (1961) X-ray diffraction studies on pe- ripheral nerve myelin. Acta Physiol Scand. 51, 290-295.
Inouye H. (1979) An x-ray diffraction study of the nerve myelin sheath. Ph.D. thesis, Kyoto University, Kyoto, Japan.
Inouye H. and Kirschner D. A. (1984) Effects ofZnClz on membrane interactions in myelin of normal and shiverer mice. Biochim. Biophys. Acta 776, 197-208.
Inouye H. and Kirschner D. A. (1988~) Membrane interactions in nerve myelin. I. Determination of surface charge from effects of pH and ionic strength on period. Biophys. J. 53, 235-246.
Inouye H. and Kirschner D. A. (19886) Membrane interactions in nerve myelin. 11. Determination of surface charge from bio- chemical data. Biophys. J. 53, 247-260.
Inouye H. and Kirschner D. A. (1989) Orientation of proteolipid protein in myelin: comparison of models with x-ray diffraction measurements. Dev. Neurosci. 11, 8 1-89.
Inouye H., Worthington A, R., and Worthington, C. R. (1980) An x-ray study of fish nerves. The Biological Bulletin 159,485.
Inouye H., Kerner A.-L., Ganser A. L., and Kirschner D. A. (1985) Novel myelin structure and composition in elasmobranchs. Trans. Am. SOC. Neurochem. 16, 124.
Ki P. F., Kishimoto Y., Lattman E. E., Stanley E. F., and Griffin J. W. (1985) Structure and function of urodele myelin lacking alpha-hydroxy fatty acids-containing galactosphingolipids: slow nerve conduction and unusual myelin thickness. Brain Res. 345,
Kirschner D. A., Ganser A. L., and Caspar D. L. D. (1984) Diffraction studies of molecular organization and membrane interactions in myelin, in Myelin (Morell P., ed), pp. 5 1-95. Plenum Press, New York.
Kirschner D. A., Inouye H., Mann V., and Kemer A.-L. (1986) Te- leost fish myelin: structure and composition correlated. Trans. Am. SOC. Neurochem. 17, 156.
Laursen R. A,, Samiullah M., and Lees M. B. (1984) The structure
19-24.
ofbovine brain proteolipid and its organization in myelin. Proc. Natl. Acad. Sci. USA 81, 2912-2916.
Lees M. B. and Brostoff S. W. (1984) Proteins of myelin, in Myelin (Morell P., ed), pp. 197-224. Plenum Press, New York.
Macklin W. B., Campagnoni C . W., Deininger P. L., and Gardinier M. V. (1987) Structure and expression of the mouse myelin proteolipid protein gene. J. Neurosci. Res. 18, 383-394.
Maize1 J. V. (197 I ) Polyacrylamide gel electrophoresis of viral pro- teins. Methods ViroL 5, 179-246.
Nave K.-A., h i C., Bloom F. E., and Milner R. J. (1987) Splice site selection in the proteolipid protein (PLP) gene transcript and primary structure of the DM-20 protein of CNS myelin. Proc. Natl. Acad. Sci. USA 84, 5665-5669.
Norton W. T. and Cammer W. ( 1 984) Isolation and characterization of myelin, in Myelin (Morell P., ed), pp. 147-195. Plenum Press, New York.
Prosser C. L. ( 1973) Comparative Animal Physiology. W. B. Saunders, Philadelphia.
Richardson G. P., Krenz W. D., Kirk C., and Fox G. Q. (1981) Organotypic culture of embryonic electromotor system tissues from Torpedo marmorata. Neuroscience 6, 118 1-1200.
Saito S. and Tamai Y. (1983) Characteristic constituents of glycolipids from frog brain and sciatic nerve. J. Neurochem. 41, 737-744.
Sedzik J., Blaurock A. E., and Hoechli M. (1985) Reconstituted Pz/ myelin-lipid multilayers. J. Neurochem. 45, 844-852.
Stoffel W., Hillen H., and Giersiefen H. (1984) Structure and mo- lecular arrangement of proteolipid protein of central nervous system myelin. Proc. Natl. Acad. Sci. USA 81, 5012-5016.
Swank R. T. and Munkres K. D. (197 1) Molecular weight analysis of oligopeptides by electrophoresis in polyacrylamide gels with sodium dodecyl sulfate. Anal. Biochetn. 39, 462-477.
Towbin H., Staehelin T., and Gordon J. (1979) Electrophoretic transfer of proteins from polyacrylamide gels to nitrocellulose sheets: procedure and some applications. Proc. Natl. Acad. Sci.
Waehneldt T. V., Gene M., Malotka J., Kiecke C., and Neuhoff V. (1984) Nervous system myelin in the electric ray, Torpedo mar- morafa: morphological characterization of the membrane and biochemical analysis of its protein components. Neurochem. Int.
Waehneldt T. V., Matthieu J.-M., and Jeserich G. (1986) Appearance of myelin proteins during vertebrate evolution. Neurochem. I n f . 9,463-474.
USA 76,4350-4354.
6,223-235.
J. Neurochem., Vol. 53, No. 5 , 1989


